


Bahasa
Halaman
Hukum

International Journal of Health Sciences & Research (www.ijhsr.org) 87
Vol.3; Issue: 9; September 2013
International Journal of Health Sciences and Research
www.ijhsr.org ISSN: 2249-9571
Original Research Article
Effects of Different Surface Treatments on Ceramo-Metalic Surfaces
Mohammed M Al-Moaleem1*, Fuad A Al-Sanabani1, Mohammed A Al-Labani2, Abulkhaliq A F Alsadidi3
1Prosthodntic Department, College of Dentistry, Jazan University, KSA, Jazan.
2Orthodontic Department, College of Dentistry, Sanaa University, Republic of Yemen. 3Intern, Dentist, College of Dentistry, King Khalid University, KSA, Abha.
*Correspondence Email: [email protected]
Received: 21/05//2013 Revised: 11/07/2013 Accepted: 01/08/2013
ABSTRACT
The aim of this study was to investigate and compare the roughening effects of different surface
treatments on different exposed surfaces of metal and ceramic restorations (porcelain, metal and
metal/porcelain surfaces). 135 specimens were prepared for three surface groups; having 45 specimens for each group. Surface treatments were air abrasion alone or in combination with hydrofluoric acid, or
phosphoric acid, burs alone or in combination with hydrofluoric acid, or phosphoric acid, hydrofluoric
acid alone, and phosphoric acid alone. Statistical analysis showed significant differences between some of the different surface treatments on the same exposed surface of metal ceramic (MC) restoration as well as
among the three exposed surfaces of MC restoration.
Key words: Metal, Porcelain, Surface treatments, Phosphoric acid, Hydrofluoric acid.
INTRODUCION
Ceramo-Metalic (MC) restorations
have been used in crowns and bridges for
aesthetic and functional purposes for several
decades due to their excellent
biocompatibility and superior aesthetics. [1,2]
However, fracture of porcelain veneered
onto a MC restoration is common and is
multifactorial.[3]
These include inappropriate
coping design, poor abutment preparation,
mismatch in modulus between metal and
ceramic materials, technical errors,
contamination, physical trauma or occlusal
prematurity.[4]
Appropriate choice of repair
treatment is determined by the cause of
failure. Intraoral and extraoral porcelain
repair treatments are two possible ways of
repair treatment. Intraoral treatment with
direct composite resin is a common and
more practical treatment for fractured MC
restorations. This is because it demands
fewer skills, less time-consuming, is less
costly, less destructive, and much more
convenient for the patient and dentist.[5,6]
It
is indicated for situations when fracture
occurs as a result of trauma, fatigue, ceramic
of inferior quality, and/or technical errors. [7]
However, the intra-oral technique is
associated with several problems. The most
common problem is de-bonding of
composite resin material from the fractured
MC restoration after short service. The bond
of intraoral repair systems depends on
mechanical and chemical means. The
International Journal of Health Sciences & Research (www.ijhsr.org) 88
Vol.3; Issue: 9; September 2013
chemical means can be achieved by
silanization while mechanical retention can
be facilitated by surface roughening
techniques. The later include macro-
mechanical and micromechanical
methods.[4,8,9,5]
Macro-mechanical retention
can be achieved by sandblasting the
fractured surface with aluminium oxide
particles, grinding with stone burs or silicon
carbide paper.[4,10,11]
These methods help
create a microretentive surface and increase
the roughened surface area for bonding and
thus its wettability.[8,4]
Micromechanical
retention can be generated by itching MC
surfaces with hydrofluoric, phosphoric or
acidulated phosphate fluoride acids.[12,4,9]
These help produce microstructures and
large porosities on the itched surfaces,
allowing composite resin penetration. [13,14]
Several studies have evaluated the
effect of the mechanical roughening
methods or the combination of more than
one, on the composite to MC bond strength. [10,4, 15,11]
However, there is still insufficient
data on the roughening effects of different
surface treatments on MC surfaces and little
discussion on their comparison.
The aim of this study was to
investigate and compare the effects of
several surfaces roughening techniques on
three exposed surfaces of MC restoration;
porcelain, metal and metal/porcelain. Two
null hypotheses were investigated.
1. The roughening effects of eight
different surface treatments would
not differ within the same exposed
surface of MC restorations.
2. The roughening effect of each
treatment would not vary among the
three exposed surfaces of MC
restorations.
MATERIALS AND METHODS
The ceramic material used in this
study was feldspathic porcelain color A3
(Vmk 68, VITA, Germany). A nickel-
chromium dental casting alloy (Wiron99,
Bego, Germany) was used for casting.
Specimen preparation
A total of hundred and thirty five
disk-shaped specimens (8mm diameter x
7mm height) were prepared; 45 specimens
from feldspathic porcelain (P), 45 specimens
from nickel-chromium alloy (M), and 45
specimens from alloy/feldspathic porcelain
(M/P).
Preparation of metal specimens (M) and
porcelain specimens (P)
90 disk-shaped wax patterns (8 mm
diameter x 7 mm height) were prepared
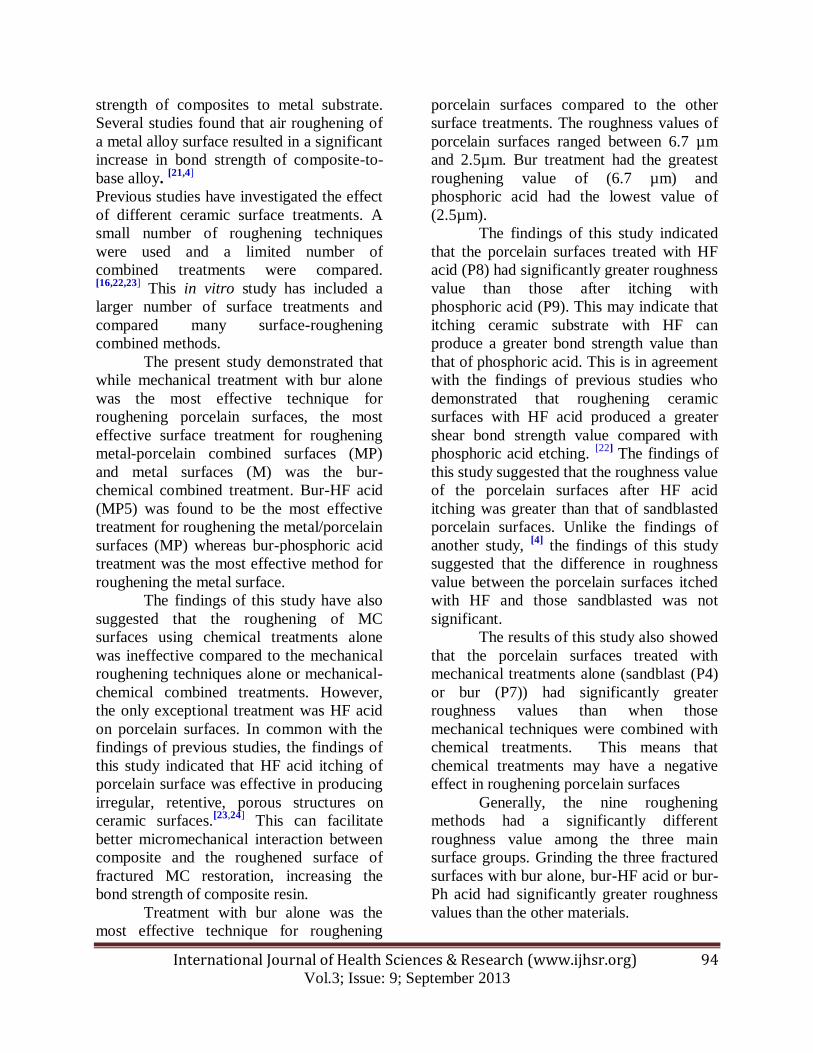
using a silicone mold and inlay wax (Figure
1). The wax patterns were then invested in
50/50 % stone and plaster mix and casted
using a nickel-chromium dental casting
alloy.
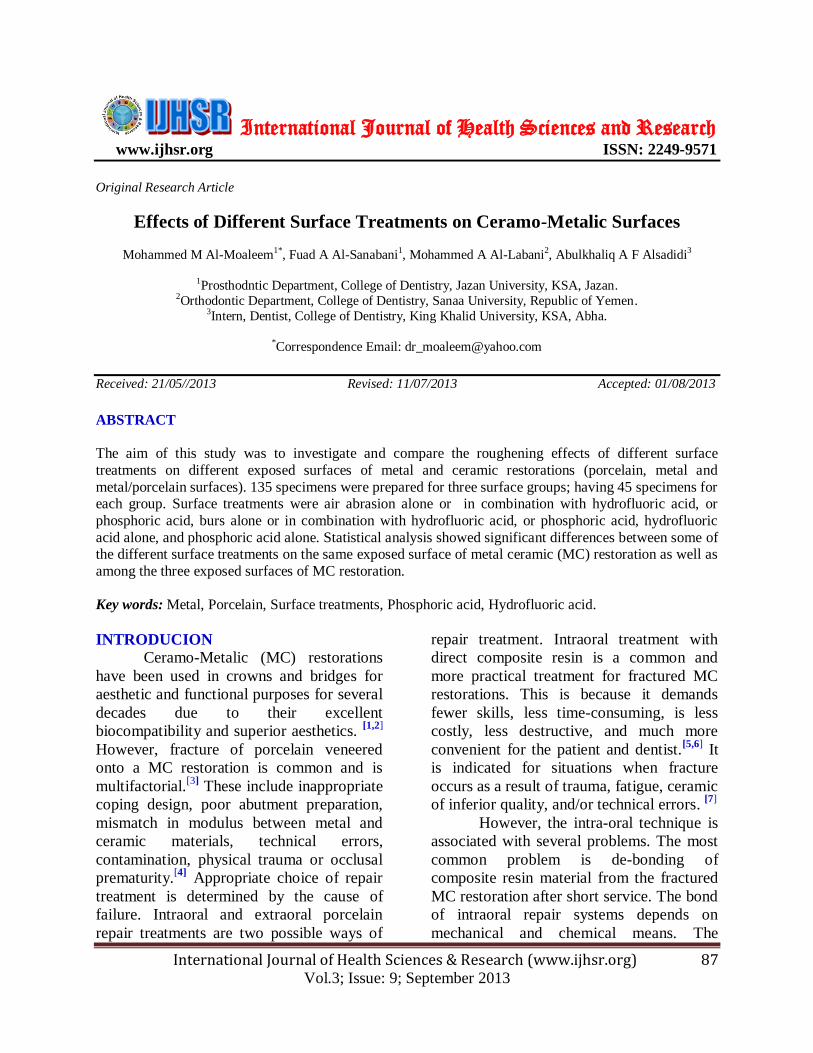
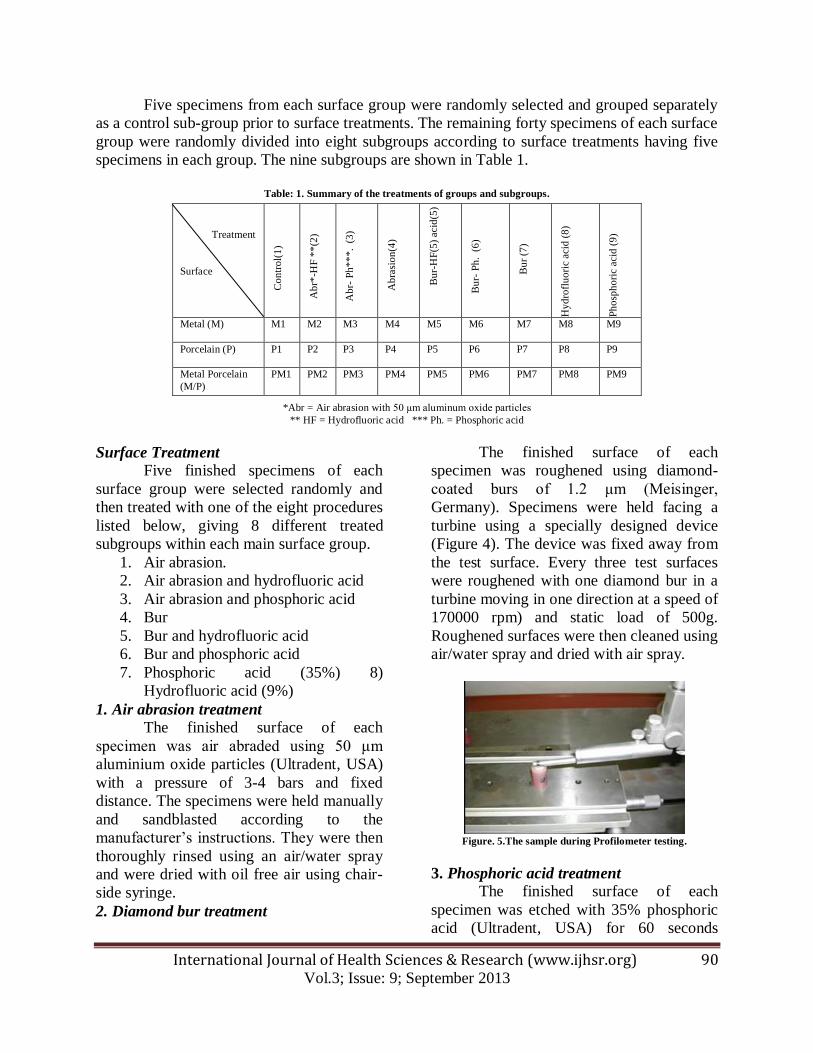
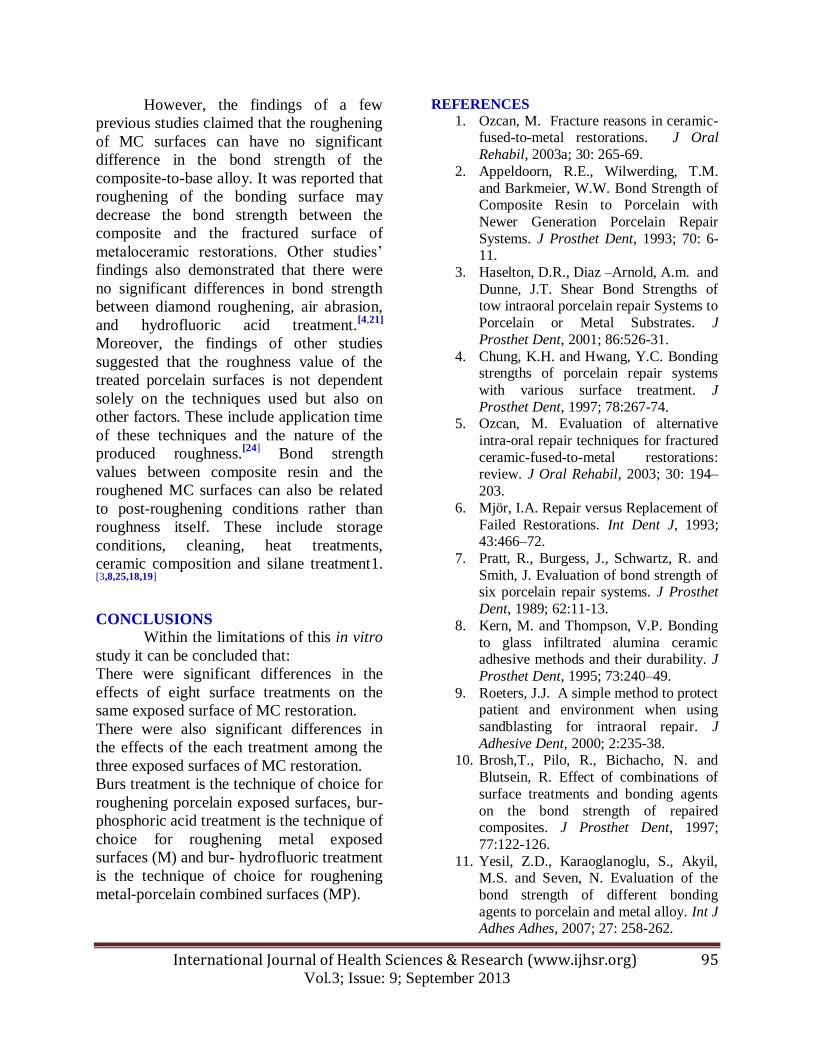
Figure. 1. Diagram represents the metal specimen. Figure. 2. A semi-circular metal specimen.
International Journal of Health Sciences & Research (www.ijhsr.org) 89
Vol.3; Issue: 9; September 2013
All specimens were then sandblasted
with 110 μm aluminium oxide abrasive
particles and were cleaned in an ultrasonic
unit with distilled water to remove any
remaining investment. The 90 specimens
were then randomly divided into two groups
of 45 specimens each. These groups were
the metal group (M) and porcelain group
(P).
For porcelain group (P), porcelain
material (Vmk 68, VITA, Germany) was
applied on to the finished surfaces of the 45
specimens selected for this group. Each
specimen was held with artery clamps and
then inserted into a modified syringe tube
(8mm in internal diameter and 9 mm in
height) (Discardit II, Spain). The opaque and
dentine porcelain layers were mixed
according to manufacturer’s instructions,
and applied to the finished surfaces using
the modified syringe tube. Porcelain layers
were fired at 9 Cº under vacuum in a touch
keyboarded computerized porcelain furnace
(VACUMAT-30, VITA, Germany)
according to the manufacturer’s instructions.
For metal/porcelain group (M/P): 45
disk-shaped metal cylinder (8 mm diameter,
7 mm height with depth of 2 mm as semi-
circular) were prepared from the same nickel
chrome metal. The wax patterns were then
invested in 50/50 % stone and plaster mix
and casted using a nickel-chromium dental
casting alloy (Figure 2). The 45 specimens
were then embedded in a phenolic ring with
a cold-polymerised acrylic resin material
(De Trey RR. Dentsply, England). The
opaque and dentine porcelain layers were
mixed according to the manufacturer’s
instructions, and applied to the finished
surfaces using the same modified syringe
tube. Porcelain layers were fired at 930 ±10
Cº under vacuum in a touch keyboarded
computerized porcelain furnace
(VACUMAT-30, VITA, Germany)
according to the manufacturer’s instructions.
A laboratory medium-grit sintered diamond
was then used to finish the metal and
porcelain surface. All specimens were
finished with 110 μm aluminium oxide
abrasive particles. The specimens were then
cleaned in an ultrasonic unit with distilled
water to remove any remaining investment.
The one hundred and thirty five specimens
were then embedded in a phenolic ring with
a cold-polymerised acrylic resin material
(De Trey RR. Dentsply, England). The
surfaces of the mounted specimens were
finished using a wet silicon carbide paper
(240grit) to achieve flat surfaces and cleaned
in an ultrasonic unit with distilled water to
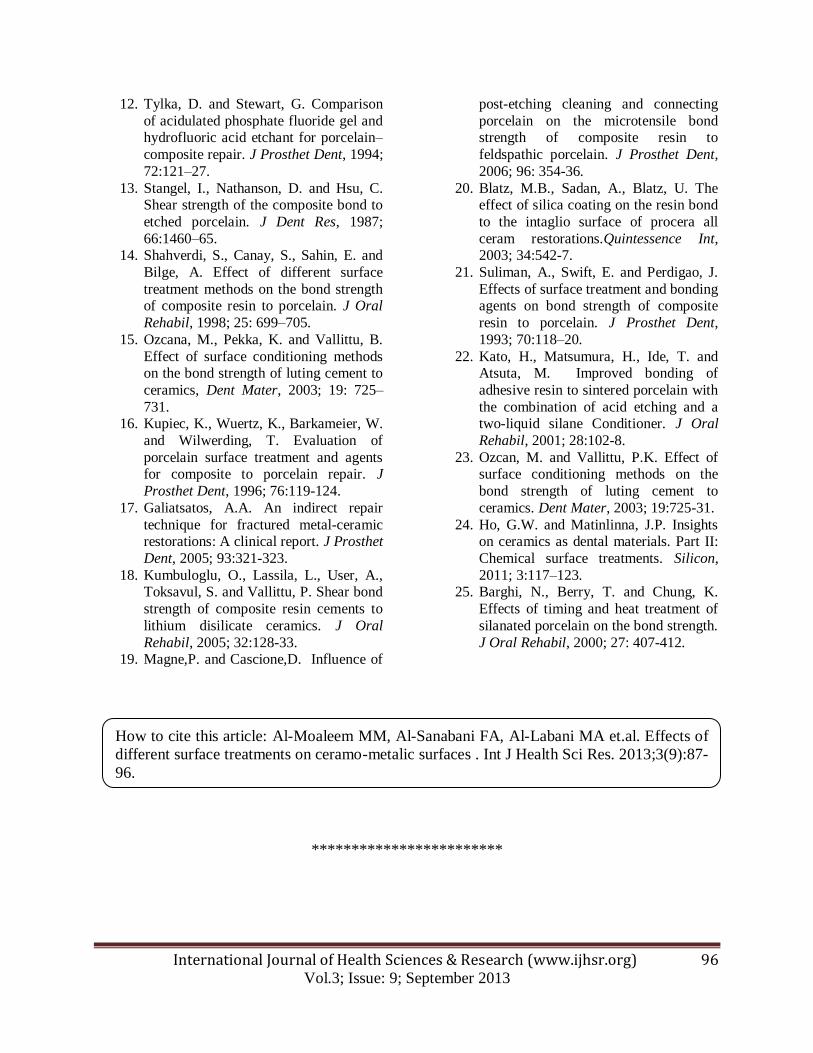
remove any trapped residue. The prepared
surface specimens of the three groups
embedded in the acrylic resin material are
shown in figure 3.
Figure 3. Prepared specimens. A- Porcelain, B- Metal, C- Metal/Porcelain. Figure.4. Specially designed device for burs treatment.
International Journal of Health Sciences & Research (www.ijhsr.org) 90
Vol.3; Issue: 9; September 2013
Five specimens from each surface group were randomly selected and grouped separately
as a control sub-group prior to surface treatments. The remaining forty specimens of each surface
group were randomly divided into eight subgroups according to surface treatments having five
specimens in each group. The nine subgroups are shown in Table 1.
Table: 1. Summary of the treatments of groups and subgroups.
*Abr = Air abrasion with 50 μm aluminum oxide particles
** HF = Hydrofluoric acid *** Ph. = Phosphoric acid
Surface Treatment
Five finished specimens of each
surface group were selected randomly and
then treated with one of the eight procedures
listed below, giving 8 different treated
subgroups within each main surface group.
1. Air abrasion.
2. Air abrasion and hydrofluoric acid
3. Air abrasion and phosphoric acid
4. Bur
5. Bur and hydrofluoric acid
6. Bur and phosphoric acid
7. Phosphoric acid (35%) 8)
Hydrofluoric acid (9%)
1. Air abrasion treatment
The finished surface of each
specimen was air abraded using 50 μm
aluminium oxide particles (Ultradent, USA)
with a pressure of 3-4 bars and fixed
distance. The specimens were held manually
and sandblasted according to the
manufacturer’s instructions. They were then
thoroughly rinsed using an air/water spray
and were dried with oil free air using chair-
side syringe.
2. Diamond bur treatment
The finished surface of each
specimen was roughened using diamond-
coated burs of 1.2 μm (Meisinger,
Germany). Specimens were held facing a
turbine using a specially designed device
(Figure 4). The device was fixed away from
the test surface. Every three test surfaces
were roughened with one diamond bur in a
turbine moving in one direction at a speed of
170000 rpm) and static load of 500g.
Roughened surfaces were then cleaned using
air/water spray and dried with air spray.
Figure. 5.The sample during Profilometer testing.
3. Phosphoric acid treatment
The finished surface of each
specimen was etched with 35% phosphoric
acid (Ultradent, USA) for 60 seconds
Treatment
Surface
C
on
tro
l(1
)
A
br*
-HF
**
(2)
A
br-
Ph
**
*. (
3)
A
bra
sio
n(4
)
B
ur-
HF
(5)
acid
(5)
Bu
r- P
h.
(6
)
B
ur
(7)
Hy
dro
flu
ori
c ac
id (
8)
Ph
osp
ho
ric
acid
(9
)
Metal (M)
M1 M2 M3 M4 M5 M6 M7 M8 M9
Porcelain (P)
P1 P2 P3 P4
P5 P6 P7 P8 P9
Metal Porcelain
(M/P)
PM1 PM2 PM3 PM4 PM5 PM6 PM7 PM8 PM9
International Journal of Health Sciences & Research (www.ijhsr.org) 91
Vol.3; Issue: 9; September 2013
according to the manufacturer’s instructions.
The etched specimens were then thoroughly
rinsed using air/water spray for 60 seconds
and were dried using free air spray.
4. Hydrofluoric acid treatment
The finished surface of each
specimen was etched with 9% hydrofluoric
acid (HF) (Ultradent, USA) for 60 seconds
according to the manufacturer’s instructions.
The etched surfaces were then thoroughly
rinsed using an air/water spray for 60
seconds and dried using free air spray.
Roughness testing
The135 specimens of all subgroups
were subjected to roughness testing using a
Profilometer (Mitutoyo, Japan). The
roughness test was expressed as roughness
average “Ra Value” and was calculated in
micrometer (μm). Each roughness test
specimen was tested by placing it
horizontally on the flat fixed surface of the
Profilometer with a small amount of glue to
avoid unwanted movement Figure 5. Three
readings for each specimen were taken. For
each reading, the stylus of the Profilometer
was moved three times over the test surface
of each specimen at least 4 mm away from
the center of the surface in three different
directions.
Ro
ugh
ne
ss v
lau
e (
µm
)
Metal(M) Porcelain(P) Metal/porcelain(MP)
0
1
2
3
4
5
6
7
8
9
1.52.1
3.22.7
3.5 3.6
2.9 3
4.3
2.9
4.1 4.34.14.5
7
55.6
4.54.1
6.7
5.7
1.5
4.4
3.4
1.5
2.5
3.4
Control (1)
Air abrasion & HF(2)
Air abrasion & Ph. Acid (3)
Air abrasion(4)
Bur & HF(5)
Bur & Ph. Acid(6)
Burs (7)
HF acid (8)
Ph. Acid (9)
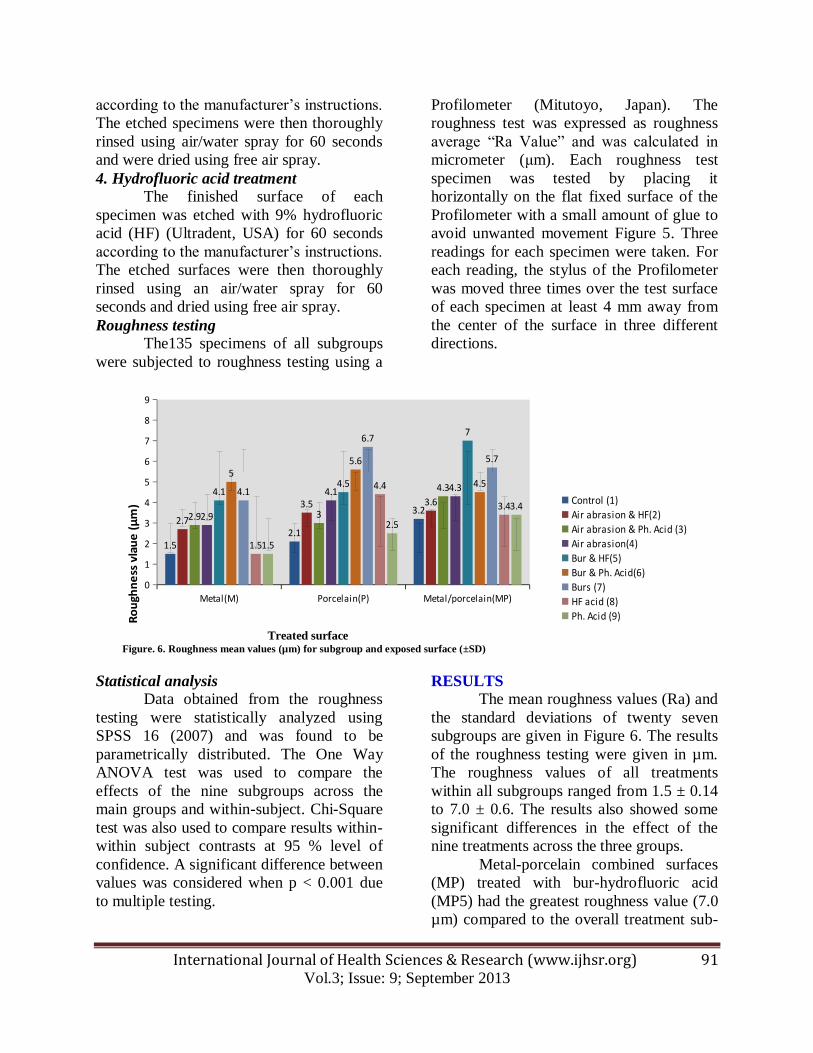
Treated surface Figure. 6. Roughness mean values (µm) for subgroup and exposed surface (±SD)
Statistical analysis
Data obtained from the roughness
testing were statistically analyzed using
SPSS 16 (2007) and was found to be
parametrically distributed. The One Way
ANOVA test was used to compare the
effects of the nine subgroups across the
main groups and within-subject. Chi-Square
test was also used to compare results within-
within subject contrasts at 95 % level of
confidence. A significant difference between
values was considered when p < 0.001 due
to multiple testing.
RESULTS
The mean roughness values (Ra) and
the standard deviations of twenty seven
subgroups are given in Figure 6. The results
of the roughness testing were given in µm.
The roughness values of all treatments
within all subgroups ranged from 1.5 ± 0.14
to 7.0 ± 0.6. The results also showed some
significant differences in the effect of the
nine treatments across the three groups.
Metal-porcelain combined surfaces
(MP) treated with bur-hydrofluoric acid
(MP5) had the greatest roughness value (7.0
µm) compared to the overall treatment sub-
International Journal of Health Sciences & Research (www.ijhsr.org) 92
Vol.3; Issue: 9; September 2013
groups tested in this study. The specimens of
the control treatment of all surfaces (MP1,
P1 and M1) had the lowest roughness values
(3.2 µm, 2.1 µm, 1.5 µm respectively).
The mechanical treatment with bur
alone was the most effective technique for
roughening porcelain surfaces (P). The most
effective surface treatment for roughening
metal-porcelain combined surfaces (MP)
and metal surfaces (M) was the bur-
chemical combined treatment; bur-
hydrofluoric acid and bur-phosphoric acid
respectively.
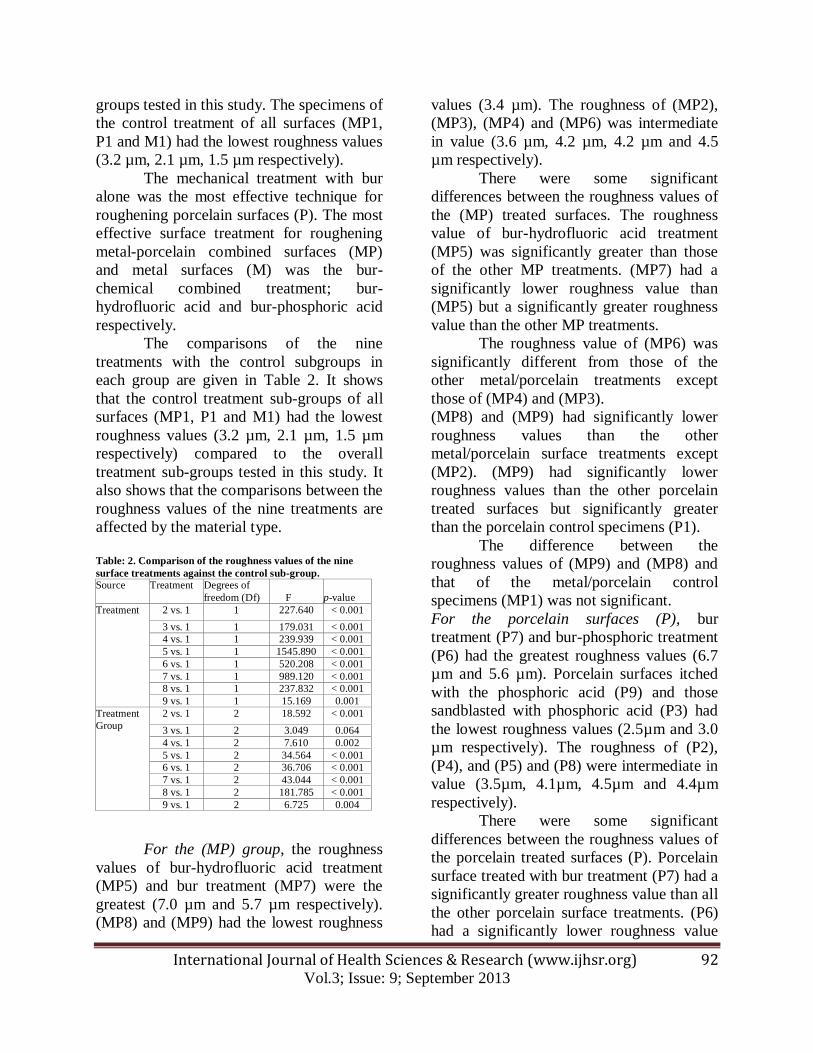
The comparisons of the nine
treatments with the control subgroups in
each group are given in Table 2. It shows
that the control treatment sub-groups of all
surfaces (MP1, P1 and M1) had the lowest
roughness values (3.2 µm, 2.1 µm, 1.5 µm
respectively) compared to the overall
treatment sub-groups tested in this study. It
also shows that the comparisons between the
roughness values of the nine treatments are
affected by the material type.
Table: 2. Comparison of the roughness values of the nine
surface treatments against the control sub-group.
Source Treatment Degrees of
freedom (Df) F p-value
Treatment 2 vs. 1 1 227.640 < 0.001
3 vs. 1 1 179.031 < 0.001
4 vs. 1 1 239.939 < 0.001
5 vs. 1 1 1545.890 < 0.001
6 vs. 1 1 520.208 < 0.001
7 vs. 1 1 989.120 < 0.001
8 vs. 1 1 237.832 < 0.001
9 vs. 1 1 15.169 0.001
Treatment
Group
2 vs. 1 2 18.592 < 0.001
3 vs. 1 2 3.049 0.064
4 vs. 1 2 7.610 0.002
5 vs. 1 2 34.564 < 0.001
6 vs. 1 2 36.706 < 0.001
7 vs. 1 2 43.044 < 0.001
8 vs. 1 2 181.785 < 0.001
9 vs. 1 2 6.725 0.004
For the (MP) group, the roughness
values of bur-hydrofluoric acid treatment
(MP5) and bur treatment (MP7) were the
greatest (7.0 µm and 5.7 µm respectively).
(MP8) and (MP9) had the lowest roughness
values (3.4 µm). The roughness of (MP2),
(MP3), (MP4) and (MP6) was intermediate
in value (3.6 µm, 4.2 µm, 4.2 µm and 4.5
µm respectively).
There were some significant
differences between the roughness values of
the (MP) treated surfaces. The roughness
value of bur-hydrofluoric acid treatment
(MP5) was significantly greater than those
of the other MP treatments. (MP7) had a
significantly lower roughness value than
(MP5) but a significantly greater roughness
value than the other MP treatments.
The roughness value of (MP6) was
significantly different from those of the
other metal/porcelain treatments except
those of (MP4) and (MP3).
(MP8) and (MP9) had significantly lower
roughness values than the other
metal/porcelain surface treatments except
(MP2). (MP9) had significantly lower
roughness values than the other porcelain
treated surfaces but significantly greater
than the porcelain control specimens (P1).
The difference between the
roughness values of (MP9) and (MP8) and
that of the metal/porcelain control
specimens (MP1) was not significant.
For the porcelain surfaces (P), bur
treatment (P7) and bur-phosphoric treatment
(P6) had the greatest roughness values (6.7
µm and 5.6 µm). Porcelain surfaces itched
with the phosphoric acid (P9) and those
sandblasted with phosphoric acid (P3) had
the lowest roughness values (2.5µm and 3.0
µm respectively). The roughness of (P2),
(P4), and (P5) and (P8) were intermediate in
value (3.5µm, 4.1µm, 4.5µm and 4.4µm
respectively).
There were some significant
differences between the roughness values of
the porcelain treated surfaces (P). Porcelain
surface treated with bur treatment (P7) had a
significantly greater roughness value than all
the other porcelain surface treatments. (P6)
had a significantly lower roughness value
International Journal of Health Sciences & Research (www.ijhsr.org) 93
Vol.3; Issue: 9; September 2013
than (P7) but a significantly greater than the
other metal/porcelain treatments (p< 0.001).
The differences in roughness values between
the sandblasted porcelain surfaces (P4),
hydrofluoric itched surfaces (P8) and bur-
hydrofluoric treated surfaces (P5) were not
significant. (P4) had a significantly greater
roughness value than (P2) and (P3). (P3) and
(P9) had significantly lower roughness
values than the other surface treatments. The
difference between their roughness values
was significant. The roughness value of (P3)
was significantly greater than that of (P9).
(P9) showed significantly greater roughness
value than the porcelain control specimens
(P1).
For the metal alloy surfaces (M),
bur-phosphoric acid treatment (M6), bur-
hydrofluoric acid (M5) and bur treatment
(M7) had the greatest roughness value (5.0
µm, 4.1 µm and 4.1 µm). Metal alloy
surfaces treated with hydrofluoric acid (M8)
and phosphoric acid (M9) had the lowest
roughness values (1.5 µm). The sandblasted
metal alloy surfaces (M4), sandblasted with
phosphoric acid (M3) and sandblasted with
hydrofluoric (M2) had intermediate
roughness vales (2.9µm, 2.9µm and 2.7µm
respectively).
There were some significant
differences between the roughness values of
the metal alloy treated surfaces (M). There
was a significant difference in roughness
values between the metal alloy surfaces
treated with bur-phosphoric acid (M6) and
those of the metal alloy surfaces treated with
bur-hydrofluoric acid (M5) and bur alone
(M7). The difference in roughness value
between (M5) and (M7) was not significant.
The difference in roughness value between
the specimens of (M5), (M6) and (M7) and
those of the other metal alloy surface
treatments was significant. The difference in
roughness value between the metal alloy
surface treated with sandblast-hydrofluoric
(M2), sandblast-phosphoric (M3) and
sandblast alone (M4) was not significant.
The difference in roughness value between
(M2), (M3) and (M4) and those of the other
metal surface treatments was significant.
The roughness values of the metal surfaces
treated with hydrofluoric acid (M8) was not
significantly different from those treated
with phosphoric acid (M9). The roughness
values of (M8) and (M9) were significantly
different from all those of the other metal
surface treatments except the control
subgroup of porcelain surfaces (M1).
DISCUSSION
This in vitro study has demonstrated
that there were significant differences
between the effects of different surface
treatments on different exposed surfaces of
the MC restorations.
Intra-oral repair of fractured metal-
ceramic (MC) restorations with composite
resin is a practically advantageous
alternative to the indirect repair method. The
application of composite to a fractured (MC)
restoration in the clinic can be cheap,
straightforward and time saving. However,
the weak bond of resin to porcelain and/or
metal is one disadvantage of the use of
direct intraoral repair with composite.
Therefore, such bond strength is of
fundamental importance for long-term
serviceability of composite resin bonded to
metal-ceramic restorations. It is well-
documented that roughening of the fractured
surface of the metaloceramic restoration is
one of the important factors that contribute
to an effective and durable bonding between
resin composite and silica-based ceramics. [13,14,16-19]
This is because the increased
roughness of ceramic surface improves the
mechanical interaction of the luting cement
to the ceramic surfaces and also increases
the total surface energy of the ceramic
surface, thus, its wettability. [4,20]
Similarly, the roughening of metal
alloy surface can also contribute to the bond
International Journal of Health Sciences & Research (www.ijhsr.org) 94
Vol.3; Issue: 9; September 2013
strength of composites to metal substrate.
Several studies found that air roughening of
a metal alloy surface resulted in a significant
increase in bond strength of composite-to-
base alloy. [21,4]
Previous studies have investigated the effect
of different ceramic surface treatments. A
small number of roughening techniques
were used and a limited number of
combined treatments were compared. [16,22,23]
This in vitro study has included a
larger number of surface treatments and
compared many surface-roughening
combined methods.
The present study demonstrated that
while mechanical treatment with bur alone
was the most effective technique for
roughening porcelain surfaces, the most
effective surface treatment for roughening
metal-porcelain combined surfaces (MP)
and metal surfaces (M) was the bur-
chemical combined treatment. Bur-HF acid
(MP5) was found to be the most effective
treatment for roughening the metal/porcelain
surfaces (MP) whereas bur-phosphoric acid
treatment was the most effective method for
roughening the metal surface.
The findings of this study have also
suggested that the roughening of MC
surfaces using chemical treatments alone
was ineffective compared to the mechanical
roughening techniques alone or mechanical-
chemical combined treatments. However,
the only exceptional treatment was HF acid
on porcelain surfaces. In common with the
findings of previous studies, the findings of
this study indicated that HF acid itching of
porcelain surface was effective in producing
irregular, retentive, porous structures on
ceramic surfaces.[23,24]
This can facilitate
better micromechanical interaction between
composite and the roughened surface of
fractured MC restoration, increasing the
bond strength of composite resin.
Treatment with bur alone was the
most effective technique for roughening
porcelain surfaces compared to the other
surface treatments. The roughness values of
porcelain surfaces ranged between 6.7 µm
and 2.5µm. Bur treatment had the greatest
roughening value of (6.7 µm) and
phosphoric acid had the lowest value of
(2.5µm).
The findings of this study indicated
that the porcelain surfaces treated with HF
acid (P8) had significantly greater roughness
value than those after itching with
phosphoric acid (P9). This may indicate that
itching ceramic substrate with HF can
produce a greater bond strength value than
that of phosphoric acid. This is in agreement
with the findings of previous studies who
demonstrated that roughening ceramic
surfaces with HF acid produced a greater
shear bond strength value compared with
phosphoric acid etching. [22]
The findings of
this study suggested that the roughness value
of the porcelain surfaces after HF acid
itching was greater than that of sandblasted
porcelain surfaces. Unlike the findings of
another study, [4]
the findings of this study
suggested that the difference in roughness
value between the porcelain surfaces itched
with HF and those sandblasted was not
significant.
The results of this study also showed
that the porcelain surfaces treated with
mechanical treatments alone (sandblast (P4)
or bur (P7)) had significantly greater
roughness values than when those
mechanical techniques were combined with
chemical treatments. This means that
chemical treatments may have a negative
effect in roughening porcelain surfaces
Generally, the nine roughening
methods had a significantly different
roughness value among the three main
surface groups. Grinding the three fractured
surfaces with bur alone, bur-HF acid or bur-
Ph acid had significantly greater roughness
values than the other materials.
International Journal of Health Sciences & Research (www.ijhsr.org) 95
Vol.3; Issue: 9; September 2013
However, the findings of a few
previous studies claimed that the roughening
of MC surfaces can have no significant
difference in the bond strength of the
composite-to-base alloy. It was reported that
roughening of the bonding surface may
decrease the bond strength between the
composite and the fractured surface of
metaloceramic restorations. Other studies’
findings also demonstrated that there were
no significant differences in bond strength
between diamond roughening, air abrasion,
and hydrofluoric acid treatment.[4,21]
Moreover, the findings of other studies
suggested that the roughness value of the
treated porcelain surfaces is not dependent
solely on the techniques used but also on
other factors. These include application time
of these techniques and the nature of the
produced roughness.[24]
Bond strength
values between composite resin and the
roughened MC surfaces can also be related
to post-roughening conditions rather than
roughness itself. These include storage
conditions, cleaning, heat treatments,
ceramic composition and silane treatment1. [3,8,25,18,19]
CONCLUSIONS
Within the limitations of this in vitro
study it can be concluded that:
There were significant differences in the
effects of eight surface treatments on the
same exposed surface of MC restoration.
There were also significant differences in
the effects of the each treatment among the
three exposed surfaces of MC restoration.
Burs treatment is the technique of choice for
roughening porcelain exposed surfaces, bur-
phosphoric acid treatment is the technique of
choice for roughening metal exposed
surfaces (M) and bur- hydrofluoric treatment
is the technique of choice for roughening
metal-porcelain combined surfaces (MP).
REFERENCES
1. Ozcan, M. Fracture reasons in ceramic-fused-to-metal restorations. J Oral
Rehabil, 2003a; 30: 265-69.
2. Appeldoorn, R.E., Wilwerding, T.M.
and Barkmeier, W.W. Bond Strength of Composite Resin to Porcelain with
Newer Generation Porcelain Repair
Systems. J Prosthet Dent, 1993; 70: 6-11.
3. Haselton, D.R., Diaz –Arnold, A.m. and
Dunne, J.T. Shear Bond Strengths of tow intraoral porcelain repair Systems to
Porcelain or Metal Substrates. J
Prosthet Dent, 2001; 86:526-31.
4. Chung, K.H. and Hwang, Y.C. Bonding strengths of porcelain repair systems
with various surface treatment. J
Prosthet Dent, 1997; 78:267-74. 5. Ozcan, M. Evaluation of alternative
intra-oral repair techniques for fractured
ceramic-fused-to-metal restorations: review. J Oral Rehabil, 2003; 30: 194–
203.
6. Mjör, I.A. Repair versus Replacement of
Failed Restorations. Int Dent J, 1993; 43:466–72.
7. Pratt, R., Burgess, J., Schwartz, R. and
Smith, J. Evaluation of bond strength of six porcelain repair systems. J Prosthet
Dent, 1989; 62:11-13.
8. Kern, M. and Thompson, V.P. Bonding
to glass infiltrated alumina ceramic adhesive methods and their durability. J
Prosthet Dent, 1995; 73:240–49.
9. Roeters, J.J. A simple method to protect patient and environment when using
sandblasting for intraoral repair. J
Adhesive Dent, 2000; 2:235-38. 10. Brosh,T., Pilo, R., Bichacho, N. and
Blutsein, R. Effect of combinations of
surface treatments and bonding agents
on the bond strength of repaired composites. J Prosthet Dent, 1997;
77:122-126.
11. Yesil, Z.D., Karaoglanoglu, S., Akyil, M.S. and Seven, N. Evaluation of the
bond strength of different bonding
agents to porcelain and metal alloy. Int J Adhes Adhes, 2007; 27: 258-262.
International Journal of Health Sciences & Research (www.ijhsr.org) 96
Vol.3; Issue: 9; September 2013
12. Tylka, D. and Stewart, G. Comparison
of acidulated phosphate fluoride gel and hydrofluoric acid etchant for porcelain–
composite repair. J Prosthet Dent, 1994;
72:121–27.
13. Stangel, I., Nathanson, D. and Hsu, C. Shear strength of the composite bond to
etched porcelain. J Dent Res, 1987;
66:1460–65. 14. Shahverdi, S., Canay, S., Sahin, E. and
Bilge, A. Effect of different surface
treatment methods on the bond strength of composite resin to porcelain. J Oral
Rehabil, 1998; 25: 699–705.
15. Ozcana, M., Pekka, K. and Vallittu, B.
Effect of surface conditioning methods on the bond strength of luting cement to
ceramics, Dent Mater, 2003; 19: 725–
731. 16. Kupiec, K., Wuertz, K., Barkameier, W.
and Wilwerding, T. Evaluation of
porcelain surface treatment and agents for composite to porcelain repair. J
Prosthet Dent, 1996; 76:119-124.
17. Galiatsatos, A.A. An indirect repair
technique for fractured metal-ceramic restorations: A clinical report. J Prosthet
Dent, 2005; 93:321-323.
18. Kumbuloglu, O., Lassila, L., User, A., Toksavul, S. and Vallittu, P. Shear bond
strength of composite resin cements to
lithium disilicate ceramics. J Oral
Rehabil, 2005; 32:128-33. 19. Magne,P. and Cascione,D. Influence of
post-etching cleaning and connecting
porcelain on the microtensile bond strength of composite resin to
feldspathic porcelain. J Prosthet Dent,
2006; 96: 354-36.
20. Blatz, M.B., Sadan, A., Blatz, U. The effect of silica coating on the resin bond
to the intaglio surface of procera all
ceram restorations.Quintessence Int, 2003; 34:542-7.
21. Suliman, A., Swift, E. and Perdigao, J.
Effects of surface treatment and bonding agents on bond strength of composite
resin to porcelain. J Prosthet Dent,
1993; 70:118–20.
22. Kato, H., Matsumura, H., Ide, T. and Atsuta, M. Improved bonding of
adhesive resin to sintered porcelain with
the combination of acid etching and a two-liquid silane Conditioner. J Oral
Rehabil, 2001; 28:102-8.
23. Ozcan, M. and Vallittu, P.K. Effect of surface conditioning methods on the
bond strength of luting cement to
ceramics. Dent Mater, 2003; 19:725-31.
24. Ho, G.W. and Matinlinna, J.P. Insights on ceramics as dental materials. Part II:
Chemical surface treatments. Silicon,
2011; 3:117–123. 25. Barghi, N., Berry, T. and Chung, K.
Effects of timing and heat treatment of
silanated porcelain on the bond strength.
J Oral Rehabil, 2000; 27: 407-412.
************************
How to cite this article: Al-Moaleem MM, Al-Sanabani FA, Al-Labani MA et.al. Effects of
different surface treatments on ceramo-metalic surfaces . Int J Health Sci Res. 2013;3(9):87-
96.
Top Related
Copyright © 2022 FDOKUMEN

