


Bahasa
Halaman
Hukum

Effect of Shear Tab Connection on Lateral Torsional Buckling Capacity
of W-Shape Beam
Pronob Kumar Ghosh
A Thesis in
The Department of
Building, Civil and Environmental Engineering
Presented to Partial Fulfillment of the Requirements
For the Degree of
Master of Applied Science (Civil Engineering)
at Concordia University
Montreal, Quebec, Canada
December 2021
© Pronob Kumar Ghosh, 2021
CONCORDIA UNIVERSITY
School of Graduate Studies
This is to certify that the thesis prepared
By: Pronob Kumar Ghosh
Entitled: Effect of Shear Tab Connection on Lateral Torsional Buckling Capacity of W-Shape
Beam
and submitted in partial fulfillment of the requirement for the degree of
Master of Applied Science (Civil Engineering)
complies with the regulation of the University and meets the accepted standards with respect to
originality and quality.
Signed by the final examining committee:
Chair
Dr. Lucia Tirca
Examiner
Dr. Mehdi Hojjati
Supervisor
Dr. Anjan Bhowmick
Approved by
Dr. Mazdak Nik-Bakht, Graduate Program Director
Dr. Mourad Debbabi, Dean of Faculty
Date: 10 December 2021
iii
Abstract
Effect of Shear Tab Connection on Lateral Torsional Buckling Capacity
of W- Shape Beam
Steel shear tab connections are one of the most common types of connections used to connect steel
beam to supporting columns and girders. Shear tab connections can be of two types: conventional
shear tab (CST) and extended shear tab (EST). In EST connection, the shear tab is generally
extended beyond the supporting member’s flange. While significant research has been conducted
on conventional shear tab connections, research on extended shear tab connections is limited. First,
this research presents the development of a three-dimensional (3D) finite element model (FEM) to
study the behavior of shear tab connections, both conventional and extended shear tab, in W-Shape
beam. Both material and geometric nonlinearities are considered in the FE model. The finite
element model is validated against available experimental results on both conventional and
extended shear tab connections. After validation of the FEM with experiments, a parametric study
is carried out for W-shape beam with unstiffened CST and EST connections with supporting
column web. In this parametric study, the effects of different parameters such as the number of
bolts, length, and thickness of shear tabs on both CST and EST connections are studied.
Previously, some research has been conducted on the stability and strength of EST connections;
however, to the best of this researcher’s knowledge, no research is currently available on the effect
of extended shear tab connections on lateral torsional buckling (LTB) strength of the supported
W-shape beam. The classic LTB equation in all codes is derived assuming both ends as simply
supported. Since extended shear tab connections have extended tab lengths and have partial
rotational rigidity, they do not act as perfect simple supports. Thus, EST connections can affect
the LTB strength of supported beam. Also, the LTB behavior of I-beam for extended beam-to-
column connections with multiple vertical rows of bolts has not been investigated to date. This
iv
research also presents a finite element (FE) analysis-based study to investigate the effect of
extended shear tab connections on the LTB capacity of I-beam. The following parameters are
considered in the study: shear tab thickness, bolt configurations with a single and double vertical
line of bolts and different bolt numbers, beam unbraced length, bolt group centroid distance from
the face of the supporting member, and the effect of stabilizer plate. Finally, a shear tab connection
using a standard channel section, instead of the conventional shear tab, is examined in this research.
It is observed that the proposed channel type shear tab connection can potentially be used in steel
construction instead of the conventional or extended shear tab connections currently used, and the
channel type shear tab connection can improve the LTB capacity of W-shape beam when compared
to the currently used shear tab connections.

v
Acknowledgements
First and foremost, I would like to give sincere gratitude to my research advisor Dr. Anjan
Bhowmick, who provided valuable guidance throughout this research. It is unforgettable for his
generous encouragement and understanding to overcome all obstacles in the completion of this
research.
I also would like to acknowledge the funding provided by the Gina Cody School of Engineering
and Computer Science, Concordia University, Montreal, Canada.
Finally, a special thanks is going to my family members, especially my mother Bina Ghosh, and
my brother Prodip Ghosh whose lifelong sacrifice and financial support allowed me to fulfill my
academic and personal goals.
vi
Table of Contents
List of Figures………………………………………………………………………....................xii
List of Tables………………………………………………………………………………..….xvii
List of Symbols……………………………………………………………………………...…xviii
List of Abbreviations……………………………………………………………………….……xx
Chapter 1 Introduction…………………………………………………………………………….1
1.1 General ………………………………………………………………………………………..1
1.2 Motivation……………………………………………………………………………………..3
1.3 Objectives……………………………………………………………………………………..3
1.4 Limitations…………………………………………………………………………………….4
1.5 Research Outline………………………………………………………………………………5
Chapter 2 Literature Review………………………………………………………………………7
2.1 General………………………………………………………………………………...7
2.2 Beam under Uniform Bending Moment………………………………………………7
2.2.1 Uniform Torsion…………………………………………………………….7
2.2.2 Non-Uniform Torsion………………………………………………………..8
2.2.3 Standard Lateral Torsional Buckling Solution…………………………….10
2.3 LTB Design Provision in Different Standards………………………………………..11
vii
2.3.1 CAN/CSA S16-14………………………………………………………….11
2.3.2 ANSI/AISC 360-10………………………………………………………...13
2.4 Factors Influence on Lateral Torsional Buckling……………………………………..14
2.4.1 Initial Imperfection…………………………………………………………14
2.4.2 Residual Stress ……………………………………………………………..15
2.4.3 Boundary Condition Effect…………………………………………………16
2.4.4 Moment Gradient Effect……………………………………………………17
2.5 Review of Previous Research on Lateral Torsional Buckling of Beam……………..18
2.5.1 Early Research on LTB…………………………………………………….18
2.5.2 Dibley (1969) ………………………………………………………………18
2.5.3 Fukumoto et al. (1980) ……………………………………………………..18
2.5.4 MacPhedran and Grondin (2009) …………………………………………..19
2.5.5 Subramanian and White (2015) ……………………………………………20
2.5.6 Kabir and Bhowmick (2018) ……………………………………………….20
2.6 Design Approaches of Shear Tab in North America………………………………….21
2.6.1 CISC Handbook 2016………………………………………………………21
2.6.2 AISC Steel Constriction Manual 2005……………………………………...23
2.6.3 AISC Steel Construction Manual 14th Edition, 2011……………………….26
viii
2.7 Previous research on Convention and Extended Shear Tab Connection……………...26
2.7.1 Richard et al. (1980) ………………………………………………………..27
2.7.2 Pham and Mansell (1982) ………………………………………………….27
2.7.3 Cheng et al. (1984) …………………………………………………………27
2.7.4 Astaneh et al. (1989) ……………………………………………………….28
2.7.5 Astaneh et al. (1993) ……………………………………………………….30
2.7.6 Bursi and Jaspart (1998) ……………………………………………………31
2.7.7 Sherman and Ghorbanpoor (2002) …………………………………………31
2.7.8 Ashakul (2004) …………………………………………………………….32
2.7.9 Creech (2005) ……………………………………………………………...33
2.7.10 Goodrich (2005) ………………………………………………………….33
2.7.11 Metzger (2006) …………………………………………………………...34
2.7.12 Rahman et al. (2007) ……………………………………………………...34
2.7.13 Mahmid et al. (2007) ……………………………………………………...35
2.7.14 Muir and Hewitt (2009) …………………………………………………..36
2.7.15 Marosi (2011) …………………………………………………………….36
2.7.16 Thornton and Frotney (2011)……………………………………………..37
2.7.17 Wen et al. (2014) ………………………………………………………….37
ix
2.7.18 Abou-zidan and Liu (2015)………………………………………………..38
2.8 Summary……………………………………………………………………………..38
Chapter 3 Finite Element Modeling of Shear Tab Connection…………………………………..39
3.1 Introduction…………………………………………………………………………..39
3.2 Method of Finite Element Model…………………………………………………….39
3.3 Material Properties…………………………………………………………………...40
3.4 Analysis Steps………………………………………………………………………..41
3.5 Interactions…………………………………………………………………………...42
3.6 Bolt Pretension……………………………………………………………………….44
3.7 Loading Condition…………………………………………………………………...44
3.8 Boundary Conditions………………………………………………………………...45
3.9 Element Selection……………………………………………………………………47
3.10 Mesh Refinement Study…………………………………………………………….48
3.11 Validation of Finite Element Modeling ……………………………………………51
3.11.1 Introduction……………………………………………………………….51
3.11.2 Details of Conventional Shear Tab Connection Test by
Astaneh et al. (1989) ….…………………………………………………………51
3.11.3 Detail of Extended Shear Tab Connection Test by Sherman and
x
Ghorbanpoor (2002) …………………………………………………………….53
3.11.4 Results and Comparison………………………………………………….55
3.11.4.1 Three Bolted Standard Shear Tab Connection by Astaneh et al.
(1989) ……………………………………………………………………55
3.11.4.2 Five Bolted Extended Shear Tab Connection by Sherman and
Ghorbanpoor (2002) ……………………………………………………..56
Chapter 4 Parametric Study on Conventional and Extended Shear Tab Connections
in W-Shape Beam…………………………………………………………………...59
4.1 General……………………………………………………………………………….59
4.2 Parametric Test Details………………………………………………………………60
4.3 Variation of Shear Force with Shear Tab Length……………………………………..61
4.4 Variation of Twist with the Shear Tab Length………………………………………..62
4.5 Relationship between Shear Force and Shear Displacement………………………….63
Chapter 5 Effect of Extended Shear Tab Connection on Laterally Unsupported
W-Shape Beam………………………………………………………………………..67
5.1 Introduction…………………………………………………………………………..67
5.2 Test Set up for Unstiffened Extended Shear Tab Connection Supported by Column
Web (Flexible Support)…………………………………………………………………..68
xi
5.3 Effect of Single Bolted Unstiffened EST Length on LTB capacity of W-Shape
Beam…………………………………………………………………………………….69
5.4 Effect of Single and Double Bolted Unstiffened EST Connection on LTB
capacity of W-Shape Beam...………………………………………………………….73
5.5 Effect of Stabilizer plates on Single Bolted EST Connection on LTB Strength of W-
Shape Beam.…...……………………………………………………………………….77
5.6 Effect of Stabilizer Plates on Single and Double Bolted EST Connection on LTB
capacity of W-Shape Beam. ...………………………………………………………….82
5.7 A new shear tab connection to improve LTB capacity of W-Shape
Beam.………………………………………………………………………...…………..87
Chapter 6 Conclusions and Recommendations…………………………………………………..93
6.1 Summary……………………………………………………………………………..93
6.2 Conclusions…………………………………………………………………………..94
6.3 Recommendations for future work ………………………………………………….96
References……………………………………………………………………………………….98
xii
List of Figures
Figure 1.1 Typical shear tab connection between beam and column web……………………2
Figure 2.1 Absolute moment value under different moment distribution…………………...12
Figure 2.2 Residual stress pattern recommended by ECCS (1984) ………………………...15
Figure 2.3 Conventional shear tab connected experimental test by Astaneh et al. (1989)….29
Figure 2.4 Extended shear tab connected experimental test by Sherman and Ghorbanpoor
(2002) ……………………………………………………………………………31
Figure 3.1 Stress-strain diagram for 350W steel (Ashakul 2004) …………………………..41
Figure 3.2 Stress-strain diagram for A325 bolts (Rahman et al. 2003) ……………………..41
Figure 3.3 Master surface (Red), slave surface (Pink) interaction among the beam,
EST, and bolts…………………..…………………..……………………………43
Figure 3.4 Applied minimum bolt pretension load to transfer the load from beam to EST…44
Figure 3.5 External load application in the mid span of the beam…………………………..45
Figure 3.6 Pin support boundary condition in the FEM……………………………………..46
Figure 3.7 Prevention of lateral movement of web for roller support ………………………46
Figure 3.8 Vertical movement prevention for roller support …………………...…………..47
Figure 3.9 Fine meshing for supporting column…………………..………………………...49
Figure 3.10 Meshing style in different regions (from ABAQUS) …………………………...50
Figure 3.11 FE mesh in the EST connection…………………..……………………………..50
xiii
Figure 3.12 Schematic of three bolted conventional shear tab connection tested
by Astaneh et al. (1989) …………………..…………………………………….52
Figure 3.13 Finite Element Model for the three bolted shear tab connection tested by
Astaneh et al. (1989)……………………………………………………………..52
Figure 3.14 Schematic of unstiffened extended shear tab connection test 4U by Sherman and
Ghorbanpoor (2002) ……………………………..………………………………54
Figure 3.15 Finite Element Model for EST connection test specimen, 4U, tested by Sherman
and Ghorbanpoor (2002) ………………………………………………………...54
Figure 3.16 FEM validation of three bolted shear tab connection tested by Astaneh et al.
(1989) …………………………………………………………………………....55
Figure 3.17 Shear force and shear displacement validation for specimen, 4U, tested by
Sherman and Ghorbanpoor (2002) ………………………………………………57
Figure 3.18 Shear force and twist relation for specimen, 4U, tested by Sherman and
Ghorbanpoor (2002)……………………………………………………….……..58
Figure 3.19 Twisting failure mode observed in FEM for specimen, 4U, tested by Sherman and
Ghorbanpoor (2002) ……………………………………………………………..58
Figure 4.1 Test setup for both conventional and extended shear tab connection……………59
Figure 4.2 Variation of shear force with shear tab length (8 mm thickness)…………….….61
Figure 4.3 Variation of shear force with shear tab length (10 mm thickness)………............61
Figure 4.4 Variation of shear force with shear tab length (12 mm thickness)………............62
xiv
Figure 4.5 Variation of shear force with twist (for 4 bolts and 8 mm thickness) …………..63
Figure 4.6 Variation of shear force with twist (for 9 bolts and 8 mm thickness)…...……….63
Figure 4.7 Shear force versus shear displacement relation for W410x54 beam ……………64
Figure 4.8 Shear force versus shear displacement relation for W460x60 beam ……………64
Figure 4.9 Shear force versus shear displacement relation for W690X125 beam ...………..65
Figure 4.10 Shear force versus shear displacement relation for W760x134 beam …………..65
Figure 4.11 Shear force versus shear displacement relation for W840x176 beam ………..…66
Figure 5.1 Test set up to investigate the effect of EST connection on LTB capacity of W-
shape beam…..…………………………………………………………………...68
Figure 5.2 Effect of EST connection with single vertical line of four bolts on LTB strength of
W410x54 beam……………………………………………..................................70
Figure 5.3 Effect of EST connection with single vertical line of five bolts on LTB strength of
W460x60 beam ………………………………………………………………….70
Figure 5.4 Effect of EST connection with single vertical line of six bolts on LTB strength of
W530x66 beam…………………………………..………………........................70
Figure 5.5 Effect of EST connection with single vertical line of seven bolts on LTB strength
of W690X125 beam……………………………………………….......................70
Figure 5.6 Effect of EST connection with single vertical line of eight bolts on LTB strength
of W760x134 beam ………………………………………………..…………….72
xv
Figure 5.7 Effect of EST connection with single vertical line of nine bolts on LTB strength
of W840x176 beam………………………………………………………………72
Figure 5.8 Double vertical line of bolted EST connection set up in FEM…………………..74
Figure 5.9 Effect of EST Connection on LTB capacity of W410x54 beam having single and
double vertical line of four bolts…………………………………………………74
Figure 5.10 Effect of EST Connection on LTB capacity of W460X60 beam having single and
double vertical line of five bolts…………………………………………………75
Figure 5.11 Effect of EST Connection on LTB capacity of W530x66 beam having single and
double vertical line of six bolts…………………………………………………..75
Figure 5.12 Effect of EST Connection on LTB capacity of W690X125 beam having single
and double vertical line of seven bolts.………………………………………….76
Figure 5.13 Effect of EST Connection on LTB capacity of W760x134 beam having single and
double vertical line of eight bolts………………………………………………...76
Figure 5.14 Effect of EST Connection on LTB capacity of W840x176 beam having single and
double vertical line of nine bolts…………………………………………………77
Figure 5.15 FE model of EST connections with Type II stabilizer plate……………………..77
Figure 5.16 FE model of EST connections with Type III stabilizer plate…………………….79
Figure 5.17 Effect of stabilizer plates in EST Connection on LTB Capacity of W410x54......80
Figure 5.18 Effect of stabilizer plates in EST Connection on LTB Capacity of W460x60......80
Figure 5.19 Effect of stabilizer plates in EST Connection on LTB Capacity of W530x66 .....81
xvi
Figure 5.20 Effect stabilizer plates in EST Connection on LTB Capacity of W690x125…...81
Figure 5.21 Effect stabilizer plates in EST Connection on LTB Capacity of W760x134 .......82
Figure 5.22 Effect of stabilizer plates in EST Connection on LTB Capacity of W840x176…82
Figure 5.23 Effect of stabilizer plates in single and double vertically bolted EST connection on
LTB capacity W410x54 beam……………………………………………………84
Figure 5.24 Effect of stabilizer plates in single and double vertically bolted EST connection
on LTB capacity W460x60 beam………………………………………………..84
Figure 5.25 Effect of stabilizer plates in single and double vertically bolted EST connection
on LTB capacity W530x66 beam………………………………………………..85
Figure 5.26 Effect of stabilizer plates in single and double vertically bolted EST connection
on LTB capacity W690X125 beam……………...………………………………85
Figure 5.27 Effect of stabilizer plates in single and double vertically bolted EST connection
on LTB capacity W760x134 beam………………………………………………86
Figure 5.28 Effect of stabilizer plates in single and double vertically bolted EST connection
on LTB capacity W840x176 beam………………………………………………86
Figure 5.29 FE model of proposed channel shear tab connection……………………………87
Figure 5.30 Comparison of LTB capacities for W410x54 beam with unstiffened EST and channel
shear tab connections…………………………………………………………......91
Figure 5.31 Comparison of LTB capacities for W460x60 beam with unstiffened EST and channel
shear tab connections……………………………………………………………..91
xvii
List of Tables
Table 2.1 Length factor to reflect the boundary support condition………………………...16
Table 2.2 The effective length factor under different boundary condition…………………17
Table 2.3 List of all limits stated for the design of EST connection………………………..24
Table 3.1 Details of validated standard and extended shear tab experimental tests………..53
Table 3.2 Comparison of results between experiment and FE analysis…………………….56
Table 4.1 The details of shear tab dimension in finite element model……………………..60
Table 5.1 Test details to find out the effect of EST connection on LTB capacity of W-Shape
beam…………………………………………………………………………….70
Table 5.2 Details of proposed channel shear tab connection with W-Shape beam….…….89
Table 5.3 Lateral torsional buckling capacity of W410x54 section with channel shear tab
connection………………………………………………………………………..89
Table 5.4 Lateral torsional buckling capacity of W460x60 section with channel shear tab
connection…………………………………………………………………..……89
Table 5.5 Lateral torsional buckling capacity of W530x66 section with channel shear tab
connection…………………………………………………………………….....90
xviii
List of Symbols
a Weld line to bolt line distance
Cb Moment gradient factor
Cw Warping Constant
ew Weld eccentricity
Fy Yield stress
Fu Ultimate Stress
ho Center to center distance between flanges.
It Torsional Constant
Iy, Iz Moment of Inertia about weak axis
L Beam Length
Mb Elastic buckling capacity of unbraced beam.
Mcr Critical lateral torsional buckling constant
Mmax Absolute values of maximum moment
Ma Absolute first quarter moment
Mb Absolute second quarter moment
Mc Absolute third quarter moment
Mp Plastic moment
xix
Mu Ultimate moment capacity
rts Effective radius of gyration
ry Radius of gyration about weak axis
Sx Section modulus about X axis
E Modulus of elasticity
G Shear modulus
J Saint-Venant torsion Constant
k, kw Effective length factors
n Number of bolts
tp Thickness of Plate
λ Modified slenderness ratio
ω2 Uniform moment factor
φ Resistance factor
xx
List of Abbreviations
AASHTO American Association of State Highway and Transportation Officials
AISC American Institute of Steel Construction
ASTM America Society for Testing and Materials
CISC Canadian Institute of Steel Construction
CSA Canadian Standards Association
ECCS European Convention for Constructional Steelwork
EST Extended Shear Tab
FE Finite Element
FEM Finite Element Model
LTB Lateral Torsional Buckling
LVDT Linear Variable Differential Transformer
STD Standard bolt hole
1
Chapter 1
Introduction
1.1 General
Different types of steel beam sections are currently being used and design by designers. However,
W-section (I-shape) is more popular due to its higher strength around the major axis than the minor
axis. To design a steel I-beam, several limit states should be considered including flexural capacity,
shear capacity, local buckling, elastic-inelastic lateral-torsional buckling, etc. Among those limit
states, lateral torsional buckling (LTB) is one kind of flexural failure mode in which a beam section
simultaneously twists about its shear center and deflects out of its bending plane. The behavior of
LTB can be classified into three parts such as (1) plastic, (2) inelastic, and (3) elastic buckling
depending on different unsupported beam lengths. Different standards such as CAN/CSA S16-14
(2019), ANSI/AISC 360-16 (2016) estimate LTB capacity in terms of elastic lateral-torsional
buckling resistance of beam under simple and idealized boundary conditions at the ends of beam
(beam-to-column connection or beam-to-girder connection).
Among so many beam-column connections, shear tab connections are commonly used in steel
construction. Steel shear tab connections are single plate connection where a plate is welded to a
supporting member, column or girder, at one end by fillet weld and the other end is bolted to the
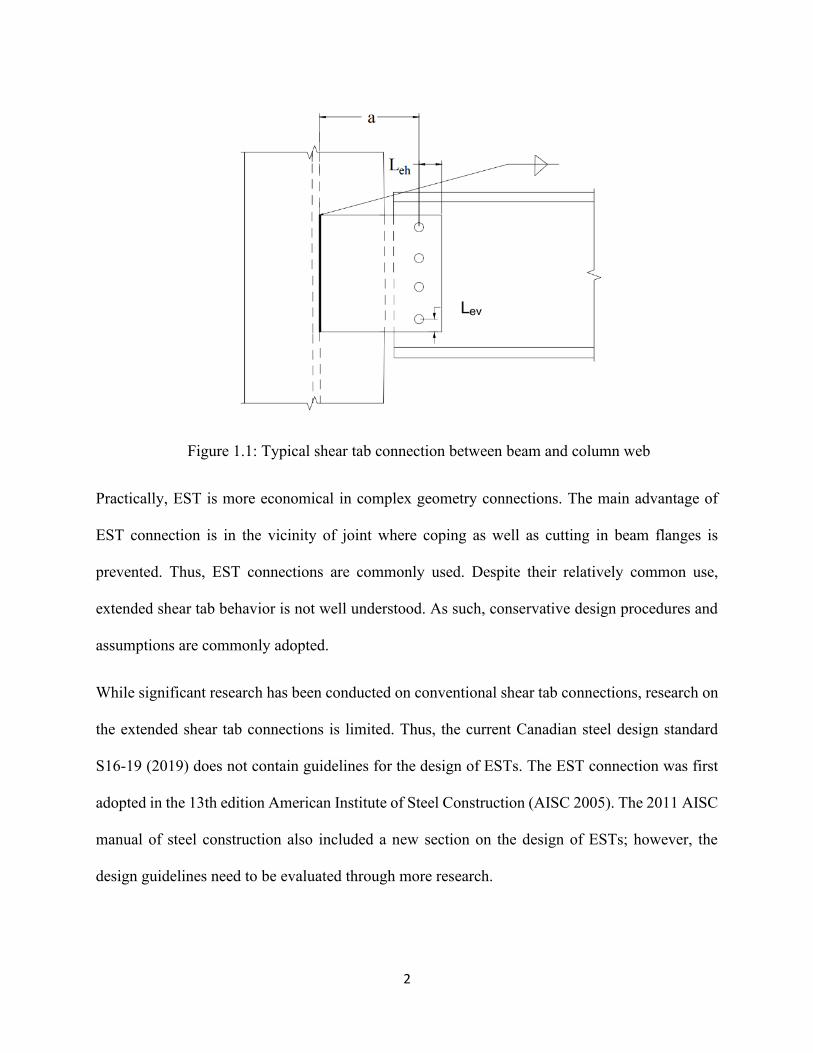
supported beam. Shear tab connections are of two types: conventional and extended shear tab
connections. In the conventional shear tab connection, weld line to the first vertical bolt line
distance (distance “a” as shown in Figure 1.1) is less than 88.9 mm and the number of bolts can be
between 2 to 12 in a single vertical row. When the weld line to the first vertical bolt line distance
(distance “a”) is more than 88.9 mm and/or the number of bolts is placed in a single or double
vertical rows, the shear tab connection is called an extended shear tab connection (EST).
2
Figure 1.1: Typical shear tab connection between beam and column web
Practically, EST is more economical in complex geometry connections. The main advantage of
EST connection is in the vicinity of joint where coping as well as cutting in beam flanges is
prevented. Thus, EST connections are commonly used. Despite their relatively common use,
extended shear tab behavior is not well understood. As such, conservative design procedures and
assumptions are commonly adopted.
While significant research has been conducted on conventional shear tab connections, research on
the extended shear tab connections is limited. Thus, the current Canadian steel design standard
S16-19 (2019) does not contain guidelines for the design of ESTs. The EST connection was first
adopted in the 13th edition American Institute of Steel Construction (AISC 2005). The 2011 AISC
manual of steel construction also included a new section on the design of ESTs; however, the
design guidelines need to be evaluated through more research.
3
From the few studies available on the extended shear tab connections, it is understood that the
extended shear tab connections will result in failure modes, such as twisting failure in the shear
tabs, that are not commonly observed in the conventional shear tab connections, and this ultimately
will have influence on the LTB strength of the supported beam.
1.2 Motivation
As stated earlier, the current CSA S16-19 standard, the LTB strength equations of W-Shape Beam
section are based on beam with simply supported end conditions. It is expected that the EST
connections between the supporting girder or column with the supported beam will have a major
effect on the LTB capacity of W beam. Unfortunately, the effect of EST connection in LTB
capacity of W-Shape Beam with geometric imperfection and residual stress has never been studied.
Also, the variation of LTB behavior and strength of I-beam with single and double vertical rows
of bolts, effect of stabilizer plates in the EST connections has not been studied. Thus, this research
is motivated to investigate the effect of EST connection on the LTB behavior of W-Shape Beam.
In previous research, it was confirmed that flexural, as well as LTB capacity of W-Shape Beam
can be substantially reduced due to the presence of residual stress. So, a standard residual stress
pattern has to be considered in this study to see the effect of both EST connection and residual
stress on the LTB capacity of W-shape beam. Moreover, effects of different parameters, such as
number of bolts, size of shear tab, presence of stabilizer plates in the shear tab connections, on the
LTB capacities of W-Shape Beam are considered this research.
1.3 Objectives
The main objective of this research is to critically investigate the effect of EST connection on the
lateral torsional buckling capacity of W- shape beam. Towards this goal, the key objectives of this
research project are as follows:
4
▪ To investigate the difference in behavior of conventional and extended shear tab
connections.
▪ To investigate effect of extended shear tab (EST) connection on lateral torsional buckling
(LTB) capacity of simple supported W-Shape beam.
▪ To investigate the effect of different parameters of EST connection, such as shear tab
dimensions (shear tab thickness and shear tab width), single and vertical line of bolt
configurations, no of bolts, on lateral torsional buckling (LTB) capacity of different W-
Shape beam.
▪ To investigate the effect of stabilizer plate in EST connection on LTB behavior of W-Shape
beam.
▪ Propose an effective solution to increase the LTB strength of laterally unsupported W-
Shape beam. This is done by welding a channel section, instead of plate, to the supported
member and then bolted with the supporting beam.
The above objectives will be achieved by developing a detailed 3D finite element model of I-beam
with shear tab connection in ABAQUS. The FE model will include geometric imperfections,
material non-linearity, and residual stress pattern. The validated FE model will be used to perform
an extensive parametric study by varying different shear tab lengths and thicknesses. In addition
to different parameters such as length and thickness of EST connection, geometric imperfections,
material non-linearity, and residual stress pattern is considered in finite element analysis.
1.4 Limitations
Several factors, for example, loading height, boundary condition, unbraced length, residual stress,
etc. have influence on the LTB capacity of W-Shape beam. The limitations of this research are as
follows.
5
▪ Only simply supported boundary conditions are considered in this research. To simulate
simply supported end conditions, one end of the beam is bolted with EST connection
whereas the other end was roller supported. The EST is connected with the column web
and the column ends were pin supported.
▪ Though different patterns for residual stress were proposed in the previous study, only the
standard residual stress pattern recommended by ECCS (1984) is followed in this present
study.
▪ Only concentrated load was applied at the top flange of the beam and the different loading
height conditions are ignored in here.
▪ Instead of the spiral pitch in a bolt, a friction coefficient of 0.3 is introduced for interaction
in all FEM.
1.5 Research Outline
Chapter 1 presented an introduction of the shear tab connections and limit state of steel beam
failure mode, particularly LTB failure. The objectives, motivation, and limitations of this research
were also addressed briefly in this chapter.
Chapter 2 presents the literature review for this study. First, the fundamental solution of lateral-
torsional buckling is described and then, the previous experimental and finite element modeling
study on the extended shear tab connection is included briefly. In addition, two steel specifications
are presented regarding both EST connection and LTB capacity.
Chapter 3 describes the development of the finite element model in ABAQUS to study LTB of W-
shape beam. This chapter also presents and discusses the validation of FEM with the experiment
conducted by Sherman and Ghorbanpoor (2002).
6
Chapter 4 presents an extensive parametric study to find out the effect of shear tab dimension on
shear capacity, shear displacement, and the out-of-plane twist of EST connection. To prevent
lateral torsional buckling in the beam, the top flange is braced along the span.
Chapter 5 presents and evaluates the LTB capacity of EST-connected W-Shape Beam with the
CSA S16-14 resistance curve. This chapter describes the effect of shear tab dimension, bolt
configuration, unbraced length, and different W-Shape beam on the LTB capacity in detail.
Chapter 5 also proposes an effective shear tab connection, where the shear tab is replaced with a
standard channel section, to increase the LTB strengths of laterally unsupported beam.
Chapter 6 concludes this research with a brief conclusion as well as recommendations for future
research.
7
Chapter 2
Literature Review
2.1 General
This chapter will describe relevant previous research on lateral torsional buckling and the behavior
of both conventional and extended shear tab connections. The whole chapter is divided into a total
of five contents. First, the introductory background analysis for elastic LTB strength has been
discussed very briefly in section 2.2 while LTB provisions for doubly symmetric I-beam in
CAN/CSA S16-14 (2014), ANSI/AISC 360 (2016) are presented in section 2.3. Second, the
influencing factors on LTB capacity of I-beam are discussed briefly in section 2.4. Third, a detailed
review of previous research on the LTB behavior of steel beam members is reviewed in section
2.5. Finally, the provision for both conventional and extended shear tab connection in different
standards and related past research are reviewed in sections 2.6 and 2.7, respectively.
2.2 Beam under Uniform Bending Moment
2.2.1 Uniform Torsion
If a beam is subjected to equal and opposite torques, the beam can experience uniform torsion
throughout its span. The beam cross-section can experience the same warping deformation in its
entire length, but there will not be any axial strain along the longitudinal direction. The uniform
torsion Tu can be expressed by the following equation [2.1].
Tu = GJdγ
dz [2.1]
Here, the term dγ
dz represents the rate of twist, G is shear modulus, and J is the torsional constant.
8
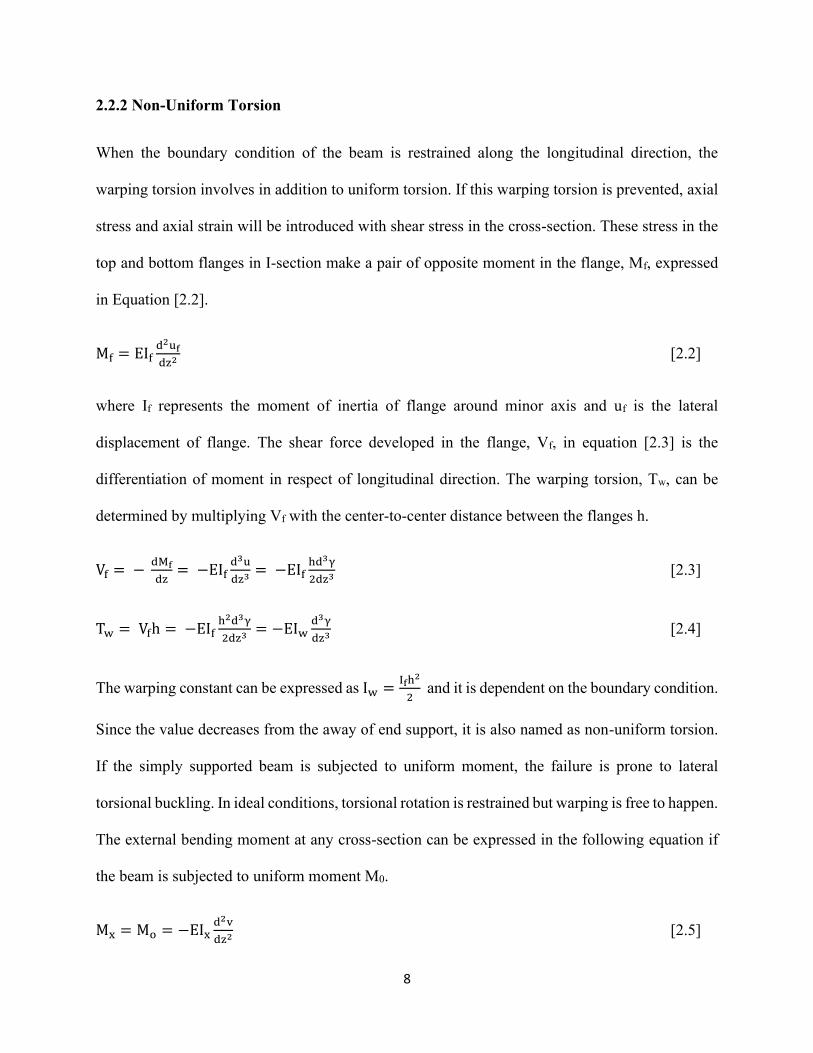
2.2.2 Non-Uniform Torsion
When the boundary condition of the beam is restrained along the longitudinal direction, the
warping torsion involves in addition to uniform torsion. If this warping torsion is prevented, axial
stress and axial strain will be introduced with shear stress in the cross-section. These stress in the
top and bottom flanges in I-section make a pair of opposite moment in the flange, Mf, expressed
in Equation [2.2].
Mf = EIfd2uf
dz2 [2.2]
where If represents the moment of inertia of flange around minor axis and uf is the lateral
displacement of flange. The shear force developed in the flange, Vf, in equation [2.3] is the
differentiation of moment in respect of longitudinal direction. The warping torsion, Tw, can be
determined by multiplying Vf with the center-to-center distance between the flanges h.
Vf = − dMf
dz= −EIf
d3u
dz3= −EIf
hd3γ
2dz3 [2.3]
Tw = Vfh = −EIfh2d3γ
2dz3 = −EIwd3γ
dz3 [2.4]
The warping constant can be expressed as Iw =Ifh2
2 and it is dependent on the boundary condition.
Since the value decreases from the away of end support, it is also named as non-uniform torsion.
If the simply supported beam is subjected to uniform moment, the failure is prone to lateral
torsional buckling. In ideal conditions, torsional rotation is restrained but warping is free to happen.
The external bending moment at any cross-section can be expressed in the following equation if
the beam is subjected to uniform moment M0.
Mx = Mo = −EIxd2v
dz2 [2.5]
9
My = γM0 = EIyd2u
dz2 [2.6]
Mz =du
dzMo = GJ
dγ
dz− EIw
d3γ
dz3 [2.7]
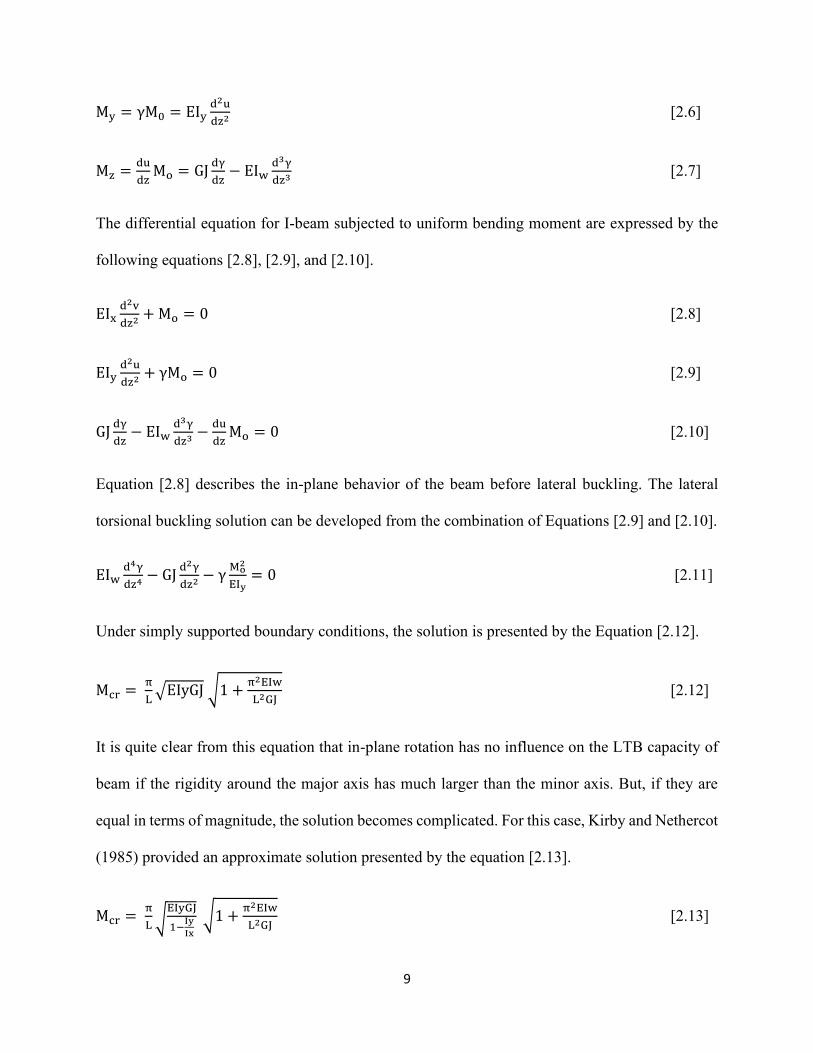
The differential equation for I-beam subjected to uniform bending moment are expressed by the
following equations [2.8], [2.9], and [2.10].
EIxd2v
dz2 + Mo = 0 [2.8]
EIyd2u
dz2 + γMo = 0 [2.9]
GJdγ
dz− EIw
d3γ
dz3 −du
dzMo = 0 [2.10]
Equation [2.8] describes the in-plane behavior of the beam before lateral buckling. The lateral
torsional buckling solution can be developed from the combination of Equations [2.9] and [2.10].
EIwd4γ
dz4 − GJd2γ
dz2 − γMo
2
EIy= 0 [2.11]
Under simply supported boundary conditions, the solution is presented by the Equation [2.12].
Mcr = π
L√EIyGJ √1 +
π2EIw
L2GJ [2.12]
It is quite clear from this equation that in-plane rotation has no influence on the LTB capacity of
beam if the rigidity around the major axis has much larger than the minor axis. But, if they are
equal in terms of magnitude, the solution becomes complicated. For this case, Kirby and Nethercot
(1985) provided an approximate solution presented by the equation [2.13].
Mcr = π
L √EIyGJ
1−Iy
Ix
√1 +π2EIw
L2GJ [2.13]
10
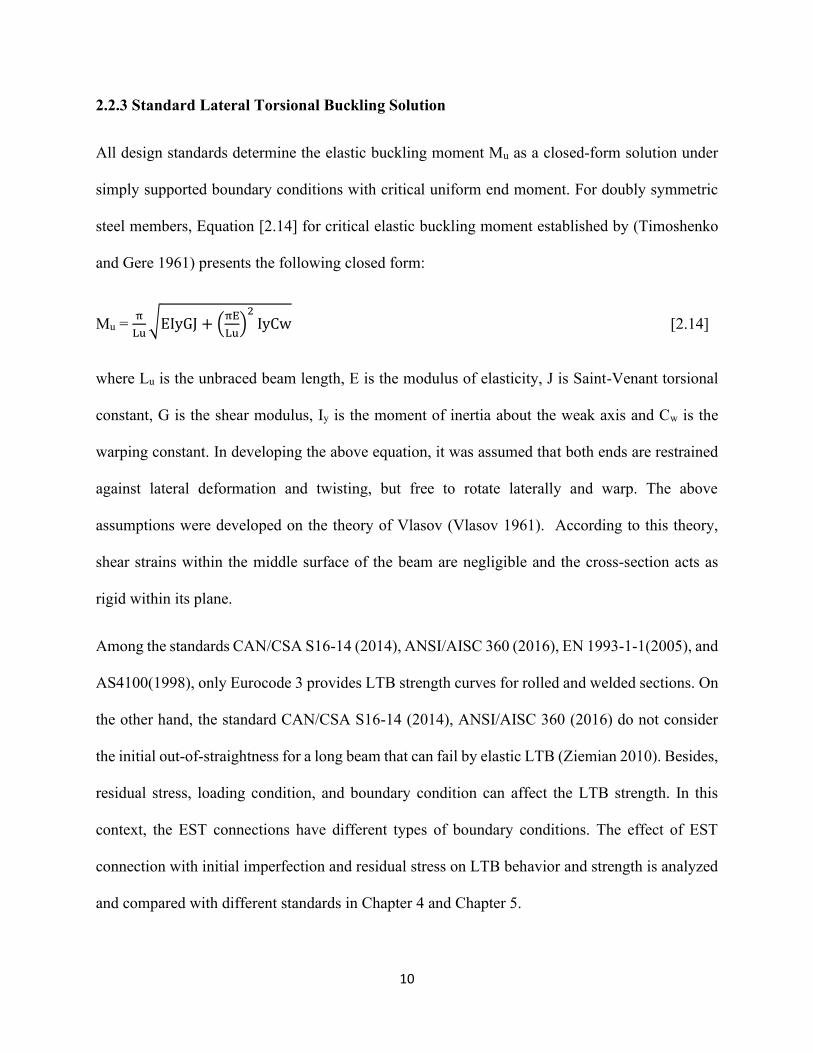
2.2.3 Standard Lateral Torsional Buckling Solution
All design standards determine the elastic buckling moment Mu as a closed-form solution under
simply supported boundary conditions with critical uniform end moment. For doubly symmetric
steel members, Equation [2.14] for critical elastic buckling moment established by (Timoshenko
and Gere 1961) presents the following closed form:
Mu = π
Lu√EIyGJ + (
πE
Lu)
2
IyCw [2.14]
where Lu is the unbraced beam length, E is the modulus of elasticity, J is Saint-Venant torsional
constant, G is the shear modulus, Iy is the moment of inertia about the weak axis and Cw is the
warping constant. In developing the above equation, it was assumed that both ends are restrained
against lateral deformation and twisting, but free to rotate laterally and warp. The above
assumptions were developed on the theory of Vlasov (Vlasov 1961). According to this theory,
shear strains within the middle surface of the beam are negligible and the cross-section acts as
rigid within its plane.
Among the standards CAN/CSA S16-14 (2014), ANSI/AISC 360 (2016), EN 1993-1-1(2005), and
AS4100(1998), only Eurocode 3 provides LTB strength curves for rolled and welded sections. On
the other hand, the standard CAN/CSA S16-14 (2014), ANSI/AISC 360 (2016) do not consider
the initial out-of-straightness for a long beam that can fail by elastic LTB (Ziemian 2010). Besides,
residual stress, loading condition, and boundary condition can affect the LTB strength. In this
context, the EST connections have different types of boundary conditions. The effect of EST
connection with initial imperfection and residual stress on LTB behavior and strength is analyzed
and compared with different standards in Chapter 4 and Chapter 5.
11
2.3 LTB Design Provision in Different Standards
2.3.1 CAN/CSA S16-14
The resistance to lateral torsional buckling of the beam depends on lateral bending as well as
twisting, whereas resistance to twisting is made up of two parts, i.e., 1) Saint Venant torsion and
2) Warping restraint. The Elastic LTB moment resistance under simply supported boundary
condition with uniform end moment is presented in Equation [2.15]
M𝑢 = π
L√EIy √GJ +
π2ECw
L2 [2.15]
Here, the terms EIy, GJ and π2ECw
L2 represent lateral bending, pure torsion, and warping torsion,
respectively.
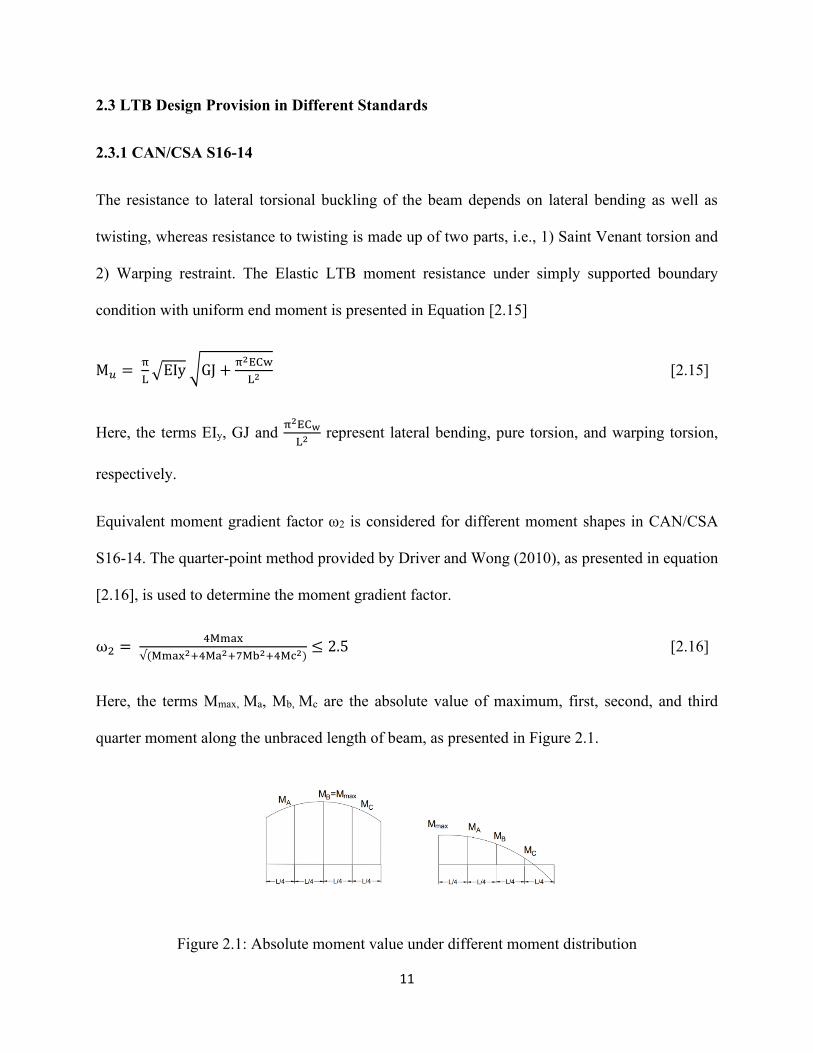
Equivalent moment gradient factor ω2 is considered for different moment shapes in CAN/CSA
S16-14. The quarter-point method provided by Driver and Wong (2010), as presented in equation
[2.16], is used to determine the moment gradient factor.
ω2 = 4Mmax
√(Mmax2+4Ma2+7Mb2+4Mc2)≤ 2.5 [2.16]
Here, the terms Mmax, Ma, Mb, Mc are the absolute value of maximum, first, second, and third
quarter moment along the unbraced length of beam, as presented in Figure 2.1.
Figure 2.1: Absolute moment value under different moment distribution
12
If the moment distribution in beam has linear variation, Equation [2.17] is suggested to use.
ω2 = 1.75 + 1.05κ + 0.3κ2 ≤ 2.5 [2.17]
where κ is the ratio of absolute end moment and the value should be less than 1. Then, the critical
elastic buckling moment Mcr for different loading and moment-curvature can be determined by
multiplying Equation [2.18] with the moment gradient factor.
Mcr = ω2Mu [2.18]
CAN/CSA S16-14 standard divides the beam cross-section into three classes i.e., Class 1, Class 2,
and Class 3. Depended on the section class, the plastic resistance and elastic resistance of any
member are calculated by Equation [2.19] and [2.20], respectively.
Mp = ZxFy [2.19]
My = SxFy [2.20]
Where the terms Zx and Sx represent plastic and elastic section modulus about the x-axis. If Mcr ≤
2
3Mp for Class 1 or 2 sections, the elastic lateral torsional buckling resistance can be determined
by the Equation [2.21].
Mr = φMcr [2.21]
In which φ is a resistance factor and the value is taken as 0.9. But, if Mcr >2
3My for Class 1 and
Class 2 sections, the lateral torsional buckling resistance can be determined by Equation [2.22].
Mr = φ1.15Mp(1 −0.28Mp
Mcr) ≤ φMp [2.22]
13
2.3.2 ANSI/AISC 360-16
ANSI/AISC 360-16 provides equation [2.23] to determine the elastic lateral torsional buckling
strength. For the moment gradient effect, the factor Cb is introduced and can be calculated by the
Equation [2.24] and it is one of the modified forms developed by Kirby and Nethercot (1979).
Mu = CbMu = Cbπ
Lu√EIyGJ + (
πE
Lu)
2
IyCw [2.23]
Cb =12.5 Mmax
2.5Mmax+3Ma+4Mb+3Mc≤ 3.0 [2.24]
AISC 360-16 divides the LTB resistance curve into three parts based on two limiting spans i.e.,
minimum unbraced length Lp for full yielding in cross-section and maximum unbraced length Lr
for elastic buckling failure. The following Equations [2.25] and [2.26] are presented for the two
limiting lengths, respectively.
Lp = 1.76ry√E
Fy [2.25]
Lr = 1.95rtsE
0.7Fy√
J
Sxho+ √(
J
Sxho)
2
+ 6.76 (0.7Fy
E)
2
[2.26]
where ry is the radius of gyration about the y-axis while rts is the effective radius of gyration. The
term h0 is the center-to-center distance between flanges.
If the unbraced length Lu is greater than Lr, the nominal strength for LTB will be followed the
Equation [2.27], and if Lp < Lu < Lr, equation [2.28] is the provision for the LTB capacity.
Mn = CbMu < Mp [2.27]
Mn = Cb[Mp − (Mp − 0.7FySx)(Lu−Lp
Lr−Lp)] ≤ Mp [2.28]
14
When Lu<Lp, the failure will be initiated by fully yielding and the capacity can be determined by
Equations [2.29] and [2.30] for compact and noncompact section, respectively.
Mn = ZxFy [2.29]
Mn = SxFy [2.30]
2.4 Factors Influencing on Lateral Torsional Buckling
Some inherent factors have a significant influence on the resistance of lateral torsional buckling.
They are initial imperfection, residual stress, boundary conditions, loading height, and moment
gradient. A significant amount of research has been carried out to address effects of these
parameters on the LTB capacities of beam are they are briefly discussed in this section.
2.4.1 Initial Imperfection
Geometric imperfection in a beam during the manufacturing process and can decrease the LTB
capacity of the beam significantly (Cook et. al. 2002). Especially, the initial imperfection in thin-
walled members can cause significant lateral distortion. Since an imperfect beam has initial
displacement from its original position, the loading will commence lateral deflection and twist
around its longitudinal axis with vertical displacement. Once the beam reaches a critical buckling
moment, lateral distortion and torsion decrease in a significant amount due to stiffness reduction.
According to Kirby et. al. (1979), this additional displacement can cause additional stresses and
the stability is affected by reduced load-carrying capacity.
2.4.2 Residual Stress
Residual stress develops practically in any cross-section due to thermal expansion and contraction
during the manufacturing process. Since the cooling is not uniform based on the shape of cross-
15
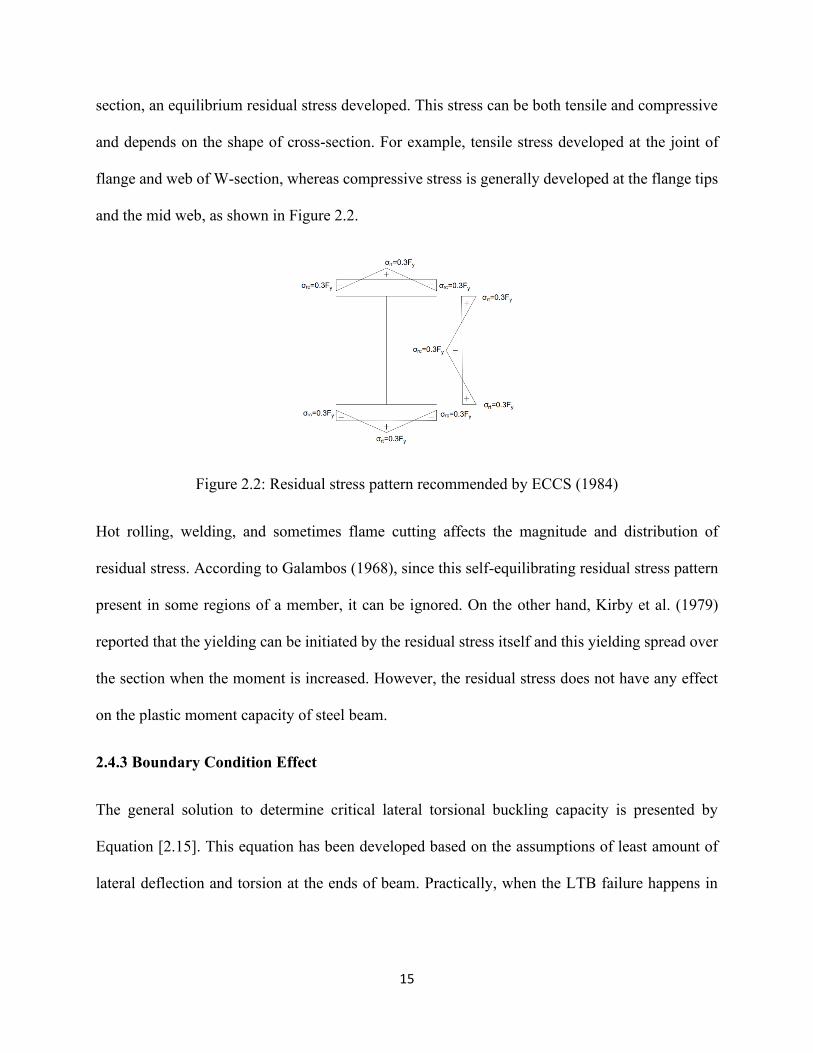
section, an equilibrium residual stress developed. This stress can be both tensile and compressive
and depends on the shape of cross-section. For example, tensile stress developed at the joint of
flange and web of W-section, whereas compressive stress is generally developed at the flange tips
and the mid web, as shown in Figure 2.2.
Figure 2.2: Residual stress pattern recommended by ECCS (1984)
Hot rolling, welding, and sometimes flame cutting affects the magnitude and distribution of
residual stress. According to Galambos (1968), since this self-equilibrating residual stress pattern
present in some regions of a member, it can be ignored. On the other hand, Kirby et al. (1979)
reported that the yielding can be initiated by the residual stress itself and this yielding spread over
the section when the moment is increased. However, the residual stress does not have any effect
on the plastic moment capacity of steel beam.
2.4.3 Boundary Condition Effect
The general solution to determine critical lateral torsional buckling capacity is presented by
Equation [2.15]. This equation has been developed based on the assumptions of least amount of
lateral deflection and torsion at the ends of beam. Practically, when the LTB failure happens in
16
any beam, three other types of phenomena can occur, and they are lateral bending, twisting, and
warping.
Timoshenko et al. (1961) presented that if both supports were fixed completely in all directions,
two inflection points would develop at the quarter points. In that boundary condition, the length of
beam was recommended to use as a half. After that, Nethercot et al. (1971) did extensive research
to find out the effect of boundary conditions on the LTB capacity of the beam and concluded a
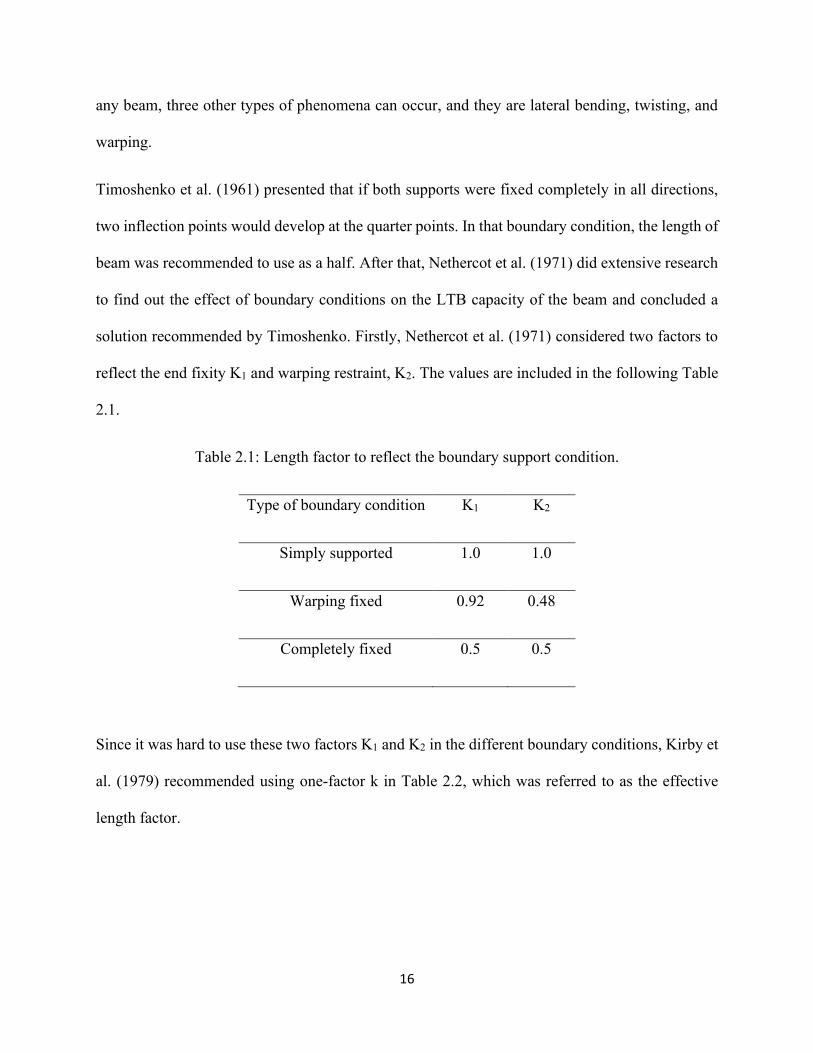
solution recommended by Timoshenko. Firstly, Nethercot et al. (1971) considered two factors to
reflect the end fixity K1 and warping restraint, K2. The values are included in the following Table
2.1.
Table 2.1: Length factor to reflect the boundary support condition.
Type of boundary condition K1 K2
Simply supported 1.0 1.0
Warping fixed 0.92 0.48
Completely fixed 0.5 0.5
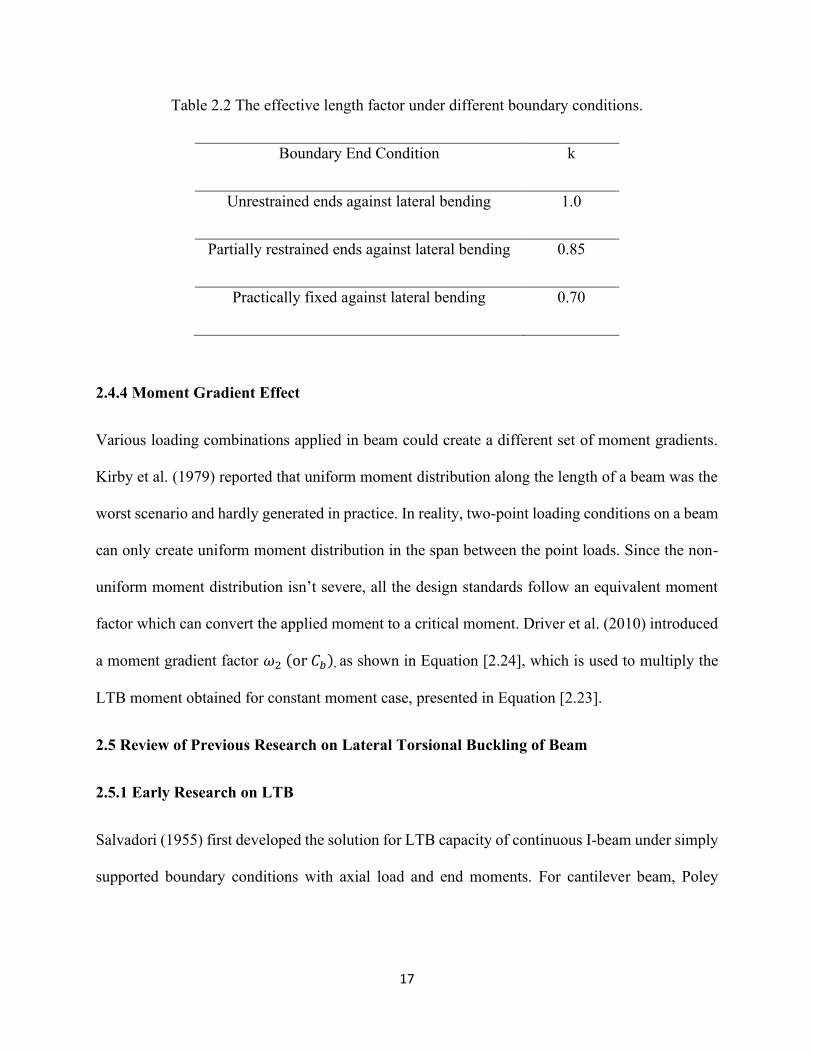
Since it was hard to use these two factors K1 and K2 in the different boundary conditions, Kirby et
al. (1979) recommended using one-factor k in Table 2.2, which was referred to as the effective
length factor.
17
Table 2.2 The effective length factor under different boundary conditions.
Boundary End Condition k
Unrestrained ends against lateral bending 1.0
Partially restrained ends against lateral bending 0.85
Practically fixed against lateral bending 0.70
2.4.4 Moment Gradient Effect
Various loading combinations applied in beam could create a different set of moment gradients.
Kirby et al. (1979) reported that uniform moment distribution along the length of a beam was the
worst scenario and hardly generated in practice. In reality, two-point loading conditions on a beam
can only create uniform moment distribution in the span between the point loads. Since the non-
uniform moment distribution isn’t severe, all the design standards follow an equivalent moment
factor which can convert the applied moment to a critical moment. Driver et al. (2010) introduced
a moment gradient factor 𝜔2 (or 𝐶𝑏), as shown in Equation [2.24], which is used to multiply the
LTB moment obtained for constant moment case, presented in Equation [2.23].
2.5 Review of Previous Research on Lateral Torsional Buckling of Beam
2.5.1 Early Research on LTB
Salvadori (1955) first developed the solution for LTB capacity of continuous I-beam under simply
supported boundary conditions with axial load and end moments. For cantilever beam, Poley
18
(1956) created a buckling differential equation using the finite difference technique under
uniformly distributed load.
2.5.2 Dibley (1969)
Dibley (1969) carried out several tests on I-beam under four-point loading conditions. Two
concentrated loads were applied vertically at a specified distance so that a uniform bending
moment exists within the unbraced segment. The load cell 50 ton and 5 ton were attached to record
the loading data. To consider and measure residual stress, tensile coupon tests were also performed.
To investigate effective length factors, a method was proposed to use for various loading and
boundary conditions. Moreover, the maximum moment was calculated and compared with
different standards. It was concluded that the effect of residual stress was small in high strength
steels.
2.5.3 Fukumoto et al. (1980)
Fukumoto et al. (1980) investigated a broad range of laterally unsupported beam to understand the
effect of imperfection and residual stress on lateral resistance of beam. In their research, total
twenty-five I-beam with 7m length were prepared. The cross-sectional dimension was similar i.e.
I-200mmx100mmx5.5mmx8mm. Three types of length 2.6m, 2.0m, and 1.5m were cut from the
7m span length of the beam. The concentrated load was applied at the mid-span of the beam and
the end restraints were fixed against torsion rather than warping.
To measure the residual stress effect, tensile coupon was cut from the web, top, and bottom flanges
from all of the twenty-five beams. Then, the sectioning method was used to measure the residual
stress. The geometric and material imperfections were reported. In addition to draw horizontal as
well as vertical deflection curves, ultimate strength was reported in this investigation. To address
19
the effect of imperfections on LTB capacity, the ratio of Mmax
MP was plotted against the slenderness
ratio λ = √Mp
Mu, where the terms Mmax, Mp, and Mu represented maximum moment from
experiments, plastic, and elastic lateral torsional buckling moment, respectively. This research
concluded that the effect of compressive residual stress was noticeable in ultimate strength.
However, the effect of initial imperfection was not found since the imperfection was less than 1
5000
of total beam length.
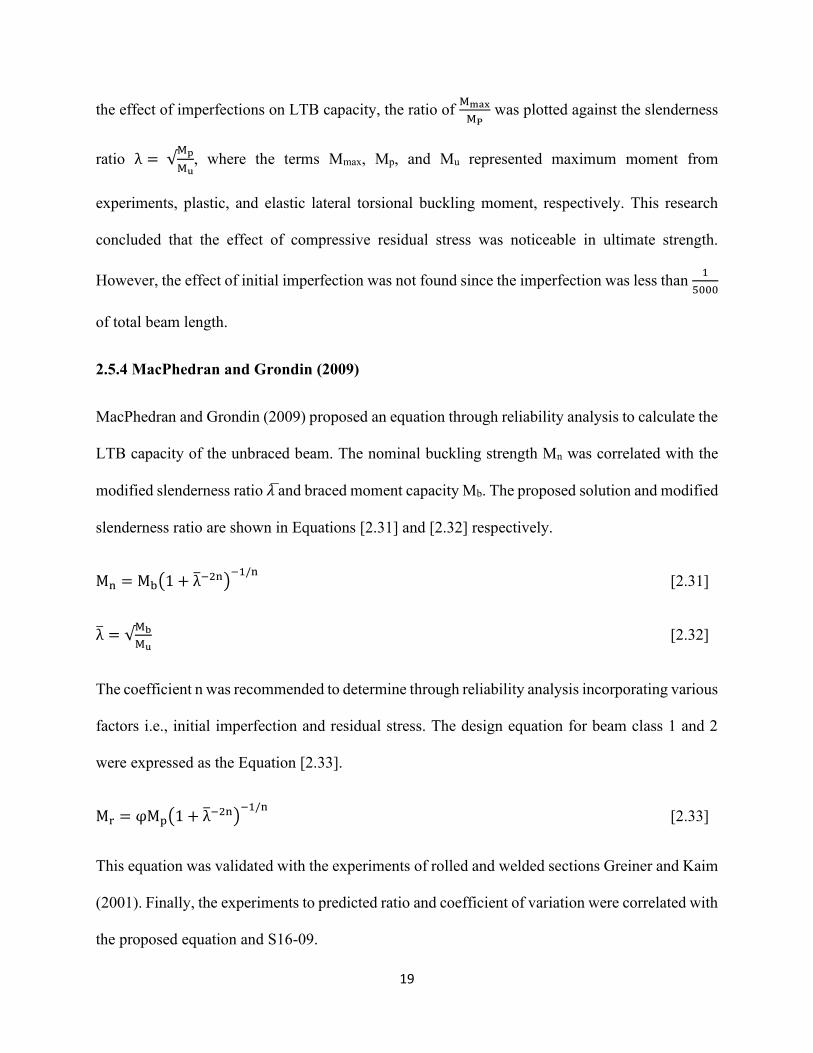
2.5.4 MacPhedran and Grondin (2009)
MacPhedran and Grondin (2009) proposed an equation through reliability analysis to calculate the
LTB capacity of the unbraced beam. The nominal buckling strength Mn was correlated with the
modified slenderness ratio 𝜆 ̅ and braced moment capacity Mb. The proposed solution and modified
slenderness ratio are shown in Equations [2.31] and [2.32] respectively.
Mn = Mb(1 + λ̅−2n)−1/n
[2.31]
λ̅ = √Mb
Mu [2.32]
The coefficient n was recommended to determine through reliability analysis incorporating various
factors i.e., initial imperfection and residual stress. The design equation for beam class 1 and 2
were expressed as the Equation [2.33].
Mr = φMp(1 + λ̅−2n)−1/n
[2.33]
This equation was validated with the experiments of rolled and welded sections Greiner and Kaim
(2001). Finally, the experiments to predicted ratio and coefficient of variation were correlated with
the proposed equation and S16-09.
20
2.5.5 Subramanian and White (2015)
Subramanian and White (2015) simulated finite element tests and compared the performance of
LTB capacity with AISC. Since FEA simulations consider idealized boundary conditions, initial
imperfection, and residual stress, sometimes the results can be conservative. For this reason, an
extensive sensitivity analysis with numerous imperfections and residual stress was conducted for
different loading and boundary conditions.
In this research, all FEM developed with the combination of various parameters i.e., different
initial imperfection, residual stress pattern, simply supported boundary condition, element size,
etc. The sensitivity analysis showed the overprediction of AISC LTB strength except for the
imperfection of L
2000 with Lehigh residual stress pattern. Moreover, the proposed model by Kim
(2010) was investigated against welded plate girders in this research. In conclusion, future
investigations were recommended for non-uniform bending.
2.5.6 Kabir and Bhowmick (2018)
Kabir and Bhowmick (2018) evaluated the performance of the current design equations for LTB
capacities of welded I-shape beam. Nonlinear Finite Element (FE) analyses were performed for
simply supported WWF beam subjected to constant moment, linear and nonlinear moment
gradients. Two different transverse loadings, a concentrated load at mid-span and uniformly
distributed load along the length, were considered. In addition, effect of loading height was
investigated. It was observed that for constant moment loading both CSA and AISC overestimated
the LTB capacity of welded I-shape beam by as much as 37%. It was also observed that for
transverse loading, current CSA strength curve overestimated the capacity significantly for top
21
flange loading and underestimated for bottom flange loading. Also, Eurocode was found to be
conservative for all cases.
2.6 Design Approaches of Shear Tab in North America
2.6.1 CISC Handbook 2016
The standard shear tab design procedure in the CISC Handbook (2016) is based on the research
carried out by Astaneh et al. (1989). In the Handbook, the factored resistance of the standard shear
tab is included with a single vertical row of bolts from number 2 to 7. Both rigid and flexible
support conditions are considered with the 20 mm, 22 mm A325 bolt, and E49 fillet welding. The
main limitation of the current code is that multiple vertical rows of bolts even the number of bolts
more than 7 in a single row aren’t included yet. Values in CISC Handbook are based on the
following assumptions.
▪ Weld line to bolt line distance 75mm.
▪ Spacing between two bolt 80mm.
▪ Edge distance 35mm.
▪ The material in shear tab plate is Grade 350W Steel.
▪ The material in bolt is Grade A325 and A325M.
▪ Punching is considered in bolt holes (db+4mm).
▪ Threads in bolt are assumed in shear plane.
The strength of bolt group can be determined with the value of bolt group coefficient. First, the
eccentricity is calculated from the bolt line. Then, the coefficient of the bolt group can be found in
Table 3-14: Eccentric Loads on Bolt Groups (CISC 2016).
In Bolt: Vr Bolt = 0.6φbnmAb[x0.7 if the threads intercepted] [2.34]
22
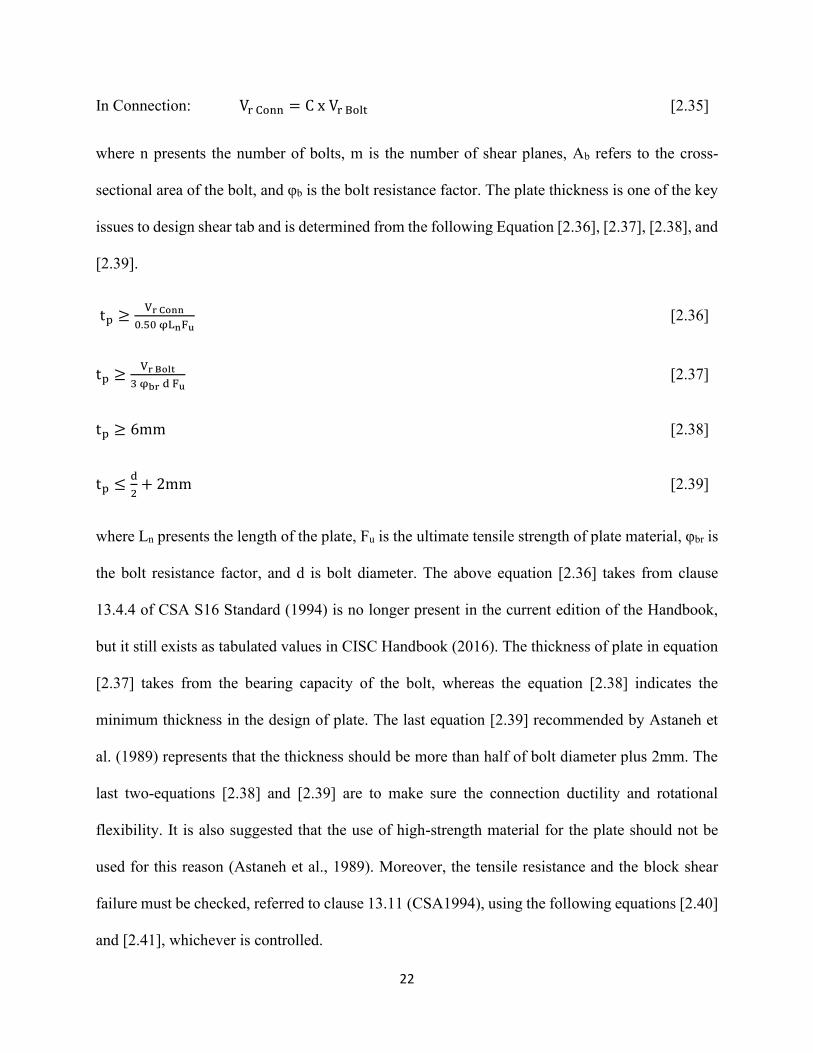
In Connection: Vr Conn = C x Vr Bolt [2.35]
where n presents the number of bolts, m is the number of shear planes, Ab refers to the cross-
sectional area of the bolt, and φb is the bolt resistance factor. The plate thickness is one of the key
issues to design shear tab and is determined from the following Equation [2.36], [2.37], [2.38], and
[2.39].
tp ≥Vr Conn
0.50 φLnFu [2.36]
tp ≥Vr Bolt
3 φbr d Fu [2.37]
tp ≥ 6mm [2.38]
tp ≤d
2+ 2mm [2.39]
where Ln presents the length of the plate, Fu is the ultimate tensile strength of plate material, φbr is
the bolt resistance factor, and d is bolt diameter. The above equation [2.36] takes from clause
13.4.4 of CSA S16 Standard (1994) is no longer present in the current edition of the Handbook,
but it still exists as tabulated values in CISC Handbook (2016). The thickness of plate in equation
[2.37] takes from the bearing capacity of the bolt, whereas the equation [2.38] indicates the
minimum thickness in the design of plate. The last equation [2.39] recommended by Astaneh et
al. (1989) represents that the thickness should be more than half of bolt diameter plus 2mm. The
last two-equations [2.38] and [2.39] are to make sure the connection ductility and rotational
flexibility. It is also suggested that the use of high-strength material for the plate should not be
used for this reason (Astaneh et al., 1989). Moreover, the tensile resistance and the block shear
failure must be checked, referred to clause 13.11 (CSA1994), using the following equations [2.40]
and [2.41], whichever is controlled.
23
Tr + Vr = φAntFu + 0.6φAgvFy [2.40]
Tr + Vr = φAntFu + 0.6φAnvFu [2.41]
where Ant and Anv refer to the net cross-sectional tensile and shear area of the shear tab,
respectively, and Agv is the gross area in shear. Clause 13.11 to calculate block shear failure has
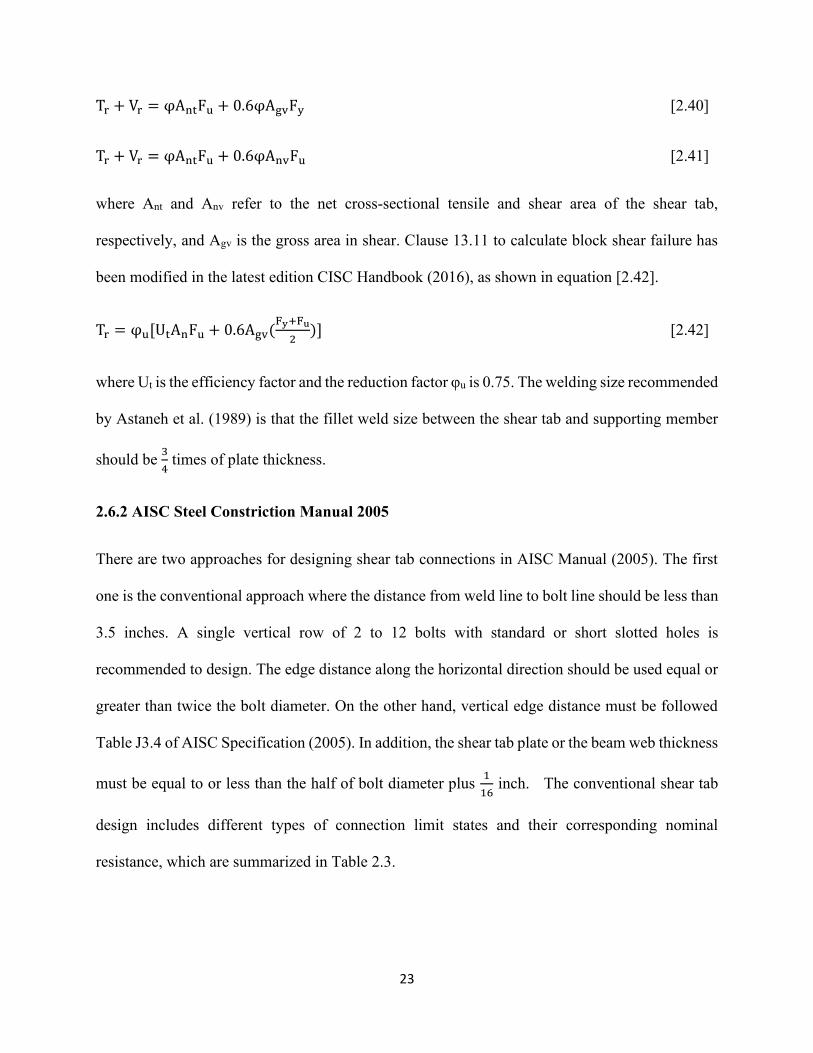
been modified in the latest edition CISC Handbook (2016), as shown in equation [2.42].
Tr = φu[UtAnFu + 0.6Agv(Fy+Fu
2)] [2.42]
where Ut is the efficiency factor and the reduction factor φu is 0.75. The welding size recommended
by Astaneh et al. (1989) is that the fillet weld size between the shear tab and supporting member
should be 3
4 times of plate thickness.
2.6.2 AISC Steel Constriction Manual 2005
There are two approaches for designing shear tab connections in AISC Manual (2005). The first
one is the conventional approach where the distance from weld line to bolt line should be less than
3.5 inches. A single vertical row of 2 to 12 bolts with standard or short slotted holes is
recommended to design. The edge distance along the horizontal direction should be used equal or
greater than twice the bolt diameter. On the other hand, vertical edge distance must be followed
Table J3.4 of AISC Specification (2005). In addition, the shear tab plate or the beam web thickness
must be equal to or less than the half of bolt diameter plus 1
16 inch. The conventional shear tab
design includes different types of connection limit states and their corresponding nominal
resistance, which are summarized in Table 2.3.
24
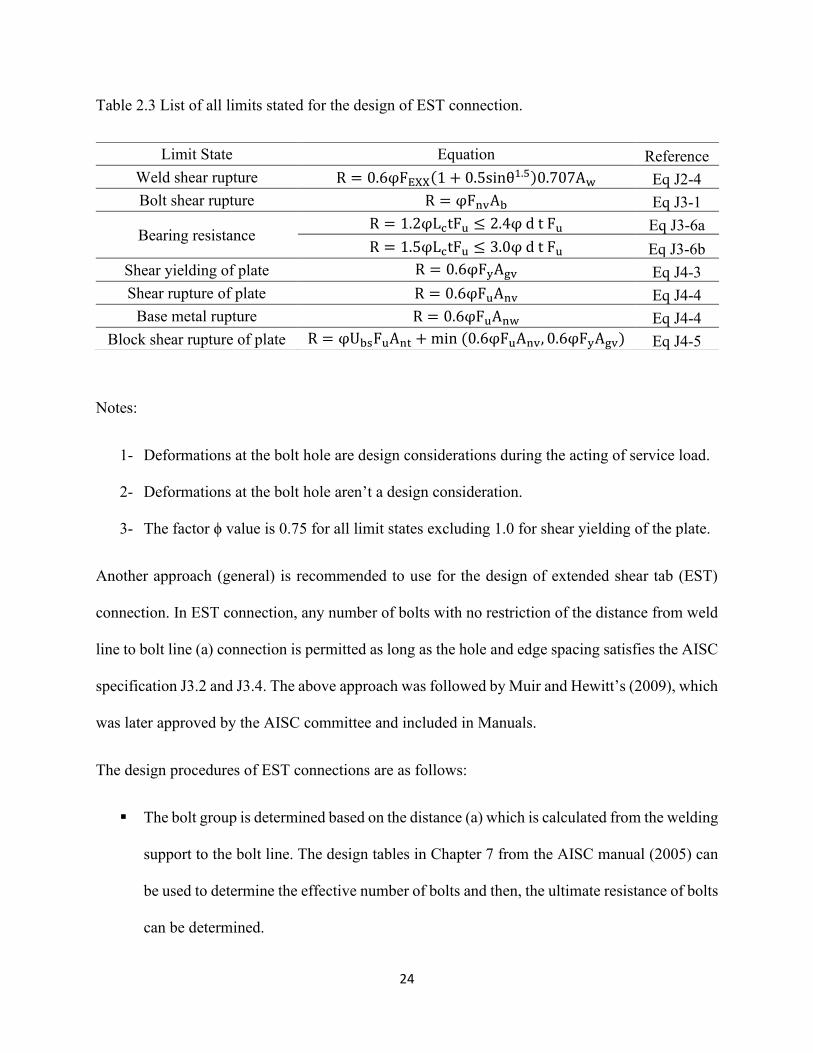
Table 2.3 List of all limits stated for the design of EST connection.
Notes:
1- Deformations at the bolt hole are design considerations during the acting of service load.
2- Deformations at the bolt hole aren’t a design consideration.
3- The factor ϕ value is 0.75 for all limit states excluding 1.0 for shear yielding of the plate.
Another approach (general) is recommended to use for the design of extended shear tab (EST)
connection. In EST connection, any number of bolts with no restriction of the distance from weld
line to bolt line (a) connection is permitted as long as the hole and edge spacing satisfies the AISC
specification J3.2 and J3.4. The above approach was followed by Muir and Hewitt’s (2009), which
was later approved by the AISC committee and included in Manuals.
The design procedures of EST connections are as follows:
▪ The bolt group is determined based on the distance (a) which is calculated from the welding
support to the bolt line. The design tables in Chapter 7 from the AISC manual (2005) can
be used to determine the effective number of bolts and then, the ultimate resistance of bolts
can be determined.
Limit State Equation Reference
Weld shear rupture R = 0.6φFEXX(1 + 0.5sinθ1.5)0.707Aw Eq J2-4
Bolt shear rupture R = φFnvAb Eq J3-1
Bearing resistance R = 1.2φLctFu ≤ 2.4φ d t Fu Eq J3-6a
R = 1.5φLctFu ≤ 3.0φ d t Fu Eq J3-6b
Shear yielding of plate R = 0.6φFyAgv Eq J4-3
Shear rupture of plate R = 0.6φFuAnv Eq J4-4
Base metal rupture R = 0.6φFuAnw Eq J4-4
Block shear rupture of plate R = φUbsFuAnt + min (0.6φFuAnv, 0.6φFyAgv) Eq J4-5
25
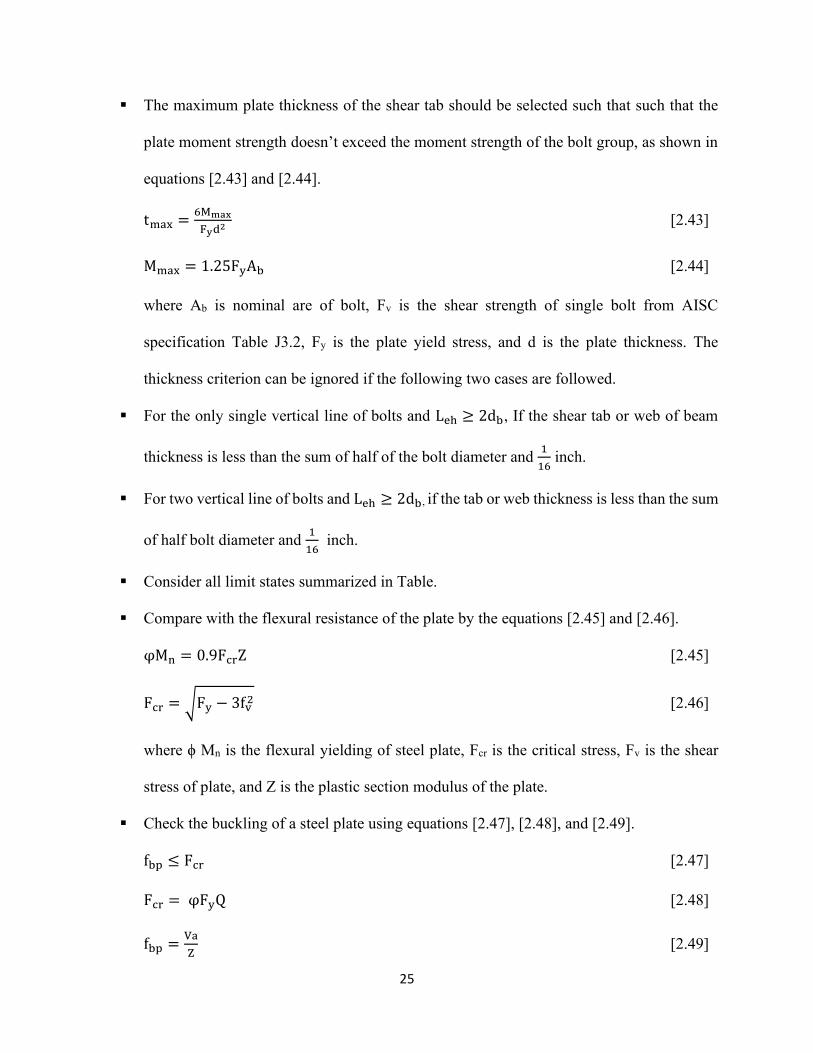
▪ The maximum plate thickness of the shear tab should be selected such that such that the
plate moment strength doesn’t exceed the moment strength of the bolt group, as shown in
equations [2.43] and [2.44].
tmax =6Mmax
Fyd2 [2.43]
Mmax = 1.25FyAb [2.44]
where Ab is nominal are of bolt, Fv is the shear strength of single bolt from AISC
specification Table J3.2, Fy is the plate yield stress, and d is the plate thickness. The
thickness criterion can be ignored if the following two cases are followed.
▪ For the only single vertical line of bolts and Leh ≥ 2db, If the shear tab or web of beam
thickness is less than the sum of half of the bolt diameter and 1
16 inch.
▪ For two vertical line of bolts and Leh ≥ 2db, if the tab or web thickness is less than the sum
of half bolt diameter and 1
16 inch.
▪ Consider all limit states summarized in Table.
▪ Compare with the flexural resistance of the plate by the equations [2.45] and [2.46].
φMn = 0.9FcrZ [2.45]
Fcr = √Fy − 3fv2 [2.46]
where ϕ Mn is the flexural yielding of steel plate, Fcr is the critical stress, Fv is the shear
stress of plate, and Z is the plastic section modulus of the plate.
▪ Check the buckling of a steel plate using equations [2.47], [2.48], and [2.49].
fbp ≤ Fcr [2.47]
Fcr = φFyQ [2.48]
fbp =Va
Z [2.49]
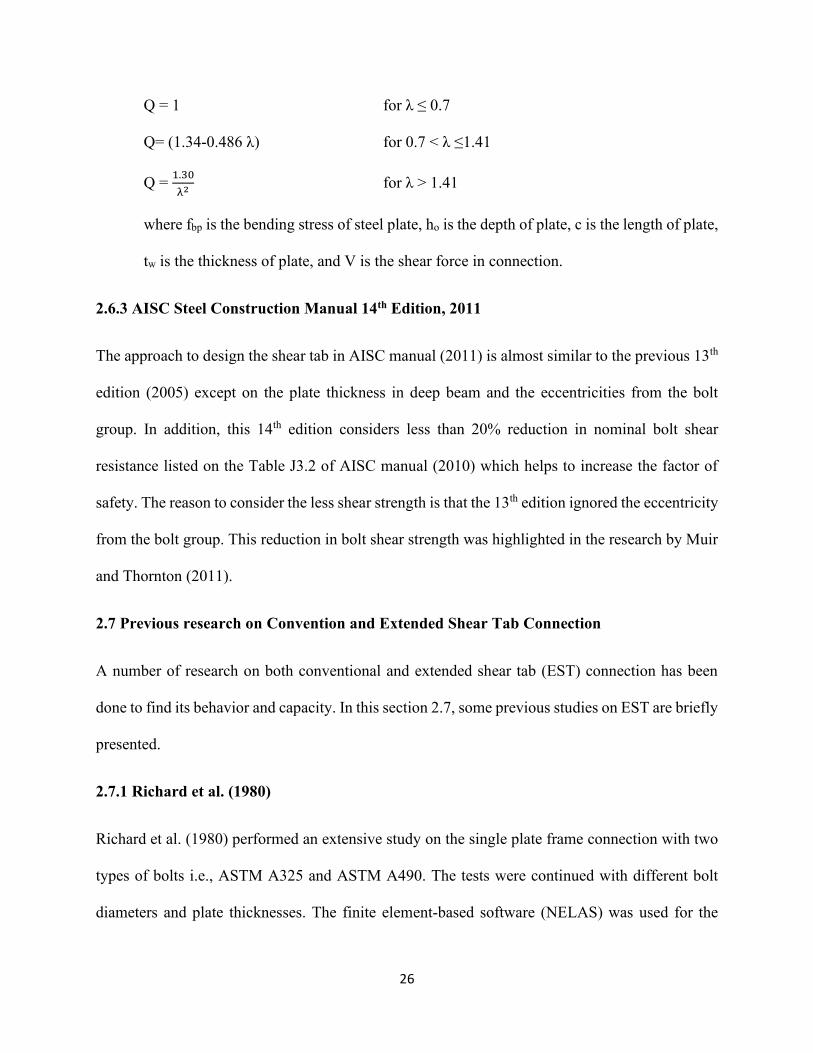
26
Q = 1 for λ ≤ 0.7
Q= (1.34-0.486 λ) for 0.7 < λ ≤1.41
Q = 1.30
λ2 for λ > 1.41
where fbp is the bending stress of steel plate, ho is the depth of plate, c is the length of plate,
tw is the thickness of plate, and V is the shear force in connection.
2.6.3 AISC Steel Construction Manual 14th Edition, 2011
The approach to design the shear tab in AISC manual (2011) is almost similar to the previous 13th
edition (2005) except on the plate thickness in deep beam and the eccentricities from the bolt
group. In addition, this 14th edition considers less than 20% reduction in nominal bolt shear
resistance listed on the Table J3.2 of AISC manual (2010) which helps to increase the factor of
safety. The reason to consider the less shear strength is that the 13th edition ignored the eccentricity
from the bolt group. This reduction in bolt shear strength was highlighted in the research by Muir
and Thornton (2011).
2.7 Previous research on Convention and Extended Shear Tab Connection
A number of research on both conventional and extended shear tab (EST) connection has been
done to find its behavior and capacity. In this section 2.7, some previous studies on EST are briefly
presented.
2.7.1 Richard et al. (1980)
Richard et al. (1980) performed an extensive study on the single plate frame connection with two
types of bolts i.e., ASTM A325 and ASTM A490. The tests were continued with different bolt
diameters and plate thicknesses. The finite element-based software (NELAS) was used for the
27
development of a single plate frame connection. The purpose of FEM in this research was to
determine the moment-rotation curve of a single plate connection. The validation of FEM results
was done against full scale two, three, five, and seven bolted connection tests. All experimental
results were in a good relationship with FEM analysis. To provide a sufficient amount of ductility,
the single plate frame connection should consider tension tearing as well as bolt shear failure. From
the finite element analysis, they concluded that the moment-rotation relation was independent on
the shear connection if eccentricity was equal or higher than bolt pattern distance and dependent
when the eccentricity was less than that. Finally, a design procedure of a single plate shear
connection was proposed based on the numerical and experimental results.
2.7.2 Pham and Mansell (1982)
To understand the behavior of shear tab and verify the computational model by Hogan and Firkins
(1978), Pham and Mansell (1982) carried out total five tests on two, three, and five bolted
connections. In their research, they noted more desirable failures and serviceability criteria. Their
tests showed the safe margin of safety and similar strength validated against Hogan and Firkins
(1978).
2.7.3 Cheng et al. (1984)
To investigate the behavior and capacity of coped beam, Cheng et al. (1984) conducted a FE-based
parametric study in software ABAQUS and BASP. The parametric study showed that the lateral
torsional buckling of beam and local web buckling at coped region could be failure modes in the
model. It was indicated that local buckling and LTB strength were significantly affected by cope
depth, cope length. In this research, they performed total sixteen experimental tests to validate
their design recommendations. Among all tests, eight tests were done to check the local web
28
buckling capacity and six tests for LTB strength. From the experimental results, the authors
concluded that the LTB capacity was decreased by approximately ten percent due to coping of
tension flange in the beam. Finally, they also investigated the coped region with different types of
stiffeners to understand the behavior and capacity of beam.
2.7.4 Astaneh et al. (1989)
Astaneh et al. (1989) performed a total of five full-scale single plate beam-column connection tests
to investigate the rotational and flexibility of the plate. The coupons cut from the plate were tested
to get the yield stress and ultimate strength. In each test, the single plate connected the web of wide
flange beam and the column flange wide with the standard bolts i.e., A325-N, A490-N. These
parametric tests, as shown in the Figure 2.3, included different bolt types, different beam materials
(for example, A36 and Grade 50), different edge distance i.e., 1.5db or 2db. The A325 bolted
connections failed suddenly due to shear fracture whereas the single plate experienced permanent
bearing deformations. On the other hand, the fracture of weld and bolt happened simultaneously
in the A490 bolt connections. In this research, it was observed that the moment developed was
little, whereas the higher rotational ductility was found. It was concluded that the fracture in the
net section of the plate, plate yielding, bolt bearing failure were the limit states in the single plate
connections.
29
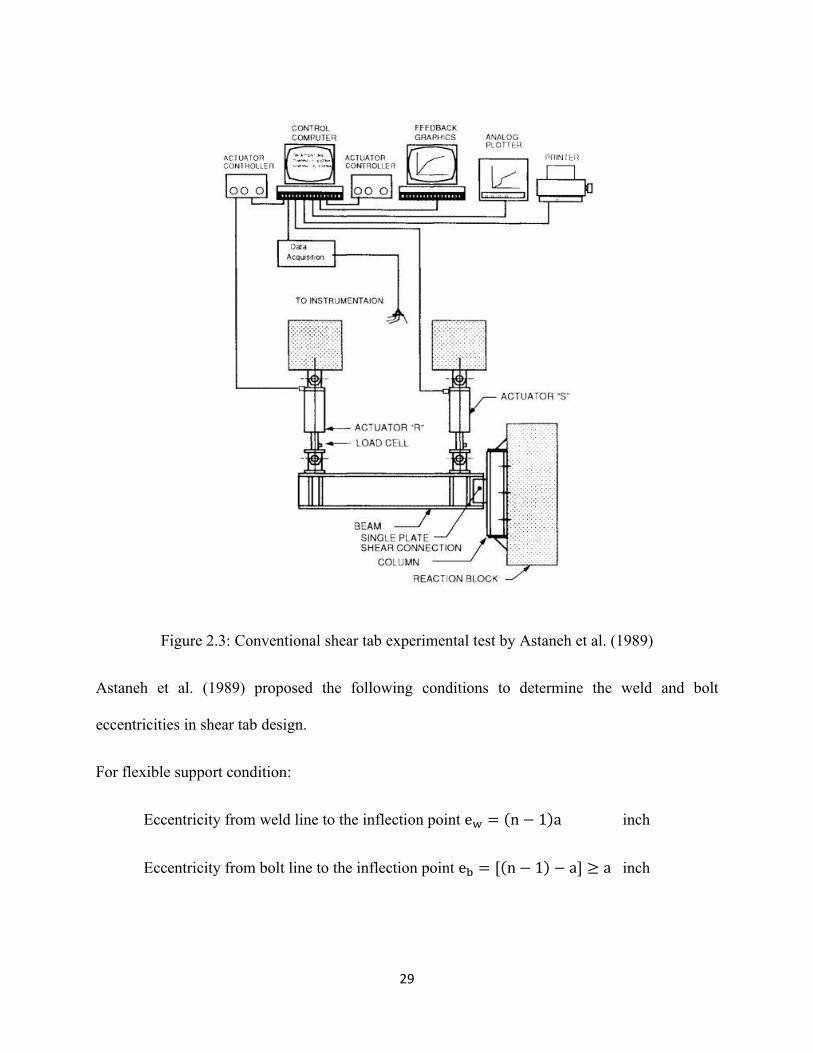
Figure 2.3: Conventional shear tab experimental test by Astaneh et al. (1989)
Astaneh et al. (1989) proposed the following conditions to determine the weld and bolt
eccentricities in shear tab design.
For flexible support condition:
Eccentricity from weld line to the inflection point ew = (n − 1)a inch
Eccentricity from bolt line to the inflection point eb = [(n − 1) − a] ≥ a inch
30
For rigid support condition:
Eccentricity from weld line to the inflection point ew = (n − 1) inch
Eccentricity from bolt line to the inflection point eb = (n − 1) − a inch
where n represents the number of bolts and a is the distance from weld line to bolt line. Since the
eccentricity was related to the number of bolts, it was found in their research that the rotational
ductility was decreased with the increasing number of bolts in the connection. Finally, the authors
proposed a design procedure for single plate shear connection based on the material properties,
bolt spacing, edge distance, plate dimension, and bolt strength from their experimental tests.
2.7.5 Astaneh et al. (1993)
Astaneh et al. (1993) investigated the single plate steel connection behavior to find out the
adequacy of shear capacity and beam-column rotational ductility for simply supported beam. First
of all, they developed finite element model of single plate shear connection frame under simply
supported boundary conditions and studied its failure behavior. From this finite element-based
research, they indicated that the shear vs rotation relation was significantly affected by the span-
depth ratio and proposed a shear-rotation curve for understanding the elastic, plastic, and inelastic
hinge formation behavior of this shear connection. After the FEM study, they conducted total six
full-scale shear connection tests to develop the design procedure. In the experimental test, normal
wide flange beam, short column, E7018 electrodes, ASTM A325, and A490 bolts were taken. The
governing failure mode was a fracture in the weld, in the bolt, in the net section of plate, yielding
in plate, bearing in the bolt hole. Since the shear connection had sufficient shear capacity and
rotational ductility, Astaneh et al. (1993) recommended a procedure for the design of shear plate
31
connection. Lastly, a shear connection design procedure was proposed to make sure that the failure
would follow ductile rather than brittle, and later, this procedure was adopted in the AISC standard.
2.7.6 Bursi and Jaspart (1998)
Bursi and Jaspart (1998) developed three-dimensional FEM of extended shear tab connection
using ABAQUS. Their study showed that the accuracy and preciseness of finite element result
were highly affected by the material properties, time step, integration points, mesh style, and
element types. In this research, the authors considered the tee stubs connections with both
preloading and non-preloading conditions. Under moment-resisting boundary conditions, they
validated their 3D non-linear FEM to understand the behavior and failure of the EST connection.
2.7.7 Sherman and Ghorbanpoor (2002)
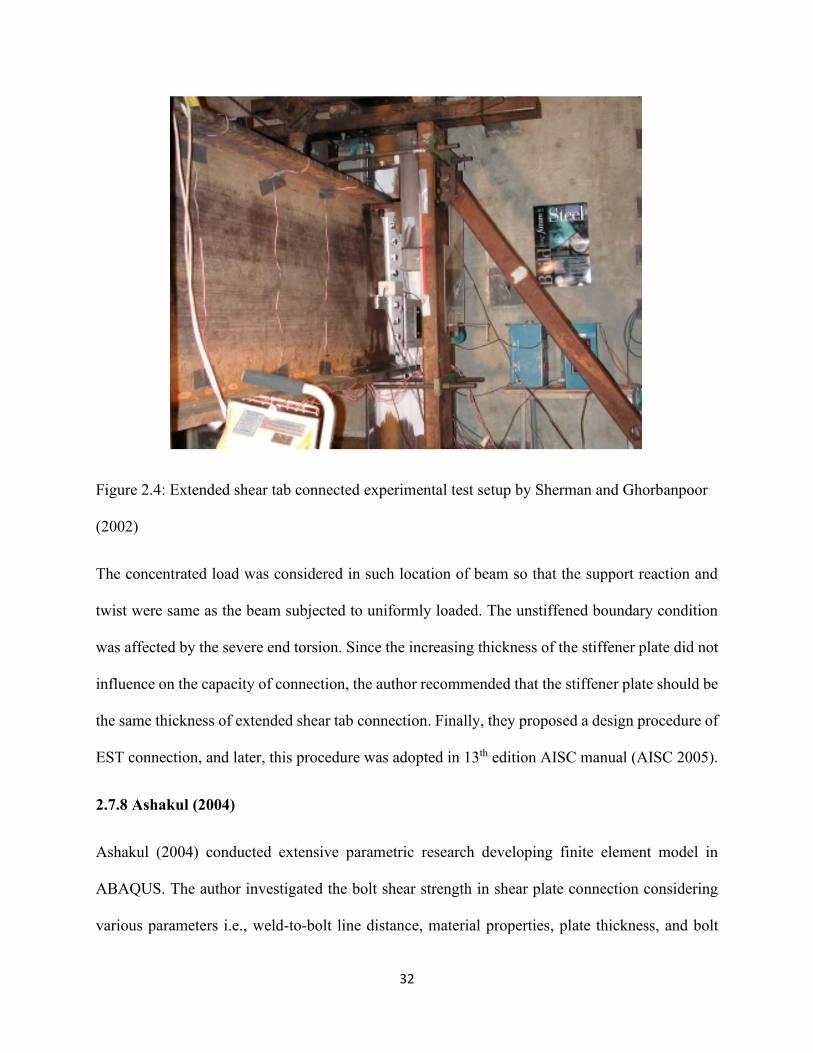
Sherman and Ghorbanpoor (2002) performed extensive experimental research, as shown in the
Figure 2.4, to find out the behavior of extended shear tab connections. They conducted total thirty-
one full-scale tests separating three phases. In the first phase, total seventeen tests were carried out
under both stiffened and unstiffened shear tab boundary conditions. The various parameters i.e.,
width-to-thickness ratio, shear tab thickness, type and number of bolts, the span-to-depth ratio of
beam, lateral bracing were considered to determine the capacity of this connection. In the second
phase, the authors investigated the capacity with stiffener plate in total four tests. In addition, the
effect of the snug tightening technique in short-slotted holes was considered in this phase. In the
final phase, the effect of deep connections was considered in the last ten tests. Two stiffener plates
were welded to the supporting column flanges on top and bottom and one stiffened plate was for
supporting girder on top.
32
Figure 2.4: Extended shear tab connected experimental test setup by Sherman and Ghorbanpoor
(2002)
The concentrated load was considered in such location of beam so that the support reaction and
twist were same as the beam subjected to uniformly loaded. The unstiffened boundary condition
was affected by the severe end torsion. Since the increasing thickness of the stiffener plate did not
influence on the capacity of connection, the author recommended that the stiffener plate should be
the same thickness of extended shear tab connection. Finally, they proposed a design procedure of
EST connection, and later, this procedure was adopted in 13th edition AISC manual (AISC 2005).
2.7.8 Ashakul (2004)
Ashakul (2004) conducted extensive parametric research developing finite element model in
ABAQUS. The author investigated the bolt shear strength in shear plate connection considering
various parameters i.e., weld-to-bolt line distance, material properties, plate thickness, and bolt
33
placement with respect to neutral axis. From the FE analysis, it was observed that the bolt shear
capacity was not affected by the weld-to-bolt distance, but the capacity would be affected
significantly if the material and thickness of the plate didn’t meet ductility. Finally, the author
made a relationship to calculate shear yielding based on shear stress distribution.
2.7.9 Creech (2005)
Creech (2005) performed total ten full-scale single plate shear connection tests considering both
the flexible and rigid configurations. The author included the effect of slab on top of the beam and
both the short-slotted, standard holes in his experiments. This study mentioned that the effect of
eccentricity should be severe for the two or three bolts connection, but the effect wasn’t significant
for four or more bolts connections. It was indicated that the snug-tight bolts could prevent slippage
better than the standards. In addition, it was concluded that the effect of hole had no significant
effect on the ultimate capacity of shear connection and slab restraints acted as fixed conditions
with the rotation of the shear plate.
2.7.10 Goodrich (2005)
Goodrich (2005) conducted total six experiments considering stiffened EST connection in beam-
to-column. The tests were classified in total three phases and all the experiments were designed
based on AISC manual. In the first phase, the EST connection had four bolts with 3
8 inch thickness
EST, 5
16 inch fillet weld and the design load was 44.7 kips. The second phase included four bolts
with 1
4 inch EST and
3
4 inch fillet weld and the designed load was 27.8 kips. In the last phase, four
bolts with 1
2 inch tab thickness and
5
16 inch fillet weld was used, and the designed load was 27.8
kips. From this research, it was indicated that the EST connections could carry around the twice
34
design load. Generally, the connection was failed due to the buckling of EST plate itself. Moreover,
the author developed the FEM using the software ANSYS to validate the tests and understand the
further behavior of this connection.
2.7.11 Metzger (2006)
Metzger (2006) carried out eight full-scale single plate shear connections. Among them, the
standard shear tab was used in the first four tests while the extended shear tab connection was
followed in the rest four. The shear plate connected the beam with the supporting column flange
in one side and the roller support was ensured on the other side. The concentrated load was applied
at three locations simultaneously until the connection was failed. In this study, the author
mentioned that the design procedure in the AISC manual was very conservative in both standard
and extended shear tab connection. A parametric study was recommended to perform so that the
maximum allowable shear plate thickness could be determined with respect to bolt diameter-to-
plate thickness ratio.
2.7.12 Rahman et al. (2007)
Rahman et al. (2007) developed a 3D finite element model of unstiffened extended shear tab in
ANSYS and validated it against the experimental results of Sherman and Ghorbanpoor (2002).
This research followed two types of configurations i.e., three bolted and five bolted unstiffened
connections in beam-to-column. In the FEM, both, elastic and plastic material properties of bolt
for ASTM A325-X, a shear tab for ASTM A36, and beam-column for ASTM A572 Grade 50 were
assigned. The contact surfaces such as beam web, shear tab, and bolts interacted properly so that
the forces transferred from the beam web to bolt and then, from bolts to the shear plate. In the
loading step, total three kinds of load were applied: 1) pretension force in bolt, 2) transformation
35
of pretension force into strain, 3) external load on beam. To simulate bolt connection, bolts were
divided into two parts, and then pretension forces were applied. To make sure proper meshing,
they considered total four types of elements, for example, eight-node brick elements for modeling
EST, supporting member, and beam: tetrahedral element for modeling the bolt. Though one of the
experiments failed due to twist, the author did not consider the shear-twist curves in finite element
analysis. The author determined the ultimate shear strength, yield points, and failure modes of the
connections using the shear-twist, shear-displacement, and shear-rotation curves. In conclusion,
they indicated that the 3D FEM is the best way to find out the failure of unstiffened extended shear
tab connection.
2.7.13 Mahmid et al. (2007)
Mahmid et al. (2007) modeled stiffened extended shear tab connection in ANSYS and validated
their FE model with the experimental research of Sherman and Ghorbanpoor (2002). They
considered their model configurations as beam-to-column and beam-to-girder connections. In
beam-to-column connection FEM, the number of bolts was two, eight, ten, and twelve, whereas in
the beam-to-girder connection, the number of bolts was three, six, ten, and twelve. The bi-linear
stress-strain material properties of ASTM A36 were assigned to shear tabs, ASTM A572 Grade
50 to beam, columns, and girders, and A325-X to bolts. The authors analyzed the behavior of
stiffened EST connections through several parameters, for example, twist of the plate, vertical
displacement along bolt line, shear load eccentricity, and failure modes. In addition, Mahmid et al.
(2007) located zero strain position and made a linear regression to correlate the finite element and
experimental results. In the study, it was revealed that the increasing number of bolts made the
connection close to rigid behavior. Moreover, the twist was detected as secondary failure mode
along with the shear tab in deep connections. The authors mentioned in the research that the non-
36
linearity had a significant effect on EST connection and in all models, non-linearity i.e., initial
geometric imperfection and material non-linearities were considered. Total five failure modes
were observed, and they were shear yielding of the plate, bolt shear, bolt bearing, shear tab twist,
and web failure of the girder. In conclusion, they claimed their model was accurate and unique to
understand the behavior of stiffened EST connections.
2.7.14 Muir and Hewitt (2009)
Muir and Hewitt (2009) investigated the behavior of unstiffened EST connection and showed that
this connection generated an extra moment in supporting members. Since AISC 2005 did not
consider this additional moment during the design, it was recommended to be considered in the
standards. The authors also discussed the general outline and development of this connection based
on AISC 13th edition (AISC 2005). According to them, the shear plate connection should be failed
before bolts or welding failure. This study mentioned that though the plate buckling was not the
first mode, the EST connection in the supporting girder tended to buckle. Lastly, they proposed a
design procedure for EST connection for both in column and girder.
2.7.15 Marosi (2011)
Marosi (2011) gave a completely new design procedure for extended shear tab connection with
single and double vertical row of bolts. Since the design provision for the shear tab connection is
limited to a single row of seven bolts, the author performed total sixteen full-scale tests with the
combination of different beam sections and three to ten bolts both in single and double rows. The
performance of retrofit in weld was also investigated in this research. From the regular and retrofit
experiments, the author concluded that the target rotation and the resistance to load for a single
row of bolt were the same as before but outperformed in double vertical row of bolts.
37
2.7.16 Thornton and Frotney (2011)
Thornton and Fortney investigated the effect of eccentricity developed due to shear transfer from
beam web to plate and lateral torsional buckling (LTB) on extended shear tab connection. Since
the AISC provision didn’t consider the eccentricity and LTB in EST design procedure, the authors
continued this research. The authors also investigated the effect of LTB on EST connected with
double coped beam and said that the LTB strength of coped beam was dependent on coped portion
but, uncoped beam could be regarded as both rigid and independent. Additionally, they
recommended their design procedure to check the need for stiffeners in EST connection but, the
assumption was to consider without coping in the beam as rigid. The effect of lap splice was the
reason to develop the torsional moment and was resisted by the torsional strength of the shear tab
and beam. In conclusion, another new theory was proposed by the authors to check the
performance of connection against the lap eccentricity.
2.7.17 Wen et al. (2014)
Wen et al (2014) studied the effect of inelastic behavior in shear tab connection using the software
ABAQUS. The FEM of shear tab was created with and without considering concrete slab. This
research optimized the solution using both the Newton method and the explicit dynamic method.
Their proposed model was claimed to be helpful to understand the behavior of shear tab
connections. It was concluded that the composite beam connected with the shear tab had opposite
behavior under positive and negative moments. On the other hand, standard shear tab connections
had the same behavior under positive and negative moments.
38
2.7.18 Abou-zidan and Liu (2015)
Abou-zidan and Liu (2015) studied the behavior of unstiffened extended shear tab connections
through finite element modeling in ANSYS. Numerous parameters such as web slenderness ratio
of supporting member, bolt number, plate thickness, and weld line to bolt line distance were
considered in this research. The whole finite element analysis was followed in two steps: 1) the
first step was for applying the pretension force, 2) the second step was for applying external
actuator load on the top flange of the beam. Three-dimensional eight-node structural solid elements
were used in shear tab, beam, column, and bolts for the meshing procedure. Finally, they concluded
that the design procedure in AISC standard was over-conservative for the number of a single
vertical row of bolts 2 to 6 but, fairly estimated the strength for more than 6 bolts.
2.8 Summary
Several experimental and numerical studies have been conducted on conventional shear tab
connections. In comparison to conventional shear tab connections, research on extended shear tab
connections is limited. This is the main reason EST connections have yet to be adopted by the
Canadian Steel design standard, CSA S16-19. Also, most of the research carried on extended shear
tabs related to a single vertical row of bolts and investigation of multiple vertical rows of bolts
were ignored.
In the previous research, only the behavior of extended shear tab connections was investigated.
The effect of EST connections on beam is still unknown to researchers. It is well known to the
researchers that beam-to-column connections can affect the lateral torsional buckling capacity of
a beam. Based on the literature review, current design standards have not addressed the effect of
EST connections on lateral torsional buckling capacity of beam.
39
Chapter 3
Finite Element Modeling of Shear Tab Connections
3.1 Introduction
In this chapter, the development of finite element model (FEM) for shear tab connections in beam-
to-column connection is presented. The finite element modeling approach adopted in this research
is validated for two experimental programs on conventional and extended shear tab connections.
The numerical simulations have been conducted through finite element software ABAQUS (2017).
ABAQUS is quite capable to simulate the nonlinear behavior of any steel member having
geometric imperfection and plastic material properties. In this research, FEM consists of a
supporting column and a beam connected with an extended shear tab connection. To describe the
whole FEM in ABAQUS, the following sections such as element selection, material properties,
step selection, loading condition, boundary conditions, mesh selection, and analysis.
3.2 Method of Finite Element Model
The effect of extended shear tab connection in a simply supported I-beam is quite complex,
especially when the whole model approaches the final stage of failure. Therefore, a three-
dimensional (3D) solid deformable element has been used in this research to simulate and capture
the real structure behavior. In this research, simply supported I-beam have been modeled with
extended shear tab connection considering both single and double vertical rows of the bolt.
The first thing to create a FEM in ABAQUS is Parts, where bolts, EST, beam, and column have
been developed and imported. After that, these parts were duplicated in Assembly through Part
Instances. Usually in Part Instance, proper material properties, sections and meshing were assigned
in each component of the model. When all elements have been assigned properly, steps,
interaction, load, boundary conditions, and meshing should be defined as in the following sections.
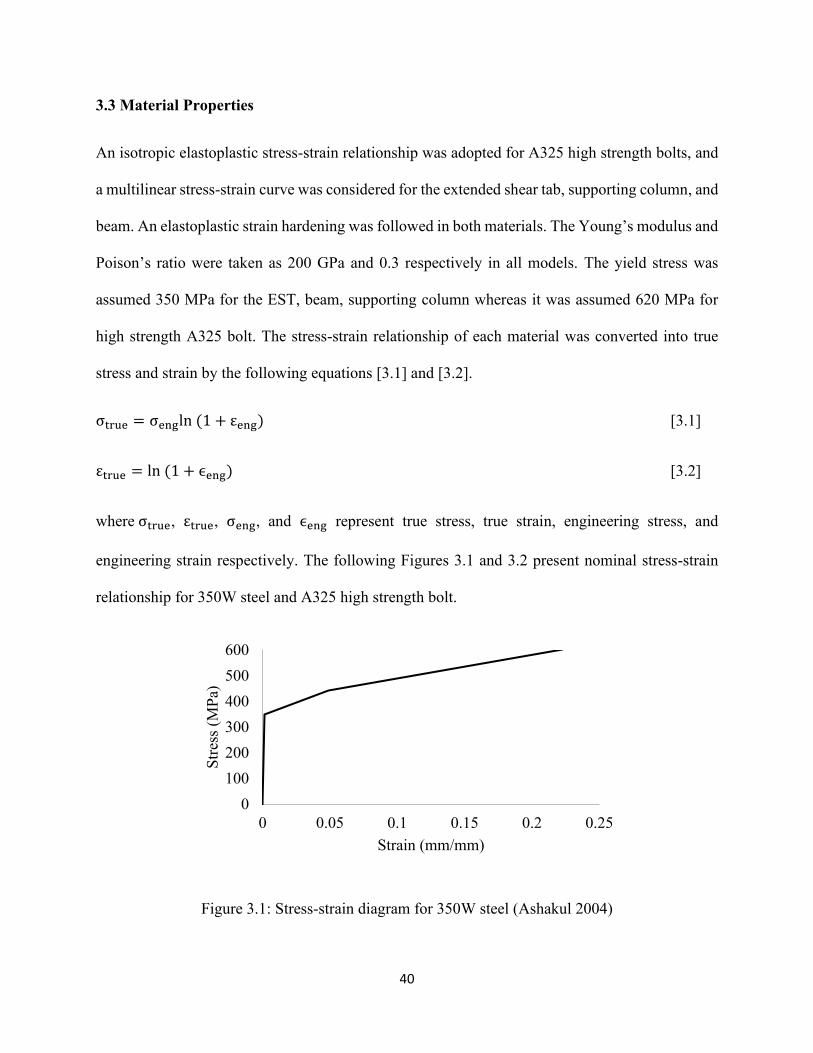
40
3.3 Material Properties
An isotropic elastoplastic stress-strain relationship was adopted for A325 high strength bolts, and
a multilinear stress-strain curve was considered for the extended shear tab, supporting column, and
beam. An elastoplastic strain hardening was followed in both materials. The Young’s modulus and
Poison’s ratio were taken as 200 GPa and 0.3 respectively in all models. The yield stress was
assumed 350 MPa for the EST, beam, supporting column whereas it was assumed 620 MPa for
high strength A325 bolt. The stress-strain relationship of each material was converted into true
stress and strain by the following equations [3.1] and [3.2].
σtrue = σengln (1 + εeng) [3.1]
εtrue = ln (1 + ϵeng) [3.2]
where σtrue, εtrue, σeng, and ϵeng represent true stress, true strain, engineering stress, and
engineering strain respectively. The following Figures 3.1 and 3.2 present nominal stress-strain
relationship for 350W steel and A325 high strength bolt.
Figure 3.1: Stress-strain diagram for 350W steel (Ashakul 2004)
0
100
200
300
400
500
600
0 0.05 0.1 0.15 0.2 0.25
Str
ess
(MP
a)
Strain (mm/mm)
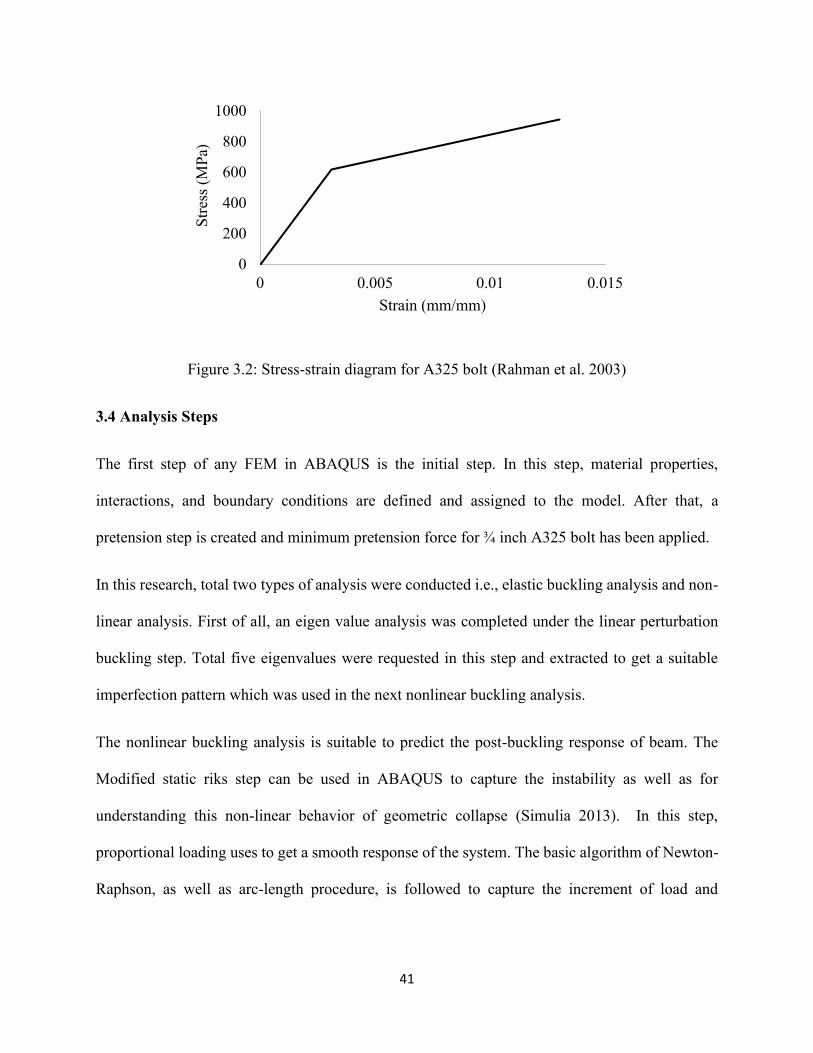
41
Figure 3.2: Stress-strain diagram for A325 bolt (Rahman et al. 2003)
3.4 Analysis Steps
The first step of any FEM in ABAQUS is the initial step. In this step, material properties,
interactions, and boundary conditions are defined and assigned to the model. After that, a
pretension step is created and minimum pretension force for ¾ inch A325 bolt has been applied.
In this research, total two types of analysis were conducted i.e., elastic buckling analysis and non-
linear analysis. First of all, an eigen value analysis was completed under the linear perturbation
buckling step. Total five eigenvalues were requested in this step and extracted to get a suitable
imperfection pattern which was used in the next nonlinear buckling analysis.
The nonlinear buckling analysis is suitable to predict the post-buckling response of beam. The
Modified static riks step can be used in ABAQUS to capture the instability as well as for
understanding this non-linear behavior of geometric collapse (Simulia 2013). In this step,
proportional loading uses to get a smooth response of the system. The basic algorithm of Newton-
Raphson, as well as arc-length procedure, is followed to capture the increment of load and
0
200
400
600
800
1000
0 0.005 0.01 0.015
Str
ess
(MP
a)
Strain (mm/mm)
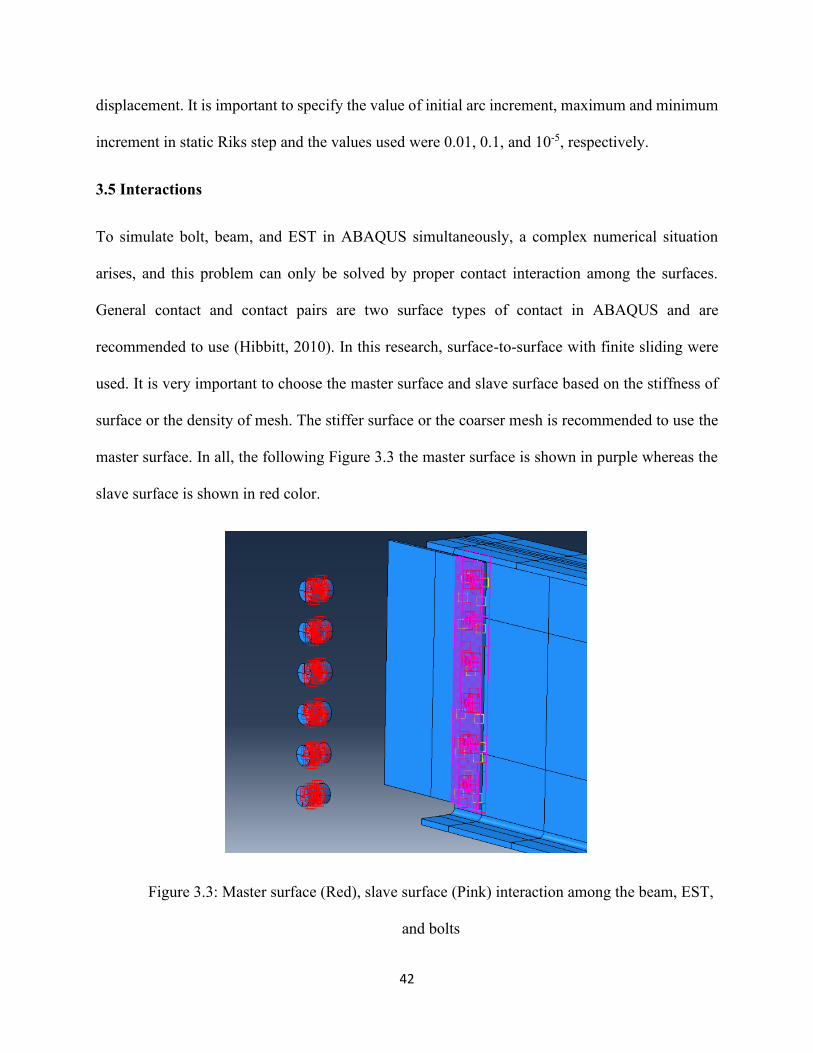
42
displacement. It is important to specify the value of initial arc increment, maximum and minimum
increment in static Riks step and the values used were 0.01, 0.1, and 10-5, respectively.
3.5 Interactions
To simulate bolt, beam, and EST in ABAQUS simultaneously, a complex numerical situation
arises, and this problem can only be solved by proper contact interaction among the surfaces.
General contact and contact pairs are two surface types of contact in ABAQUS and are
recommended to use (Hibbitt, 2010). In this research, surface-to-surface with finite sliding were
used. It is very important to choose the master surface and slave surface based on the stiffness of
surface or the density of mesh. The stiffer surface or the coarser mesh is recommended to use the
master surface. In all, the following Figure 3.3 the master surface is shown in purple whereas the
slave surface is shown in red color.
Figure 3.3: Master surface (Red), slave surface (Pink) interaction among the beam, EST,
and bolts
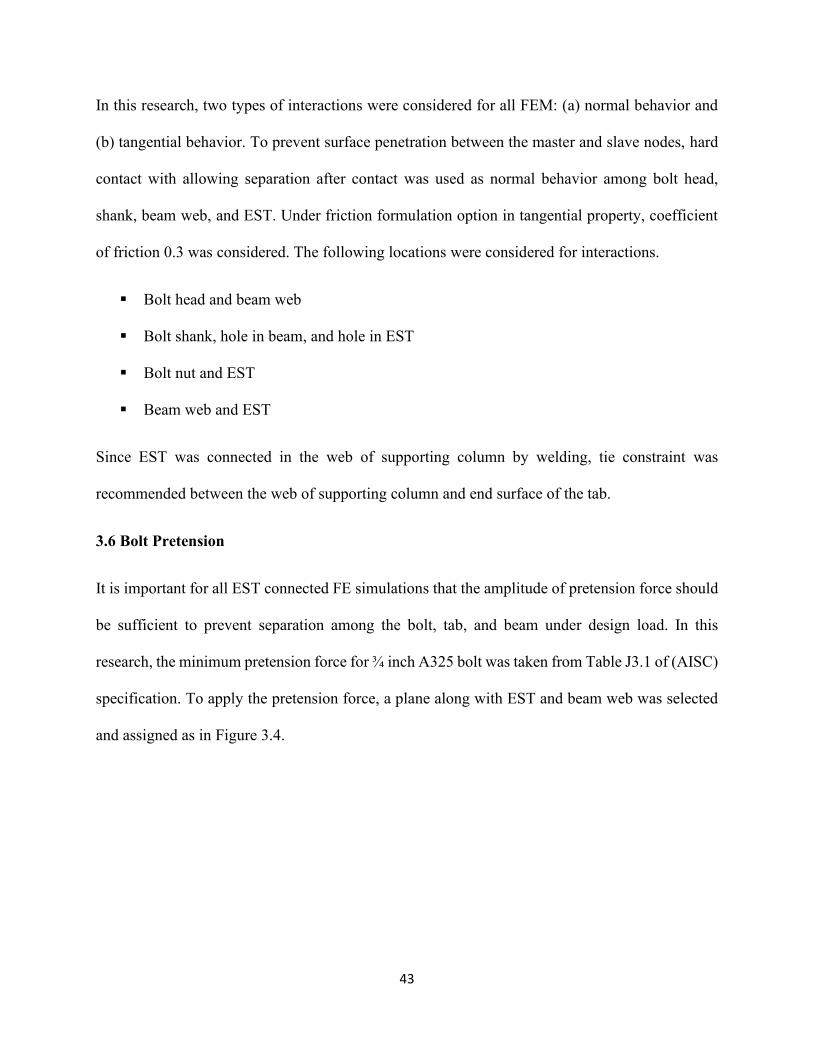
43
In this research, two types of interactions were considered for all FEM: (a) normal behavior and
(b) tangential behavior. To prevent surface penetration between the master and slave nodes, hard
contact with allowing separation after contact was used as normal behavior among bolt head,
shank, beam web, and EST. Under friction formulation option in tangential property, coefficient
of friction 0.3 was considered. The following locations were considered for interactions.
▪ Bolt head and beam web
▪ Bolt shank, hole in beam, and hole in EST
▪ Bolt nut and EST
▪ Beam web and EST
Since EST was connected in the web of supporting column by welding, tie constraint was
recommended between the web of supporting column and end surface of the tab.
3.6 Bolt Pretension
It is important for all EST connected FE simulations that the amplitude of pretension force should
be sufficient to prevent separation among the bolt, tab, and beam under design load. In this
research, the minimum pretension force for ¾ inch A325 bolt was taken from Table J3.1 of (AISC)
specification. To apply the pretension force, a plane along with EST and beam web was selected
and assigned as in Figure 3.4.
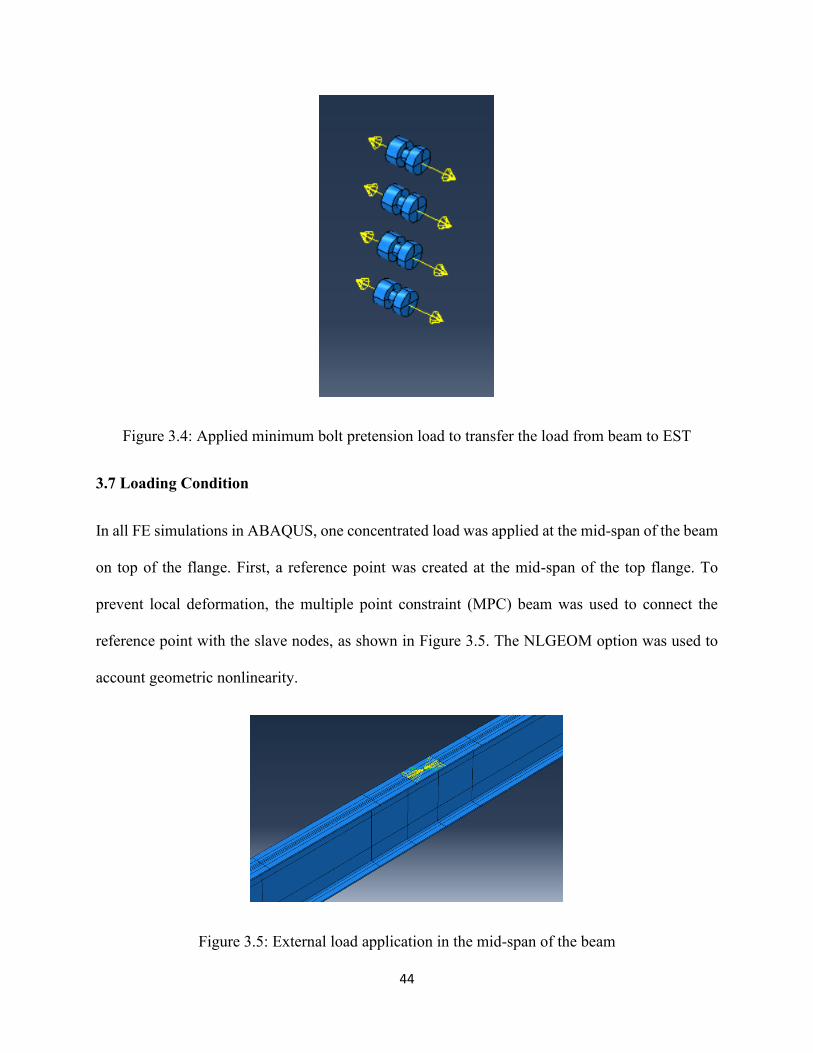
44
Figure 3.4: Applied minimum bolt pretension load to transfer the load from beam to EST
3.7 Loading Condition
In all FE simulations in ABAQUS, one concentrated load was applied at the mid-span of the beam
on top of the flange. First, a reference point was created at the mid-span of the top flange. To
prevent local deformation, the multiple point constraint (MPC) beam was used to connect the
reference point with the slave nodes, as shown in Figure 3.5. The NLGEOM option was used to
account geometric nonlinearity.
Figure 3.5: External load application in the mid-span of the beam
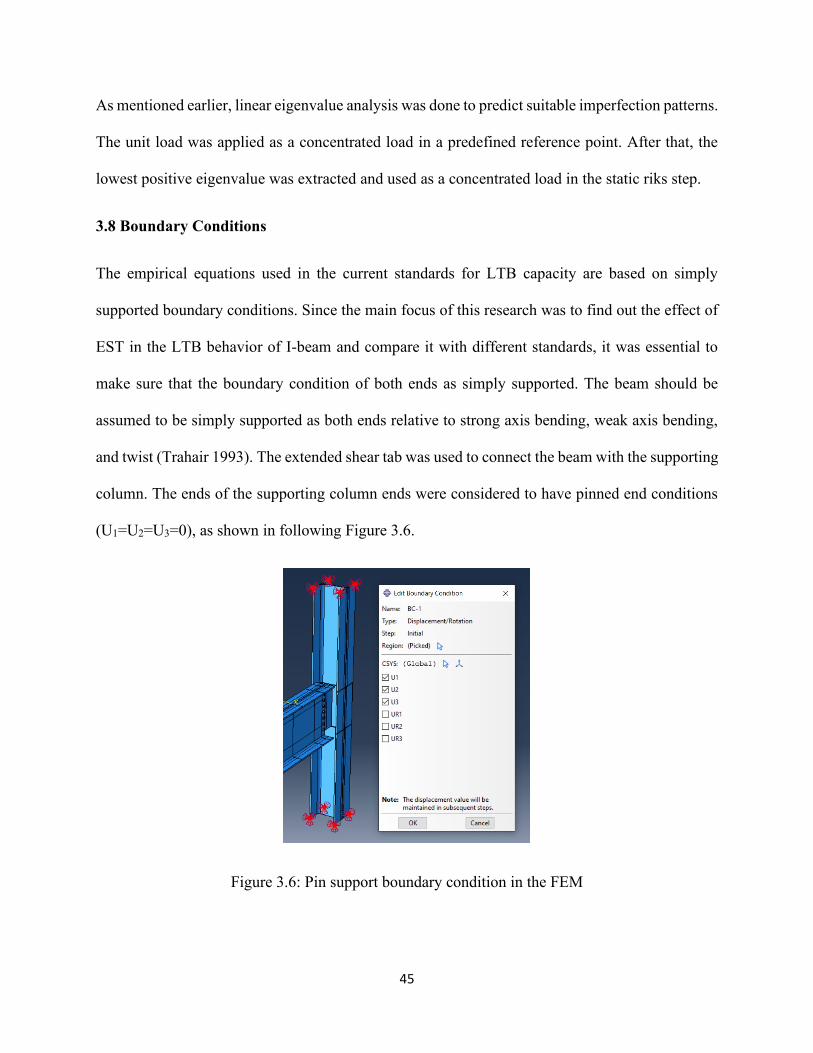
45
As mentioned earlier, linear eigenvalue analysis was done to predict suitable imperfection patterns.
The unit load was applied as a concentrated load in a predefined reference point. After that, the
lowest positive eigenvalue was extracted and used as a concentrated load in the static riks step.
3.8 Boundary Conditions
The empirical equations used in the current standards for LTB capacity are based on simply
supported boundary conditions. Since the main focus of this research was to find out the effect of
EST in the LTB behavior of I-beam and compare it with different standards, it was essential to
make sure that the boundary condition of both ends as simply supported. The beam should be
assumed to be simply supported as both ends relative to strong axis bending, weak axis bending,
and twist (Trahair 1993). The extended shear tab was used to connect the beam with the supporting
column. The ends of the supporting column ends were considered to have pinned end conditions
(U1=U2=U3=0), as shown in following Figure 3.6.
Figure 3.6: Pin support boundary condition in the FEM
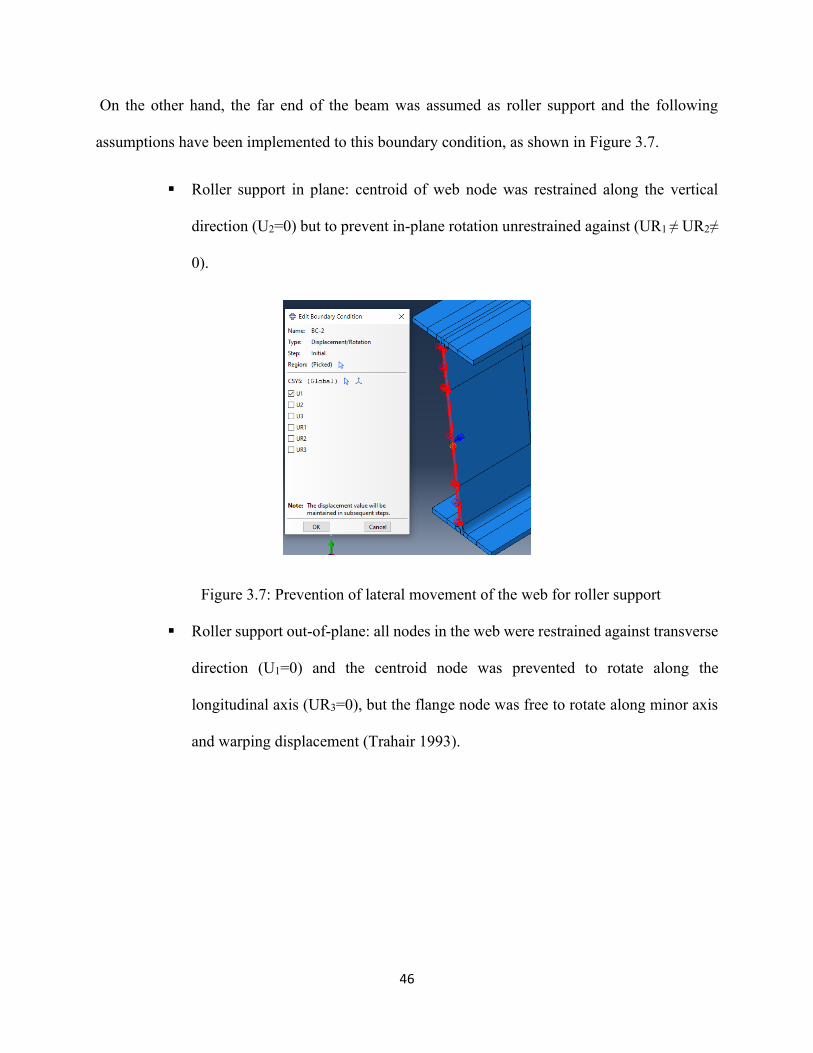
46
On the other hand, the far end of the beam was assumed as roller support and the following
assumptions have been implemented to this boundary condition, as shown in Figure 3.7.
▪ Roller support in plane: centroid of web node was restrained along the vertical
direction (U2=0) but to prevent in-plane rotation unrestrained against (UR1 ≠ UR2≠
0).
Figure 3.7: Prevention of lateral movement of the web for roller support
▪ Roller support out-of-plane: all nodes in the web were restrained against transverse
direction (U1=0) and the centroid node was prevented to rotate along the
longitudinal axis (UR3=0), but the flange node was free to rotate along minor axis
and warping displacement (Trahair 1993).
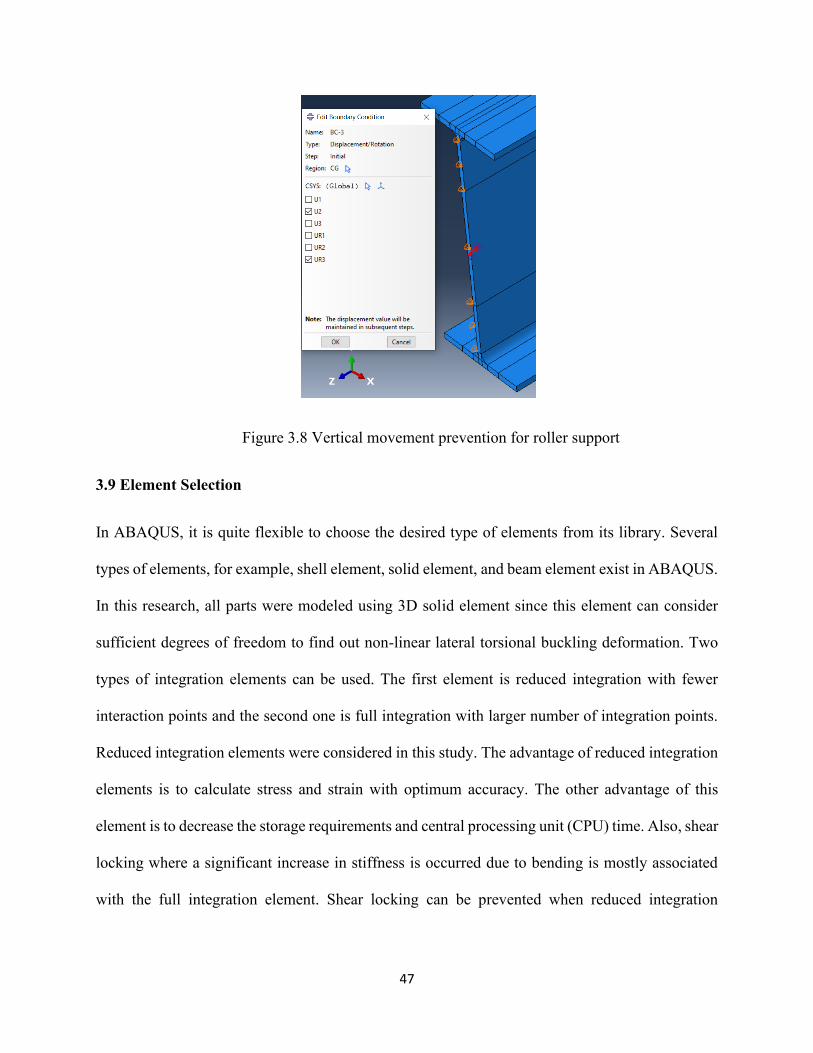
47
Figure 3.8 Vertical movement prevention for roller support
3.9 Element Selection
In ABAQUS, it is quite flexible to choose the desired type of elements from its library. Several
types of elements, for example, shell element, solid element, and beam element exist in ABAQUS.
In this research, all parts were modeled using 3D solid element since this element can consider
sufficient degrees of freedom to find out non-linear lateral torsional buckling deformation. Two
types of integration elements can be used. The first element is reduced integration with fewer
interaction points and the second one is full integration with larger number of integration points.
Reduced integration elements were considered in this study. The advantage of reduced integration
elements is to calculate stress and strain with optimum accuracy. The other advantage of this
element is to decrease the storage requirements and central processing unit (CPU) time. Also, shear
locking where a significant increase in stiffness is occurred due to bending is mostly associated
with the full integration element. Shear locking can be prevented when reduced integration
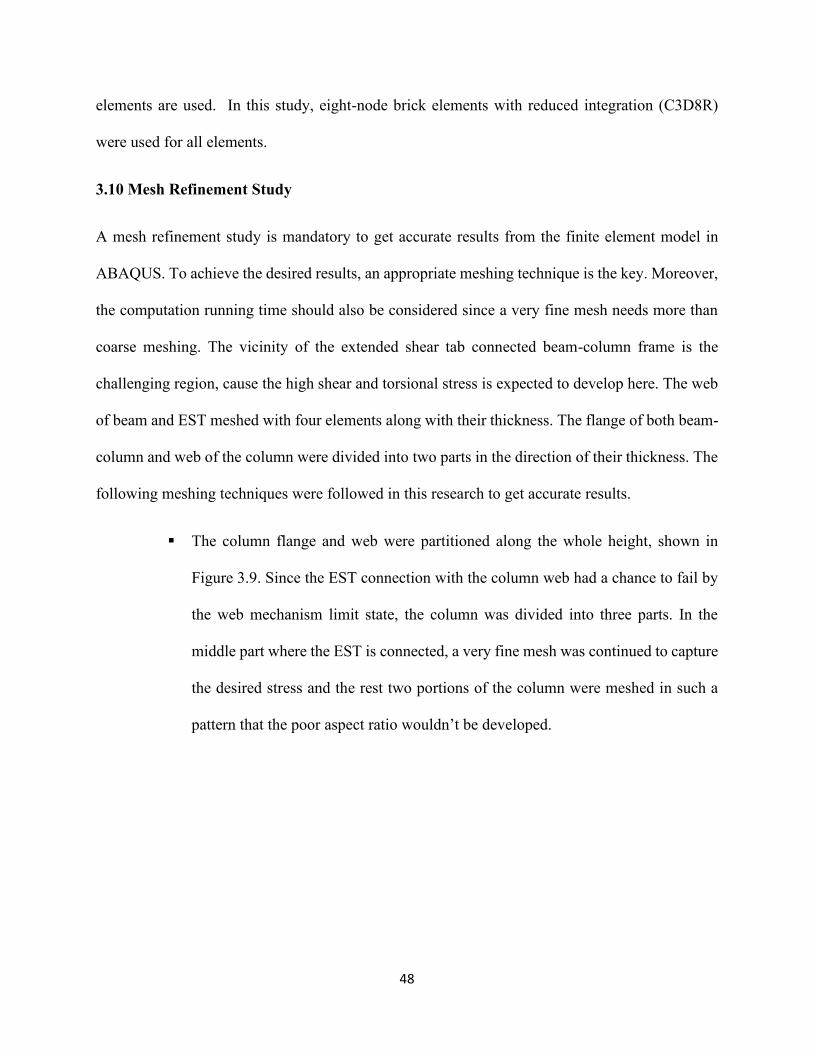
48
elements are used. In this study, eight-node brick elements with reduced integration (C3D8R)
were used for all elements.
3.10 Mesh Refinement Study
A mesh refinement study is mandatory to get accurate results from the finite element model in
ABAQUS. To achieve the desired results, an appropriate meshing technique is the key. Moreover,
the computation running time should also be considered since a very fine mesh needs more than
coarse meshing. The vicinity of the extended shear tab connected beam-column frame is the
challenging region, cause the high shear and torsional stress is expected to develop here. The web
of beam and EST meshed with four elements along with their thickness. The flange of both beam-
column and web of the column were divided into two parts in the direction of their thickness. The
following meshing techniques were followed in this research to get accurate results.
▪ The column flange and web were partitioned along the whole height, shown in
Figure 3.9. Since the EST connection with the column web had a chance to fail by
the web mechanism limit state, the column was divided into three parts. In the
middle part where the EST is connected, a very fine mesh was continued to capture
the desired stress and the rest two portions of the column were meshed in such a
pattern that the poor aspect ratio wouldn’t be developed.
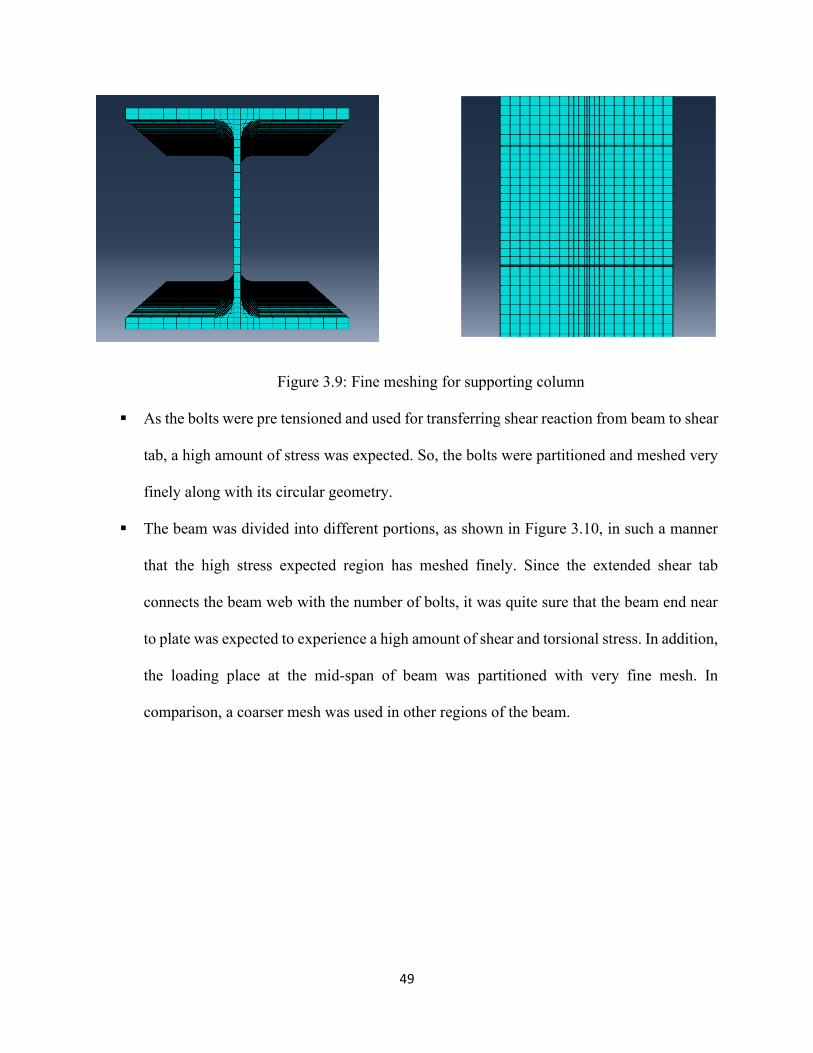
49
Figure 3.9: Fine meshing for supporting column
▪ As the bolts were pre tensioned and used for transferring shear reaction from beam to shear
tab, a high amount of stress was expected. So, the bolts were partitioned and meshed very
finely along with its circular geometry.
▪ The beam was divided into different portions, as shown in Figure 3.10, in such a manner
that the high stress expected region has meshed finely. Since the extended shear tab
connects the beam web with the number of bolts, it was quite sure that the beam end near
to plate was expected to experience a high amount of shear and torsional stress. In addition,
the loading place at the mid-span of beam was partitioned with very fine mesh. In
comparison, a coarser mesh was used in other regions of the beam.
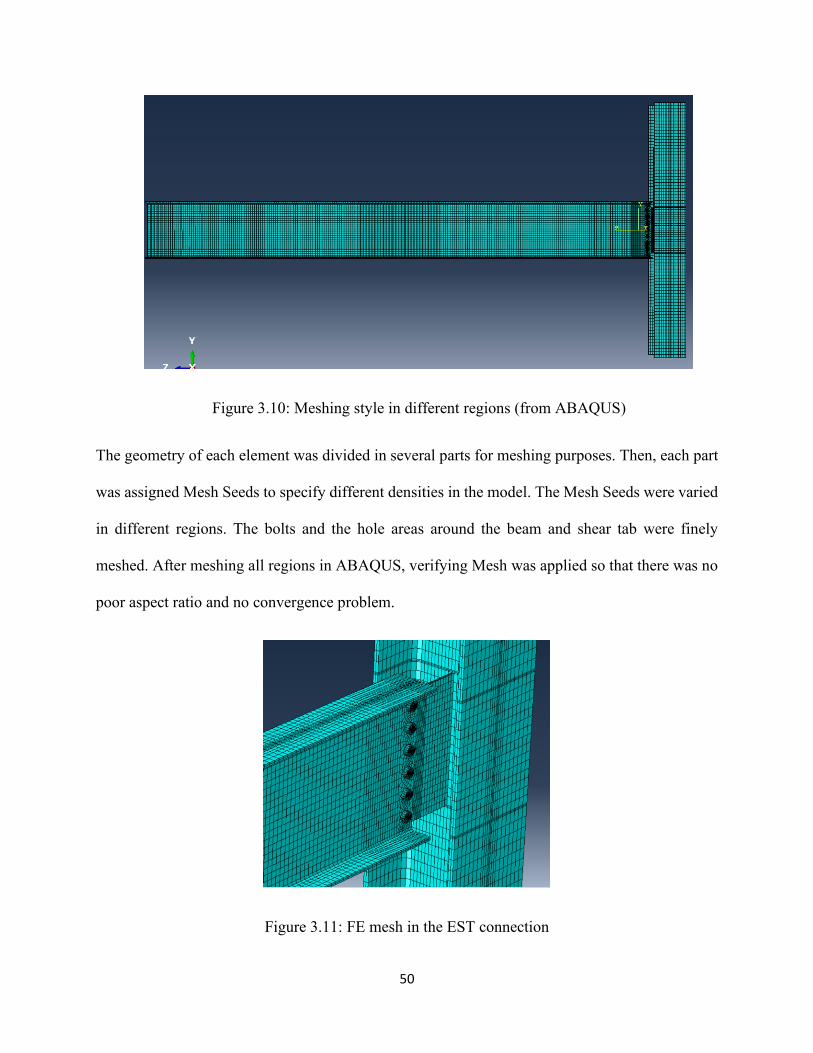
50
Figure 3.10: Meshing style in different regions (from ABAQUS)
The geometry of each element was divided in several parts for meshing purposes. Then, each part
was assigned Mesh Seeds to specify different densities in the model. The Mesh Seeds were varied
in different regions. The bolts and the hole areas around the beam and shear tab were finely
meshed. After meshing all regions in ABAQUS, verifying Mesh was applied so that there was no
poor aspect ratio and no convergence problem.
Figure 3.11: FE mesh in the EST connection
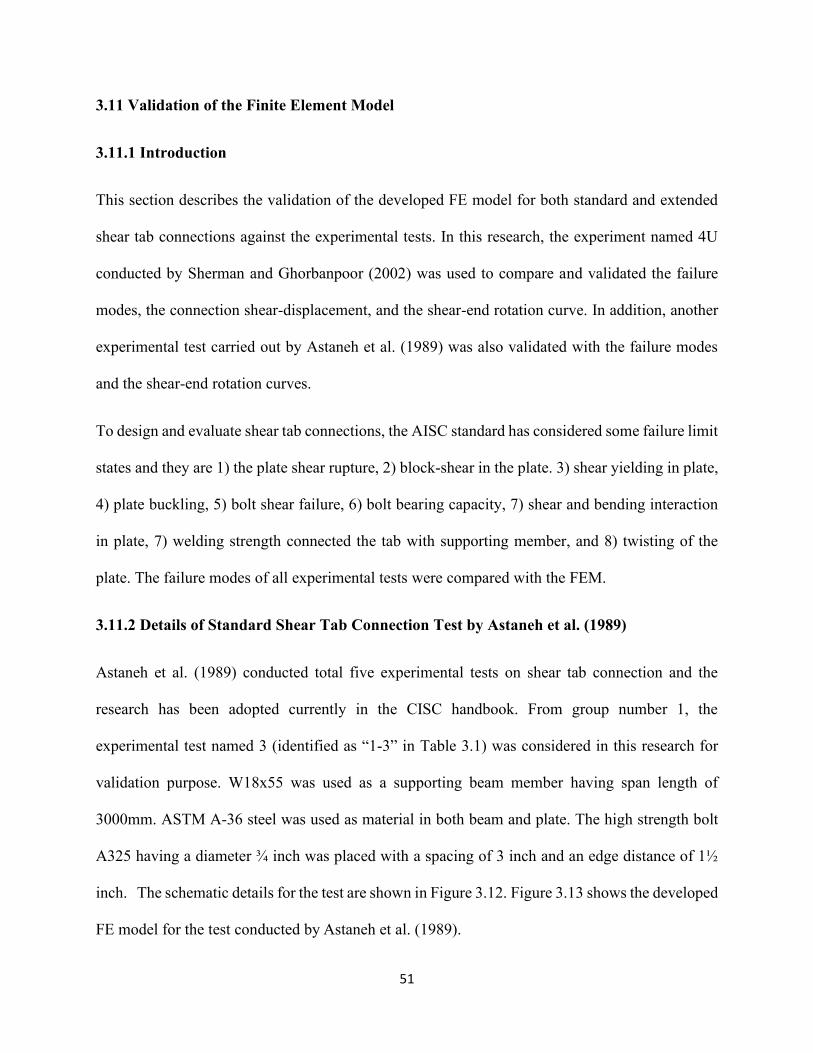
51
3.11 Validation of the Finite Element Model
3.11.1 Introduction
This section describes the validation of the developed FE model for both standard and extended
shear tab connections against the experimental tests. In this research, the experiment named 4U
conducted by Sherman and Ghorbanpoor (2002) was used to compare and validated the failure
modes, the connection shear-displacement, and the shear-end rotation curve. In addition, another
experimental test carried out by Astaneh et al. (1989) was also validated with the failure modes
and the shear-end rotation curves.
To design and evaluate shear tab connections, the AISC standard has considered some failure limit
states and they are 1) the plate shear rupture, 2) block-shear in the plate. 3) shear yielding in plate,
4) plate buckling, 5) bolt shear failure, 6) bolt bearing capacity, 7) shear and bending interaction
in plate, 7) welding strength connected the tab with supporting member, and 8) twisting of the
plate. The failure modes of all experimental tests were compared with the FEM.
3.11.2 Details of Standard Shear Tab Connection Test by Astaneh et al. (1989)
Astaneh et al. (1989) conducted total five experimental tests on shear tab connection and the
research has been adopted currently in the CISC handbook. From group number 1, the
experimental test named 3 (identified as “1-3” in Table 3.1) was considered in this research for
validation purpose. W18x55 was used as a supporting beam member having span length of
3000mm. ASTM A-36 steel was used as material in both beam and plate. The high strength bolt
A325 having a diameter ¾ inch was placed with a spacing of 3 inch and an edge distance of 1½
inch. The schematic details for the test are shown in Figure 3.12. Figure 3.13 shows the developed
FE model for the test conducted by Astaneh et al. (1989).
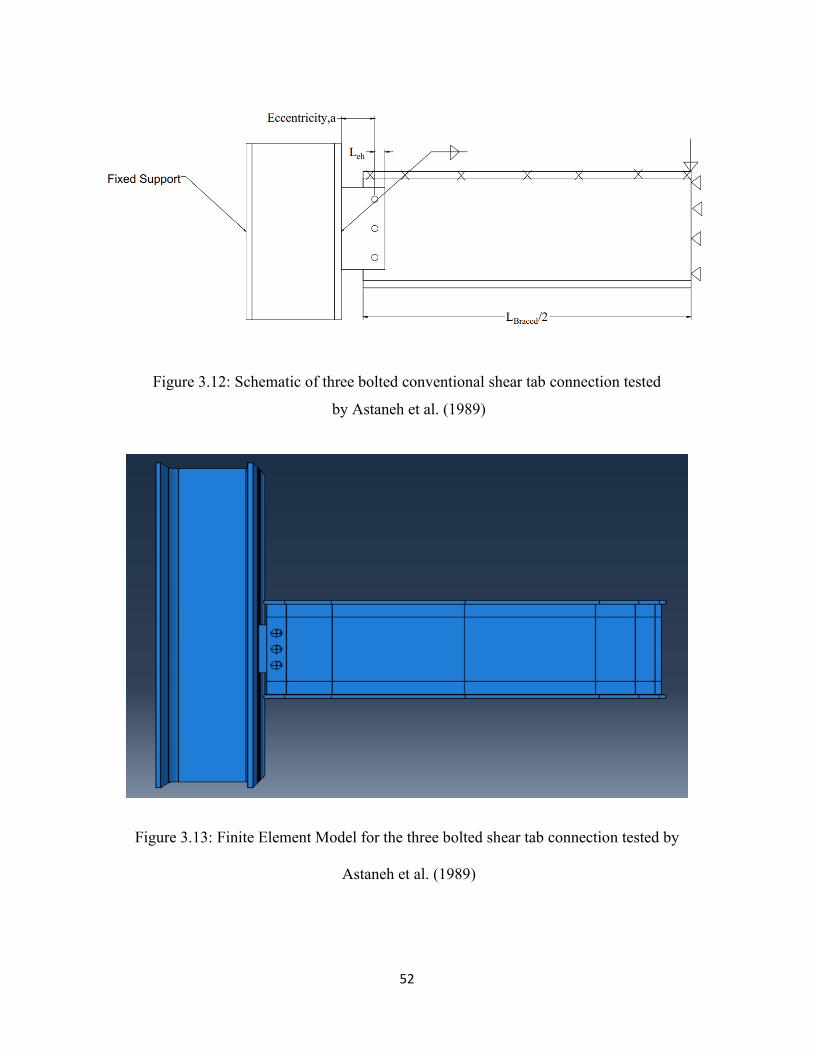
52
Figure 3.12: Schematic of three bolted conventional shear tab connection tested
by Astaneh et al. (1989)
Figure 3.13: Finite Element Model for the three bolted shear tab connection tested by
Astaneh et al. (1989)
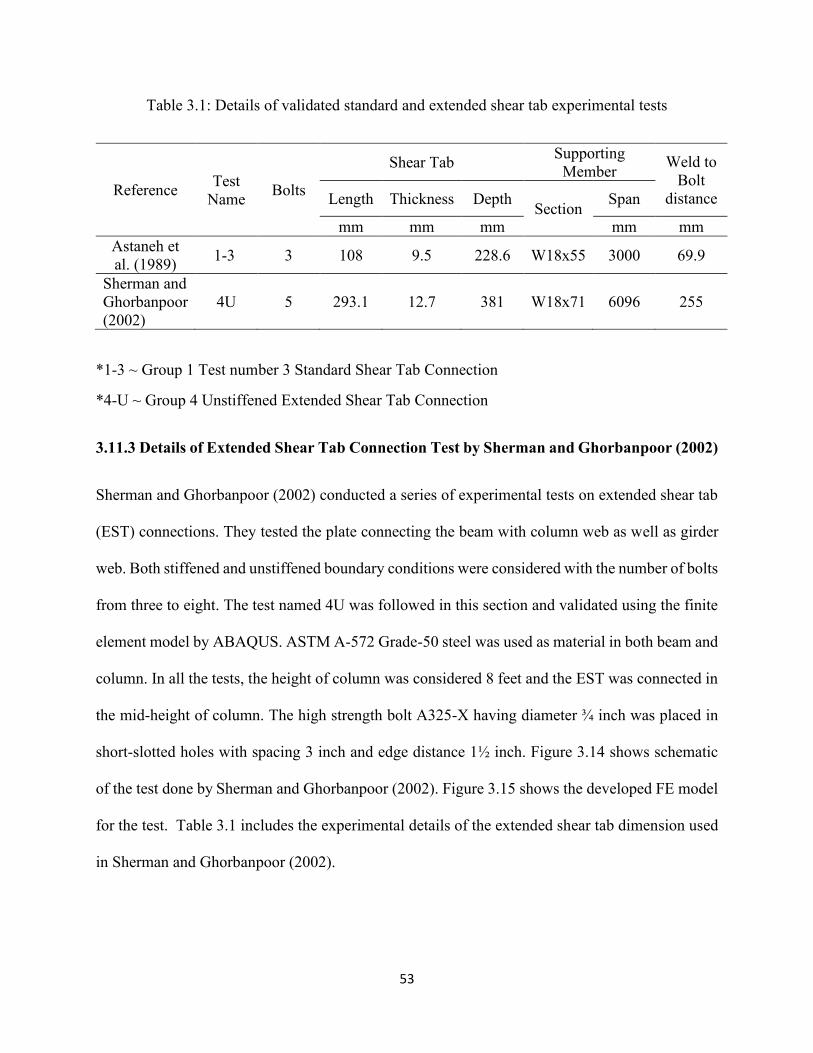
53
Table 3.1: Details of validated standard and extended shear tab experimental tests
Reference Test
Name Bolts
Shear Tab Supporting
Member Weld to
Bolt
distance Length Thickness Depth Section
Span
mm mm mm mm mm
Astaneh et
al. (1989) 1-3 3 108 9.5 228.6 W18x55 3000 69.9
Sherman and
Ghorbanpoor
(2002)
4U 5 293.1 12.7 381 W18x71 6096 255
*1-3 ~ Group 1 Test number 3 Standard Shear Tab Connection
*4-U ~ Group 4 Unstiffened Extended Shear Tab Connection
3.11.3 Details of Extended Shear Tab Connection Test by Sherman and Ghorbanpoor (2002)
Sherman and Ghorbanpoor (2002) conducted a series of experimental tests on extended shear tab
(EST) connections. They tested the plate connecting the beam with column web as well as girder
web. Both stiffened and unstiffened boundary conditions were considered with the number of bolts
from three to eight. The test named 4U was followed in this section and validated using the finite
element model by ABAQUS. ASTM A-572 Grade-50 steel was used as material in both beam and
column. In all the tests, the height of column was considered 8 feet and the EST was connected in
the mid-height of column. The high strength bolt A325-X having diameter ¾ inch was placed in
short-slotted holes with spacing 3 inch and edge distance 1½ inch. Figure 3.14 shows schematic
of the test done by Sherman and Ghorbanpoor (2002). Figure 3.15 shows the developed FE model
for the test. Table 3.1 includes the experimental details of the extended shear tab dimension used
in Sherman and Ghorbanpoor (2002).
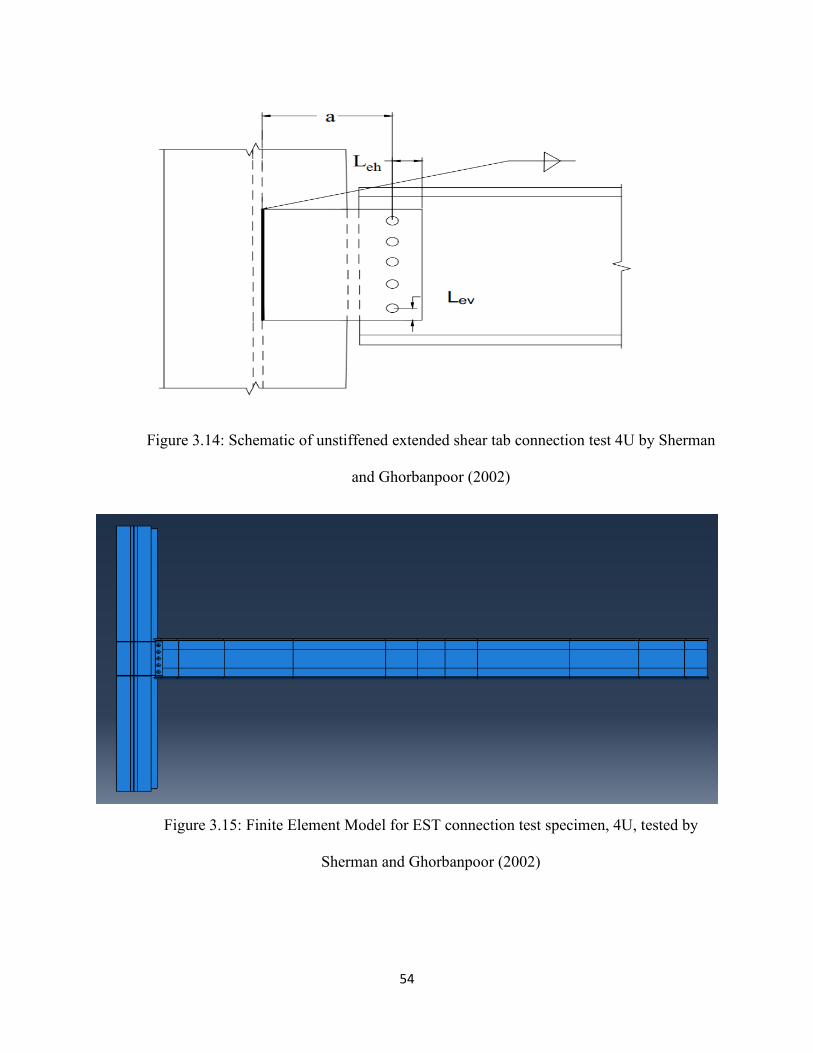
54
Figure 3.14: Schematic of unstiffened extended shear tab connection test 4U by Sherman
and Ghorbanpoor (2002)
Figure 3.15: Finite Element Model for EST connection test specimen, 4U, tested by
Sherman and Ghorbanpoor (2002)
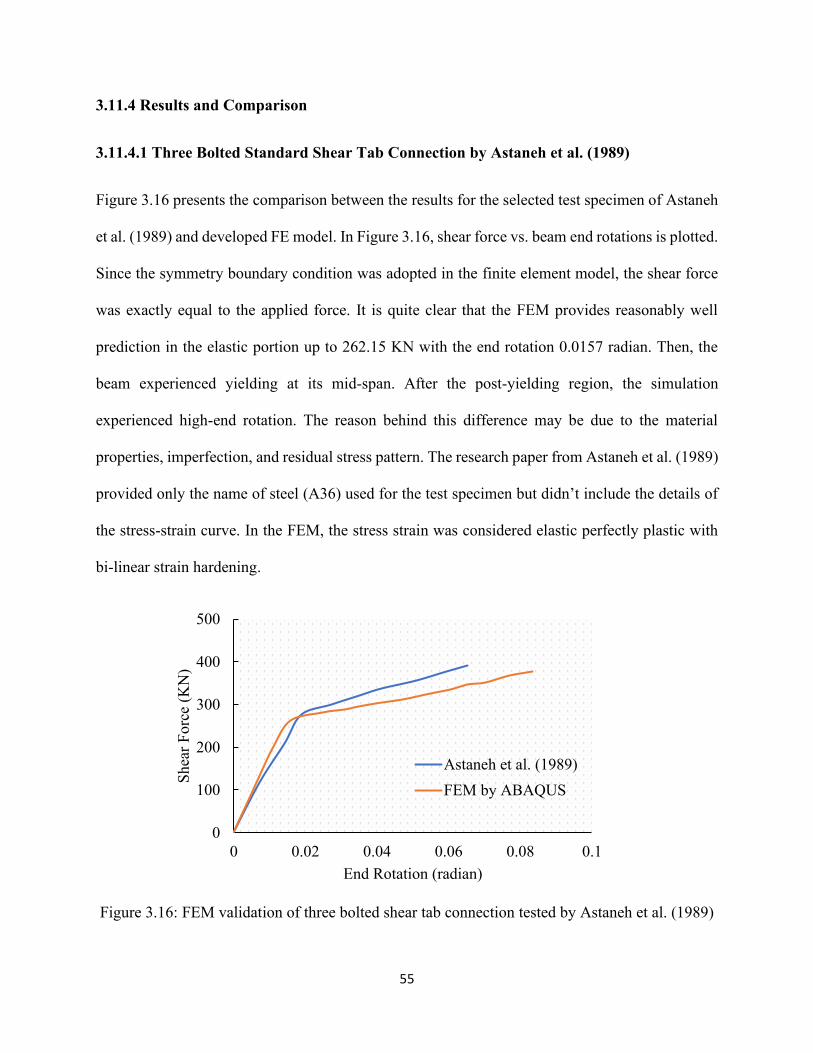
55
3.11.4 Results and Comparison
3.11.4.1 Three Bolted Standard Shear Tab Connection by Astaneh et al. (1989)
Figure 3.16 presents the comparison between the results for the selected test specimen of Astaneh
et al. (1989) and developed FE model. In Figure 3.16, shear force vs. beam end rotations is plotted.
Since the symmetry boundary condition was adopted in the finite element model, the shear force
was exactly equal to the applied force. It is quite clear that the FEM provides reasonably well
prediction in the elastic portion up to 262.15 KN with the end rotation 0.0157 radian. Then, the
beam experienced yielding at its mid-span. After the post-yielding region, the simulation
experienced high-end rotation. The reason behind this difference may be due to the material
properties, imperfection, and residual stress pattern. The research paper from Astaneh et al. (1989)
provided only the name of steel (A36) used for the test specimen but didn’t include the details of
the stress-strain curve. In the FEM, the stress strain was considered elastic perfectly plastic with
bi-linear strain hardening.
Figure 3.16: FEM validation of three bolted shear tab connection tested by Astaneh et al. (1989)
0
100
200
300
400
500
0 0.02 0.04 0.06 0.08 0.1
Shea
r F
orc
e (K
N)
End Rotation (radian)
Astaneh et al. (1989)
FEM by ABAQUS
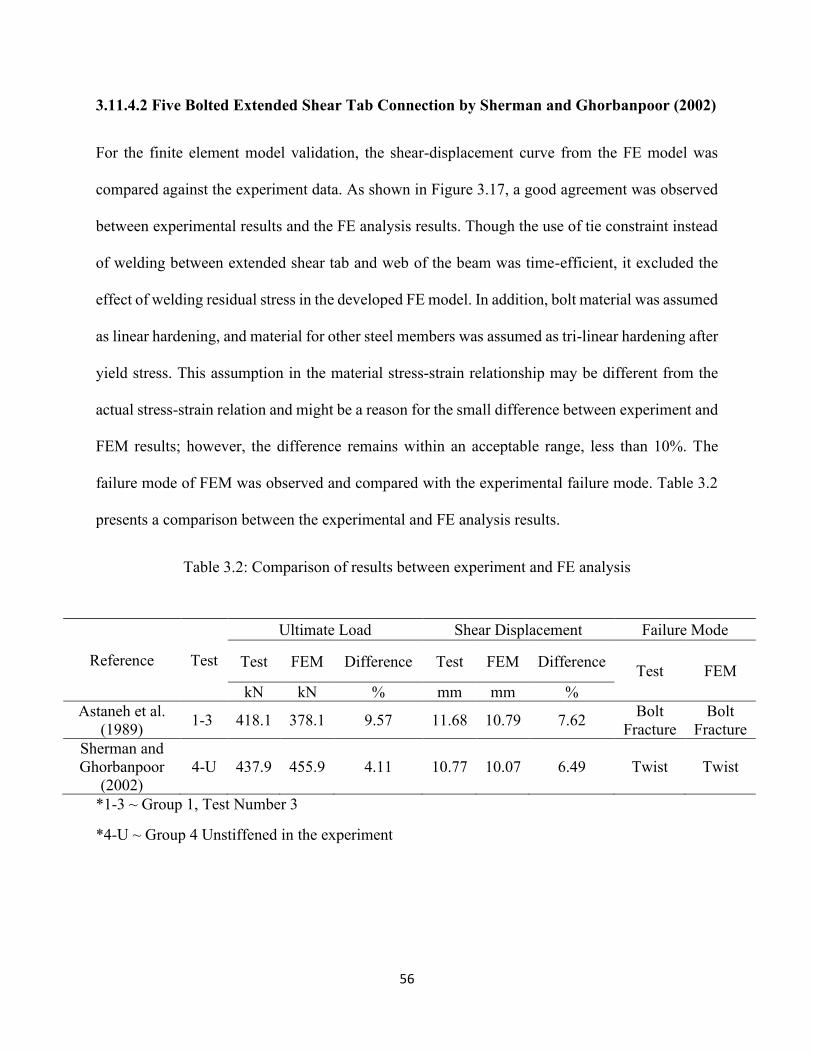
56
3.11.4.2 Five Bolted Extended Shear Tab Connection by Sherman and Ghorbanpoor (2002)
For the finite element model validation, the shear-displacement curve from the FE model was
compared against the experiment data. As shown in Figure 3.17, a good agreement was observed
between experimental results and the FE analysis results. Though the use of tie constraint instead
of welding between extended shear tab and web of the beam was time-efficient, it excluded the
effect of welding residual stress in the developed FE model. In addition, bolt material was assumed
as linear hardening, and material for other steel members was assumed as tri-linear hardening after
yield stress. This assumption in the material stress-strain relationship may be different from the
actual stress-strain relation and might be a reason for the small difference between experiment and
FEM results; however, the difference remains within an acceptable range, less than 10%. The
failure mode of FEM was observed and compared with the experimental failure mode. Table 3.2
presents a comparison between the experimental and FE analysis results.
Table 3.2: Comparison of results between experiment and FE analysis
Reference Test
Ultimate Load Shear Displacement Failure Mode
Test FEM Difference Test FEM Difference Test FEM
kN kN % mm mm %
Astaneh et al.
(1989) 1-3 418.1 378.1 9.57 11.68 10.79 7.62
Bolt
Fracture
Bolt
Fracture
Sherman and
Ghorbanpoor
(2002)
4-U 437.9 455.9 4.11 10.77 10.07 6.49 Twist Twist
*1-3 ~ Group 1, Test Number 3
*4-U ~ Group 4 Unstiffened in the experiment
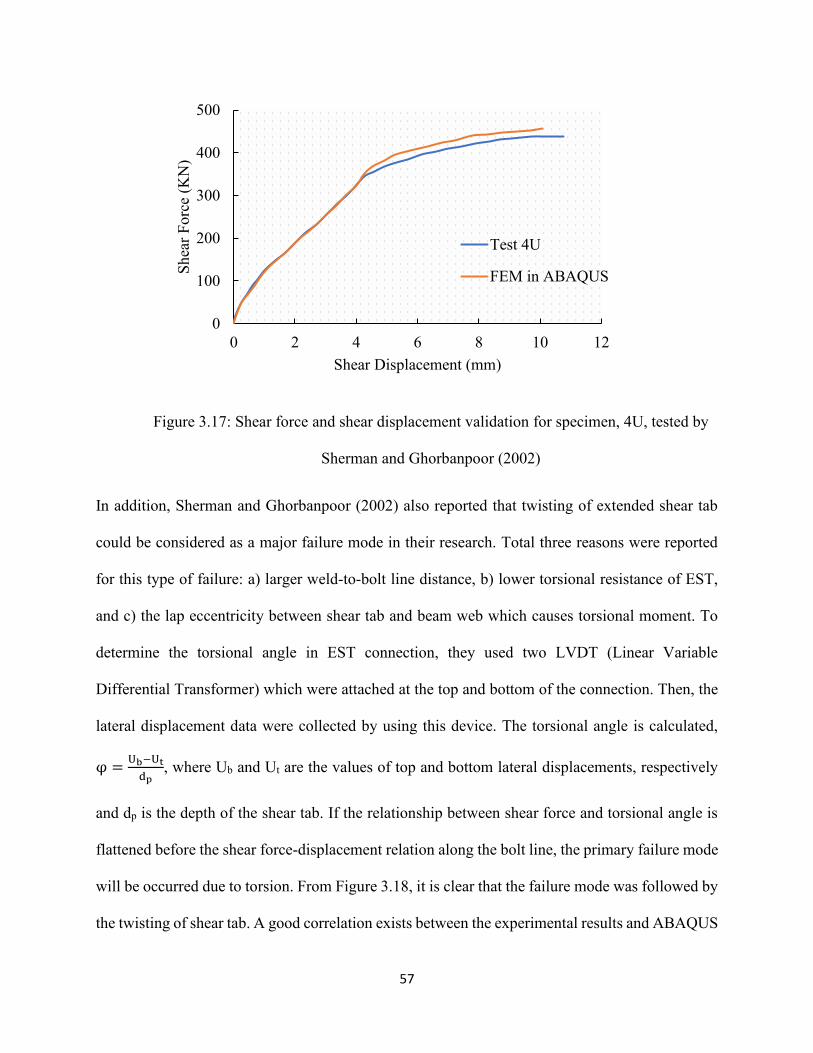
57
Figure 3.17: Shear force and shear displacement validation for specimen, 4U, tested by
Sherman and Ghorbanpoor (2002)
In addition, Sherman and Ghorbanpoor (2002) also reported that twisting of extended shear tab
could be considered as a major failure mode in their research. Total three reasons were reported
for this type of failure: a) larger weld-to-bolt line distance, b) lower torsional resistance of EST,
and c) the lap eccentricity between shear tab and beam web which causes torsional moment. To
determine the torsional angle in EST connection, they used two LVDT (Linear Variable
Differential Transformer) which were attached at the top and bottom of the connection. Then, the
lateral displacement data were collected by using this device. The torsional angle is calculated,
φ =Ub−Ut
dp, where Ub and Ut are the values of top and bottom lateral displacements, respectively
and dp is the depth of the shear tab. If the relationship between shear force and torsional angle is
flattened before the shear force-displacement relation along the bolt line, the primary failure mode
will be occurred due to torsion. From Figure 3.18, it is clear that the failure mode was followed by
the twisting of shear tab. A good correlation exists between the experimental results and ABAQUS
0
100
200
300
400
500
0 2 4 6 8 10 12
Shea
r F
orc
e (K
N)
Shear Displacement (mm)
Test 4U
FEM in ABAQUS
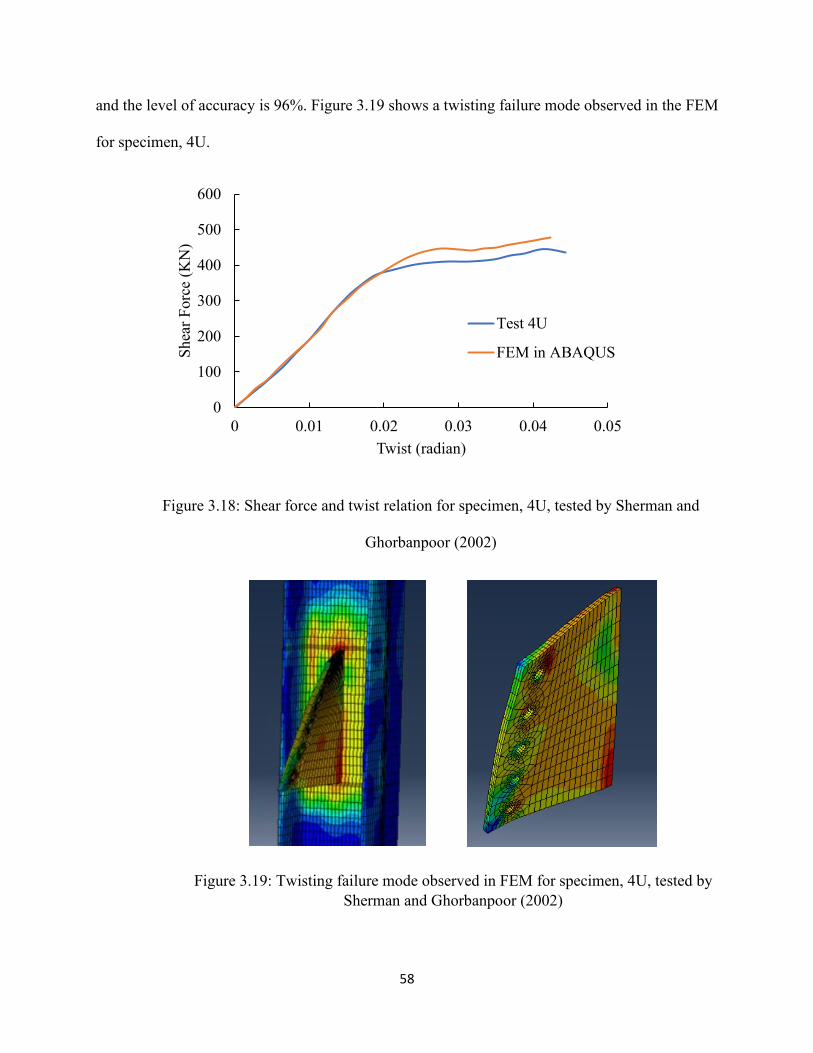
58
and the level of accuracy is 96%. Figure 3.19 shows a twisting failure mode observed in the FEM
for specimen, 4U.
Figure 3.18: Shear force and twist relation for specimen, 4U, tested by Sherman and
Ghorbanpoor (2002)
Figure 3.19: Twisting failure mode observed in FEM for specimen, 4U, tested by
Sherman and Ghorbanpoor (2002)
0
100
200
300
400
500
600
0 0.01 0.02 0.03 0.04 0.05
Shea
r F
orc
e (K
N)
Twist (radian)
Test 4U
FEM in ABAQUS
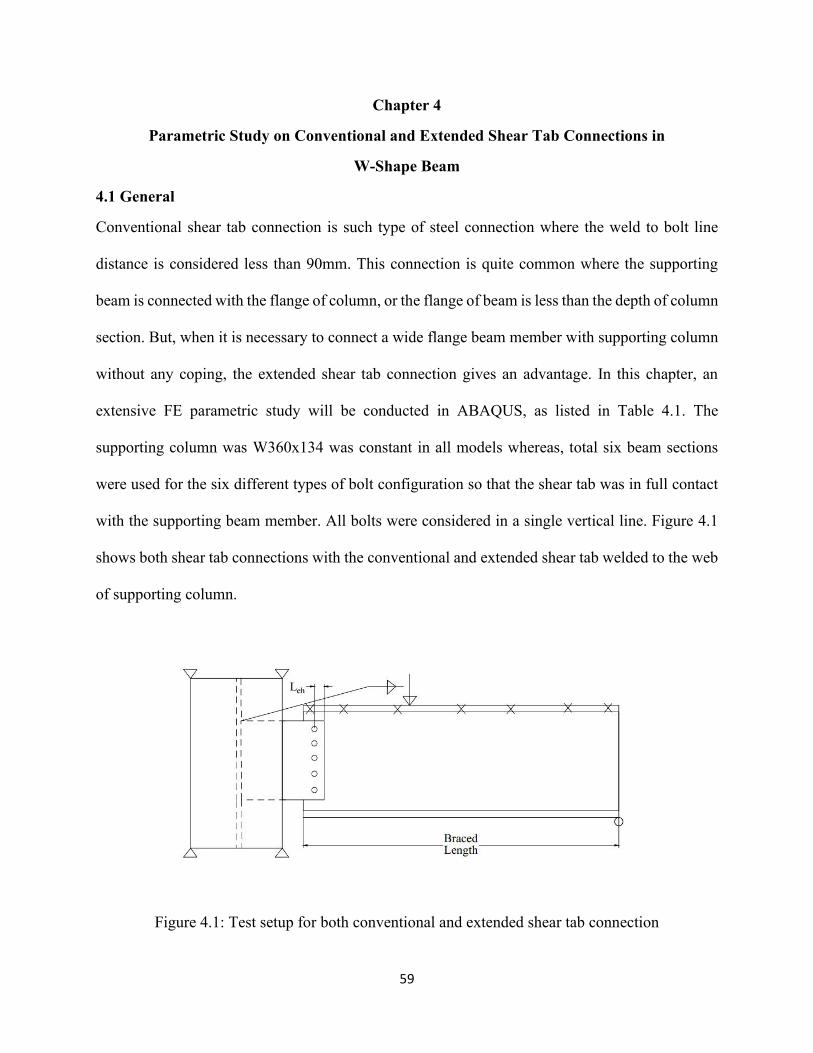
59
Chapter 4
Parametric Study on Conventional and Extended Shear Tab Connections in
W-Shape Beam
4.1 General
Conventional shear tab connection is such type of steel connection where the weld to bolt line
distance is considered less than 90mm. This connection is quite common where the supporting
beam is connected with the flange of column, or the flange of beam is less than the depth of column
section. But, when it is necessary to connect a wide flange beam member with supporting column
without any coping, the extended shear tab connection gives an advantage. In this chapter, an
extensive FE parametric study will be conducted in ABAQUS, as listed in Table 4.1. The
supporting column was W360x134 was constant in all models whereas, total six beam sections
were used for the six different types of bolt configuration so that the shear tab was in full contact
with the supporting beam member. All bolts were considered in a single vertical line. Figure 4.1
shows both shear tab connections with the conventional and extended shear tab welded to the web
of supporting column.
Figure 4.1: Test setup for both conventional and extended shear tab connection
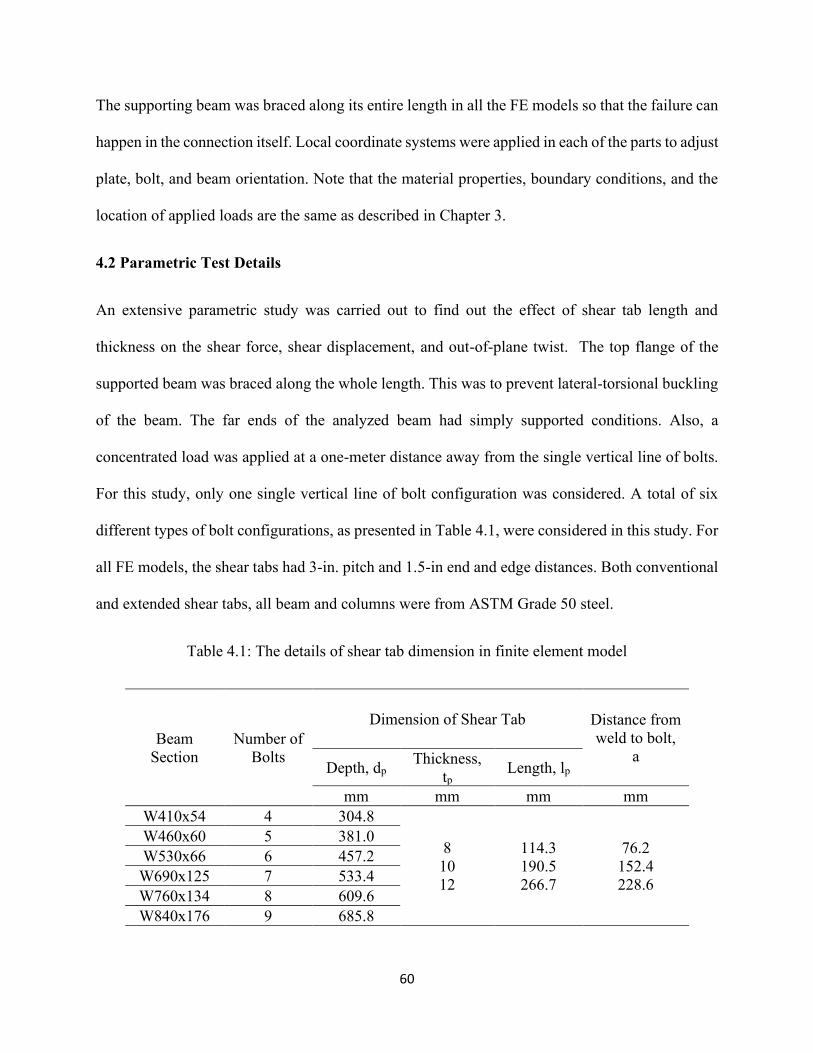
60
The supporting beam was braced along its entire length in all the FE models so that the failure can
happen in the connection itself. Local coordinate systems were applied in each of the parts to adjust
plate, bolt, and beam orientation. Note that the material properties, boundary conditions, and the
location of applied loads are the same as described in Chapter 3.
4.2 Parametric Test Details
An extensive parametric study was carried out to find out the effect of shear tab length and
thickness on the shear force, shear displacement, and out-of-plane twist. The top flange of the
supported beam was braced along the whole length. This was to prevent lateral-torsional buckling
of the beam. The far ends of the analyzed beam had simply supported conditions. Also, a
concentrated load was applied at a one-meter distance away from the single vertical line of bolts.
For this study, only one single vertical line of bolt configuration was considered. A total of six
different types of bolt configurations, as presented in Table 4.1, were considered in this study. For
all FE models, the shear tabs had 3-in. pitch and 1.5-in end and edge distances. Both conventional
and extended shear tabs, all beam and columns were from ASTM Grade 50 steel.
Table 4.1: The details of shear tab dimension in finite element model
Beam
Section
Number of
Bolts
Dimension of Shear Tab Distance from
weld to bolt,
a Depth, dp
Thickness,
tp Length, lp
mm mm mm mm
W410x54 4 304.8
8
10
12
114.3
190.5
266.7
76.2
152.4
228.6
W460x60 5 381.0
W530x66 6 457.2
W690x125 7 533.4
W760x134 8 609.6
W840x176 9 685.8
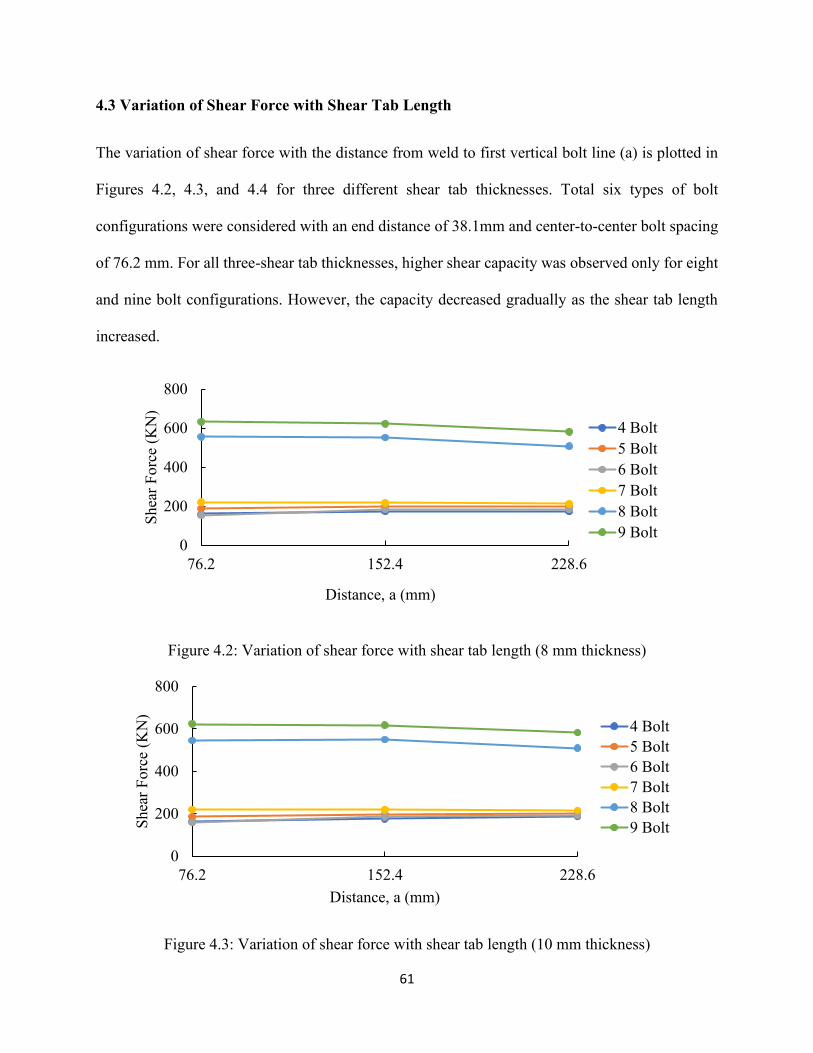
61
4.3 Variation of Shear Force with Shear Tab Length
The variation of shear force with the distance from weld to first vertical bolt line (a) is plotted in
Figures 4.2, 4.3, and 4.4 for three different shear tab thicknesses. Total six types of bolt
configurations were considered with an end distance of 38.1mm and center-to-center bolt spacing
of 76.2 mm. For all three-shear tab thicknesses, higher shear capacity was observed only for eight
and nine bolt configurations. However, the capacity decreased gradually as the shear tab length
increased.
Figure 4.2: Variation of shear force with shear tab length (8 mm thickness)
Figure 4.3: Variation of shear force with shear tab length (10 mm thickness)
0
200
400
600
800
76.2 152.4 228.6
Shea
r F
orc
e (K
N)
Distance, a (mm)
4 Bolt
5 Bolt
6 Bolt
7 Bolt
8 Bolt
9 Bolt
0
200
400
600
800
76.2 152.4 228.6
Shea
r F
orc
e (K
N)
Distance, a (mm)
4 Bolt
5 Bolt
6 Bolt
7 Bolt
8 Bolt
9 Bolt
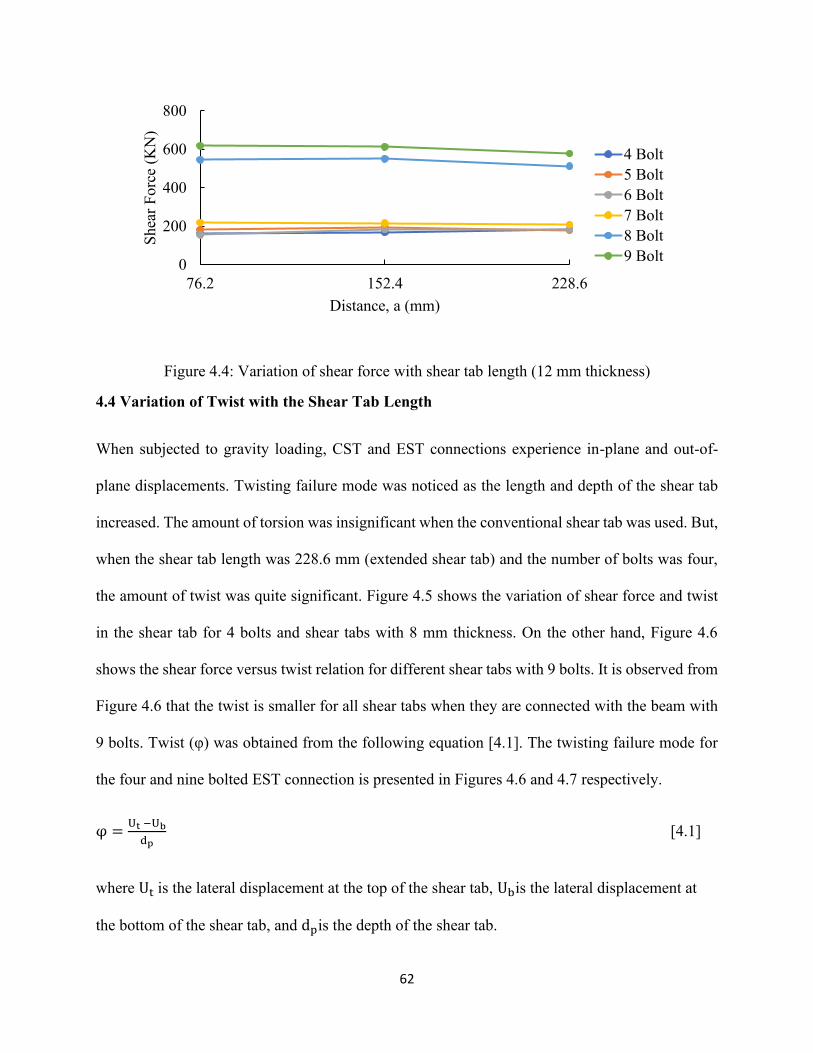
62
Figure 4.4: Variation of shear force with shear tab length (12 mm thickness)
4.4 Variation of Twist with the Shear Tab Length
When subjected to gravity loading, CST and EST connections experience in-plane and out-of-
plane displacements. Twisting failure mode was noticed as the length and depth of the shear tab
increased. The amount of torsion was insignificant when the conventional shear tab was used. But,
when the shear tab length was 228.6 mm (extended shear tab) and the number of bolts was four,
the amount of twist was quite significant. Figure 4.5 shows the variation of shear force and twist
in the shear tab for 4 bolts and shear tabs with 8 mm thickness. On the other hand, Figure 4.6
shows the shear force versus twist relation for different shear tabs with 9 bolts. It is observed from
Figure 4.6 that the twist is smaller for all shear tabs when they are connected with the beam with
9 bolts. Twist (φ) was obtained from the following equation [4.1]. The twisting failure mode for
the four and nine bolted EST connection is presented in Figures 4.6 and 4.7 respectively.
φ =Ut −Ub
dp [4.1]
where Ut is the lateral displacement at the top of the shear tab, Ubis the lateral displacement at
the bottom of the shear tab, and dpis the depth of the shear tab.
0
200
400
600
800
76.2 152.4 228.6
Shea
r F
orc
e (K
N)
Distance, a (mm)
4 Bolt
5 Bolt
6 Bolt
7 Bolt
8 Bolt
9 Bolt
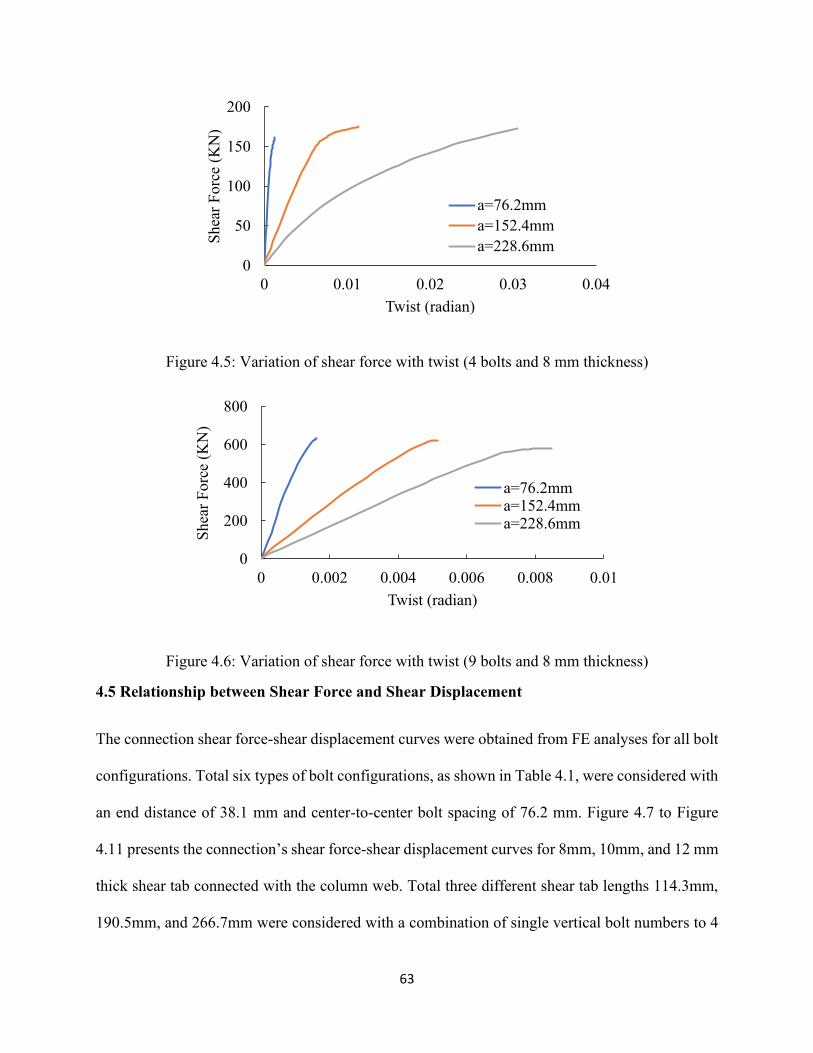
63
Figure 4.5: Variation of shear force with twist (4 bolts and 8 mm thickness)
Figure 4.6: Variation of shear force with twist (9 bolts and 8 mm thickness)
4.5 Relationship between Shear Force and Shear Displacement
The connection shear force-shear displacement curves were obtained from FE analyses for all bolt
configurations. Total six types of bolt configurations, as shown in Table 4.1, were considered with
an end distance of 38.1 mm and center-to-center bolt spacing of 76.2 mm. Figure 4.7 to Figure
4.11 presents the connection’s shear force-shear displacement curves for 8mm, 10mm, and 12 mm
thick shear tab connected with the column web. Total three different shear tab lengths 114.3mm,
190.5mm, and 266.7mm were considered with a combination of single vertical bolt numbers to 4
0
50
100
150
200
0 0.01 0.02 0.03 0.04
Shea
r F
orc
e (K
N)
Twist (radian)
a=76.2mm
a=152.4mm
a=228.6mm
0
200
400
600
800
0 0.002 0.004 0.006 0.008 0.01
Shea
r F
orc
e (K
N)
Twist (radian)
a=76.2mma=152.4mma=228.6mm
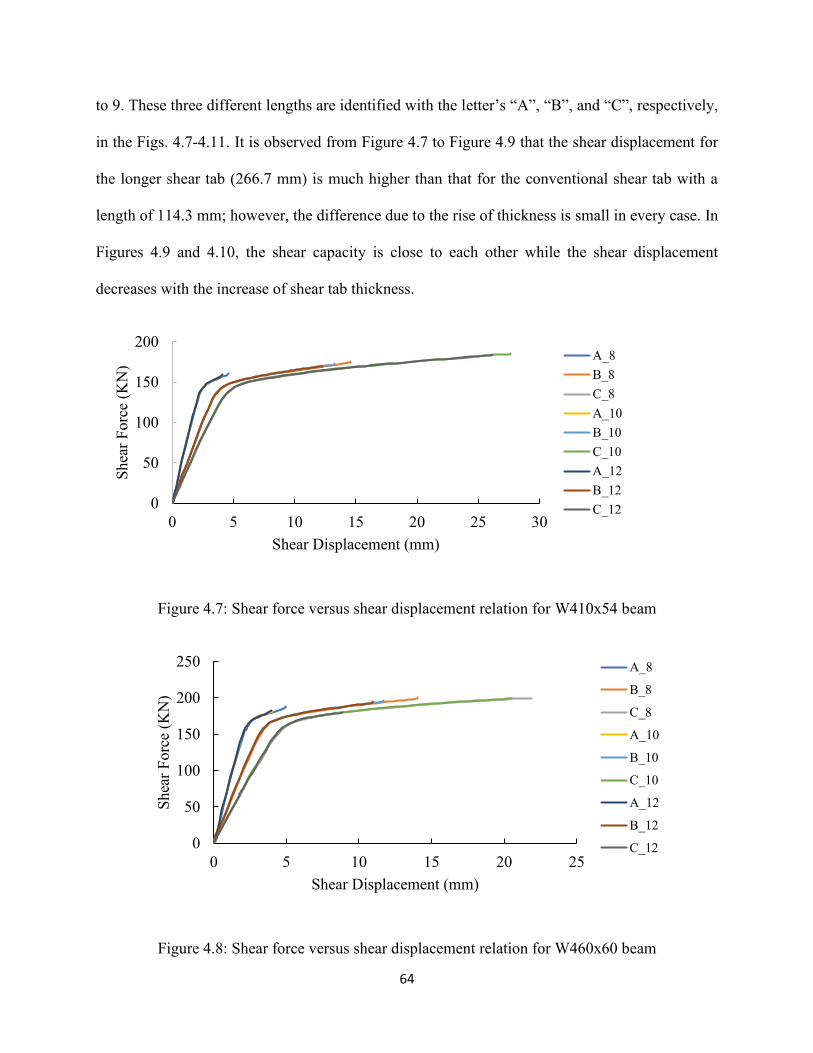
64
to 9. These three different lengths are identified with the letter’s “A”, “B”, and “C”, respectively,
in the Figs. 4.7-4.11. It is observed from Figure 4.7 to Figure 4.9 that the shear displacement for
the longer shear tab (266.7 mm) is much higher than that for the conventional shear tab with a
length of 114.3 mm; however, the difference due to the rise of thickness is small in every case. In
Figures 4.9 and 4.10, the shear capacity is close to each other while the shear displacement
decreases with the increase of shear tab thickness.
Figure 4.7: Shear force versus shear displacement relation for W410x54 beam
Figure 4.8: Shear force versus shear displacement relation for W460x60 beam
0
50
100
150
200
0 5 10 15 20 25 30
Shea
r F
orc
e (K
N)
Shear Displacement (mm)
A_8
B_8
C_8
A_10
B_10
C_10
A_12
B_12
C_12
0
50
100
150
200
250
0 5 10 15 20 25
Shea
r F
orc
e (K
N)
Shear Displacement (mm)
A_8
B_8
C_8
A_10
B_10
C_10
A_12
B_12
C_12
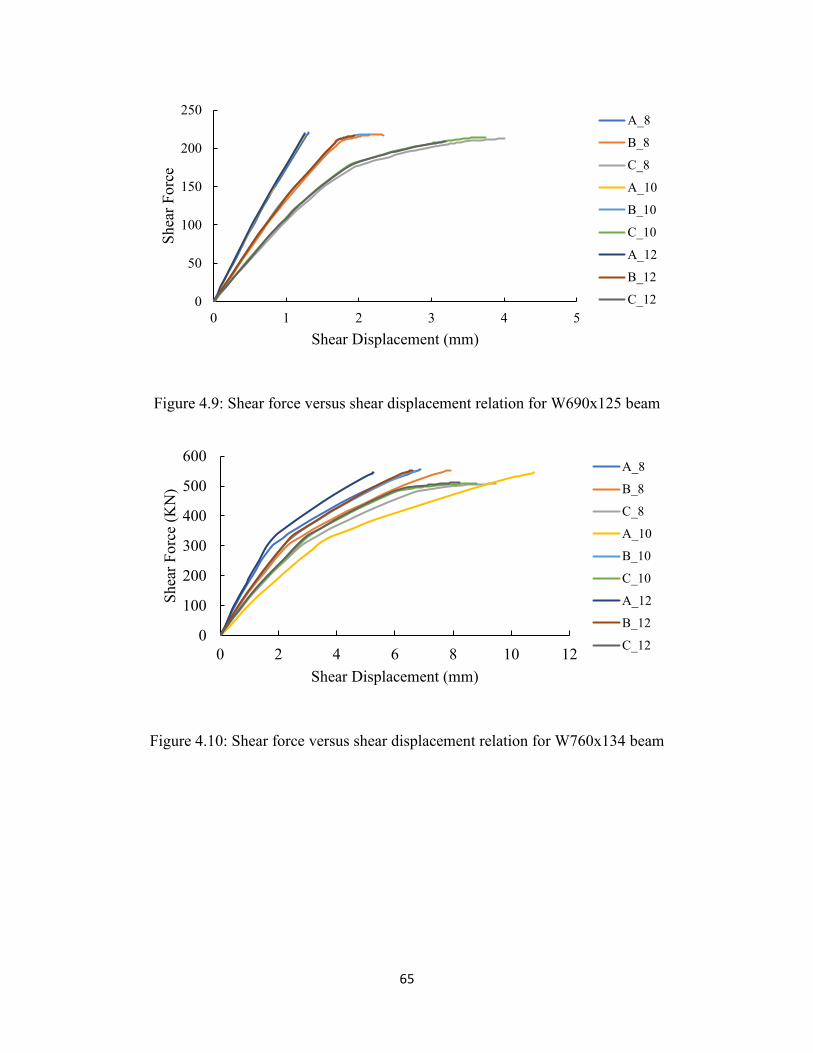
65
Figure 4.9: Shear force versus shear displacement relation for W690x125 beam
Figure 4.10: Shear force versus shear displacement relation for W760x134 beam
0
50
100
150
200
250
0 1 2 3 4 5
Shea
r F
orc
e
Shear Displacement (mm)
A_8
B_8
C_8
A_10
B_10
C_10
A_12
B_12
C_12
0
100
200
300
400
500
600
0 2 4 6 8 10 12
Shea
r F
orc
e (K
N)
Shear Displacement (mm)
A_8
B_8
C_8
A_10
B_10
C_10
A_12
B_12
C_12
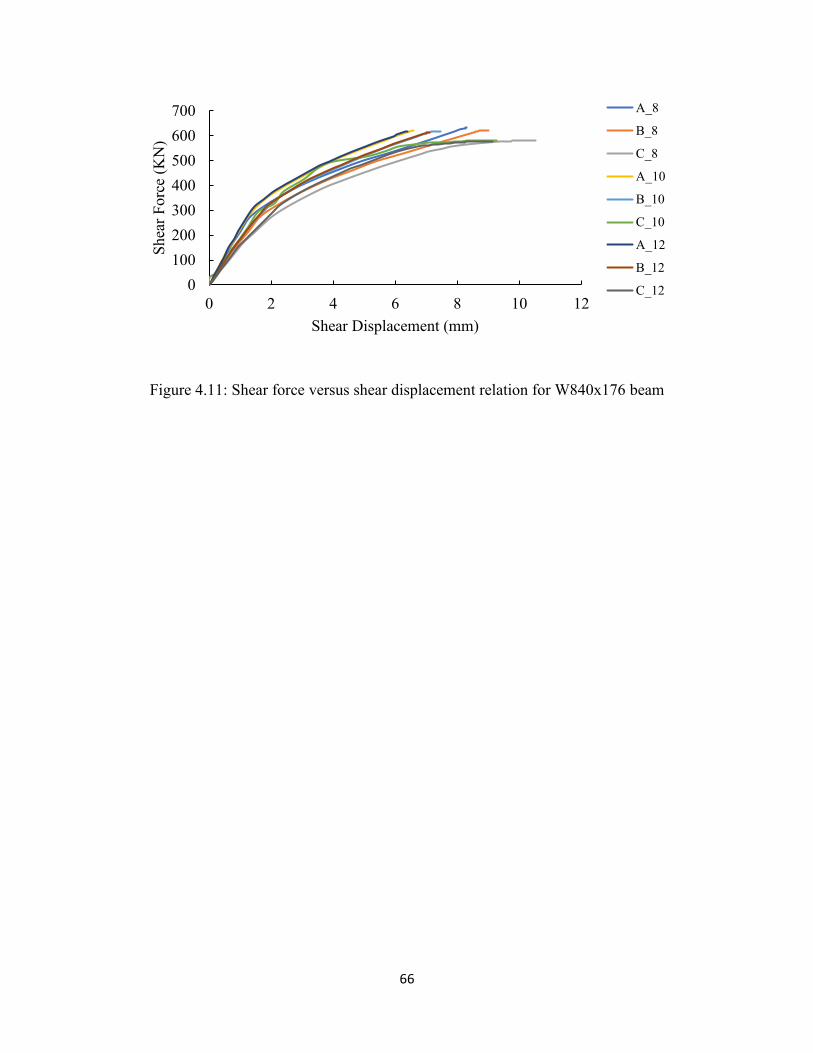
66
Figure 4.11: Shear force versus shear displacement relation for W840x176 beam
0
100
200
300
400
500
600
700
0 2 4 6 8 10 12
Shea
r F
orc
e (K
N)
Shear Displacement (mm)
A_8
B_8
C_8
A_10
B_10
C_10
A_12
B_12
C_12
67
Chapter 5
Effect of Extended Shear Tab Connection on Laterally Unsupported W-Shape Beam
5.1 Introduction
Lateral torsional buckling (LTB) is a type of failure where deformation occurs simultaneously in
both in-plane and out-of-plane directions. It has occurred when the applied load does not go
through the shear center. A uniform moment along the span can create a critical situation to happen
LTB failure. Though the uniform moment is considered as a critical condition theoretically, a
concentrated load is applied in the mid-span having simply supported boundary condition without
any lateral bracing along the beam has been considered. CSA S16-14 considers a moment gradient
factor ω2 and multiplies with the resistance equation from the uniform moment. However, Wong
and Driver (2010) provided a general equation [2.16] to calculate the factor for any moment
distribution. Moreover, different types of boundary conditions affect the buckling capacity of
beam. The present study focuses only to find out the effect of extended shear tab connection on
LTB moment capacity.
In Chapter 4, the shear force, shear displacement, and torsional angles were determined and
compared by varying the length, thickness, and depth of the shear tab. To find out the
characteristics of shear tab itself, it was also important to consider the lateral bracing along the top
flange of beam. Since the extended shear tab is prone to fail by twist mode (Sherman and
Ghorbanpoor, 2002), the effect of lateral torsional buckling capacity on W-Shape beam will be
followed in this chapter.
This chapter compares the LTB strength curve from both CSA S16-14 and AISC with the finite
element model varying shear tab dimensions. Additionally, the FEM results have been compared
between the single and double vertical line of bolts as well as considering the different unbraced
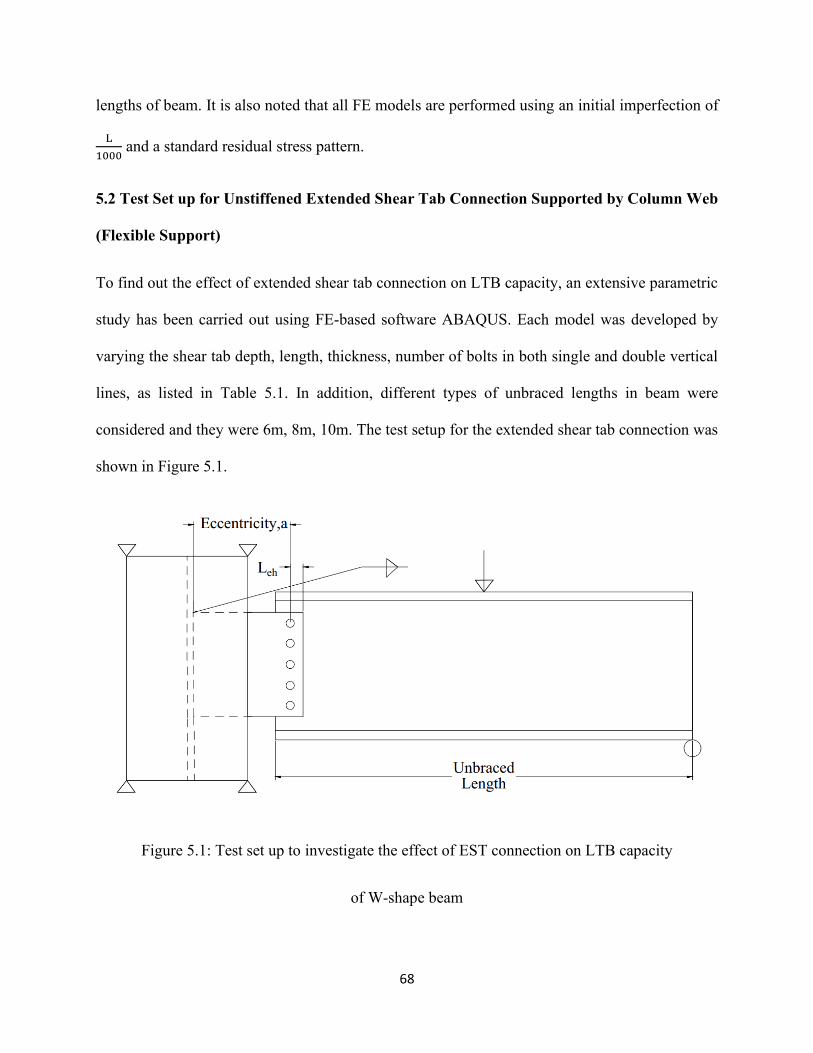
68
lengths of beam. It is also noted that all FE models are performed using an initial imperfection of
L
1000 and a standard residual stress pattern.
5.2 Test Set up for Unstiffened Extended Shear Tab Connection Supported by Column Web
(Flexible Support)
To find out the effect of extended shear tab connection on LTB capacity, an extensive parametric
study has been carried out using FE-based software ABAQUS. Each model was developed by
varying the shear tab depth, length, thickness, number of bolts in both single and double vertical
lines, as listed in Table 5.1. In addition, different types of unbraced lengths in beam were
considered and they were 6m, 8m, 10m. The test setup for the extended shear tab connection was
shown in Figure 5.1.
Figure 5.1: Test set up to investigate the effect of EST connection on LTB capacity
of W-shape beam
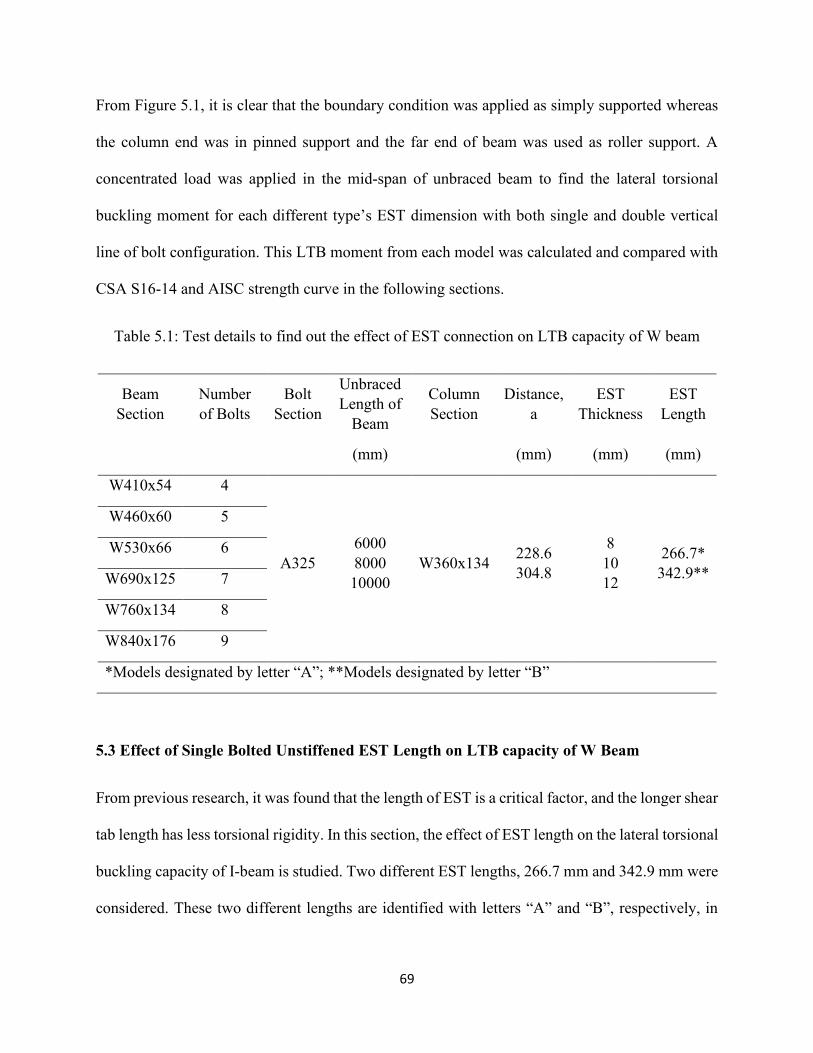
69
From Figure 5.1, it is clear that the boundary condition was applied as simply supported whereas
the column end was in pinned support and the far end of beam was used as roller support. A
concentrated load was applied in the mid-span of unbraced beam to find the lateral torsional
buckling moment for each different type’s EST dimension with both single and double vertical
line of bolt configuration. This LTB moment from each model was calculated and compared with
CSA S16-14 and AISC strength curve in the following sections.
Table 5.1: Test details to find out the effect of EST connection on LTB capacity of W beam
Beam
Section
Number
of Bolts
Bolt
Section
Unbraced
Length of
Beam
Column
Section
Distance,
a
EST
Thickness
EST
Length
(mm) (mm) (mm) (mm)
W410x54 4
A325
6000
8000
10000
W360x134 228.6
304.8
8
10
12
266.7*
342.9**
W460x60 5
W530x66 6
W690x125 7
W760x134 8
W840x176 9
*Models designated by letter “A”; **Models designated by letter “B”
5.3 Effect of Single Bolted Unstiffened EST Length on LTB capacity of W Beam
From previous research, it was found that the length of EST is a critical factor, and the longer shear
tab length has less torsional rigidity. In this section, the effect of EST length on the lateral torsional
buckling capacity of I-beam is studied. Two different EST lengths, 266.7 mm and 342.9 mm were
considered. These two different lengths are identified with letters “A” and “B”, respectively, in
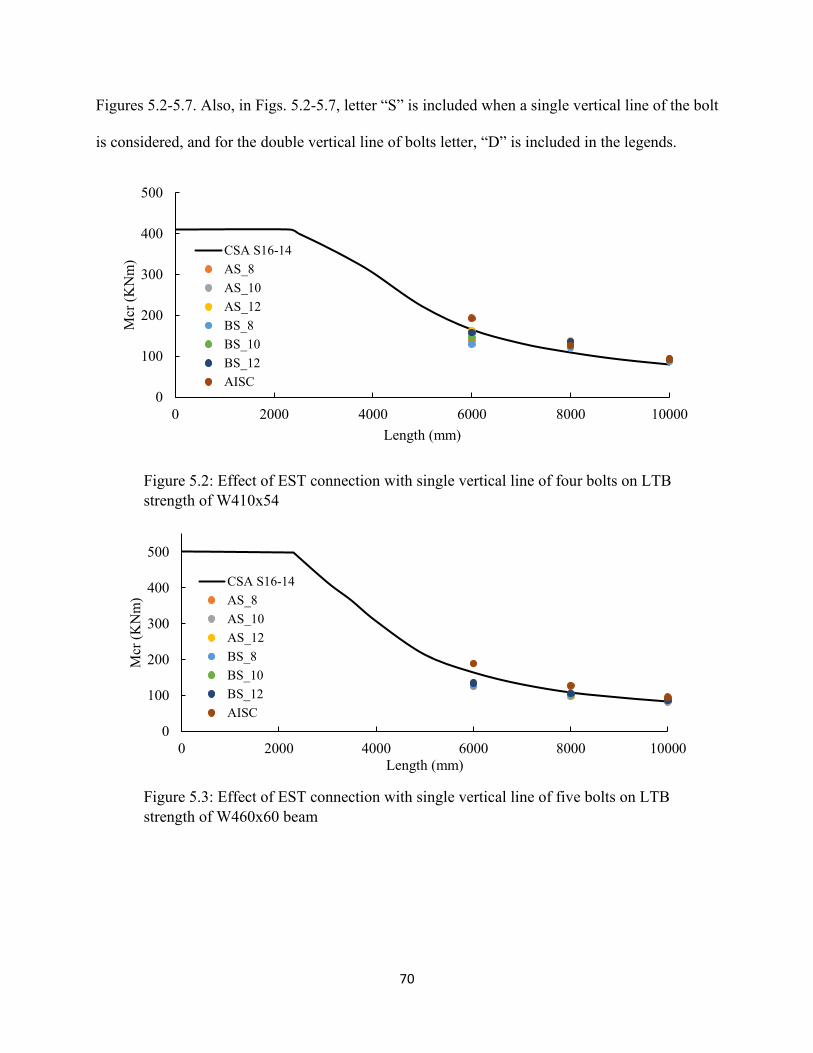
70
Figures 5.2-5.7. Also, in Figs. 5.2-5.7, letter “S” is included when a single vertical line of the bolt
is considered, and for the double vertical line of bolts letter, “D” is included in the legends.
Figure 5.2: Effect of EST connection with single vertical line of four bolts on LTB
strength of W410x54
Figure 5.3: Effect of EST connection with single vertical line of five bolts on LTB
strength of W460x60 beam
0
100
200
300
400
500
0 2000 4000 6000 8000 10000
Mcr
(K
Nm
)
Length (mm)
CSA S16-14
AS_8
AS_10
AS_12
BS_8
BS_10
BS_12
AISC
0
100
200
300
400
500
0 2000 4000 6000 8000 10000
Mcr
(K
Nm
)
Length (mm)
CSA S16-14
AS_8
AS_10
AS_12
BS_8
BS_10
BS_12
AISC
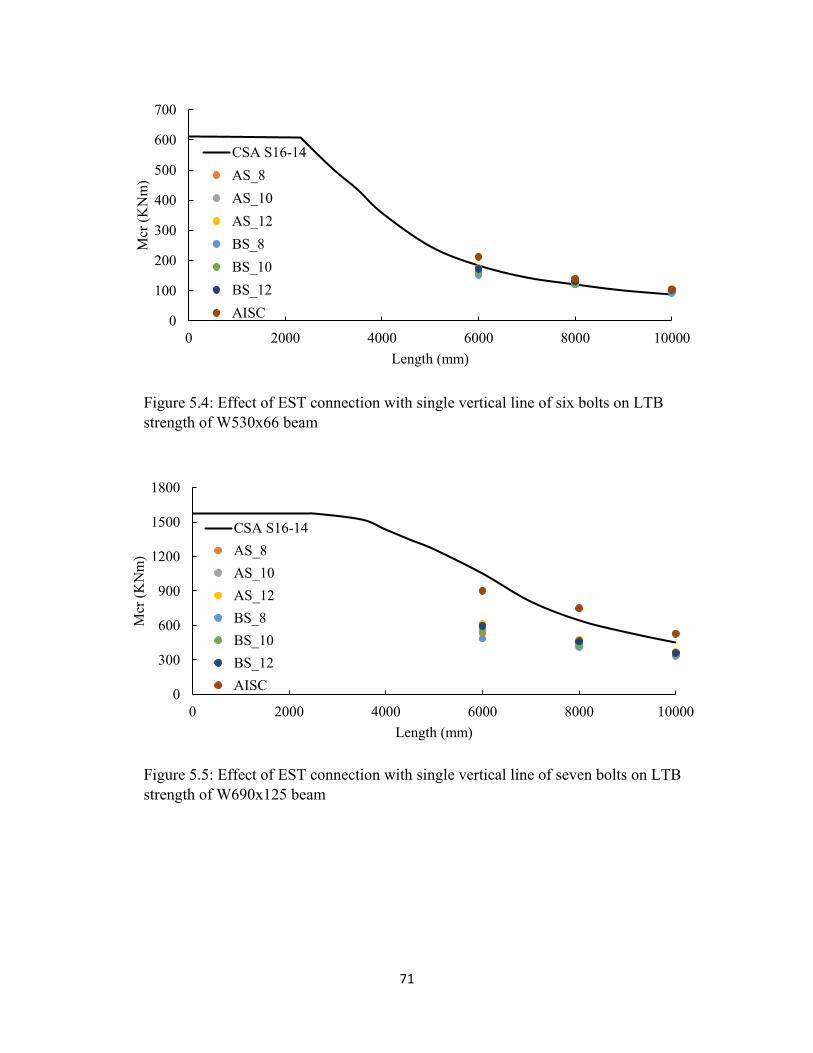
71
Figure 5.4: Effect of EST connection with single vertical line of six bolts on LTB
strength of W530x66 beam
Figure 5.5: Effect of EST connection with single vertical line of seven bolts on LTB
strength of W690x125 beam
0
100
200
300
400
500
600
700
0 2000 4000 6000 8000 10000
Mcr
(K
Nm
)
Length (mm)
CSA S16-14
AS_8
AS_10
AS_12
BS_8
BS_10
BS_12
AISC
0
300
600
900
1200
1500
1800
0 2000 4000 6000 8000 10000
Mcr
(K
Nm
)
Length (mm)
CSA S16-14
AS_8
AS_10
AS_12
BS_8
BS_10
BS_12
AISC
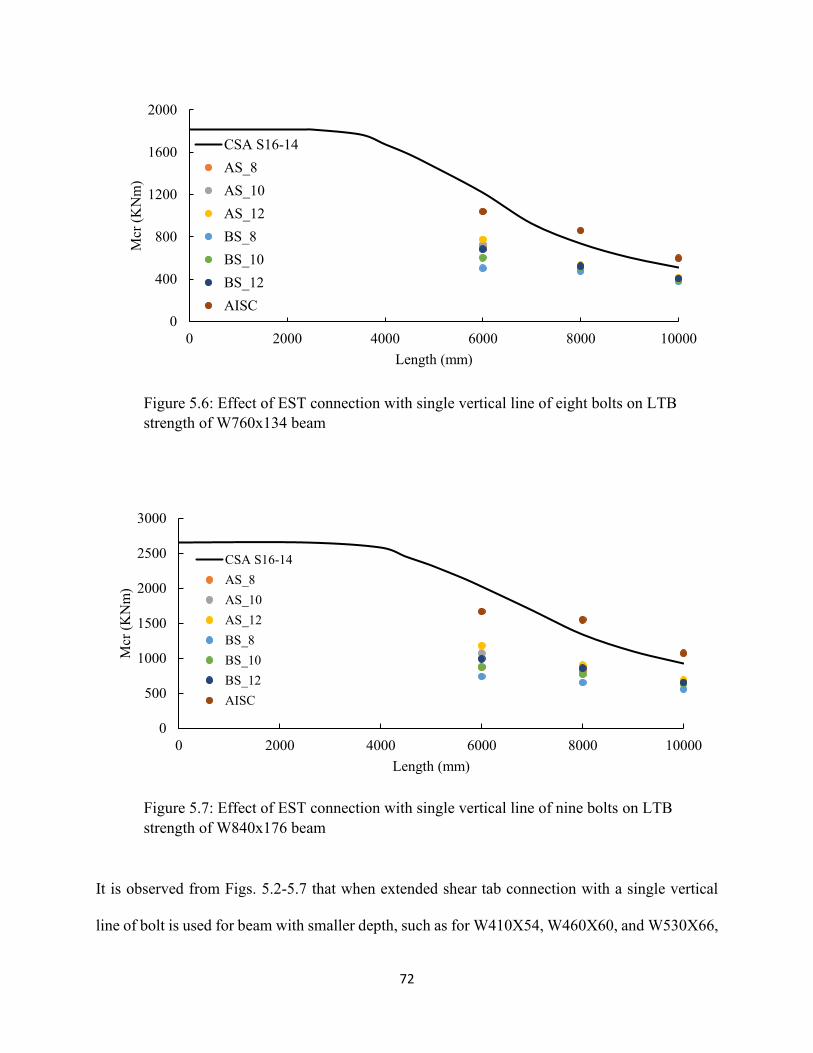
72
Figure 5.6: Effect of EST connection with single vertical line of eight bolts on LTB
strength of W760x134 beam
Figure 5.7: Effect of EST connection with single vertical line of nine bolts on LTB
strength of W840x176 beam
It is observed from Figs. 5.2-5.7 that when extended shear tab connection with a single vertical
line of bolt is used for beam with smaller depth, such as for W410X54, W460X60, and W530X66,
0
400
800
1200
1600
2000
0 2000 4000 6000 8000 10000
Mcr
(K
Nm
)
Length (mm)
CSA S16-14
AS_8
AS_10
AS_12
BS_8
BS_10
BS_12
AISC
0
500
1000
1500
2000
2500
3000
0 2000 4000 6000 8000 10000
Mcr
(K
Nm
)
Length (mm)
CSA S16-14
AS_8
AS_10
AS_12
BS_8
BS_10
BS_12
AISC
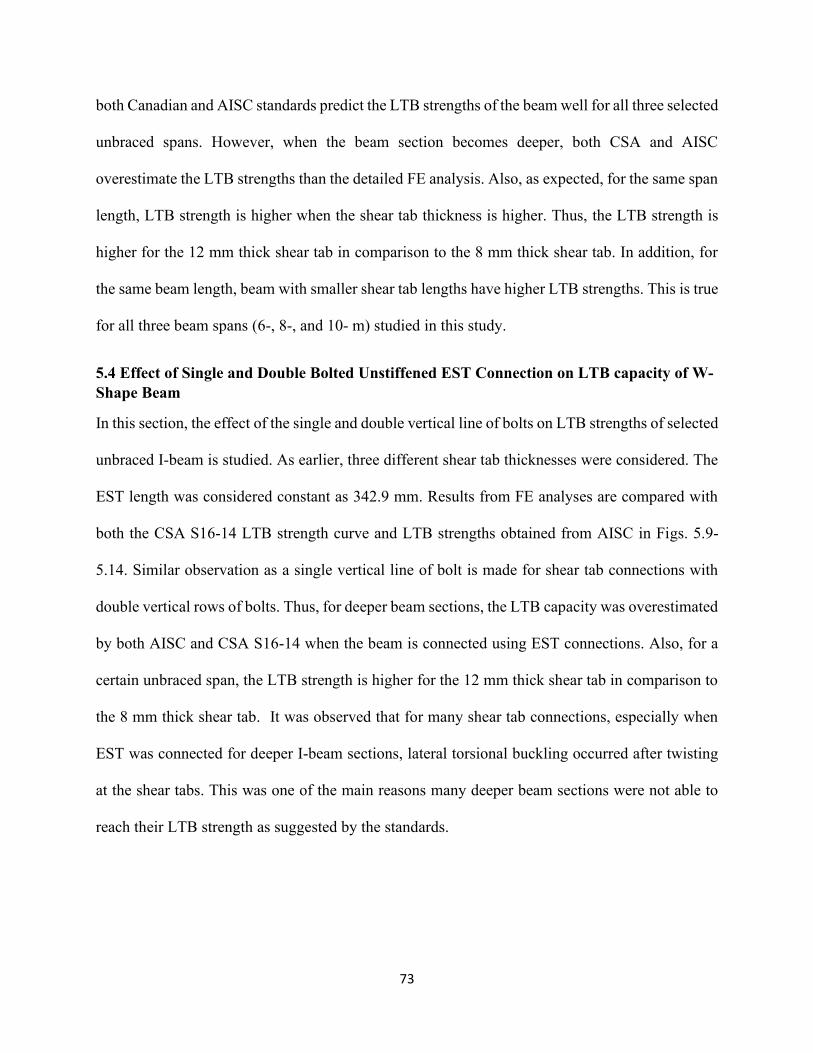
73
both Canadian and AISC standards predict the LTB strengths of the beam well for all three selected
unbraced spans. However, when the beam section becomes deeper, both CSA and AISC
overestimate the LTB strengths than the detailed FE analysis. Also, as expected, for the same span
length, LTB strength is higher when the shear tab thickness is higher. Thus, the LTB strength is
higher for the 12 mm thick shear tab in comparison to the 8 mm thick shear tab. In addition, for
the same beam length, beam with smaller shear tab lengths have higher LTB strengths. This is true
for all three beam spans (6-, 8-, and 10- m) studied in this study.
5.4 Effect of Single and Double Bolted Unstiffened EST Connection on LTB capacity of W-
Shape Beam
In this section, the effect of the single and double vertical line of bolts on LTB strengths of selected
unbraced I-beam is studied. As earlier, three different shear tab thicknesses were considered. The
EST length was considered constant as 342.9 mm. Results from FE analyses are compared with
both the CSA S16-14 LTB strength curve and LTB strengths obtained from AISC in Figs. 5.9-
5.14. Similar observation as a single vertical line of bolt is made for shear tab connections with
double vertical rows of bolts. Thus, for deeper beam sections, the LTB capacity was overestimated
by both AISC and CSA S16-14 when the beam is connected using EST connections. Also, for a
certain unbraced span, the LTB strength is higher for the 12 mm thick shear tab in comparison to
the 8 mm thick shear tab. It was observed that for many shear tab connections, especially when
EST was connected for deeper I-beam sections, lateral torsional buckling occurred after twisting
at the shear tabs. This was one of the main reasons many deeper beam sections were not able to
reach their LTB strength as suggested by the standards.
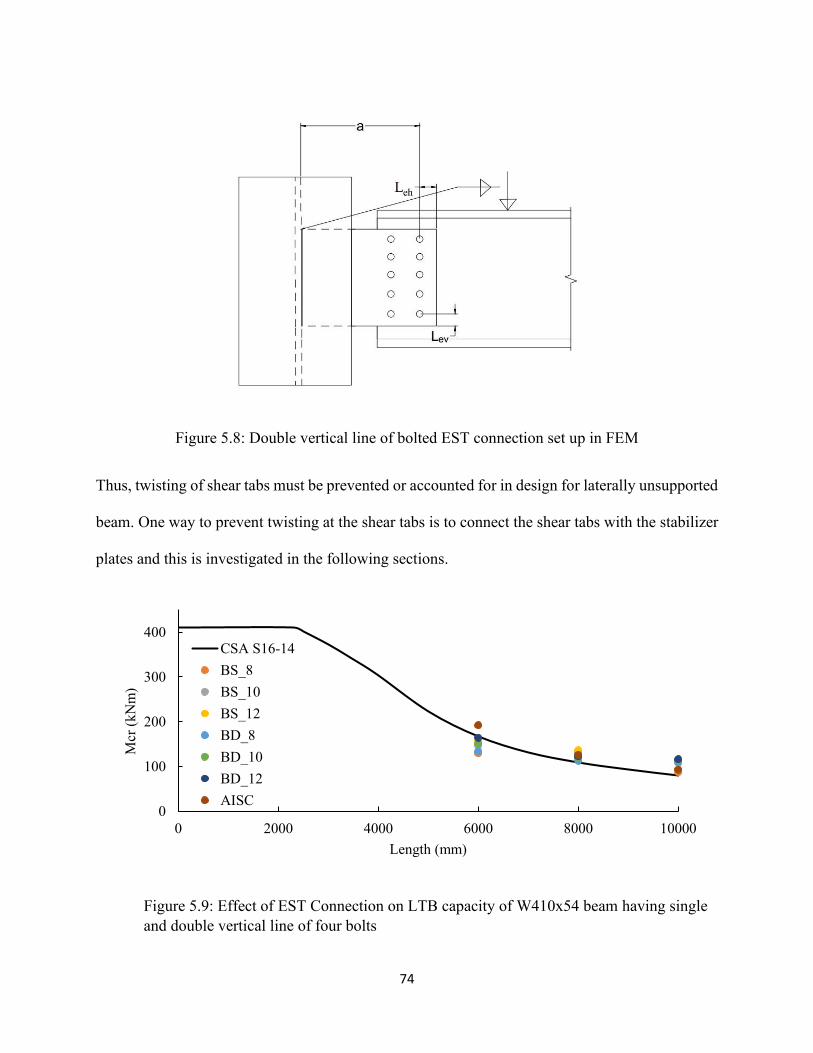
74
Figure 5.8: Double vertical line of bolted EST connection set up in FEM
Thus, twisting of shear tabs must be prevented or accounted for in design for laterally unsupported
beam. One way to prevent twisting at the shear tabs is to connect the shear tabs with the stabilizer
plates and this is investigated in the following sections.
Figure 5.9: Effect of EST Connection on LTB capacity of W410x54 beam having single
and double vertical line of four bolts
0
100
200
300
400
0 2000 4000 6000 8000 10000
Mcr
(kN
m)
Length (mm)
CSA S16-14
BS_8
BS_10
BS_12
BD_8
BD_10
BD_12
AISC
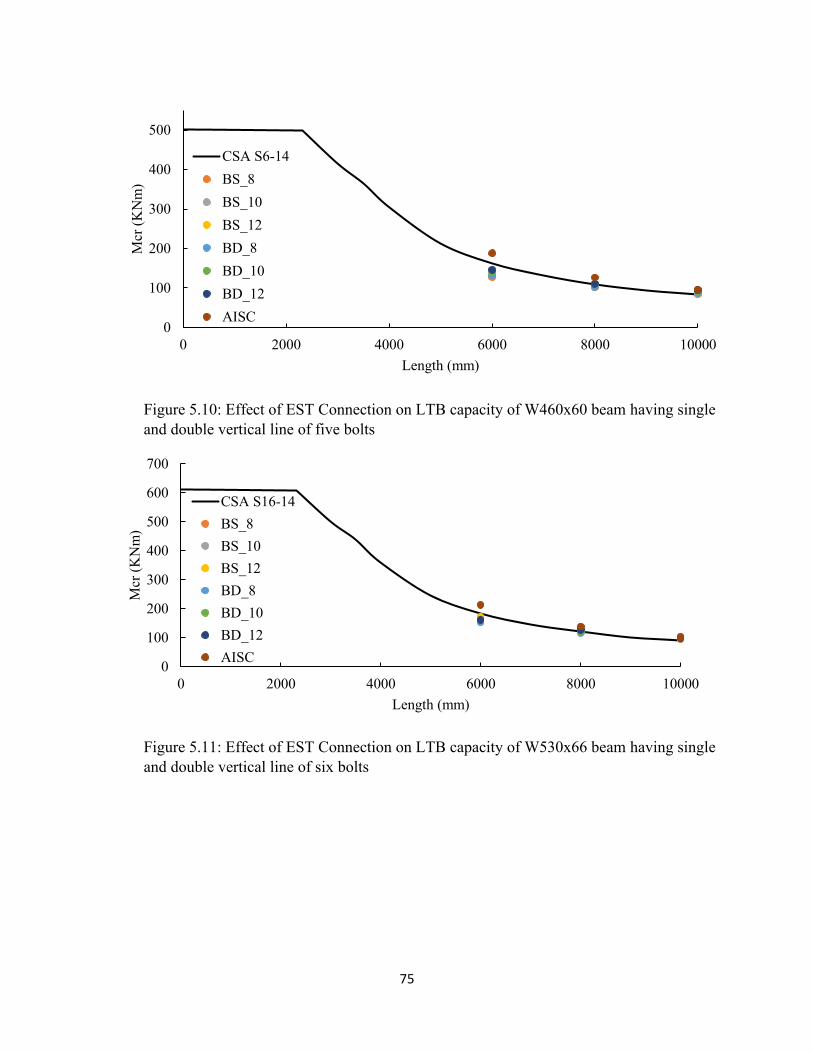
75
Figure 5.10: Effect of EST Connection on LTB capacity of W460x60 beam having single
and double vertical line of five bolts
Figure 5.11: Effect of EST Connection on LTB capacity of W530x66 beam having single
and double vertical line of six bolts
0
100
200
300
400
500
0 2000 4000 6000 8000 10000
Mcr
(K
Nm
)
Length (mm)
CSA S6-14
BS_8
BS_10
BS_12
BD_8
BD_10
BD_12
AISC
0
100
200
300
400
500
600
700
0 2000 4000 6000 8000 10000
Mcr
(K
Nm
)
Length (mm)
CSA S16-14
BS_8
BS_10
BS_12
BD_8
BD_10
BD_12
AISC
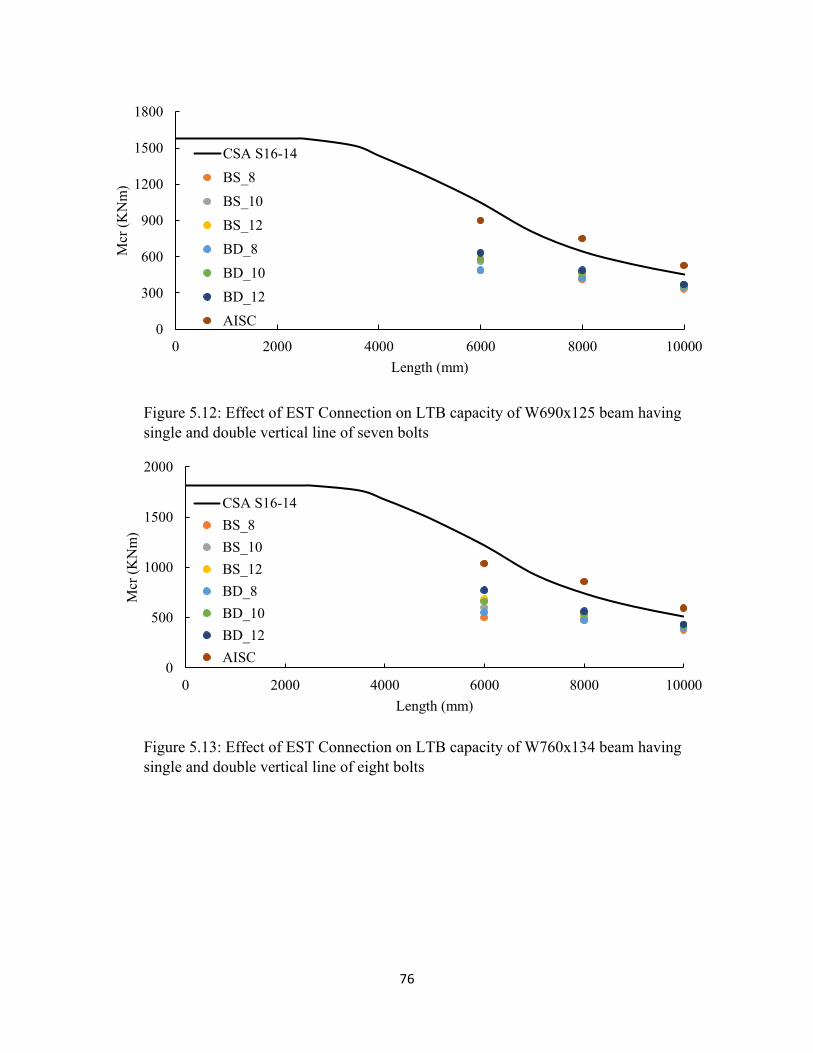
76
Figure 5.12: Effect of EST Connection on LTB capacity of W690x125 beam having
single and double vertical line of seven bolts
Figure 5.13: Effect of EST Connection on LTB capacity of W760x134 beam having
single and double vertical line of eight bolts
0
300
600
900
1200
1500
1800
0 2000 4000 6000 8000 10000
Mcr
(K
Nm
)
Length (mm)
CSA S16-14
BS_8
BS_10
BS_12
BD_8
BD_10
BD_12
AISC
0
500
1000
1500
2000
0 2000 4000 6000 8000 10000
Mcr
(K
Nm
)
Length (mm)
CSA S16-14
BS_8
BS_10
BS_12
BD_8
BD_10
BD_12
AISC
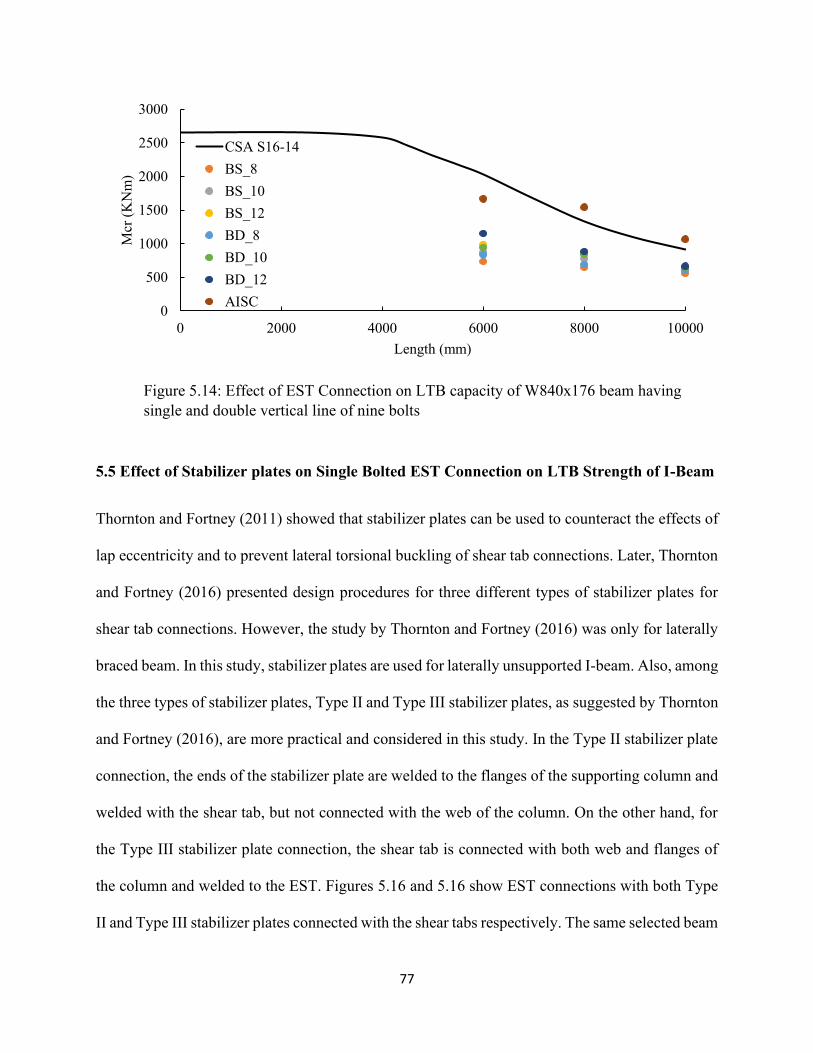
77
Figure 5.14: Effect of EST Connection on LTB capacity of W840x176 beam having
single and double vertical line of nine bolts
5.5 Effect of Stabilizer plates on Single Bolted EST Connection on LTB Strength of I-Beam
Thornton and Fortney (2011) showed that stabilizer plates can be used to counteract the effects of
lap eccentricity and to prevent lateral torsional buckling of shear tab connections. Later, Thornton
and Fortney (2016) presented design procedures for three different types of stabilizer plates for
shear tab connections. However, the study by Thornton and Fortney (2016) was only for laterally
braced beam. In this study, stabilizer plates are used for laterally unsupported I-beam. Also, among
the three types of stabilizer plates, Type II and Type III stabilizer plates, as suggested by Thornton
and Fortney (2016), are more practical and considered in this study. In the Type II stabilizer plate
connection, the ends of the stabilizer plate are welded to the flanges of the supporting column and
welded with the shear tab, but not connected with the web of the column. On the other hand, for
the Type III stabilizer plate connection, the shear tab is connected with both web and flanges of
the column and welded to the EST. Figures 5.16 and 5.16 show EST connections with both Type
II and Type III stabilizer plates connected with the shear tabs respectively. The same selected beam
0
500
1000
1500
2000
2500
3000
0 2000 4000 6000 8000 10000
Mcr
(K
Nm
)
Length (mm)
CSA S16-14
BS_8
BS_10
BS_12
BD_8
BD_10
BD_12
AISC
78
sections, as presented in Table 5.1, were re-analyzed with EST connections with Type II and Type
III stabilizer plates. Figures 5.17-5.22 compare the LTB capacities of the six selected beam for
unstiffened and stiffened EST connections (with Type II and Type III stabilizer plates). Results
for the beam with only a single vertical line of bolt are only presented in this section. In Figs.
5.16-5.21, A_U and B_U cases represent unstiffened EST connections with two different shear tab
lengths. Also, S2 and S3 represent cases with Type II and Type III stabilizer plates. It is observed
from Fig. 5.17-5.22 that stabilizer plates in the EST connections significantly increase the LTB
capacity of laterally unsupported beam. The LTB strength from Figures 5.17 - 5.19 for the 8 and
10m laterally unsupported beam was very close to the Canadian standard curve and for the 6m,
the strength was approximately 15% less than the standard. The effect of stabilizer plate was
insignificant in both 8- and 10m beam while, the strength increases in 6m, but still, it is lower from
the CSA S16-14 curve. Next, the capacity was always low in every laterally unsupported beam
W690x125, W760x134, and W840x176. This is clear in Figs. 5.19-5.22, where the LTB strength
for laterally unsupported W690x125, W760x134, and W840x176 beam is increased by more than
50% for 12-in shear tab connection with the stabilizer plate. However, the stabilized EST
connection was much lower than the CSA S16-14 curve. It is also observed that the difference
between LTB strengths for unsupported beam with both Type II and Type III stabilizer plate
connections is less than 5%.
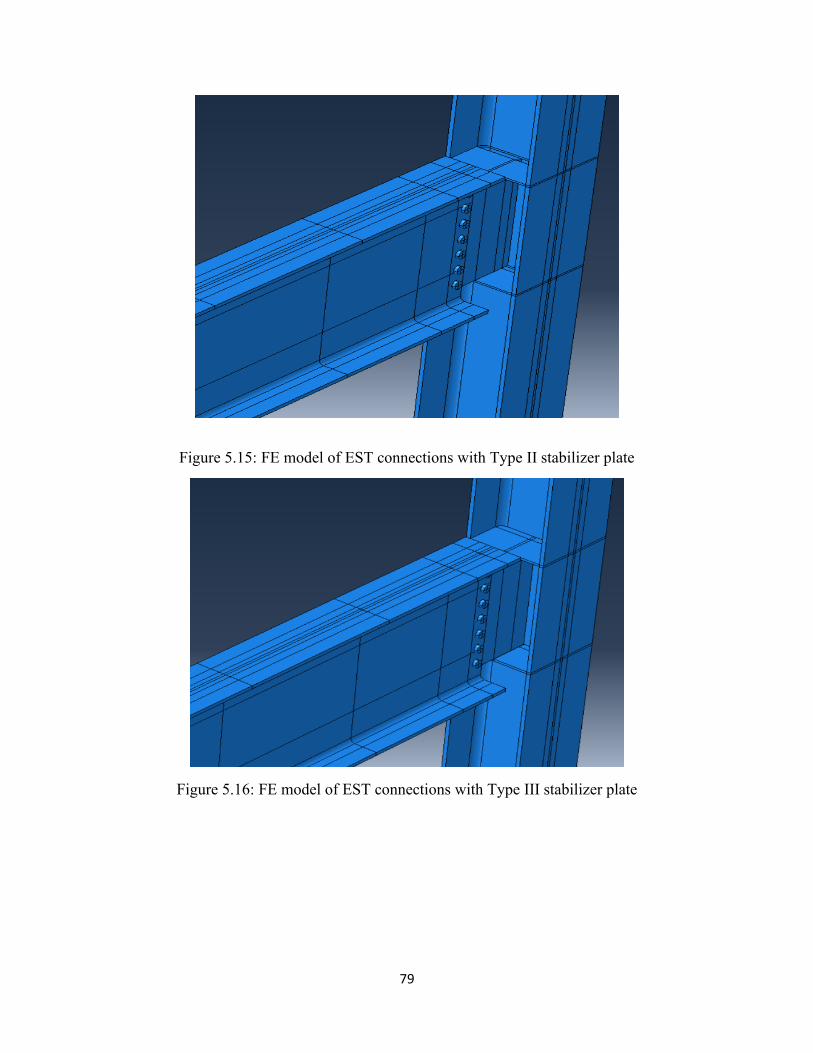
79
Figure 5.15: FE model of EST connections with Type II stabilizer plate
Figure 5.16: FE model of EST connections with Type III stabilizer plate
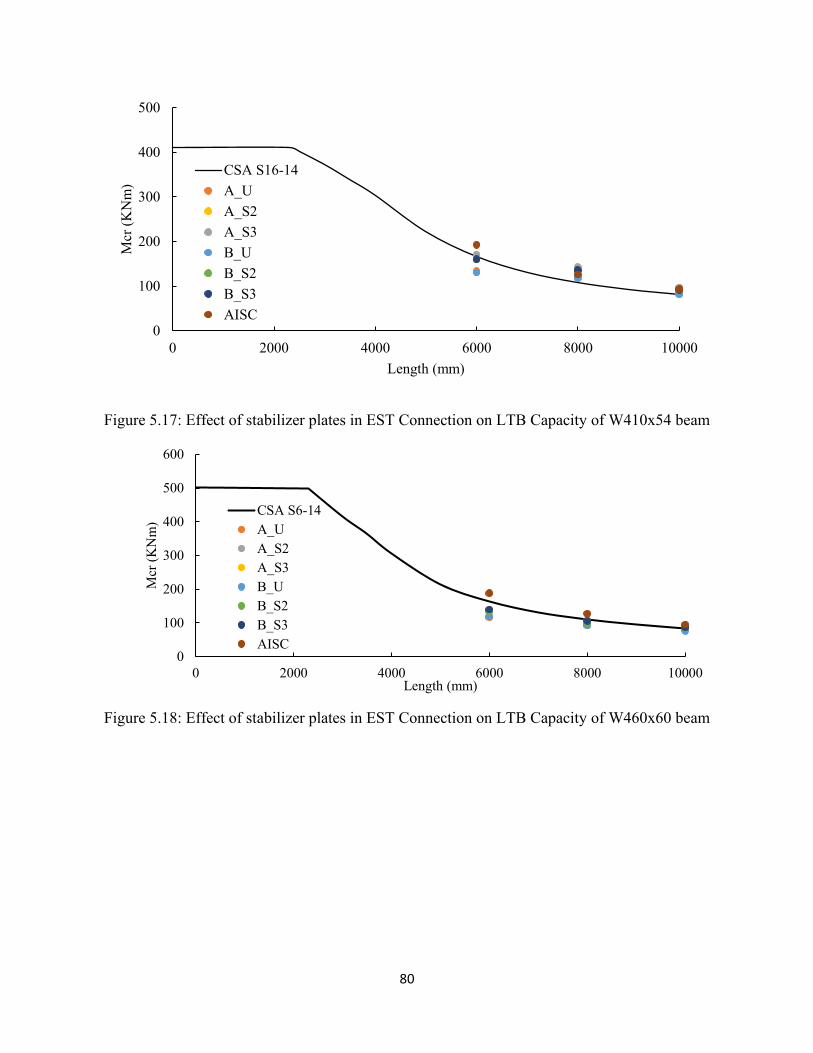
80
Figure 5.17: Effect of stabilizer plates in EST Connection on LTB Capacity of W410x54 beam
Figure 5.18: Effect of stabilizer plates in EST Connection on LTB Capacity of W460x60 beam
0
100
200
300
400
500
0 2000 4000 6000 8000 10000
Mcr
(K
Nm
)
Length (mm)
CSA S16-14
A_U
A_S2
A_S3
B_U
B_S2
B_S3
AISC
0
100
200
300
400
500
600
0 2000 4000 6000 8000 10000
Mcr
(K
Nm
)
Length (mm)
CSA S6-14
A_U
A_S2
A_S3
B_U
B_S2
B_S3
AISC
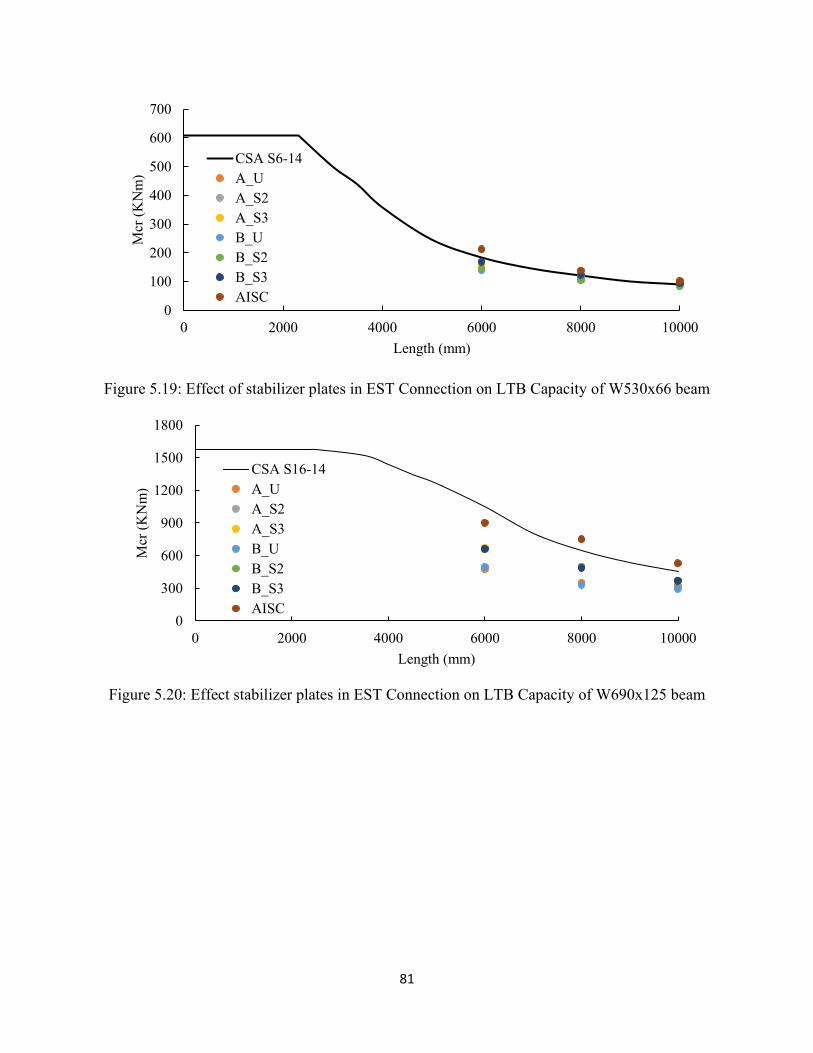
81
Figure 5.19: Effect of stabilizer plates in EST Connection on LTB Capacity of W530x66 beam
Figure 5.20: Effect stabilizer plates in EST Connection on LTB Capacity of W690x125 beam
0
100
200
300
400
500
600
700
0 2000 4000 6000 8000 10000
Mcr
(K
Nm
)
Length (mm)
CSA S6-14
A_U
A_S2
A_S3
B_U
B_S2
B_S3
AISC
0
300
600
900
1200
1500
1800
0 2000 4000 6000 8000 10000
Mcr
(K
Nm
)
Length (mm)
CSA S16-14
A_U
A_S2
A_S3
B_U
B_S2
B_S3
AISC
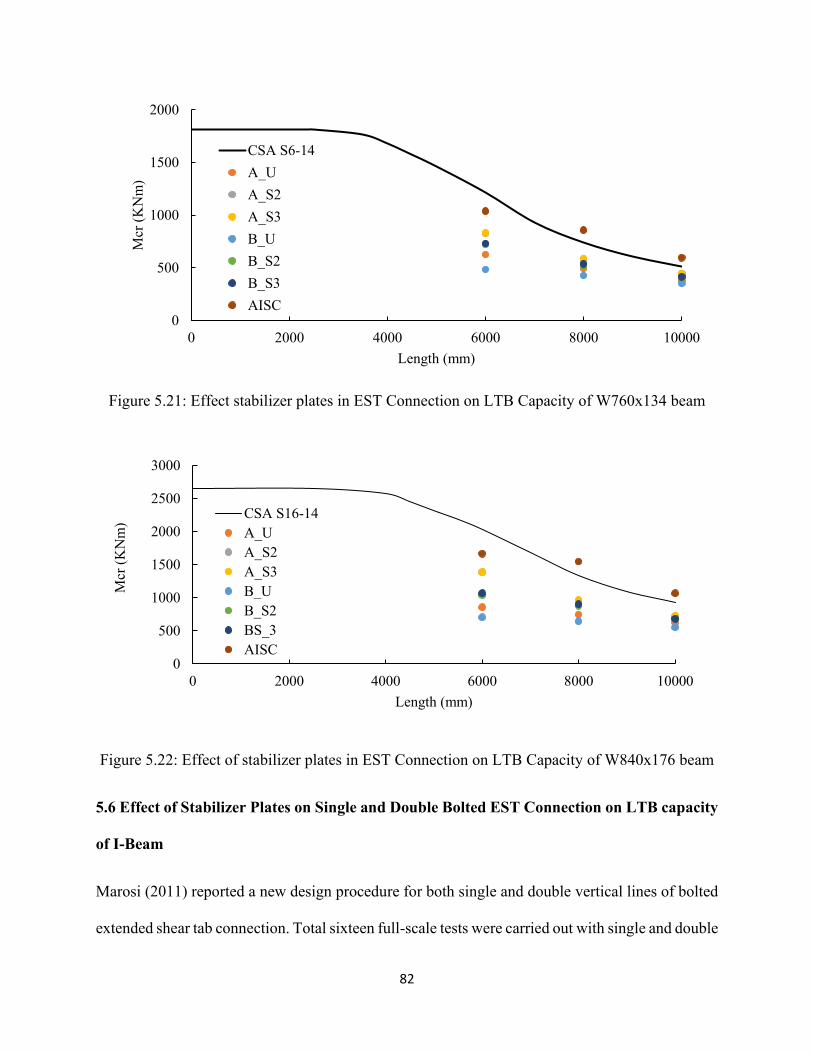
82
Figure 5.21: Effect stabilizer plates in EST Connection on LTB Capacity of W760x134 beam
Figure 5.22: Effect of stabilizer plates in EST Connection on LTB Capacity of W840x176 beam
5.6 Effect of Stabilizer Plates on Single and Double Bolted EST Connection on LTB capacity
of I-Beam
Marosi (2011) reported a new design procedure for both single and double vertical lines of bolted
extended shear tab connection. Total sixteen full-scale tests were carried out with single and double
0
500
1000
1500
2000
0 2000 4000 6000 8000 10000
Mcr
(K
Nm
)
Length (mm)
CSA S6-14
A_U
A_S2
A_S3
B_U
B_S2
B_S3
AISC
0
500
1000
1500
2000
2500
3000
0 2000 4000 6000 8000 10000
Mcr
(K
Nm
)
Length (mm)
CSA S16-14
A_U
A_S2
A_S3
B_U
B_S2
BS_3
AISC
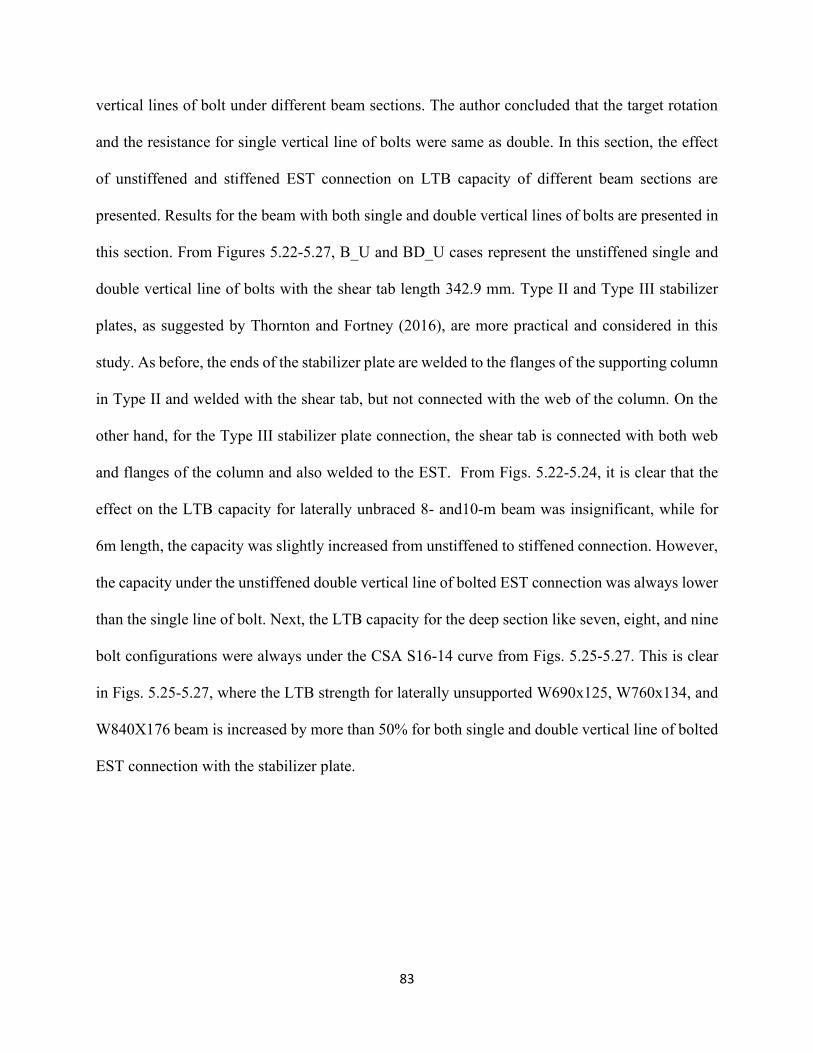
83
vertical lines of bolt under different beam sections. The author concluded that the target rotation
and the resistance for single vertical line of bolts were same as double. In this section, the effect
of unstiffened and stiffened EST connection on LTB capacity of different beam sections are
presented. Results for the beam with both single and double vertical lines of bolts are presented in
this section. From Figures 5.22-5.27, B_U and BD_U cases represent the unstiffened single and
double vertical line of bolts with the shear tab length 342.9 mm. Type II and Type III stabilizer
plates, as suggested by Thornton and Fortney (2016), are more practical and considered in this
study. As before, the ends of the stabilizer plate are welded to the flanges of the supporting column
in Type II and welded with the shear tab, but not connected with the web of the column. On the
other hand, for the Type III stabilizer plate connection, the shear tab is connected with both web
and flanges of the column and also welded to the EST. From Figs. 5.22-5.24, it is clear that the
effect on the LTB capacity for laterally unbraced 8- and10-m beam was insignificant, while for
6m length, the capacity was slightly increased from unstiffened to stiffened connection. However,
the capacity under the unstiffened double vertical line of bolted EST connection was always lower
than the single line of bolt. Next, the LTB capacity for the deep section like seven, eight, and nine
bolt configurations were always under the CSA S16-14 curve from Figs. 5.25-5.27. This is clear
in Figs. 5.25-5.27, where the LTB strength for laterally unsupported W690x125, W760x134, and
W840X176 beam is increased by more than 50% for both single and double vertical line of bolted
EST connection with the stabilizer plate.
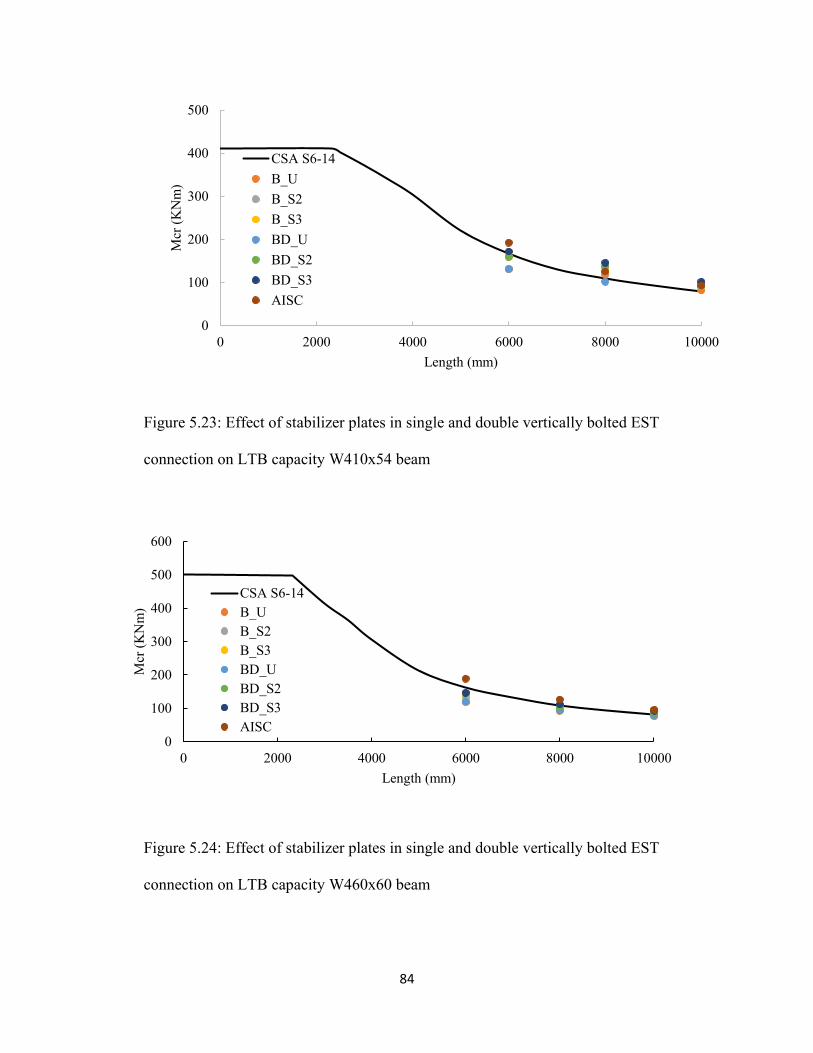
84
Figure 5.23: Effect of stabilizer plates in single and double vertically bolted EST
connection on LTB capacity W410x54 beam
Figure 5.24: Effect of stabilizer plates in single and double vertically bolted EST
connection on LTB capacity W460x60 beam
0
100
200
300
400
500
0 2000 4000 6000 8000 10000
Mcr
(K
Nm
)
Length (mm)
CSA S6-14
B_U
B_S2
B_S3
BD_U
BD_S2
BD_S3
AISC
0
100
200
300
400
500
600
0 2000 4000 6000 8000 10000
Mcr
(K
Nm
)
Length (mm)
CSA S6-14
B_U
B_S2
B_S3
BD_U
BD_S2
BD_S3
AISC
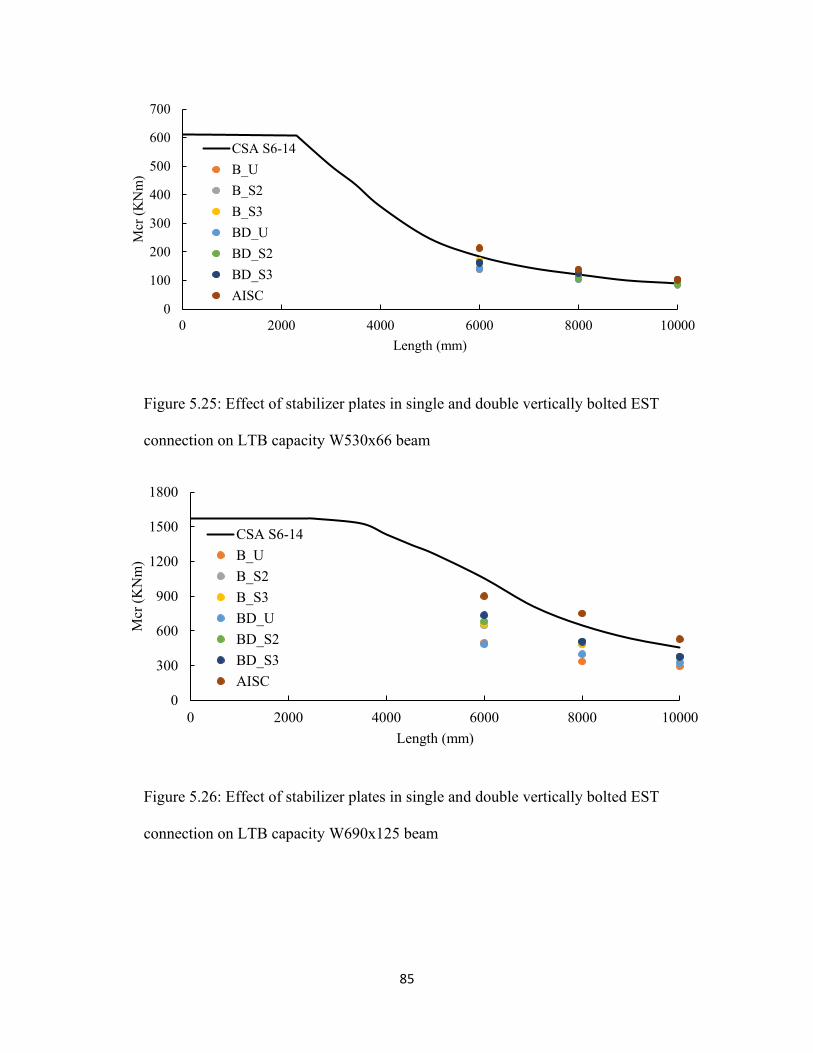
85
Figure 5.25: Effect of stabilizer plates in single and double vertically bolted EST
connection on LTB capacity W530x66 beam
Figure 5.26: Effect of stabilizer plates in single and double vertically bolted EST
connection on LTB capacity W690x125 beam
0
100
200
300
400
500
600
700
0 2000 4000 6000 8000 10000
Mcr
(K
Nm
)
Length (mm)
CSA S6-14
B_U
B_S2
B_S3
BD_U
BD_S2
BD_S3
AISC
0
300
600
900
1200
1500
1800
0 2000 4000 6000 8000 10000
Mcr
(K
Nm
)
Length (mm)
CSA S6-14
B_U
B_S2
B_S3
BD_U
BD_S2
BD_S3
AISC
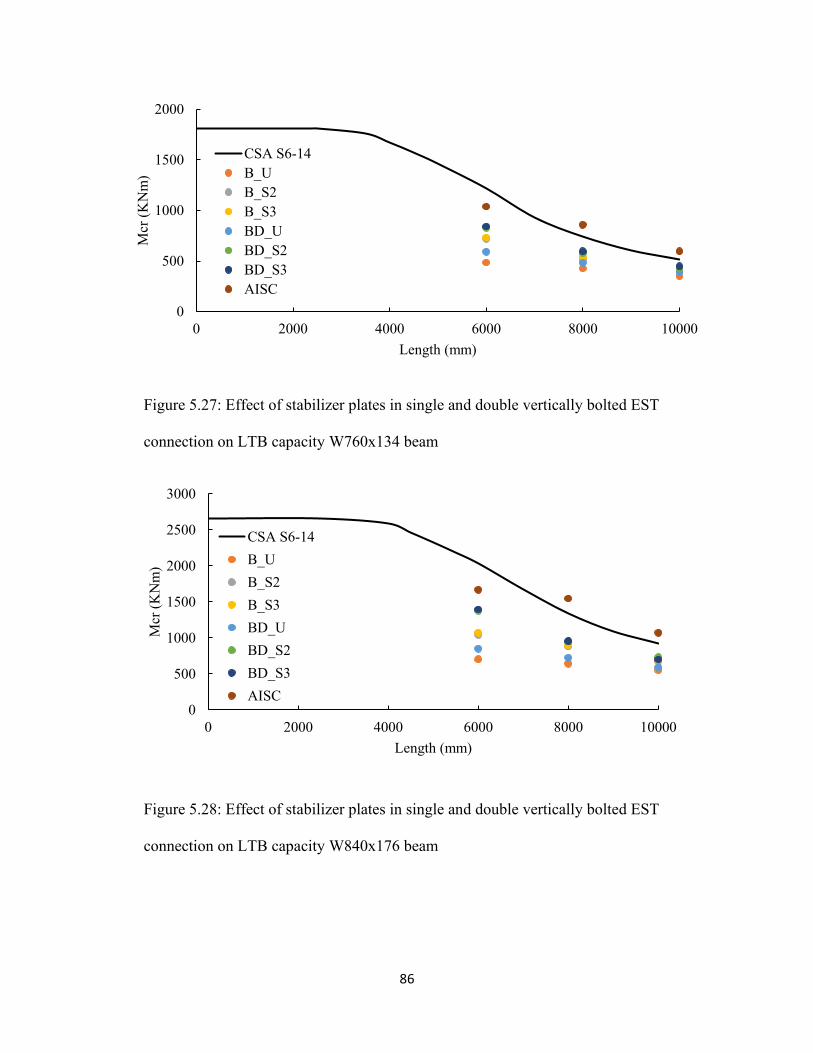
86
Figure 5.27: Effect of stabilizer plates in single and double vertically bolted EST
connection on LTB capacity W760x134 beam
Figure 5.28: Effect of stabilizer plates in single and double vertically bolted EST
connection on LTB capacity W840x176 beam
0
500
1000
1500
2000
0 2000 4000 6000 8000 10000
Mcr
(K
Nm
)
Length (mm)
CSA S6-14
B_U
B_S2
B_S3
BD_U
BD_S2
BD_S3
AISC
0
500
1000
1500
2000
2500
3000
0 2000 4000 6000 8000 10000
Mcr
(K
Nm
)
Length (mm)
CSA S6-14
B_U
B_S2
B_S3
BD_U
BD_S2
BD_S3
AISC
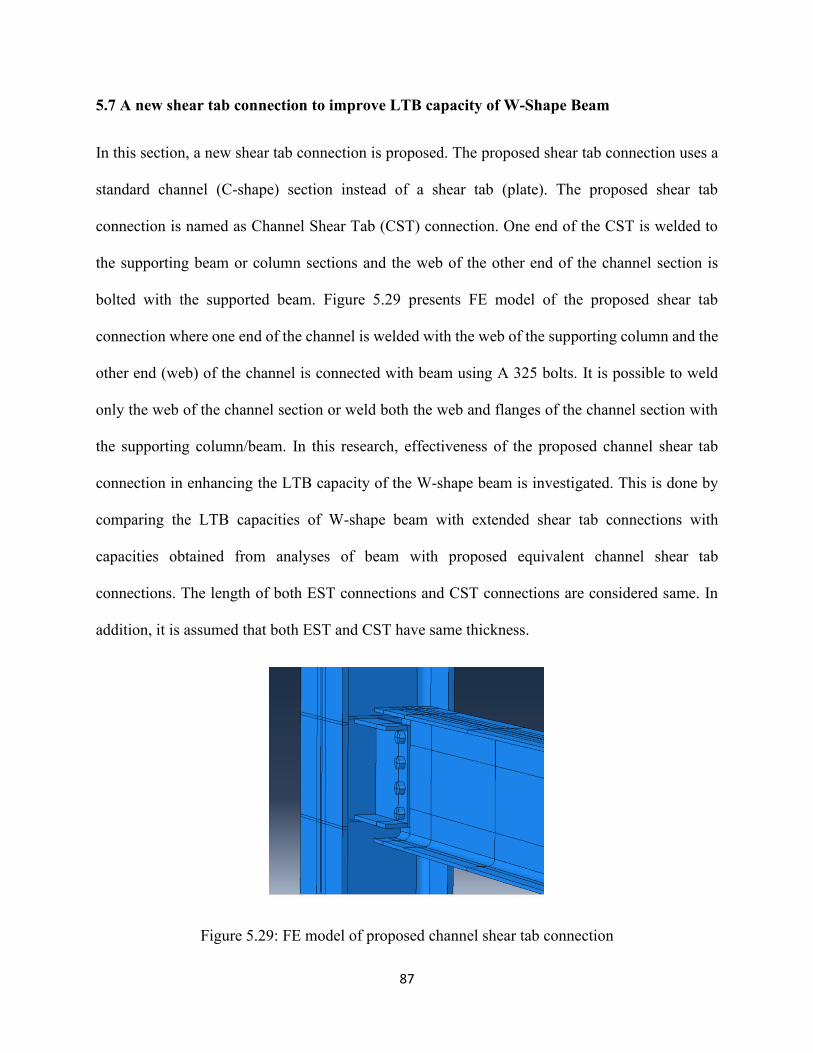
87
5.7 A new shear tab connection to improve LTB capacity of W-Shape Beam
In this section, a new shear tab connection is proposed. The proposed shear tab connection uses a
standard channel (C-shape) section instead of a shear tab (plate). The proposed shear tab
connection is named as Channel Shear Tab (CST) connection. One end of the CST is welded to
the supporting beam or column sections and the web of the other end of the channel section is
bolted with the supported beam. Figure 5.29 presents FE model of the proposed shear tab
connection where one end of the channel is welded with the web of the supporting column and the
other end (web) of the channel is connected with beam using A 325 bolts. It is possible to weld
only the web of the channel section or weld both the web and flanges of the channel section with
the supporting column/beam. In this research, effectiveness of the proposed channel shear tab
connection in enhancing the LTB capacity of the W-shape beam is investigated. This is done by
comparing the LTB capacities of W-shape beam with extended shear tab connections with
capacities obtained from analyses of beam with proposed equivalent channel shear tab
connections. The length of both EST connections and CST connections are considered same. In
addition, it is assumed that both EST and CST have same thickness.
Figure 5.29: FE model of proposed channel shear tab connection
88
Table 5.2 presents the details of the selected channel shear tab connection. Because of the
limitation of the availability of standard channel sections, only three different beam sections from
Table 5.1 are selected to study the effectiveness of the channel sections. The selected standard
channel sections have same depths as the shear tab depths used in Table 5.1. Tables 5.3-5.5
compare lateral torsional buckling capacities of W410x54, W460x60, and W530x66 beam sections
with channel shear tab connections against the LTB capacities of the selected beam with
unstiffened EST connections. As presented in Tables 5.3-5.5, the analyses are done for three
different shear tab thicknesses. In addition, for channel shear tab connections, two cases were
considered: (1) when only the web of the channel is welded to the column, and (2) when both web
and flanges of the channel are welded to the column. Figure 5.30 compares LTB capacities of
W410x54 beam with unstiffened EST and channel shear tab connections. Figure 5.31 compares
LTB capacities of W460x60 beam with unstiffened EST and channel shear tab connections.
Comparison of LTB capacities for W530x66 beam with unstiffened EST and channel shear tab
connections is presented in Figure 5.32. It is observed from Tables 5.3-5.5 and Figures 5.30-5.32
that channel shear tab connections can effectively increase the LTB strengths of laterally
unsupported beam when compared to extended shear tab connections. Also, the increase in LTB
capacity is higher when both the web and flange of the channel sections are welded with the
column. In addition, as expected, the LTB strengths increase as the thickness of the shear tab
increases. Thus, the channel shear tab section can be used for steel construction.
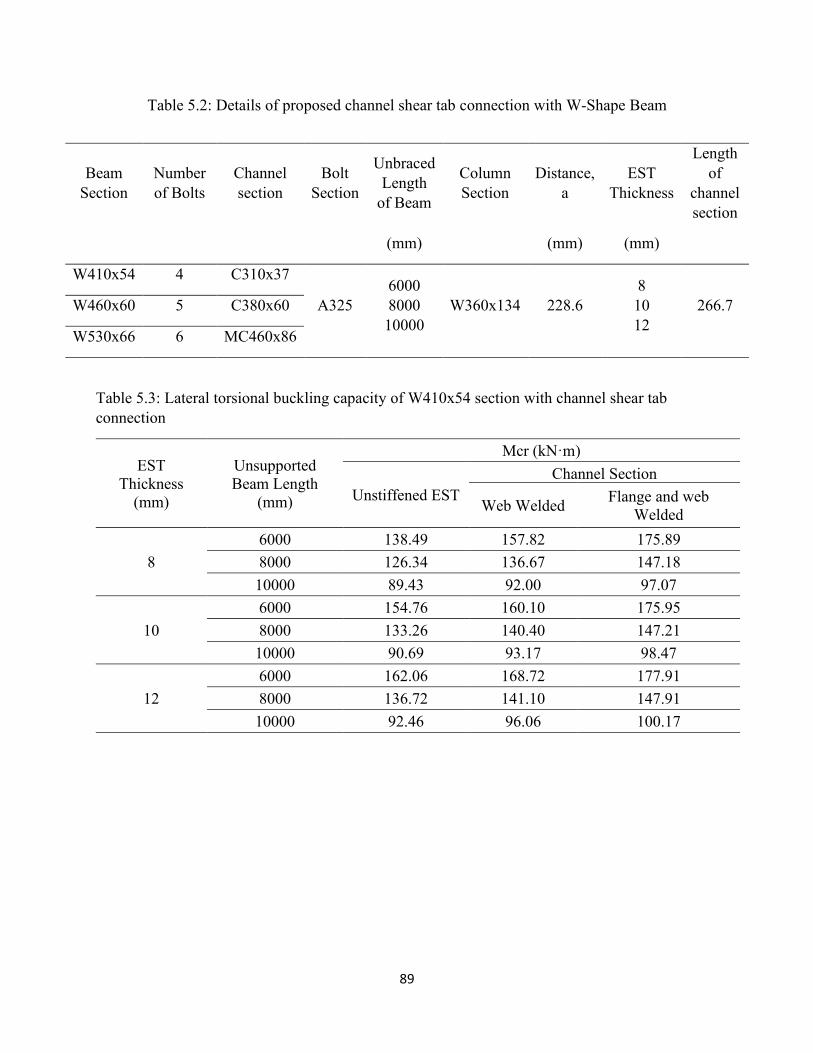
89
Table 5.2: Details of proposed channel shear tab connection with W-Shape Beam
Beam
Section
Number
of Bolts
Channel
section
Bolt
Section
Unbraced
Length
of Beam
Column
Section
Distance,
a
EST
Thickness
Length
of
channel
section
(mm) (mm) (mm)
W410x54 4 C310x37
A325
6000
8000
10000
W360x134 228.6
8
10
12
266.7 W460x60 5 C380x60
W530x66 6 MC460x86
Table 5.3: Lateral torsional buckling capacity of W410x54 section with channel shear tab
connection
EST
Thickness
(mm)
Unsupported
Beam Length
(mm)
Mcr (kN·m)
Unstiffened EST
Channel Section
Web Welded Flange and web
Welded
8
6000 138.49 157.82 175.89
8000 126.34 136.67 147.18
10000 89.43 92.00 97.07
10
6000 154.76 160.10 175.95
8000 133.26 140.40 147.21
10000 90.69 93.17 98.47
12
6000 162.06 168.72 177.91
8000 136.72 141.10 147.91
10000 92.46 96.06 100.17
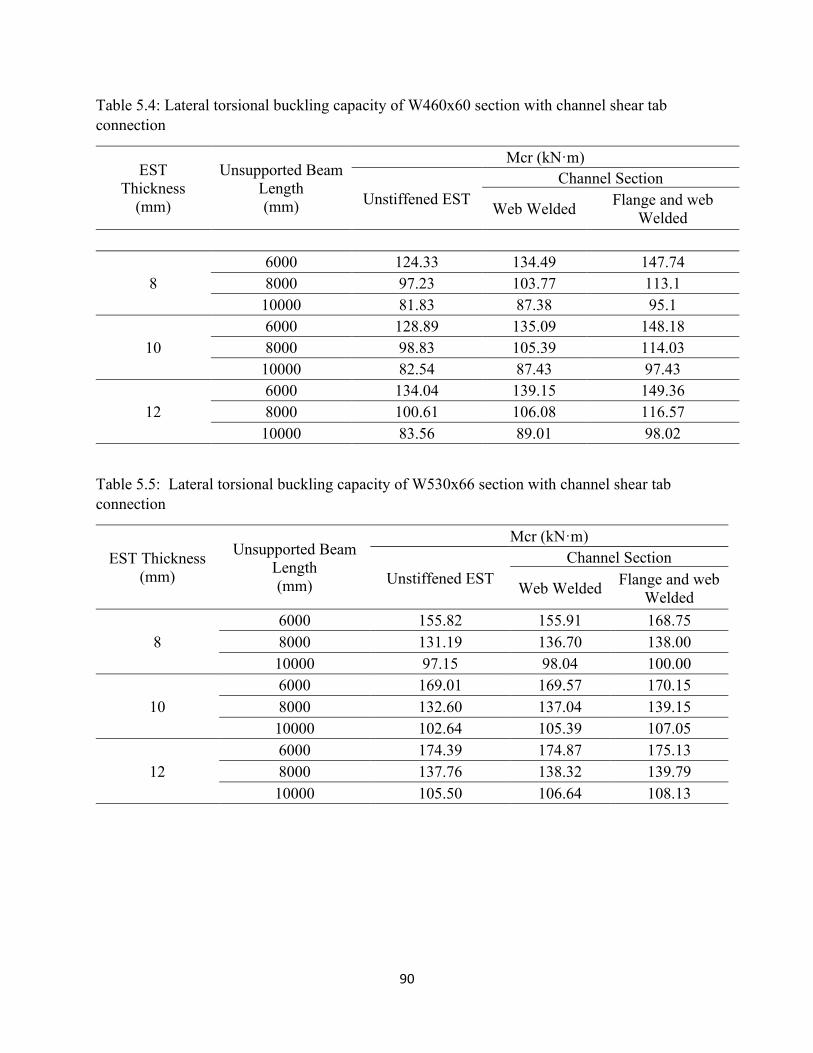
90
Table 5.4: Lateral torsional buckling capacity of W460x60 section with channel shear tab
connection
EST
Thickness
(mm)
Unsupported Beam
Length
(mm)
Mcr (kN·m)
Unstiffened EST
Channel Section
Web Welded Flange and web
Welded
8
6000 124.33 134.49 147.74
8000 97.23 103.77 113.1
10000 81.83 87.38 95.1
10
6000 128.89 135.09 148.18
8000 98.83 105.39 114.03
10000 82.54 87.43 97.43
12
6000 134.04 139.15 149.36
8000 100.61 106.08 116.57
10000 83.56 89.01 98.02
Table 5.5: Lateral torsional buckling capacity of W530x66 section with channel shear tab
connection
EST Thickness
(mm)
Unsupported Beam
Length
(mm)
Mcr (kN·m)
Unstiffened EST
Channel Section
Web Welded Flange and web
Welded
8
6000 155.82 155.91 168.75
8000 131.19 136.70 138.00
10000 97.15 98.04 100.00
10
6000 169.01 169.57 170.15
8000 132.60 137.04 139.15
10000 102.64 105.39 107.05
12
6000 174.39 174.87 175.13
8000 137.76 138.32 139.79
10000 105.50 106.64 108.13
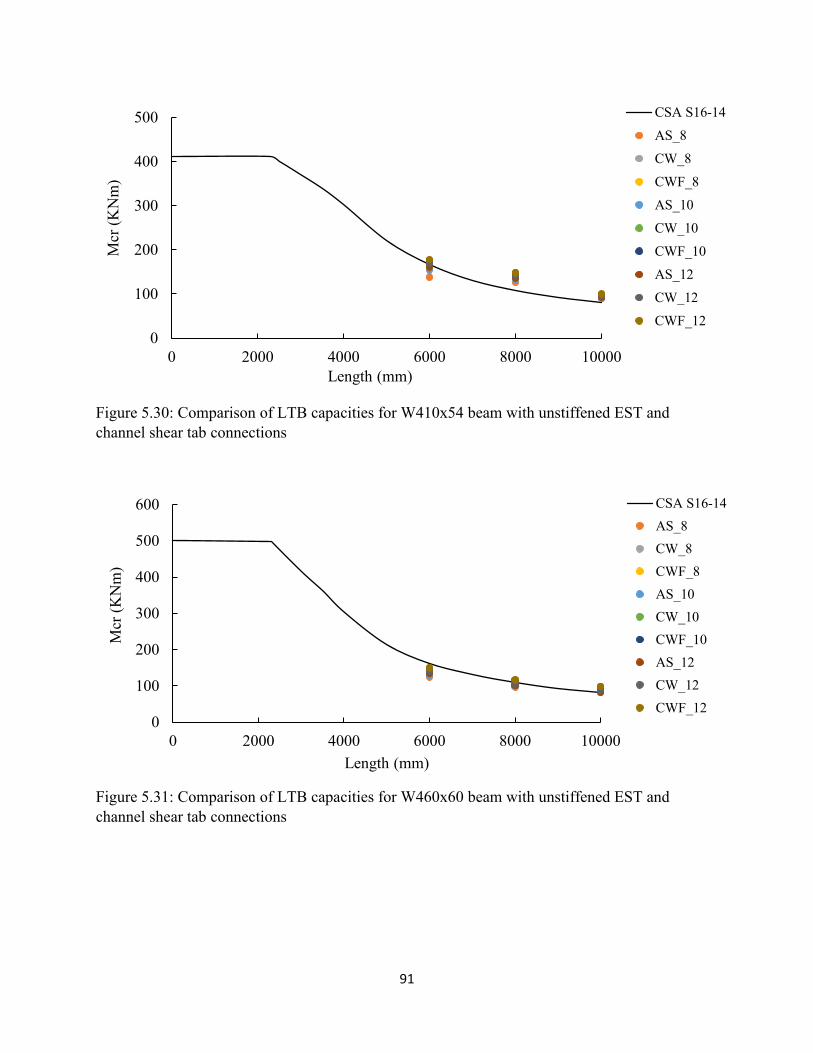
91
Figure 5.30: Comparison of LTB capacities for W410x54 beam with unstiffened EST and
channel shear tab connections
Figure 5.31: Comparison of LTB capacities for W460x60 beam with unstiffened EST and
channel shear tab connections
0
100
200
300
400
500
0 2000 4000 6000 8000 10000
Mcr
(K
Nm
)
Length (mm)
CSA S16-14
AS_8
CW_8
CWF_8
AS_10
CW_10
CWF_10
AS_12
CW_12
CWF_12
0
100
200
300
400
500
600
0 2000 4000 6000 8000 10000
Mcr
(K
Nm
)
Length (mm)
CSA S16-14
AS_8
CW_8
CWF_8
AS_10
CW_10
CWF_10
AS_12
CW_12
CWF_12
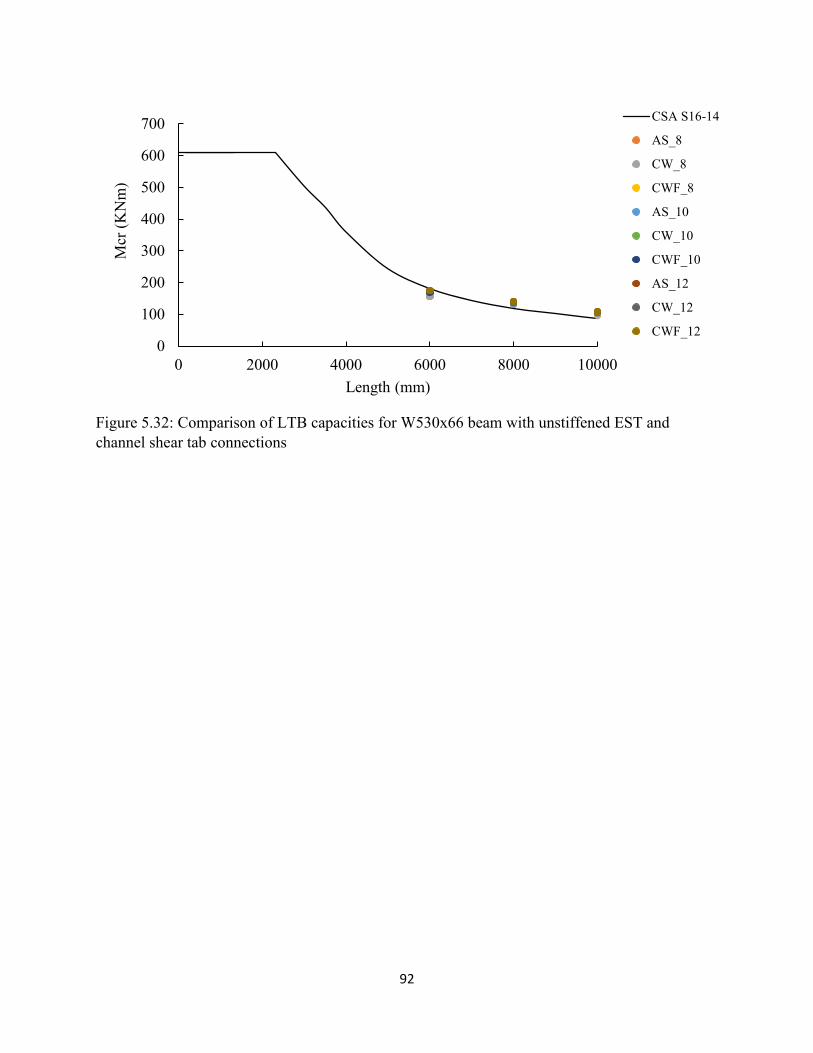
92
Figure 5.32: Comparison of LTB capacities for W530x66 beam with unstiffened EST and
channel shear tab connections
0
100
200
300
400
500
600
700
0 2000 4000 6000 8000 10000
Mcr
(K
Nm
)
Length (mm)
CSA S16-14
AS_8
CW_8
CWF_8
AS_10
CW_10
CWF_10
AS_12
CW_12
CWF_12
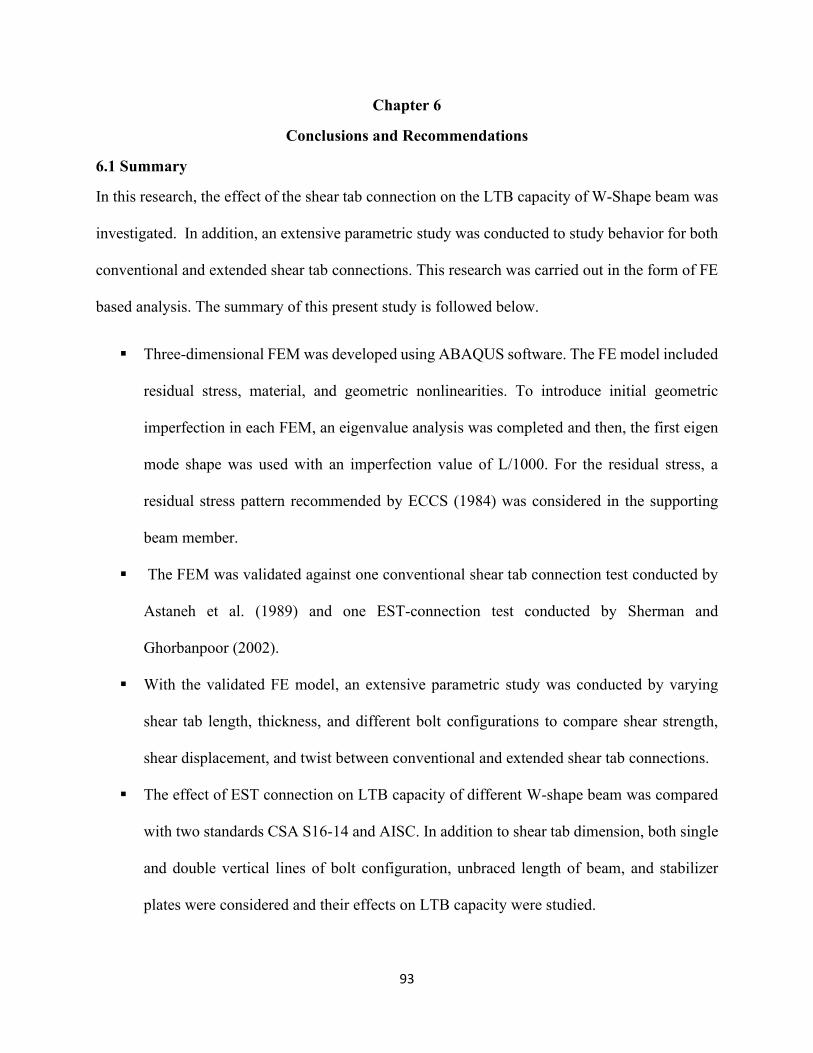
93
Chapter 6
Conclusions and Recommendations
6.1 Summary
In this research, the effect of the shear tab connection on the LTB capacity of W-Shape beam was
investigated. In addition, an extensive parametric study was conducted to study behavior for both
conventional and extended shear tab connections. This research was carried out in the form of FE
based analysis. The summary of this present study is followed below.
▪ Three-dimensional FEM was developed using ABAQUS software. The FE model included
residual stress, material, and geometric nonlinearities. To introduce initial geometric
imperfection in each FEM, an eigenvalue analysis was completed and then, the first eigen
mode shape was used with an imperfection value of L/1000. For the residual stress, a
residual stress pattern recommended by ECCS (1984) was considered in the supporting
beam member.
▪ The FEM was validated against one conventional shear tab connection test conducted by
Astaneh et al. (1989) and one EST-connection test conducted by Sherman and
Ghorbanpoor (2002).
▪ With the validated FE model, an extensive parametric study was conducted by varying
shear tab length, thickness, and different bolt configurations to compare shear strength,
shear displacement, and twist between conventional and extended shear tab connections.
▪ The effect of EST connection on LTB capacity of different W-shape beam was compared
with two standards CSA S16-14 and AISC. In addition to shear tab dimension, both single
and double vertical lines of bolt configuration, unbraced length of beam, and stabilizer
plates were considered and their effects on LTB capacity were studied.
94
▪ Finally, the effectiveness of channel shear tab connection, instead of conventional shear
tab connection, in improving the LTB capacity of the beam was studied.
The main findings from this research are presented in the next section and section 6.3 provides
recommendations for future work.
6.2 Conclusions
In conclusion, the key success of this research can be described in several portions. From the finite
element modeling and parametric study of conventional and extended shear tab connections, the
following findings can be included.
▪ The developed FE model showed a good agreement with the results obtained from the two
experiments considered in this research. The failure modes obtained from analyses were
the same as those observed in the tests. Thus, the FE model was able to provide excellent
predictions of behavior of the shear tab connections and was used to conduct a parametric
study of shear tab connections.
▪ The thickness of the shear tab can increase the shear capacity slightly; however, the higher
shear tab thickness can decrease the out-of-plane displacement of the shear tab connection.
▪ The length of the shear tab for the EST connection has a great influence on the shear
displacement and twist of the shear tab connection.
▪ The shear capacity was high when the shear tab had a higher depth. Thus, shear tab
connections with eight and nine bolts showed higher shear strength in comparison to other
bolt configurations with smaller shear tab depth.
▪ A twisting mode of failure was observed for the EST connections. The amount of torsion
was insignificant when the conventional shear tab was used.
95
▪ In the conventional shear tab connection, the failure was initiated by bolt fracture, plate
bearing, and bolt bearing.
The effect of EST connection on the LTB capacity of I-beam is summarized as follows:
▪ The LTB strengths of laterally unsupported I-beam with unstiffened EST connections
having single or double vertical lines of bolts can be significantly lower, especially for
deeper beam sections, than that predicted by CSA S16-14 and AISC 360-16. This was
mainly because for many unbraced I-beam, LTB of beam were triggered by the twisting of
the extended shear tabs.
▪ For the same span length, LTB strength was higher when the shear tab thickness was
higher.
▪ The analyses were conducted on I-beam with EST connections stiffened with Type II and
Type III stabilizer plates. It was observed that both Type II and Type III stabilizer plates in
the EST connections could significantly increase the LTB strength of laterally unsupported
I-beam.
▪ No significant difference was observed between LTB capacities of unbraced beam with
EST connections stiffened with Type II and Type III stabilizer plates. However, even with
the use of stabilizer plates in the EST connections, many deeper I-beam sections showed
lower LTB strengths than those predicted by the current steel design standards.
Finally, when compared with the equivalent shear tab connection currently used, it was observed
that the proposed channel type shear tab increases the lateral torsional buckling capacity of laterally
unsupported W-shape beam. Also, the LTB capacity increase was higher when both web and
96
flanges of the channel shear tab section were welded with the supporting column section. Thus,
the proposed channel shear tab connection can effectively be used in steel construction.
6.3 Recommendations for future work
Based on the findings and results obtained during this research work, the following
recommendations are made for future work:
▪ Different types of residual stress patterns and imperfections can be considered in the FE
model and their effects on lateral torsional buckling capacity of beam with shear tab
connections can be studied in future research.
▪ In this study, only the A325 bolt was considered with minimum pretension load. In the
future, various types of high-strength bolts having different pretension can be considered
to find out the effect of bolt configuration on the LTB capacity of the supported beam.
▪ The shear tab connections considered in this study are bearing type connections. Future
research is needed when the connections are slip critical connections.
▪ In the present study, a total of six different I-beam sections were considered with bolt
numbers four to nine. Every section was connected with the specific number of bolts, while
the effect of EST connection on LTB capacity can be determined by varying the different
number of bolts in each section.
▪ Only concentrated load was applied on the top flange of the beam. Effects of different types
of loading such as uniformly distributed loading and constant moment over length can be
considered in future research. In addition, effect of loading height can be considered in
future investigations.
97
▪ While the analysis shows the effectiveness of the proposed channel type shear tab in
increasing the LTB capacity of W-shape beam, experimental investigation on this new
shear tab connection is required.
98
References
ABAQUS. (2014). “ABAQUS standard user’s manual, 6.14.” Dassault Systems.
Abou-zidan, A., and Liu, Y. (2015). “Numerical Study of Unstiffened Extended Shear Tab
Connections.” Journal of Constructional Steel Research, Vol. 107, pp. 70-80.
American Institute of Steel Construction (AISC). (2005). Steel Construction Manual. 13th ed.,
Chicago, IL, USA.
American Institute of Steel Construction (AISC). (2011). Steel Construction Manual. 14th ed.,
Chicago, IL, USA.
American Institute of Steel Construction (AISC). (2016). “Specifications for Structural Steel
Buildings, ANSI/AISC 360-16.” Chicago, IL.
Ashakul, A. (2004). “Finite Element Analysis of Single Plate Shear Connections.” Doctor of
Philosophy Dissertation, Virginia Polytechnic Institute and State University, Blacksburg,
Virginia, USA.
Astaneh, A., Call, S.M. and McMullin, K.M. (1989). “Design of Single Plate Shear Connections.”
Engineering Journal, American Institute of Steel Construction, 26 (1) 21-32.
Bursi O.S., Jaspart J.P. (1998). “Basic issues in the finite element simulation of extended end plate
connections.” Computer Structures, 69: 225-62.
Canadian Standards Association (CSA). (2014). “Limit States Design of Steel Structures.”
CAN/CSA-S16-14, Toronto, Ontario, Canada.
Canadian Institute of Steel Construction (CISC). (2016). Handbook of Steel Constructions. 11th
ed., Toronto, Ontario, Canada.
Cook, R.D. and D.S. Malkus. (2002). “Concepts and applications of finite element analysis.” Ed.
By W. Anderson. John Wiley & Sons Inc.
Creech, D.D. (2005). “Behavior of Single-Plate Shear Connections with Rigid and Flexible
Supports.” Master’s Thesis, North Carolina State University, Department of Civil and
Environmental Engineering, Raleigh, NC.
Chengh, J.J., Yura, J.A. and Johnson, C.F. (1984). “Designed Behavior of Coped Beam.” Phil M.
Ferguson Structural Engineering Laboratory, University of Texas at Austin, Austin, TX.
99
Dibley, J.E. (1969). “Lateral Torsional Buckling of I-sections in Grade 55 Steel.” Proc. Inst. Civil
Eng., 599-627.
ECCS (1984). “Ultimate limit state calculation of sway frames with rigid joints.” TC 8 of European
Convention for Constructional Steelwork (ECCS), No. 33.
Fortney, P.J., and Thornton, W.A. (2016). “Analysis and Design of Stabilizer Plates in Single
Plate Shear Connections.” Engineering Journal, AISC, First Quarter, pp. 1-28.
Fukumoto, Y., Itoh, Y. and Kubo. M. (1980). “Strength variation of laterally unsupported beam.”
J. Struct. Div., ASCE, 106 (ST1), pp:165-181.
Kabir, I., Bhowmick, A.K. (2018). “Applicability of North American standards for lateral torsional
buckling of welded I-beam.” Journal of Constructional Steel Research, 147: 16-26.
Kabir, I., Bhowmick, A.K. (2018). “Lateral torsional buckling of welded wide flange beam under
constant moment.” Canadian Journal of Civil Engineering, 45(9): 766-779.
Kirby, P.A. and D.A. Nethercot (1979). “Design for Structural Stability.” Ed. By M.R. Horne.
Granada Publishing Limited.
Goodrich, W. (2005). “Behavior of extended shear tabs in stiffened beam-to-column web
connections.” M.Sc. thesis, Vanderbilt Univ., Nashville, TN.
Lipson, S.L., (1968). “Single-Angle and Single-Plate Beam Framing Connections.” Canadian
Structural Engineering Conference, Toronto, pp. 141-162.
MacPhedran, I., and Grondin, G. (2011). “A Proposed Simplified Canadian Beam Design.” Can.
J. Civ. Eng. 38: 141-143.
Marosi M. (2011). “Behavior of single and double row bolted shear tab connections and weld
retrofits.” MEng Thesis, Dept. of Civil Engineering, McGill University, Montreal, Quebec.
Metzger, K.B. (2006). “Experimental Verification of a New Single Plate Shear Connection Design
Model.” Master’s Thesis, Virginia Polytechnic Institute and State University.
Muir, L. S., and Hewitt, C.M. (2009). “Design of unstiffened extended single-plate shear
connections.” Eng. J., 46(2),67-79.
Nethercot, D.A. and K.C. Rockey. (1971). “A unified approach to the elastic lateral buckling of
the beam.” The Structural Engineer 49, pp. 321-330.
Pham, L. and Mansell, D.S. (1982). “Testing of the Web Side Plate Connection.” Australian
100
Welding Research, AWRA Report P6-1-87.
Powell, G. and Klingner R. (1970). “Elastic Lateral Buckling of Steel Beam.” Journal of the
Structural Division 96(9): 1919-1932.
Rahman, A., Mahamid, M., Amro, A. and Ghorbanpoor, A. (2003). “3D FE Model of Extended
Shear Tab Connections.” 16th Engineering Mechanics Conference, ASCE, Seattle, USA.
Richard, R. M., Gillett, P.E., Kriegh, J.D., and Lewis, B.A. (1980). “The analysis and design of
single plate framing connections.” Engineering Journal, 17(2), 38-52.
Salvadori, M.G. (1955). “Lateral Buckling of I-beam.” American Society of Civil Engineers 120,
pp. 1165-1177.
Sherman, D.R., and Ghorbanpoor, A. (2002). “Design of Extended Shear Tabs.” Research Report
2RR3095, American Institute of Steel Construction Inc., Chicago, IL, USA.
Subramanian L. and White D.W. (2015). “Evaluation of Lateral Torsional Buckling Resistance
Equations in AISC and AASHTO.” Proceedings of the Annual Stability Conference, Structural
Stability Research Council.
Thornton, W.A., and Fortney, P.J. (2011). “On the need for stiffeners and the effect of lap
eccentricity on Extended Shear Tabs.” Engineering Journal, AISC, 48 (2), 117–125.
Timoshenko, S.P. and Gere, J.M. (1961). “Theory of Elastic Stability. 2nd Edition.” McGraw-Hill
Book Company, Inc., Toronto.
Trahair, N. S. (1993). “Flexural-Torsional buckling of structures.” CRC Press, Boca Raton, FL,
USA.
Vlasov, V.Z. (1961). “Thin-Walled Elastic Beam.” Israel Program for Scientific Translations,
Jerusalem.
Wen, R., Akbas, B., Suitchiewcharn, N., and Shen, J. (2014). “Inelastic behaviors of steel Shear
Tab Connections.” The Structural Design of Tall and Special Buildings Jordan, Vol. 23, Issue 12,
pp. 929-946.
Wong, E., and Driver, R.G. (2010). “Critical evaluation of equivalent moment factor procedures
for laterally unsupported beam.” Engineering Journal, AISC, Q1, pp. 1–20.
Ziemian, Ronald D., Editor. (2010). “Guide to stability design criterion for Metal structures.”
Hoboken, New Jersey: John Wiley & Sons, Inc.
Top Related
Copyright © 2022 FDOKUMEN

