


Bahasa
Halaman
Hukum

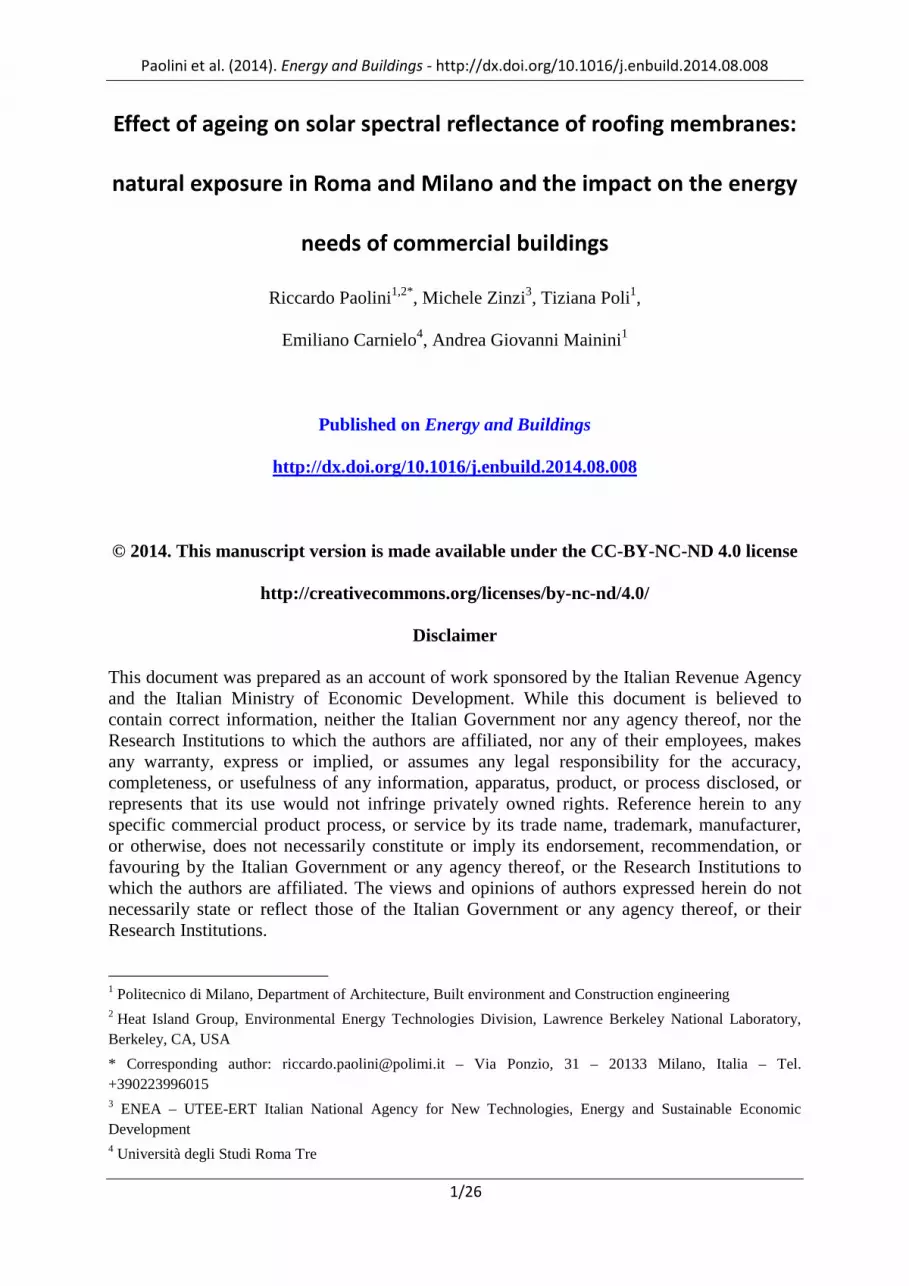
Paolini et al. (2014). Energy and Buildings - http://dx.doi.org/10.1016/j.enbuild.2014.08.008
1/26
Effect of ageing on solar spectral reflectance of roofing membranes:
natural exposure in Roma and Milano and the impact on the energy
needs of commercial buildings
Riccardo Paolini1,2*, Michele Zinzi3, Tiziana Poli1,
Emiliano Carnielo4, Andrea Giovanni Mainini1
Published on Energy and Buildings
http://dx.doi.org/10.1016/j.enbuild.2014.08.008
© 2014. This manuscript version is made available under the CC-BY-NC-ND 4.0 license
http://creativecommons.org/licenses/by-nc-nd/4.0/
Disclaimer
This document was prepared as an account of work sponsored by the Italian Revenue Agency and the Italian Ministry of Economic Development. While this document is believed to contain correct information, neither the Italian Government nor any agency thereof, nor the Research Institutions to which the authors are affiliated, nor any of their employees, makes any warranty, express or implied, or assumes any legal responsibility for the accuracy, completeness, or usefulness of any information, apparatus, product, or process disclosed, or represents that its use would not infringe privately owned rights. Reference herein to any specific commercial product process, or service by its trade name, trademark, manufacturer, or otherwise, does not necessarily constitute or imply its endorsement, recommendation, or favouring by the Italian Government or any agency thereof, or the Research Institutions to which the authors are affiliated. The views and opinions of authors expressed herein do not necessarily state or reflect those of the Italian Government or any agency thereof, or their Research Institutions.
1 Politecnico di Milano, Department of Architecture, Built environment and Construction engineering 2 Heat Island Group, Environmental Energy Technologies Division, Lawrence Berkeley National Laboratory, Berkeley, CA, USA
* Corresponding author: [email protected] – Via Ponzio, 31 – 20133 Milano, Italia – Tel. +390223996015 3 ENEA – UTEE-ERT Italian National Agency for New Technologies, Energy and Sustainable Economic Development 4 Università degli Studi Roma Tre

Paolini et al. (2014). Energy and Buildings - http://dx.doi.org/10.1016/j.enbuild.2014.08.008
2/26
Abstract
Highly reflective roofs, widely known as cool roofs, can reduce peak surface temperatures
and the energy required to cool buildings, mitigate urban microclimates, and offset CO2.
However, weathering, soiling, and biological growth affect their solar reflectance. In this
study, the solar spectral reflectances of 12 roofing membranes were measured before the
exposure and after 3, 6, 12, 18, and 24 months of natural ageing in Roma and Milano, Italy.
The membranes with an initial solar reflectance greater than 0.80, for example, decreased in
reflectance by 0.14 in Roma and 0.22 in Milano after 2 years. Then, for a typical highly
insulated commercial building, the annual cooling savings were calculated to be reduced by
4.1-7.1 MJ m-2 y-1 per 0.1 loss in reflectance. When the buildings are non-insulated, the
savings reduction is 58-71 MJ m-2 y-1 in Milano and 70-84 MJ m-2 y-1 in Roma. Ageing yielded
a reduction of the cooling savings that could be achieved with a new white membrane of 14-
23% in Roma and of 20-34% in Milano. Moreover, in Milano, an aged, white, highly
insulated roof, which has a solar reflectance of 0.56, may reach a surface temperature 16°C
higher than a new roof, which has a solar reflectance of 0.80.
Keywords: solar reflectance; ageing; soiling; cool roof; building energy need; UV-Vis-NIR;
natural exposure; building envelope.
1. Introduction
The microclimate in urban areas is very different from that in non-urban adjacent areas [1–3]
and typically leads to relevant differences in the energy needs of urban buildings [4–7] and
the peak electricity demand [8]. For instance, for office buildings within the urban area of
Paolini et al. (2014). Energy and Buildings - http://dx.doi.org/10.1016/j.enbuild.2014.08.008
3/26
Milano, the heating energy need is estimated to be from 30% to 60% lower than the needs
outside the city, while the cooling need is from 15% to 70% higher [9,10].
To mitigate urban climates and to reduce the cooling energy required, highly reflective
roofing materials have been widely suggested and recommended [11–18]. However,
especially in an urban environment where air pollution is significantly higher than in rural
areas, the surfaces of buildings are subject to weathering and to the deposition of soot and
other particulate matter, which cause a change in their reflectance [19–26].
Even if data are available, and unfortunately, the available data are seldom spectral,
they are provided by short exposure research programmes or concern only North America. In
the U.S. especially, extensive data about more than 2500 roofing products are made available
by the Cool Roofing Rating Council (CRRC) for three exposure sites: one in a temperate sub-
urban environment in Ohio, which has moderate air pollution [27]; one in a hot-dry extra-
urban climate in Arizona; and one in a hot and humid extra-urban climate in Florida. The
CRRC reports the clean and aged average solar reflectance ( Sρ ) and thermal emittance (ε )
measured at the three sites after three years of natural exposure. At the CRRC's sites, all of the
exposed products, excluding those with an initial solar reflectance ( S0ρ ) lower than 0.20,
present losses increasing with S0ρ [22]. For instance, for products with S0ρ greater than 0.80,
the three-site average loss of Sρ after three years is equal to 0.16, with a maximum of 0.24 in
Florida and a minimum of 0.08 in Arizona. With regard to the thermal emittance, in the
CRRC's database, most variations for products with an initial ε greater than 0.85 are within ±
0.05 after 3 years, while if the initial ε is lower than 0.50, there is an average increase of
approximately 0.07.
The ageing of high-albedo roofing may naturally lead to a decrease in the energy
savings achievable using cool materials (i.e., up to 20% compared to the first year for
detached houses in Sacramento, CA) as assessed by Bretz and Akbari [28]. Even if techniques
Paolini et al. (2014). Energy and Buildings - http://dx.doi.org/10.1016/j.enbuild.2014.08.008
4/26
to restore the initial solar reflectance exist [29,30], cleaning does not seem economically or
environmentally sustainable when only trying to achieve energy savings.
To complete the available information with data measured in urban environments,
which is where most buildings with high energy needs are typically located, a selection of 12
roofing membranes, including synthetic, factory-applied coatings on synthetic membranes,
field-applied coatings on modified bitumen, and modified bitumen with roofing granules,
were exposed and analysed in Milano and Roma, Italy. Their solar spectral reflectance was
measured when new and after 3, 6, 12, 18, and 24 months of exposure; the impact of solar
reflectance variation on the surface temperatures of insulated or non-insulated roofs was then
measured and was used to calculate the resulting energy needs for heating and cooling of a
typical commercial building in Milano and Roma.
2. Experiment
2.1 Selected materials
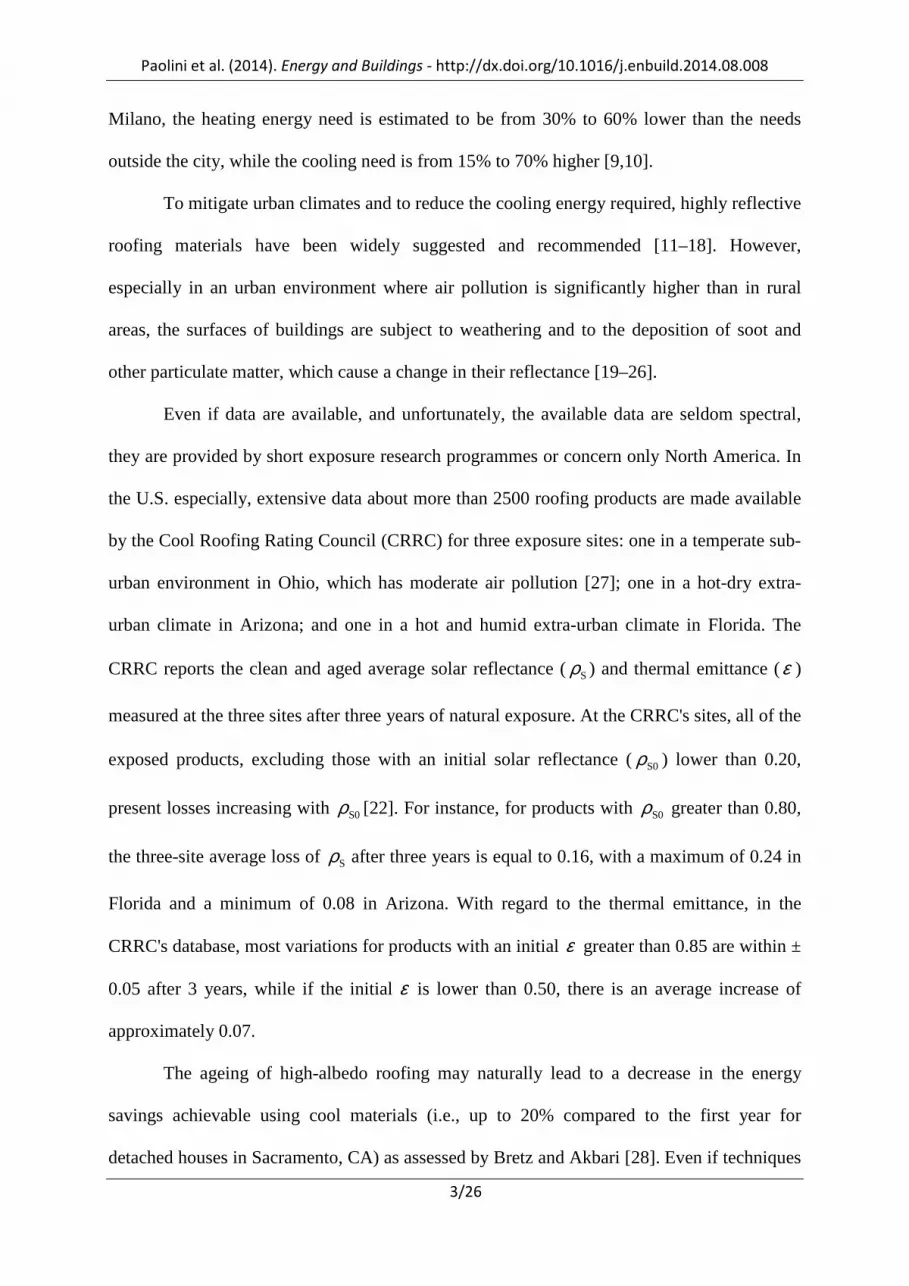
Twelve roofing membrane products available on the market with S0ρ values ranging from
0.26 to 0.85 (Figure 1) and having varying surface roughnesses were selected. Some
membranes were somewhat glossy, while others were matte; for each roofing material class
(e.g., modified bitumen), products offering different spectral features (i.e., cool and non-cool
coloured) were chosen. Those selected comprise a wide set of features of non-black
waterproofing materials made of modified bitumen, PVC and polyolefin, with different
spectral reflectances, surface roughnesses and open porosity.

Paolini et al. (2014). Energy and Buildings - http://dx.doi.org/10.1016/j.enbuild.2014.08.008
5/26
Selected samples
m01 (ρs0 = 0.26) m02 (ρs0 = 0.84) m03 (ρs0 = 0.76) m04 (ρs0 = 0.82) Grey flexible polyolefin (matte
and with anti-slip surface) White factory-applied coating (glossy) on flexible polyolefin
White flexible polyolefin (matte and anti-slip)
White thermoplastic polyolefin (glossy)
m05 (ρs0 = 0.46) m06 (ρs0 = 0.85) m07 (ρs0 = 0.59) m08 (ρs0 = 0.73)
Grey PVC membrane (glossy) White PVC membrane (matte) Cool beige thermoplastic
polyolefin (matte) Modified-bitumen with white field-applied coating (matte)
m09 (ρs0 = 0.72) m10 (ρs0 = 0.39) m11 (ρs0 = 0.28) m12 (ρs0 = 0.23)
Modified-bitumen with white field-applied coating (glossy)
Modified-bitumen with cool coloured field-applied coating
Modified-bitumen with photoactive roofing granules
Modified-bitumen with standard roofing granules
Figure 1: Selected roofing membranes, and initial solar reflectance ( S0ρ ).
2.2 Natural exposure procedure
The selected roofing membranes were exposed to the natural elements at two urban sites: in
Roma (41° 55' 57" N, 12° 27' 54" E; 35 m above mean sea level) and in Milano (45° 28' 48"

Paolini et al. (2014). Energy and Buildings - http://dx.doi.org/10.1016/j.enbuild.2014.08.008
6/26
N, 9° 13' 46" E; 123 m above mean sea level), offering different climates and pollutant
concentrations. In both cases, the exposures occurred approximately halfway between the city
centres and the peripheries on two non-shaded roofs and were distant from the primary
sources of pollution. The roofing membranes were exposed at a low slope (i.e., 1.5%
according to Italian code practices [31] and Swiss standards [32]). In Milano, additional
specimens were also exposed facing south with a slope of 45°.
The samples were measured when new and after 3, 6, 12, 18, and 24 months of natural
exposure, which began on April 18th, 2012. In addition, in Milano, one year later on May 3rd,
2013, a second low-sloped exposure of membranes from m02 to m10 (Figure 1) was started to
assess the variability caused by different ageing conditions occurring in short-term
programmes. At each time point, the samples were retrieved, measured in the laboratory, and
re-exposed; each sample remained unexposed for approximately one week when the
measurements were taken. Three samples of 10 cm x 10 cm in size per product were exposed
for each site and slope condition; they were fastened to metal frames according to ISO 2810
[33] 80 cm above the roof (Figure 2). To observe the speed of the reflectance loss, in the
second year, 39 additional specimens of membrane m06, which was a white PVC single-ply,
were exposed, retrieving three coupons and measuring them each week during the first two
months and then every two weeks for the following two months.
2.3 Reflectance measurement method
The spectral reflectance was measured with two identical Perkin Elmer Lambda 950
spectrophotometers, one in Roma and one in Milano; the latter was used after the first year.
Both machines were equipped with a 150 mm Spectralon-coated integrating sphere, a
photomultiplier tube, and lead sulphide detectors.

Paolini et al. (2014). Energy and Buildings - http://dx.doi.org/10.1016/j.enbuild.2014.08.008
7/26
Figure 2: Exposure facility in Milano. A weather station on the same roof monitors solar global radiation, air temperature, relative humidity and pressure, wind velocity and direction, and precipitation.
Reflectance measurements were carried out and compared to a Spectralon calibrated reference
in the 300-2500 nm wavelength range with a spectral resolution of 5 nm. The centre point of
each sample lit by the measurement beam was used for the analysis; thus, soiling edge effects
were excluded. The slit aperture was set to 2 nm in the visible range and in servo mode in the
near-infrared range. The servo mode allowed the instrument to automatically change the slit
aperture in order to optimize the energy input as a function of wavelength. Broad band values
were calculated from the spectral data according to ASTM E 903 [34] using the global solar
horizontal irradiance distribution given for air mass 1 at 5 nm intervals, as described by
Levinson et al. [35]. The visible band was considered to range from 380 to 780 nm, according
to ISO 9050 [36]. For each product and exposure condition (i.e., site, orientation, and slope)

Paolini et al. (2014). Energy and Buildings - http://dx.doi.org/10.1016/j.enbuild.2014.08.008
8/26
for the three specimens, we computed the average spectral curve and then the integrated
values.
3. Building energy simulations
3.1 Simulation tool
The evolution over time of solar reflectance already provides an indication of the possible
variation in the surface energy balance of the building envelope. However, dynamic heat and
moisture transport numerical simulations may provide a deeper insight into the impact of
reflectance changes on the hygrothermal performance of the building envelope and on the
building energy needs for heating and cooling. The software model WUFI Plus 2.5.3 [37] was
used, which was validated within the context of IEA Annex 41 [38]. This model resolves the
enthalpy balance with the finite control volumes method, coupling the heat transfer with the
liquid and vapour moisture transport in porous media and accounting for both latent heat
transformations and the influence of moisture content and temperature on the thermal and
moisture transport properties of building materials [39].
As in the work of Levinson et al. [40], the building simulations included the
temperature dependency of thermal conductivity (λ). For expanded polystyrene (EPS), λ =
0.034 W m-1 K-1 at -20°C and λ = 0.054 W m-1 K-1 at +80°C from WUFI database were used,
in agreement with the provisional formulas for EPS given in ISO 10456 [41]. Simulations
were performed with a time step of 15 minutes.
3.2 Case study
As a case study, a typical one-storey commercial building located in Milano or Roma was
considered, which was modelled as a single zone measuring 50 m x 40 m x 6.5 m (i.e., inner

Paolini et al. (2014). Energy and Buildings - http://dx.doi.org/10.1016/j.enbuild.2014.08.008
9/26
dimensions) and east-west oriented with ribbon windows on the south and north façades,
precast walls, and a flat precast roof with unprotected membrane (Table 1).
Table 1: Building envelope components surface area, and thermal transmittance (U). The thermal conductivity (λ) of expanded polystyrene (EPS) is set to 0.04 W m-1 K-1, while for
reinforced concrete we considered λ = 1.6 W m-1 K-1 and volumic mass equal to 2300 kg m-3. Windows are described also by frame incidence, and by their total solar energy transmittance for normal incidence (g⊥).
Building envelope
component
Orientation and area
(m2) Highly insulated case No insulation
Roof (flat)
2000
U = 0.19 W m-2 K-1 Double tee precast reinforced
concrete slab (flange 0.05 m thick), 0.05 m of concrete screed, vapour
barrier (water vapour diffusion equivalent thickness sd = 100 m), 0.20
m of EPS, and roofing membrane
U = 4.7 W m-2 K-1 Double tee precast reinforced
concrete slab (flange 0.05 m thick), 0.05 m of concrete screed, and
roofing membrane
Floor 2000
U = 0.19 W m-2 K-1 0.15 m of reinforced concrete slab over the ground (no direct contact),
0.20 m of EPS, and 0.08 m of concrete (screed and cement
pavement finishing).
U = 3.8 W m-2 K-1 Reinforced concrete slab (0.15 m,
with cement pavement finishing) over the ground (no direct contact).
Walls (precast concrete)
N: 281 S: 269 E: 248 W: 260
(tot: 1058)
U = 0.27 W m-2 K-1 Sandwich panel made of two skins of
0.01 m thick high density fibre-reinforced concrete each, and 0.14 m
of EPS
ρs = 0.50
U = 1.4 W m-2 K-1 Panel made of two skins of 0.05 m thick reinforced concrete each, and
0.02 m of low density EPS as lightening (we considered only 2 cm of EPS to take into account thermal bridges between panels, and those
due to the edges and the ribs of each panel)
ρs = 0.50
Ribbon windows (5 m from ground)
S: 44 N: 44
Doors E: 12 S: 12
Double-glazing with low emissivity
coating (ε = 0.20) U = 1.6 W m-2 K-1
g⊥ = 0.60 Frame incidence = 30%
Uncoated single-glazing U = 5.0 W m-2 K-1
g⊥ = 0.81 Frame incidence = 30%
The building typology and envelope technology were representative of industrial and
commercial sectors in Italy. Internal partitions and furniture provided low thermal inertia,
which was offered by the precast building envelope and by 75 m3 of bottled liquid
Paolini et al. (2014). Energy and Buildings - http://dx.doi.org/10.1016/j.enbuild.2014.08.008
10/26
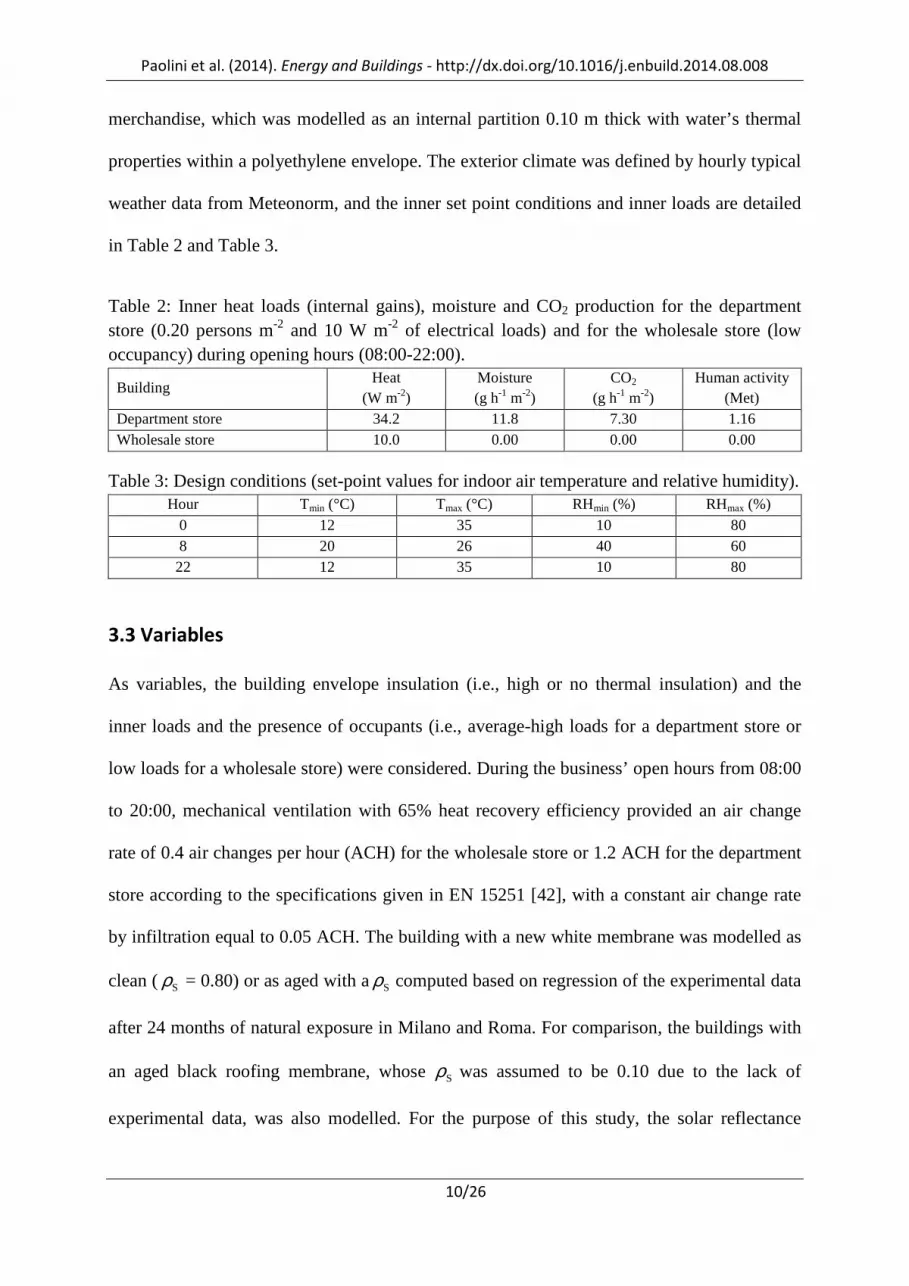
merchandise, which was modelled as an internal partition 0.10 m thick with water’s thermal
properties within a polyethylene envelope. The exterior climate was defined by hourly typical
weather data from Meteonorm, and the inner set point conditions and inner loads are detailed
in Table 2 and Table 3.
Table 2: Inner heat loads (internal gains), moisture and CO2 production for the department store (0.20 persons m-2 and 10 W m-2 of electrical loads) and for the wholesale store (low occupancy) during opening hours (08:00-22:00).
Building Heat
(W m-2) Moisture (g h-1 m-2)
CO2 (g h-1 m-2)
Human activity (Met)
Department store 34.2 11.8 7.30 1.16 Wholesale store 10.0 0.00 0.00 0.00
Table 3: Design conditions (set-point values for indoor air temperature and relative humidity). Hour Tmin (°C) Tmax (°C) RHmin (%) RHmax (%)
0 12 35 10 80 8 20 26 40 60 22 12 35 10 80
3.3 Variables
As variables, the building envelope insulation (i.e., high or no thermal insulation) and the
inner loads and the presence of occupants (i.e., average-high loads for a department store or
low loads for a wholesale store) were considered. During the business’ open hours from 08:00
to 20:00, mechanical ventilation with 65% heat recovery efficiency provided an air change
rate of 0.4 air changes per hour (ACH) for the wholesale store or 1.2 ACH for the department
store according to the specifications given in EN 15251 [42], with a constant air change rate
by infiltration equal to 0.05 ACH. The building with a new white membrane was modelled as
clean ( Sρ = 0.80) or as aged with aSρ computed based on regression of the experimental data
after 24 months of natural exposure in Milano and Roma. For comparison, the buildings with
an aged black roofing membrane, whose Sρ was assumed to be 0.10 due to the lack of
experimental data, was also modelled. For the purpose of this study, the solar reflectance

Paolini et al. (2014). Energy and Buildings - http://dx.doi.org/10.1016/j.enbuild.2014.08.008
11/26
decay was accounted for only in the case of the roofing membrane, while for the glazing and
opaque façades were considered constant values.
4. Results and discussion
4.1 Experimental results
Both in Milano and in Roma after 3 months of exposure (i.e., from mid-April to mid-July
2012), the three membranes with S0ρ values greater than 0.80 lost an average of 0.13 in solar
reflectance (Figure 3). At 6 months of exposure (i.e., mid- to late October 2012), remarkable
variations were not measured. After the initial drop during the first 3 months, the greatest
losses in reflectance occurred during the first winter (i.e., from 6 to 12 months of exposure
time, namely, from October 2012 to April 2013), which is when building heating systems are
operating. The second winter did not yield further loss of the same magnitude, and stability
was achieved for most of the exposed products. After 24 months of natural ageing,
membranes withS0ρ values greater than 0.80 were found to have lost an average of 0.14 in
Roma and 0.22 in Milano, while membranes with S0ρ values in the range of 0.60 to 0.80 lost
an average of 0.15 in Roma and 0.24 in Milano.
Low-reflectivity membranes (S0ρ = 0.20-0.30) showed modest absolute variations (i.e.,
within 0.02-0.05) with a Sρ of modified bitumen with roofing granules (i.e., m11 and m12)
that fluctuated over time, sometimes exceeding the initial value; this occurred because of soot
deposits on the modified bitumen substrate (Sρ ~ 0.05) underneath the granules, as discussed
in detail by Berdahl et al. [43]. In some cases (e.g., for m02 and m04), fluctuations were also
shown for the glossy single-ply membranes. Differences between the ageing conditions in
Roma and Milano emerged during the wintertime because it is in average colder in Milano
(i.e., 2404 heating degree days with 20°C as set-point temperature) than in Roma (i.e., 1415

Paolini et al. (2014). Energy and Buildings - http://dx.doi.org/10.1016/j.enbuild.2014.08.008
12/26
heating degree days) with higher pollutant concentrations in Milano due to the increased
building heating (e.g., over one year, the 95th percentile of PM10 concentration was equal to
98.7 49 µg m-3 in Milano and to 49 µg m-3 in Roma [44,45]). These differences were also due
to the weak air circulation in Milano, where the average wind velocity was equal to 1.5 m s-1,
while the average wind velocity was 3.3 m s-1 in Roma. For membranes with S0ρ values
greater than 0.60, the difference between Roma and Milano was nearly 0.08.
Sol
ar r
efle
ctan
ce v
aria
tion
0 3 6 12 18 24-0.30
-0.25
-0.20
-0.15
-0.10
-0.05
0.00
0.05
0.10Roma horMilano horMilano 45° south
m01ρs0 = 0.26
Sol
ar r
efle
ctan
ce v
aria
tion
0 3 6 12 18 24-0.30
-0.25
-0.20
-0.15
-0.10
-0.05
0.00
0.05
0.10Roma horMilano horMilano 45° southMilano hor 2 expnd
m02ρs0 = 0.84
Sol
ar r
efle
ctan
ce v
aria
tion
0 3 6 12 18 24-0.30
-0.25
-0.20
-0.15
-0.10
-0.05
0.00
0.05
0.10Roma horMilano horMilano 45° southMilano hor 2 expnd
m03ρs0 = 0.76
Sol
ar r
efle
ctan
ce v
aria
tion
0 3 6 12 18 24-0.30
-0.25
-0.20
-0.15
-0.10
-0.05
0.00
0.05
0.10Roma horMilano horMilano 45° southMilano hor 2 expnd
m04ρs0 = 0.82
Sol
ar r
efle
ctan
ce v
aria
tion
0 3 6 12 18 24-0.30
-0.25
-0.20
-0.15
-0.10
-0.05
0.00
0.05
0.10Roma horMilano horMilano 45° southMilano hor 2 expnd
m05ρs0 = 0.46
Sol
ar r
efle
ctan
ce v
aria
tion
0 3 6 12 18 24-0.30
-0.25
-0.20
-0.15
-0.10
-0.05
0.00
0.05
0.10Roma horMilano horMilano 45° southMilano hor 2 expnd
m06ρs0 = 0.85
Sol
ar r
efle
ctan
ce v
aria
tion
0 3 6 12 18 24-0.30
-0.25
-0.20
-0.15
-0.10
-0.05
0.00
0.05
0.10Roma horMilano horMilano 45° southMilano hor 2 expnd
m07ρs0 = 0.59
Sol
ar r
efle
ctan
ce v
aria
tion
0 3 6 12 18 24-0.30
-0.25
-0.20
-0.15
-0.10
-0.05
0.00
0.05
0.10Roma horMilano horMilano 45° southMilano hor 2 expnd
m08ρs0 = 0.73
Sol
ar r
efle
ctan
ce v
aria
tion
0 3 6 12 18 24-0.30
-0.25
-0.20
-0.15
-0.10
-0.05
0.00
0.05
0.10Roma horMilano horMilano 45° southMilano hor 2 expnd
m09ρs0 = 0.72
Sol
ar r
efle
ctan
ce v
aria
tion
0 3 6 12 18 24-0.30
-0.25
-0.20
-0.15
-0.10
-0.05
0.00
0.05
0.10Roma horMilano horMilano 45° south
m10ρs0 = 0.39
Sol
ar r
efle
ctan
ce v
aria
tion
0 3 6 12 18 24-0.30
-0.25
-0.20
-0.15
-0.10
-0.05
0.00
0.05
0.10Roma horMilano horMilano 45° south
m11ρs0 = 0.28
Sol
ar r
efle
ctan
ce v
aria
tion
0 3 6 12 18 24-0.30
-0.25
-0.20
-0.15
-0.10
-0.05
0.00
0.05
0.10Roma horMilano horMilano 45° south
m12ρs0 = 0.23
Exposure time (months) Exposure time (months) Exposure time (months)
Figure 3: Solar reflectance variation (aged - initial) with exposure time (measurements before the exposure, and after 3, 6, 12, 18, and 24 months).
Paolini et al. (2014). Energy and Buildings - http://dx.doi.org/10.1016/j.enbuild.2014.08.008
13/26
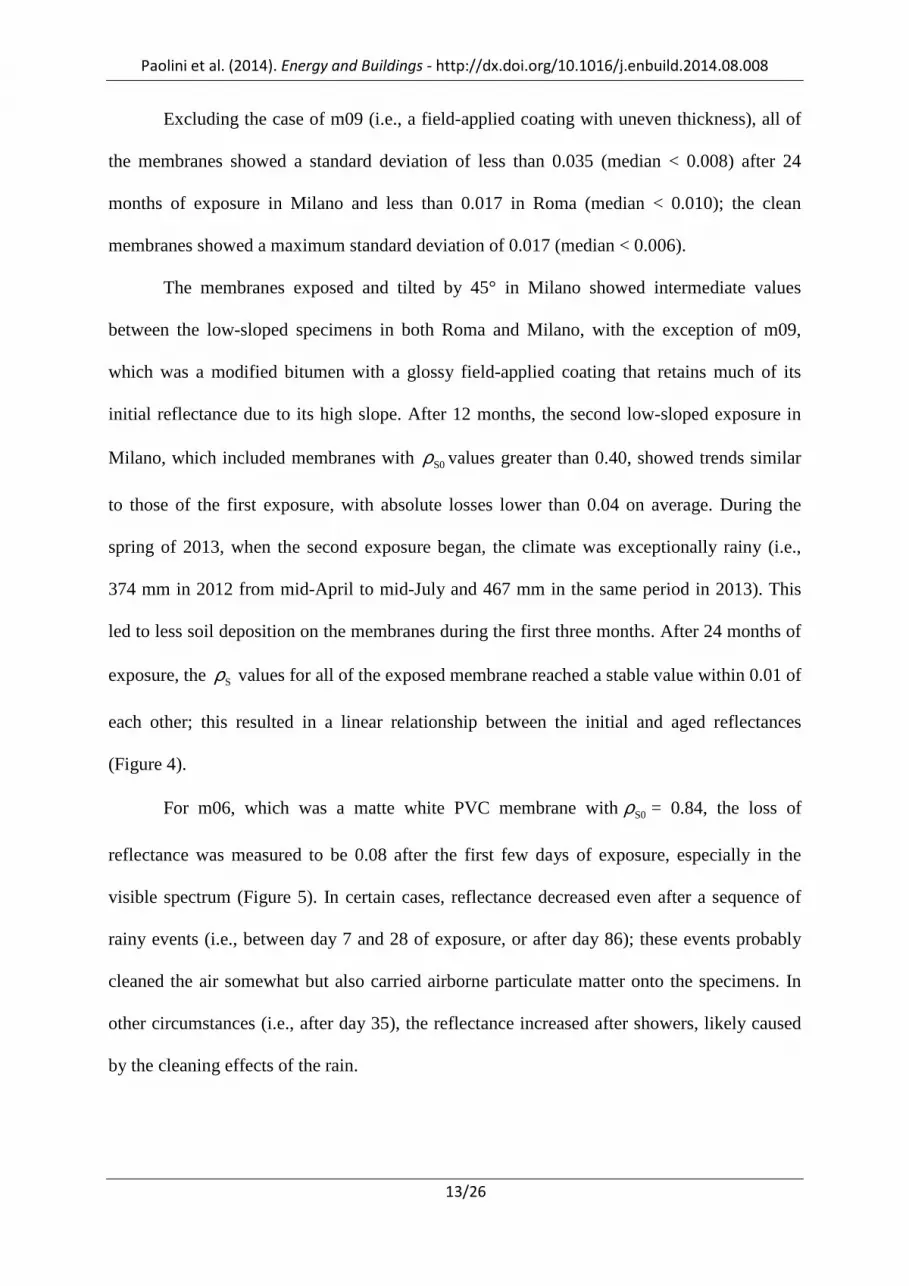
Excluding the case of m09 (i.e., a field-applied coating with uneven thickness), all of
the membranes showed a standard deviation of less than 0.035 (median < 0.008) after 24
months of exposure in Milano and less than 0.017 in Roma (median < 0.010); the clean
membranes showed a maximum standard deviation of 0.017 (median < 0.006).
The membranes exposed and tilted by 45° in Milano showed intermediate values
between the low-sloped specimens in both Roma and Milano, with the exception of m09,
which was a modified bitumen with a glossy field-applied coating that retains much of its
initial reflectance due to its high slope. After 12 months, the second low-sloped exposure in
Milano, which included membranes with S0ρ values greater than 0.40, showed trends similar
to those of the first exposure, with absolute losses lower than 0.04 on average. During the
spring of 2013, when the second exposure began, the climate was exceptionally rainy (i.e.,
374 mm in 2012 from mid-April to mid-July and 467 mm in the same period in 2013). This
led to less soil deposition on the membranes during the first three months. After 24 months of
exposure, the Sρ values for all of the exposed membrane reached a stable value within 0.01 of
each other; this resulted in a linear relationship between the initial and aged reflectances
(Figure 4).
For m06, which was a matte white PVC membrane withS0ρ = 0.84, the loss of
reflectance was measured to be 0.08 after the first few days of exposure, especially in the
visible spectrum (Figure 5). In certain cases, reflectance decreased even after a sequence of
rainy events (i.e., between day 7 and 28 of exposure, or after day 86); these events probably
cleaned the air somewhat but also carried airborne particulate matter onto the specimens. In
other circumstances (i.e., after day 35), the reflectance increased after showers, likely caused
by the cleaning effects of the rain.

Paolini et al. (2014). Energy and Buildings - http://dx.doi.org/10.1016/j.enbuild.2014.08.008
14/26
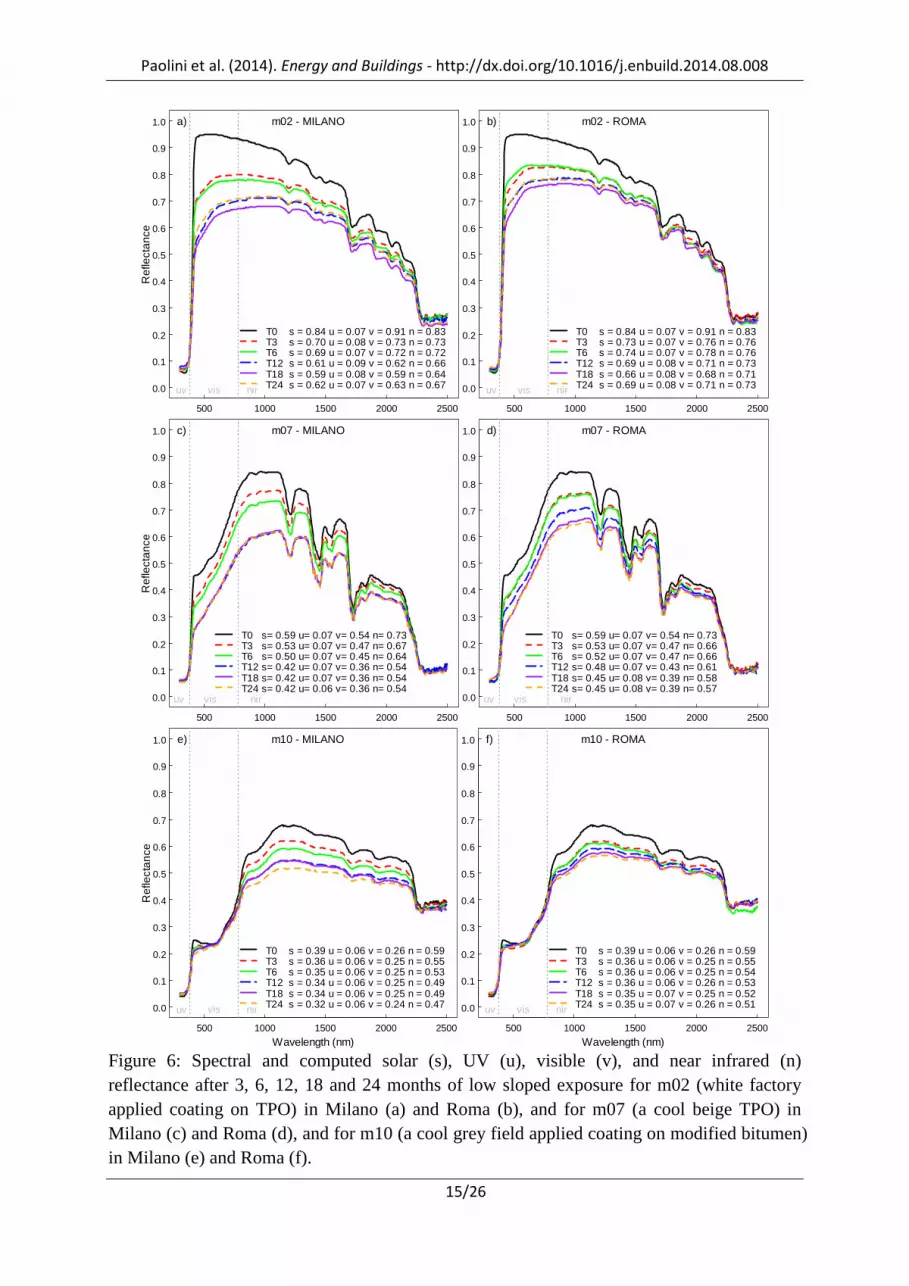
Focusing on the spectral data, the portions of the solar spectrum where weathering and
soiling have the largest impact and the factors that primarily affect the dirt pickup and the
variations in reflectance can be determined (Figure 6).
0.0 0.1 0.2 0.3 0.4 0.5 0.6 0.7 0.8 0.9 1.0
0.0
0.1
0.2
0.3
0.4
0.5
0.6
0.7
0.8
0.9
1.0
Initial solar reflectance
Age
d so
lar
refle
ctan
ce
ρRM 24 hor = 0.78 * ρs0+ 0.02; R = 0.972
ρMI 24 hor = 0.64 * ρs0 + 0.05; R = 0.922
ρMI 24 tilt45 = 0.67 * ρs0 + 0.05; R = 0.872
Figure 4: Linear regression of solar reflectance after 2 years of natural exposure in Roma (low sloped) and in Milano (low sloped and 45° tilted south oriented) as a function of initial solar reflectance.
02468
m s
−1 Wind velocity
0
10
20
30
mm
h−1 Precipitation
01020304050
µ g
m−3
PM2.5 PM10
(d.u
.)
0 7 21 35 49 71 86 101 116-0.20
-0.10
0.00∆ρs ∆ρv ∆ρn
Exposure time (days)
Figure 5: Solar, visible, and near infrared reflectance variation (aged - initial) during the first four months of natural ageing for a white PVC membrane (m06) low sloped exposure in Milano, measured each week for the first two months, and each two weeks in the following two months. The decreasing trend of reflectance is plotted together with the average daily concentration of fine particulate matter (PM2.5 and PM10), and hourly values of precipitation and wind velocity (measured on the same roof of the exposure). Air pollution data are provided by ARPA Lombardia (regional environmental protection agency), for the station 'Pascal', about 250 m far from the exposure site [45].
Paolini et al. (2014). Energy and Buildings - http://dx.doi.org/10.1016/j.enbuild.2014.08.008
15/26
500 1000 1500 2000 2500
0.0
0.1
0.2
0.3
0.4
0.5
0.6
0.7
0.8
0.9
1.0
Wavelength (nm)
Ref
lect
ance
T0 s = 0.84 u = 0.07 v = 0.91 n = 0.83T3 s = 0.70 u = 0.08 v = 0.73 n = 0.73T6 s = 0.69 u = 0.07 v = 0.72 n = 0.72T12 s = 0.61 u = 0.09 v = 0.62 n = 0.66T18 s = 0.59 u = 0.08 v = 0.59 n = 0.64T24 s = 0.62 u = 0.07 v = 0.63 n = 0.67
a) m02 - MILANO
uv vis nir
500 1000 1500 2000 2500
0.0
0.1
0.2
0.3
0.4
0.5
0.6
0.7
0.8
0.9
1.0
Wavelength (nm)
Ref
lect
ance
T0 s = 0.84 u = 0.07 v = 0.91 n = 0.83T3 s = 0.73 u = 0.07 v = 0.76 n = 0.76T6 s = 0.74 u = 0.07 v = 0.78 n = 0.76T12 s = 0.69 u = 0.08 v = 0.71 n = 0.73T18 s = 0.66 u = 0.08 v = 0.68 n = 0.71T24 s = 0.69 u = 0.08 v = 0.71 n = 0.73
b) m02 - ROMA
uv vis nir
500 1000 1500 2000 2500
0.0
0.1
0.2
0.3
0.4
0.5
0.6
0.7
0.8
0.9
1.0
Wavelength (nm)
Ref
lect
ance
T0 s= 0.59 u= 0.07 v= 0.54 n= 0.73T3 s= 0.53 u= 0.07 v= 0.47 n= 0.67T6 s= 0.50 u= 0.07 v= 0.45 n= 0.64T12 s= 0.42 u= 0.07 v= 0.36 n= 0.54T18 s= 0.42 u= 0.07 v= 0.36 n= 0.54T24 s= 0.42 u= 0.06 v= 0.36 n= 0.54
c) m07 - MILANO
uv vis nir
500 1000 1500 2000 2500
0.0
0.1
0.2
0.3
0.4
0.5
0.6
0.7
0.8
0.9
1.0
Wavelength (nm)
Ref
lect
ance
T0 s= 0.59 u= 0.07 v= 0.54 n= 0.73T3 s= 0.53 u= 0.07 v= 0.47 n= 0.66T6 s= 0.52 u= 0.07 v= 0.47 n= 0.66T12 s= 0.48 u= 0.07 v= 0.43 n= 0.61T18 s= 0.45 u= 0.08 v= 0.39 n= 0.58T24 s= 0.45 u= 0.08 v= 0.39 n= 0.57
d) m07 - ROMA
uv vis nir
500 1000 1500 2000 2500
0.0
0.1
0.2
0.3
0.4
0.5
0.6
0.7
0.8
0.9
1.0
Wavelength (nm)
Ref
lect
ance
T0 s = 0.39 u = 0.06 v = 0.26 n = 0.59T3 s = 0.36 u = 0.06 v = 0.25 n = 0.55T6 s = 0.35 u = 0.06 v = 0.25 n = 0.53T12 s = 0.34 u = 0.06 v = 0.25 n = 0.49T18 s = 0.34 u = 0.06 v = 0.25 n = 0.49T24 s = 0.32 u = 0.06 v = 0.24 n = 0.47
e) m10 - MILANO
uv vis nir
500 1000 1500 2000 2500
0.0
0.1
0.2
0.3
0.4
0.5
0.6
0.7
0.8
0.9
1.0
Wavelength (nm)
Ref
lect
ance
T0 s = 0.39 u = 0.06 v = 0.26 n = 0.59T3 s = 0.36 u = 0.06 v = 0.25 n = 0.55T6 s = 0.36 u = 0.06 v = 0.25 n = 0.54T12 s = 0.36 u = 0.06 v = 0.26 n = 0.53T18 s = 0.35 u = 0.07 v = 0.25 n = 0.52T24 s = 0.35 u = 0.07 v = 0.26 n = 0.51
f) m10 - ROMA
uv vis nir
Figure 6: Spectral and computed solar (s), UV (u), visible (v), and near infrared (n) reflectance after 3, 6, 12, 18 and 24 months of low sloped exposure for m02 (white factory applied coating on TPO) in Milano (a) and Roma (b), and for m07 (a cool beige TPO) in Milano (c) and Roma (d), and for m10 (a cool grey field applied coating on modified bitumen) in Milano (e) and Roma (f).
Paolini et al. (2014). Energy and Buildings - http://dx.doi.org/10.1016/j.enbuild.2014.08.008
16/26
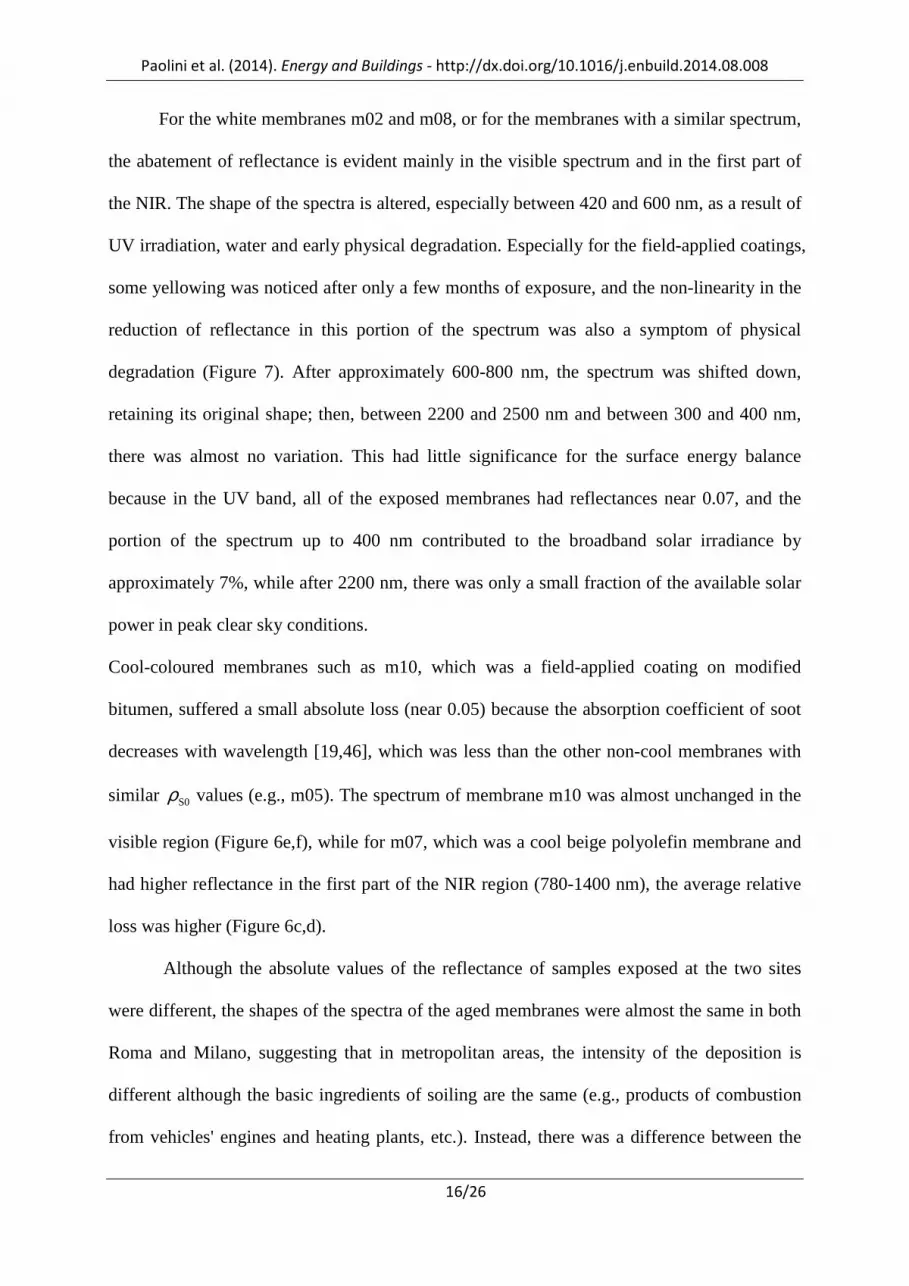
For the white membranes m02 and m08, or for the membranes with a similar spectrum,
the abatement of reflectance is evident mainly in the visible spectrum and in the first part of
the NIR. The shape of the spectra is altered, especially between 420 and 600 nm, as a result of
UV irradiation, water and early physical degradation. Especially for the field-applied coatings,
some yellowing was noticed after only a few months of exposure, and the non-linearity in the
reduction of reflectance in this portion of the spectrum was also a symptom of physical
degradation (Figure 7). After approximately 600-800 nm, the spectrum was shifted down,
retaining its original shape; then, between 2200 and 2500 nm and between 300 and 400 nm,
there was almost no variation. This had little significance for the surface energy balance
because in the UV band, all of the exposed membranes had reflectances near 0.07, and the
portion of the spectrum up to 400 nm contributed to the broadband solar irradiance by
approximately 7%, while after 2200 nm, there was only a small fraction of the available solar
power in peak clear sky conditions.
Cool-coloured membranes such as m10, which was a field-applied coating on modified
bitumen, suffered a small absolute loss (near 0.05) because the absorption coefficient of soot
decreases with wavelength [19,46], which was less than the other non-cool membranes with
similar S0ρ values (e.g., m05). The spectrum of membrane m10 was almost unchanged in the
visible region (Figure 6e,f), while for m07, which was a cool beige polyolefin membrane and
had higher reflectance in the first part of the NIR region (780-1400 nm), the average relative
loss was higher (Figure 6c,d).
Although the absolute values of the reflectance of samples exposed at the two sites
were different, the shapes of the spectra of the aged membranes were almost the same in both
Roma and Milano, suggesting that in metropolitan areas, the intensity of the deposition is
different although the basic ingredients of soiling are the same (e.g., products of combustion
from vehicles' engines and heating plants, etc.). Instead, there was a difference between the

Paolini et al. (2014). Energy and Buildings - http://dx.doi.org/10.1016/j.enbuild.2014.08.008
17/26
shape of the spectra of the horizontally exposed samples and the spectra of those tilted by 45°
facing south. For the latter, the effect of weathering and soiling between 420 and 600 nm was
shown to be slightly less pronounced than for the low sloped specimens (Figure 8).
Figure 7: Coefficient of determination (R2) of a linear regression (soiled spectral reflectance as a function of clean reflectance) of all the UV-Vis-NIR measurements performed each 5 nm for all the samples. Within the chart, an example of visual comparison between a new and an aged white field applied coating, showing yellowing of the surface.
300 350 400 450 500 550 600 650 700 750 800
0.0
0.1
0.2
0.3
0.4
0.5
0.6
0.7
0.8
0.9
1.0
Wavelength (nm)
Ref
lect
ance
T0 T12 Roma horT12 Milano hor (2nd exp)T12 Milano 45° southT12 Milano hor
uv vis nir
Figure 8: Spectral reflectance between 300 and 800 nm of a white factory applied coating onto a single-ply TPO membrane (m02): comparison between time zero, and values after 12 months of natural exposure in Roma (low sloped), and in Milano (low sloped, first and second exposure), and 45° tilted facing south.
Paolini et al. (2014). Energy and Buildings - http://dx.doi.org/10.1016/j.enbuild.2014.08.008
18/26
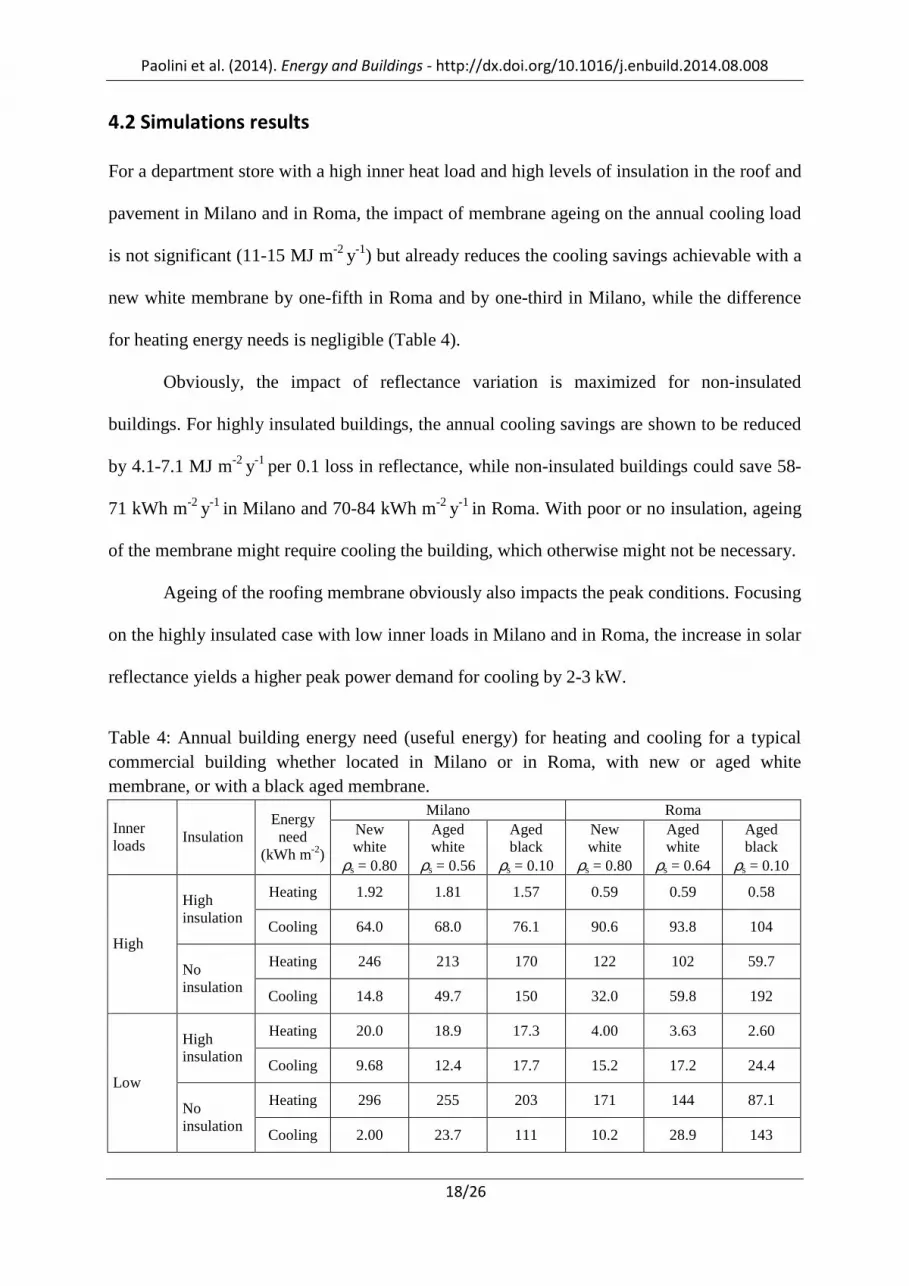
4.2 Simulations results
For a department store with a high inner heat load and high levels of insulation in the roof and
pavement in Milano and in Roma, the impact of membrane ageing on the annual cooling load
is not significant (11-15 MJ m-2 y-1) but already reduces the cooling savings achievable with a
new white membrane by one-fifth in Roma and by one-third in Milano, while the difference
for heating energy needs is negligible (Table 4).
Obviously, the impact of reflectance variation is maximized for non-insulated
buildings. For highly insulated buildings, the annual cooling savings are shown to be reduced
by 4.1-7.1 MJ m-2 y-1 per 0.1 loss in reflectance, while non-insulated buildings could save 58-
71 kWh m-2 y-1 in Milano and 70-84 kWh m-2 y-1 in Roma. With poor or no insulation, ageing
of the membrane might require cooling the building, which otherwise might not be necessary.
Ageing of the roofing membrane obviously also impacts the peak conditions. Focusing
on the highly insulated case with low inner loads in Milano and in Roma, the increase in solar
reflectance yields a higher peak power demand for cooling by 2-3 kW.
Table 4: Annual building energy need (useful energy) for heating and cooling for a typical commercial building whether located in Milano or in Roma, with new or aged white membrane, or with a black aged membrane.
Milano Roma Inner loads
Insulation Energy need
(kWh m-2)
New white
ρs = 0.80
Aged white
ρs = 0.56
Aged black
ρs = 0.10
New white
ρs = 0.80
Aged white
ρs = 0.64
Aged black
ρs = 0.10
Heating 1.92 1.81 1.57 0.59 0.59 0.58 High insulation
Cooling 64.0 68.0 76.1 90.6 93.8 104
Heating 246 213 170 122 102 59.7 High
No insulation
Cooling 14.8 49.7 150 32.0 59.8 192
Heating 20.0 18.9 17.3 4.00 3.63 2.60 High insulation
Cooling 9.68 12.4 17.7 15.2 17.2 24.4
Heating 296 255 203 171 144 87.1 Low
No insulation
Cooling 2.00 23.7 111 10.2 28.9 143

Paolini et al. (2014). Energy and Buildings - http://dx.doi.org/10.1016/j.enbuild.2014.08.008
19/26
While the impact on energy needs from the increase in solar reflectance depends on
the building inner loads and the building envelope design, the impact on the surface
temperatures of the roofing membrane itself is extremely relevant, especially for high-
insulation setups. For instance, in Milano, the computed exterior surface temperatures of a
new white membrane (Sρ = 0.80) over 20 cm of thermal insulation is between -10°C and
+36°C, while the same membrane when aged (Sρ = 0.56) may reach +52°C with frequent
differences exceeding 10°C during the hot season and peak differences of 19°C (Figure 9).
Month
Tem
pera
ture
diff
eren
ce (
°C)
J F M A M J J A S O N D
0
2
4
6
8
10
12
14
16
18
20
22 ∆ Tmax (aged-new) insulateda)
Month
Tem
pera
ture
diff
eren
ce (
°C)
J F M A M J J A S O N D
0
2
4
6
8
10
12
14
16
18
20
22 ∆ Tmax (aged-new) insulatedb)
Figure 9: Difference between maximum daily temperatures of an aged white membrane (ρs =
0.56) and a white new membrane (ρs = 0.80) over 20 cm of expanded polystyrene (a) or over a non-insulated roof (b).
When the roof is not insulated, the surface temperature of the new membrane would
range from -2°C to +31°C, while if the membrane is soiled, the temperature would exceed
+40°C. These peak temperatures differ because the maximum temperatures are reached at
different times due to the different relative importance of air temperature and solar radiation
and the variation in the thermal conductivity of building materials with temperature.

Paolini et al. (2014). Energy and Buildings - http://dx.doi.org/10.1016/j.enbuild.2014.08.008
20/26
On a typical peak summer day (i.e., maximum irradiance of 860 W m-2 and air
temperature of 30°C), a highly insulated soiled roof may be 16°C hotter than the same roof
when the membrane is new; even without insulation, the peak difference between the soiled
and clean membrane is nearly 10°C (Figure 10a).
2 4 6 8 10 12 14 16 18 20 22 24
15
20
25
30
35
40
45
50
55
Local standard time
Tem
pera
ture
(°C
)
Exterior surface - 19 JULAged - insulatedAged - non-insulatedNew - insulatedNew - non-insulated
a)
2 4 6 8 10 12 14 16 18 20 22 24
-10
-5
0
5
10
15
20
25
30
Local standard time
Tem
pera
ture
(°C
)
Exterior surface - 16 JANAged membrane - non-insulatedNew membrane - non-insulatedAged membrane - insulatedNew membrane - insulated
b)
2 4 6 8 10 12 14 16 18 20 22 24
16
18
20
22
24
26
28
30
32
34
36
Local standard time
Tem
pera
ture
(°C
)
Interior surface - 19 JUL
Aged - non-insulated
New - non-insulated
Aged - insulated
New - insulated
c)
2 4 6 8 10 12 14 16 18 20 22 24
4
6
8
10
12
14
16
18
20
22
24
Local standard time
Tem
pera
ture
(°C
)
Interior surface - 16 JAN
Aged - insulated
New - insulated
Aged - non-insulated
New - non-insulated
d)
Figure 10: Exterior surface temperature of a white soiled membrane and of the same membrane when clean (a) for 19th July and (b) for 16th January; difference between the interior (ceiling) surface temperature of a roof with a white soiled membrane and with the same membrane when clean (c) for 19th July and (d) for 16th January.
Paolini et al. (2014). Energy and Buildings - http://dx.doi.org/10.1016/j.enbuild.2014.08.008
21/26
On a cold but sunny day in Milano (i.e., maximum irradiance of 230 W m-2 and air
temperature of 3.5°C), the peak differences between the soiled and clean membranes over an
insulated or non-insulated roof may be, respectively, 5.7°C and 2.6°C (Figure 10b). If the roof
is highly insulated, the influence of the variation in solar reflectance on the ceiling surface
temperature is negligible, while in the case of poor or no insulation, a soiled roof may be even
5.6°C hotter on the interior than a clean roof in summer and nearly 1.4°C hotter in winter
(Figure 10c,d).
6. Conclusions
Cool roofs are effective at mitigating heat islands and reducing the cooling energy needs of
buildings, but weathering and soiling may strongly affect their solar reflectance, especially in
polluted urban environments.
Twelve commercially available roofing membranes with initial solar reflectances
ranging from 0.26 and 0.84 were selected. Samples of each were exposed to the natural
rooftop environments in two major European urban areas: Roma and Milano. Their solar
spectral reflectances were measured before exposure and after 3, 6, 12, 18, and 24 months of
exposure. The results showed that ageing, which was mainly caused by weathering and
soiling but not mould growth, strongly affects the solar reflectance of roofing membranes,
even within the first few months. The most reflective membranes (S0ρ > 0.80) lost 0.14 in
Roma and 0.22 in Milano on average after 2 years of natural ageing. Cool-coloured materials
were subject to lower losses due to soot than standard materials with the same solar
reflectance but lower NIR reflectances because the absorbance of soot particles decreases
with increasing wavelength and because the most relevant impact of weathering is between
420 and 600 nm.

Paolini et al. (2014). Energy and Buildings - http://dx.doi.org/10.1016/j.enbuild.2014.08.008
22/26
The loss of reflectance impacts the energy needs of buildings and the surface
temperature of the roofing membrane. To quantify this aspect, representative commercial
buildings in Roma and Milano with a new white flat roof ( Sρ = 0.80) and with an aged roof
( Sρ equal to 0.64 for Roma and 0.56 for Milano, as computed from the regression of
experimental data to take into account the average loss) were modelled. For highly insulated
buildings, the annual cooling savings were shown to be reduced by 4.1-7.1 MJ m-2 y-1 per 0.1
loss in reflectance, while for non-insulated buildings, the loss of cool roof savings due to
ageing was shown to be 58-71 MJ m-2 y-1 in Milano and 70-84 MJ m-2 y-1 in Roma. In all
considered cases, ageing yielded a reduction of the cooling savings that could be achieved
with a new white membrane of approximately 14-23% for the building in Roma and of 20-
34% in Milano.
Reflectance loss also impacted the peak cooling power demand, with a difference of 2-
3 kW in the considered case study. Moreover, an aged white ( Sρ = 0.56) highly insulated roof
in Milano under peak summer conditions may reach a surface temperature 16°C higher than a
new roof ( Sρ = 0.80).
The impact of ageing on the optical-radiative performance of building envelope
materials is thus relevant and must be considered in the modelling and design of sustainable
and durable near-zero energy buildings. Thus, there is a need to develop a new generation of
cool roofing materials that should be easy to clean and able to retain their initial solar
reflectance for as long as possible.
Acknowledgments
This work was funded by the Italian Ministry for Economic Development with the projects
“Valutazione delle prestazioni di cool materials esposti all'ambiente urbano” and “Sviluppo di
Paolini et al. (2014). Energy and Buildings - http://dx.doi.org/10.1016/j.enbuild.2014.08.008
23/26
materiali e tecnologie per la riduzione degli effetti della radiazione solare”; and by Politecnico
di Milano & Agenzia delle Entrate (Italian Revenue Agency) with the project “Cinque per
mille junior - Rivestimenti fluorurati avanzati per superfici edilizie ad alte prestazioni”. The
authors wish to thank Florian Antretter and Daniel Zirkelbach (Fraunhofer Institut für
Bauphysik) for precious suggestions about hygrothermal simulations; and Hugo Destaillats,
Ronnen Levinson, and Mohamad Sleiman (Lawrence Berkeley National Laboratory) for
valuable exchanges about the analysis of UV-Vis-NIR spectral data. The authors gratefully
acknowledge anonymous reviewers, who provided relevant and helpful suggestions to
improve the presentation of results.
References
[1] P. Bacci, M. Maugeri, The urban heat island of Milan, Nuovo Cim. C. 15 (1992) 417–424. http://dx.doi.org/10.1007/BF02511742.
[2] A.M. Rizwan, L.Y.C. Dennis, C. Liu, A review on the generation, determination and mitigation of Urban Heat Island, J. Environ. Sci. 20 (2008) 120–128. http://dx.doi.org/10.1016/S1001-0742(08)60019-4.
[3] C.S.B.S.B. Grimmond, M. Roth, T.R.R. Oke, Y.C.C. Au, M. Best, R. Betts, et al., Climate and more sustainable cities: Climate information for improved planning and management of cities (Producers/Capabilities Perspective), in: Procedia Environ. Sci., 2010: pp. 247–274. http://dx.doi.org/10.1016/j.proenv.2010.09.016.
[4] S. Hassid, M. Santamouris, N. Papanikolaou, A. Linardi, N. Klitsikas, C. Georgakis, et al., Effect of the Athens heat island on air conditioning load, Energy Build. 32 (2000) 131–141. http://dx.doi.org/10.1016/S0378-7788(99)00045-6.
[5] M. Santamouris, N. Papanikolaou, I. Livada, I. Koronakis, C. Georgakis, a Argiriou, et al., On the impact of urban climate on the energy consumption of buildings, Sol. Energy. 70 (2001) 201–216. http://dx.doi.org/10.1016/S0038-092X(00)00095-5.
[6] M. Kolokotroni, I. Giannitsaris, R. Watkins, The effect of the London urban heat island on building summer cooling demand and night ventilation strategies, Sol. Energy. 80 (2006) 383–392. http://dx.doi.org/10.1016/j.solener.2005.03.010.
[7] M. Kolokotroni, X. Ren, M. Davies, A. Mavrogianni, London’s urban heat island: Impact on current and future energy consumption in office buildings, Energy Build. 47 (2012) 302–311. http://dx.doi.org/10.1016/j.enbuild.2011.12.019.
[8] H. Akbari, M. Pomerantz, H. Taha, Cool surfaces and shade trees to reduce energy use and improve air quality in urban areas, Sol. Energy. 70 (2001) 295–310. http://dx.doi.org/10.1016/S0038-092X(00)00089-X.
Paolini et al. (2014). Energy and Buildings - http://dx.doi.org/10.1016/j.enbuild.2014.08.008
24/26
[9] T. Poli, L. Pietro Gattoni, R. Paolini, G. Pansa, M. Favaron, S. Pilati, The Influence of the Urban Heat Island over Building Energy Demand: The Case of Milan, in: Seventh Int. Conf. Urban Clim., Yokohama, Japan, 2009: pp. 1–4. http://www.ide.titech.ac.jp/~icuc7/extended_abstracts/pdf/384633-1-090521000651-002.pdf.
[10] T. Toppi, P. Zangheri, R. Paolini, Simplified Method for Modification of Weather Data File for Energy Simulations within Urban Areas, in: R. Paolini (Ed.), 8th Work. Meet. CIB W108 - Clim. Chang. Built Environ., Maggioli editore, Milan, Italy, 2009: pp. 65–70. http://www.irbnet.de/daten/iconda/CIB16454.pdf.
[11] A.H. Rosenfeld, H. Akbari, J.J. Romm, M. Pomerantz, Cool communities: strategies for heat island mitigation and smog reduction, Energy Build. 28 (1998) 51–62. http://dx.doi.org/10.1016/S0378-7788(97)00063-7.
[12] R. Levinson, H. Akbari, S. Konopacki, S. Bretz, Inclusion of cool roofs in nonresidential Title 24 prescriptive requirements, Energy Policy. 33 (2005) 151–170. http://dx.doi.org/10.1016/S0301-4215(03)00206-4.
[13] A. Synnefa, M. Santamouris, H. Akbari, Estimating the effect of using cool coatings on energy loads and thermal comfort in residential buildings in various climatic conditions, Energy Build. 39 (2007) 1167–1174. http://dx.doi.org/10.1016/j.enbuild.2007.01.004.
[14] M. Zinzi, Cool materials and cool roofs: Potentialities in Mediterranean buildings, Adv. Build. Energy Res. 4 (2010) 201–266. http://dx.doi.org/10.3763/aber.2009.0407.
[15] M. Zinzi, S. Agnoli, Cool and green roofs. An energy and comfort comparison between passive cooling and mitigation urban heat island techniques for residential buildings in the Mediterranean region, Energy Build. 55 (2012) 66–76. http://dx.doi.org/10.1016/j.enbuild.2011.09.024.
[16] C. Romeo, M. Zinzi, Impact of a cool roof application on the energy and comfort performance in an existing non-residential building. A Sicilian case study, Energy Build. 67 (2013) 647–657. http://dx.doi.org/10.1016/j.enbuild.2011.07.023.
[17] A.L. Pisello, F. Cotana, The thermal effect of an innovative cool roof on residential buildings in Italy: Results from two years of continuous monitoring, Energy Build. 69 (2014) 154–164. http://dx.doi.org/10.1016/j.enbuild.2013.10.031.
[18] P.J. Rosado, D. Faulkner, D.P. Sullivan, R. Levinson, Measured temperature reductions and energy savings from a cool tile roof on a central California home, Energy Build. (2014). http://dx.doi.org/10.1016/j.enbuild.2014.04.024.
[19] P. Berdahl, H. Akbari, L.S. Rose, Aging of reflective roofs: soot deposition., Appl. Opt. 41 (2002) 2355–60. http://www.ncbi.nlm.nih.gov/pubmed/12003230.
[20] P. Berdahl, H. Akbari, R. Levinson, W. a. Miller, Weathering of roofing materials – An overview, Constr. Build. Mater. 22 (2008) 423–433. http://dx.doi.org/10.1016/j.conbuildmat.2006.10.015.
[21] M. Ichinose, T. Inoue, Y. Sakamoto, Long-term performance of high-reflectivity exterior panels, Build. Environ. 44 (2009) 1601–1608. http://dx.doi.org/10.1016/j.buildenv.2008.10.003.
[22] M. Sleiman, G. Ban-Weiss, H.E. Gilbert, D. François, P. Berdahl, T.W. Kirchstetter, et al., Soiling of building envelope surfaces and its effect on solar reflectance—Part I: Analysis of roofing product databases, Sol. Energy Mater. Sol. Cells. 95 (2011) 3385–3399. http://dx.doi.org/10.1016/j.solmat.2011.08.002.
[23] M.V. Diamanti, R. Paolini, M. Zinzi, M. Ormellese, M. Fiori, M.P. Pedeferri, Self-cleaning ability and cooling effect of TiO2-containing mortars, in: NSTI Nanotechnol.

Paolini et al. (2014). Energy and Buildings - http://dx.doi.org/10.1016/j.enbuild.2014.08.008
25/26
Conf. Expo, NSTI-Nanotech, Washington, DC, USA, 2013: pp. 716–719. http://www.nsti.org/procs/Nanotech2013v3/10/T9.232.
[24] G.M. Revel, M. Martarelli, M.Á. Bengochea, A. Gozalbo, M.J. Orts, A. Gaki, et al., Nanobased coatings with improved NIR reflecting properties for building envelope materials: Development and natural aging effect measurement, Cem. Concr. Compos. 36 (2013) 128–135. http://dx.doi.org/10.1016/j.cemconcomp.2012.10.002.
[25] M. Sleiman, T.W. Kirchstetter, P. Berdahl, H.E. Gilbert, S. Quelen, L. Marlot, et al., Soiling of building envelope surfaces and its effect on solar reflectance – Part II: Development of an accelerated aging method for roofing materials, Sol. Energy Mater. Sol. Cells. 122 (2014) 271–281. http://dx.doi.org/10.1016/j.solmat.2013.11.028.
[26] A.G. Mainini, T. Poli, R. Paolini, M. Zinzi, L. Vercesi, Transparent Multilayer ETFE Panels for Building Envelope: Thermal Transmittance Evaluation and Assessment of Optical and Solar Performance Decay due to Soiling, Energy Procedia. 48 (2014) 1302–1310. http://dx.doi.org/10.1016/j.egypro.2014.02.147.
[27] N. Moise, M. Rogers, J. Rush, P. Shah, Annual Air Quality Monitoring Report 2010, Cleveland, OH, USA, 2010. http://www.clevelandhealth.org/assets/documents/health/communicable_disease/air_quality_report_2010_final_draft.pdf.
[28] S.E. Bretz, H. Akbari, Long-term performance of high-albedo roof coatings, Energy Build. 25 (1997) 159–167. http://dx.doi.org/10.1016/S0378-7788(96)01005-5.
[29] H. Akbari, A.A. Berhe, R. Levinson, S. Graveline, K. Foley, A.H. Delgado, et al., Aging and weathering of cool roofing membranes, Berkeley, CA, USA, 2005. http://escholarship.org/uc/item/3qb8j3k7.
[30] R. Levinson, P. Berdahl, a Asefawberhe, H. Akbari, Effects of soiling and cleaning on the reflectance and solar heat gain of a light-colored roofing membrane, Atmos. Environ. 39 (2005) 7807–7824. http://dx.doi.org/10.1016/j.atmosenv.2005.08.037.
[31] IGLAE, Codice di pratica delle impermeabilizzazioni (Practice code for waterproofing. In Italian), 2012. http://www.iglae.org.
[32] SIA, SIA 271. Waterproofing for buildings, (2007).
[33] ISO, ISO 2810. Paints and varnishes – Natural weathering of coatings - Exposure and assessment, (2004).
[34] ASTM, ASTM E 903-12. Standard Test Method for Solar Absorptance, Reflectance, and Transmittance of Materials Using Integrating Spheres, (2012). http://dx.doi.org/10.1520/E0903-12.
[35] R. Levinson, H. Akbari, P. Berdahl, Measuring solar reflectance-Part I: Defining a metric that accurately predicts solar heat gain, Sol. Energy. 84 (2010) 1717–1744. http://dx.doi.org/10.1016/j.solener.2010.04.018.
[36] ISO, ISO 9050 - Glass in building - Determination of light transmittance, solar direct transmittance, total solar energy transmittance, ultraviolet transmittance and related glazing factors, (2003).
[37] A. Holm, H.M. Kuenzel, K. Sedlbauer, The Hygrothermal Behaviour of Rooms : Combining Thermal Building Simulation and Hygrothermal Envelope Calculation, in: Eighth Int. Build. Perform. Simul. Assoc. Conf., Eindhoven, Netherlands, 2003: pp. 499–506. http://www.ibpsa.org/%5Cproceedings%5CBS2003%5CBS03_0499_506.pdf.

Paolini et al. (2014). Energy and Buildings - http://dx.doi.org/10.1016/j.enbuild.2014.08.008
26/26
[38] F. Antretter, F. Sauer, T. Schöpfer, A. Holm, Validation of a hygrothermal whole building simulation software, in: 12th Conf. Int. Build. Perform. Simul. Assoc., Sydney, Australia, 2011: pp. 1694–1701. http://www.ibpsa.org/proceedings/bs2011/p_1554.pdf.
[39] H.M. Künzel, Simultaneous Heat and Moisture Transport in Building Components One- and two-dimensional calculation using simple parameters., Fraunhofer IRB Verlag, Stuttgart, Germany, 1995. http://www.hoki.ibp.fraunhofer.de/ibp/publikationen/dissertationen/hk_dissertation_e.pdf.
[40] R. Levinson, H. Akbari, L.M. Gartland, Impact of the temperature dependency of fiberglass insulation R-value on cooling energy use in buildings, in: ACEEE 1996 Summer Study Energy Effic. Build., 1996. http://www.osti.gov/scitech/biblio/451183.
[41] ISO, ISO 10456. Building materials and products - Hygrothermal properties - Tabulated design values and procedures for determining declared and design thermal values, (2007).
[42] CEN, EN 15251. Indoor environmental input parameters for design and assessment of energy performance of buildings addressing indoor air quality, thermal environment, lighting and acoustics, (2007).
[43] P. Berdahl, H. Akbari, R. Levinson, J. Jacobs, F. Klink, R. Everman, Three-year weathering tests on asphalt shingles: Solar reflectance, Sol. Energy Mater. Sol. Cells. 99 (2012) 277–281. http://dx.doi.org/10.1016/j.solmat.2011.12.010.
[44] ARPA Lazio, Air quality data of ARPA Lazio, Agenzia Regionale per la Protezione Ambientale del Lazio (Environmental Protection Agency of Lazio region, Italy), (2015). www.arpalazio.it.
[45] ARPA Lombardia, Air quality data of ARPA Lombardia, Agenzia Regionale per la Protezione Ambientale della Lombardia (Environmental Protection Agency of Lombardia region, Italy), (2015). http://www2.arpalombardia.it/.
[46] J.D. Lindberg, R.E. Douglass, D.M. Garvey, Carbon and the optical properties of atmospheric dust., Appl. Opt. 32 (1993) 6077–81. http://dx.doi.org/10.1364/AO.32.006077.
Top Related
Copyright © 2022 FDOKUMEN

