


Bahasa
Halaman
Hukum

Earnings Smoothing, Governance and Liquidity: International Evidence
Ryan LaFond Massachusetts Institute of Technology
Mark Lang
University of North Carolina
Hollis A. Skaife University of Wisconsin
March 2007 We thank the seminar participants at Carnegie Mellon University and the University of North Carolina Global Issues in Accounting Conference for their comments.
Earnings Smoothing, Governance and Liquidity: International Evidence
Abstract We examine the relation between earnings smoothing, governance and liquidity for a sample of non-U.S. firms. We divide smoothing into innate and discretionary components, and find that discretionary smoothing is increasing in incentives to smooth (greater tax-book conformity, concentrated ownership, related party transactions and weak overall governance) and decreasing in oversight (investor protection, analyst following and ADR listing). Given the potential for smoothing to affect transparency, we examine the relation between smoothing and investors’ willingness to transact in the stock as reflected in liquidity. After controlling for other liquidity determinants, we find that firms with greater levels of discretionary smoothing experience lower liquidity as evidenced by greater frequency of zero returns days, lower trading volume and higher bid-ask spreads. In contrast, results for innate smoothing suggest that innate smoothing is positively correlated with liquidity. Taken together, our results suggest that investors differentiate between innate and discretionary smoothing, and discretionary smoothing reduces their willingness to transact in the stock.
Earnings Smoothing, Governance and Liquidity: International Evidence
I. Introduction
In this paper, we investigate the relation between the earnings smoothing characteristics
of accruals, transparency and liquidity in the firm’s stock. Ideally, accruals increase the
transparency of reported accounting data relative to cash flows by better reflecting the
underlying economics of the firm. However, because accruals have a significant
discretionary component, their opportunistic application may increase opacity. One
economic consequence of transparency is that it may affect investors’ willingness to
transact in the firm’s shares. In particular, prior research suggests that reduced
transparency will tend to result in lower liquidity, raising transactions costs and
increasing the firm’s cost of capital.
We begin by dividing smoothing into innate and discretionary components
because much of the smoothness in earnings is a function of innate characteristics of the
firm and the natural role of accruals. For example, the smoothing properties of accruals
relative to cash flows naturally vary with differences in firm characteristics such as the
firm’s industry, operating cycle, growth, size and the inherent variability of the operating
environment. Innate accruals are more likely to be associated with increased
transparency to the extent that they reflect the underlying operating characteristics of the
firm. Discretionary accruals, on the other hand, are more likely to be driven by
managerial discretion potentially creating greater opacity in earnings.
To assess whether earnings smoothing reflects managerial discretion, we analyze
its relation with various corporate governance measures. We consider three types of
governance, (1) internal, firm-specific governance, as reflected in concentrated
ownership, (2) external, country-wide governance such as investor protection and the
alignment of tax and financial reporting, and (3) market oversight, as reflected in analyst
following. After controlling for firm operating characteristics that inherently are related
to smoothing, we find, consistent with predictions, that earnings smoothing tends to be
more pronounced when managers have incentives to smooth (concentrated managerial
ownership and greater tax/book conformity) and the impediments are less pronounced
(weaker investor protection, less analyst coverage and for firms not cross listed on US
markets).
We also apply a broader governance measure based on ratings provided by
Governance Metrics International (GMI), which reflects not only the assessment of a
firm’s ownership structure, but also captures a firm’s governance related to board
structure, financial information quality, and shareholder rights. In addition, we consider
the GMI ranking for related party transactions, because related party transactions provide
particular opportunities for expropriation and, therefore, particular incentives for opacity.
While the sample size drops substantially using the GMI data and we are limited to the
largest firms where governance is likely to be less of an issue, our results are consistent in
suggesting that discretionary smoothing is lower for firms with high governance
rankings, especially with respect to related party transactions.
Given that discretionary smoothing appears to be predictably correlated with
incentives and impediments for earnings management, we examine whether it has effects
on trading in a firm’s shares. In particular, if discretionary smoothing creates opacity, it
should affect investors’ willingness to trade. As argued in Lesmond (2005), investors
4

will be hesitant to trade if there are concerns over the adequacy of information available
to them and bid/ask spreads will increase, increasing transactions costs.1 Bekaert,
Harvey and Lundblad (2006) develop a model to illustrate that liquidity can affect
expected returns even under full market integration.
Following research like Lesmond (1999) and Bekaert et al. (2006), we use three
measures of liquidity: the proportion of zero-return days, bid-ask spreads, and trading
volume. We examine the relation between discretionary smoothing, innate smoothing,
and these three measures of liquidity because each measure has advantages and
disadvantages as an empirical proxy for liquidity in international markets.
Our results provide evidence of a relation between innate smoothing,
discretionary smoothing and liquidity. In particular, our evidence suggests that firms
with greater evidence of discretionary smoothing experience significantly lower liquidity
as reflected in more frequent zero-return days, higher bid-ask spreads and lower trading
volumes, controlling for other factors. Results for innate smoothing are more dependent
on specification. However, where significant, they suggest that greater innate smoothing
is associated with greater liquidity. This result is striking because it suggests that innate
aspects of smoothing behave differently than the discretionary aspects. In other words,
reduced earnings variability that accompanies innate smoothing appears to be associated
with increased transparency, while discretionary smoothing appears to reduce
transparency.
A potential question is why managers would choose to smooth if it could have
negative effects on investors’ willingness to hold shares. In some cases, it may result
1 The disclosure literature contains numerous studies suggesting that transparency can affect investors’ willingness to transact in capital markets. See, for example, Verrecchia (2001) for an overview of the literature.
5

from managers creating opacity for personal gain. However, it is important to note that
smoothing, even if it reduces investors willingness to trade, may be optimal for the firm.
For example, in many countries stakeholders other than shareholders are important and
may create incentives to report smoother earnings. Labor unions, for instance, may
create incentives to smooth earnings because high profits attract greater compensation
demands and losses create concerns about viability. Similarly, firms may smooth
earnings to reduce perceived risk and attract lower interest rates on debt, lower taxes or
reduce political costs. Our results suggest that a firm’s tendency to undertake those types
of activities is particularly pronounced when financial reporting oversight is weak, few
analysts follow the firm and ownership is more concentrated. While smoothing may be
optimal in those situations, our results suggest a tradeoff in that increased smoothing can
reduce transparency, resulting in lower liquidity.2
Our results make several contributions to the literature.3 First, and most
importantly, we focus on an economic consequence of earnings smoothing. As noted
above, managers face tradeoffs, especially in international contexts, in applying
discretion. Our results suggest that one potential consequence of discretionary smoothing
is increased opacity and a resulting reduction in liquidity. The effect of variation in
earnings quality on liquidity is likely to be strongest in international settings where
incentives to manage earnings are stronger, oversight is weaker and liquidity issues are
2 Desai and Dharmapala (2006) make a similar point in reference to tax avoidance and earnings management. They observe that earnings management to reduce taxes can create opacity that also reduces equity holders’ ability to assess firm performance. 3 Our measures of earnings smoothing can also be interpreted in the context of timely loss (and gain) recognition. As discussed in Ball and Shivakumar (2005, 2006), timely loss recognition will tend to result in a less negative correlation between accruals and cash flows because periods of poor cash flows also typically indicate likely decreases in the present value of future cash flows. As a consequence, timely loss recognition will be reflected in negative accruals in periods of poor cash flows, attenuating the natural negative relation between accruals and cash flows and creating greater volatility in the earnings stream.
6
more pronounced. Our results suggest that smoothing is associated with higher
transactions costs and less trading. While it is always difficult to draw strong inferences
on causality, our results suggest that one potential consequence of smoothing is an
increase in opacity reflected in transactions costs. Because reduced transparency is likely
to affect investors’ willingness to hold a stock and the required expected return on the
stock, our results provide evidence on a potential cost of earnings smoothing.
Second, we differentiate between innate and discretionary earnings smoothing.
By their very nature, accruals affect the variability of earnings relative to cash flows, and
that relation can affect the information environment of the firm. Therefore, it is
important to separate out the smoothing effects of accruals that occur naturally in the
firm’s operating environment from those that reflect managerial discretion. The fact that
our measure of discretionary smoothing is correlated with variables that likely reflect
incentives for, and limits on, earnings management, and behaves differently in the
liquidity tests than does innate smoothing provides greater confidence that our results do
not reflect omitted correlated variables.
Further, our results potentially help bridge the gap between the notion that
smoothing can convey information about the underlying economics of the firm and the
notion that earnings management can create opacity. Our results suggest that innate
smoothing may reflect increased transparency, while discretionary smoothing tends to
reduce transparency. Perspectives on smoothing differ in the literature, with research
such as Dichev and Tang (2005) suggesting that smoothing is a function of matching and
can enhance transparency while research such as Leuz, Nanda and Wysocki (2003)
argues that opportunistic smoothing reduces transparency. Our results suggest that both
7
factors may be at work in practice, with innate smoothing increasing transparency and
discretionary smoothing increasing opacity. While the former effect may dominate in US
settings, where governance tends to be relatively strong, our results suggest that the latter
effect may be particularly pronounced in international settings where incentives to
manage earnings tend to be relatively strong and oversight relatively weak.
Finally, our earnings smoothing analysis is at the individual firm level. Research
such as Bhattacharya, Daouk and Welker (2003) and Leuz et al. (2003) provides evidence
of effects of earnings smoothing at the country level with a focus on across country
variation driven by things like differences in investor protection environment. While
there are advantages in that approach, we posit and provide evidence that there is also
substantial within-country variation in incentives to smooth and the consequences for
liquidity.
In the next section, we discuss the related literature and our hypotheses. The
methodology and data are presented in Section III. Section IV presents the results,
followed by conclusions in Section V.
II. Related Literature
Our research is related to several streams of literature. As mentioned earlier, Leuz et al.
(2003) and Bhattacharya et al. (2003) provide country-level evidence on the causes and
consequences of earnings management. Leuz et al. (2003) examine earnings
management in 31 countries, and provides evidence that earnings management is more
pronounced in countries where anti-director rights and legal enforcement are weaker, and
where the average block premium is larger. Our evidence is consistent with their results
in that we also find evidence of increased smoothing for firms in countries with weak rule
8
of law. Because our analysis is at the firm level, we are also able to document the effects
of firm-specific governance and analyst following on smoothing.
Haw, Hu, Hwang and Wu (2004) examine the relation between the absolute value
of discretionary accruals and the divergence between control rights and cash flow rights
for a sample of European and East Asian firms. Overall, they find an unexpected
negative relation between discretionary accruals and the divergence between control and
cash flow rights, but find that the effect of the divergence is mitigated when legal and
extra-legal institutions are strong. However, as discussed in Wysocki (2004), there is no
evidence of correlation between the Haw et al. (2004) measures of earnings discretion
and earnings smoothing, or between their measure of earnings discretion and measures of
accounting and disclosure quality from previous research.
Burgstahler, Hail and Leuz (2006) document that earnings management in general
is greater for private than for public firms and that strong legal systems result in less
earnings management for both public and private firms. In his discussion of Lang, Raedy
and Wilson (2006), Leuz (2006) documents that earnings management is correlated with
ownership concentration and home-country institutions. Our analysis complements prior
research by incorporating a range of potential determinants of discretionary smoothing
and providing consistent evidence of a link between governance-related factors and
smoothing.
There is less research on the link between earnings attributes and capital market
outcomes in international contexts. Bhattacharya et al. (2003) investigates, at the country
level, the relation between country-wide aggressive loss recognition, loss avoidance and
smoothing on cost of equity capital. Although they provide some evidence that earnings
9
attributes affect country-level cost of capital, their evidence varies based on the
component measure of cost of capital. They provide evidence that countries with more
earning aggressiveness (higher levels of accruals deflated by total assets) experience
higher cost of capital. Their earnings smoothing measure (correlation between changes
in accruals and changes in cash flows) is insignificant in explaining cost of capital, but is
correlated with trading volume. Because our analysis focuses on across-firm
comparisons, we abstract from cross-country differences that may affect equity markets,
are able to control for a variety of other firm-specific factors that likely affect earnings
attributes and equity markets, and can focus on the discretionary portion of earnings
management. Further, while we do not attempt to directly measure cost of capital, our
results suggest that a mechanism by which earnings smoothing might affect cost of
capital is through its effect on liquidity. While liquidity is difficult to measure, especially
in international contexts, our results are consistent across all three measures, suggesting a
robust relation between discretionary smoothing and liquidity.
For US firms, Francis, LaFond, Olsson and Schipper (2004) provides evidence
that earnings attributes are correlated with ex ante cost of capital. Closest to our study,
they find that smoothing is negatively correlated with equity cost of capital. While we do
not examine cost of capital directly, our results complement theirs in suggesting that
innate smoothing may be correlated with improvements in liquidity, particularly lower
bid-ask spreads, which could reduce cost of capital. However, we also find that the
discretionary component of smoothing is negatively correlated with all three of our
liquidity measures, suggesting that excessive smoothing can reduce transparency,
particularly in international contexts.
10
Our two hypotheses (in alternative form) are as follows:
H1: Discretionary smoothing is positively related to weak governance.
H2: Discretionary smoothing is negatively related to liquidity.
III. Methodology
We quantify earnings smoothing using two measures common in the literature. The first
earnings smoothing measure (SMTH1) captures the volatility of earnings relative to the
volatility of cash flows (Leuz et al. 2003, Francis, LaFond, Olsson and Schipper 2004).
Specifically, SMTH1 is the standard deviation of net income before extraordinary items
divided by the standard deviation of cash flow from operations, where net income before
extraordinary items and cash flow from operations are scaled by average total assets. We
calculate the standard deviations using rolling time intervals requiring a minimum of
three and a maximum of five years of data. Cash flow from operations is equal to net
income before extraordinary items minus accruals, where accruals are defined as the
change in current assets minus the change in current liabilities minus the change in cash
plus the change in current debt in current liabilities minus depreciation and amortization
expense. SMTH1 is multiplied by negative one so that larger values, i.e., values closer to
zero, represent more smooth earnings.
The second earnings smoothing measure (SMTH2) is equal to the correlation
between the cash flow from operations scaled by total assets and total accruals scaled by
total assets (Lang et al., 2006, Barth, Landsman and Lang, 2006).4 SMTH2 is multiplied
4 Leuz et al. (2003) and Bhattacharya et al. (2003) calculate the correlation-based measure using the change in cash flows from operations and the change in total accruals, whereas our correlation measure is based on the level. We draw identical inferences when defining SMTH2 based on changes; however, the sample sizes are smaller due to the additional data requirements of the change measures.
11
by negative one so that firms with larger SMTH2 values (i.e., values closer to one)
represent firms with more smooth earnings.
III.I Sample
Table 1 presents the number of firm-year observations and descriptive statistics
on SMTH1 and SMTH2 for the 21 sample countries: Australia, Austria, Belgium,
Canada, Denmark, Finland, France, Germany, Greece, Hong Kong, Ireland, Italy, Japan,
the Netherlands, New Zealand, Norway, Singapore, Spain, Sweden, Switzerland, and the
U.K. We select these 21 countries because they have relatively well-developed capital
markets and managers face diverse incentives to smooth earnings because of the
differences in governance attributes across firms domiciled in these countries.
Accounting and market data are collected from Datastream Advanced (a collaboration of
market statistics from Datastream and accounting data from WorldScope) over the 1994-
2005 time period. We require firm-year observations to have the necessary income
statement and balance sheet data to calculate cash flows, accruals, and operating
characteristic variables.
Table 1 highlights that, on average, firms domiciled in Greece, Austria, and Italy
report the most smoothed earnings whereas Norwegian, Swedish, and Canadian firms
report the least smoothed earnings. The descriptive statistics on SMTH1 and SMTH2
and rank ordering of countries are generally consistent with those reported in Leuz et al.
(2003) and Bhattacharya et al. (2003), respectively.
III.2 Determinants of Smoothing
Ball et al. (2000) suggests that country-specific institutional factors contribute to a
manager’s set of reporting incentives. The first governance variable we consider is the
12
antidirector rights index of LaPorta et al. (1998) label RIGHTS. Prior research
documents that firms domiciled in countries with weak investor protection report more
smooth earnings (Leuz et al. 2003). An explanation for this finding is that in countries
with weak investor protection, managers face greater incentives and have the ability to
smooth earnings to conceal opportunistic behavior. We add RIGHTS to our smoothing
model to proxy for greater incentives to smooth earnings when there is weak investor
protection.5
Another institutional factor posited to contribute to managers' reporting incentives
is the alignment between tax and financial reporting (Alford et al. 1993; Ali and Hwang
2000; Kasanen et al. 1996). In some countries, tax-reporting rules require managers to
use similar accounting methods for tax reporting and financial reporting, i.e., there is a
high degree of tax-book conformity. In general, it is optimal for managers to smooth
earnings for tax reporting in order to minimize the likelihood of large tax payments or to
avoid tax losses that may provide reduced benefits to the firm. We posit that when there
is a high alignment between tax reporting and financial reporting, the incentives
managers face to smooth earnings for taxes will carry over to smoother accounting
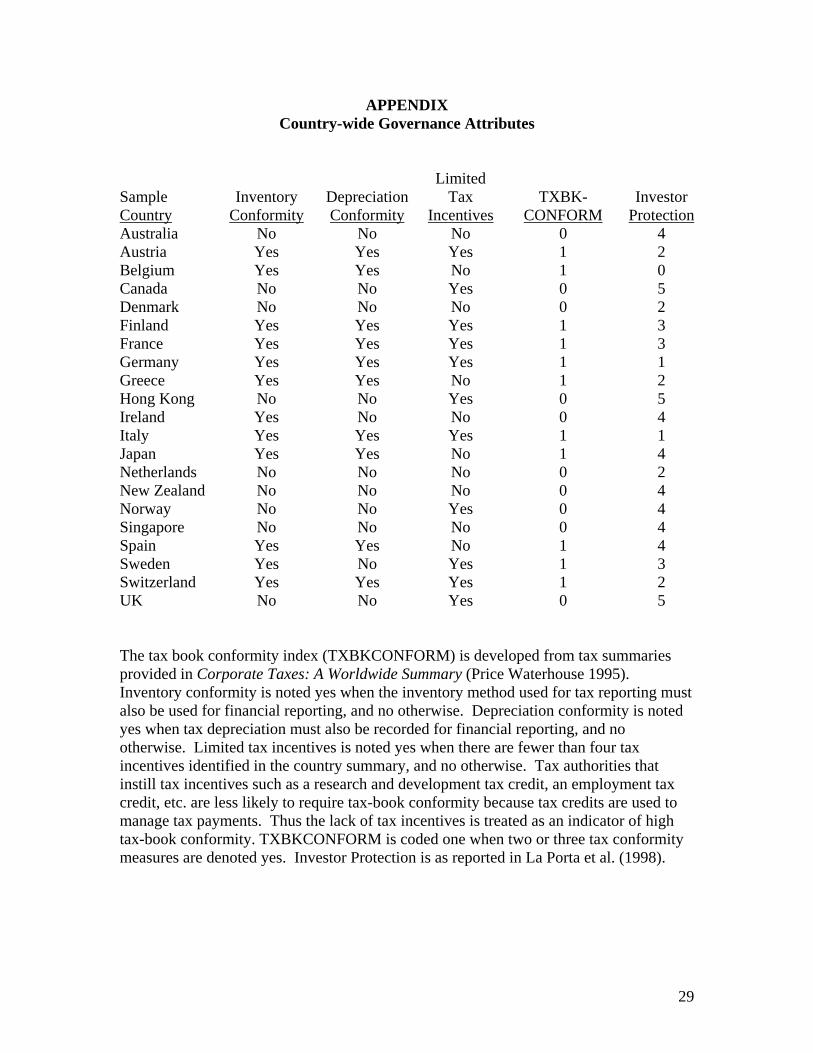
earnings. Thus, the second governance attribute studied is TXBKCONFORM, which is
coded one for firms domiciled in countries that have high tax-book conformity, and zero
otherwise. Our measure of TXBKCONFORM is based on Ashbaugh and LaFond (2003)
and details of its construction by sample country are provided in the Appendix.
5 As a sensitivity test, we replace RIGHTS with LAW; a categorical variable coded one for firms domiciled in common law countries and zero otherwise (La Porta et al. 1997). We do not include both measures in our model because the Pearson (Spearman) correlation between LAW and RIGHTS is 0.64 (0.76). When we substitute LAW for RIGHTS the results of the analysis are consistent with those reported in the tables.
13

As noted above, we posit that there is likely to be substantial within-country
variation in managers’ incentives to smooth earnings, and there are factors that can
mitigate or enhance managers’ ability to act on those incentives. First, the effective
regulatory environment of firms may vary depending on whether they list on US
exchanges. The stringency of accounting standards followed and scrutiny of regulators
over a firm’s financial reporting affects the quality of firm’s financial information
(Securities and Exchange Commission [SEC] 2000). U.S. GAAP is considered by many
to be the most stringent set of accounting standards because of the more constrained
measurement standards and the number of required disclosures relative to International
Financial Reporting Standards or country-specific accounting principles. Managers of
U.S. foreign issuers may be less able to smooth because they are required to report U.S.
GAAP earnings.6 The additional oversight over financial reporting by the SEC is also
expected to attenuate managers’ incentives to smooth earnings. Thus, we posit that the
incentives to smooth earnings are less for U.S. foreign issuers relative to firms not listed
with the SEC and use ADR, coded one for sample firms that are U.S. foreign issuers and
zero otherwise, to capture the disincentives to smooth earnings.
Oversight by informational intermediaries may affect firms’ incentives to smooth
earnings. We use analyst following (ANALYST) as a proxy for the demand for
transparent financial information by capital market participants.7 Analysts depend on
6 Pownall and Schipper (1999) suggests that non-U.S. firms required to prepare U.S. GAAP financial information may choose alternatives under International Accounting Standards or their domestic standards that align with U.S. GAAP as opposed to choosing alternatives that maximize financial reporting objectives. Ashbaugh and Olsson (2002) and Lang, Ready and Wilson (2006) provide evidence consistent with this conjecture. 7 Analysts may potentially increase incentives for managers to smooth earnings to meet analysts’ earnings expectations, or may be attracted to firms that smooth less for other reasons. That is less of a concern with other measures such as regulatory environment, tax/book conformity, cross listing and ownership structure since those measures are less likely to be caused by smoothing. Research such as Yu (2006) suggests that
14

relevant financial reports, as well as other pieces of information, to develop their
forecasts of firms’ future earnings and stock recommendations. In this context, analysts
serve as a proxy for increased capital market monitoring of managers’ financial reporting
thereby potentially mitigating earnings management. Thus, we expect a negative relation
between ANALYST and the two smoothing measures.
The third firm-specific governance attribute that we consider is insider ownership.
We use the percent of shares that are closely held, %CLHLD, to proxy for insider
ownership (Himmelberg, Hubbard and Love, 2002; Lins and Warnock, 2004). While, in
theory, more concentrated ownership could result in increased monitoring of managers’
discretionary accounting practices, research like Lang, Lins and Miller (2003), Leuz, Lins
and Warnock (2005) and Leuz (2006) suggest that more concentrated ownership is
associated with increased agency issues internationally. As a consequence, we predict a
positive relation between %CLHLD and the smoothing measures.
In summary, we model earnings smoothness as a function of a firm’s operating
characteristics and governance attributes. The OLS regression model with industry fixed
effects used to test H1 is as follows:
ta iat
tt
tttt
ttttt
tttttt
IND
CLHLDANALYSTADRMTXBKCONFORRIGHTSRETSTDAVECFODIVIDENDOPLEVSGOPCYCLE
LOSSSALESSTDBMLEVLNTOTASSSMTH
εα
βββββββββββ
ββββββ
++
+++++++++++
+++++=
∑ =
60
1
1615
14131211
109876
543210
%_
%_
(1)
SMTH is set equal to SMTH1, defined as negative one times the ratio of the standard deviation of net income before extraordinary items scaled by average total assets to the standard deviation of cash flow from operations scaled by average total assets, where analyst following serves primarily as a source of capital market oversight and that analyst following appears to mitigate earnings management.
15
standard deviations are calculated using a minimum of three and maximum of five years of data, or SMTH2, defined as the correlation between cash flow from operations and total accruals where both measures are scaled by average total assets, multiplied by negative one, where correlations are calculated using a minimum of three and maximum of five years of data. The definitions of the operating characteristic variables are as follows: LNTOTASS is equal to the natural log of total assets measured in US dollars; LEV is equal to total debt divided by total assets; BM is equal to book value of common equity divided by market value of equity; STD_SALES is the standard deviation of sales scaled by total assets calculated requiring a minimum of three and maximum of five fiscal years; %LOSS is the proportion of years that a firm reports negative earnings, calculated requiring a minimum of three and maximum of five fiscal years; OPCYCLE is the natural log of the operating cycle measured in days, defined as 365*(average accounts receivable /sales)+365*(average inventory/cost of goods sold); SG is the average sales growth over the past three to five years; OPLEV is net property, plant and equipment over total assets; DIVIDEND is equal to cash dividends divided by average total assets; AVECFO is equal to the average cash flow from operations divided by average total assets over the past three to five fiscal years. All other variables are as previously defined.
We use size (LNTOTASS), leverage (LEV), book-to-market (BM), the standard
deviation in sales (STD_SALES), the percentage of losses (%LOSS), and length of
operating cycle (OPCYCLE) as measures of a firm’s operating characteristics that
naturally affect the variability of a firm’s cash flows (Francis et al. 2004). We also
include the BM ratio in the model to mitigate the effect of differences in the composition
of firms’ assets on smoothing. We include dividends paid (DIVIDEND), sales growth
(SG) and cash flows (AVECFO) as additional firm characteristics that affect the ability of
firms to smooth earnings.
III.3 Descriptive Statistics
Table 2 reports the descriptive statistics on the two smoothing measures as well as
the operating characteristic variables used to explain differences in the innate portion of
earnings smoothing. The mean (median) values of SMTH1 and SMTH2 after pooling all
firm-year observations are -0.635 (-0.513) and 0.720 (0.911) respectively. A typical
sample firm is relatively large (median LNTOTASS 12.301 USD), has a significant
16

amount of debt in its capital structure (median LEV 0.210) and is a fairly mature firm as
captured by a median BM value of 0.682. The median sample firm has sales volatility of
0.100, reports losses infrequently, has an operating cycle of 126 days and has experienced
5.9% sales growth over recent years. The average firm pays out 0.7% of assets in
dividends and has 29.3% of its assets invested in net property, plant, and equipment.
Table 2 also reports the descriptive statistics on the five governance attributes we
predict will affect managers’ incentives to report smooth earnings. The average firm in
our sample has an investor’s right score of 3.691 out of 6, where 6 represents a country
with the strongest investor protection. The mean TXBKCONFORM value of 0.583
indicates that 58.3% of our sample firms are from countries with a high degree of
conformity between tax and financial reporting. The descriptive statistics indicate that
just over 3% of the observations are associated with firms trading ADRs in the U.S.
The mean (5.111) and median (2.000) values of ANALYST indicate that some
sample firms have extensive analyst following whereas other sample firms have
relatively low analyst following, potentially affecting managers’ incentives to smooth
earnings. We also see that, for the median firm, 44.1% of shares are closely held,
suggesting that there are potential agency issues that create greater incentives to smooth.
IV. Results
IV.1 Incentives to Smooth
Our first hypothesis implies that earnings smoothing is affected by managers’ incentives
to smooth and that there exist firm-specific (i.e., internal) and institutional (i.e., external)
governance attributes that enhance or mitigate managerial incentives to smooth earnings.
17

Table 3 reports the regression results of estimating the earnings smoothing model
using SMTH1 and then SMTH2. Significance levels are based on Fama-MacBeth (1973)
t-statistics to control for potential cross correlation in residuals. Because of the reduction
in sample size due to data limitations on %CLHLD, we table the results of estimating
equation (1) with and without the closely held incentive attribute. However, we discuss
the results of both analyses because there are no significant differences in the findings.
Regardless of smoothing measure, the results indicate that firms with more leverage,
higher BM and greater sales growth report smoother earnings. Firms with less volatile
sales, less frequent losses and less investment in fixed assets report smoother earnings.
The model also suggests that firms paying less dividends report smoother earnings,
although the relation is not always statistically significant. The only inconsistencies
across the two models are that average cash flows are negatively related to SMTH1 but
positively related to SMTH2, and that the length of a firm’s operating cycle is not
significantly related to SMTH1, whereas firms with longer operating cycles report
smoother earnings when earnings smoothness is defined by SMTH2.
Turning to our primary governance variables, we find a negative relation between
RIGHTS and earnings smoothing indicating that managers report more smooth earnings
in countries with weak investor protection. This finding is consistent with prior research
that examines the relation between earnings smoothing and investor protection (Leuz et
al., 2003). Consistent with expectations, the positive and significant coefficient on
TXBKCONFORM indicates that managers are more likely to smooth earnings when
having to file tax information that conforms with financial information. This finding
18
suggests that managers in high tax book conformity countries face incentives to smooth
earnings for tax purposes.
As expected, we find a negative relation between ADR and earnings smoothing.
This finding indicates that managers of non-U.S. firms that face the regulatory oversight
of the SEC and restricted accounting measurement choices of U.S. GAAP have less of a
tendency to smooth earnings.
The results also indicate that higher analyst following is associated with less
smoothing as the coefficient on ANALYST is negative and highly significant. This
finding suggests that capital market monitoring plays an important role in diminishing
managers’ incentives to smooth earnings. The results also provide evidence that non-U.S.
firms’ ownership structures are associated with earnings smoothing. Specifically, we
find, after controlling for innate operating characteristics, firms with more closely held
shares engage in relatively more earnings smoothing. Taken together, the results reported
in Panel B of Table 5 suggest that concentrated ownership and tax book conformity
encourage earnings smoothing, but the incentives to smooth are mitigated in the presence
of strong investor protection, regulatory oversight over financial reporting, and
monitoring by capital market participants.
IV.2 Overall Internal Governance
In the analyses above we examine two internal and three external governance
mechanisms to draw inferences on whether governance mitigates the propensity for
managers to smooth earnings. To explore firms’ internal governance structure as a
whole, we replace %CLHLD with an overall measure of governance (GOVSCORE) that
is equal to the governance rating of the firm as reported in Governance Metrics
19

International (GMI). The GMI score reflects not only the assessment of a firm’s
ownership structure, but also captures a firm’s governance related to board structure,
financial information quality, and firm level shareholder rights. The GMI data are only
available for the fiscal 2004 and 2005 reporting period and only available for 1,122 firms,
substantially reducing the sample size and limiting the analysis to large, widely-followed
firms.
Within the GMI scoring system, one particular category of interest is the scrutiny
and disclosure of related party transactions (RELATEDPARTY), where higher values
indicate a greater existence and less scrutiny being placed on related party transactions.
If managers engage in related party transactions to expropriate the firm's resources, then
they have incentives to manage earnings to mask such expropriation (Gordon and Henry
2005). When there is no or little scrutiny over related party transactions, the manager has
greater incentives to expropriate firm resources and smooth earnings to create opacity.
Thus, we predict a positive relation between RELATEDPARTY and SMTH.
To test whether internal governance as a whole affects managers’ incentives to
smooth earnings and whether related party transactions have incremental smoothing
effects, we estimate the following OLS regression:
tt
tttt
ttttt
tttttt
YRTYRELATEDPARGOVSCOREANALYSTADR
AVECFODIVIDENDOPLEVSGOPCYCLELOSSSALESSTDBMLEVLNTOTASSSMTH
εβββββ
βββββββββββ
++++++
++++++++++=
04
%_
15
14131211
109876
543210
(2)
where all variables are previously defined.
Table 4 presents the results of estimating equation (2). As noted above, the
sample size is substantially reduced because we are estimating equation (2) for only two
years and the GMI data only cover the largest, most widely held companies. The
20

explanatory power of the operating characteristic and governance variables for SMTH
using the smaller sample is lower than when the model is estimated using the full sample,
perhaps reflecting the fact that the GMI firms tend to be larger and more homogeneous.
While the signs are generally consistent with the earlier models, the significance of the
estimated coefficients on the innate determinants of smoothing is reduced consistent with
the smaller sample size and greater homogeneity.
In terms of our primary variables of interest, after controlling for innate operating
characteristics we find evidence of a negative relation between SMTH and GOVSCORE
in both models, although it is only significant in the SMTH2 model, suggesting that firms
with stronger internal governance engage in less earnings smoothing. Furthermore, the
evidence suggests that a lack of scrutiny and disclosure of related party transactions
increases managers’ incentives to smooth earnings as reflected in a positive relation
between SMTH and RELATEDPARTY in both models.
While the inferences from the analyses presented in Table 4 should be viewed
with caution due to the sample and time period limitations, the overall results presented
in Table 4 are consistent with those in the preceding analyses and support H1 that
predicts that smoothing is more pronounced when governance is weak.
IV.3 Discretionary Smoothing and Liquidity
Our second hypothesis states that discretionary smoothing is expected to have negative
capital market consequences in terms of reduced liquidity. In particular, if excess
earnings smoothing reduces the information available to market participants, they will be
less willing to trade in a firm’s stock because of potential information asymmetries and
higher transaction costs. We use the predicted value of equation (1) estimated using only
21
the operating characteristic variables as a measure of innate smoothing that is inherent in
earnings prepared under the accrual basis of accounting (INNATE_SMTH1 or
INNATE_SMTH2). The difference between a firm’s predicted value and reported
smoothing measure (i.e., SMTH1 or SMTH2) is defined as discretionary smoothing
(DISCR_SMTH1 or DISCR _SMTH2, respectively), which we posit is affected by
managers’ incentives to smooth earnings and will result in reduced transparency and less
liquidity.
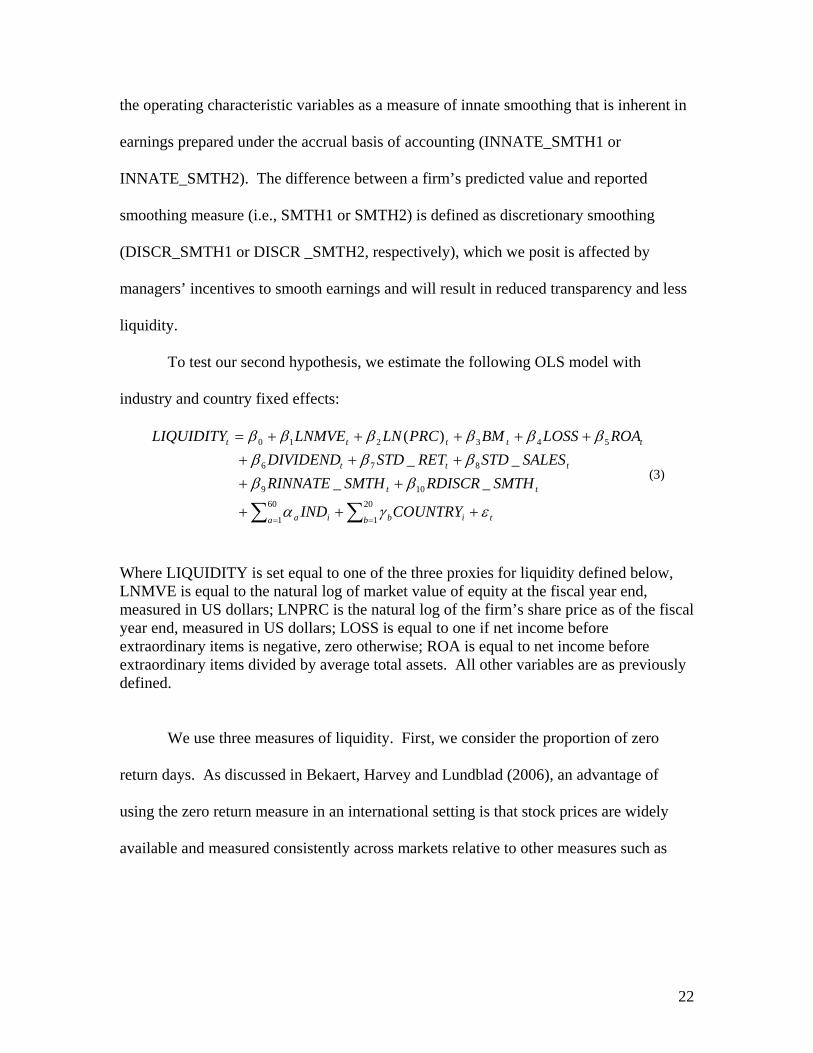
To test our second hypothesis, we estimate the following OLS model with
industry and country fixed effects:
tb iba ia
tt
ttt
ttttt
COUNTRYIND
SMTHRDISCRSMTHRINNATESALESSTDRETSTDDIVIDEND
ROALOSSBMPRCLNLNMVELIQUIDITY
εγα
βββββ
ββββββ
+++
+++++
+++++=
∑∑ ==
20
1
60
1
109
876
543210
____
)(
(3)
Where LIQUIDITY is set equal to one of the three proxies for liquidity defined below, LNMVE is equal to the natural log of market value of equity at the fiscal year end, measured in US dollars; LNPRC is the natural log of the firm’s share price as of the fiscal year end, measured in US dollars; LOSS is equal to one if net income before extraordinary items is negative, zero otherwise; ROA is equal to net income before extraordinary items divided by average total assets. All other variables are as previously defined.
We use three measures of liquidity. First, we consider the proportion of zero
return days. As discussed in Bekaert, Harvey and Lundblad (2006), an advantage of
using the zero return measure in an international setting is that stock prices are widely
available and measured consistently across markets relative to other measures such as
22
volume or bid-ask spreads.8 Lesmond et al. (1999) argues that a manifestation of high
transaction costs will be infrequent trading reflected in days without price movements.
Bekaert, Harvey and Lundblad (2006) apply the zero return measure in international
contexts and find that the measure predicts future returns and behaves like a priced
returns factor. Lesmond (2005) provides evidence that zero returns are a better proxy for
liquidity than is volume in international settings. Ashbaugh-Skaife, Gassen and LaFond
(2006) provide evidence that a zero return metric is a summary measure of the extent to
which firm-specific information is impounded in share price. Lesmond (2005)
demonstrates that more traditional measures of transactions costs such as bid-ask spreads,
where available, tend to be highly correlated with zero return days.
Following Bekaert, Harvey and Lundblad (2006), we define the zero-return metric
(ZR) as the number of zero-return trading days over the fiscal year divided by the total
trading days of the firm’s fiscal year and use it as our first LIQUIDITY measure. If
excess smoothing results in greater transaction costs, we expect a positive relation
between ZR and our DISCR_SMTH measures.
Our second proxy for transaction costs is the bid-ask spread
(BID_ASK_SPRD), measured as the average bid-ask spread over the fiscal year, where
the bid-ask spread is calculated as (ASK-BID)/((ASK+BID)/2). As noted in research like
Glosten and Milgrom (1985), information asymmetry can lead to increased bid-ask
spreads and reduced share prices (Amihud and Mendelson, 1996). In their international
study, Lesmond et al. (1999) argue that a scarcity of information will increase the bid-ask
8 We include country fixed effects in the model to control for potential cross country differences in the measurement of the liquidity variables.
23
spread. If excessive smoothing results in less useful financial information, we predict a
positive relation between BID_ASK_SPRD and discretionary smoothing.
We use trading volume (VOLUME) as our final proxy for liquidity. VOLUME is
equal to the number of shares traded over the fiscal year divided by the number of shares
outstanding. An opaque information environment can lead to lower trading volume
because of higher transaction costs and greater information asymmetry. Therefore we
expect a negative relation between discretionary smoothing and VOLUME. While
bid/ask spreads and trading volume are available for fewer firms and it is more difficult
to ensure that data are computed consistently across countries, these two measures of
market liquidity potentially provide important confirmatory evidence on the results for
zero returns measures.
The control variables, LNMVE, LN(PRC), BM, LOSS, ROA, DIVIDEND,
STD_RET, and STD_SALES, are added to the model for consistency with prior literature
studying our three liquidity measures (Lee, Mucklow and Ready1993; Welker 1995;
Chordia, Roll, and Subrahmanyam 2000; and Ertimur 2004). We transform
INNATE_SMTH and DISCR_SMTH into scaled percentile ranks, where values range
from zero to one, with higher values representing greater smoothing. The transformation
is necessitated by our earlier definition of SMTH, which cast SMTH as a non-positive
value to facilitate interpretation of the SMTH results.9
Table 5 displays the descriptive statistics for the dependent and independent
variables of equation (3). As stated above, data requirements to calculate
BID_ASK_SPREAD and VOLUME reduce the sample size relative to the %ZERORET
metric. The descriptive statistics indicate that sample firms, on average, have zero 9 Results are consistent for the raw (unranked) smoothing variables.
24

returns on 36.0% of the trading days in the year, have a spread of 3.6%, and 71.1% of
their shares outstanding trade over their fiscal year.
Panels A, B, and C of Table 6 display the results of estimating equation (4) using
the three measures of liquidity. Regardless of liquidity measure, the signs and
significance of the coefficients on the control variables, in general, allow us to draw
similar inferences across the three analyses, so we discuss them only once. The results
suggest that larger firms (LNMVE) are more liquid. In addition, the results suggest that
firms paying dividends (DIVIDEND) have greater liquidity as measured by bid-ask
spread or zero return days. In contrast, firms paying dividends have lower trading
volume. We find firms with more volatile returns (STD_RET) have fewer zero return
days and trade a greater proportion of their outstanding shares each year. For our sample
of international firms, the volatility of sales (STD_SALES) does not appear to have an
effect on bid-ask spreads or volume, but is negatively related to the zero-return days.
Turning to the variables of interest, panel A of Table 6 reports the results of the
zero-return analysis. When we bifurcate earnings smoothing into innate and
discretionary components, we find a significantly positive coefficient only on the
discretionary portion of earnings smoothing, i.e., RDISCR_SMTH. This finding suggests
that investors are less willing to trade in firms’ shares when managers report earnings that
are excessively smooth relative to underlying cash flows. We also find a marginally
significant negative coefficient on the innate portion of smoothing, i.e.,
RINNATE_SMTH, suggesting that the market values smoothing that comes about as a
result of operating characteristics.
25
The results displayed in panel B of Table 6 indicate that there is a negative and
significant coefficient on RINNATE_SMTH, indicating that expected smoothing as a
result of firms operations reduces information asymmetry. In contrast, the discretionary
portion of smoothing is positively associated with bid-ask spreads again suggesting that
excessive smoothing is associated with more opaque financial information that increases
transaction costs.
Finally, the results reported in panel C of Table 6 suggest that VOLUME is
adversely affected by discretionary smoothing. Here the coefficients on
RINNATE_SMTH are not statistically significant. However, as with the previous two
analyses, the coefficient on our primary variable of interest, RDISCR _SMTH, is
statistically negative for both specifications, indicating that firms that report excessively
smooth earnings trade a lower portion of their outstanding shares each year.
In summary, the results presented in Table 6 for all three of our liquidity measures
and both of our smoothing measures support our liquidity hypothesis (H2), which
predicts that discretionary smoothing results in less liquidity. Results for innate
smoothing are sometimes insignificant but, where significant, suggest that innate
smoothing is associated with enhanced liquidity. Taken together, the results highlight the
potential countervailing effects of innate and discretionary smoothing.
IV.4 Additional Analysis
First, we repeat the entire analysis after eliminating Japanese and UK firms
because these two countries add the most firms to our sample, potentially threatening the
external validity of our results. We draw similar inferences from the results after
eliminating Japanese and UK firms. Specifically, we continue to find support for both
26

H1 and H2 that discretionary smoothing is significantly reduced when firms have better
governance and greater discretionary smoothing significantly reduces liquidity.
Second, in testing H2, rather than pooling firm-year observations from all
countries, we estimate the smoothing model within each country. We then use the firm-
specific residuals and predicted values from the within-country estimates to test the
relation between discretionary and innate smoothing, and measures of liquidity. The
results of these analyses are similar to those reported in the tables. Specifically, we
continue to find that greater discretionary smoothing is significantly associated with
lower liquidity regardless of the liquidity measure used. In addition, we find that innate
smoothing, when significant, is associated with greater liquidity.
The results of these sensitivity analyses support our overall conclusions that better
governance is associated with reduced discretionary smoothing and that increased
discretionary smoothing is associated with reduced liquidity.
V. Conclusion
We examine the relation between earnings management via earnings smoothing,
governance and liquidity. Our evidence suggests that better governance mitigates
earnings smoothing. In particular, earnings smoothing is more prevalent when there is
weak investor protection, when fewer analysts follow the firm, when there is a greater
proportion of closely held shares, and when there is less scrutiny over related party
transactions. We also document that discretionary earnings smoothing has capital market
effects as evidenced by a negative relation between our measure of discretionary
smoothing and liquidity as measured by the frequency of zero-return days, bid-ask
27
spreads, and share volume. Our results suggest that firms that excessively smooth
earnings likely face lower liquidity and higher transactions costs, potentially increasing
cost of capital.
The results raise questions for future research. First, our study examined a limited
set of governance attributes. Future research can explore whether alternative governance
attributes reduce or increase firms’ smoothing. Second, we investigated only one capital
market consequence – liquidity – that proxies for transactions costs and has implications
for cost of capital. Future research can explore other capital market consequences and
whether other economic events (e.g., mandatory dividend payouts) affect incentives and
economic consequence of earnings management.
28
APPENDIX Country-wide Governance Attributes
Sample Country
Inventory
Conformity
Depreciation Conformity
Limited Tax
Incentives
TXBK-
CONFORM
Investor
ProtectionAustralia No No No 0 4 Austria Yes Yes Yes 1 2 Belgium Yes Yes No 1 0 Canada No No Yes 0 5 Denmark No No No 0 2 Finland Yes Yes Yes 1 3 France Yes Yes Yes 1 3 Germany Yes Yes Yes 1 1 Greece Yes Yes No 1 2 Hong Kong No No Yes 0 5 Ireland Yes No No 0 4 Italy Yes Yes Yes 1 1 Japan Yes Yes No 1 4 Netherlands No No No 0 2 New Zealand No No No 0 4 Norway No No Yes 0 4 Singapore No No No 0 4 Spain Yes Yes No 1 4 Sweden Yes No Yes 1 3 Switzerland Yes Yes Yes 1 2 UK No No Yes 0 5 The tax book conformity index (TXBKCONFORM) is developed from tax summaries provided in Corporate Taxes: A Worldwide Summary (Price Waterhouse 1995). Inventory conformity is noted yes when the inventory method used for tax reporting must also be used for financial reporting, and no otherwise. Depreciation conformity is noted yes when tax depreciation must also be recorded for financial reporting, and no otherwise. Limited tax incentives is noted yes when there are fewer than four tax incentives identified in the country summary, and no otherwise. Tax authorities that instill tax incentives such as a research and development tax credit, an employment tax credit, etc. are less likely to require tax-book conformity because tax credits are used to manage tax payments. Thus the lack of tax incentives is treated as an indicator of high tax-book conformity. TXBKCONFORM is coded one when two or three tax conformity measures are denoted yes. Investor Protection is as reported in La Porta et al. (1998).
29
REFERENCES
Ashbaugh, H., Collins, D., LaFond, R. 2006. The Effects of Corporate Governance on Firms’ Credit Ratings. Journal of Accounting and Economics, forthcoming. Ashbaugh, H., LaFond, R. 2004. Reporting Incentives and the Quality of Non-U.S. Firms’ Working Capital Accruals. Working paper, University of Wisconsin. Ashbaugh, H., Olsson P. 2002. An Exploratory Study of the Valuation Properties of Cross-listed Firms’ IAS and US-GAAP Earnings and Book Values. The Accounting Review 77: 107-126. Ball, R., L. Shivakumar. 2005. Earnings Quality in UK Private Firms: Comparative Loss Recognition Timeliness. Journal of Accounting and Economics 39: 83-128. Ball, R., L. Shivakumar. 2006. The Role of Accruals in Asymmetrically Timely Gain and Loss Recognition. Journal of Accounting Research 44: 207-242. Barth, M., Landsman, W., Lang, M. 2006. International Accounting Standards and Accounting Quality. Working paper, Stanford University. Bekaert, G., Harvey C., Lundblad C. 2006. Liquidity and Expected Returns: Lessons from Emerging Markets. Forthcoming, Review of Financial Studies. Bhattacharya, U., Daouk, H., Welker, M. 2003. The World Price of Earnings Opacity. The Accounting Review 78: 641-678. Breeden, R., 1994. Foreign Companies and U.S. Markets in a Time of Economic Transformation. Fordham International Law Journal 17. Burgstahler, D., Hail, L., Leuz, C. 2006. The Importance of Reporting Incentives: Earnings Management in European Private and Public Firms. The Accounting Review. October. Bushman, R. Smith, A. 2001, “Financial Accounting Information and Corporate Governance,” Journal of Accounting and Economics, Vol. 32, Nos. 1-3, December. Chordia, T., Roll, R., Subrahmanyam, A. 2000. Co-Movements in Bid-Ask Spreads and Market Depth. Financial Analysts Journal 56: 23–27. Desai, M., Dharmapala, D. 2006. Earnings Management and Corporate Tax Shelters. Working paper, Harvard University. Diamond, D., Verrecchia. 1991. Disclosure, Liquidity and the Cost of Capital. The Journal of Finance. Vol. XLVI, No. 4: 1325-1359. Dichev, I., Tang, W., 2005. Matching and the Volatility of Earnings. Working Paper.
30

Fama, E., MacBeth, J., 1973. Risk, return and equilibrium: empirical tests. Journal of Political Economy 81: 607-636. Francis, J., LaFond, R., Olsson, P., Schipper, K., 2004. Costs of Equity and Earnings Attributes, The Accounting Review 79, 967-1010. Gordon, E., Henry, E, 2005. "Related Party Transactions and Earnings Management" working paper. Haw, I., Hu, B., Hwang, L., Wu, W., 2004. Ultimate Ownership, Income Management and Extra-Legal Institutions. Journal of Accounting Research 42: 423-462. Himmelberg, C., Hubbard, R., Love, I. 2002. Investment, Protection, Ownership, and the Cost of Capital. Working Paper National Bank of Belgium. Jensen, M. C., Meckling W. H. , 1976. Theory of the Firm: Managerial Behavior, Agency Costs and Ownership Structure, Journal of Financial Economics. 3:305-60. La Porta, R., Lopez-de-Silanes, F., Shleifer, A., Vishny, R. 1998. Law and finance. Journal of Political Economy 106: 1113-1155.
La Porta, R., Lopez-de-Silanes, F., Shleifer, A. 1999. Corporate ownership around the world. Journal of Finance 54: 471-517. Lang, M., Lins, K., Miller, D. 2003. ADRs, analysts, and accuracy: Does cross listing in the United States improve a firm’s information environment and increase market value? Journal of Accounting Research 41: 317-345. Lang, M., Lins, K., Miller, D. 2004. Concentrated Control, Analyst Following, and Valuation: Do Analysts Matter Most When Investors are Protected Least? Journal of Accounting Research 42: 581-623. Lang, M., Smith Raedy, J., Wilson, W., 2006, Earnings Management and Cross Listing: Are Reconciled Earnings Comparable to U.S. Earnings? Journal of Accounting and Economics 42: 255-283. Lang, M., Raedy, J., Yetman, M., 2003. How Representative are Firms that are Cross Listed in the United States? An Analysis of Accounting Quality. Journal of Accounting Research 41: 363-386. Larcker, D, Richardson, S., Tuna, I., 2006. How Important is Corporate Governance? Working paper, Wharton School, University of Pennsylvania. Lee, C., Mucklow, B., Ready, M., 1993. Spreads, depths, and the impact of earnings information: an intraday analysis. Review of Financial Studies 6: 345-374.
31

Lesmond, D., Ogden, J., Trzcinka, J. 1999. A New Estimate of Transaction Costs. The Review of Financial Studies. 12: 1113-1141. Lesmond, D. 2005. Liquidity of Emerging Markets. Forthcoming Journal of Financial Economics. 77: 411-452. Leuz, C., 2006. Cross Listing, Bonding and Firms’ Reporting Incentives: A Discussion of Lang, Raedy and Wilson. Journal of Accounting and Economics 42: 284-296. Leuz, C., Nanda, D.,Wysocki, P. 2003. Earnings Management and Investor Protection: An International Comparison. Journal of Financial Economics 69: 505-527. Lins, K , Warnock, F. 2004. Corporate Governance and the Shareholder Base. ECGI - Finance Working Paper. Pownell, G., Schipper, K. 1999. Implications for Accounting Research for the SEC’s Consideration of International Accounting Standards for U.S. Securities Offerings. Accounting Horizons 13: 259-280. Shleifer, A., Vishny, R., 1997. A Survey of Corporate Governance. Journal of Finance Vol. LII, No. 2: 737-783. Tucker, J., Zarowin, P., 2006. Does Income Smoothing Improve Earnings Informativeness? The Accounting Review 81: 251-270. United States Securities and Exchange Commission (SEC). 2000. International Accounting Standards. February 16, 2000. Release Nos. 33-7801, 34-42430; International Series Release No. 1215; File No. S7-04-00. Verrecchia, R., 2001. Essays on Disclosure. Journal of Accounting and Economics 32, 1-3: 97-180. Welker, M., 1995. Disclosure policy, information asymmetry, and liquidity in equity markets. Contemporary Accounting Research 11, 801-827. Wysocki, P., 2004. Discussion of Ultimate Ownership, Income Management and Extra-Legal Institutions. Journal of Accounting Research 42: 463-474. Yu, F., 2006. Analyst Coverage and Earnings Management. Working Paper, University of Minnesota.
32
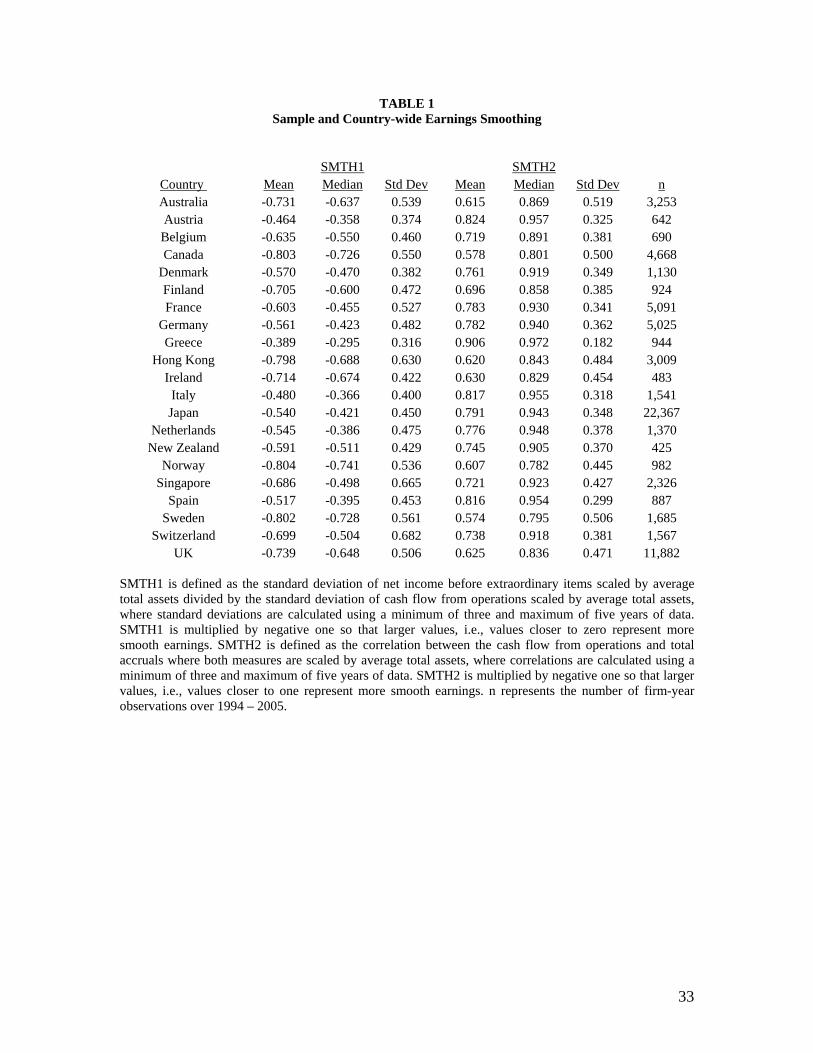
TABLE 1 Sample and Country-wide Earnings Smoothing
SMTH1 SMTH2 Country Mean Median Std Dev Mean Median Std Dev nAustralia -0.731 -0.637 0.539 0.615 0.869 0.519 3,253 Austria -0.464 -0.358 0.374 0.824 0.957 0.325 642 Belgium -0.635 -0.550 0.460 0.719 0.891 0.381 690 Canada -0.803 -0.726 0.550 0.578 0.801 0.500 4,668
Denmark -0.570 -0.470 0.382 0.761 0.919 0.349 1,130 Finland -0.705 -0.600 0.472 0.696 0.858 0.385 924 France -0.603 -0.455 0.527 0.783 0.930 0.341 5,091
Germany -0.561 -0.423 0.482 0.782 0.940 0.362 5,025 Greece -0.389 -0.295 0.316 0.906 0.972 0.182 944
Hong Kong -0.798 -0.688 0.630 0.620 0.843 0.484 3,009 Ireland -0.714 -0.674 0.422 0.630 0.829 0.454 483
Italy -0.480 -0.366 0.400 0.817 0.955 0.318 1,541 Japan -0.540 -0.421 0.450 0.791 0.943 0.348 22,367
Netherlands -0.545 -0.386 0.475 0.776 0.948 0.378 1,370 New Zealand -0.591 -0.511 0.429 0.745 0.905 0.370 425
Norway -0.804 -0.741 0.536 0.607 0.782 0.445 982 Singapore -0.686 -0.498 0.665 0.721 0.923 0.427 2,326
Spain -0.517 -0.395 0.453 0.816 0.954 0.299 887 Sweden -0.802 -0.728 0.561 0.574 0.795 0.506 1,685
Switzerland -0.699 -0.504 0.682 0.738 0.918 0.381 1,567 UK -0.739 -0.648 0.506 0.625 0.836 0.471 11,882
SMTH1 is defined as the standard deviation of net income before extraordinary items scaled by average total assets divided by the standard deviation of cash flow from operations scaled by average total assets, where standard deviations are calculated using a minimum of three and maximum of five years of data. SMTH1 is multiplied by negative one so that larger values, i.e., values closer to zero represent more smooth earnings. SMTH2 is defined as the correlation between the cash flow from operations and total accruals where both measures are scaled by average total assets, where correlations are calculated using a minimum of three and maximum of five years of data. SMTH2 is multiplied by negative one so that larger values, i.e., values closer to one represent more smooth earnings. n represents the number of firm-year observations over 1994 – 2005.
33

TABLE 2 Descriptive Statistics on Non-U.S. Firms’ Earnings Smoothing and Operating Characteristics
Variable Mean Median Std Dev SMTH1 -0.635 -0.513 0.514 SMTH2 0.720 0.911 0.415 LNTOTASS 12.407 12.301 1.897 LEV 0.233 0.210 0.189 BM 0.882 0.682 0.804 STD_SALES 0.152 0.100 0.161 %LOSS 0.234 0.000 0.302 OPCYCLE 4.835 4.898 0.698 SG 0.324 0.059 2.454 OPLEV 0.325 0.293 0.217 DIVIDEND 0.014 0.007 0.022 AVECFO 0.048 0.057 0.112 RIGHTS 3.691 4.000 1.264 TXBKCONFORM 0.583 1.000 0.493 ADR 0.031 0.000 0.172 ANALYST 5.111 2.000 7.342 %CLHLDa 0.445 0.441 0.239
Descriptive statistics are based on all firms having sufficient data over the 1994 – 2005 time period (n=70,891). SMTH1 is defined as the standard deviation of net income before extraordinary items scaled by average total assets divided by the standard deviation of cash flow from operations scaled by average total assets, where standard deviations are calculated using a minimum of three and maximum of five years of data. SMTH1 is multiplied by negative one so that larger values, i.e., values closer to zero represent more smooth earnings. SMTH2 is defined as the correlation between cash flow from operations and total accruals where both measures are scaled by average total assets, where correlations are calculated using a minimum of three and maximum of five years of data. SMTH2 is multiplied by negative one so that larger values, i.e., values closer to one represent more smooth earnings. The definition of operating characteristic variables are as follows: LNTOTASS is equal to the natural log of total assets measured in US dollars; LEV is equal to total debt divided by total assets; BM is equal to book value of common equity divided by market value of equity; STD_SALES is the standard deviation of sales scaled by total assets calculated requiring a minimum of three and maximum of five fiscal years; %LOSS is the proportion of years that a firm reports negative earnings, calculated requiring a minimum of three and maximum of five fiscal years; OPCYCLE is the natural log of the operating cycle measured in days, defined as 365*(average accounts receivable /sales)+365*(average inventory/cost of goods sold); SG is the average sales growth over the past three to five years; OPLEV is net property, plant and equipment over total assets; DIVIDEND is equal to cash dividends divided by average total assets; AVECFO is equal to the average cash flow from operations divided by total average total assets over the past three to five fiscal years. Governance variables are defined as: RIGHTS is the antidirector rights index developed by La Porta et al. (1998) for the country; TXBKCONFORM is equal to one if there is a high degree of conformity between tax and financial reporting in the country, and zero otherwise (see Appendix for details); ADR is equal to one if the firm trades in the U.S. during the fiscal year, and zero otherwise; ANALYST is equal to the number of analysts making a forecast for fiscal year t’s earnings; and %CLHLD is the proportion of shares that are closely held as of the end of the fiscal year t. a Requiring firms to have closely held ownership data reduces the sample size to 54,344.
34

TABLE 3
Incentives to Smooth Earnings
Incentives to Smooth - Annual Cross-Sectional Fama-MacBeth Regressions of SMTH1 and SMTH2 Regressed on Firm Operating Characteristics and Incentive Attributes
ta iat
tt
tttt
ttttt
tttttt
IND
CLHLDANALYSTADRMTXBKCONFORRIGHTSRETSTDAVECFODIVIDENDOPLEVSGOPCYCLE
LOSSSALESSTDBMLEVLNTOTASSSMTH
εα
βββββββββββ
ββββββ
++
+++++++++++
+++++=
∑ =
60
1
1615
14131211
109876
543210
%_
%_
(2)
SMTH1 SMTH2
parameter estimate p-value
parameter estimate p-value
parameter estimate p-value
parameter estimate p-value
INTERCEPT -0.455 0.00 -0.552 0.00 0.742 0.00 0.667 0.00 Innate Characteristics LNTOTASS 0.014 0.00 0.018 0.00 0.011 0.00 0.014 0.00 LEV 0.073 0.00 0.054 0.02 0.067 0.00 0.051 0.01 BM 0.008 0.04 0.002 0.50 0.024 0.00 0.020 0.00 STD_SALES -0.136 0.00 -0.136 0.00 -0.098 0.00 -0.100 0.00 %LOSS -0.645 0.00 -0.641 0.00 -0.419 0.00 -0.418 0.00 OPCYCLE 0.002 0.45 0.005 0.22 0.012 0.00 0.014 0.00 SG 0.003 0.00 0.004 0.00 0.003 0.02 0.005 0.00 OPLEV -0.126 0.00 -0.121 0.00 -0.081 0.00 -0.084 0.00 DIVIDEND -0.115 0.12 -0.167 0.09 -0.119 0.11 -0.166 0.04 AVECFO -0.156 0.00 -0.145 0.00 0.284 0.00 0.295 0.00 Governance RIGHTS -0.024 0.00 -0.024 0.00 -0.017 0.00 -0.016 0.00 TAXCONFORM 0.063 0.00 0.041 0.00 0.045 0.00 0.030 0.00 ADR -0.057 0.00 -0.051 0.00 -0.071 0.00 -0.064 0.00 ANALYST -0.006 0.00 -0.005 0.00 -0.004 0.00 -0.004 0.00 %CLHLD 0.075 0.00 0.058 0.00 Industry Dummies YES YES YES YES
Average Adj R2 0.25 0.25 0.24 0.24 Average n 5,908 4,529 5,908 4,529
All variables are defined in Table 2.
35

TABLE 4 Overall Governance and Incentives to Smooth
Incentives to Smooth – Pooled Cross Sectional Regressions, firm cluster standard errors of SMTH1 and SMTH2 Regressed on Firm Operating Characteristics and Incentive Attributes
tt
tttt
ttttt
tttttt
YRTYRELATEDPARGOVSCOREANALYSTADR
AVECFODIVIDENDOPLEVSGOPCYCLELOSSSALESSTDBMLEVLNTOTASSSMTH
εβββββ
βββββββββββ
++++++
++++++++++=
04
%_
15
14131211
109876
543210
SMTH1 SMTH2
parameter estimate p-value
parameter estimate p-value
INTERCEPT -0.594 0.00 0.387 0.03 Innate Characteristics LNTOTASS 0.009 0.49 0.020 0.06 LEV 0.086 0.31 0.146 0.03 BM 0.033 0.41 0.060 0.07 STD_SALES 0.061 0.56 0.015 0.88 %LOSS -0.757 0.00 -0.640 0.00 OPCYCLE 0.003 0.87 0.031 0.03 SG 0.003 0.43 0.003 0.25 OPLEV -0.081 0.18 -0.072 0.15 DIVIDEND -0.102 0.84 -0.375 0.35 AVECFO -0.537 0.01 0.342 0.12 Governance ADR -0.024 0.19 0.004 0.42 ANALYST -0.002 0.10 -0.004 0.01 GOVSCORE -0.007 0.15 -0.012 0.01 RELATEDPARTY 0.009 0.02 0.005 0.06
Year Dummies YES YES
Adj R2 0.12 0.16 n 2,071 2,071
This table reports the results of a pooled cross-sectional regression using data from fiscal 2004 and 2005 using 2,071 firm-year observations for 1,122 firms. The smaller sample sizes are due to the requirement that firms be followed by Governance Metrics International (GMI). GOVSCORE is GMI’s global overall rating, where higher values represent stronger governance; RELATEDPARTY is equal to the GMI assessment of related party transactions where higher values indicate a greater existence and less scrutiny being placed on related party transactions. All other definitions are provided in Table 2.
36
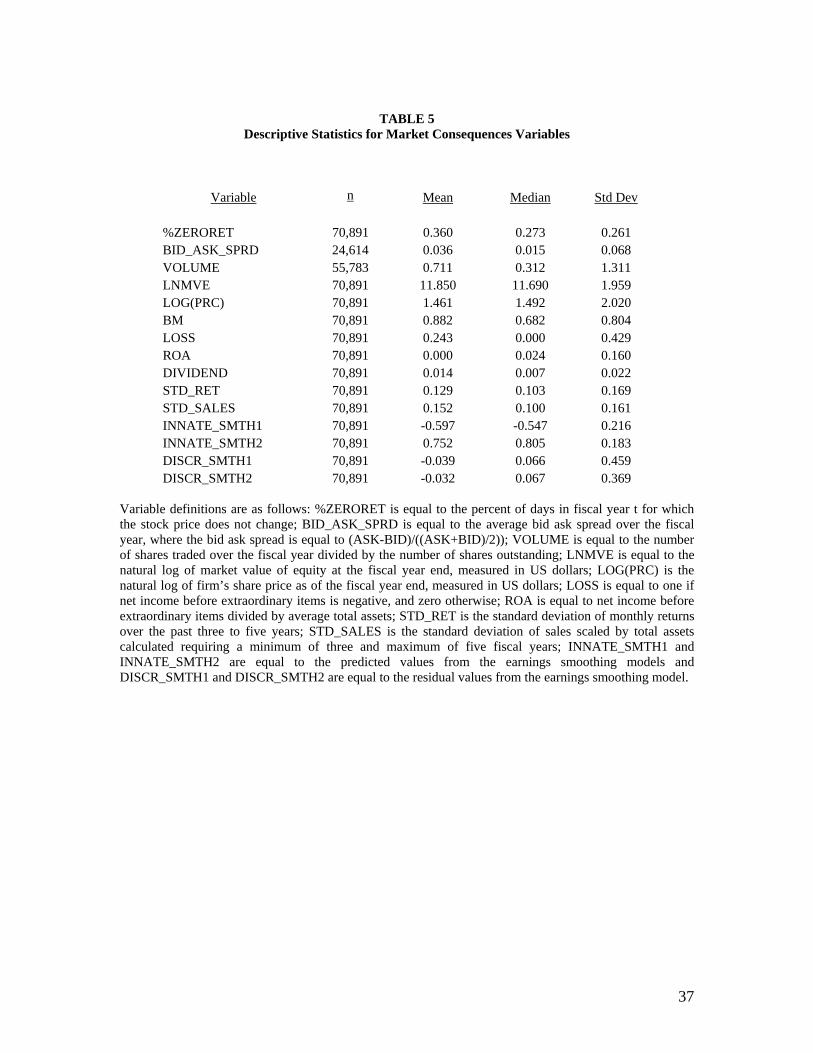
TABLE 5
Descriptive Statistics for Market Consequences Variables
Variable n Mean Median Std Dev
%ZERORET 70,891 0.360 0.273 0.261 BID_ASK_SPRD 24,614 0.036 0.015 0.068 VOLUME 55,783 0.711 0.312 1.311 LNMVE 70,891 11.850 11.690 1.959 LOG(PRC) 70,891 1.461 1.492 2.020 BM 70,891 0.882 0.682 0.804 LOSS 70,891 0.243 0.000 0.429 ROA 70,891 0.000 0.024 0.160 DIVIDEND 70,891 0.014 0.007 0.022 STD_RET 70,891 0.129 0.103 0.169 STD_SALES 70,891 0.152 0.100 0.161 INNATE_SMTH1 70,891 -0.597 -0.547 0.216 INNATE_SMTH2 70,891 0.752 0.805 0.183 DISCR_SMTH1 70,891 -0.039 0.066 0.459 DISCR_SMTH2 70,891 -0.032 0.067 0.369
Variable definitions are as follows: %ZERORET is equal to the percent of days in fiscal year t for which the stock price does not change; BID_ASK_SPRD is equal to the average bid ask spread over the fiscal year, where the bid ask spread is equal to (ASK-BID)/((ASK+BID)/2)); VOLUME is equal to the number of shares traded over the fiscal year divided by the number of shares outstanding; LNMVE is equal to the natural log of market value of equity at the fiscal year end, measured in US dollars; LOG(PRC) is the natural log of firm’s share price as of the fiscal year end, measured in US dollars; LOSS is equal to one if net income before extraordinary items is negative, and zero otherwise; ROA is equal to net income before extraordinary items divided by average total assets; STD_RET is the standard deviation of monthly returns over the past three to five years; STD_SALES is the standard deviation of sales scaled by total assets calculated requiring a minimum of three and maximum of five fiscal years; INNATE_SMTH1 and INNATE_SMTH2 are equal to the predicted values from the earnings smoothing models and DISCR_SMTH1 and DISCR_SMTH2 are equal to the residual values from the earnings smoothing model.
37
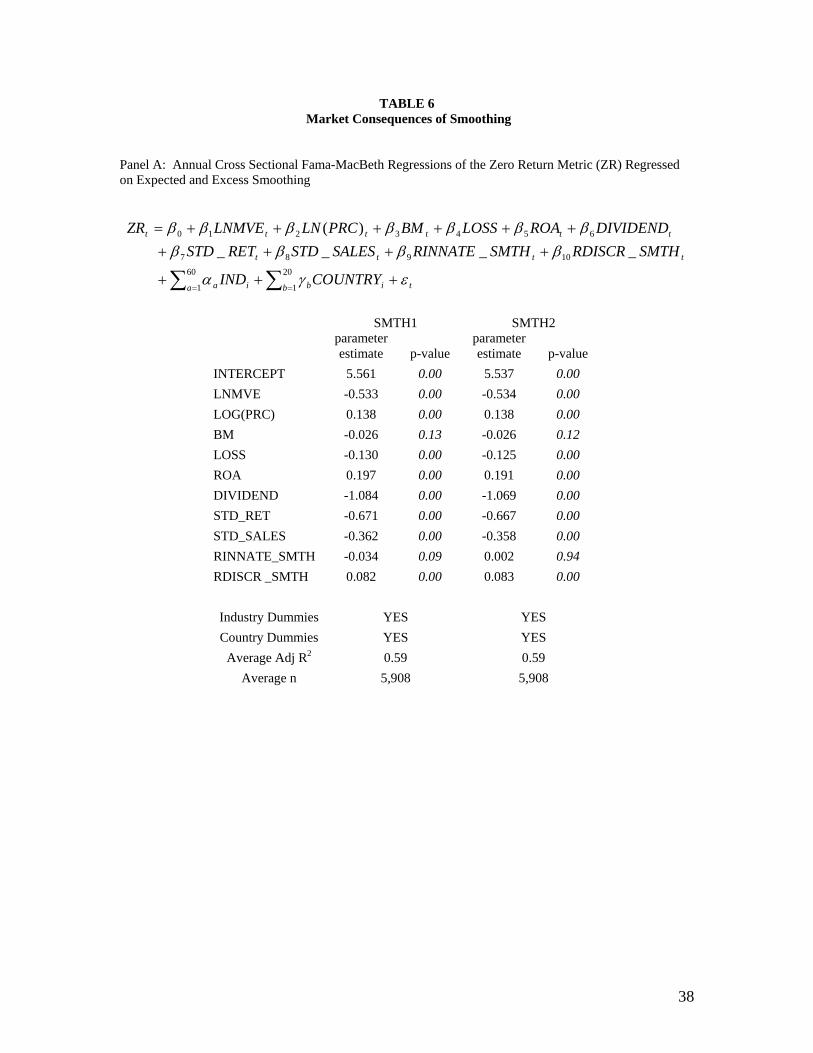
TABLE 6 Market Consequences of Smoothing
Panel A: Annual Cross Sectional Fama-MacBeth Regressions of the Zero Return Metric (ZR) Regressed on Expected and Excess Smoothing
tb iba ia
tttt
tttttt
COUNTRYIND
SMTHRDISCRSMTHRINNATESALESSTDRETSTDDIVIDENDROALOSSBMPRCLNLNMVEZR
εγα
βββββββββββ
+++
++++++++++=
∑∑ ==
20
1
60
1
10987
6543210
____)(
SMTH1 SMTH2
parameter estimate p-value
parameter estimate p-value
INTERCEPT 5.561 0.00 5.537 0.00 LNMVE -0.533 0.00 -0.534 0.00 LOG(PRC) 0.138 0.00 0.138 0.00 BM -0.026 0.13 -0.026 0.12 LOSS -0.130 0.00 -0.125 0.00 ROA 0.197 0.00 0.191 0.00 DIVIDEND -1.084 0.00 -1.069 0.00 STD_RET -0.671 0.00 -0.667 0.00 STD_SALES -0.362 0.00 -0.358 0.00 RINNATE_SMTH -0.034 0.09 0.002 0.94 RDISCR _SMTH 0.082 0.00 0.083 0.00
Industry Dummies YES YES Country Dummies YES YES
Average Adj R2 0.59 0.59 Average n 5,908 5,908
38
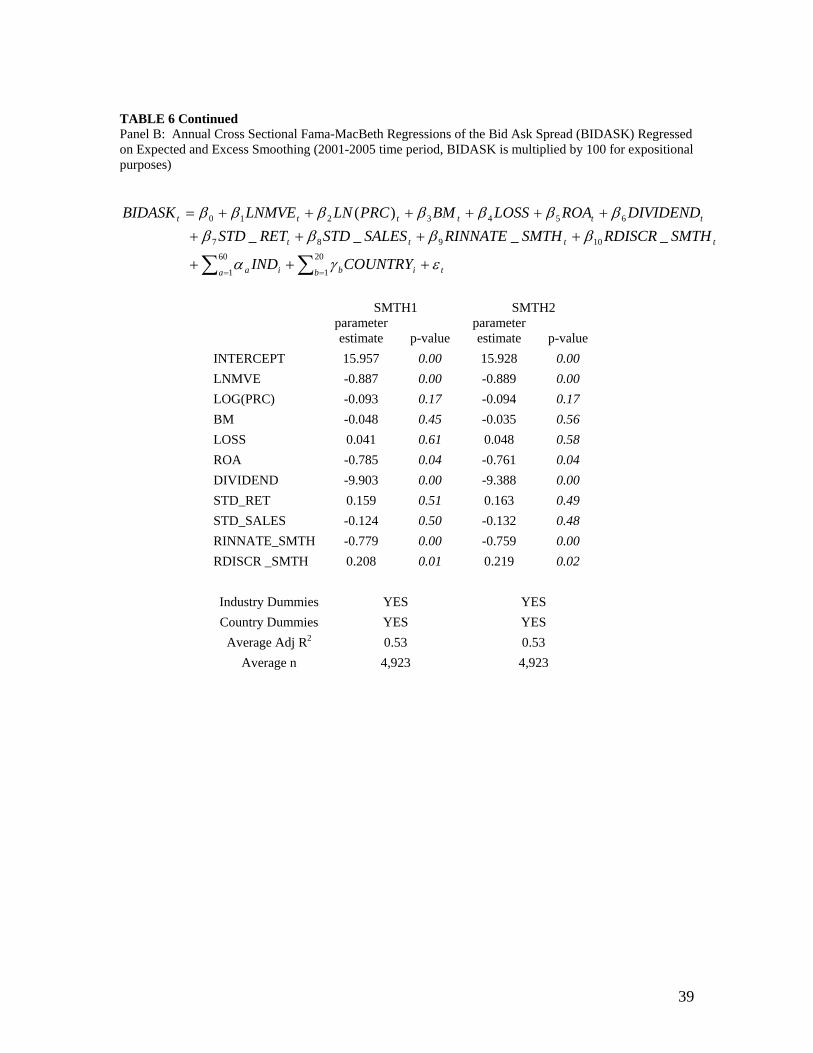
TABLE 6 Continued Panel B: Annual Cross Sectional Fama-MacBeth Regressions of the Bid Ask Spread (BIDASK) Regressed on Expected and Excess Smoothing (2001-2005 time period, BIDASK is multiplied by 100 for expositional purposes)
tb iba ia
tttt
tttttt
COUNTRYIND
SMTHRDISCRSMTHRINNATESALESSTDRETSTDDIVIDENDROALOSSBMPRCLNLNMVEBIDASK
εγα
βββββββββββ
+++
++++++++++=
∑∑ ==
20
1
60
1
10987
6543210
____)(
SMTH1 SMTH2
parameter estimate p-value
parameter estimate p-value
INTERCEPT 15.957 0.00 15.928 0.00 LNMVE -0.887 0.00 -0.889 0.00 LOG(PRC) -0.093 0.17 -0.094 0.17 BM -0.048 0.45 -0.035 0.56 LOSS 0.041 0.61 0.048 0.58 ROA -0.785 0.04 -0.761 0.04 DIVIDEND -9.903 0.00 -9.388 0.00 STD_RET 0.159 0.51 0.163 0.49 STD_SALES -0.124 0.50 -0.132 0.48 RINNATE_SMTH -0.779 0.00 -0.759 0.00 RDISCR _SMTH 0.208 0.01 0.219 0.02
Industry Dummies YES YES Country Dummies YES YES
Average Adj R2 0.53 0.53 Average n 4,923 4,923
39
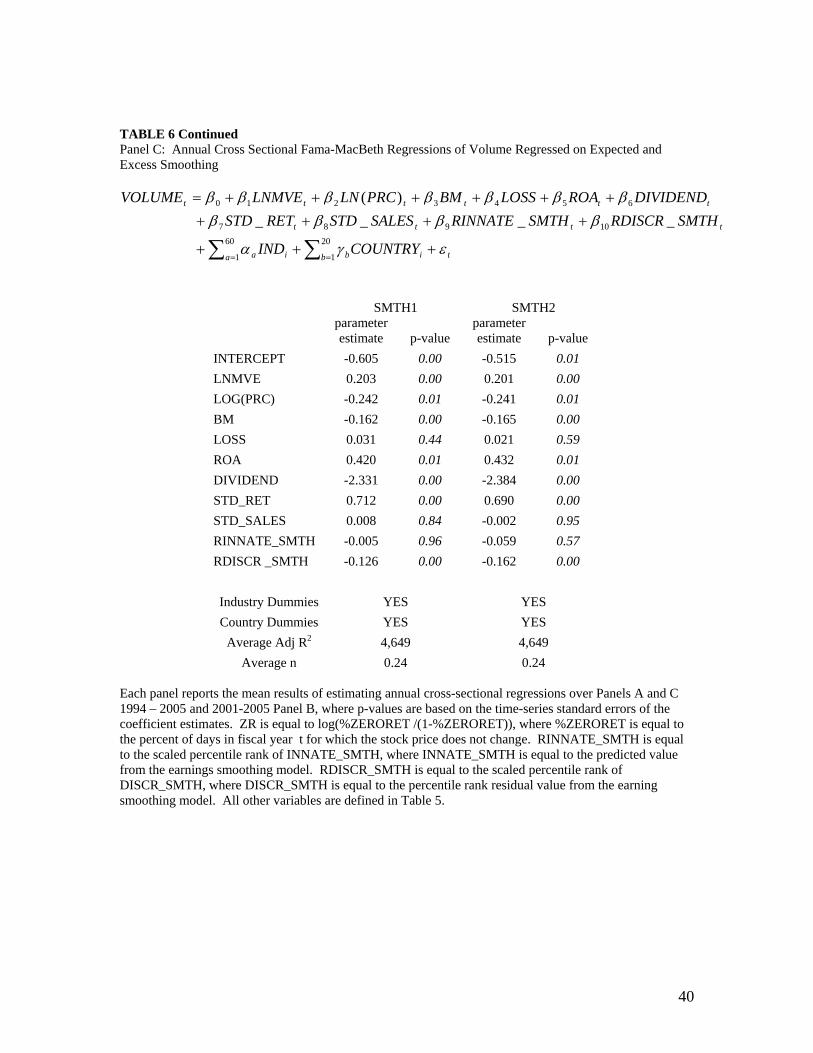
TABLE 6 Continued Panel C: Annual Cross Sectional Fama-MacBeth Regressions of Volume Regressed on Expected and Excess Smoothing
tb iba ia
tttt
tttttt
COUNTRYIND
SMTHRDISCRSMTHRINNATESALESSTDRETSTDDIVIDENDROALOSSBMPRCLNLNMVEVOLUME
εγα
βββββββββββ
+++
++++++++++=
∑∑ ==
20
1
60
1
10987
6543210
____)(
SMTH1 SMTH2
parameter estimate p-value
parameter estimate p-value
INTERCEPT -0.605 0.00 -0.515 0.01 LNMVE 0.203 0.00 0.201 0.00 LOG(PRC) -0.242 0.01 -0.241 0.01 BM -0.162 0.00 -0.165 0.00 LOSS 0.031 0.44 0.021 0.59 ROA 0.420 0.01 0.432 0.01 DIVIDEND -2.331 0.00 -2.384 0.00 STD_RET 0.712 0.00 0.690 0.00 STD_SALES 0.008 0.84 -0.002 0.95 RINNATE_SMTH -0.005 0.96 -0.059 0.57 RDISCR _SMTH -0.126 0.00 -0.162 0.00
Industry Dummies YES YES Country Dummies YES YES
Average Adj R2 4,649 4,649 Average n 0.24 0.24
Each panel reports the mean results of estimating annual cross-sectional regressions over Panels A and C 1994 – 2005 and 2001-2005 Panel B, where p-values are based on the time-series standard errors of the coefficient estimates. ZR is equal to log(%ZERORET /(1-%ZERORET)), where %ZERORET is equal to the percent of days in fiscal year t for which the stock price does not change. RINNATE_SMTH is equal to the scaled percentile rank of INNATE_SMTH, where INNATE_SMTH is equal to the predicted value from the earnings smoothing model. RDISCR_SMTH is equal to the scaled percentile rank of DISCR_SMTH, where DISCR_SMTH is equal to the percentile rank residual value from the earning smoothing model. All other variables are defined in Table 5.
40
Top Related
Copyright © 2022 FDOKUMEN

