


Bahasa
Halaman
Hukum


Carlos Pestana Barros & Nicolas Peypoch
A Comparative Analysis of Productivity Change in Italian and Portuguese Airports
WP 006/2007/DE _________________________________________________________
António Afonso & Pedro Gomes
Do fiscal imbalances deteriorate sovereign debt ratings?
WP 24/2010/DE/UECE
_________________________________________________________
Department of Economics
WORKING PAPERS
ISSN Nº 0874-4548
School of Economics and Management TECHNICAL UNIVERSITY OF LISBON

Do fiscal imbalances deteriorate sovereign
debt ratings?*
António Afonso $ # and Pedro Gomes
2010
Abstract We use sovereign debt rating estimations from Afonso, Gomes and Rother (2009, 2010) for Fitch, Moody’s, and Standard & Poor’s, to assess to what extent the recent fiscal imbalances are being reflected on the sovereign debt notations. We use macro and fiscal data up to 2009, and macro and fiscal projections, to obtain the expected rating for several OECD countries. The answer to the title question is yes, but in a diverse way for each country. Our average model predictions point to a heterogeneous behaviour of rating agencies across countries. JEL: C23; E44; G15. Keywords: credit ratings; sovereign debt; rating agencies. * We are grateful to Davide Furceri, Philipp Rother, Guntram Wolff, and to participants at the 2010 Banque de France and University of Strasbourg conference “New Challenges for Public Debt in Advanced Economies” for helpful comments. The opinions expressed herein are those of the authors and do not necessarily reflect those of the the ECB or the Eurosystem. $ ISEG/UTL - Technical University of Lisbon, Department of Economics; UECE – Research Unit on Complexity and Economics. UECE is supported by FCT (Fundação para a Ciência e a Tecnologia, Portugal), email: [email protected]. # European Central Bank, Directorate General Economics, Kaiserstraße 29, D-60311 Frankfurt am Main, Germany. email: [email protected]. Universidad Carlos III de Madrid, Department of Economics, c/ Madrid 126, 28903 Getafe, Spain. email: [email protected].

2
1. Introduction
Existing studies on the determinants of sovereign ratings find that rating
agencies look at several variables when attributing a rating notation: per capita
income, GDP growth, inflation, external debt, level of economic development, default
history, unemployment rate or the investment-to-GDP ratio (see, for instance, Cantor
and Packer, 1996, Afonso, 2003, and Bissoondoyal-Bheenick, 2005). Moreover,
variables that reflect how the government conducts its fiscal policy, the budget
balance and government debt are also relevant. These results are particularly
significant for developed economies while for emerging economies other variables
such as foreign reserves, current account balance, exports or terms of trade also seem
to play an important role.
Out of these variables, Afonso, Gomes and Rother (2009, 2010) have shown that
four fundamental variables have a consistent short-run impact on sovereign ratings,
determining roughly the rating ladder: the level of GDP per capita, real GDP growth,
the public debt level and the government budget balance. In addition to undermining
economic growth, as shown by Reinhart and Rogoff (2010), it seems reasonable to
think that high fiscal imbalances can increase the likelihood of sovereign defaults.
In this study we use the estimated models for sovereign debt rating from Afonso,
Gomes and Rother (2009, 2010), for Fitch, Moody’s, and Standard & Poor’s (S&P), to
assess to what extent the deterioration of fiscal imbalances since 2008 in several
OECD countries is being reflected on the sovereign debt ratings. For that purpose we
use macro and fiscal data up to 2009, and macro and fiscal projections, to make a
prediction for the expected rating for several OECD countries up until 2011 (the
countries covered in the analysis are: Canada, France, Germany, Greece, Ireland,
Italy, Japan, Portugal, Spain, the U.K., and the U.S.).
The answer to the title question seems to be yes, but in a diverse way for each
country. We find that most of the deterioration of sovereign creditworthiness over the
past two year is due to the increase of government deficits and debt, rather then the
poor economic performance. Moreover, our rating predictions point to an under rating
of Greece, Ireland and Portugal relative to the average country prediction. On the
other hand, the rating agencies seem to be more lenient with Japan, UK, US and,
although to a lesser extent, with France and Italy.
The paper is organised as follows. In Section Two we explain the methodology
followed by Afonso, Gomes and Rother (2010) and summarise their results. In Section

3
Three we conduct the forecast of the ratings for each country and discuss its results.
Section Four summarises the paper’s main findings.
2. Methodology
Afonso, Gomes and Rother (2010) initially estimated rating models for a panel
of 130 countries for the period 1995-2005, using both linear estimation methods and
ordered response models. The detailed results and data description are reported in
Afonso, Gomes and Rother (2010).
Linear estimation: random effects
The equation to estimate by random effects is
( X ) ( )Xi iit it i i itR X Z , (1)
where we have: Rit – quantitative variable, obtained by a linear transformation; Xit is a
vector containing time varying variables and Zi is a vector of time invariant variables.
The time-average of the explanatory variables, iX , is also include as an additional
time-invariant regressor. The index i (i=1,…,N) denotes the country, and the index t
(t=1,…,T) indicates the period. Additionally, it is assumed that the disturbances µit are
independent across countries and across time, and i is uncorrelated with the
regressors.
Equation (1) has an interesting economic interpretation. can be
interpreted as a long-term effect (e. g. if a country has a permanent high
unemployment what is the effect on the rating) while is a short-term effect (e. g. if a
country manages to reduce unemployment this year what is the impact on the rating).
This distinction is useful for policy purposes as it can tell what a country can do to
improve its rating in the short to medium-term. Alternatively, we can understand δ as
the coefficient of the cross-country determinants of the credit rating.
An advantage of this framework is that it allows us to estimate i for each
country, which would capture any unobserved characteristic of the country, which
have a permanent impact on its rating.
The cardinal transformation of the ratings was done following the
correspondence with the qualitative codes shown in Table 1, using a linear scale with
4
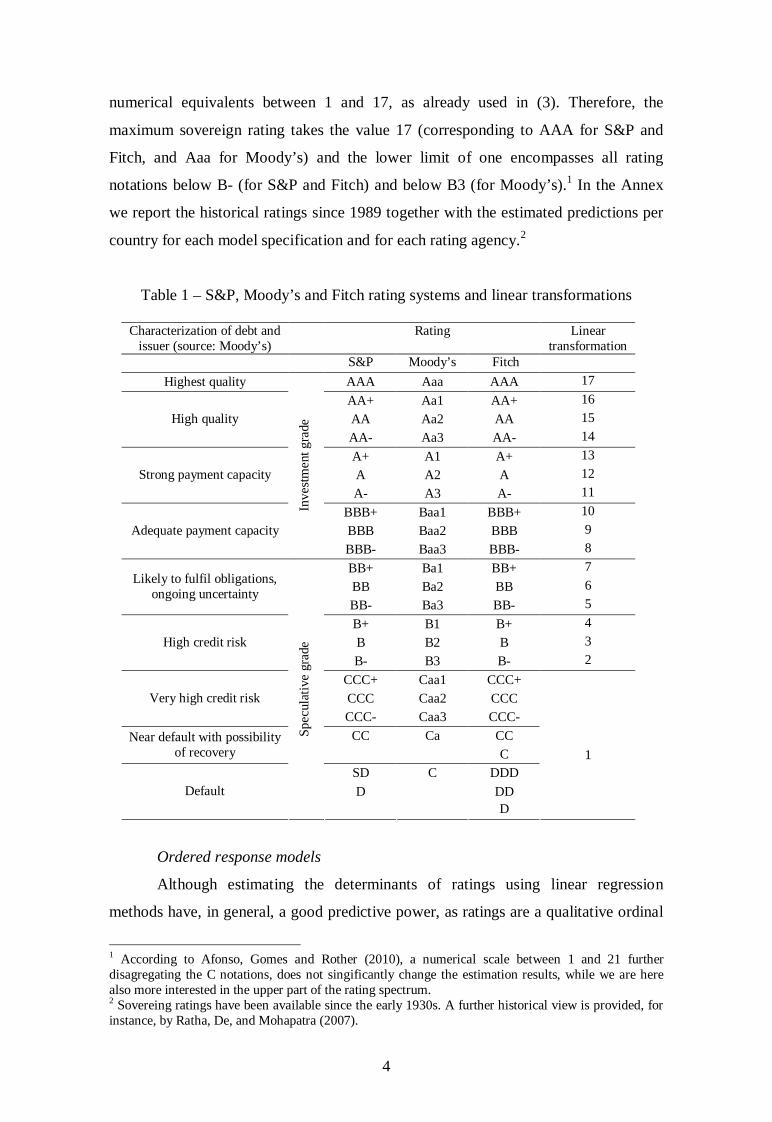
numerical equivalents between 1 and 17, as already used in (3). Therefore, the
maximum sovereign rating takes the value 17 (corresponding to AAA for S&P and
Fitch, and Aaa for Moody’s) and the lower limit of one encompasses all rating
notations below B- (for S&P and Fitch) and below B3 (for Moody’s).1 In the Annex
we report the historical ratings since 1989 together with the estimated predictions per
country for each model specification and for each rating agency.2
Table 1 – S&P, Moody’s and Fitch rating systems and linear transformations
Characterization of debt and issuer (source: Moody’s)
Rating Linear transformation
S&P Moody’s Fitch Highest quality AAA Aaa AAA 17
AA+ Aa1 AA+ 16 AA Aa2 AA 15 High quality AA- Aa3 AA- 14 A+ A1 A+ 13 A A2 A 12 Strong payment capacity A- A3 A- 11
BBB+ Baa1 BBB+ 10 BBB Baa2 BBB 9 Adequate payment capacity
Inve
stmen
t gra
de
BBB- Baa3 BBB- 8 BB+ Ba1 BB+ 7 BB Ba2 BB 6 Likely to fulfil obligations,
ongoing uncertainty BB- Ba3 BB- 5 B+ B1 B+ 4 B B2 B 3 High credit risk B- B3 B- 2
CCC+ Caa1 CCC+ CCC Caa2 CCC Very high credit risk CCC- Caa3 CCC-
CC Ca CC Near default with possibility of recovery C
SD C DDD D DD Default
Spec
ulat
ive
grad
e
D
1
Ordered response models
Although estimating the determinants of ratings using linear regression
methods have, in general, a good predictive power, as ratings are a qualitative ordinal
1 According to Afonso, Gomes and Rother (2010), a numerical scale between 1 and 21 further disagregating the C notations, does not singificantly change the estimation results, while we are here also more interested in the upper part of the rating spectrum. 2 Sovereing ratings have been available since the early 1930s. A further historical view is provided, for instance, by Ratha, De, and Mohapatra (2007).

5
measure, ordered response models are more suited. The rating agency makes a
continuous evaluation of a country’s credit-worthiness, embodied in an unobserved
latent variable *itR . The latent variable has a linear form and depends on the same set
of variables as before,
* ( X ) Xi iit it i i itR X Z . (2)
There are several cut-off points to draw up the boundaries of each rating
category, and the final rating notation is given by
*16
*16 15
*15 14
*1
( ) ( 1)
( 2)
( 3)
it
it
it it
it
AAA Aaa if R cAA Aa if c R c
R AA Aa if c R c
B B if c R
. (3)
The parameters of equation (2) and (3), notably β, δ, λ and the cut-off points c1
to c16 are estimated using maximum likelihood. As we have panel data, the
generalization of ordered probit is not simple, since instead of one error term, we now
have two. One possibility is to use a random effects ordered probit estimation, which
considers both errors i and µit to be normally distributed, and maximizes the log-
likelihood accordingly. The other alternative is to perform the traditional ordered
probit estimation, but considering that the error term is autocorrelated.
Summary of results
Afonso, Gomes and Rother (2010) estimated such models for the period 1995-
2005. They use several variables grouped mainly in three categories: macroeconomic
performance (log of GDP per capita PPP, GDP growth, unemployment rate, inflation
rate), government variables (government debt, fiscal balance and a measure of
government effectiveness) and external variables (foreign reserves, current account
balance and external debt).

6
As already mentioned, in this paper we are going to focus on the contribution
of the macro and the fiscal elements. Generally the set of main macroeconomic and
fiscal variables that we use in this study may determine sovereign ratings as follows.
GDP per capita – positive impact on rating: more developed economies are
expected to have more stable institutions to prevent government over-borrowing and
to be less vulnerable to exogenous shocks.
Real GDP growth – positive impact: higher real growth strengthens the
government’s ability to repay outstanding obligations.
Unemployment – negative impact: a country with lower unemployment tends
to have more flexible labour markets making it less vulnerable to changes in the
economic environment. In addition, lower unemployment reduces the fiscal burden of
unemployment and social benefits while broadening the base for labour taxation.
Inflation – uncertain impact: on the one hand, it reduces the real stock of
outstanding government debt in domestic currency, leaving overall more resources for
the coverage of foreign debt obligations. On the other hand, it is symptomatic of
problems at the macroeconomic policy level, especially if caused by monetary
financing of deficits.
Government debt – negative impact: a higher stock of outstanding
government debt implies a higher interest burden and should correspond to a higher
risk of default.
Fiscal balance – positive impact: large fiscal deficits absorb domestic
savings and also suggest macroeconomic disequilibria, negatively affecting the rating
level. Persistent deficits may signal problems with the institutional environment for
policy makers.
Table 2 shows the effect on the rating of changes in the fiscal and macro
variables, for the three agencies and for the three methodologies. The first conclusion is
that, individually, changes in only one macro or fiscal variable have a small effect on a
country’s sovereign rating. For instance, a reduction in GDP growth by 3 percent only reduces
a country’s rating by 0.10 to 0.20 notches. However, given their interdependence, the effects
should not be seen in isolation, but analysed jointly.

7
Table 2 – Estimated effects of fiscal and macro variables
Note: RE - Random Effects; OP - Ordered Probit; REOP - Random Effects Ordered Probit. Fraction of a notch: for the ordered response models, it is in fraction of the average size of the categories between BBB- and AAA.
We can also see from Table 2 that roughly the rating agencies tend to put more
weight on the fiscal variables. An increase of 5 percentage points in the fiscal deficit
would reduce the rating between 0.23 notches (for Fitch) and 0.5 (for Moody’s). It is
also possible to observe that the rating agencies give more emphasis to different
variables. Moody’s gives more emphasis to the government deficit, whereas S&P and
Fitch focus more in government debt.
Another important element is that, although the unemployment rate does not
have a short-run effect on a country’s rating it has a significant long-run effect. The
interpretation is that only structural unemployment seems to matter for the rating
decision.
Table 3 – Summary of prediction errors
Notes: * prediction error within +/- 1 notch. ** prediction error within +/- 2 notches.
Fitch S&P Moody’s Short-run effect of: RE OP REOP Avg RE OP REOP Avg RE OP REOP Avg ↓ 5% GDP per capita -0.11 -0.13 -0.12 -0.12 -0.09 -0.11 -0.09 -0.10 -0.14 -0.15 -0.12 -0.14 ↓ 3% GDP growth -0.13 -0.09 0.00 -0.07 -0.22 -0.10 -0.10 -0.14 -0.40 -0.14 -0.14 -0.23 ↑ 5% Inflation -0.01 -0.02 -0.01 -0.01 -0.04 -0.03 -0.01 -0.03 -0.01 -0.03 -0.01 -0.02 ↑ 10% Gov. Debt -0.27 -0.28 -0.25 -0.27 -0.33 -0.30 -0.48 -0.37 -0.21 -0.15 -0.21 -0.19 ↑ 5% Gov. Deficit -0.28 -0.15 -0.27 -0.23 -0.37 -0.36 -0.29 -0.34 -0.53 -0.51 -0.49 -0.51 Long run effect of: ↑ 5% Unemployment rate 0.00 -0.10 -0.13 -0.08 -0.09 -0.14 0.00 -0.08 -0.34 -0.22 -0.17 -0.24
% Correctly predicted
% Within 1 notch *
% Within 2 notches ** Estimation Procedure Observations
RE with εi 557 64.8% 95.2% 99.6% RE without εi 557 33.8% 75.6% 93.9% Ordered Probit 557 46.5% 79.7% 94.3% Moody’s
RE Ordered Probit 557 43.8% 75.6% 92.3% RE with εi 565 69.4% 98.2% 99.6% RE without εi 565 38.2% 79.1% 95.2% Ordered Probit 565 46.4% 84.8% 93.8%
S&P
RE Ordered Probit 565 38.6% 81.9% 94.3% RE with εi 481 70.5% 98.3% 99.4% RE without εi 481 36.2% 77.5% 97.5% Ordered Probit 481 43.5% 82.1% 95.2% Fitch
RE Ordered Probit 553 34.5% 77.2% 93.3%

8
In terms of prediction, the models correctly predict the rating of 40% of the
sample and more than 75% of the predicted ratings lie within one notch of the
observed value (see Table 3). When we include the estimated country error i , the
prediction improves significantly, as it captures all unobservable country effects.
3. Rating forecasts
3.1. Forecast approach and data
In order to make our country specific forecasts we use the previous estimation
results up to 2005, together with macro and fiscal data up to 2009, and notably the
more recent spring 2010 projections from the European Commission, to make
predictions for the annual expected ratings up to 2011.
As an example, and drawing on the results of the prediction specification,
estimated by Afonso, Gomes and Rother (2010), the estimations for the changes in the
ratings, using the random effects specification, are given by (4),
^ ^ ^ ^ ^ ^ ^ ^
1 2 3 4 5 6 -1 it it it it it it it itR Ypc Y U D B R , (4)
where Ypc is per capita GPD, Y is the real growth rate of GDP, U is the
unemployment rate, D is debt-to-GDP ratio, and B is the government budget balance
ratio. Notice that we report in (4) only the estimated coefficients of the explanatory
variables for which we have available macro and fiscal forecast data for the period
2010-2011.3
Another important element is that the unemployment rate does not have a
significant short-run effect, so instead we use the long-run coefficient, assuming that
the increase in the unemployment rate is structural.4 For the random effects, we then
round the number to the nearer integer to have a rating prediction. With the ordered
probit framework we estimate the value of the latent variable in a similar way, and
then compare the value with the cut-points to assess the rating.
3 For instance, the estimated coefficients for the average of the random effects specification for Moody’s are given below:
-1 1.789 8.768 -0.073* -0.145* -0.014* 6.991*it it it it it it it itR Ypc Y U D B R . 4 In practice, this only matters for the case of Spain that had an increase in the unemployment rate of around 10 percentage points. For all the other countries the isolated effect of the unemployment rate is very small.

9
In this context, Figure 1 shows the recent developments of the government
debt ratio and of the budget balance ratio for the countries under analysis, which
illustrates the significant post 2007-2008 fiscal deterioration, with increasing
government budget deficits and rising government indebtedness.
Figure 1 – General government debt and budget balance ratios (% of GDP)
1.1 – Debt ratio 1.2 – Budget balance
20
40
60
80
100
120
140
2000
2001
2002
2003
2004
2005
2006
2007
2008
2009
2010
2011
% o
f GD
P
IR GR UK PT SP US
-15
-13
-11
-9
-7
-5
-3
-1
1
3
5
2000
2001
2002
2003
2004
2005
2006
2007
2008
2009
2010
2011
% o
f GD
P
IR GR UK PT SP US
1.3 – Debt ratio 1.4 – Budget balance
50
55
60
65
70
75
80
85
90
2000
2001
2002
2003
2004
2005
2006
2007
2008
2009
2010
2011
% o
f GD
P
FR IT DE CA
-9-8
-7-6
-5-4
-3-2
-10
12
34
5
2000
2001
2002
2003
2004
2005
2006
2007
2008
2009
2010
2011
% o
f GD
P
JP FR IT DE CA Source: European Commission AMECO database and spring 2010 Economic Forecasts. The debt ratio for Japan, not shown to facilitate the scale in the chart presentation, is 142% and 194% respectively in 2000 and 2011. IR - Ireland; GR - Greece, PT - Portugal, SP - Spain, FR - France, IT - Italy, DE - Germany, CA - Canada.
3.2. Country specific forecast
We report below the set of results that depict the effective country ratings,
observed up until July 2010, together with the illustration of the rating prediction that
we computed using the several model specifications for the three rating agencies, for
each country. We also computed the predicted ratings for 2010-2011 on the basis of
10
the available macro and fiscal forecasts. The main results are discussed for each of the
eleven OECD countries covered in our analysis (detailed information can be seen in
the Annex).
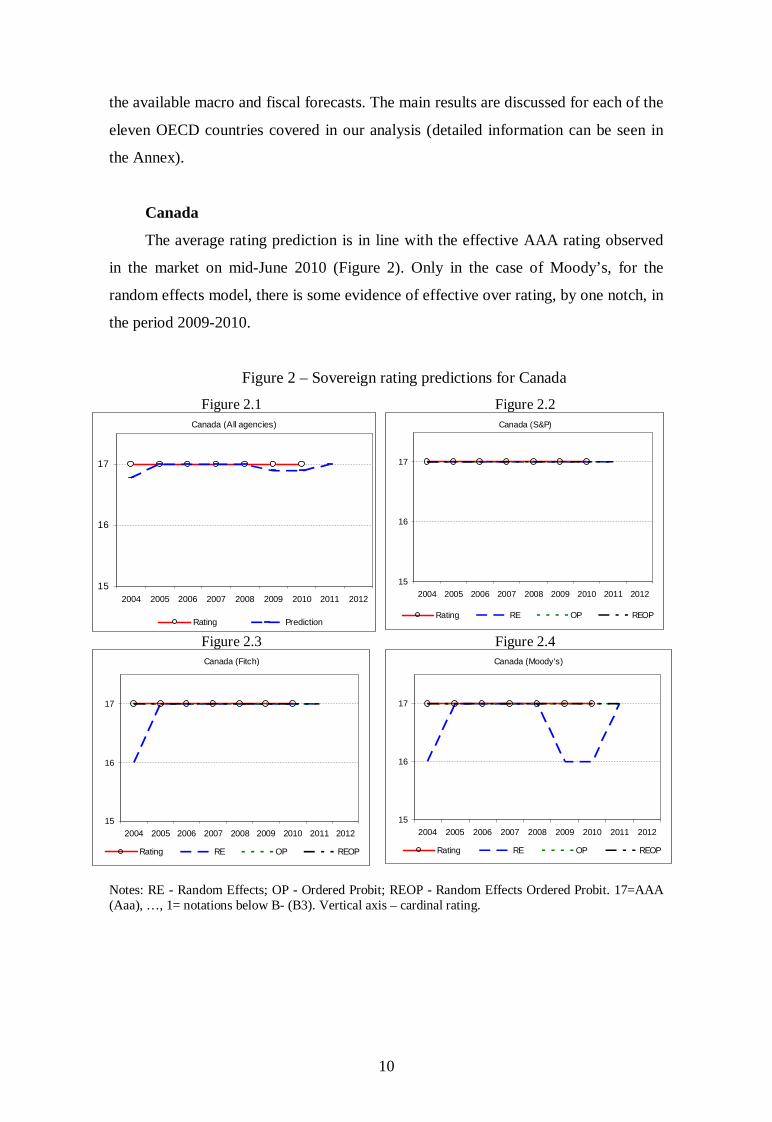
Canada
The average rating prediction is in line with the effective AAA rating observed
in the market on mid-June 2010 (Figure 2). Only in the case of Moody’s, for the
random effects model, there is some evidence of effective over rating, by one notch, in
the period 2009-2010.
Figure 2 – Sovereign rating predictions for Canada Figure 2.1 Figure 2.2
Canada (All agencies)
15
16
17
2004 2005 2006 2007 2008 2009 2010 2011 2012
Rating Prediction
Canada (S&P)
15
16
17
2004 2005 2006 2007 2008 2009 2010 2011 2012
Rating RE OP REOP
Figure 2.3 Figure 2.4 Canada (Fitch)
15
16
17
2004 2005 2006 2007 2008 2009 2010 2011 2012
Rating RE OP REOP
Canada (Moody's)
15
16
17
2004 2005 2006 2007 2008 2009 2010 2011 2012
Rating RE OP REOP
Notes: RE - Random Effects; OP - Ordered Probit; REOP - Random Effects Ordered Probit. 17=AAA (Aaa), …, 1= notations below B- (B3). Vertical axis – cardinal rating.
11
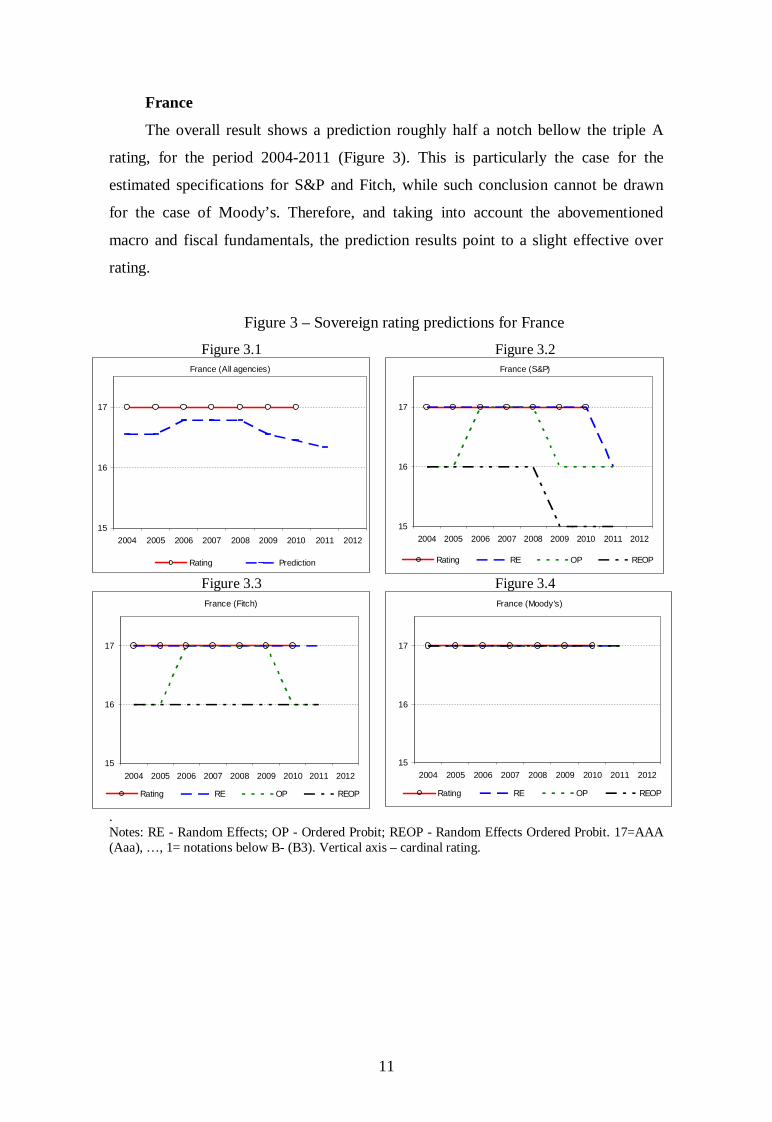
France
The overall result shows a prediction roughly half a notch bellow the triple A
rating, for the period 2004-2011 (Figure 3). This is particularly the case for the
estimated specifications for S&P and Fitch, while such conclusion cannot be drawn
for the case of Moody’s. Therefore, and taking into account the abovementioned
macro and fiscal fundamentals, the prediction results point to a slight effective over
rating.
Figure 3 – Sovereign rating predictions for France
Figure 3.1 Figure 3.2 France (All agencies)
15
16
17
2004 2005 2006 2007 2008 2009 2010 2011 2012
Rating Prediction
France (S&P)
15
16
17
2004 2005 2006 2007 2008 2009 2010 2011 2012
Rating RE OP REOP
Figure 3.3 Figure 3.4 France (Fitch)
15
16
17
2004 2005 2006 2007 2008 2009 2010 2011 2012
Rating RE OP REOP
France (Moody's)
15
16
17
2004 2005 2006 2007 2008 2009 2010 2011 2012
Rating RE OP REOP
. Notes: RE - Random Effects; OP - Ordered Probit; REOP - Random Effects Ordered Probit. 17=AAA (Aaa), …, 1= notations below B- (B3). Vertical axis – cardinal rating.

12
Germany
For the random ordered probit models, and for the cases of S&P and Fitch, the
prediction results show a rating somewhat below triple A, but not enough to imply an
effective over rating (Figure 4). However, as in the case of France, the prediction
results from the three alternative specifications for the case of Moody’s do not
indicate a situation of effective over rating. Therefore, it seems that for the two largest
euro area economies Moody’s has a somewhat different (more benign) assessment
than the ones that are possible to model via the historical track record for S&P and
Fitch.
Figure 4 – Sovereign rating predictions for Germany Figure 4.1 Figure 4.2
Germany (All agencies)
15
16
17
2004 2005 2006 2007 2008 2009 2010 2011 2012
Rating Prediction
Germany (S&P)
15
16
17
2004 2005 2006 2007 2008 2009 2010 2011 2012
Rating RE OP REOP
Figure 4.3 Figure 4.4 Germany (Fitch)
15
16
17
2004 2005 2006 2007 2008 2009 2010 2011 2012
Rating RE OP REOP
Germany (Moody's)
15
16
17
2004 2005 2006 2007 2008 2009 2010 2011 2012
Rating RE OP REOP
. Notes: RE - Random Effects; OP - Ordered Probit; REOP - Random Effects Ordered Probit. 17=AAA (Aaa), …, 1= notations below B- (B3). Vertical axis – cardinal rating.

13
Greece
The average prediction from the three specifications and for the three rating
agencies is around A for S&P and Fitch, and A2 for Moody’s (Figure 5). These model
predictions are above the effective rating levels observed on mid-June 2010, which
ranged from BB+ for S&P to A3 for Moody’s. Nevertheless, the model predictions
rightly detect the downward movement in the Greek sovereign ratings from 2008
onwards, following the economic and financial crisis and the ensuing deterioration of
the fiscal scenario. Since then, the model predicts a downgrade between one to four
notches. However, it seems that the S&P and Moody’s downgrades were much
sharper than the predictions (a downgrade between 1 and 4 notches), when compared
to a downgrade of two notches of Fitch. From these prediction results there seems to
arise a situation of effective under rating for Greece.
Figure 5 – Sovereign rating predictions for Greece Figure 5.1 Figure 5.2
Greece (All agencies)
8
9
10
11
12
13
14
2004 2005 2006 2007 2008 2009 2010 2011 2012
Rating Prediction
Greece (S&P)
7
8
9
10
11
12
13
14
15
2004 2005 2006 2007 2008 2009 2010 2011 2012
Rating RE OP REOP
Figure 5.3 Figure 5.4 Greece (Fitch)
9
10
11
12
13
14
15
2004 2005 2006 2007 2008 2009 2010 2011 2012
Rating RE OP REOP
Greece (Moody's)
7
8
9
10
11
12
13
14
15
2004 2005 2006 2007 2008 2009 2010 2011 2012
Rating RE OP REOP
Notes: RE - Random Effects; OP - Ordered Probit; REOP - Random Effects Ordered Probit. 17=AAA (Aaa), …, 1= notations below B- (B3). Vertical axis – cardinal rating.

14
Ireland
The average rating prediction for Ireland comes out slightly above the effective
rating classification in the first half of 2010 (Figure 6). Indeed, while the effective Aa2
rating from Moody’s is accurately reproduced by the average of the respective model
specifications, the model predictions for S&P and for Fitch are roughly on notch
above the 2010 rating. These prediction results would indicate an effective under
rating situation at that time. Again, the triple A ratings are correctly predicted up to
2008, and after that year the models correctly pick up the worsening of the fiscal and
macro conditions.
Figure 6 – Sovereign rating predictions for Ireland Figure 6.1 Figure 6.2
Ireland (All agencies)
14
15
16
17
2004 2005 2006 2007 2008 2009 2010 2011 2012
Rating Prediction
Ireland (S&P)
14
15
16
17
2004 2005 2006 2007 2008 2009 2010 2011 2012
Rating RE OP REOP
Figure 6.3 Figure 6.4 Ireland (Fitch)
14
15
16
17
2004 2005 2006 2007 2008 2009 2010 2011 2012
Rating RE OP REOP
Ireland (Moody's)
14
15
16
17
2004 2005 2006 2007 2008 2009 2010 2011 2012
Rating RE OP REOP
Notes: RE - Random Effects; OP - Ordered Probit; REOP - Random Effects Ordered Probit. 17=AAA (Aaa), …, 1= notations below B- (B3). Vertical axis – cardinal rating.
15
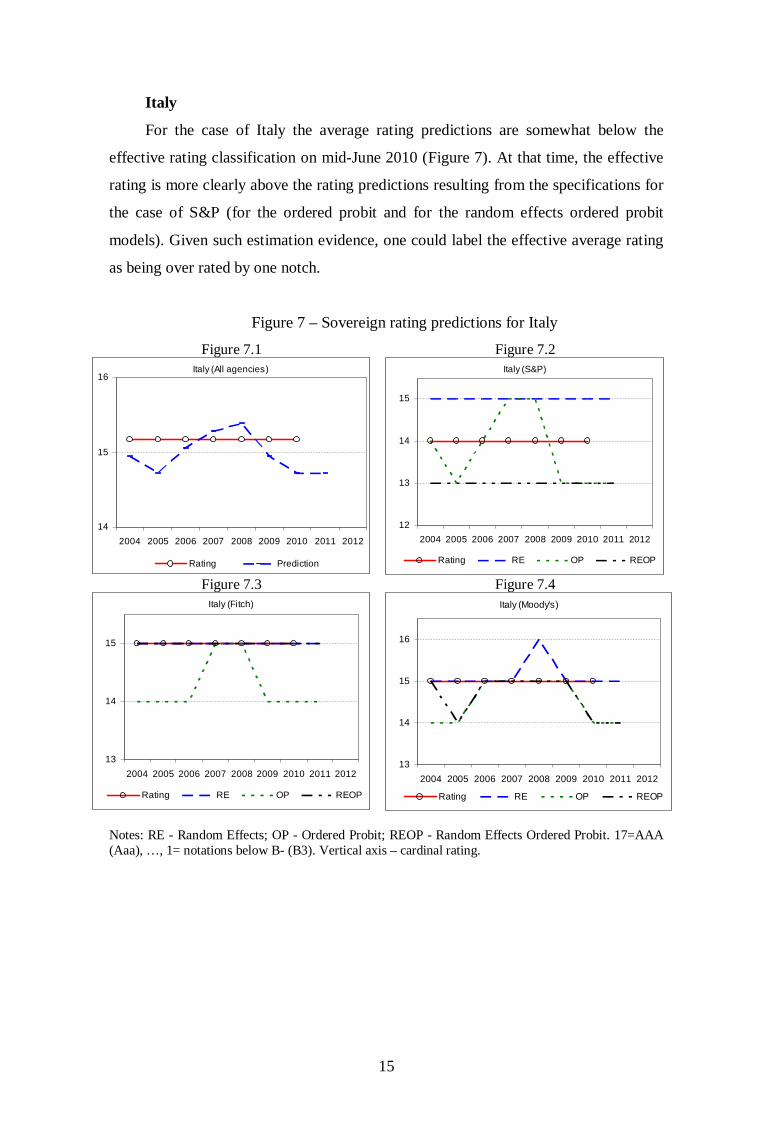
Italy
For the case of Italy the average rating predictions are somewhat below the
effective rating classification on mid-June 2010 (Figure 7). At that time, the effective
rating is more clearly above the rating predictions resulting from the specifications for
the case of S&P (for the ordered probit and for the random effects ordered probit
models). Given such estimation evidence, one could label the effective average rating
as being over rated by one notch.
Figure 7 – Sovereign rating predictions for Italy
Figure 7.1 Figure 7.2 Italy (All agencies)
14
15
16
2004 2005 2006 2007 2008 2009 2010 2011 2012
Rating Prediction
Italy (S&P)
12
13
14
15
2004 2005 2006 2007 2008 2009 2010 2011 2012
Rating RE OP REOP
Figure 7.3 Figure 7.4 Italy (Fitch)
13
14
15
2004 2005 2006 2007 2008 2009 2010 2011 2012
Rating RE OP REOP
Italy (Moody's)
13
14
15
16
2004 2005 2006 2007 2008 2009 2010 2011 2012
Rating RE OP REOP
Notes: RE - Random Effects; OP - Ordered Probit; REOP - Random Effects Ordered Probit. 17=AAA (Aaa), …, 1= notations below B- (B3). Vertical axis – cardinal rating.
16
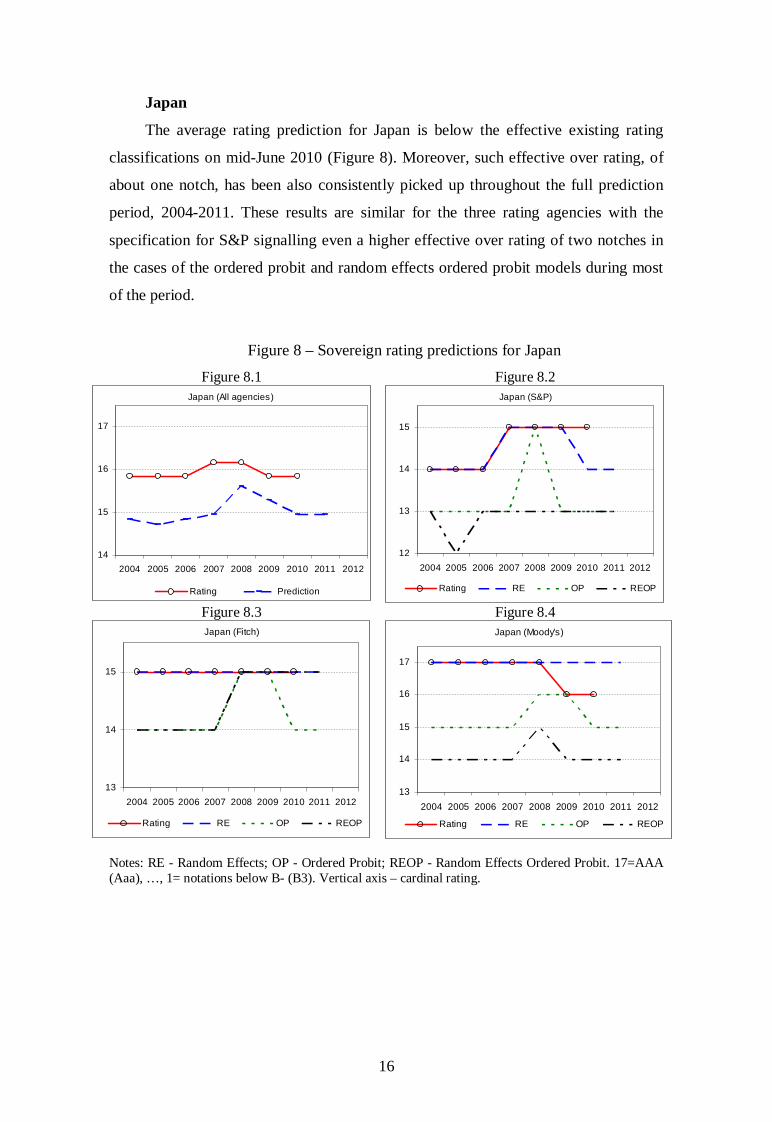
Japan
The average rating prediction for Japan is below the effective existing rating
classifications on mid-June 2010 (Figure 8). Moreover, such effective over rating, of
about one notch, has been also consistently picked up throughout the full prediction
period, 2004-2011. These results are similar for the three rating agencies with the
specification for S&P signalling even a higher effective over rating of two notches in
the cases of the ordered probit and random effects ordered probit models during most
of the period.
Figure 8 – Sovereign rating predictions for Japan Figure 8.1 Figure 8.2
Japan (All agencies)
14
15
16
17
2004 2005 2006 2007 2008 2009 2010 2011 2012
Rating Prediction
Japan (S&P)
12
13
14
15
2004 2005 2006 2007 2008 2009 2010 2011 2012
Rating RE OP REOP
Figure 8.3 Figure 8.4 Japan (Fitch)
13
14
15
2004 2005 2006 2007 2008 2009 2010 2011 2012
Rating RE OP REOP
Japan (Moody's)
13
14
15
16
17
2004 2005 2006 2007 2008 2009 2010 2011 2012
Rating RE OP REOP
Notes: RE - Random Effects; OP - Ordered Probit; REOP - Random Effects Ordered Probit. 17=AAA (Aaa), …, 1= notations below B- (B3). Vertical axis – cardinal rating.

17
Portugal
For Portugal, the average rating prediction from the models’ estimations is
around two notches above the effective rating average (Figure 9). This effective rating
under rating vis-à-vis the model predictions is more pronounced in the case of S&P
where the deviation reaches three notches for 2010. In fact, the rating of S&P is two
and three notches below respectively the Moody’s and Fitch’s counterpart. Again, the
estimated models are able to track, on average, the recent rating downgrade, reflecting
the less favourable fiscal and macro developments and their respective projections for
2010-2011 by the European Commission.
Figure 9 – Sovereign rating predictions for Portugal Figure 9.1 Figure 9.2
Portugal (All agencies)
13
14
15
16
2004 2005 2006 2007 2008 2009 2010 2011 2012
Rating Prediction
Portugal (S&P)
11
12
13
14
15
16
17
2004 2005 2006 2007 2008 2009 2010 2011 2012
Rating RE OP REOP
Figure 9.3 Figure 9.4 Portugal (Fitch)
13
14
15
16
17
2004 2005 2006 2007 2008 2009 2010 2011 2012
Rating RE OP REOP
Portugal (Moody's)
13
14
15
16
17
2004 2005 2006 2007 2008 2009 2010 2011 2012
Rating RE OP REOP
Notes: RE - Random Effects; OP - Ordered Probit; REOP - Random Effects Ordered Probit. 17=AAA (Aaa), …, 1= notations below B- (B3). Vertical axis – cardinal rating.

18
Spain
The average predictions are essentially in line with the average of the effective
2010 ratings (Figure 10). Such conclusion is also valid for the past recent years.
However, it is interesting to notice that the rating predictions for the models estimated
for Moody’s reflect an effective over rating in 2010, of one notch, which is also
estimated for 2011 (across the three specifications). Therefore, we can observe for
Moody’s a situation somewhat similar to the cases seen before for Germany and
France.
Figure 10 – Sovereign rating predictions for Spain Figure 10.1 Figure 10.2
Spain (All agencies)
15
16
17
2004 2005 2006 2007 2008 2009 2010 2011 2012
Rating Prediction
Spain (S&P)
14
15
16
17
2004 2005 2006 2007 2008 2009 2010 2011 2012
Rating RE OP REOP
Figure 10.3 Figure 10.4 Spain (Fitch)
14
15
16
17
2004 2005 2006 2007 2008 2009 2010 2011 2012
Rating RE OP REOP
Spain (Moody's)
14
15
16
17
2004 2005 2006 2007 2008 2009 2010 2011 2012
Rating RE OP REOP
Notes: RE - Random Effects; OP - Ordered Probit; REOP - Random Effects Ordered Probit. 17=AAA (Aaa), …, 1= notations below B- (B3). Vertical axis – cardinal rating.

19
U.K.
Regarding the U.K. the averaging of the model rating predictions indicates the
existence of an effective over rating of more than one notch (Figure 11). Indeed, for
2010-2011, all models produce an estimated sovereign rating below the effective 2010
rating. This difference is more relevant in the case of S&P for 2011, where the
potential effective over rating could be around two notches.
Figure 11 – Sovereign rating predictions for the U.K. Figure 11.1 Figure 11.2
United Kingdom (All agencies)
15
16
17
2004 2005 2006 2007 2008 2009 2010 2011 2012
Rating Prediction
United Kingdom (S&P)
14
15
16
17
2004 2005 2006 2007 2008 2009 2010 2011 2012
Rating RE OP REOP
Figure 11.3 Figure 11.4 United Kingdom (Fitch)
14
15
16
17
2004 2005 2006 2007 2008 2009 2010 2011 2012
Rating RE OP REOP
United Kingdom (Moody's)
14
15
16
17
2004 2005 2006 2007 2008 2009 2010 2011 2012
Rating RE OP REOP
Notes: RE - Random Effects; OP - Ordered Probit; REOP - Random Effects Ordered Probit. 17=AAA (Aaa), …, 1= notations below B- (B3). Vertical axis – cardinal rating.

20
U.S.
For the case of the U.S. the average of the estimated ratings is more than one
notch below the average effective rating in the beginning of 2010 (Figure 12). Such
effective over rating is around two notches in the case of S&P in 2010-2011.
Interestingly, the increase in the estimated effective over rating is picked up as early
as 2008, although it was already possible to be tracked since 2004 for the S&P and the
Fitch specifications.
Figure 12 – Sovereign rating predictions for the U.S.
Figure 12.1 Figure 12.2 United States (All agencies)
15
16
17
2004 2005 2006 2007 2008 2009 2010 2011 2012
Rating Prediction
United States (S&P)
14
15
16
17
2004 2005 2006 2007 2008 2009 2010 2011 2012
Rating RE OP REOP
Figure 12.3 Figure 12.4 United States (Fitch)
14
15
16
17
2004 2005 2006 2007 2008 2009 2010 2011 2012
Rating RE OP REOP
United States (Moody's)
14
15
16
17
2004 2005 2006 2007 2008 2009 2010 2011 2012
Rating RE OP REOP
Notes: RE - Random Effects; OP - Ordered Probit; REOP - Random Effects Ordered Probit. 17=AAA (Aaa), …, 1= notations below B- (B3). Vertical axis – cardinal rating.

21
3.3. Overview of the forecast
Table 4 further summarises the deviations of the average country prediction
results vis-à-vis the effective mid-June 2010 average ratings of the three rating
agencies. It can be seen that for 2010 the three main rating agencies seem to be
attributing too low sovereign ratings for Greece, Ireland, and Portugal, taking into
account the main macro and fiscal determinants used in the model specifications used
in this study. Therefore, one may see in these results some evidence of effective under
rating for those countries. On the other hand, the estimated prediction results point to
the existence of a relative over rating vis-à-vis the average country for France,
Germany, Italy, Japan, the U.K., and the U.S.
Table 4 – 3-agency average effective (mid-June) 2010 rating vis-à-vis the average model predictions
Effective rating vis-
à-vis the prediction Notches of effective over (+)
and under (-) rating Canada equal 0 France above +1 Germany equal 0 Greece below -4 Ireland below -1 Italy above +1 Japan above +2 Portugal below -2 Spain equal 0 UK above +1 US above +1
Table 5 shows the importance of fiscal elements in explaining the deterioration
of the ratings, as percentage of total. We can see that for most countries, the increase
in government debt and in the budget deficit contributed between 60 and 100 percent
to the reduction of creditworthiness.
Again, one must bear in mind that we are only using, for the prediction of the
ratings, the macro and fiscal variables, in order to be able to do the corresponding
forecasts for the period 2010-2011, for which we use the European Commission
forecasts. Therefore, other rating determinants may actually play a role in mitigating
the extent of the under rating or over rating situations reported in this study.
Additionally, the model was estimated for 100 countries and was not specific to
OECD countries. Other important elements might be the maturity structure of the

22
government debt; and the possibility that rating agencies also assess banking sector
developments, which can also impinge on fiscal imbalances.5
Table 5 – Contribution of fiscal elements (2008-2011), % of total
Fitch S&P Moody's
RE OP ROP Avg RE OP ROP Avg RE OP ROP Avg
Avg
Canada 1.14 1.17 1.13 1.15 1.00 1.05 1.08 1.05 0.89 1.05 1.03 0.99 1.06 France 0.80 0.72 0.76 0.76 0.79 0.77 0.89 0.81 0.60 0.66 0.72 0.66 0.74 Germany 0.68 0.64 0.75 0.69 0.69 0.72 0.80 0.74 0.52 0.61 0.67 0.60 0.68 Greece 0.74 0.66 0.72 0.70 0.68 0.69 0.85 0.74 0.45 0.54 0.62 0.54 0.66 Ireland 0.75 0.64 0.69 0.70 0.73 0.71 0.85 0.76 0.52 0.59 0.66 0.59 0.68
Italy 0.66 0.56 0.61 0.61 0.66 0.63 0.78 0.69 0.44 0.49 0.57 0.50 0.60 Japan 1.20 1.28 1.28 1.25 1.02 1.12 1.11 1.08 0.92 1.18 1.11 1.07 1.13 Portugal 0.81 0.73 0.77 0.77 0.80 0.78 0.89 0.82 0.62 0.67 0.74 0.68 0.76 Spain 0.77 0.63 0.68 0.69 0.71 0.68 0.86 0.75 0.49 0.57 0.64 0.57 0.67 UK 0.74 0.67 0.72 0.71 0.76 0.74 0.84 0.78 0.60 0.63 0.70 0.64 0.71
US 1.04 0.96 0.94 0.98 0.94 0.92 1.03 0.96 0.75 0.85 0.89 0.83 0.92 Note: RE - Random Effects; OP - Ordered Probit; REOP - Random Effects Ordered Probit.
Finally, the relevance of the sovereign rating notations can also be summarised
in terms of the additional basis points that a sovereign issuer would have to pay, on
average, above the triple A rating. Such additional premium is reported in terms of
basis points in Table 6, where the end of the year yields and ratings were used. For
instance, it is possible to observe that BBB rated sovereigns ended up paying in the
past, and on average, around 300 basis points more than an AAA issuer.
Table 6 – Average yield spread of government bonds over sovereign AAA bonds (1996-2009)
Rating AAA AA+ AA AA- A+ A A- BBB+ BBB BBB- Basis points 0 8 3 29 71 100 159 275 312 297
Source: Reuters and for the yields and own calculations. Note: countries included are Belgium, Germany, Ireland, Greece, Spain, France, Italy, Netherlands, Austria, Portugal, Finland, Malta, Denmark, United Kingdom, Bulgaria, Czech Republic, Hungary, Latvia, Poland, Sweden, United States, and Canada. Japan was dropped form the calculation due to the fact that rather low yields would generate sometimes marginally negative spreads.
4. Conclusion
We used the estimated ordered response models for sovereign debt rating from
Afonso, Gomes and Rother (2009, 2010), for Fitch, Moody’s, and Standard & Poor’s,
5 Gerlach, Schulz and Wolff (2010) argue that when financial markets perceive a larger risk that governments will need to rescue banks, by increasing government debt, this negatively impinges on sovereign risk.

23
to assess to what extent the recent fiscal imbalances in several OECD countries are
being reflected on the sovereign debt notations. For that purpose we use macro and
fiscal data up to 2009, and macro and fiscal projections for 2010-2011, to compute the
expected sovereign ratings for eleven OECD countries.
When computing the predicted sovereign ratings we used, for each country, and
for each of the three rating agencies, three different estimations methods: random
effects, ordered probit, and random effects ordered probit. In that way, we are able to
gain more robustness for the calculations by averaging all the rating predictions to
compare with the effective rating notation.
According to our results, we observe an overall downgrading in sovereign debt
ratings from the computed predictions in the period 2009-2011. Therefore, fiscal
worsening, together with less optimistic macro scenarios are indeed translated into
lower sovereign ratings. The importance of the fiscal variables, government debt and
fiscal deficit, to explain the deterioration of the sovereign ratings, is between 60 and
100 percent of the reduction of creditworthiness.
However, the response has not been homogeneous across rating agencies. The
rating predictions that we computed also point to a relative over rating vis-à-vis the
average country of France, Italy, Japan, U.K. and U.S. of around one and two notches.
On the other hand, a relative average under rating in the cases of Greece, Ireland and
Portugal was uncovered, ranging between one and four notches.
How can we explain this asymmetry? These predictions came from a model
estimated for 60 countries, so they reflect the behaviour of agencies when rating an
average country. These differences can be explained if agencies are looking at other
variables that are more relevant now, such as the stability of the financial system, the
maturity structure of debt or other political factors. One can envisage that for the
average under rated country, the agencies seem to see a worse medium-term outlook
not reflected in the current projection of fundamentals, while for the average over
rated country, rating agencies may be expecting a return to more normal fiscal and
macro conditions in the medium- term. On the other hand, rating agencies could be
keener to attribute higher ratings in boom times, when investor’s trust on the economy
tends to rise, and the risk of rating misspecification is lower for the agencies’
reputation (see Bolton, Freixas and Shapiro, 2009).

24
However, we cannot exclude that some of the effective sovereign ratings may
also be prompted by an overall increase in risk aversion that trickled down to country
specific ratings.
All in all, governments need to be aware of the importance of sound fiscal
policies in order to decrease the risk perception of capital markets and investors vis-à-
vis their levels of government indebtedness.
References
Afonso, A. (2003). “Understanding the determinants of sovereign debt ratings:
evidence for the two leading agencies”. Journal of Economics and Finance, 27
(1), 56-74.
Afonso, A., Gomes, P., Rother, P. (2009). “Ordered Response Models for Sovereign
Debt Ratings”, Applied Economics Letters, 16 (8), 769-773.
Afonso, A., Gomes, P., Rother, P. (2010). “Short and Long-run Determinants of
Sovereign Debt Credit Ratings”, International Journal of Finance and Economics,
forthcoming.
Bissoondoyal-Bheenick, E. (2005). “An analysis of the determinants of sovereign
ratings”. Global Finance Journal, 15 (3), 251-280.
Bolton, P., Freixas, X., Shapiro, J. (2009). “The Credit Ratings Game”, NBER
Working Paper 14712.
Cantor, R., Packer, F. (1996). “Determinants and impact of sovereign credit ratings”.
Economic Policy Review, 2, 37-53. Federal Reserve Bank of New York.
Depken, C., LaFountain, C., Butters, R. (2007). “Corruption and Creditworthiness:
Evidence from Sovereign Credit Ratings”. Working Papers 0601, University of
Texas at Arlington, Department of Economics.
Gerlach, S., Schulz, A., Wolff, G. (2010). “Banking and Sovereign Risk in the Euro
Area”, CEPR Discussion Paper 7833.
Hu, Y.-T., Kiesel, R., Perraudin, W. (2002). “The estimation of transition matrices for
sovereign credit ratings”. Journal of Banking & Finance, 26 (7), 1383-1406.
Mora, N. (2006). “Sovereign credit ratings: Guilty beyond reasonable doubt?” Journal
of Banking and Finance, 30, 2041-2062.
Ratha, D., De, P., Mohapatra, S. (2007). “Shadow Sovereign Ratings for Unrated
Developing Countries”, World Bank Policy Research Working Paper No. 4269.
Reinhart, C., Rogoff, R. (2010). “Growth in a Time of Debt”, NBER WP 15639.

25
Annex – Rating history and predictions Table A1 – Canada
Rating Rating Code Fitch S&P Moody's Year Fitch SP M FC17 SPC17 MC17 Avg RE OP REOP Avg RE OP REOP Avg RE OP REOP Avg Avg
1989 AAA Aaa 17 17
1990 AAA Aaa 17 17
1991 AAA Aaa 17 17
1992 AA+ Aaa 16 17
1993 AA+ Aaa 16 17
1994 AA AA+ Aa1 15 16 16
1995 AA AA+ Aa2 15 16 15
1996 AA AA+ Aa2 15 16 15 15.3 15 15 15 15.0 15 15 15 15.0 15 15 15 15.0 15.0
1997 AA AA+ Aa2 15 16 15 15.3 15 15 15 15.0 16 16 16 16.0 15 15 16 15.3 15.4
1998 AA AA+ Aa2 15 16 15 15.3 15 15 16 15.3 16 16 16 16.0 16 16 16 16.0 15.8
1999 AA AA+ Aa2 15 16 15 15.3 16 15 16 15.7 16 16 16 16.0 16 16 17 16.3 16.0
2000 AA AA+ Aa1 15 16 16 15.7 16 15 16 15.7 17 16 16 16.3 16 17 17 16.7 16.2
2001 AA+ AA+ Aa1 16 16 16 16.0 16 15 16 15.7 16 16 16 16.0 16 17 17 16.7 16.1
2002 AA+ AAA Aaa 16 17 17 16.7 16 16 16 16.0 17 16 16 16.3 16 17 17 16.7 16.3
2003 AA+ AAA Aaa 16 17 17 16.7 16 16 17 16.3 17 17 17 17.0 16 17 17 16.7 16.7
2004 AAA AAA Aaa 17 17 17 17.0 16 17 17 16.7 17 17 17 17.0 16 17 17 16.7 16.8
2005 AAA AAA Aaa 17 17 17 17.0 17 17 17 17.0 17 17 17 17.0 17 17 17 17.0 17.0
2006 AAA AAA Aaa 17 17 17 17.0 17 17 17 17.0 17 17 17 17.0 17 17 17 17.0 17.0
2007 AAA AAA Aaa 17 17 17 17.0 17 17 17 17.0 17 17 17 17.0 17 17 17 17.0 17.0
2008 AAA AAA Aaa 17 17 17 17.0 17 17 17 17.0 17 17 17 17.0 17 17 17 17.0 17.0
2009 AAA AAA Aaa 17 17 17 17.0 17 17 17 17.0 17 17 17 17.0 16 17 17 16.7 16.9
2010 AAA AAA Aaa 17 17 17 17.0 16 17 17 16.7 17 17 17 17.0 16 17 17 16.7 16.8
2011 16 17 17 17 17 17 17 17 16 17 17 17 16.8
Table A2 – France
Rating Rating Code Fitch S&P Moody's Year Fitch SP M FC17 SPC17 MC17 Avg RE OP REOP Avg RE OP REOP Avg RE OP REOP Avg Avg
1989 AAA 17
1990 AAA 17
1991 AAA 17
1992 AAA Aaa 17 17
1993 AAA Aaa 17 17
1994 AAA AAA Aaa 17 17 17
1995 AAA AAA Aaa 17 17 17
1996 AAA AAA Aaa 17 17 17 17.0 17 16 16 16.3 17 16 16 16.3 17 17 17 17.0 16.6
1997 AAA AAA Aaa 17 17 17 17.0 17 16 16 16.3 17 16 16 16.3 17 17 17 17.0 16.6
1998 AAA AAA Aaa 17 17 17 17.0 17 16 16 16.3 17 16 16 16.3 17 17 17 17.0 16.6
1999 AAA AAA Aaa 17 17 17 17.0 17 15 15 15.7 17 16 16 16.3 17 17 17 17.0 16.3
2000 AAA AAA Aaa 17 17 17 17.0 17 15 15 15.7 17 16 15 16.0 17 16 17 16.7 16.1
2001 AAA AAA Aaa 17 17 17 17.0 17 15 15 15.7 17 16 15 16.0 17 17 17 17.0 16.2
2002 AAA AAA Aaa 17 17 17 17.0 17 16 15 16.0 17 16 15 16.0 17 17 17 17.0 16.3
2003 AAA AAA Aaa 17 17 17 17.0 17 16 16 16.3 17 16 15 16.0 17 17 17 17.0 16.4
2004 AAA AAA Aaa 17 17 17 17.0 17 16 16 16.3 17 16 16 16.3 17 17 17 17.0 16.6
2005 AAA AAA Aaa 17 17 17 17.0 17 16 16 16.3 17 16 16 16.3 17 17 17 17.0 16.6
2006 AAA AAA Aaa 17 17 17 17.0 17 17 16 16.7 17 17 16 16.7 17 17 17 17.0 16.8
2007 AAA AAA Aaa 17 17 17 17.0 17 17 16 16.7 17 17 16 16.7 17 17 17 17.0 16.8
2008 AAA AAA Aaa 17 17 17 17.0 17 17 16 16.7 17 17 16 16.7 17 17 17 17.0 16.8
2009 AAA AAA Aaa 17 17 17 17.0 17 17 16 16.7 17 16 15 16.0 17 17 17 17.0 16.6
2010 AAA AAA Aaa 17 17 17 17.0 17 16 16 16.3 17 16 15 16.0 17 17 17 17.0 16.4
2011 17 16 16 16 16 16 15 16 17 17 17 17 16.3
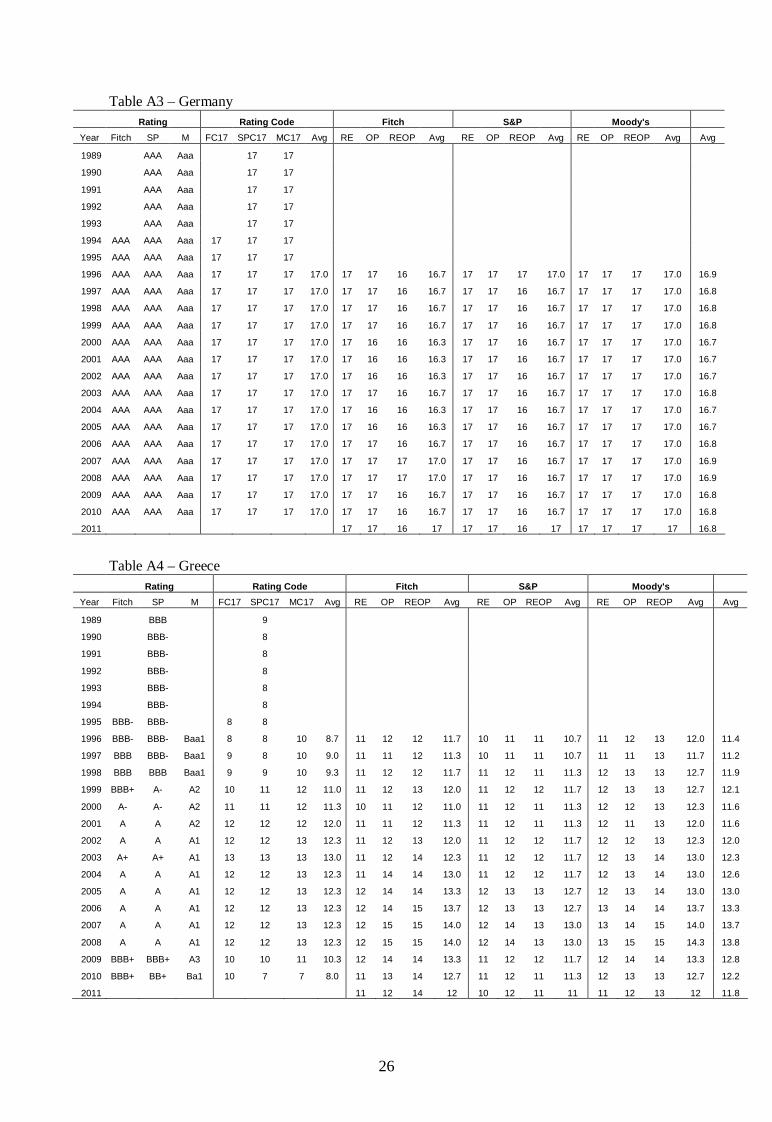
26
Table A3 – Germany Rating Rating Code Fitch S&P Moody's Year Fitch SP M FC17 SPC17 MC17 Avg RE OP REOP Avg RE OP REOP Avg RE OP REOP Avg Avg
1989 AAA Aaa 17 17
1990 AAA Aaa 17 17
1991 AAA Aaa 17 17
1992 AAA Aaa 17 17
1993 AAA Aaa 17 17
1994 AAA AAA Aaa 17 17 17
1995 AAA AAA Aaa 17 17 17
1996 AAA AAA Aaa 17 17 17 17.0 17 17 16 16.7 17 17 17 17.0 17 17 17 17.0 16.9
1997 AAA AAA Aaa 17 17 17 17.0 17 17 16 16.7 17 17 16 16.7 17 17 17 17.0 16.8
1998 AAA AAA Aaa 17 17 17 17.0 17 17 16 16.7 17 17 16 16.7 17 17 17 17.0 16.8
1999 AAA AAA Aaa 17 17 17 17.0 17 17 16 16.7 17 17 16 16.7 17 17 17 17.0 16.8
2000 AAA AAA Aaa 17 17 17 17.0 17 16 16 16.3 17 17 16 16.7 17 17 17 17.0 16.7
2001 AAA AAA Aaa 17 17 17 17.0 17 16 16 16.3 17 17 16 16.7 17 17 17 17.0 16.7
2002 AAA AAA Aaa 17 17 17 17.0 17 16 16 16.3 17 17 16 16.7 17 17 17 17.0 16.7
2003 AAA AAA Aaa 17 17 17 17.0 17 17 16 16.7 17 17 16 16.7 17 17 17 17.0 16.8
2004 AAA AAA Aaa 17 17 17 17.0 17 16 16 16.3 17 17 16 16.7 17 17 17 17.0 16.7
2005 AAA AAA Aaa 17 17 17 17.0 17 16 16 16.3 17 17 16 16.7 17 17 17 17.0 16.7
2006 AAA AAA Aaa 17 17 17 17.0 17 17 16 16.7 17 17 16 16.7 17 17 17 17.0 16.8
2007 AAA AAA Aaa 17 17 17 17.0 17 17 17 17.0 17 17 16 16.7 17 17 17 17.0 16.9
2008 AAA AAA Aaa 17 17 17 17.0 17 17 17 17.0 17 17 16 16.7 17 17 17 17.0 16.9
2009 AAA AAA Aaa 17 17 17 17.0 17 17 16 16.7 17 17 16 16.7 17 17 17 17.0 16.8
2010 AAA AAA Aaa 17 17 17 17.0 17 17 16 16.7 17 17 16 16.7 17 17 17 17.0 16.8
2011 17 17 16 17 17 17 16 17 17 17 17 17 16.8
Table A4 – Greece Rating Rating Code Fitch S&P Moody's Year Fitch SP M FC17 SPC17 MC17 Avg RE OP REOP Avg RE OP REOP Avg RE OP REOP Avg Avg
1989 BBB 9
1990 BBB- 8
1991 BBB- 8
1992 BBB- 8
1993 BBB- 8
1994 BBB- 8
1995 BBB- BBB- 8 8
1996 BBB- BBB- Baa1 8 8 10 8.7 11 12 12 11.7 10 11 11 10.7 11 12 13 12.0 11.4
1997 BBB BBB- Baa1 9 8 10 9.0 11 11 12 11.3 10 11 11 10.7 11 11 13 11.7 11.2
1998 BBB BBB Baa1 9 9 10 9.3 11 12 12 11.7 11 12 11 11.3 12 13 13 12.7 11.9
1999 BBB+ A- A2 10 11 12 11.0 11 12 13 12.0 11 12 12 11.7 12 13 13 12.7 12.1
2000 A- A- A2 11 11 12 11.3 10 11 12 11.0 11 12 11 11.3 12 12 13 12.3 11.6
2001 A A A2 12 12 12 12.0 11 11 12 11.3 11 12 11 11.3 12 11 13 12.0 11.6
2002 A A A1 12 12 13 12.3 11 12 13 12.0 11 12 12 11.7 12 12 13 12.3 12.0
2003 A+ A+ A1 13 13 13 13.0 11 12 14 12.3 11 12 12 11.7 12 13 14 13.0 12.3
2004 A A A1 12 12 13 12.3 11 14 14 13.0 11 12 12 11.7 12 13 14 13.0 12.6
2005 A A A1 12 12 13 12.3 12 14 14 13.3 12 13 13 12.7 12 13 14 13.0 13.0
2006 A A A1 12 12 13 12.3 12 14 15 13.7 12 13 13 12.7 13 14 14 13.7 13.3
2007 A A A1 12 12 13 12.3 12 15 15 14.0 12 14 13 13.0 13 14 15 14.0 13.7
2008 A A A1 12 12 13 12.3 12 15 15 14.0 12 14 13 13.0 13 15 15 14.3 13.8
2009 BBB+ BBB+ A3 10 10 11 10.3 12 14 14 13.3 11 12 12 11.7 12 14 14 13.3 12.8
2010 BBB+ BB+ Ba1 10 7 7 8.0 11 13 14 12.7 11 12 11 11.3 12 13 13 12.7 12.2
2011 11 12 14 12 10 12 11 11 11 12 13 12 11.8

27
Table A5 – Ireland Rating Rating Code Fitch S&P Moody's Year Fitch SP M FC17 SPC17 MC17 Avg RE OP REOP Avg RE OP REOP Avg RE OP REOP Avg Avg
1989 AA- Aa3 14 14
1990 AA- Aa3 14 14
1991 AA- Aa3 14 14
1992 AA- Aa3 14 14
1993 AA- Aa3 14 14
1994 AA+ AA- Aa2 16 14 15
1995 AA+ AA Aa2 16 15 15
1996 AA+ AA Aa2 16 15 15 15.3 16 15 16 15.7 15 16 15 15.3 15 16 16 15.7 15.6
1997 AA+ AA Aa2 16 15 15 15.3 16 16 16 16.0 16 16 16 16.0 16 17 17 16.7 16.2
1998 AAA AA+ Aaa 17 16 17 16.7 16 17 16 16.3 16 16 16 16.0 16 17 17 16.7 16.3
1999 AAA AA+ Aaa 17 16 17 16.7 17 17 17 17.0 16 17 16 16.3 17 17 17 17.0 16.8
2000 AAA AA+ Aaa 17 16 17 16.7 17 17 17 17.0 16 17 17 16.7 17 17 17 17.0 16.9
2001 AAA AAA Aaa 17 17 17 17.0 17 17 17 17.0 17 17 17 17.0 17 17 17 17.0 17.0
2002 AAA AAA Aaa 17 17 17 17.0 17 17 17 17.0 17 17 17 17.0 17 17 17 17.0 17.0
2003 AAA AAA Aaa 17 17 17 17.0 17 17 17 17.0 17 17 17 17.0 17 17 17 17.0 17.0
2004 AAA AAA Aaa 17 17 17 17.0 17 17 17 17.0 17 17 17 17.0 17 17 17 17.0 17.0
2005 AAA AAA Aaa 17 17 17 17.0 17 17 17 17.0 17 17 17 17.0 17 17 17 17.0 17.0
2006 AAA AAA Aaa 17 17 17 17.0 17 17 17 17.0 17 17 17 17.0 17 17 17 17.0 17.0
2007 AAA AAA Aaa 17 17 17 17.0 17 17 17 17.0 17 17 17 17.0 17 17 17 17.0 17.0
2008 AAA AAA Aaa 17 17 17 17.0 17 17 17 17.0 16 17 17 16.7 17 17 17 17.0 16.9
2009 AA- AA Aa1 14 15 16 15.0 17 17 17 17.0 15 16 16 15.7 15 17 17 16.3 16.3
2010 AA- AA Aa2 14 15 15 14.7 16 17 16 16.3 14 16 15 15.0 14 17 16 15.7 15.7
2011 16 17 16 16 14 16 14 15 14 17 16 16 15.6
Table A6 – Italy Rating Rating Code Fitch S&P Moody's Year Fitch SP M FC17 SPC17 MC17 Avg RE OP REOP Avg RE OP REOP Avg RE OP REOP Avg Avg
1989 AA+ Aaa 16 17
1990 AA+ Aaa 16 17
1991 AA+ Aa1 16 16
1992 AA+ Aa3 16 14
1993 AA A1 15 13
1994 AA AA A1 15 15 13
1995 AA- AA A1 14 15 13
1996 AA- AA Aa3 14 15 14 14.3 14 12 14 13.3 14 12 12 12.7 14 12 13 13.0 13.0
1997 AA- AA Aa3 14 15 14 14.3 14 12 14 13.3 14 12 12 12.7 14 12 13 13.0 13.0
1998 AA- AA Aa3 14 15 14 14.3 14 12 14 13.3 15 12 13 13.3 14 12 13 13.0 13.2
1999 AA- AA Aa3 14 15 14 14.3 14 12 15 13.7 15 12 13 13.3 14 12 14 13.3 13.4
2000 AA- AA Aa3 14 15 14 14.3 14 12 14 13.3 15 12 13 13.3 14 12 14 13.3 13.3
2001 AA- AA Aa3 14 15 14 14.3 14 12 14 13.3 15 12 13 13.3 14 13 14 13.7 13.4
2002 AA AA Aa2 15 15 15 15.0 14 12 15 13.7 15 13 13 13.7 14 13 14 13.7 13.7
2003 AA AA Aa2 15 15 15 15.0 15 14 15 14.7 15 13 13 13.7 15 14 14 14.3 14.2
2004 AA AA- Aa2 15 14 15 14.7 15 14 15 14.7 15 14 13 14.0 15 14 15 14.7 14.4
2005 AA AA- Aa2 15 14 15 14.7 15 14 15 14.7 15 13 13 13.7 15 14 14 14.3 14.2
2006 AA- A+ Aa2 15 14 15 14.7 15 14 15 14.7 15 14 13 14.0 15 15 15 15.0 14.6
2007 AA- A+ Aa2 15 14 15 14.7 15 15 15 15.0 15 15 13 14.3 15 15 15 15.0 14.8
2008 AA- A+ Aa2 15 14 15 14.7 15 15 15 15.0 15 15 13 14.3 16 15 15 15.3 14.9
2009 AA- A+ Aa2 15 14 15 14.7 15 14 15 14.7 15 13 13 13.7 15 15 15 15.0 14.4
2010 AA- A+ Aa2 15 14 15 14.7 15 14 15 14.7 15 13 13 13.7 15 14 14 14.3 14.2
2011 15 14 15 15 15 13 13 14 15 14 14 14 14.2

28
Table A7 – Japan Rating Rating Code Fitch S&P Moody's Year Fitch SP M FC17 SPC17 MC17 Avg RE OP REOP Avg RE OP REOP Avg RE OP REOP Avg Avg
1989 AAA Aaa 17 17
1990 AAA Aaa 17 17
1991 AAA Aaa 17 17
1992 AAA Aaa 17 17
1993 AAA Aaa 17 17
1994 AAA AAA Aaa 17 17 17
1995 AAA AAA Aaa 17 17 17
1996 AAA AAA Aaa 17 17 17 17.0 17 16 16 16.3 17 16 16 16.3 17 15 14 15.3 16.0
1997 AAA AAA Aaa 17 17 17 17.0 17 15 16 16.0 17 15 16 16.0 16 14 14 14.7 15.6
1998 AA+ AAA Aa1 16 17 16 16.3 16 15 15 15.3 16 15 15 15.3 16 14 14 14.7 15.1
1999 AA+ AAA Aa1 16 17 16 16.3 16 15 15 15.3 16 15 15 15.3 16 14 14 14.7 15.1
2000 AA+ AAA Aa1 16 17 16 16.3 16 15 15 15.3 16 14 15 15.0 16 14 14 14.7 15.0
2001 AA AA Aa1 15 15 16 15.3 15 14 15 14.7 15 13 13 13.7 16 14 13 14.3 14.2
2002 AA AA- Aaa 15 14 17 15.3 15 14 14 14.3 15 13 13 13.7 16 14 13 14.3 14.1
2003 AA AA- Aaa 15 14 17 15.3 15 14 14 14.3 15 13 13 13.7 17 15 14 15.3 14.4
2004 AA AA- Aaa 15 14 17 15.3 15 14 14 14.3 14 13 13 13.3 17 15 14 15.3 14.3
2005 AA AA- Aaa 15 14 17 15.3 15 14 14 14.3 14 13 12 13.0 17 15 14 15.3 14.2
2006 AA AA- Aaa 15 14 17 15.3 15 14 14 14.3 14 13 13 13.3 17 15 14 15.3 14.3
2007 AA AA Aaa 15 15 17 15.7 15 14 14 14.3 15 13 13 13.7 17 15 14 15.3 14.4
2008 AA AA Aaa 15 15 17 15.7 15 15 15 15.0 15 15 13 14.3 17 16 15 16.0 15.1
2009 AA AA Aa2 15 15 16 15.3 15 15 15 15.0 15 13 13 13.7 17 16 14 15.7 14.8
2010 AA AA Aa3 15 15 16 15.3 15 14 15 14.7 14 13 13 13.3 17 15 14 15.3 14.4
2011 15 14 15 15 14 13 13 13 17 15 14 15 14.4
Table A8 – Portugal Rating Rating Code Fitch S&P Moody's Year Fitch SP M FC17 SPC17 MC17 Avg RE OP REOP Avg RE OP REOP Avg RE OP REOP Avg Avg
1989 A A1 12 13
1990 A A1 12 13
1991 A+ A1 13 13
1992 A+ A1 13 13
1993 AA- A1 14 13
1994 AA- AA- A1 14 14 13
1995 AA- AA- A1 14 14 13
1996 AA- AA- A1 14 14 13 13.7 15 14 14 14.3 14 14 13 13.7 14 15 15 14.7 14.2
1997 AA- AA- Aa3 14 14 14 14.0 15 15 14 14.7 15 15 13 14.3 15 15 15 15.0 14.7
1998 AA AA Aa2 15 15 15 15.0 15 15 15 15.0 15 15 14 14.7 15 15 15 15.0 14.9
1999 AA AA Aa2 15 15 15 15.0 15 15 15 15.0 15 15 14 14.7 15 15 15 15.0 14.9
2000 AA AA Aa2 15 15 15 15.0 15 15 14 14.7 15 15 14 14.7 15 15 15 15.0 14.8
2001 AA AA Aa2 15 15 15 15.0 15 15 14 14.7 15 15 13 14.3 15 15 15 15.0 14.7
2002 AA AA Aa2 15 15 15 15.0 15 15 14 14.7 15 15 13 14.3 15 16 15 15.3 14.8
2003 AA AA Aa2 15 15 15 15.0 15 15 15 15.0 15 15 14 14.7 15 15 15 15.0 14.9
2004 AA AA Aa2 15 15 15 15.0 15 15 15 15.0 15 15 14 14.7 15 15 15 15.0 14.9
2005 AA AA- Aa2 15 14 15 14.7 15 15 15 15.0 15 15 14 14.7 15 15 15 15.0 14.9
2006 AA AA- Aa2 15 14 15 14.7 15 15 15 15.0 15 15 14 14.7 15 15 15 15.0 14.9
2007 AA AA- Aa2 15 14 15 14.7 15 15 15 15.0 15 16 14 15.0 15 16 16 15.7 15.2
2008 AA AA- Aa2 15 14 15 14.7 15 16 15 15.3 15 16 14 15.0 15 16 16 15.7 15.3
2009 AA A+ Aa2 15 13 15 14.3 15 15 15 15.0 14 15 13 14.0 15 15 15 15.0 14.7
2010 AA- A- A1 14 11 13 12.7 15 15 15 15.0 14 15 13 14.0 14 15 15 14.7 14.6
2011 14 15 14 14 14 14 13 14 14 15 15 15 14.2

29
Table A9 – Spain Rating Rating Code Fitch S&P Moody's Year Fitch SP M FC17 SPC17 MC17 Avg RE OP REOP Avg RE OP REOP Avg RE OP REOP Avg Avg
1989 AA Aa2 15 15
1990 AA Aa2 15 15
1991 AA Aa2 15 15
1992 AA Aa2 15 15
1993 AA Aa2 15 15
1994 AA AA Aa2 15 15 15 AA
1995 AA AA Aa2 15 15 15 AA
1996 AA AA Aa2 15 15 15 15.0 15 15 15 15.0 16 15 15 15.3 15 15 16 15.3 AA
1997 AA AA Aa2 15 15 15 15.0 15 15 14 14.7 15 15 15 15.0 16 15 16 15.7 AA
1998 AA AA Aa2 15 15 15 15.0 16 16 15 15.7 16 16 15 15.7 16 15 16 15.7 AA
1999 AA+ AA+ Aa2 16 16 15 15.7 16 16 15 15.7 16 16 15 15.7 16 16 16 16.0 AA+
2000 AA+ AA+ Aa2 16 16 15 15.7 16 16 15 15.7 16 16 15 15.7 16 16 16 16.0 AA+
2001 AA+ AA+ Aaa 16 16 17 16.3 16 16 15 15.7 16 16 15 15.7 16 16 16 16.0 AA+
2002 AA+ AA+ Aaa 16 16 17 16.3 16 17 15 16.0 16 16 15 15.7 16 17 17 16.7 AA+
2003 AAA AA+ Aaa 17 16 17 16.7 16 17 16 16.3 16 17 16 16.3 16 17 17 16.7 AAA
2004 AAA AAA Aaa 17 17 17 17.0 16 17 16 16.3 16 17 16 16.3 17 17 17 17.0 AAA
2005 AAA AAA Aaa 17 17 17 17.0 17 17 16 16.7 17 17 16 16.7 17 17 17 17.0 AAA
2006 AAA AAA Aaa 17 17 17 17.0 17 17 16 16.7 17 17 16 16.7 17 17 17 17.0 AAA
2007 AAA AAA Aaa 17 17 17 17.0 17 17 17 17.0 17 17 17 17.0 17 17 17 17.0 AAA
2008 AAA AAA Aaa 17 17 17 17.0 17 17 17 17.0 17 17 17 17.0 17 17 17 17.0 AAA
2009 AAA AA+ Aaa 17 16 17 16.7 17 17 16 16.7 16 17 16 16.3 16 17 17 16.7 AAA
2010 AA+ AA Aaa 16 15 17 16.0 16 17 15 16.0 15 16 15 15.3 15 17 16 16.0 AA+
2011 16 17 15 16 15 16 15 15 15 16 16 16
Table A10 – U.K. Rating Rating Code Fitch S&P Moody's Year Fitch SP M FC17 SPC17 MC17 Avg RE OP REOP Avg RE OP REOP Avg RE OP REOP Avg Avg
1989 AAA Aaa 17 17
1990 AAA Aaa 17 17
1991 AAA Aaa 17 17
1992 AAA Aaa 17 17
1993 AAA Aaa 17 17
1994 AAA AAA Aaa 17 17 17
1995 AAA AAA Aaa 17 17 17
1996 AAA AAA Aaa 17 17 17 17.0 16 16 16 16.0 16 17 16 16.3 16 17 17 16.7 16.3
1997 AAA AAA Aaa 17 17 17 17.0 17 17 16 16.7 17 17 16 16.7 16 17 17 16.7 16.7
1998 AAA AAA Aaa 17 17 17 17.0 17 17 16 16.7 17 17 16 16.7 17 17 17 17.0 16.8
1999 AAA AAA Aaa 17 17 17 17.0 17 17 17 17.0 17 17 17 17.0 17 17 17 17.0 17.0
2000 AAA AAA Aaa 17 17 17 17.0 17 17 16 16.7 17 17 16 16.7 17 17 17 17.0 16.8
2001 AAA AAA Aaa 17 17 17 17.0 17 17 16 16.7 17 17 17 17.0 17 17 17 17.0 16.9
2002 AAA AAA Aaa 17 17 17 17.0 17 17 17 17.0 17 17 17 17.0 17 17 17 17.0 17.0
2003 AAA AAA Aaa 17 17 17 17.0 17 17 17 17.0 17 17 17 17.0 17 17 17 17.0 17.0
2004 AAA AAA Aaa 17 17 17 17.0 17 17 17 17.0 17 17 17 17.0 17 17 17 17.0 17.0
2005 AAA AAA Aaa 17 17 17 17.0 17 17 17 17.0 17 17 17 17.0 17 17 17 17.0 17.0
2006 AAA AAA Aaa 17 17 17 17.0 17 17 17 17.0 17 17 17 17.0 17 17 17 17.0 17.0
2007 AAA AAA Aaa 17 17 17 17.0 17 17 17 17.0 17 17 17 17.0 17 17 17 17.0 17.0
2008 AAA AAA Aaa 17 17 17 17.0 17 17 17 17.0 17 17 17 17.0 17 17 17 17.0 17.0
2009 AAA AAA Aaa 17 17 17 17.0 16 17 16 16.3 16 17 16 16.3 16 17 17 16.7 16.4
2010 AAA AAA Aaa 17 17 17 17.0 16 16 16 16.0 16 16 15 15.7 16 17 17 16.7 16.1
2011 16 16 15 16 15 16 14 15 16 17 17 17 15.8

30
Table A11 – U.S. Rating Rating Code Fitch S&P Moody's Year Fitch SP M FC17 SPC17 MC17 Avg RE OP REOP Avg RE OP REOP Avg RE OP REOP Avg Avg
1989 AAA Aaa 17 17
1990 AAA Aaa 17 17
1991 AAA Aaa 17 17
1992 AAA Aaa 17 17
1993 AAA Aaa 17 17
1994 AAA AAA Aaa 17 17 17
1995 AAA AAA Aaa 17 17 17
1996 AAA AAA Aaa 17 17 17 17.0 17 15 16 16.0 16 15 15 15.3 16 16 16 16.0 15.8
1997 AAA AAA Aaa 17 17 17 17.0 17 15 16 16.0 17 16 16 16.3 16 16 16 16.0 16.1
1998 AAA AAA Aaa 17 17 17 17.0 17 15 16 16.0 17 16 16 16.3 17 16 16 16.3 16.2
1999 AAA AAA Aaa 17 17 17 17.0 17 15 16 16.0 17 16 16 16.3 17 17 17 17.0 16.4
2000 AAA AAA Aaa 17 17 17 17.0 17 15 16 16.0 17 16 16 16.3 17 17 17 17.0 16.4
2001 AAA AAA Aaa 17 17 17 17.0 17 15 16 16.0 17 16 16 16.3 17 17 17 17.0 16.4
2002 AAA AAA Aaa 17 17 17 17.0 17 15 16 16.0 17 16 16 16.3 17 17 17 17.0 16.4
2003 AAA AAA Aaa 17 17 17 17.0 17 15 16 16.0 17 16 16 16.3 17 17 17 17.0 16.4
2004 AAA AAA Aaa 17 17 17 17.0 17 16 16 16.3 17 16 16 16.3 17 17 17 17.0 16.6 2005 AAA AAA Aaa 17 17 17 17.0 17 16 16 16.3 17 16 16 16.3 17 17 17 17.0 16.6 2006 AAA AAA Aaa 17 17 17 17.0 17 16 16 16.3 17 16 16 16.3 17 17 17 17.0 16.6
2007 AAA AAA Aaa 17 17 17 17.0 17 16 16 16.3 17 17 16 16.7 17 17 17 17.0 16.7 2008 AAA AAA Aaa 17 17 17 17.0 17 16 16 16.3 17 16 16 16.3 17 17 17 17.0 16.6 2009 AAA AAA Aaa 17 17 17 17.0 17 15 16 16.0 16 16 15 15.7 16 16 16 16.0 15.9 2010 AAA AAA Aaa 17 17 17 17.0 17 15 15 15.7 16 15 15 15.3 16 16 15 15.7 15.6 2011 16 15 15 15 16 15 14 15 16 16 15 16 15.3
Top Related
Copyright © 2022 FDOKUMEN

