


Bahasa
Halaman
Hukum

QUARTERLY JOURNAL OF THE ROYAL METEOROLOGICAL SOCIETYQ. J. R. Meteorol. Soc. 136(s1): 92–106 (2010)Published online 25 June 2009 in Wiley InterScience(www.interscience.wiley.com) DOI: 10.1002/qj.435
Diurnal cycle of the intertropical discontinuity over WestAfrica analysed by remote sensing and mesoscale modelling
Bernhard Pospichal,a*Diana Bou Karam,b Susanne Crewell,a Cyrille Flamantb Anja Hunerbeinc
Olivier Bockd and Frederique Saıde
a Universitat zu Koln, Institut fur Geophysik und Meteorologie, Cologne, Germanyb Universite Pierre et Marie Curie, LATMOS/IPSL/CNRS, Paris, France
c Freie Universitat Berlin, Institut fur Weltraumwissenschaften, Berlin, Germanyd IGN/LAREG, Paris, France
e Observatoire Midi-Pyrenees, Laboratoire d’Aerologie, Toulouse, France
ABSTRACT: The diurnal cycle of the Intertropical discontinuity (ITD), i.e. the interface at the ground between moistmonsoon air and dry Harmattan air, is an important factor in the West African monsoon system. During the whole of 2006,high-resolution ground-based remote-sensing measurements were performed in the area of Djougou, Benin, which madeit possible to observe the ITD and the associated sharp gradient of temperature and humidity in detail. In order to extendthe point measurements to a three-dimensional view of the ITD and to enhance the knowledge of the related processes,the mesoscale atmospheric model Meso-NH was run for a case study (84 h period) in April 2006. In addition Meteosatinfrared observations were used to determine the ITD position and its movement. From these observations a northwardpropagation of the moist air front (ITD) of 8–12 m s−1 was calculated. The propagation speed of the front evaluated fromthe satellite observations was replicated by the model and the time of the front arrival over Djougou was simulated with amaximum error of 1 hour. With respect to the ground-based observations, the model was able to reproduce the dynamicsand thermodynamics of the front as well as the diurnal cycle of the planetary boundary layer over the study area. Thisagreement suggests the use of the model to further describe processes in the lower atmosphere at high resolution. Copyrightc© 2009 Royal Meteorological Society
KEY WORDS AMMA; West African Monsoon; low level jet; Meso-NH
Received 12 November 2008; Revised 9 April 2009; Accepted 20 April 2009
1. Introduction
One of the main goals of the African Monsoon Mul-tidisciplinary Analyses (AMMA) project (Redelspergeret al., 2006) is to better understand and quantify meso-scale processes in the lower troposphere with respectto the West African monsoon system. A lack of under-standing of atmospheric processes over this region is stillprevalent, and many questions on the West African Mon-soon (WAM) such as the northward propagation of theIntertropical discontinuity (ITD) and the meridional trans-port of moisture at the beginning of the monsoon seasonremain open. Until recently, there were only a few atmos-pheric observations in this region; with, in particular, pooravailability of reliable upper-air data. Therefore, a sub-stantial part of the AMMA project that was launched in2001 was devoted to the increase of observations (Lebelet al., 2010), both intensifying existing observing systemssuch as conventional weather stations or radiosondes andthe application of new methods (such as radar, lidar andother remote sensing instruments).
∗Correspondence to: B. Pospichal, Universitat zu Koln, Institut furGeophysik und Meteorologie, Cologne, Germany.E-mail: [email protected]
The ITD marks the convergence zone at the groundbetween two flows: the moist and relatively cool south-westerly monsoon flow to the south and the dry and warmnortheasterly Harmattan flow to the north (Hastenrath,1985; Bou Karam et al., 2008; Flamant et al., 2009). Themonsoon season in West Africa starts with the propaga-tion of the ITD from the Gulf of Guinea coast towardsthe north during the months of March and April. Thisdefines the beginning of the first rainy season over theGuinean coast region south of 10◦N (Sultan and Janicot,2003). During the following months, the ITD continuesto move inland (Lothon et al., 2008), reaching its north-ernmost climatological position at about 21◦N in Julyand August (Sultan et al., 2007). The ITD position doesnot move gradually over several months, but there aremany processes that impact the ITD at various time-scales, from daily low-level jets (Flamant et al., 2009) tomulti-day pulsations with cycles of about 5 days (Cou-vreux et al., 2010). These pulsations are associated withincreased meridional low-level winds and bring additionalmoisture to the north. The diurnal cycle of the ITD is oneof the atmospheric processes that play a crucial role inthe WAM system. With the associated (mainly nocturnal)
Copyright c© 2009 Royal Meteorological Society
DIURNAL CYCLE OF THE ITD 93
low-level winds, the diurnal variation of the ITD posi-tion has been recognized in several previous studies as akey factor in the northward transport of moisture (Parkeret al. 2005; Sultan et al., 2007; Lothon et al., 2008). Bocket al. (2008) describe the seasonal evolution of the diurnalwater vapour cycle for several locations in West Africausing GPS observations. They show that, for each of thesestations, strong diurnal cycles occur only during one ortwo distinct months in connection with the ITD. Nearlyall year round, nocturnal low-level jets occur with moreor less intensity over the region, which can peak up to15–20 m s−1 below 500 m above ground level (AGL)(Lothon et al., 2008). The origin of these low-level jets isalready widely known. During daytime, convective tur-bulent mixing is large and limits horizontal transport ofair masses. In the late afternoon, the heat flux decreases,and the circulation responds to the surface pressure gradi-ent force imposed by the heat low without being sloweddown by friction. The winds are accelerated towards thelow pressure during the night, reaching their maximumspeed in the morning hours. Due to the proximity tothe equator, the influence of the Coriolis force is rathersmall. The speed and depth of the low-level jet dependon a range of factors, including baroclinity, terrain slope,surface cooling rates and many more (Blackadar, 1957;Garratt, 1994). However, over West Africa the strengthof the nocturnal jet as well as the sharpness of watervapour and temperature gradients across the ITD dur-ing its northward displacement have been little observeduntil now. An exception is several days of observationsin Mali/Niger during the early monsoon season, whenthe ITD almost reached its northernmost position (BouKaram et al., 2008; Flamant et al., 2009).
Complementary to the above mentioned work, wepresent here the continuous monitoring of the ITD overseveral days using a variety of ground-based and satelliteremote sensing methods. The ground-based measure-ments have been taken at the AMMA supersite in Nan-gatchori, close to Djougou (Central Benin), representinga unique dataset of observations in this area (Pospichaland Crewell, 2007). The extension from a point view(ground-based observations) to a spatial view (satellite,model) allows the broadening of our knowledge of theatmospheric state on small temporal and spatial scales.
The diurnal variation of the latitudinal ITD positionwhile over Central Benin is about 100–200 km. Thisis relatively small to be represented in global numericalweather prediction (NWP) models with a typical grid boxsize of 25–50 km. These models usually provide outputsonly every three to six hours, which is not adequatefor monitoring this phenomenon properly. Moreover, thesparse network of routine ground-based and upper-airobservations already makes it difficult to capture thesephenomena in model analyses properly. Therefore, it isessential to use mesoscale atmospheric models to describesub-synoptic-scale features in the lower atmosphere. Inthis study, the use of the Meso-NH model with aresolution of 10 km × 10 km will demonstrate to whatextent it is able to reproduce the atmospheric stateand sharp gradients along the ITD. In addition, we
will validate the mesoscale model Meso-NH with theobservations and use the model as a tool to investigatefurther the processes around the ITD.
The choice of a suitable period for this case studywas made after considering two main prerequisites: thenumber of available observations should be as highas possible and the strongest temperature and humiditygradients between the moist and dry air masses should besituated over Nangatchori. For these reasons the periodbetween 9 April, 1200 UTC and 13 April, 0000 UTC,when the ITD remained close to Nangatchori, was chosenfor the model comparison.
This paper is structured as follows: First of all, detailson the measurements are given in section 2. A modeldescription can be found in section 3 and the synopticsituation is presented briefly in section 4. Once the sim-ulations have been validated, the full three-dimensionalinformation for the model is used to investigate the ITDdevelopment in section 5.
2. Observations
In the framework of the AMMA campaign, three so-called supersites have been set up with a variety ofground-based instruments in order to study the atmos-pheric processes over West Africa as completely as pos-sible. These supersites were situated around the 0◦Emeridian and covered different climate zones, fromDjougou/Nangatchori, Benin (9.6◦N, 1.8◦E) to Niamey,Niger (13.5◦N, 2.1◦E) and to Gourma, Mali (16◦N,1.5◦W). The monsoon flow usually arrives in Djougou inApril, whereas Gourma does not become fully influencedby the moist air masses before June (Bock et al., 2008).
The observations used for this study have been takenat the Benin supersite, about 350 km north of the Gulf ofGuinea. In 2006, a variety of meteorological instrumentswere operated at two locations: the city of Djougou andNangatchori (10 km east of Djougou in a more ruralenvironment). The main ground-based instruments usedin this paper are a microwave profiler and an ultra-high-frequency (UHF) wind profiler. Both of them weredeployed in Nangatchori (Pospichal and Crewell, 2007).
The microwave profiler HATPRO measures atmos-pheric emission by gaseous and liquid compounds of theatmosphere at 14 frequencies, seven on the upper wingof the water-vapour line of 22.235 GHz and seven onthe lower wing of the oxygen absorption complex around60 GHz (Rose et al., 2005). From this frequency com-bination, it is possible to derive integrated water vapour(IWV) and cloud liquid-water path (LWP) as well as tem-perature and humidity profiles using statistical retrievalalgorithms. The measurements have been taken at an ele-vation angle of 70◦ over the full year. The antenna wastilted to the north in order to avoid looking directly intothe sun. Additional measurements under six lower eleva-tion angles were performed in order to enhance – assum-ing horizontal homogeneity – the accuracy of temperatureprofiles in the lowest 1500 m; with a bias and root-meansquare (RMS) both less than 0.5 K, the error gradually
Copyright c© 2009 Royal Meteorological Society Q. J. R. Meteorol. Soc. 136(s1): 92–106 (2010)
94 B. POSPICHAL ET AL.
increases with height. (Crewell and Lohnert, 2007). Theseelevation scans were carried out every 15 minutes andall data used here are with this temporal resolution. Theaccuracy of these measurements is better than 1 kg m−2
for IWV and 25 g m−2 for LWP. When compared withGPS observations at Djougou, the HATPRO-derived IWVexhibits a bias of 0.3 kg m−2 and a RMS difference of1.1 kg m−2 for the year 2006 (not shown). For humidityprofiles only between two and four independent pieces ofinformation can be detected (Lohnert et al., 2008) becausethe microwave frequencies along the 22.235 GHz water-vapour absorption line are strongly correlated and do notprovide more information on the vertical distribution ofwater vapour. Therefore strong vertical water-vapour gra-dients cannot be reproduced properly with the microwaveradiometer.
The UHF (1.24 GHz) wind profiler Doppler radar,operated by the Centre National de RecherchesMeteorologiques, provides vertical profiles of the threewind components, reflectivity and spectral width underclear air or precipitation, in the first 3–5 km of the atmos-phere. It is a five-static-antenna profiler working in acontinuous operating mode with a maximum peak powerof 4 kW. The typical vertical and temporal resolutions are100 m and 5 minutes, respectively. For more details onthe instrument and data processing refer to Jacoby-Coalyet al. (2002) or Heo et al. (2003).
In addition, a variety of meteorological instrumentswere operated in the Djougou area, such as a lidarceilometer and several radars (C-Band, X-Port and the24.1 GHz micro rain radar). Surface standard weatherobservations in Djougou and Nangatchori as well as fluxmeasurements in Nangatchori were also performed there.
Furthermore, Meteosat Second Generation (MSG)Spinning Enhanced Visible and Infrared Imager (SEVIRI)observations are used as a proxy for surface temperature.As the continuum absorption of water vapour is relativelyweak at the wavelength of 10.8 µm and the surface/cloudemissivity is close to the emissivity of a black body, thebrightness temperatures (BT) measured in this channelare highly correlated to the target temperatures. For thisreason this channel is suitable for the detection of clouds,due to their temperature which is generally lower thanthe temperature of the surface underneath. For the samereason clear-sky BTs can be used as a proxy for the sur-face skin temperature. In this region, the spatial resolutionof the observations is particularly high (3 km) due to theproximity to the satellite nadir at 0◦N, 0◦E.
3. Mesoscale simulation
3.1. Model description
We use the non-hydrostatic mesoscale model Meso-NH(Lafore et al., 1998), which has been developed jointlyby CNRM (Meteo France) and Laboratoire d’Aerologie(CNRS). Meso-NH contains different sets of parametriza-tions. For this study, the turbulence scheme (Bougeaultand Lacarrere, 1989), as well as the radiative scheme
of the European Centre for Medium-range Forecasts(ECMWF) which computes radiative fluxes of short-waveand long-wave radiation, are used. Meso-NH is coupledto an externalized surface model which handles heat andwater vapour fluxes between the low-level atmosphereand different surface types, as provided by the ECO-CLIMAP data base (Masson et al., 2003). Land surfaceprocesses are treated by the ISBA scheme (Noilhan andMahfouf, 1996).
3.2. Simulation description
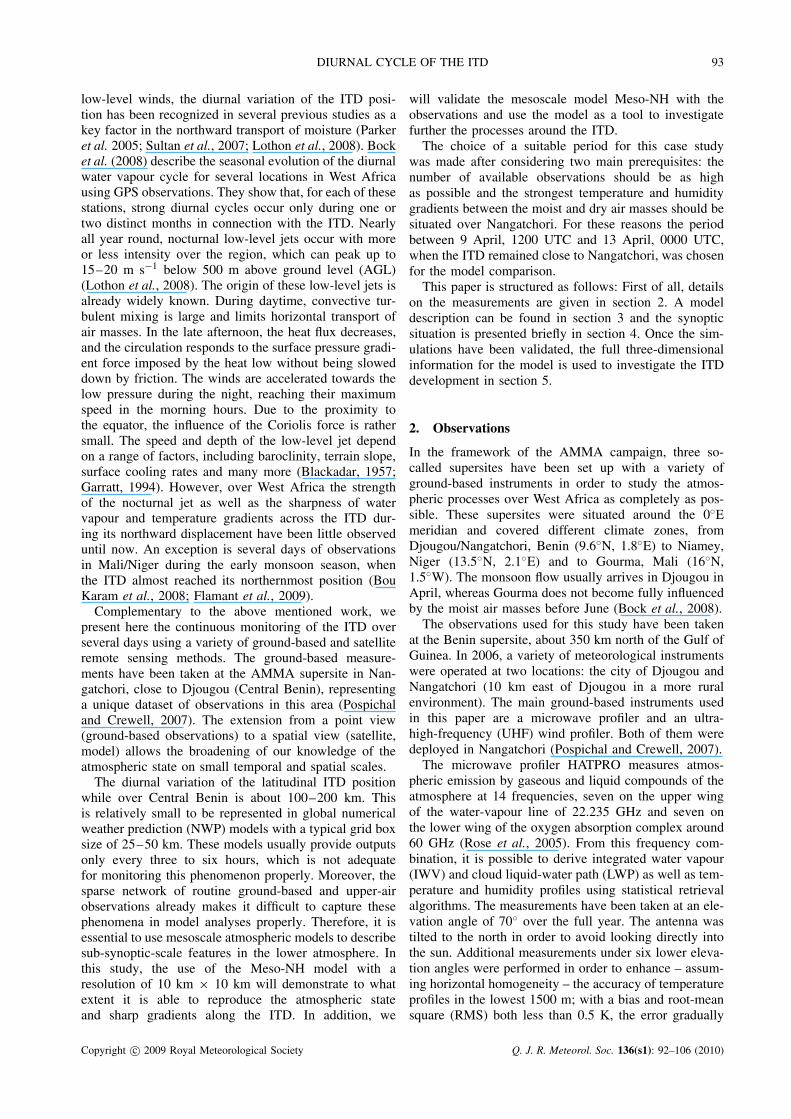
In this study, a simulation over 84 hours – between9 April 2006, 1200 UTC and 13 April 2006, 0000UTC – was carried out over a domain of 1000 km ×1000 km with a horizontal mesh size of 10 km, centredat 9◦N and 2◦E (Figure 1). In the vertical, 72 stretchedlevels were used. The lowermost level was set at 10 mabove the ground and 31 levels were located within thelowest 1000 m above ground, while the highest level wasset at 28 km AGL. The model outputs are available everyhour. The first six hours are discarded as spin-up time.
Initial and lateral boundary conditions were takenfrom the ECMWF analyses of 0.5◦ horizontal resolution.In order to keep the simulation close to the analyzedmeteorological conditions, nudging was activated. Everysix hours the model results were relaxed toward theECMWF analysis over the whole domain. However, theobservation data used in this study for the validation ofthe model were not assimilated into the ECMWF analyses(within the model domain only 83 sondes from Niameyand 23 sondes from Cotonou were assimilated into theECMWF analyses during the whole month of April. Asthe convection scheme is not activated in this Meso-NH run, possible changes induced by the presence ofclouds are taken into account indirectly by nudging withECMWF analyses. The validity of this assumption isconfirmed by remote-sensing observations, which showthat in the centre of the domain (over Nangatchori) cloudswere present during only three out of 84 hours of the
Figure 1. Meso-NH Model domain with orography. Djougou is situated10 km north-west of Nangatchori.
Copyright c© 2009 Royal Meteorological Society Q. J. R. Meteorol. Soc. 136(s1): 92–106 (2010)
DIURNAL CYCLE OF THE ITD 95
model run. These clouds were thin broken altocumulusclouds at about 4 km AGL. At the same time and height,the model simulated 100% relative humidity (see alsosection 5.2). The comparison of Meso-NH results withECMWF analyses confirms the benefits of a mesoscalemodel when simulating processes around the ITD. Wefound much more pronounced gradients of water vapourand temperature across the ITD. The nocturnal low-leveljet (925 hPa) south of the ITD is simulated as stronger inMeso-NH (by about 2 m s−1) and the pressure distributionshows a deeper heat low (Meso-NH: 1001 hPa; ECMWFanalysis: 1003 hPa) as well as a stronger gradient (by2 hPa) between the Guinean coast and Nangatchori.When averaging the Meso-NH results on to the 0.5◦ECMWF grid, these improvements persist (not shownhere).
4. Synoptic situation
The dry season in early 2006 in the Djougou area wascharacterized by several outbreaks of moist air from thesouth, resulting in moister than average conditions fromJanuary to March, and causing also a major rainfall event(> 50 mm) on 15 February 2006 over the region. For thatreason, it is not easy to define a clear beginning date ofthe transition towards the monsoon season. However, theregion was predominantly influenced by a northeasterlyflow until the end of March, when winds started to shiftevery night from north-east to south-west, evidencing thedaily northward pulse of the monsoon air. This night-timewind shift was observed during 16 nights between 1 and18 April 2006 (mean shift at 2319 UTC, see Pospichaland Crewell (2007)). After 20 April, the study arearemained all day in the south-westerly monsoon flow.Janicot et al. (2008) also stated that around 10 April dryair masses with very weak convective activity prevailedover West Africa, followed by an abrupt increase inmoisture towards the end of that month. As these diurnal
pulsations have not been observed at moisture outbreaksbefore the end of March, they turned out to be animportant precursor to the long-term establishment ofmoist air in the region.
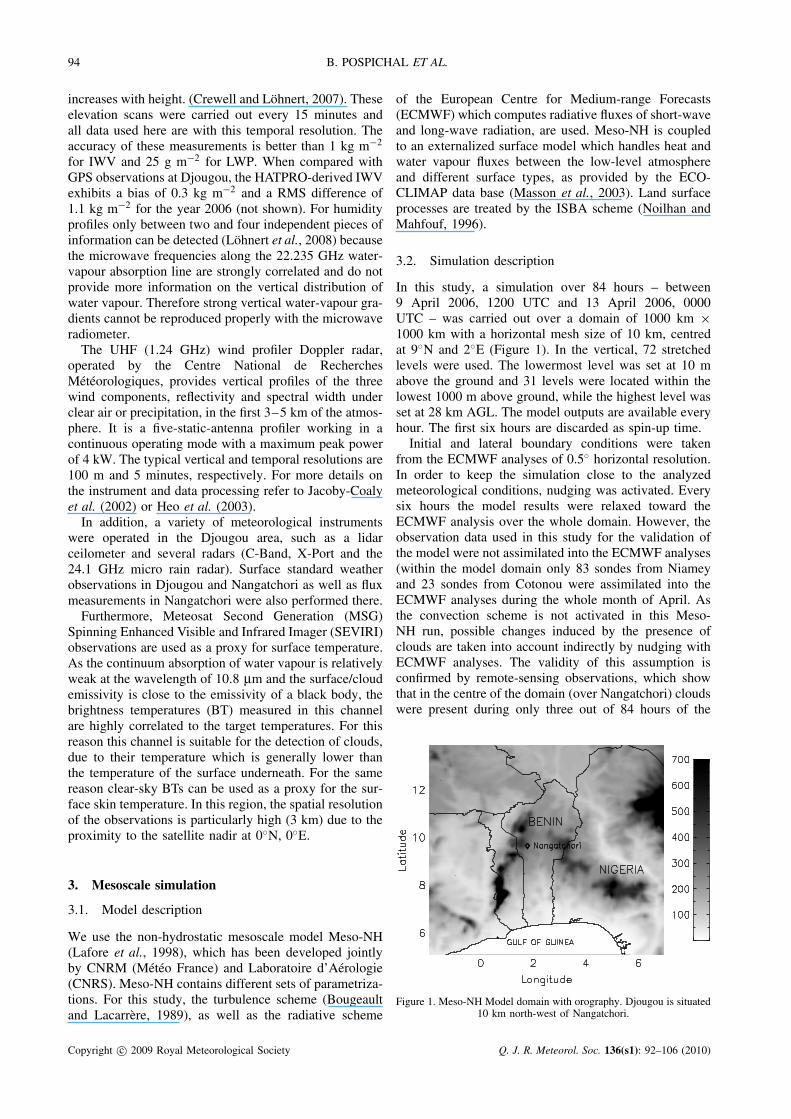
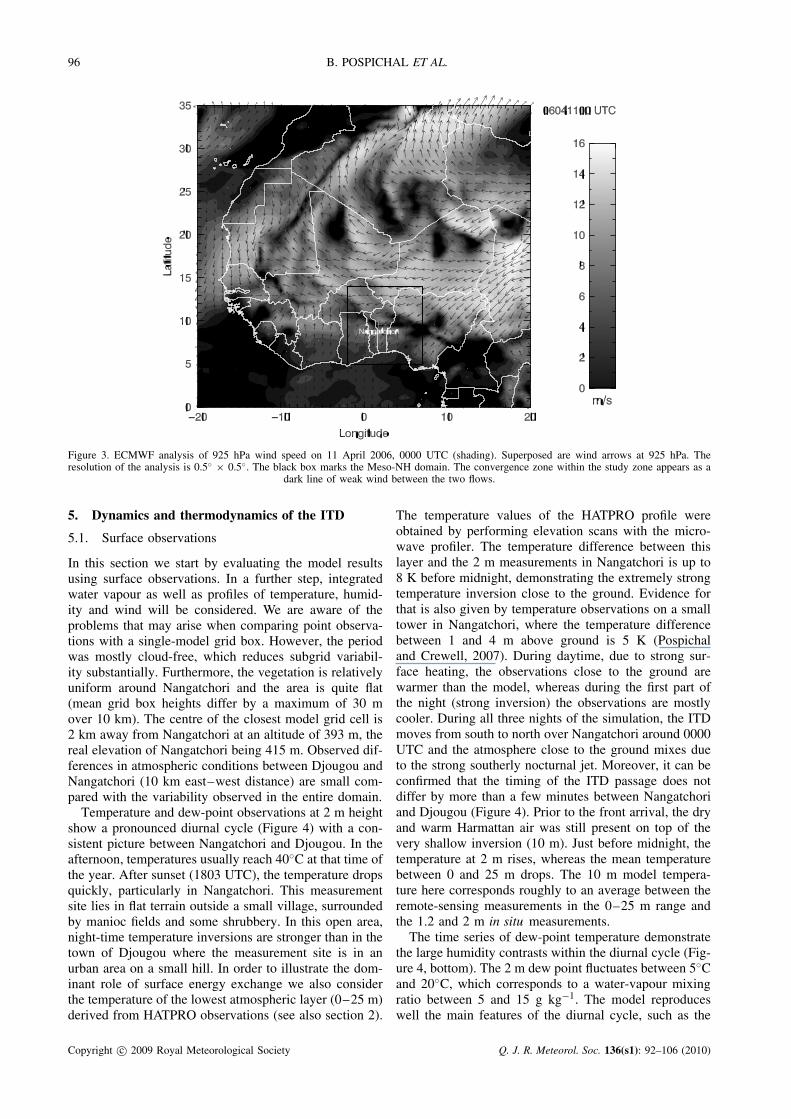
The development that led to the dry air outbreakarriving in the Djougou area on 10 April 2006 startedseveral days before. At the beginning of April, thesynoptic situation was characterized by a ridge overnorthwestern Africa and a very pronounced midlatitudetrough over Libya and Egypt into Sudan. Over thewestern parts of the Sahara, high pressure was present.From 4 April onward, the ridge was flattened and shiftedeastwards due to a rather strong westerly flow overAlgeria, causing a lower surface pressure over the Saharawhich induced a northward move of the ITD west of the5◦E meridian. At the rear edge of another trough overthe Red Sea, dry and relatively cool upper-troposphericair subsided on 7 April over Libya and Northern Chad.Following a re-strengthening of the ridge over Algeria,these very dry air masses moved southwestward at thesouthern edge of the high geopotential over the centralSahara. The driest air masses arrived over the study areaon 11 April with an IWV of less than 10 kg m−2. Theboundary between the moist and the dry air masses waslocated at the Djougou latitude at 0000 UTC (Figure 2).On 10 and 11 April, the synoptic situation is characterizedby a strong surface high-pressure area between Libya andEastern Niger, which causes a southward retreat of theITD east of 0◦E, whereas the heat low was placed overMauritania. The ECMWF analysis of the 925 hPa windfrom 11 April 0000 UTC (Figure 3) illustrates the quitestrong winds over southern Niger and northern Nigeriaand the convergence zone between the Harmattan andmonsoon flow over central Benin (around 9◦N) veryclearly. After 11 April, the northeasterly wind decreaseddue to the weakening of the high-pressure area overLibya. As a result, the diurnal mean ITD position slowlymoved back northward.
–40 –20 0 20 40
Longitude
–10
0
10
20
30
40
Latit
ude
5500 5600
5600
5700
570057005800
58005800
0
10
20
30
40
50
60
70
IWV[kgm–2]
Nangatchori
Figure 2. Synoptic situation on 11 April 2006, 0000 UTC from ECMWF analysis. Integrated water vapour (shading) and 500 hPa geopotentialheight (contour lines with 20 gpm distance) are shown. The white box shows the boundaries of the Meso-NH domain. Djougou is situated 10 km
north-west of Nangatchori.
Copyright c© 2009 Royal Meteorological Society Q. J. R. Meteorol. Soc. 136(s1): 92–106 (2010)
96 B. POSPICHAL ET AL.
Figure 3. ECMWF analysis of 925 hPa wind speed on 11 April 2006, 0000 UTC (shading). Superposed are wind arrows at 925 hPa. Theresolution of the analysis is 0.5◦ × 0.5◦. The black box marks the Meso-NH domain. The convergence zone within the study zone appears as a
dark line of weak wind between the two flows.
5. Dynamics and thermodynamics of the ITD
5.1. Surface observations
In this section we start by evaluating the model resultsusing surface observations. In a further step, integratedwater vapour as well as profiles of temperature, humid-ity and wind will be considered. We are aware of theproblems that may arise when comparing point observa-tions with a single-model grid box. However, the periodwas mostly cloud-free, which reduces subgrid variabil-ity substantially. Furthermore, the vegetation is relativelyuniform around Nangatchori and the area is quite flat(mean grid box heights differ by a maximum of 30 mover 10 km). The centre of the closest model grid cell is2 km away from Nangatchori at an altitude of 393 m, thereal elevation of Nangatchori being 415 m. Observed dif-ferences in atmospheric conditions between Djougou andNangatchori (10 km east–west distance) are small com-pared with the variability observed in the entire domain.
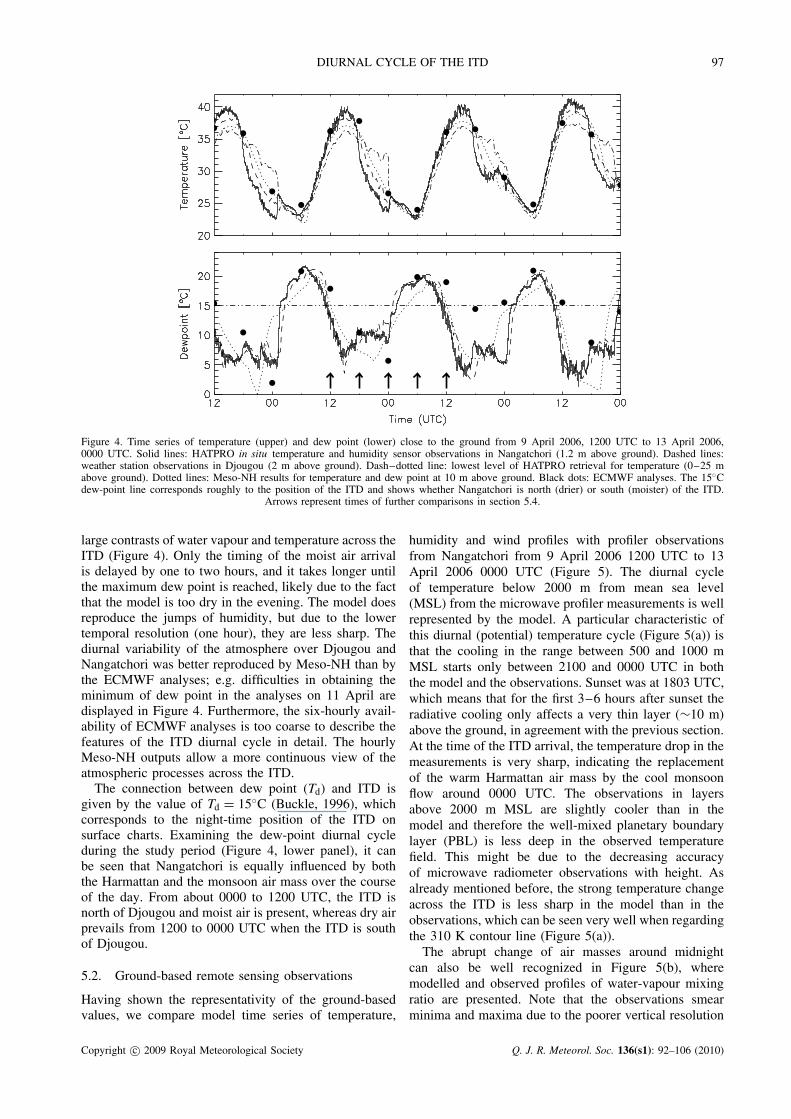
Temperature and dew-point observations at 2 m heightshow a pronounced diurnal cycle (Figure 4) with a con-sistent picture between Nangatchori and Djougou. In theafternoon, temperatures usually reach 40◦C at that time ofthe year. After sunset (1803 UTC), the temperature dropsquickly, particularly in Nangatchori. This measurementsite lies in flat terrain outside a small village, surroundedby manioc fields and some shrubbery. In this open area,night-time temperature inversions are stronger than in thetown of Djougou where the measurement site is in anurban area on a small hill. In order to illustrate the dom-inant role of surface energy exchange we also considerthe temperature of the lowest atmospheric layer (0–25 m)derived from HATPRO observations (see also section 2).
The temperature values of the HATPRO profile wereobtained by performing elevation scans with the micro-wave profiler. The temperature difference between thislayer and the 2 m measurements in Nangatchori is up to8 K before midnight, demonstrating the extremely strongtemperature inversion close to the ground. Evidence forthat is also given by temperature observations on a smalltower in Nangatchori, where the temperature differencebetween 1 and 4 m above ground is 5 K (Pospichaland Crewell, 2007). During daytime, due to strong sur-face heating, the observations close to the ground arewarmer than the model, whereas during the first part ofthe night (strong inversion) the observations are mostlycooler. During all three nights of the simulation, the ITDmoves from south to north over Nangatchori around 0000UTC and the atmosphere close to the ground mixes dueto the strong southerly nocturnal jet. Moreover, it can beconfirmed that the timing of the ITD passage does notdiffer by more than a few minutes between Nangatchoriand Djougou (Figure 4). Prior to the front arrival, the dryand warm Harmattan air was still present on top of thevery shallow inversion (10 m). Just before midnight, thetemperature at 2 m rises, whereas the mean temperaturebetween 0 and 25 m drops. The 10 m model tempera-ture here corresponds roughly to an average between theremote-sensing measurements in the 0–25 m range andthe 1.2 and 2 m in situ measurements.
The time series of dew-point temperature demonstratethe large humidity contrasts within the diurnal cycle (Fig-ure 4, bottom). The 2 m dew point fluctuates between 5◦Cand 20◦C, which corresponds to a water-vapour mixingratio between 5 and 15 g kg−1. The model reproduceswell the main features of the diurnal cycle, such as the
Copyright c© 2009 Royal Meteorological Society Q. J. R. Meteorol. Soc. 136(s1): 92–106 (2010)
DIURNAL CYCLE OF THE ITD 97
Figure 4. Time series of temperature (upper) and dew point (lower) close to the ground from 9 April 2006, 1200 UTC to 13 April 2006,0000 UTC. Solid lines: HATPRO in situ temperature and humidity sensor observations in Nangatchori (1.2 m above ground). Dashed lines:weather station observations in Djougou (2 m above ground). Dash–dotted line: lowest level of HATPRO retrieval for temperature (0–25 mabove ground). Dotted lines: Meso-NH results for temperature and dew point at 10 m above ground. Black dots: ECMWF analyses. The 15◦Cdew-point line corresponds roughly to the position of the ITD and shows whether Nangatchori is north (drier) or south (moister) of the ITD.
Arrows represent times of further comparisons in section 5.4.
large contrasts of water vapour and temperature across theITD (Figure 4). Only the timing of the moist air arrivalis delayed by one to two hours, and it takes longer untilthe maximum dew point is reached, likely due to the factthat the model is too dry in the evening. The model doesreproduce the jumps of humidity, but due to the lowertemporal resolution (one hour), they are less sharp. Thediurnal variability of the atmosphere over Djougou andNangatchori was better reproduced by Meso-NH than bythe ECMWF analyses; e.g. difficulties in obtaining theminimum of dew point in the analyses on 11 April aredisplayed in Figure 4. Furthermore, the six-hourly avail-ability of ECMWF analyses is too coarse to describe thefeatures of the ITD diurnal cycle in detail. The hourlyMeso-NH outputs allow a more continuous view of theatmospheric processes across the ITD.
The connection between dew point (Td) and ITD isgiven by the value of Td = 15◦C (Buckle, 1996), whichcorresponds to the night-time position of the ITD onsurface charts. Examining the dew-point diurnal cycleduring the study period (Figure 4, lower panel), it canbe seen that Nangatchori is equally influenced by boththe Harmattan and the monsoon air mass over the courseof the day. From about 0000 to 1200 UTC, the ITD isnorth of Djougou and moist air is present, whereas dry airprevails from 1200 to 0000 UTC when the ITD is southof Djougou.
5.2. Ground-based remote sensing observations
Having shown the representativity of the ground-basedvalues, we compare model time series of temperature,
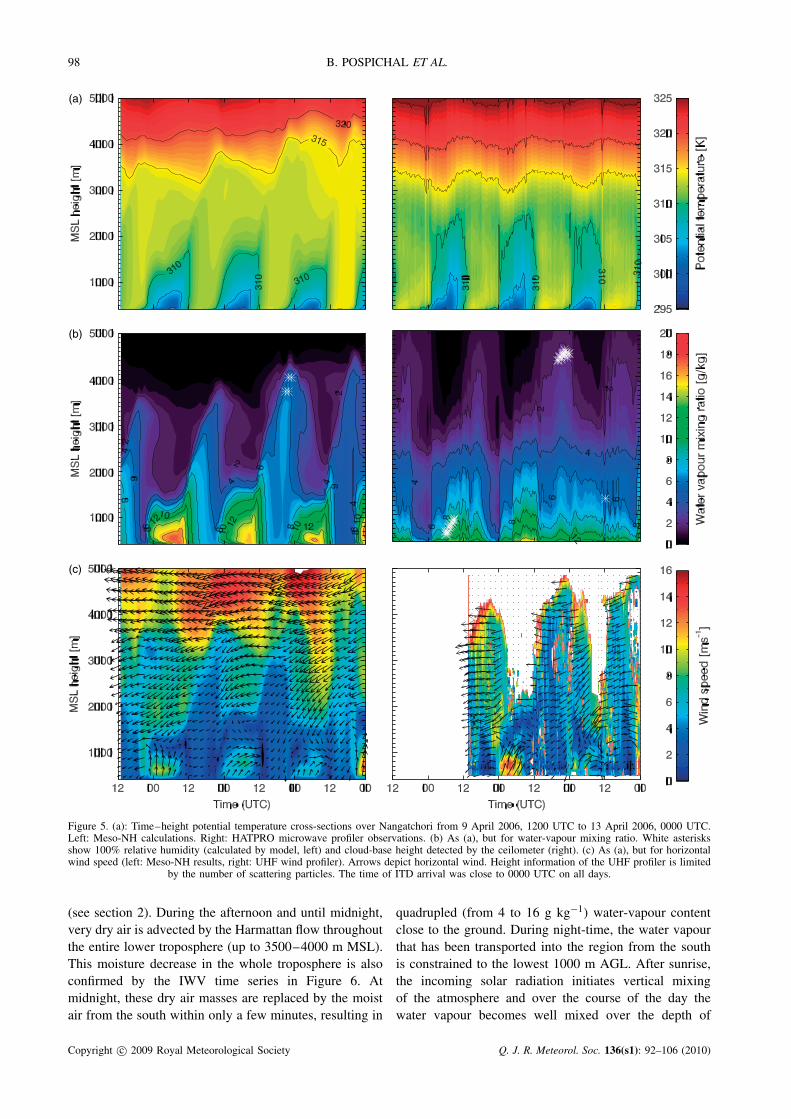
humidity and wind profiles with profiler observationsfrom Nangatchori from 9 April 2006 1200 UTC to 13April 2006 0000 UTC (Figure 5). The diurnal cycleof temperature below 2000 m from mean sea level(MSL) from the microwave profiler measurements is wellrepresented by the model. A particular characteristic ofthis diurnal (potential) temperature cycle (Figure 5(a)) isthat the cooling in the range between 500 and 1000 mMSL starts only between 2100 and 0000 UTC in boththe model and the observations. Sunset was at 1803 UTC,which means that for the first 3–6 hours after sunset theradiative cooling only affects a very thin layer (∼10 m)above the ground, in agreement with the previous section.At the time of the ITD arrival, the temperature drop in themeasurements is very sharp, indicating the replacementof the warm Harmattan air mass by the cool monsoonflow around 0000 UTC. The observations in layersabove 2000 m MSL are slightly cooler than in themodel and therefore the well-mixed planetary boundarylayer (PBL) is less deep in the observed temperaturefield. This might be due to the decreasing accuracyof microwave radiometer observations with height. Asalready mentioned before, the strong temperature changeacross the ITD is less sharp in the model than in theobservations, which can be seen very well when regardingthe 310 K contour line (Figure 5(a)).
The abrupt change of air masses around midnightcan also be well recognized in Figure 5(b), wheremodelled and observed profiles of water-vapour mixingratio are presented. Note that the observations smearminima and maxima due to the poorer vertical resolution
Copyright c© 2009 Royal Meteorological Society Q. J. R. Meteorol. Soc. 136(s1): 92–106 (2010)
98 B. POSPICHAL ET AL.
Figure 5. (a): Time–height potential temperature cross-sections over Nangatchori from 9 April 2006, 1200 UTC to 13 April 2006, 0000 UTC.Left: Meso-NH calculations. Right: HATPRO microwave profiler observations. (b) As (a), but for water-vapour mixing ratio. White asterisksshow 100% relative humidity (calculated by model, left) and cloud-base height detected by the ceilometer (right). (c) As (a), but for horizontalwind speed (left: Meso-NH results, right: UHF wind profiler). Arrows depict horizontal wind. Height information of the UHF profiler is limited
by the number of scattering particles. The time of ITD arrival was close to 0000 UTC on all days.
(see section 2). During the afternoon and until midnight,very dry air is advected by the Harmattan flow throughoutthe entire lower troposphere (up to 3500–4000 m MSL).This moisture decrease in the whole troposphere is alsoconfirmed by the IWV time series in Figure 6. Atmidnight, these dry air masses are replaced by the moistair from the south within only a few minutes, resulting in
quadrupled (from 4 to 16 g kg−1) water-vapour contentclose to the ground. During night-time, the water vapourthat has been transported into the region from the southis constrained to the lowest 1000 m AGL. After sunrise,the incoming solar radiation initiates vertical mixingof the atmosphere and over the course of the day thewater vapour becomes well mixed over the depth of
Copyright c© 2009 Royal Meteorological Society Q. J. R. Meteorol. Soc. 136(s1): 92–106 (2010)
DIURNAL CYCLE OF THE ITD 99
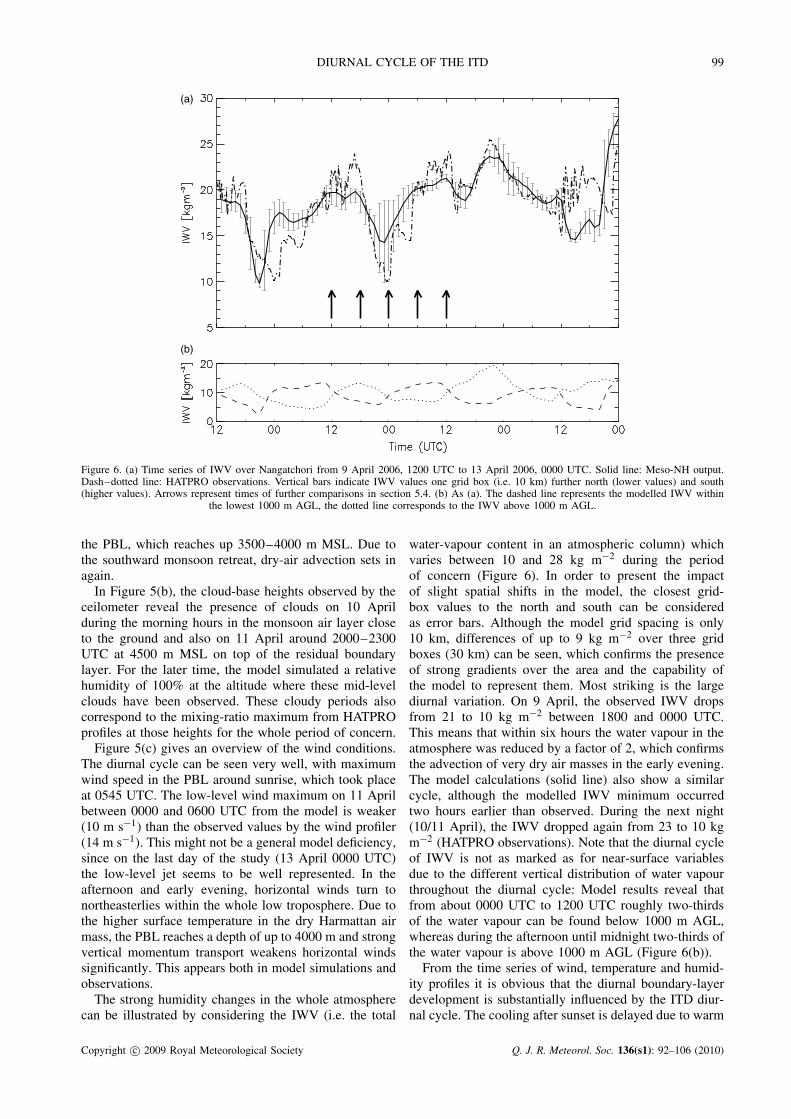
Figure 6. (a) Time series of IWV over Nangatchori from 9 April 2006, 1200 UTC to 13 April 2006, 0000 UTC. Solid line: Meso-NH output.Dash–dotted line: HATPRO observations. Vertical bars indicate IWV values one grid box (i.e. 10 km) further north (lower values) and south(higher values). Arrows represent times of further comparisons in section 5.4. (b) As (a). The dashed line represents the modelled IWV within
the lowest 1000 m AGL, the dotted line corresponds to the IWV above 1000 m AGL.
the PBL, which reaches up 3500–4000 m MSL. Due tothe southward monsoon retreat, dry-air advection sets inagain.
In Figure 5(b), the cloud-base heights observed by theceilometer reveal the presence of clouds on 10 Aprilduring the morning hours in the monsoon air layer closeto the ground and also on 11 April around 2000–2300UTC at 4500 m MSL on top of the residual boundarylayer. For the later time, the model simulated a relativehumidity of 100% at the altitude where these mid-levelclouds have been observed. These cloudy periods alsocorrespond to the mixing-ratio maximum from HATPROprofiles at those heights for the whole period of concern.
Figure 5(c) gives an overview of the wind conditions.The diurnal cycle can be seen very well, with maximumwind speed in the PBL around sunrise, which took placeat 0545 UTC. The low-level wind maximum on 11 Aprilbetween 0000 and 0600 UTC from the model is weaker(10 m s−1) than the observed values by the wind profiler(14 m s−1). This might not be a general model deficiency,since on the last day of the study (13 April 0000 UTC)the low-level jet seems to be well represented. In theafternoon and early evening, horizontal winds turn tonortheasterlies within the whole low troposphere. Due tothe higher surface temperature in the dry Harmattan airmass, the PBL reaches a depth of up to 4000 m and strongvertical momentum transport weakens horizontal windssignificantly. This appears both in model simulations andobservations.
The strong humidity changes in the whole atmospherecan be illustrated by considering the IWV (i.e. the total
water-vapour content in an atmospheric column) whichvaries between 10 and 28 kg m−2 during the periodof concern (Figure 6). In order to present the impactof slight spatial shifts in the model, the closest grid-box values to the north and south can be consideredas error bars. Although the model grid spacing is only10 km, differences of up to 9 kg m−2 over three gridboxes (30 km) can be seen, which confirms the presenceof strong gradients over the area and the capability ofthe model to represent them. Most striking is the largediurnal variation. On 9 April, the observed IWV dropsfrom 21 to 10 kg m−2 between 1800 and 0000 UTC.This means that within six hours the water vapour in theatmosphere was reduced by a factor of 2, which confirmsthe advection of very dry air masses in the early evening.The model calculations (solid line) also show a similarcycle, although the modelled IWV minimum occurredtwo hours earlier than observed. During the next night(10/11 April), the IWV dropped again from 23 to 10 kgm−2 (HATPRO observations). Note that the diurnal cycleof IWV is not as marked as for near-surface variablesdue to the different vertical distribution of water vapourthroughout the diurnal cycle: Model results reveal thatfrom about 0000 UTC to 1200 UTC roughly two-thirdsof the water vapour can be found below 1000 m AGL,whereas during the afternoon until midnight two-thirds ofthe water vapour is above 1000 m AGL (Figure 6(b)).
From the time series of wind, temperature and humid-ity profiles it is obvious that the diurnal boundary-layerdevelopment is substantially influenced by the ITD diur-nal cycle. The cooling after sunset is delayed due to warm
Copyright c© 2009 Royal Meteorological Society Q. J. R. Meteorol. Soc. 136(s1): 92–106 (2010)
100 B. POSPICHAL ET AL.
and dry northeasterly winds, whereas after the ITD arrivalthe lowest 1000 m AGL are dominated by the moist andcooler monsoon air (Bou Karam et al., 2008). After sun-rise, the convective boundary layer grows rapidly andthe moisture is mixed into the whole PBL up to 4000 mAGL. In the afternoon northeasterly winds again bringalong very dry air masses; the moist air is both mixed upinto higher levels and transported back southwards.
5.3. Satellite observations
A common way to evaluate atmospheric models is byusing satellite observations. These data have the greatadvantage of covering a more or less large area of theEarth at a glance. For example, Sohne et al. (2008)present a verification of Meso-NH cloud cover forecastsover West Africa during peak monsoon season. However,for boundary-layer studies of temperature or humidity, theuse of satellite data is usually very limited because theshape of the weighting function does not provide detailedprofile information of the lower atmosphere. Furthermore,clouds in the thermal infrared and visible or water vapourat higher microwave channels obscure the view to thesurface.
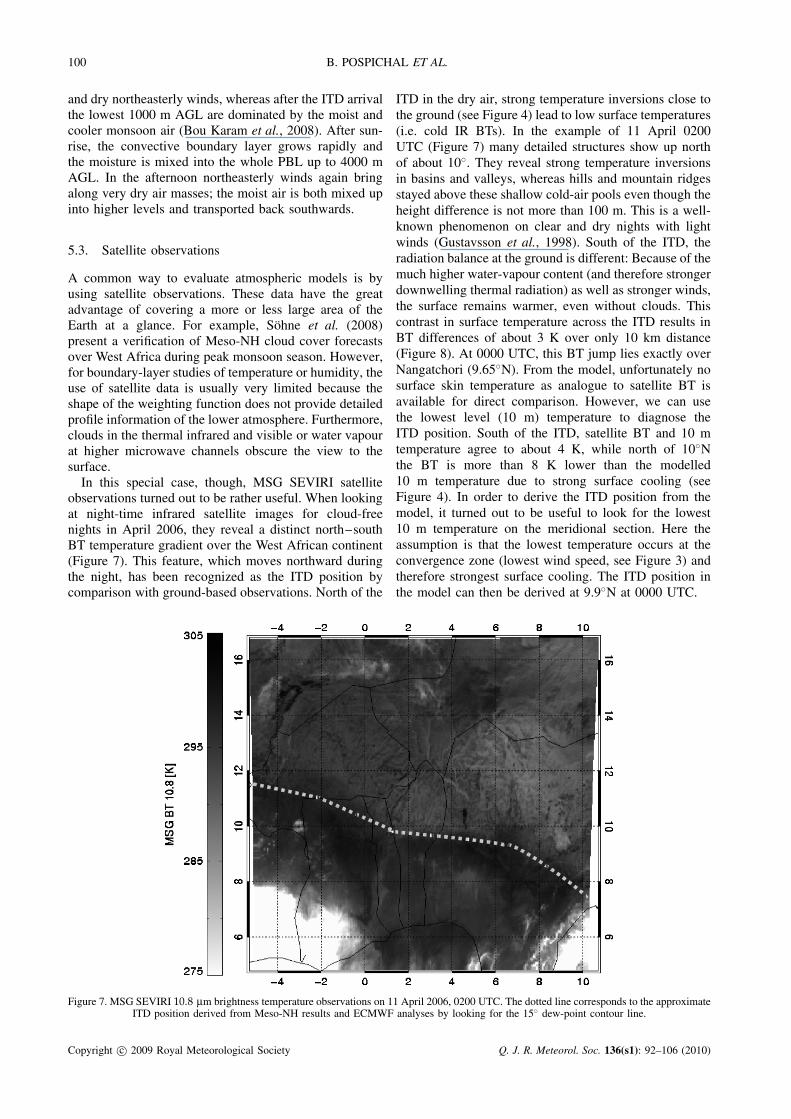
In this special case, though, MSG SEVIRI satelliteobservations turned out to be rather useful. When lookingat night-time infrared satellite images for cloud-freenights in April 2006, they reveal a distinct north–southBT temperature gradient over the West African continent(Figure 7). This feature, which moves northward duringthe night, has been recognized as the ITD position bycomparison with ground-based observations. North of the
ITD in the dry air, strong temperature inversions close tothe ground (see Figure 4) lead to low surface temperatures(i.e. cold IR BTs). In the example of 11 April 0200UTC (Figure 7) many detailed structures show up northof about 10◦. They reveal strong temperature inversionsin basins and valleys, whereas hills and mountain ridgesstayed above these shallow cold-air pools even though theheight difference is not more than 100 m. This is a well-known phenomenon on clear and dry nights with lightwinds (Gustavsson et al., 1998). South of the ITD, theradiation balance at the ground is different: Because of themuch higher water-vapour content (and therefore strongerdownwelling thermal radiation) as well as stronger winds,the surface remains warmer, even without clouds. Thiscontrast in surface temperature across the ITD results inBT differences of about 3 K over only 10 km distance(Figure 8). At 0000 UTC, this BT jump lies exactly overNangatchori (9.65◦N). From the model, unfortunately nosurface skin temperature as analogue to satellite BT isavailable for direct comparison. However, we can usethe lowest level (10 m) temperature to diagnose theITD position. South of the ITD, satellite BT and 10 mtemperature agree to about 4 K, while north of 10◦Nthe BT is more than 8 K lower than the modelled10 m temperature due to strong surface cooling (seeFigure 4). In order to derive the ITD position from themodel, it turned out to be useful to look for the lowest10 m temperature on the meridional section. Here theassumption is that the lowest temperature occurs at theconvergence zone (lowest wind speed, see Figure 3) andtherefore strongest surface cooling. The ITD position inthe model can then be derived at 9.9◦N at 0000 UTC.
Figure 7. MSG SEVIRI 10.8 µm brightness temperature observations on 11 April 2006, 0200 UTC. The dotted line corresponds to the approximateITD position derived from Meso-NH results and ECMWF analyses by looking for the 15◦ dew-point contour line.
Copyright c© 2009 Royal Meteorological Society Q. J. R. Meteorol. Soc. 136(s1): 92–106 (2010)
DIURNAL CYCLE OF THE ITD 101
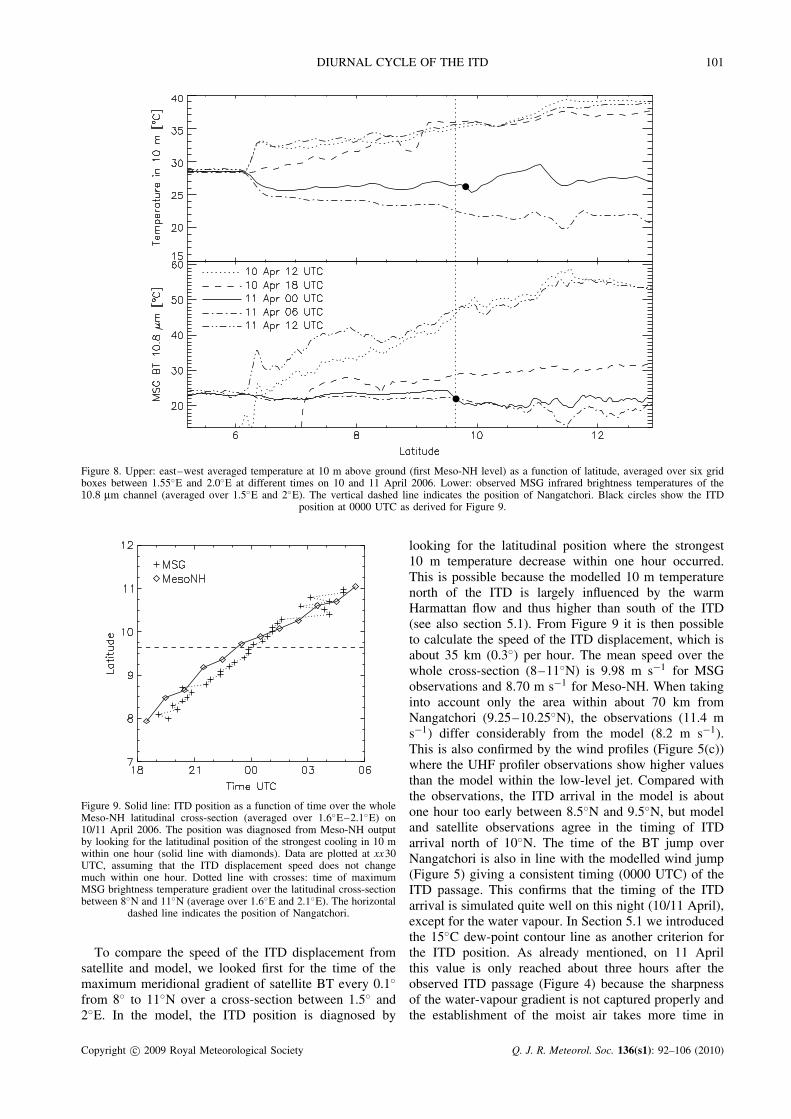
Figure 8. Upper: east–west averaged temperature at 10 m above ground (first Meso-NH level) as a function of latitude, averaged over six gridboxes between 1.55◦E and 2.0◦E at different times on 10 and 11 April 2006. Lower: observed MSG infrared brightness temperatures of the10.8 µm channel (averaged over 1.5◦E and 2◦E). The vertical dashed line indicates the position of Nangatchori. Black circles show the ITD
position at 0000 UTC as derived for Figure 9.
Figure 9. Solid line: ITD position as a function of time over the wholeMeso-NH latitudinal cross-section (averaged over 1.6◦E–2.1◦E) on10/11 April 2006. The position was diagnosed from Meso-NH outputby looking for the latitudinal position of the strongest cooling in 10 mwithin one hour (solid line with diamonds). Data are plotted at xx30UTC, assuming that the ITD displacement speed does not changemuch within one hour. Dotted line with crosses: time of maximumMSG brightness temperature gradient over the latitudinal cross-sectionbetween 8◦N and 11◦N (average over 1.6◦E and 2.1◦E). The horizontal
dashed line indicates the position of Nangatchori.
To compare the speed of the ITD displacement fromsatellite and model, we looked first for the time of themaximum meridional gradient of satellite BT every 0.1◦from 8◦ to 11◦N over a cross-section between 1.5◦ and2◦E. In the model, the ITD position is diagnosed by
looking for the latitudinal position where the strongest10 m temperature decrease within one hour occurred.This is possible because the modelled 10 m temperaturenorth of the ITD is largely influenced by the warmHarmattan flow and thus higher than south of the ITD(see also section 5.1). From Figure 9 it is then possibleto calculate the speed of the ITD displacement, which isabout 35 km (0.3◦) per hour. The mean speed over thewhole cross-section (8–11◦N) is 9.98 m s−1 for MSGobservations and 8.70 m s−1 for Meso-NH. When takinginto account only the area within about 70 km fromNangatchori (9.25–10.25◦N), the observations (11.4 ms−1) differ considerably from the model (8.2 m s−1).This is also confirmed by the wind profiles (Figure 5(c))where the UHF profiler observations show higher valuesthan the model within the low-level jet. Compared withthe observations, the ITD arrival in the model is aboutone hour too early between 8.5◦N and 9.5◦N, but modeland satellite observations agree in the timing of ITDarrival north of 10◦N. The time of the BT jump overNangatchori is also in line with the modelled wind jump(Figure 5) giving a consistent timing (0000 UTC) of theITD passage. This confirms that the timing of the ITDarrival is simulated quite well on this night (10/11 April),except for the water vapour. In Section 5.1 we introducedthe 15◦C dew-point contour line as another criterion forthe ITD position. As already mentioned, on 11 Aprilthis value is only reached about three hours after theobserved ITD passage (Figure 4) because the sharpnessof the water-vapour gradient is not captured properly andthe establishment of the moist air takes more time in
Copyright c© 2009 Royal Meteorological Society Q. J. R. Meteorol. Soc. 136(s1): 92–106 (2010)
102 B. POSPICHAL ET AL.
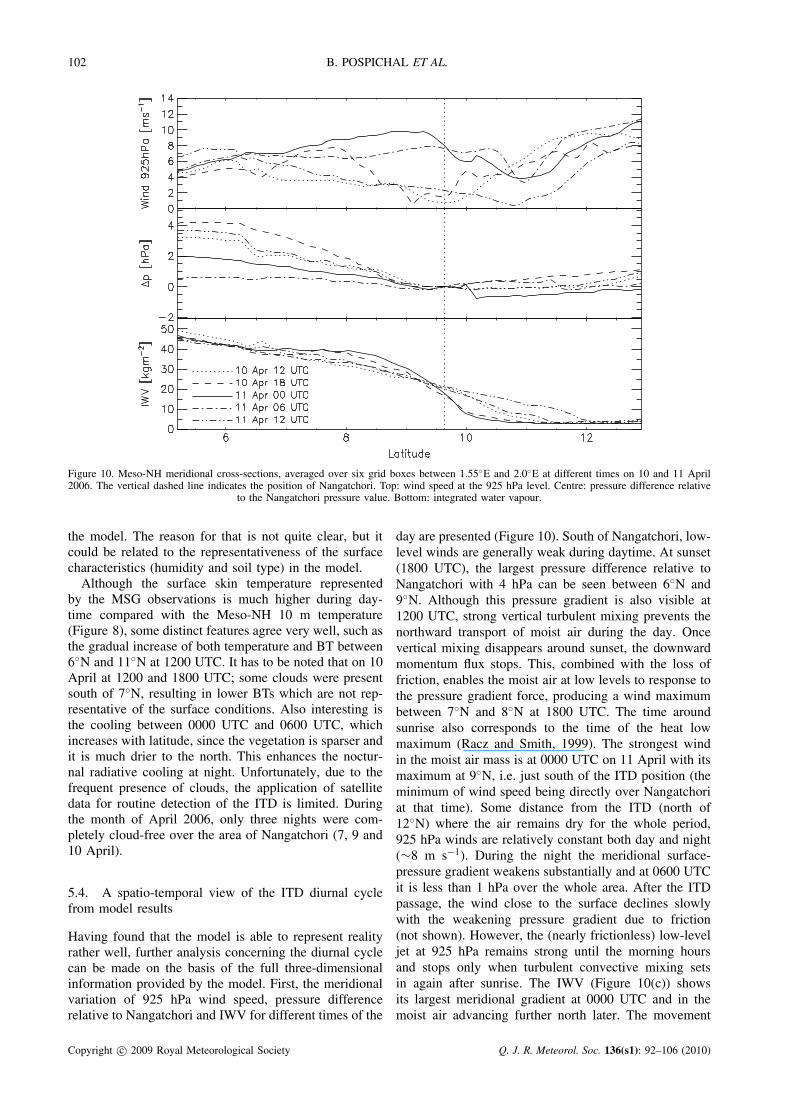
Figure 10. Meso-NH meridional cross-sections, averaged over six grid boxes between 1.55◦E and 2.0◦E at different times on 10 and 11 April2006. The vertical dashed line indicates the position of Nangatchori. Top: wind speed at the 925 hPa level. Centre: pressure difference relative
to the Nangatchori pressure value. Bottom: integrated water vapour.
the model. The reason for that is not quite clear, but itcould be related to the representativeness of the surfacecharacteristics (humidity and soil type) in the model.
Although the surface skin temperature representedby the MSG observations is much higher during day-time compared with the Meso-NH 10 m temperature(Figure 8), some distinct features agree very well, such asthe gradual increase of both temperature and BT between6◦N and 11◦N at 1200 UTC. It has to be noted that on 10April at 1200 and 1800 UTC; some clouds were presentsouth of 7◦N, resulting in lower BTs which are not rep-resentative of the surface conditions. Also interesting isthe cooling between 0000 UTC and 0600 UTC, whichincreases with latitude, since the vegetation is sparser andit is much drier to the north. This enhances the noctur-nal radiative cooling at night. Unfortunately, due to thefrequent presence of clouds, the application of satellitedata for routine detection of the ITD is limited. Duringthe month of April 2006, only three nights were com-pletely cloud-free over the area of Nangatchori (7, 9 and10 April).
5.4. A spatio-temporal view of the ITD diurnal cyclefrom model results
Having found that the model is able to represent realityrather well, further analysis concerning the diurnal cyclecan be made on the basis of the full three-dimensionalinformation provided by the model. First, the meridionalvariation of 925 hPa wind speed, pressure differencerelative to Nangatchori and IWV for different times of the
day are presented (Figure 10). South of Nangatchori, low-level winds are generally weak during daytime. At sunset(1800 UTC), the largest pressure difference relative toNangatchori with 4 hPa can be seen between 6◦N and9◦N. Although this pressure gradient is also visible at1200 UTC, strong vertical turbulent mixing prevents thenorthward transport of moist air during the day. Oncevertical mixing disappears around sunset, the downwardmomentum flux stops. This, combined with the loss offriction, enables the moist air at low levels to response tothe pressure gradient force, producing a wind maximumbetween 7◦N and 8◦N at 1800 UTC. The time aroundsunrise also corresponds to the time of the heat lowmaximum (Racz and Smith, 1999). The strongest windin the moist air mass is at 0000 UTC on 11 April with itsmaximum at 9◦N, i.e. just south of the ITD position (theminimum of wind speed being directly over Nangatchoriat that time). Some distance from the ITD (north of12◦N) where the air remains dry for the whole period,925 hPa winds are relatively constant both day and night(∼8 m s−1). During the night the meridional surface-pressure gradient weakens substantially and at 0600 UTCit is less than 1 hPa over the whole area. After the ITDpassage, the wind close to the surface declines slowlywith the weakening pressure gradient due to friction(not shown). However, the (nearly frictionless) low-leveljet at 925 hPa remains strong until the morning hoursand stops only when turbulent convective mixing setsin again after sunrise. The IWV (Figure 10(c)) showsits largest meridional gradient at 0000 UTC and in themoist air advancing further north later. The movement
Copyright c© 2009 Royal Meteorological Society Q. J. R. Meteorol. Soc. 136(s1): 92–106 (2010)
DIURNAL CYCLE OF THE ITD 103
Figure 11. Meridional cross-section of the modelled 11 g kg−1 water-vapour mixing ratio contour line at different times on 10 and 11 April2006.
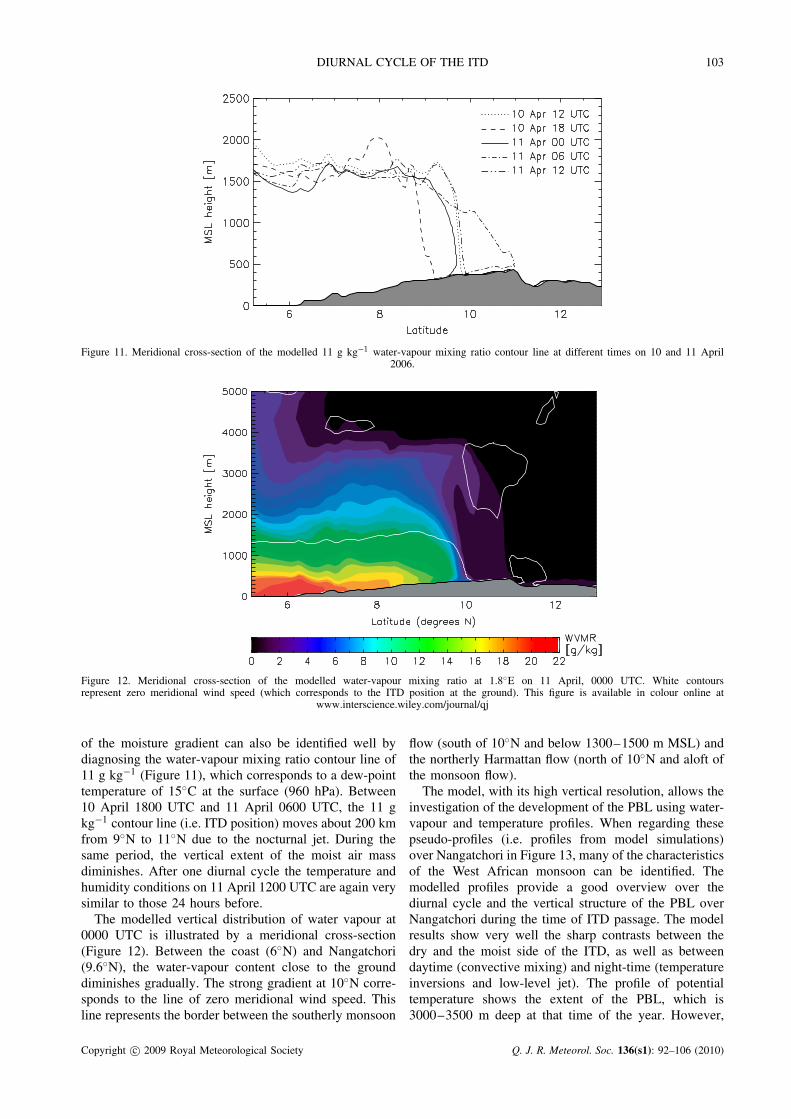
Figure 12. Meridional cross-section of the modelled water-vapour mixing ratio at 1.8◦E on 11 April, 0000 UTC. White contoursrepresent zero meridional wind speed (which corresponds to the ITD position at the ground). This figure is available in colour online at
www.interscience.wiley.com/journal/qj
of the moisture gradient can also be identified well bydiagnosing the water-vapour mixing ratio contour line of11 g kg−1 (Figure 11), which corresponds to a dew-pointtemperature of 15◦C at the surface (960 hPa). Between10 April 1800 UTC and 11 April 0600 UTC, the 11 gkg−1 contour line (i.e. ITD position) moves about 200 kmfrom 9◦N to 11◦N due to the nocturnal jet. During thesame period, the vertical extent of the moist air massdiminishes. After one diurnal cycle the temperature andhumidity conditions on 11 April 1200 UTC are again verysimilar to those 24 hours before.
The modelled vertical distribution of water vapour at0000 UTC is illustrated by a meridional cross-section(Figure 12). Between the coast (6◦N) and Nangatchori(9.6◦N), the water-vapour content close to the grounddiminishes gradually. The strong gradient at 10◦N corre-sponds to the line of zero meridional wind speed. Thisline represents the border between the southerly monsoon
flow (south of 10◦N and below 1300–1500 m MSL) andthe northerly Harmattan flow (north of 10◦N and aloft ofthe monsoon flow).
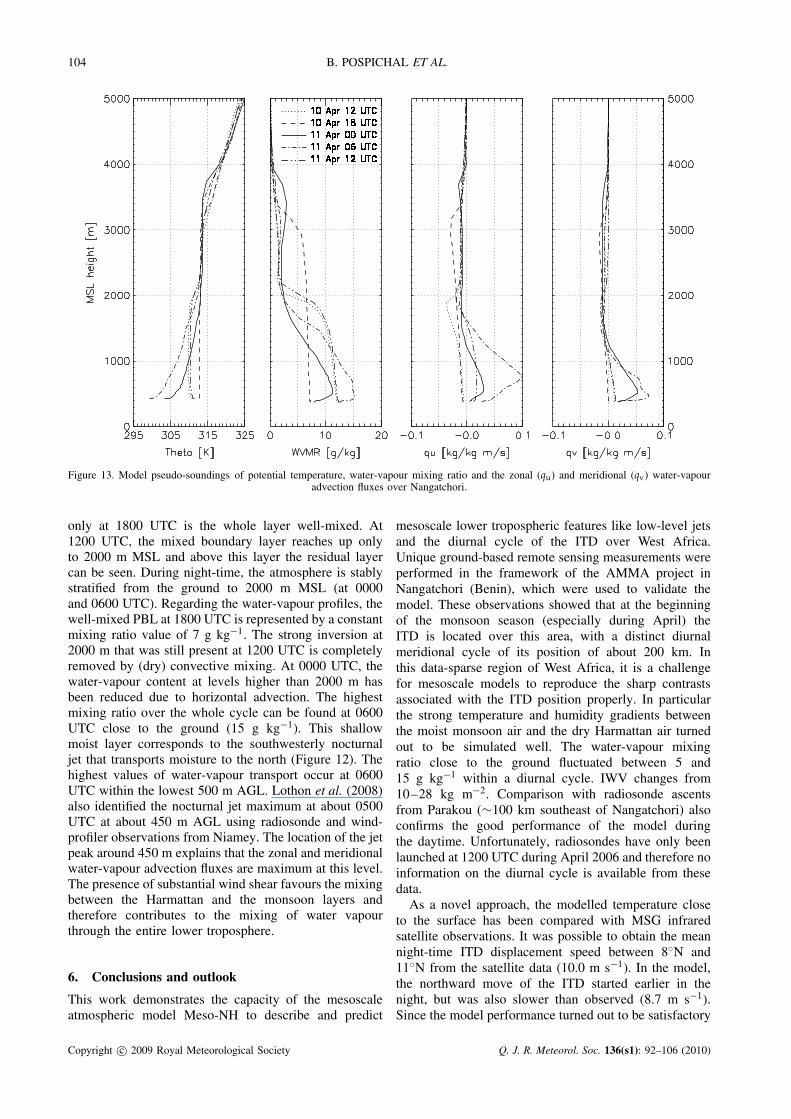
The model, with its high vertical resolution, allows theinvestigation of the development of the PBL using water-vapour and temperature profiles. When regarding thesepseudo-profiles (i.e. profiles from model simulations)over Nangatchori in Figure 13, many of the characteristicsof the West African monsoon can be identified. Themodelled profiles provide a good overview over thediurnal cycle and the vertical structure of the PBL overNangatchori during the time of ITD passage. The modelresults show very well the sharp contrasts between thedry and the moist side of the ITD, as well as betweendaytime (convective mixing) and night-time (temperatureinversions and low-level jet). The profile of potentialtemperature shows the extent of the PBL, which is3000–3500 m deep at that time of the year. However,
Copyright c© 2009 Royal Meteorological Society Q. J. R. Meteorol. Soc. 136(s1): 92–106 (2010)
104 B. POSPICHAL ET AL.
Figure 13. Model pseudo-soundings of potential temperature, water-vapour mixing ratio and the zonal (qu) and meridional (qv) water-vapouradvection fluxes over Nangatchori.
only at 1800 UTC is the whole layer well-mixed. At1200 UTC, the mixed boundary layer reaches up onlyto 2000 m MSL and above this layer the residual layercan be seen. During night-time, the atmosphere is stablystratified from the ground to 2000 m MSL (at 0000and 0600 UTC). Regarding the water-vapour profiles, thewell-mixed PBL at 1800 UTC is represented by a constantmixing ratio value of 7 g kg−1. The strong inversion at2000 m that was still present at 1200 UTC is completelyremoved by (dry) convective mixing. At 0000 UTC, thewater-vapour content at levels higher than 2000 m hasbeen reduced due to horizontal advection. The highestmixing ratio over the whole cycle can be found at 0600UTC close to the ground (15 g kg−1). This shallowmoist layer corresponds to the southwesterly nocturnaljet that transports moisture to the north (Figure 12). Thehighest values of water-vapour transport occur at 0600UTC within the lowest 500 m AGL. Lothon et al. (2008)also identified the nocturnal jet maximum at about 0500UTC at about 450 m AGL using radiosonde and wind-profiler observations from Niamey. The location of the jetpeak around 450 m explains that the zonal and meridionalwater-vapour advection fluxes are maximum at this level.The presence of substantial wind shear favours the mixingbetween the Harmattan and the monsoon layers andtherefore contributes to the mixing of water vapourthrough the entire lower troposphere.
6. Conclusions and outlook
This work demonstrates the capacity of the mesoscaleatmospheric model Meso-NH to describe and predict
mesoscale lower tropospheric features like low-level jetsand the diurnal cycle of the ITD over West Africa.Unique ground-based remote sensing measurements wereperformed in the framework of the AMMA project inNangatchori (Benin), which were used to validate themodel. These observations showed that at the beginningof the monsoon season (especially during April) theITD is located over this area, with a distinct diurnalmeridional cycle of its position of about 200 km. Inthis data-sparse region of West Africa, it is a challengefor mesoscale models to reproduce the sharp contrastsassociated with the ITD position properly. In particularthe strong temperature and humidity gradients betweenthe moist monsoon air and the dry Harmattan air turnedout to be simulated well. The water-vapour mixingratio close to the ground fluctuated between 5 and15 g kg−1 within a diurnal cycle. IWV changes from10–28 kg m−2. Comparison with radiosonde ascentsfrom Parakou (∼100 km southeast of Nangatchori) alsoconfirms the good performance of the model duringthe daytime. Unfortunately, radiosondes have only beenlaunched at 1200 UTC during April 2006 and therefore noinformation on the diurnal cycle is available from thesedata.
As a novel approach, the modelled temperature closeto the surface has been compared with MSG infraredsatellite observations. It was possible to obtain the meannight-time ITD displacement speed between 8◦N and11◦N from the satellite data (10.0 m s−1). In the model,the northward move of the ITD started earlier in thenight, but was also slower than observed (8.7 m s−1).Since the model performance turned out to be satisfactory
Copyright c© 2009 Royal Meteorological Society Q. J. R. Meteorol. Soc. 136(s1): 92–106 (2010)
DIURNAL CYCLE OF THE ITD 105
in all major parameters, the meridional distribution ofvarious atmospheric parameters (such as water vapour,temperature or wind speed) as well as vertical profiles forthe lower troposphere were analysed. These simulationresults give a good insight into the large contrast betweenthe dry and moist air masses on both sides of theITD and the pronounced diurnal cycle. In addition, thePBL development could be described in detail. Becauseof the dry conditions, a large part of the incomingsolar radiation was converted into sensible heat flux andtherefore the PBL depth reached up to 4000 m in theafternoon. The moisture that was carried north duringnight close to the ground was then distributed over thewhole layer.
Despite the restriction through clouds, the potentialof satellites for detecting low-level atmospheric featuresover this area with only a few ground-based and upper-air observations should be studied further. For extendedstatistical analyses and deeper knowledge of inter-annualvariations of the ITD position and its diurnal cycle, long-term PBL observations as well as further model studiesare necessary.
In the future, we will investigate the difference ofthe diurnal and annual cycles of the PBL betweenDjougou (9.6◦N) and Niamey (13.5◦N), where a similarinstrumentation was deployed in 2006 at the ARM mobilefacility (Miller and Slingo, 2007). A comparison ofground-based PBL observations with respect to the ITDposition will be performed.
Acknowledgements
Based on a French initiative, AMMA was built by aninternational scientific group and is currently funded bya large number of agencies, especially from France,UK, US and Africa. It has been the beneficiary of amajor financial contribution from the European Commu-nity’s Sixth Framework Research Programme. Detailedinformation on scientific coordination and funding isavailable on the AMMA International web site athttp://www.amma-international.org.
Special thanks go to Sylvie Galle (IRD) for weatherstation data of Djougou.
References
Blackadar AK. 1957. Boundary layer wind maxima and their signi-ficance for the growth of nocturnal inversions. Bull. Am. Meteorol.Soc. 38: 283–290.
Bock O, Bouin MN, Doerflinger E, Collard P, Masson F, Meynadier R,Nahmani S, Koite M, Gaptia Lawan Balawan K, Dide F,Ouedraogo D, Pokperlaar S, Ngamini JB, Lafore JP, Janicot S,Guichard F, Nuret M. 2008. The West African Monsoon observedwith ground-based GPS receivers during AMMA. J. Geophys. Res.113: D21105. DOI:10.1029/2008JD010327.
Bougeault P, Lacarrere P. 1989. Parametrization of orography-induced turbulence in a meso-beta model, Mon. Weather Rev. 117:1872–1890.
Bou Karam D, Flamant C, Knippertz P, Reitebuch O, Chong M,Pelon J, Dabas A. 2008. Dust emissions over the Sahel associatedwith the West African Monsoon inter-tropical discontinuity region:a representative case study. Q. J. R. Meteorol. Soc. 134: 621–634.
Buckle C. 1996. Weather and climate in Africa. Addison-WesleyLongman Ltd: Harlow, UK. 320.
Couvreux F, Guichard F, Bock O, Lafore JP, Redelsperger JL. 2009.Synoptic variability of the monsoon flux over West Africa prior tothe onset. Q. J. R. Meteorol. Soc. 136(s1): 160–174.
Crewell S, Lohnert U. 2007. Accuracy of boundary layer temperatureprofiles retrieved with multifrequency multiangle microwaveradiometry. IEEE Trans. Geosci. Remote Sensing 45: 2195–2201.
Flamant C, Knippertz P, Parker DJ, Chaboureau JP, Lavaysse C,Agusti-Panareda A, Kergoat L. 2009. The impact of a mesoscaleconvective system cold-pool on the northward propagation of theinter-tropical discontinuity over West Africa. Q. J. R. Meteorol. Soc.135: 139–159.
Garratt JR. 1994. The Atmospheric Boundary Layer. CambridgeUniversity Press: Cambridge, UK. 336.
Gustavsson T, Karlsson M, Bogren J, Lindqvist S. 1998. Developmentof temperature patterns during clear nights. J. Appl. Meteorol., 37:559–571.
Hastenrath S. 1985. Climate and Circulation of the Tropics. D. ReidelPublishing Company: Dordrecht. 455 pp.
Heo BH, Jacoby-Coaly S, Kim KE, Campistron B, Benech B, Jung ES.2003. Use of the Doppler spectral width to improve the estimationof the convective boundary layer height. J. Atmos. Oceanic Technol.20: 408–424.
Jacoby-Coaly S, Campistron B, Bernard S, Benech B, Ardhuin-Girard F, Dessens J, Dupont E, Carissimo B. 2002. Turbulentdissipation rate in the boundary layer via UHF wind profilerDoppler spectral width measurements. Boundary-Layer Meteorol.103: 361–389.
Janicot S, Thorncroft CD, Ali A, Asencio N, Berry G, Bock O,Bourles B, Caniaux G, Chauvin F, Deme A, Kergoat L, Lafore JP,Lavaysse C, Lebel T, Marticorena B, Mounier F, Nedelec P,Redelsperger JL, Ravegnani F, Reeves CE, Roca R, de Rosnay P,Schlager H, Sultan B, Tomasini M, Ulanovsky A, ACMADforecasters team. 2008. Large-scale overview of the summermonsoon over West Africa during the AMMA field experiment in2006. Annales Geophysicae 26: 2569–2595.
Lafore JP, Stein J, Asencio N, Bougeault P, Ducrocq V, Duron J,Fischer C, Hreil P, Mascart P, Masson V, Pinty J, Redelsperger JL,Richard E, Vil-Guerau de Arellano J. 1998. The Meso-NHatmospheric simulation system. Part I: adiabatic formulation andcontrol simulations. Scientific objectives and experimental design.Annales Geophysicae 16: 90–109.
Lebel T, Parker DJ, Flamant C, Bourles B, Marticorena B, Mougin E,Peugeot C, Diedhiou A, Haywood JM, Ngamini JB, Polcher J,Redelsperger JL, Thorncroft CD. 2009. The AMMA field campaigns:Multiscale and multidisciplinary observations in the West Africanregion. Q. J. R. Meteorol. Soc. 136(s1): 8–33.
Lohnert U, Turner DD, Crewell S. 2008. Ground-based temperatureand humidiy profiling using spectral infrared and microwaveobservations. Part 1. Retrieval performance in clear sky conditions.J. Appl. Meteorol. Clim. 48: 1017–1032.
Lothon M, Said F, Lohou F, Campistron B. 2008. Observation of thediurnal cycle in the low troposphere over West Africa. Mon. WeatherRev. 136: 3477–3500.
Masson V, Champeaux JL, Chauvin F, Meriguet C, Lacaze R. 2003.A global database of land surface parameters at 1-km resolution inmeteorological and climate models. J. Climate 16: 1261–1282.
Miller MA, Slingo A. 2007. The ARM mobile facility and its firstinternational deployment: measuring radiative flux divergence inWest Africa. Bull. Am. Meteorol. Soc. 88: 1229–1244.
Noilhan J, Mahfouf JF. 1996. The ISBA land surface parametrizationscheme. Global and Planetary Change 13: 145–159.
Parker DJ, Burton RR, Diongue-Niang A, Ellis RJ, Felton M,Taylor CM, Thorncroft CD, Bessemoulin P, Tompkins AM. 2005.The diurnal cycle of the West African monsoon circulation. Q. J. R.Meteorol. Soc. 131: 2839–2860.
Pospichal B, Crewell S. 2007. Boundary layer observations in WestAfrica using a novel microwave radiometer. Meteorol. Z. 16:513–523.
Racz Z, Smith RK. 1999. The dynamics of heat lows. Q. J. R. Meteorol.Soc. 125: 225–252.
Redelsperger JL, Thorncroft CD, Diedhiou A, Lebel T, Parker DJ,Polcher J. 2006. African Monsoon Multidisciplinary Analysis:An international research project and field campaign. Bull. Am.Meteorol. Soc. 87: 1739–1746.
Copyright c© 2009 Royal Meteorological Society Q. J. R. Meteorol. Soc. 136(s1): 92–106 (2010)

106 B. POSPICHAL ET AL.
Rose T, Crewell S, Lohnert U, Simmer C. 2005. A network suitablemicrowave radiometer for operational monitoring of the cloudyatmosphere. Atmos. Res. 75: 183–200.
Sohne N, Chaboureau JP, Guichard F. 2008. Verification of cloud coverforecast with satellite observation over West Africa. Mon. WeatherRev. 136: 4421–4434.
Sultan B, Janicot S. 2003. The West African monsoon dynamics. PartII: The “preonset” and “onset” of the summer monsoon. J. Climate.16: 3407–3427.
Sultan B, Janicot S, Drobinski P. 2007. Characterization of the diurnalcycle of the West African monsoon around the monsoon onset.J. Climate 20: 4014–4032.
Copyright c© 2009 Royal Meteorological Society Q. J. R. Meteorol. Soc. 136(s1): 92–106 (2010)
Top Related
Copyright © 2022 FDOKUMEN

