


Bahasa
Halaman
Hukum

Digital Image Quality forIris Recognition
Biometric Image Quality Workshop
Digital Image Quality for Iris Recognition
Biometric Image Quality Workshop
PhP ilip D. Wassermanhilip D. Wasserman Guest Researcher, National Institute of Standards and TechnologyGuest Researcher, National Institute of Standards and Technology
Images courtesy of Dr. JohnImages courtesy of Dr. John DaugmanDaugman
Abstract
•• DDiiffefferreennt t sstutuddiiees s sshhoow w llaarrgge e vvaarriiaatitioonns s iin nrreeppoorrteted d eerrrroor r rraate te
•• ImImaaggiinng g ppllaattfoforrm m ddiifffeferreennccees s mmaay y aaccccoouunnt tfofor r ddiiffefferreenncce e
• Show accuracy results from [Daugman] and[IBG] reports.
• Suggest that imaging platform differences mayaccount for the apparent discrepancy betweenthese test results
• Define iris error rate terminology• Show the components of an imaging platform
quality.
illuminators.
Objectives
• Show accuracy results from [Daugman] and [IBG] reports.
• Suggest that imaging platform differences may account for the apparent discrepancy between these test results
• Define iris error rate terminology • Show the components of an imaging platform
quality.
illuminators.
and their characteristics affecting iris imageand their characteristics affecting iris image
•• Discuss eye hazard issues with infraredDiscuss eye hazard issues with infrared

• False non-match rate (FNMR)• Rejection rate of “genuines”
• Those with valid enrollment on file
• Passes undesirables in watch-list applications• Causes user dissatisfaction, increased workload and
delays.
FNMR and FMR Error Rates • False non-match rate (FNMR)
• Rejection rate of “genuines” • Those with valid enrollment on file
• Passes undesirables in watch-list applications • Causes user dissatisfaction, increased workload and
delays.
•• FFaallsse e mmaattcch h rraatte e ((FFMMRR) )•• Acceptance rate of Acceptance rate of ““iimpostersmposters” ”
• • TThhoosse e wwiitth h nno o eennrroollllmmeennt t oon n ffiille e• • LLeetts s kknnoowwn n uunnddeessiirraabbllees s tthhrroouuggh h
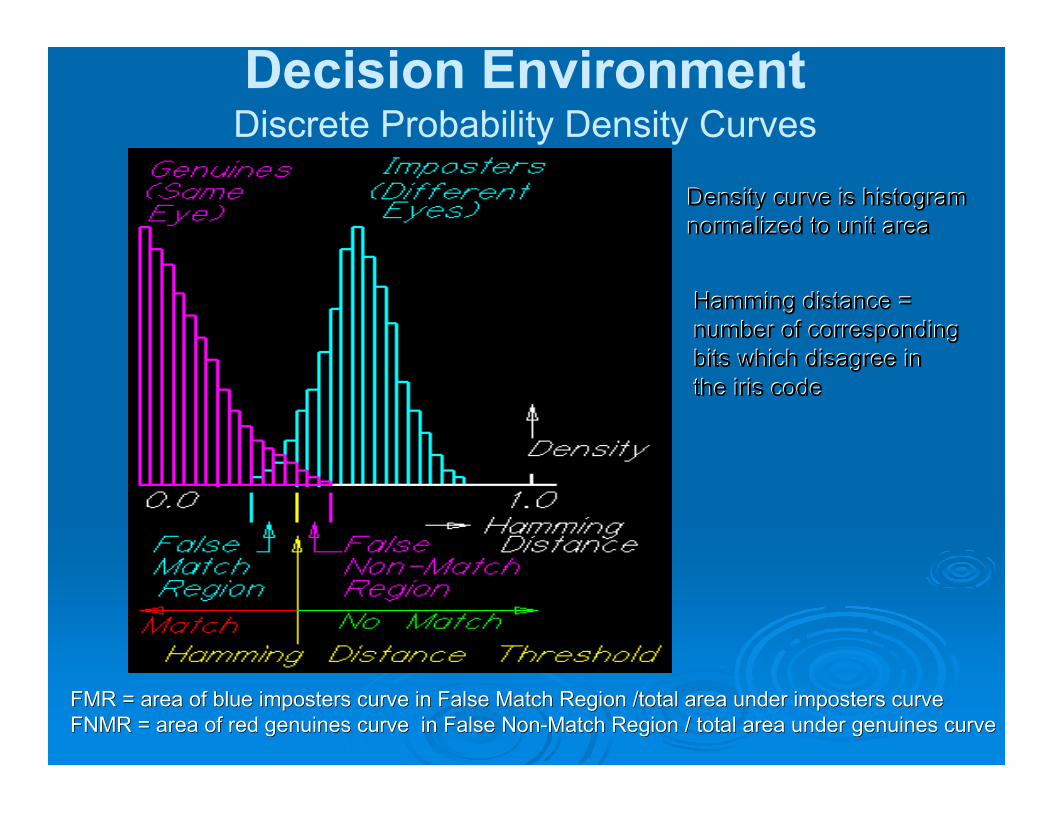
Decision Environment Discrete Probability Density Curves
FMF R = area of blue imposters curve in False Match Region /total area under imposters curveMR = area of blue imposters curve in False Match Region /total area under imposters curve FNMR = area of redFNMR = area of red genuinesgenuines curve in False Non-Match Region / total area undercurve in False Non-Match Region / total area under genuinesgenuines curvecurve
Density curve is histogram Density curve is histogramnormalized to unit area normalized to unit area
Hamming distance = Hamming distance =number of corresponding number of correspondingbits which disagree in bits which disagree inthe iris code the iris code
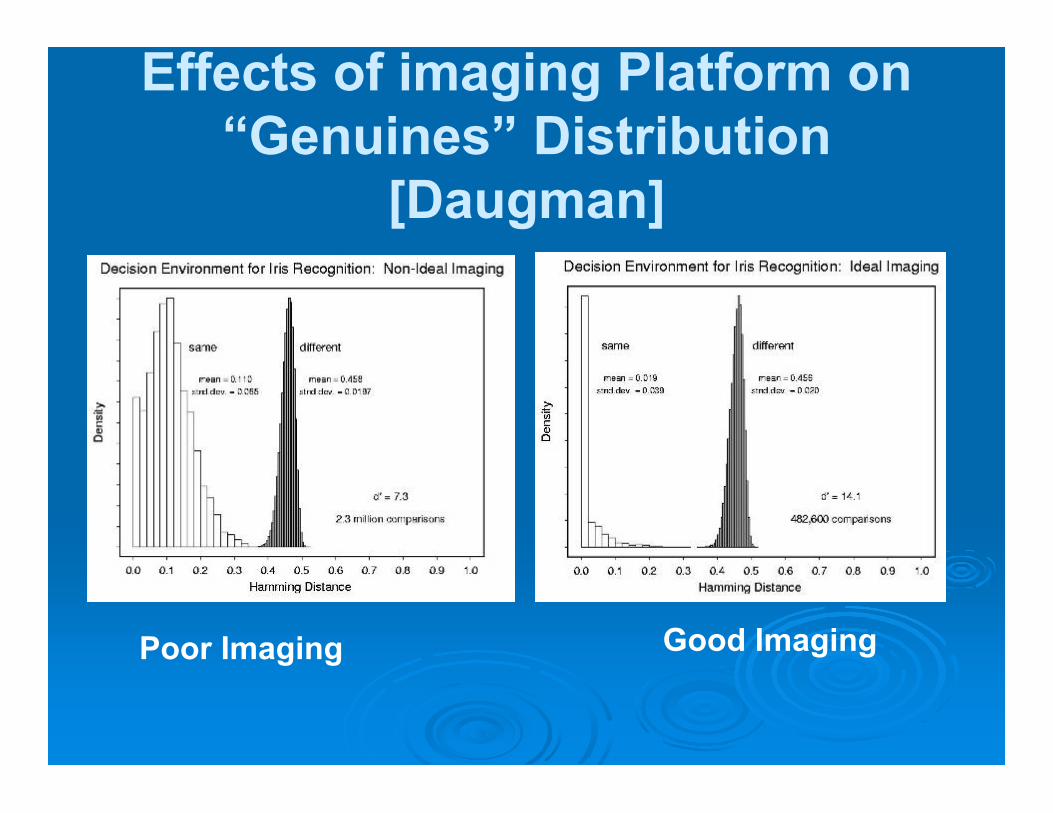
Effects of imaging Platform on “Genuines” Distribution
[Daugman]
Poor Imaging Good Imaging
Differing Error Rate Results
• False Non-match Rate• [Daugman] no false non-matches in 7070
comparisons• [IBG] one false non-match per 94.339
comparisons• False Match rate
•three devices
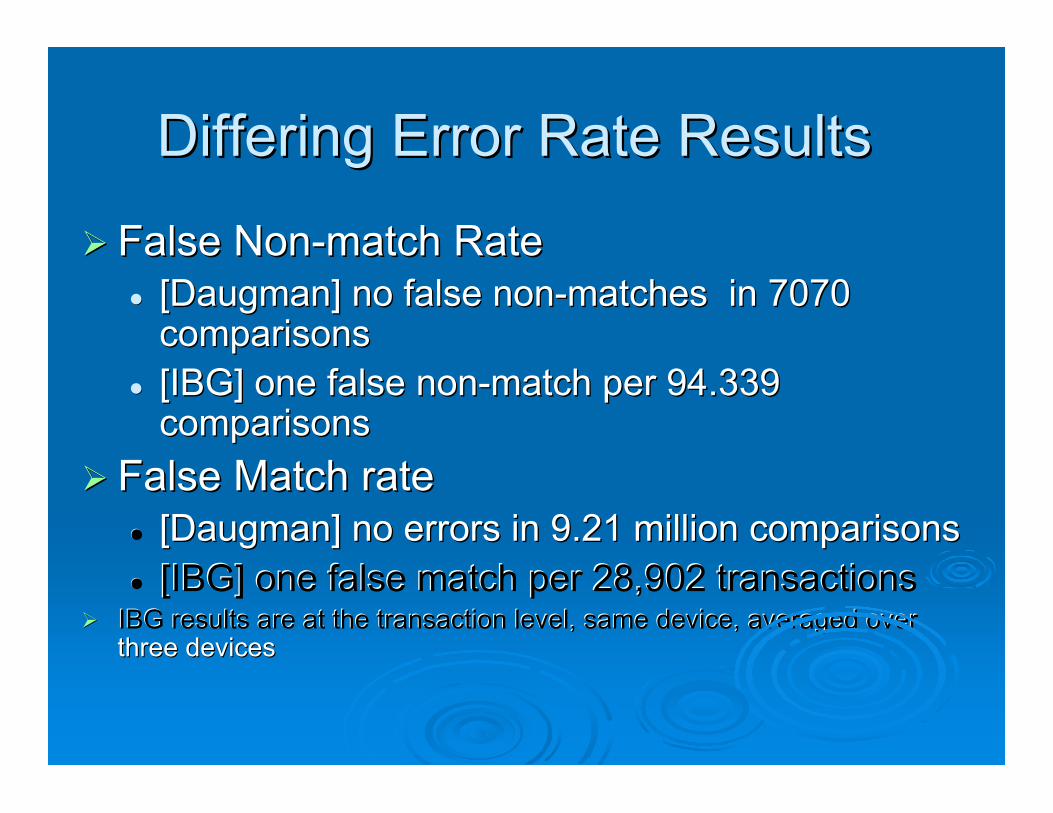
Differing Error Rate Results
• False Non-match Rate • [Daugman] no false non-matches in 7070
comparisons • [IBG] one false non-match per 94.339
comparisons • False Match rate
•
••
•• [[IIBBGG] ] oonne e ffaalslse e mmaattcch h ppeer r 2288,,99002 2 ttrraannssaaccttioionns sIIBBG G rreessuulltts s aarre e aat t tthhe e ttrraannssaaccttiioon n lleevveell, , ssaamme e ddeevviiccee, , aavveerraaggeed d oovveer r
[[DaugmanDaugman] no errors in 9.21 million comparisons] no errors in 9.21 million comparisons
three devices
• All suppliers in the IBG test used the same matchingalgorithm (licensed from Iridian)• Each supplier uses their own proprietary imaging platform• “the ‘authentics’ distribution [controlling FNMR] depends
strongly on the quality of imaging (e.g. aberrations, motion blur,focus, noise, etc.) and would be different for different imagingplatforms” [Daugman]
• “the measured similarity for “imposters” [ determiningFNMR] … is apparently almost completely independentof imaging factors.” [Daugman]•
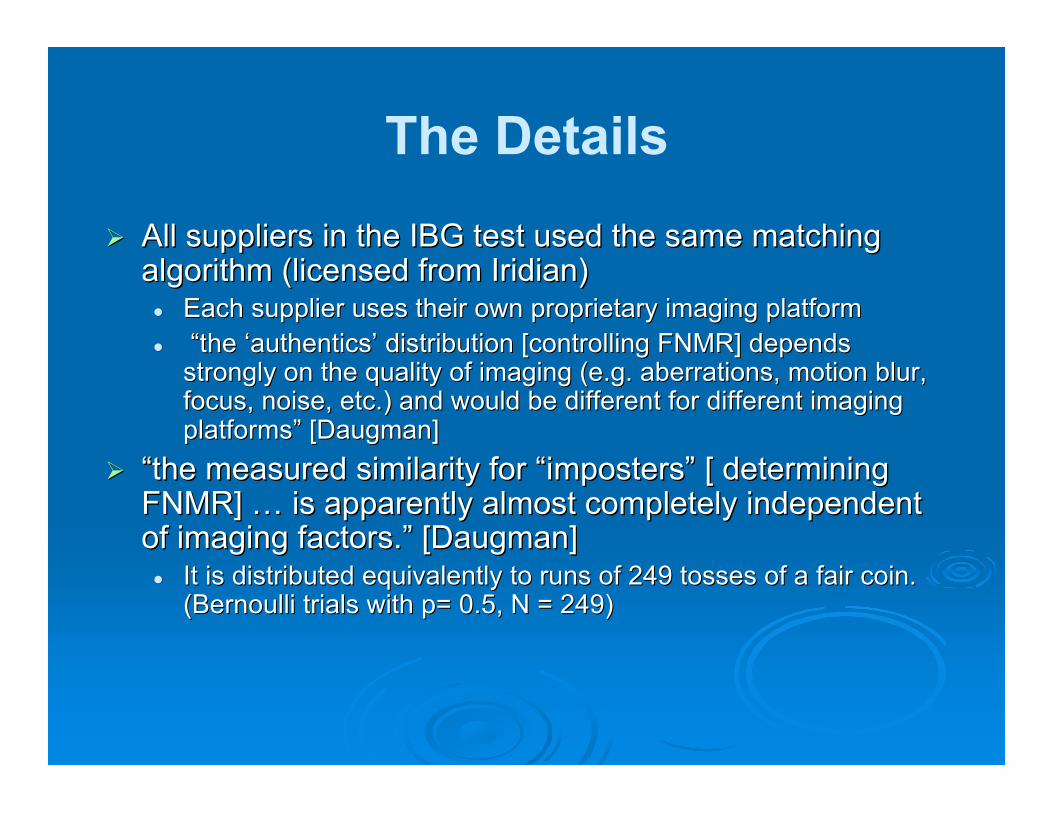
The Details • All suppliers in the IBG test used the same matching
algorithm (licensed from Iridian) • Each supplier uses their own proprietary imaging platform • “the ‘authentics’ distribution [controlling FNMR] depends
strongly on the quality of imaging (e.g. aberrations, motion blur, focus, noise, etc.) and would be different for different imaging platforms” [Daugman]
• “the measured similarity for “imposters” [ determiningFNMR] … is apparently almost completely independentof imaging factors.” [Daugman] • It is distributed equivalently to runs of 249 tosses of a fair coin.It is distributed equivalently to runs of 249 tosses of a fair coin.
(Bernoulli trials with p= 0.5, N = 249)(Bernoulli trials with p= 0.5, N = 249)
• FNMR can be reduced by increasing theHD (Hamming Distance) threshold
• The cost is high: a small decrease inFNMR produces a large increase in FMR• Reducing FNMR by 15.7% increases FMR by
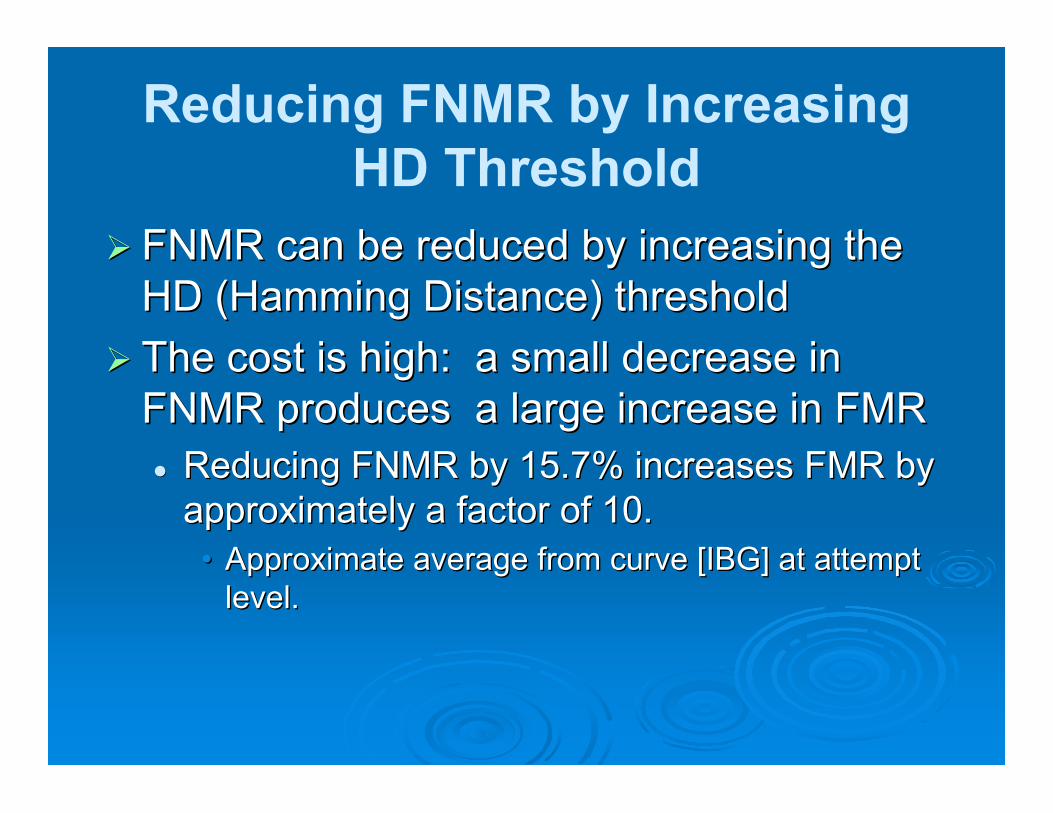
Reducing FNMR by Increasing HD Threshold
• FNMR can be reduced by increasing the HD (Hamming Distance) threshold
• The cost is high: a small decrease in FNMR produces a large increase in FMR • Reducing FNMR by 15.7% increases FMR by
approximately a factor of 10.approximately a factor of 10. •• Approximate average from curve [IBG] at attemptApproximate average from curve [IBG] at attempt
level.level.
Summary• [IBG] reports that FNMR is much higher
than FMR• FNMR can be a serious problem in watch-
list applications• Passes known criminals and terrorists
Summary • [IBG] reports that FNMR is much higher
than FMR • FNMR can be a serious problem in watch-
list applications • Passes known criminals and terrorists •• Fails to passFails to pass ““genuinesgenuines”” enrolled in theenrolled in the
databasedatabase •• FNMR is heavily influenced by the imagingFNMR is heavily influenced by the imaging
platform [Daugman]platform [Daugman]
Components of an Iris ImagingPlatform
• Digital Image Sensor• CCD or CMOS chip
• Lens• Illuminator• Camera
•• Encloses digital image sensor and lensEncloses digital image sensor and lens •• Subject interfaceSubject interface
Components of an Iris Imaging Platform
• Digital Image Sensor • CCD or CMOS chip
• Lens • Illuminator • Camera
The Digital ImageThe Digital Image SensorSensor

Digital Image Sensor• A digital camera chip converts a light image to digital form• Solid state sensors: CCD or CMOS
• CCDs have been the choice for low noise• CMOS sensors are approaching the performance of CCDs
• Pixel density does not fully define resolution• Pixel spacing controls spatial sampling rate
• Spatial frequency components must be less than sampling rate/2 (Nyquistlimit) to avoid aliasing which roduces moiré patterns
• Pixel-pixel crosstalk reduces resolution• Acts as low pass filter on image
• Sensor may have built-in filters that make it inappropriate for NIR(Near Infrared) imaging
•
Digital Image Sensor • A digital camera chip converts a light image to digital form • Solid state sensors: CCD or CMOS
• CCDs have been the choice for low noise • CMOS sensors are approaching the performance of CCDs
• Pixel density does not fully define resolution • Pixel spacing controls spatial sampling rate
• Spatial frequency components must be less than sampling rate/2 (Nyquist limit) to avoid aliasing which roduces moiré patterns
• Pixel-pixel crosstalk reduces resolution • Acts as low pass filter on image
• Sensor may have built-in filters that make it inappropriate for NIR(Near Infrared) imaging
•
•• RGBRGB •• Anti-aliasing (low-pass)Anti-aliasing (low-pass)
Sensor spectral sensitivity must extend into the NIR.Sensor spectral sensitivity must extend into the NIR.
Digital Image Sensor (cont.)• Sensor size affects resolution
• Analogous to advantage of large film size• Pixel size affects dynamic range
• Large pixels capture more light, decreasing noise.• Pixels smaller than the diffraction limit do not increase
resolution• Defective pixels
Digital Image Sensor (cont.) • Sensor size affects resolution
• Analogous to advantage of large film size • Pixel size affects dynamic range
• Large pixels capture more light, decreasing noise. • Pixels smaller than the diffraction limit do not increase
resolution • Defective pixels
•• always blackalways black •• always whitealways white •• ““lazy pixelslazy pixels””, sensitivity differences, sensitivity differences •• number and maximum cluster size must be specifiednumber and maximum cluster size must be specified
Important Digital Image SensorSpecifications
• Dynamic Range• = 20 log (Max Output (p-p) / Read Noise (rms))
• Fixed pattern noise (FPN)• = Fixed pixel-pixel offset variations
• Photo Response Non-Uniformity (PRNU)• = Fixed pixel-pixel gain variations
• Responsivity• = Output in digital numbers / light input in nJ/cm2
• Read Noise• = Random rms noise of the digital output
•
•
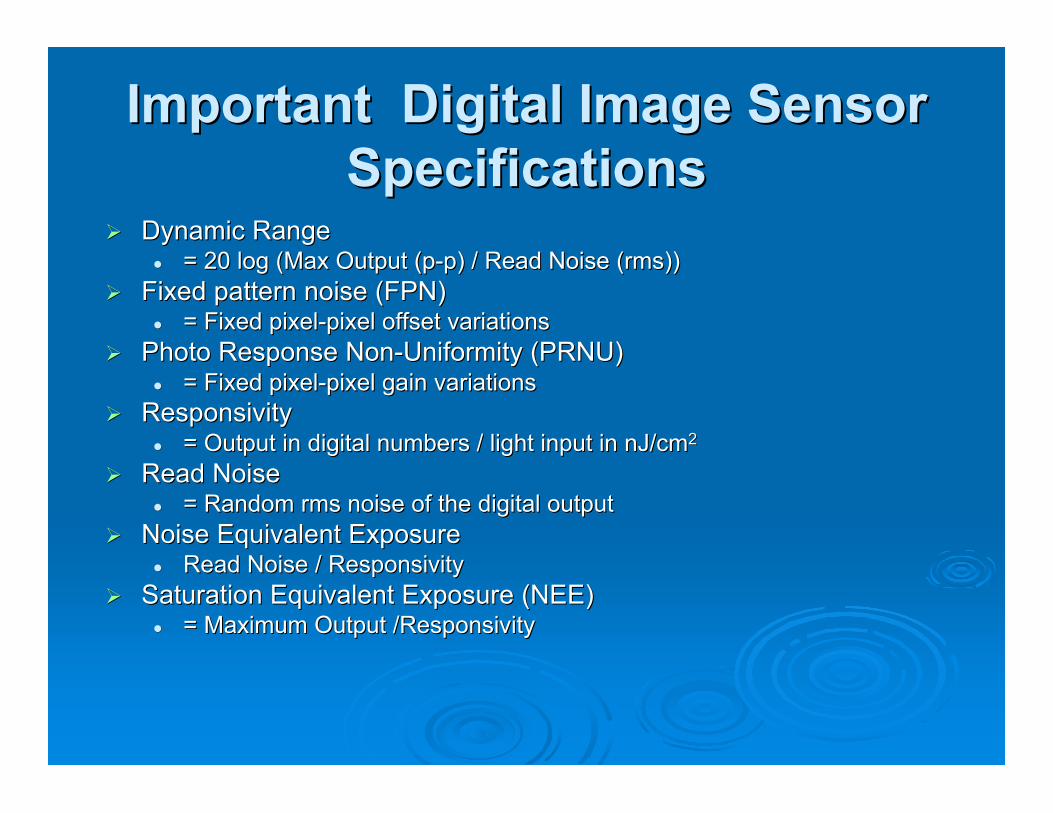
Important Digital Image Sensor Specifications
• Dynamic Range • = 20 log (Max Output (p-p) / Read Noise (rms))
• Fixed pattern noise (FPN) • = Fixed pixel-pixel offset variations
• Photo Response Non-Uniformity (PRNU) • = Fixed pixel-pixel gain variations
• Responsivity • = Output in digital numbers / light input in nJ/cm2
• Read Noise • = Random rms noise of the digital output
•
•
Noise Equivalent ExposureNoise Equivalent Exposure •• Read Noise / ResponsivityRead Noise / Responsivity
Saturation Equivalent Exposure (NEE)Saturation Equivalent Exposure (NEE) •• = Maximum Output /Responsivity= Maximum Output /Responsivity

The LensThe Lens
The Lens
• The lens must faithfully project an imageof the subject onto the digital sensor.
• NIR imaging places special requirementson the lens• Different from those for visual light.• High quality lenses designed for visible light
can produce serious image degradation in thecan produce serious image degradation in the NIRNIR
The Lens
• The lens must faithfully project an image of the subject onto the digital sensor.
• NIR imaging places special requirements on the lens • Different from those for visual light. • High quality lenses designed for visible light

NIR Lens Requirements• High-quality lenses optimized for visible light often perform poorly in
the NIR (Near Infra-Red, 700-1000 nanometers)• Lens design must be optimized for the NIR.
• Lens coatings must be designed for the NIR• Lens elements are coated to reduce reflections and avoid light loss of
approximately 4.0 – 5.0% at each surface.• 10 – 20 surfaces are common• NIR optimized coatings will reduce loss to 0.5-1% per surface
• Lens coatings not optimized for the NIR will cause:• light loss• internal reflections• ghost images
• Broad-band lenses cover both the NIR and visible range•
NIR Lens Requirements • High-quality lenses optimized for visible light often perform poorly in
the NIR (Near Infra-Red, 700-1000 nanometers) • Lens design must be optimized for the NIR.
• Lens coatings must be designed for the NIR • Lens elements are coated to reduce reflections and avoid light loss of
approximately 4.0 – 5.0% at each surface. • 10 – 20 surfaces are common • NIR optimized coatings will reduce loss to 0.5-1% per surface
• Lens coatings not optimized for the NIR will cause: • light loss • internal reflections • ghost images
• Broad-band lenses cover both the NIR and visible range • Lens must be designed for digital sensor useLens must be designed for digital sensor use
•• Cover glass on sensor must be included in lens designCover glass on sensor must be included in lens design •• Small pixel sizes (3-12 microns) increase requirements for lens quality.Small pixel sizes (3-12 microns) increase requirements for lens quality.
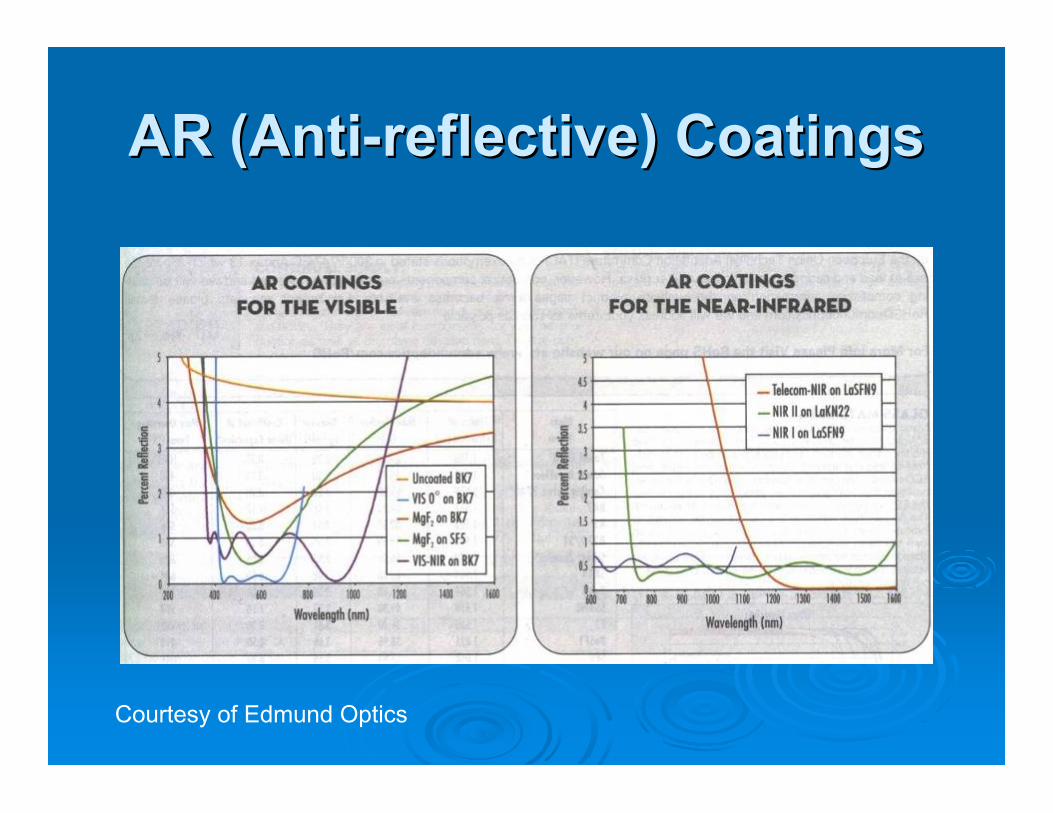
AR (Anti-reflective) CoatingsAR (Anti-reflective) Coatings
Courtesy of Edmund Optics
Measures of Lens QualityMeasures of Lens Quality
•• Image SharpnessImage Sharpness •• Distortion levelDistortion level •• Uniformity of brightnessUniformity of brightness
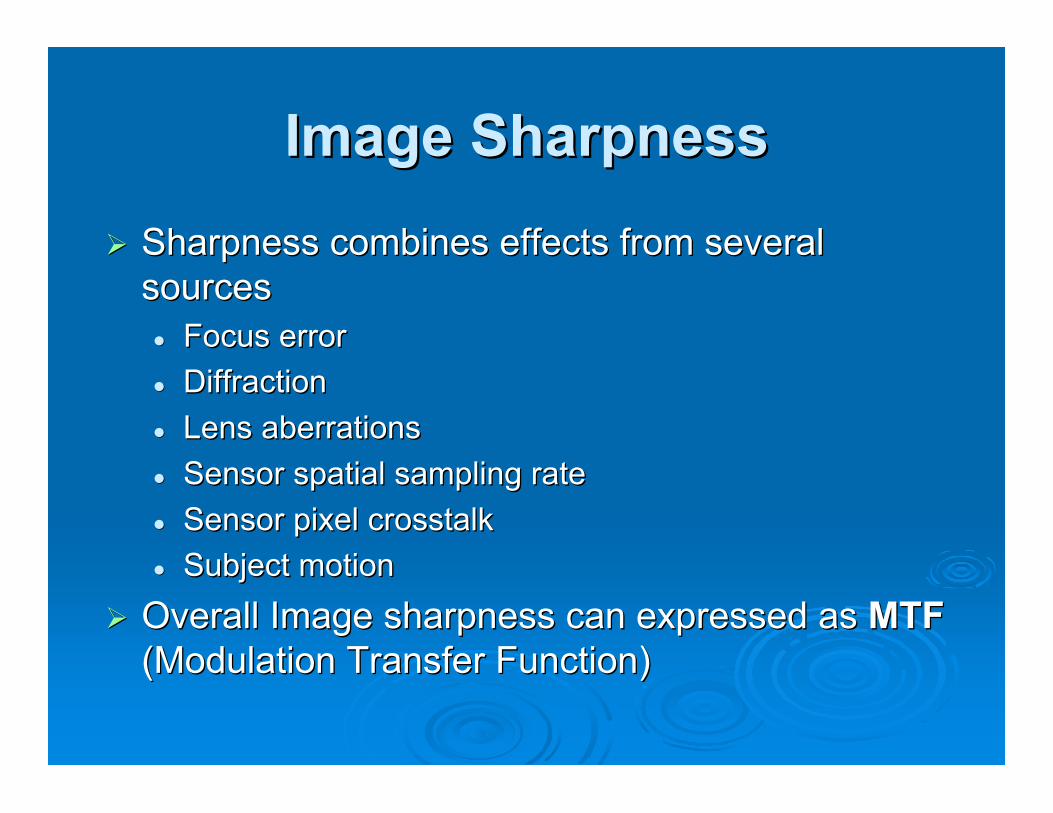
Image Sharpness• Sharpness combines effects from several
sources• Focus error• Diffraction• Lens aberrations• Sensor spatial sampling rate
Image Sharpness • Sharpness combines effects from several
sources • Focus error • Diffraction • Lens aberrations • Sensor spatial sampling rate •• Sensor pixel crosstalkSensor pixel crosstalk •• Subject motionSubject motion
•• Overall Image sharpness can expressed asOverall Image sharpness can expressed as MTFMTF (Modulation Transfer Function)(Modulation Transfer Function)
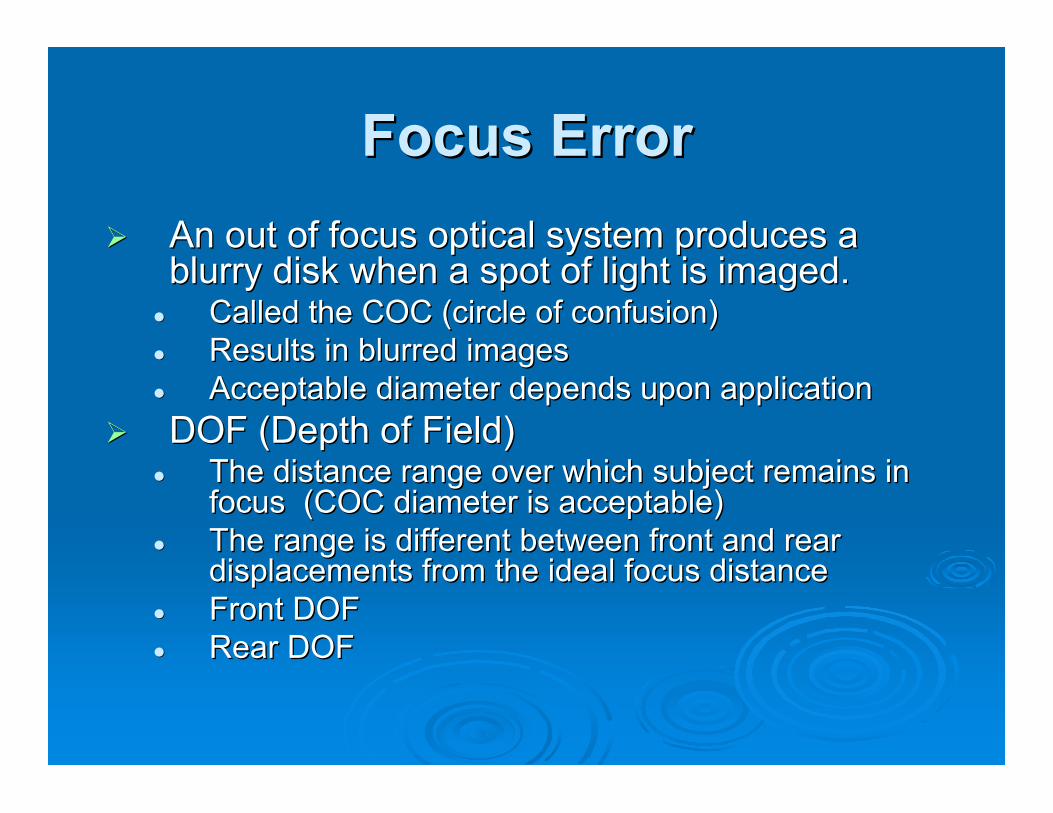
Focus Error• An out of focus optical system produces a
blurry disk when a spot of light is imaged.• Called the COC (circle of confusion)• Results in blurred images• Acceptable diameter depends upon application
• DOF (Depth of Field)• The distance range over which subject remains in
focus (COC diameter is acceptable)• The range is different between front and rear
• Front DOF• Rear DOF
Focus Error • An out of focus optical system produces a
blurry disk when a spot of light is imaged. • Called the COC (circle of confusion) • Results in blurred images • Acceptable diameter depends upon application
• DOF (Depth of Field) • The distance range over which subject remains in
focus (COC diameter is acceptable) • The range is different between front and rear
• Front DOF • Rear DOF
displacements from the ideal focus distancedisplacements from the ideal focus distance

• DOF = c * N * (1+M/p) / (M^2 * (1 ± (N * c) / (f * M)))Use + for front DOF, - for rear DOF
• Where:c = diameter of largest acceptable circle of confusionN = f-number
DOF Formula • DOF =
c * N * (1+M/p) / (M^2 * (1 ± (N * c) / (f * M))) Use + for front DOF, - for rear DOF
• Where: c = diameter of largest acceptable circle of confusion N = f-number M = magnificationM = magnification p = pupil magnificationp = pupil magnification f = focal length of lensf = focal length of lens
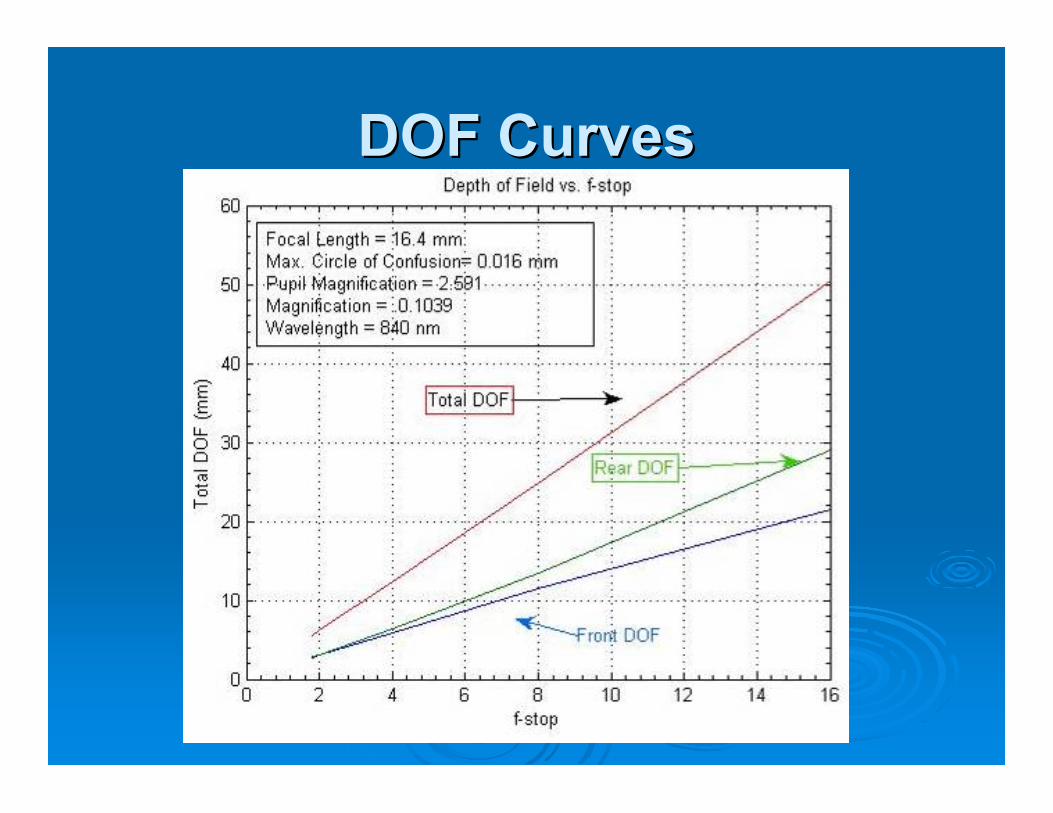
DOF CurvesDOF Curves
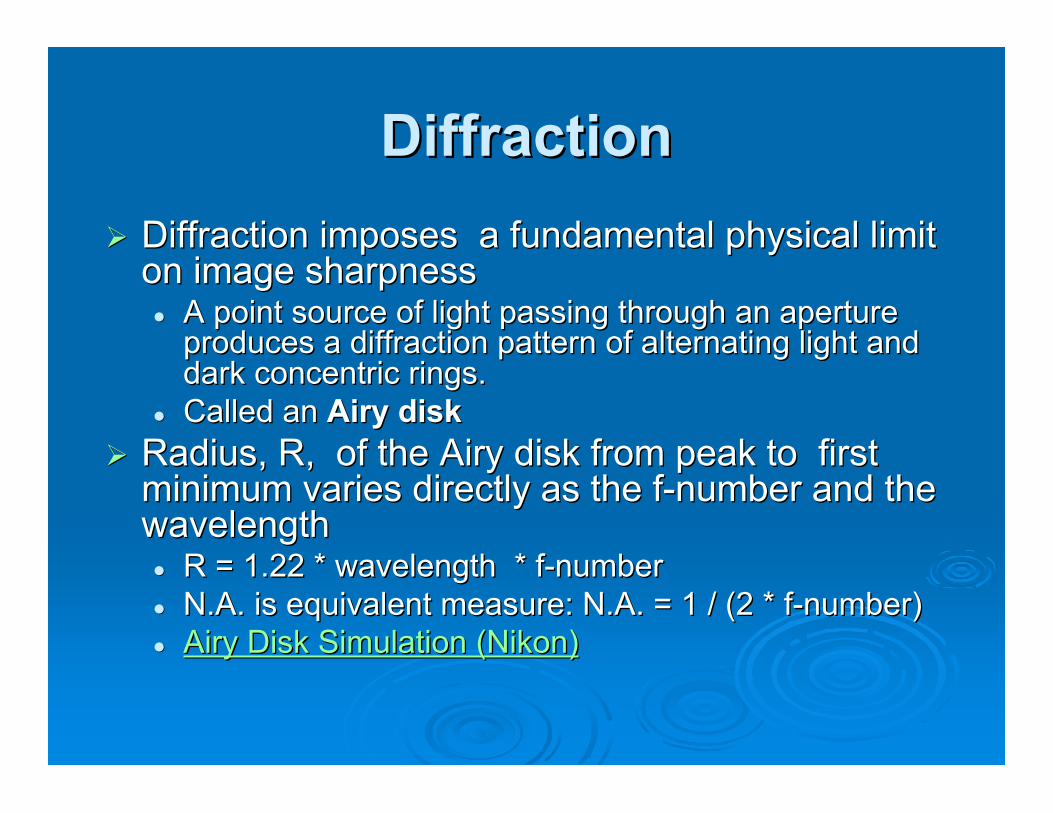
Diffraction• Diffraction imposes a fundamental physical limit
on image sharpness• A point source of light passing through an aperture
produces a diffraction pattern of alternating light anddark concentric rings.
• Called an Airy disk• Radius, R, of the Airy disk from peak to first
Diffraction • Diffraction imposes a fundamental physical limit
on image sharpness • A point source of light passing through an aperture
produces a diffraction pattern of alternating light anddark concentric rings.
• Called an Airy disk • Radius, R, of the Airy disk from peak to first
minimum varies directly as the f-number and theminimum varies directly as the f-number and the wavelengthwavelength •• R = 1.22 * wavelength * f-numberR = 1.22 * wavelength * f-number •• N.A. is equivalent measure: N.A. = 1 / (2 * f-number)N.A. is equivalent measure: N.A. = 1 / (2 * f-number) •• Airy Disk Simulation (Nikon)Airy Disk Simulation (Nikon)
Lens Resolution and f-number
• Lenses are usually aberration limited atlow f-numbers (large aperture)
• At high f-numbers, lens resolutionbecomes diffraction limited.• In the NIR, diffraction results in almost a 2:1
reduction in resolution relative to visible light.•• For many high-quality lenses, f-8 throughFor many high-quality lenses, f-8 through
f-11 produces the best balance betweenf-11 produces the best balance between aberrations and diffractionaberrations and diffraction
Lens Resolution and f-number
• Lenses are usually aberration limited at low f-numbers (large aperture)
• At high f-numbers, lens resolution becomes diffraction limited. • In the NIR, diffraction results in almost a 2:1
reduction in resolution relative to visible light.
Quantifying Sharpness UsingMTF
• Traditional method of measuring MTF is by humanobservation of a resolution chart image.• value is subjective• typically yields optimistic MTF at about 2-5% modulation
• MTF can be objectively measured using the slanted-edge method.• Requires an image with a sharp, slanted dark/light edge and
suitable software [Imatest]• ISO 12233:2000 Photography -Electronic still picture cameras –
Resolution measurements
Quantifying Sharpness Using MTF
• Traditional method of measuring MTF is by humanobservation of a resolution chart image. • value is subjective • typically yields optimistic MTF at about 2-5% modulation
• MTF can be objectively measured using the slanted-edge method. • Requires an image with a sharp, slanted dark/light edge and
suitable software [Imatest] • ISO 12233:2000 Photography -Electronic still picture cameras –
Resolution measurements •• Complete MTF specification must include a modulationComplete MTF specification must include a modulation
level, a wavelength, and overshoot limit. For example:level, a wavelength, and overshoot limit. For example: •• MTF at 60%, 840nm, is 4 line-pairs/mm with edge traceMTF at 60%, 840nm, is 4 line-pairs/mm with edge trace
overshoot less than 5%overshoot less than 5%
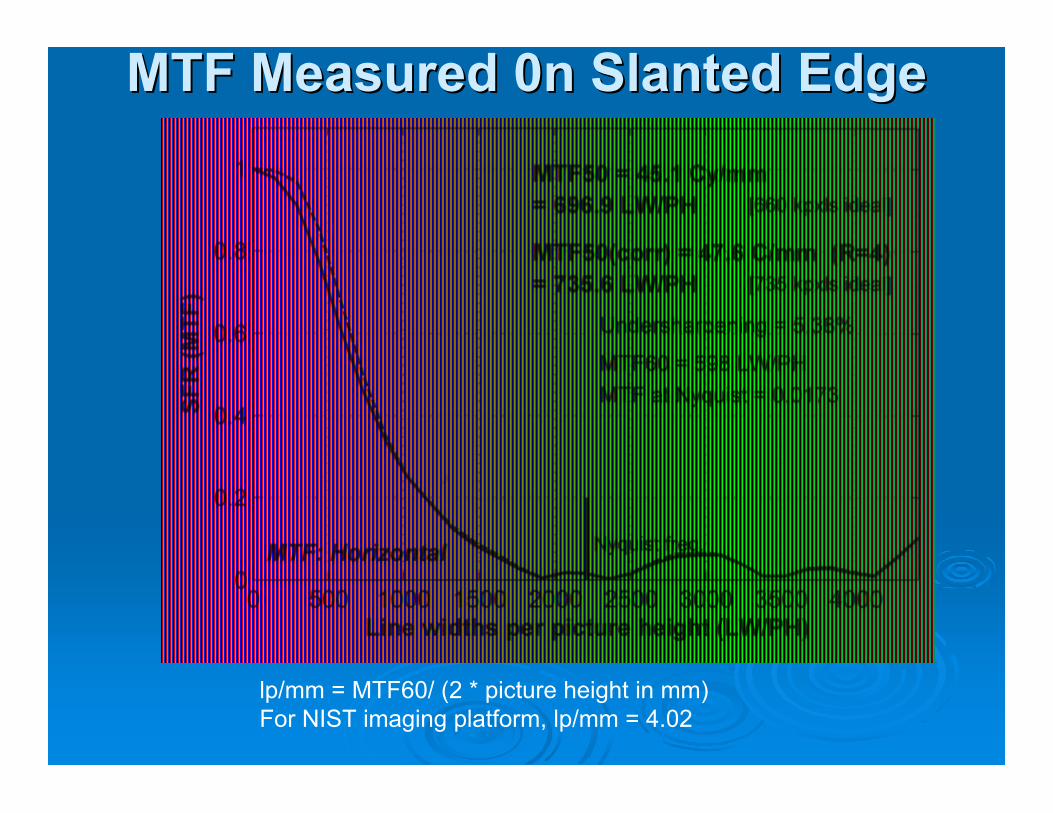
MTF Measured 0n Slanted EdgeMTF Measured 0n Slanted Edge
lp/mm = MTF60/ (2 * picture height in mm) For NIST imaging platform, lp/mm = 4.02

Edge ProfileEdge Profile
Digital Signal Processing ofImage
• MTF can be artificially increased by digitalsharpening.
• Excessive sharpening will produceovershoot and ringing on edges.
• Edge profile will show this distortion
Digital Signal Processing of Image
• MTF can be artificially increased by digital sharpening.
• Excessive sharpening will produce overshoot and ringing on edges.
• Edge profile will show this distortion •• The edge profile can be produced byThe edge profile can be produced by
commercial software [commercial software [ImatestImatest].].

Under-SharpenedUnder-Sharpened MTF60 = 376 LW/PHMTF60 = 376 LW/PH
Over-SharpenedOver-Sharpened MTF60 = 809 LW/PHMTF60 = 809 LW/PH
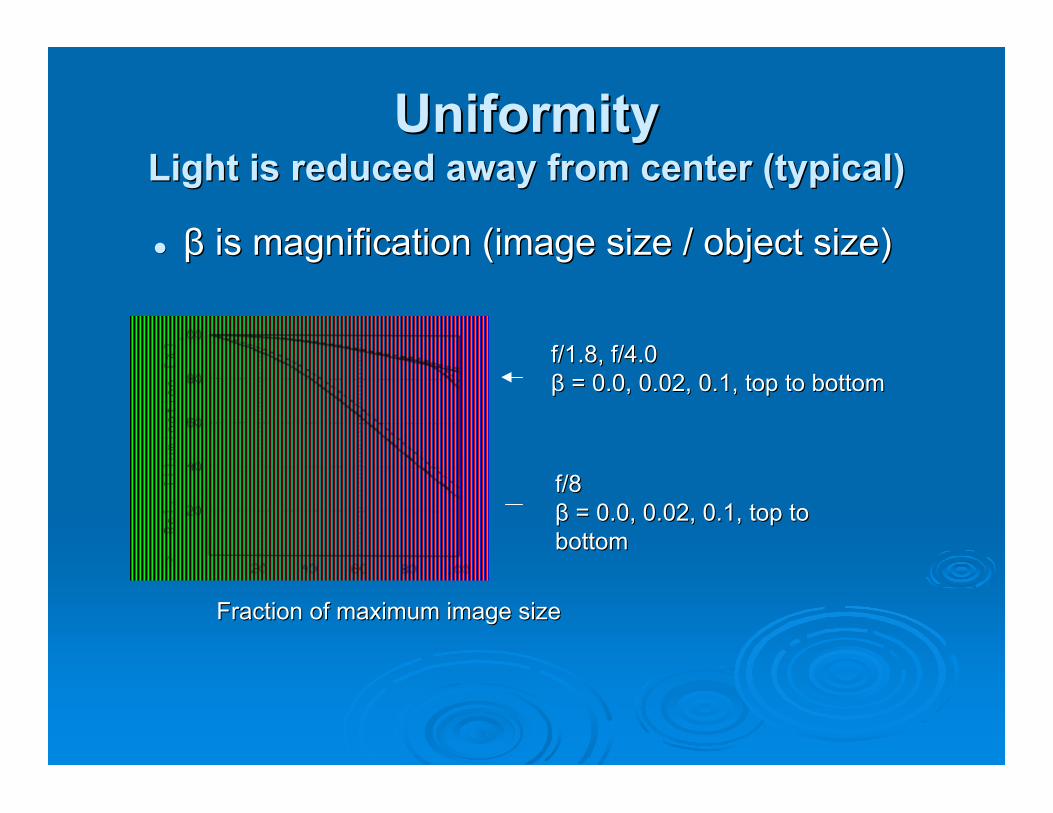
UniformityLight is reduced away from center (typical)
• β is magnification (image size / object size)
Uniformity Light is reduced away from center (typical)
• β is magnification (image size / object size)
Fraction of maximum image sizeFraction of maximum image size
f/1.8, f/4.0f/1.8, f/4.0 ββ = 0.0, 0.02, 0.1, top to bottom= 0.0, 0.02, 0.1, top to bottom
f/8f/8 ββ = 0.0, 0.02, 0.1, top to= 0.0, 0.02, 0.1, top to bottombottom
Lens Aberrations
• Non-ideal lens characteristics degrade theimage in many ways
• Every lens exhibits these aberrations tosome degree.• The lens designer uses multiple optical
Lens Aberrations
• Non-ideal lens characteristics degrade the image in many ways
• Every lens exhibits these aberrations to some degree. • The lens designer uses multiple optical
elements to reduce aberrations.elements to reduce aberrations.
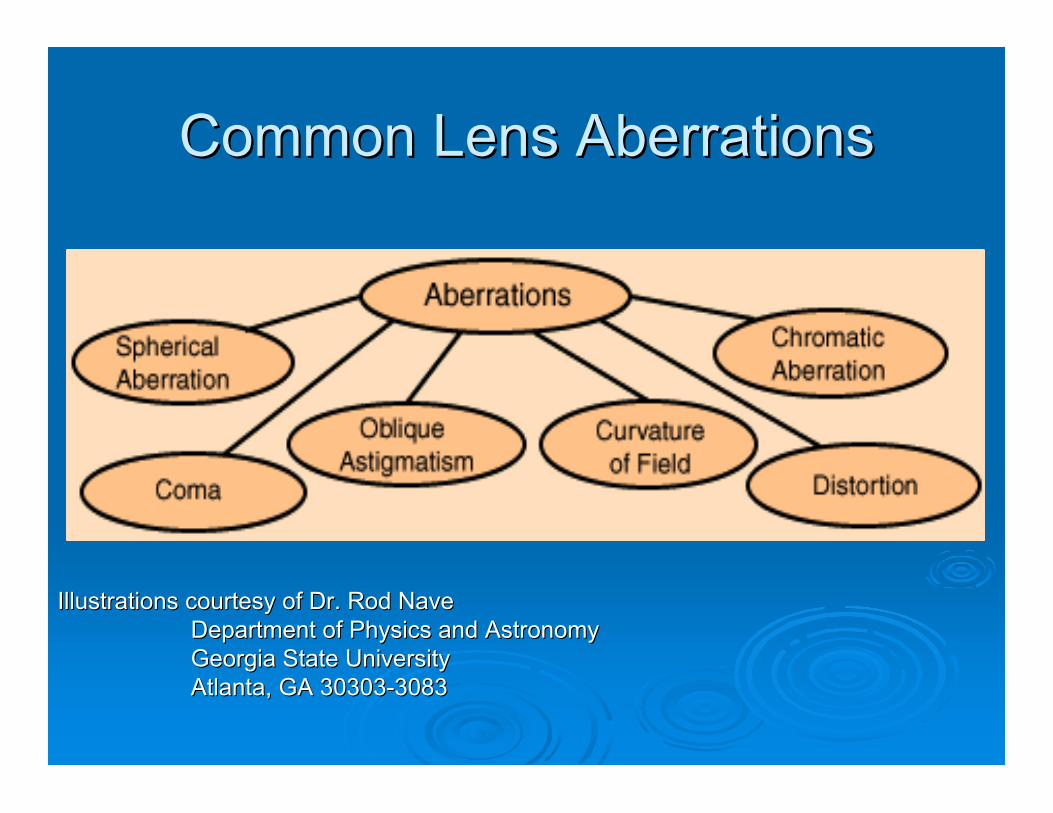
Common Lens AberrationsCommon Lens Aberrations
Illustrations courtesy of Dr. Rod NaveIllustrations courtesy of Dr. Rod Nave Department of Physics and AstronomyDepartment of Physics and Astronomy Georgia State UniversityGeorgia State University Atlanta, GA 30303-3083Atlanta, GA 30303-3083

Chromatic AberrationChromatic Aberration Light of Different WavelengthsLight of Different Wavelengths Focus at Different DistancesFocus at Different Distances

DistortionDistortion
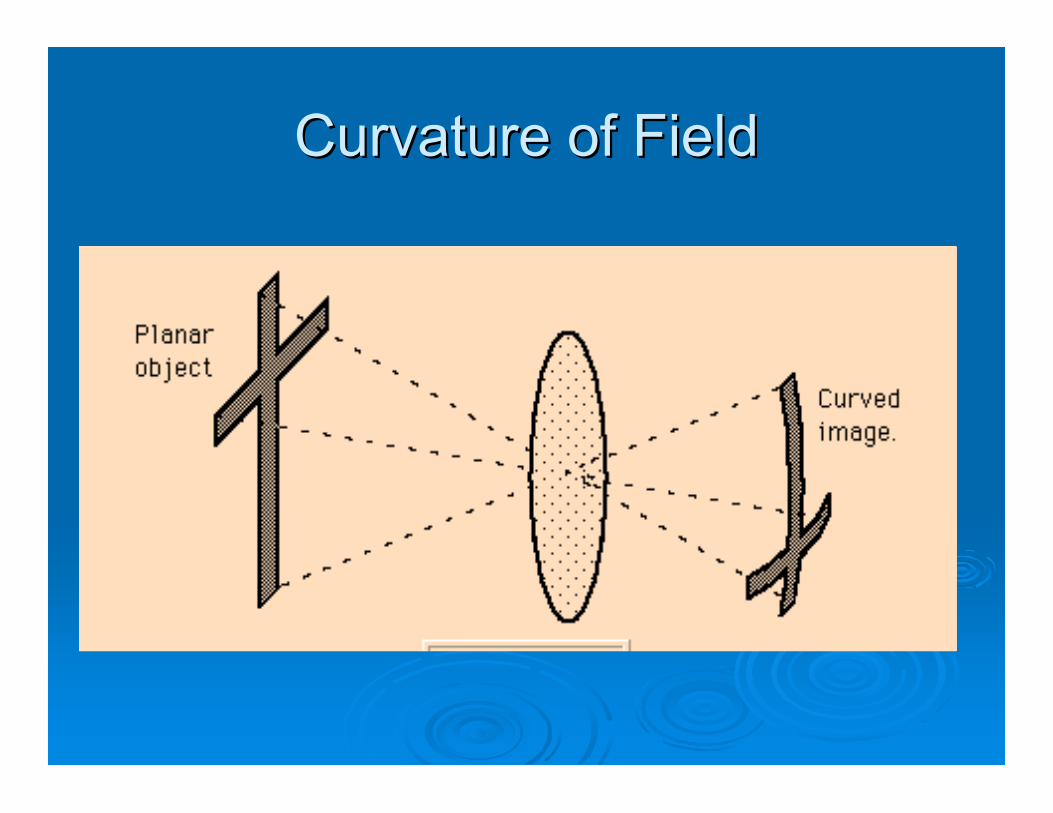
Curvature of FieldCurvature of Field
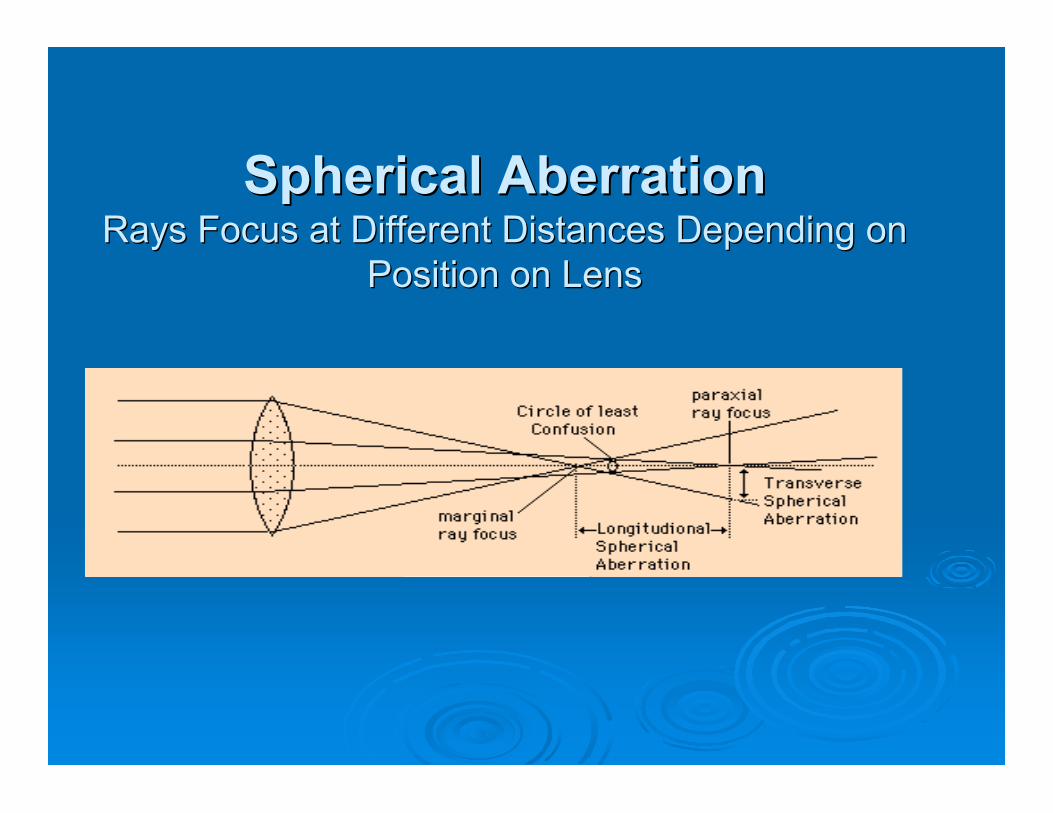
Spherical AberrationSpherical Aberration Rays Focus at Different Distances Depending onRays Focus at Different Distances Depending on
Position on LensPosition on Lens
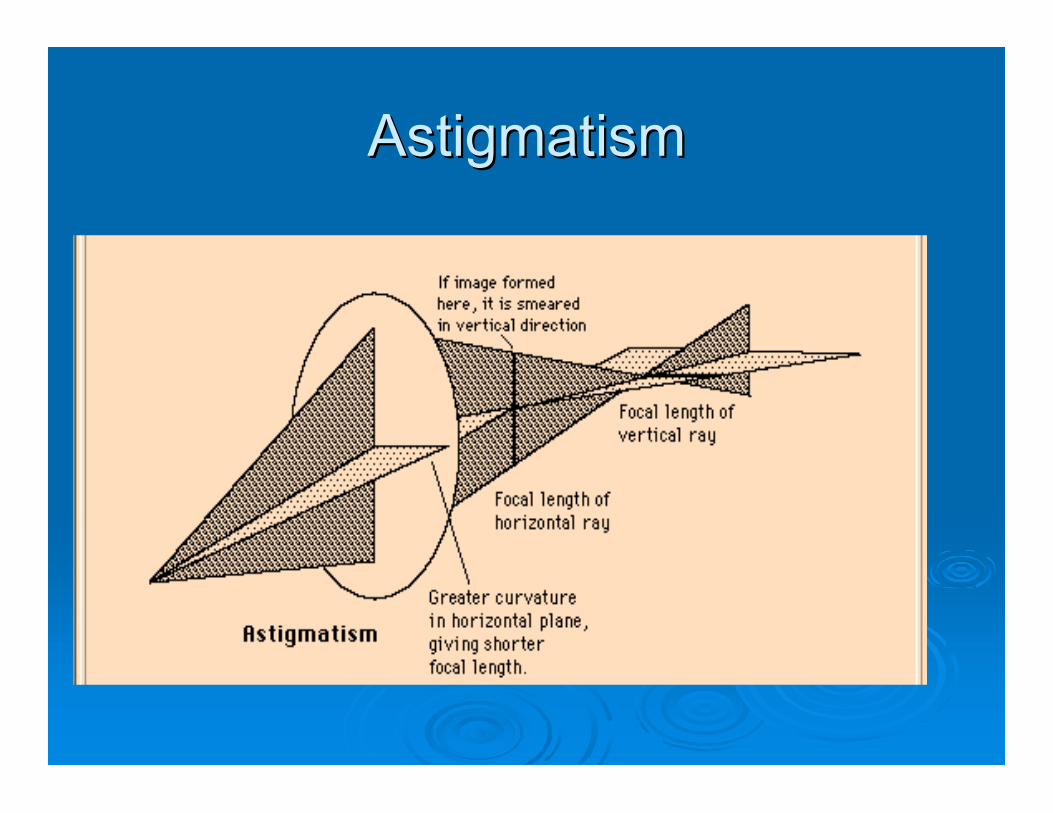
AstigmatismAstigmatism

Coma Produces Trailing Comet-likeComa Produces Trailing Comet-like Tail in ImageTail in Image
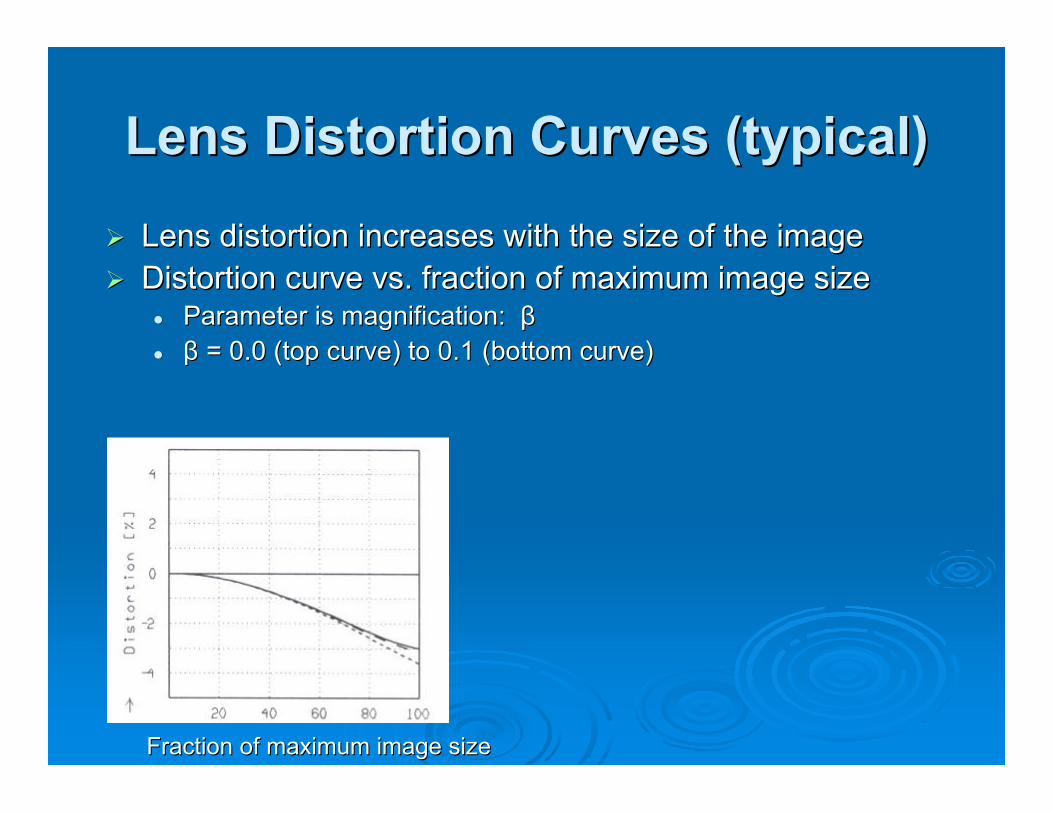
Lens Distortion Curves (typical)• Lens distortion increases with the size of the image• Distortion curve vs. fraction of maximum image size
• Parameter is magnification: β• β = 0.0 (top curve) to 0.1 (bottom curve)
Lens Distortion Curves (typical) • Lens distortion increases with the size of the image • Distortion curve vs. fraction of maximum image size
• Parameter is magnification: β • β = 0.0 (top curve) to 0.1 (bottom curve)
Fraction of maximum image sizeFraction of maximum image size
The CameraThe Camera
The NIR Camera• Controls image acquisition, display, and control.• Must not have NIR block filter installed
• NIR block filter is installed on nearly all commercialcameras to reduce blurring caused by non-optimization in the NIR
• Must not have color filter on sensor• Installed on most commercial color cameras
•
sampling
The NIR Camera • Controls image acquisition, display, and control. • Must not have NIR block filter installed
• NIR block filter is installed on nearly all commercial cameras to reduce blurring caused by non-optimization in the NIR
• Must not have color filter on sensor • Installed on most commercial color cameras
•• Must not have anti-aliasing diffuser installedMust not have anti-aliasing diffuser installed Often used to avoid aliasing effects from under-Often used to avoid aliasing effects from under-•
sampling

The IlluminatorThe Illuminator
Illuminator Requirements
• Sufficient light to produce low-noiseimages at the desired f-stop
• Uniform coverage• Reproducible results require uniform
illumination over the object, over the entire
Illuminator Requirements
• Sufficient light to produce low-noise images at the desired f-stop
• Uniform coverage • Reproducible results require uniform
illumination over the object, over the entire permissible positional range of eye locations.permissible positional range of eye locations.
•• Illumination must not injure the eyeIllumination must not injure the eye
NIR Imaging
• Iris imaging in the near-infrared (NIR)improves iris detail with dark irises.• 700-900 nm range is commonly used
• For blue irises, infrared illumination mayproduce less iris detail than visible light
NIR Imaging
• Iris imaging in the near-infrared (NIR) improves iris detail with dark irises. • 700-900 nm range is commonly used
• For blue irises, infrared illumination may produce less iris detail than visible light •• Broad band sensor and optics can captureBroad band sensor and optics can capture
both NIR and visible light.both NIR and visible light.

Effects of IlluminationWavelength
Effects of Illumination Wavelength
Blue IrisBrown Iris
Infrared Illumination
http://msp.pmit.edu.au
Visible Illumination
Illuminator Safety• High illumination levels can cause permanent
eye damage• NIR illumination is particularly hazardous• The eye does not respond with protective
mechanisms (aversion, blinking, pupil contraction)• Application requirements call for high light levels
• Depth of field strongly affects usability• Typically achieved by increasing f-number• Required light level increases as square of f-number
•
•
Illuminator Safety • High illumination levels can cause permanent
eye damage • NIR illumination is particularly hazardous • The eye does not respond with protective
mechanisms (aversion, blinking, pupil contraction) • Application requirements call for high light levels
• Depth of field strongly affects usability • Typically achieved by increasing f-number • Required light level increases as square of f-number
•
•
Short exposure time reduces motion artifactShort exposure time reduces motion artifact •• Required light level increases with reduced exposure timeRequired light level increases with reduced exposure time
Signal/noise ratio is improved as light level increasesSignal/noise ratio is improved as light level increases
NIR Eye Safety• NIR (near infrared) illuminators may pose
safety issues• The eye does not respond to NIR• Does not protect itself as with visible light
• Pupil contraction• Avoidance• Blinking
•
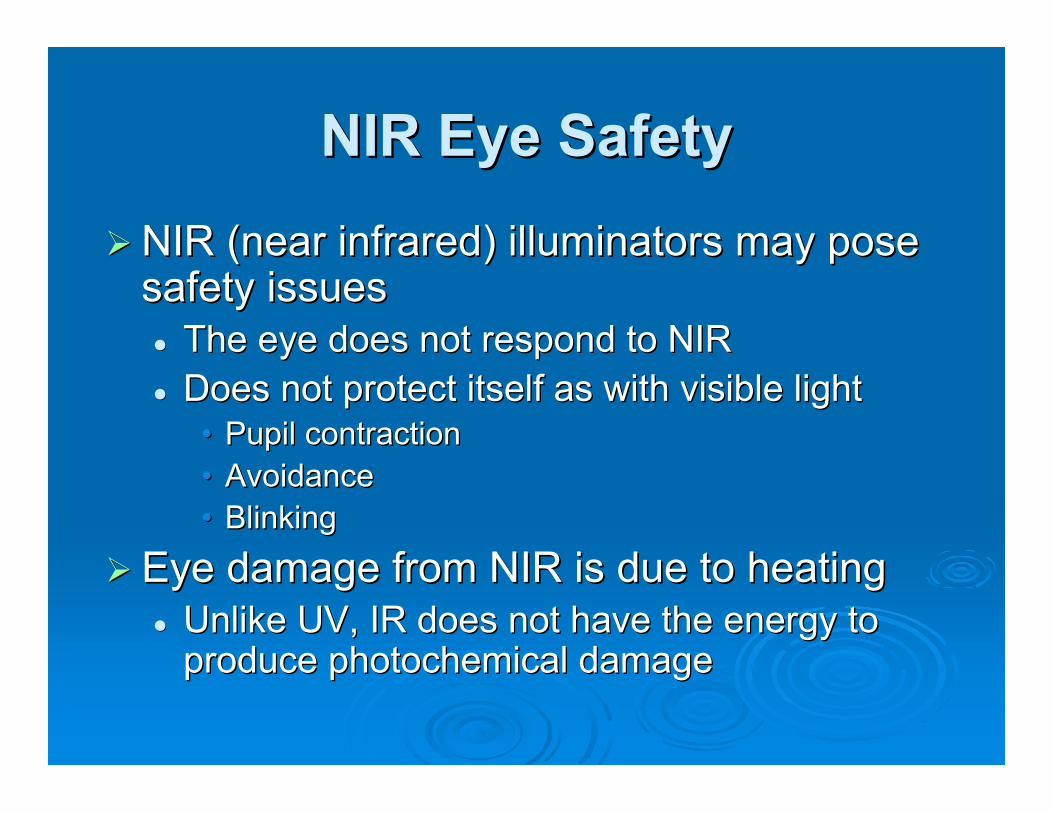
NIR Eye Safety • NIR (near infrared) illuminators may pose
safety issues • The eye does not respond to NIR • Does not protect itself as with visible light
• Pupil contraction • Avoidance • Blinking
•
•• Eye damage from NIR is due to heatingEye damage from NIR is due to heating Unlike UV, IR does not have the energy toUnlike UV, IR does not have the energy to produce photochemical damageproduce photochemical damage
NIR Eye Safety (2)• Small and extended sources
• Different safety limits for small and extendedsources
• LED is a small source• Eye produces focused image on retina
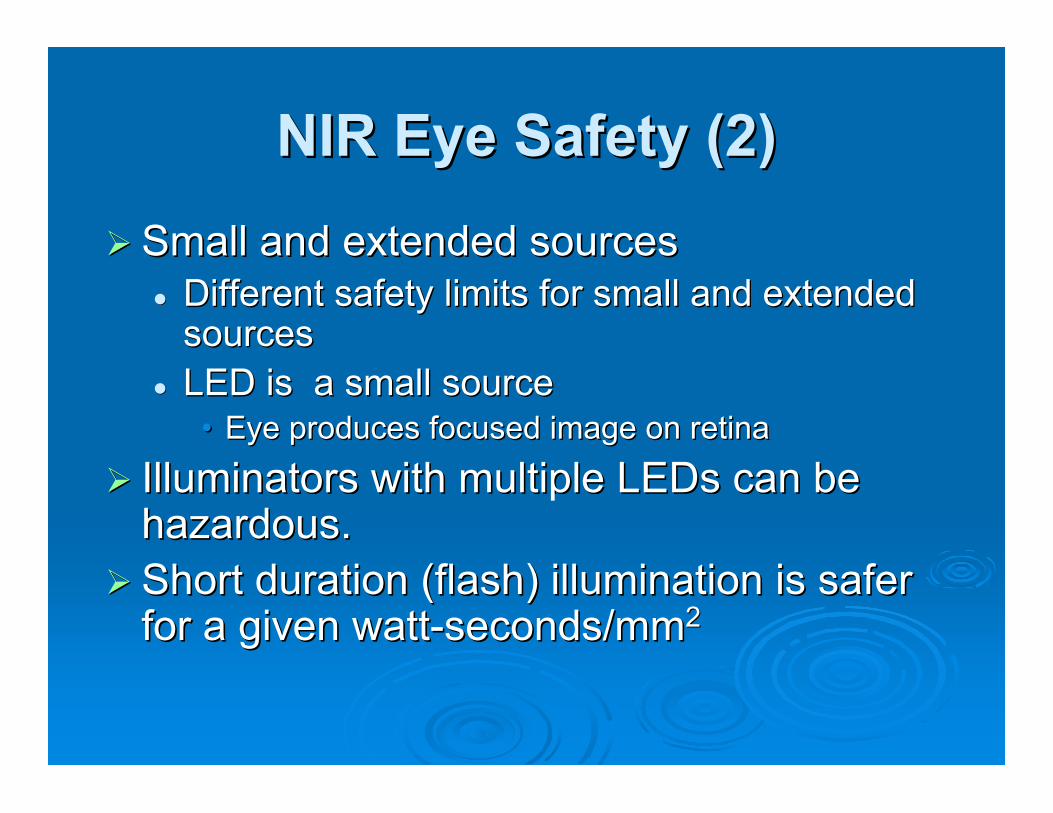
• Illuminators with multiple LEDs can behazardous.hazardous.
•• Short duration (flash) illumination is saferShort duration (flash) illumination is safer for a given watt-seconds/mmfor a given watt-seconds/mm22
NIR Eye Safety (2) • Small and extended sources
• Different safety limits for small and extended sources
• LED is a small source • Eye produces focused image on retina
• Illuminators with multiple LEDs can be
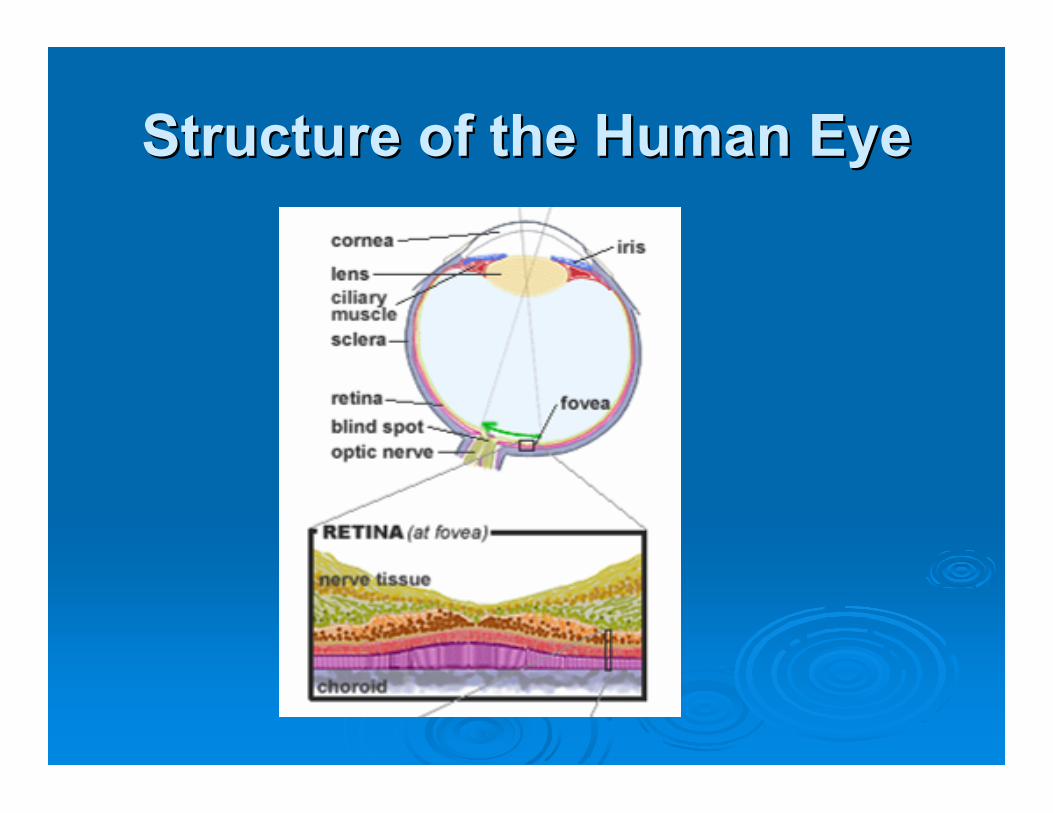
Structure of the Human EyeStructure of the Human Eye
Geometry of Retinal Exposure[ICNIRP]
Geometry of Retinal Exposure [ICNIRP]
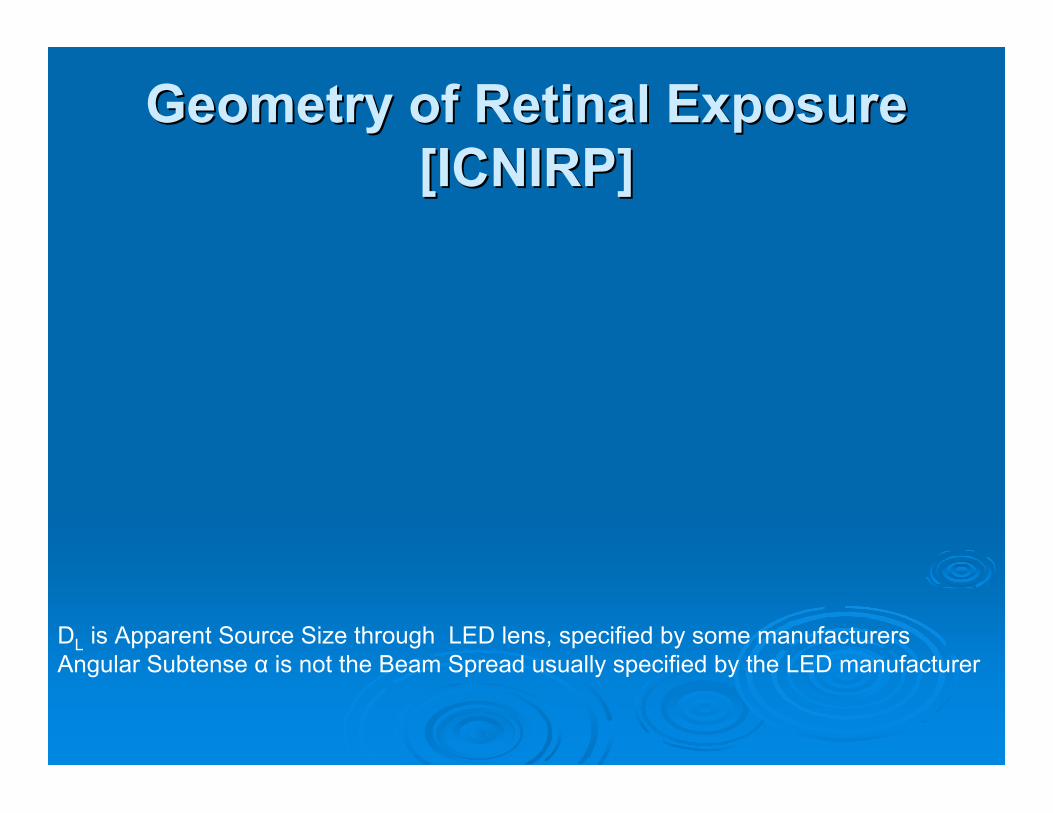
DL is Apparent Source Size through LED lens, specified by some manufacturers Angular Subtense α is not the Beam Spread usually specified by the LED manufacturer
Extended and Small Sources ofNIR
• Extended sources (diffuse light)• Can cause damage to cornea, lens and retina
• Small source safety for the retina• Small, bright emitters can be imaged onto the
retina causing permanent injury.
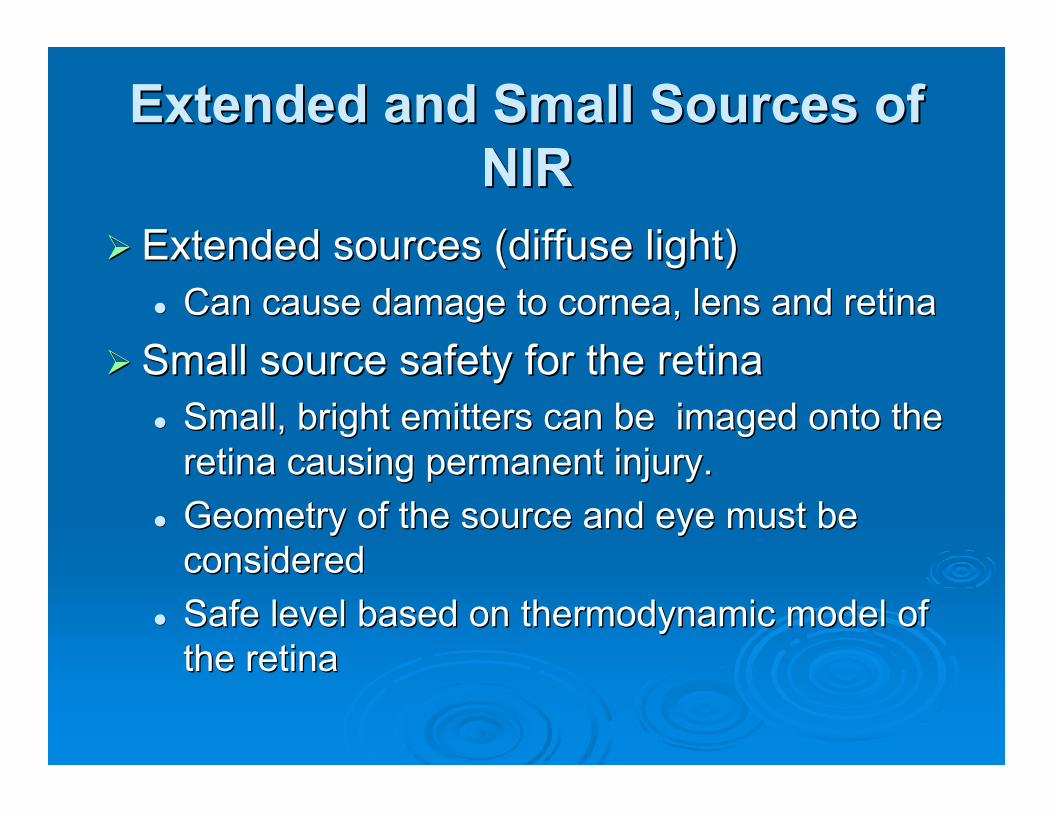
Extended and Small Sources of NIR
• Extended sources (diffuse light) • Can cause damage to cornea, lens and retina
• Small source safety for the retina • Small, bright emitters can be imaged onto the
retina causing permanent injury. •• Geometry of the source and eye must beGeometry of the source and eye must be
consideredconsidered •• Safe level based on thermodynamic model ofSafe level based on thermodynamic model of
the retinathe retina
• Radiance Lλ is the source brightness Measuredin Watts sr-1 cm-2
• Conserved through lenses• Requires knowledge of the apparent source diameter.
• This is supplied by some manufacturers• See Vishay Semiconductors, TSAL5100
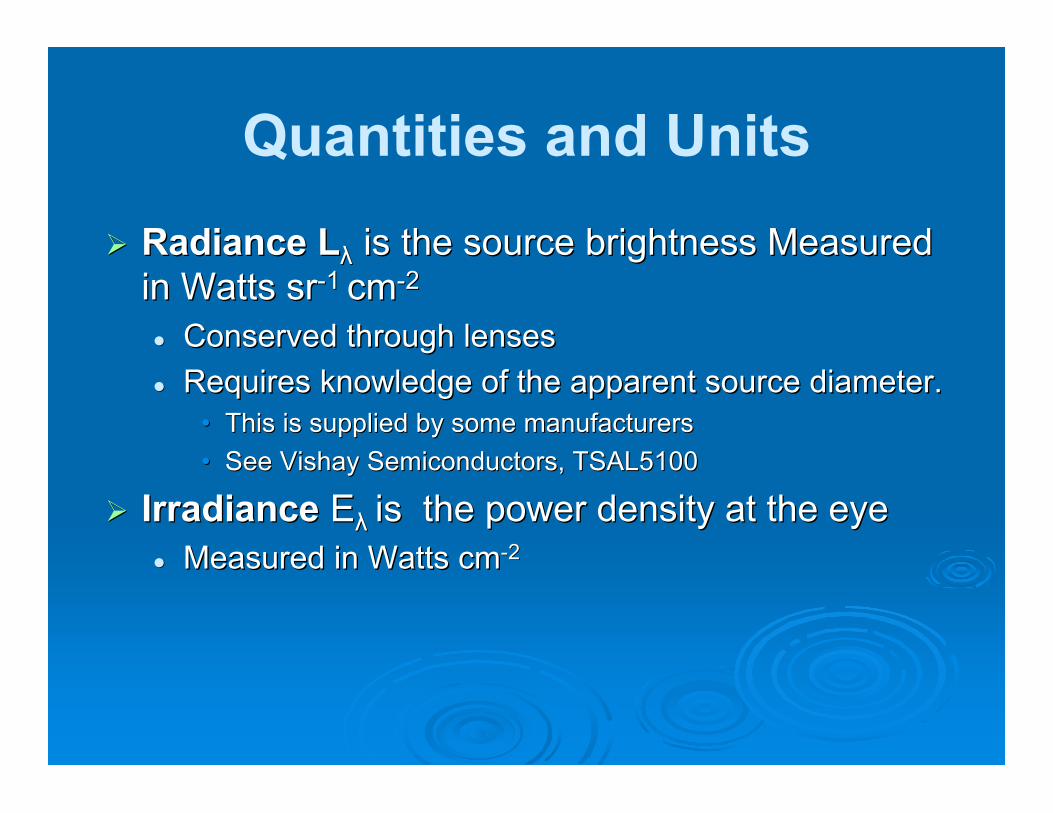
Quantities and Units • Radiance Lλ is the source brightness Measured
in Watts sr-1 cm-2
• Conserved through lenses • Requires knowledge of the apparent source diameter.
• This is supplied by some manufacturers • See Vishay Semiconductors, TSAL5100
•• IrradianceIrradiance EEλλ isis the power density at the eyethe power density at the eye •• Measured in Watts cmMeasured in Watts cm-2-2
Protecting Cornea and Lens fromNIR Radiation Damage [ACGIH]
Summation is over λ range where light level is significant
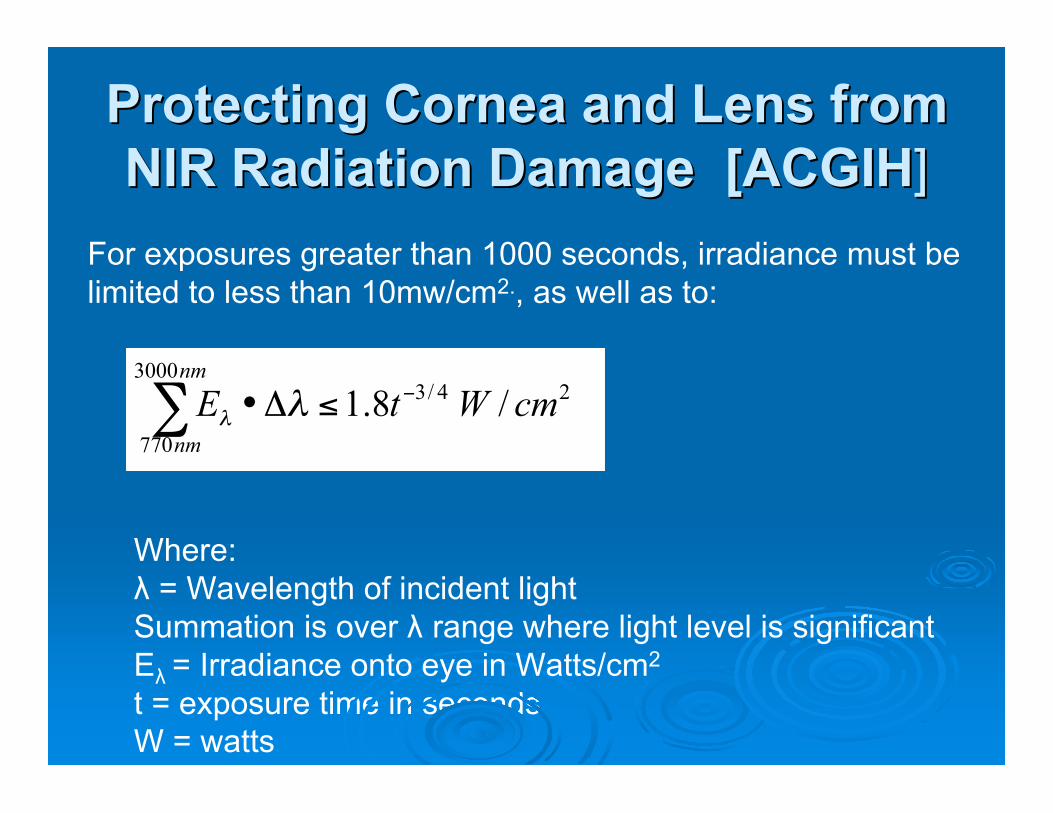
Protecting Cornea and Lens from NIR Radiation Damage [ACGIH]
For exposures greater than 1000 seconds, irradiance must be limited to less than 10mw/cm2., as well as to:
24/3
3000
770
/8.1 cmWtE
nm
nm
!"#•$ %%
Where: λ = Wavelength of incident light
t = exposure time in seconds W = watts
Eλ = Irradiance onto eye in Watts/cm2
- -
Preventing NIR Retinal Damage[ACGIH]
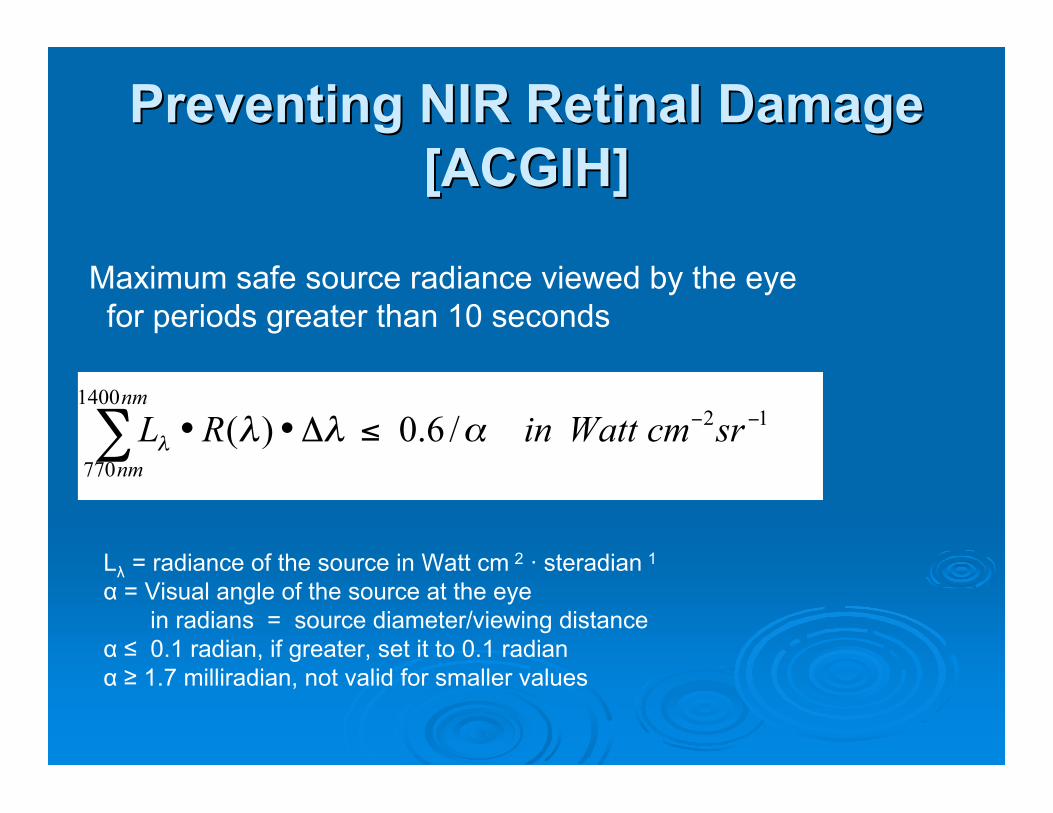
Preventing NIR Retinal Damage [ACGIH]
Maximum safe source radiance viewed by the eye for periods greater than 10 seconds
121400
770
/6.0)( !!"#••$ srcmWattinRL
nm
nm
%&&&
Lλ = radiance of the source in Watt cm 2 · steradian 1
α = Visual angle of the source at the eye in radians = source diameter/viewing distance
α ≤ 0.1 radian, if greater, set it to 0.1 radian α ≥ 1.7 milliradian, not valid for smaller values
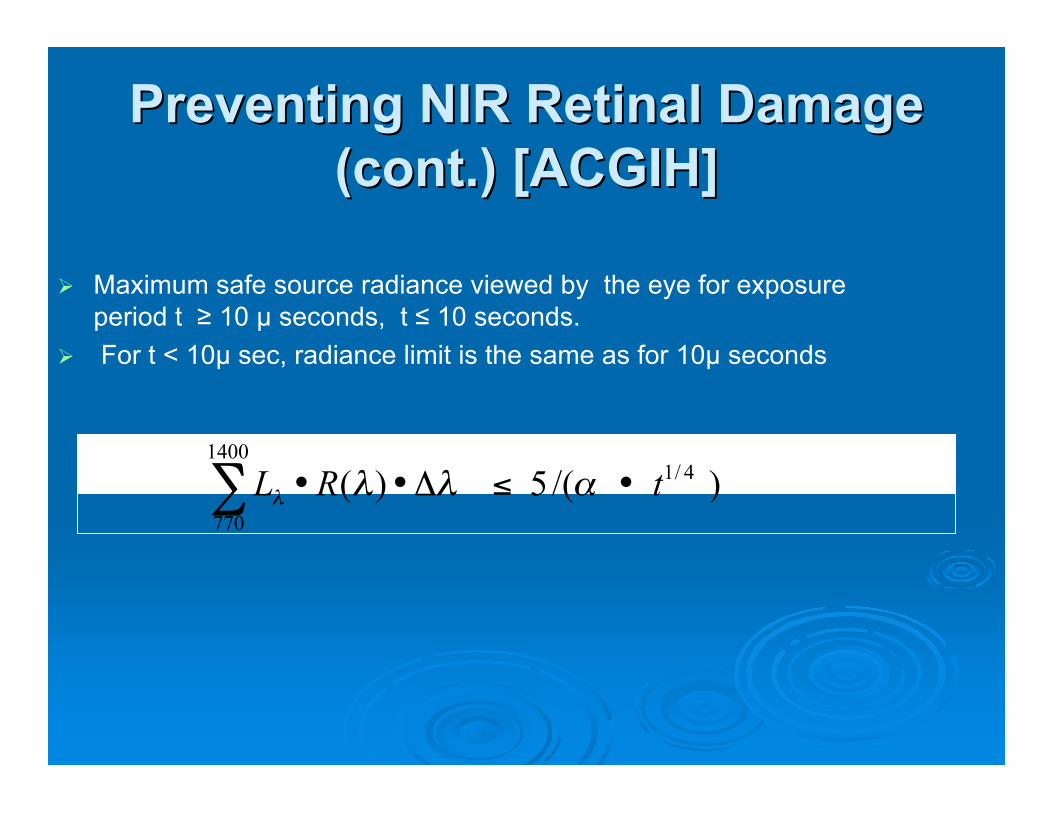
Preventing NIR Retinal Damage(cont.) [ACGIH]
Preventing NIR Retinal Damage (cont.) [ACGIH]
• Maximum safe source radiance viewed by the eye for exposure period t ≥ 10 µ seconds, t ≤ 10 seconds.
• For t < 10µ sec, radiance limit is the same as for 10µ seconds
)/(5)( 4/11400
770
tRL •!"••# $%%%
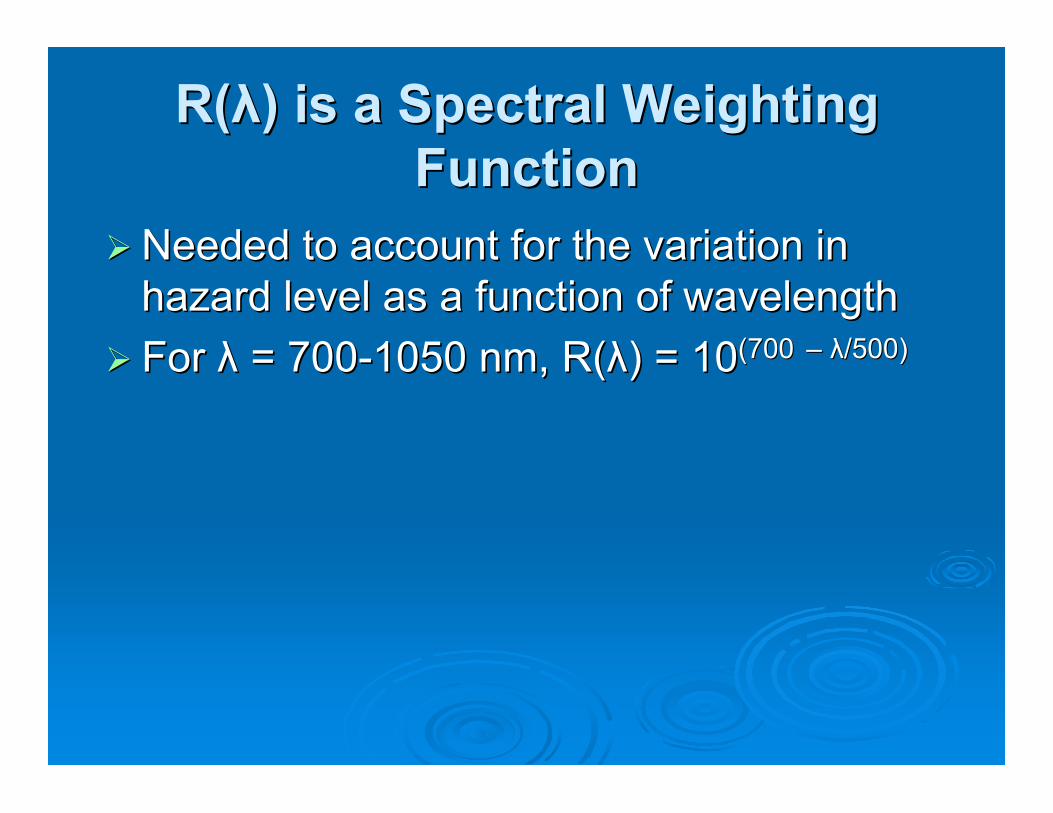
R(λ) is a Spectral WeightingFunction
• Needed to account for the variation inhazard level as a function of wavelength
– λ/500)• For λ = 700-1050 nm, R(λ) = 10(700
R(λ) is a Spectral Weighting Function
• Needed to account for the variation in hazard level as a function of wavelength
– λ/500)• For λ = 700-1050 nm, R(λ) = 10(700
LED Eye Safety Standards
• See References• [ACGIH]• [ICNIRP]• [ICNIRP 2000]• [IEC]
LED Eye Safety Standards
• See References • [ACGIH] • [ICNIRP] • [ICNIRP 2000] • [IEC] •• [ANSI][ANSI]
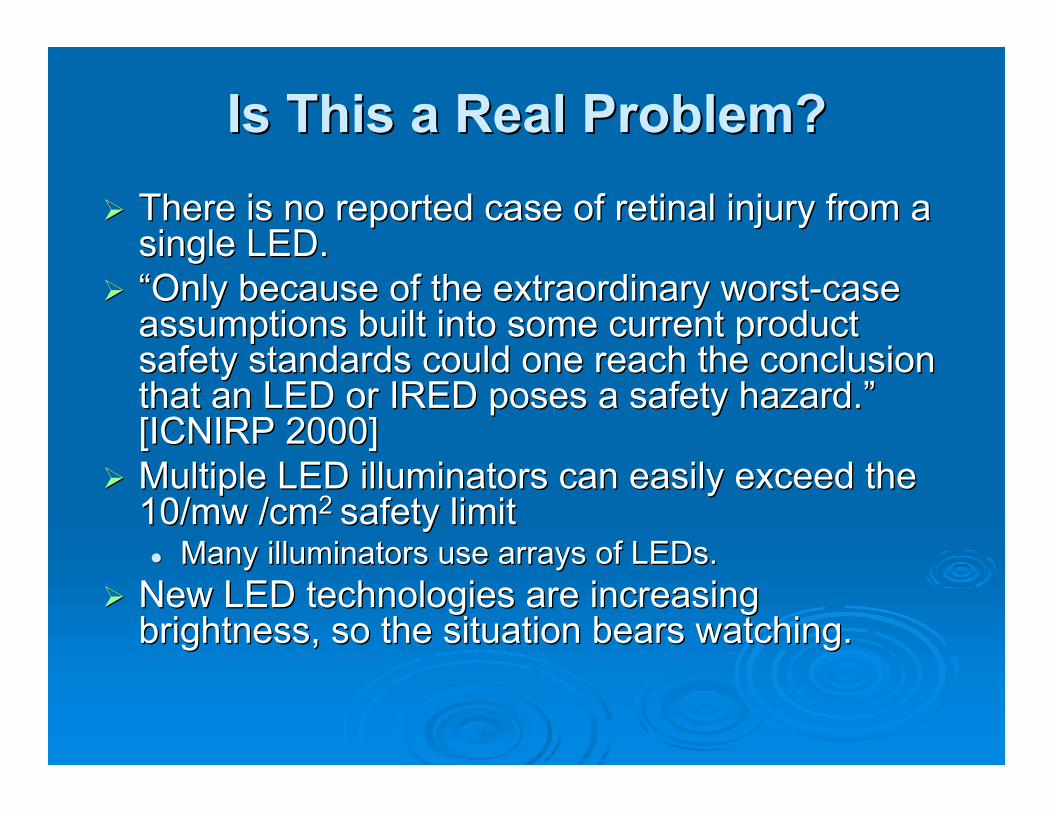
Is This a Real Problem?• There is no reported case of retinal injury from a
single LED.• “Only because of the extraordinary worst-case
assumptions built into some current productsafety standards could one reach the conclusionthat an LED or IRED poses a safety hazard.”[ICNIRP 2000]
Is This a Real Problem? • There is no reported case of retinal injury from a
single LED. • “Only because of the extraordinary worst-case
assumptions built into some current product safety standards could one reach the conclusion that an LED or IRED poses a safety hazard.” [ICNIRP 2000]
•• Multiple LED illuminators can easily exceed theMultiple LED illuminators can easily exceed the 10/mw /cm10/mw /cm22 safety limitsafety limit •• Many illuminators use arrays of LEDs.Many illuminators use arrays of LEDs.
•• New LED technologies are increasingNew LED technologies are increasingbrightness, so the situation bears watching.brightness, so the situation bears watching.

The Subject InterfaceThe Subject Interface
Subject Interface
• Stability of the eye increases accuracy• Avoid motion artifact• Position iris uniformly
• Sources of motion• The body can move in three dimensions
Subject Interface
• Stability of the eye increases accuracy • Avoid motion artifact • Position iris uniformly
• Sources of motion • The body can move in three dimensions •• The head can move independentlyThe head can move independently •• The eye can move independentlyThe eye can move independently
Subject Interface (2)• Both eye and head position must be controlled
• Cold mirror target with crosshairs• Audible feedback• Forehead and/or chin rest.
• Eye motion during exposure causes imageblurring
•• Saccadic motion blurSaccadic motion blur •• eye moves approximately .001eye moves approximately .001””, 60 times/sec, 60 times/sec •• may limit image resolutionmay limit image resolution
Subject Interface (2) • Both eye and head position must be controlled
• Cold mirror target with crosshairs • Audible feedback • Forehead and/or chin rest.
• Eye motion during exposure causes image blurring

References• [Daugman] John Daugman, How Iris Recognition Works, IEEE Trans.CSVT2004,pp.21 -
30.• [IBG] International Biometrics Group, Independent Testing of Iris Recognition Technology
Final Report, May 2005.• [Imatest] http://www.imatest.com/• [ACGIH] American Conference of Government Industrial Hygienists, “Eye Safety With Near
Infra-Red Illuminators”, 1981.• [ICNIRP 2000] “ICNIRP statement on light-emitting diodes (LEDs) and Laser Diodes:
Implications for Hazard Assessment”, Health Physics, Vol. 78, Number 6.• [ICNIRP] International Commission on Non-ionizing Radiation Protection, “Guidelines on
Limits of Exposure to Broad-Band Incoherent Optical Radiation (0.38 to 3µM)”, 1997.• [IEC] 60825-1 International Electrotechnical Commission, “Safety of laser products, Part1:
Equipment classification, requirements and user’s guide”, 2001• [ANSI] American National Standards Institute. “American National Standard for the safe
•
References • [Daugman] John Daugman, How Iris Recognition Works, IEEE Trans.CSVT2004,pp.21 -
30. • [IBG] International Biometrics Group, Independent Testing of Iris Recognition Technology
Final Report, May 2005. • [Imatest] http://www.imatest.com/ • [ACGIH] American Conference of Government Industrial Hygienists, “Eye Safety With Near
Infra-Red Illuminators”, 1981. • [ICNIRP 2000] “ICNIRP statement on light-emitting diodes (LEDs) and Laser Diodes:
Implications for Hazard Assessment”, Health Physics, Vol. 78, Number 6. • [ICNIRP] International Commission on Non-ionizing Radiation Protection, “Guidelines on
Limits of Exposure to Broad-Band Incoherent Optical Radiation (0.38 to 3µM)”, 1997. • [IEC] 60825-1 International Electrotechnical Commission, “Safety of laser products, Part1:
Equipment classification, requirements and user’s guide”, 2001 • [ANSI] American National Standards Institute. “American National Standard for the safe
•
use of lasers and LEDs used in optical fiber transmission systems. Orlando, FL: Laseruse of lasers and LEDs used in optical fiber transmission systems. Orlando, FL: Laser Institute of America; ANSI Z136.2 1988 (2Institute of America; ANSI Z136.2 1988 (2ndnd edition,1988).edition,1988). [CIE] Commission International de l[CIE] Commission International de l’’Eclarirage.Eclarirage. ““Photobiological safety standards forPhotobiological safety standards for lamps.lamps.”” Vienna: CIE; Report of TC 6-38; CIE 134-3-99; 1999.Vienna: CIE; Report of TC 6-38; CIE 134-3-99; 1999.
Top Related
Copyright © 2022 FDOKUMEN

