


Bahasa
Halaman
Hukum

Journal of Tropical Ecologyhttp://journals.cambridge.org/TRO
Additional services for Journal of Tropical Ecology:
Email alerts: Click hereSubscriptions: Click hereCommercial reprints: Click hereTerms of use : Click here
Diet selection is related to breeding status in two frugivorous hornbillspecies of Central Africa
Aaron M. Lamperti, Aaron R. French, Ellen S. Dierenfeld, Mark K. Fogiel, Kenneth D. Whitney, Donald J. Stauffer, KimberlyM. Holbrook, Britta D. Hardesty, Connie J. Clark, John R. Poulsen, Benjamin C. Wang, Thomas B. Smith and V. ThomasParker
Journal of Tropical Ecology / Volume 30 / Issue 04 / July 2014, pp 273 - 290DOI: 10.1017/S0266467414000236, Published online: 23 June 2014
Link to this article: http://journals.cambridge.org/abstract_S0266467414000236
How to cite this article:Aaron M. Lamperti, Aaron R. French, Ellen S. Dierenfeld, Mark K. Fogiel, Kenneth D. Whitney, Donald J. Stauffer, KimberlyM. Holbrook, Britta D. Hardesty, Connie J. Clark, John R. Poulsen, Benjamin C. Wang, Thomas B. Smith and V. ThomasParker (2014). Diet selection is related to breeding status in two frugivorous hornbill species of Central Africa . Journal ofTropical Ecology, 30, pp 273-290 doi:10.1017/S0266467414000236
Request Permissions : Click here
Downloaded from http://journals.cambridge.org/TRO, IP address: 63.251.187.58 on 25 Jun 2014

Journal of Tropical Ecology (2014) 30:273–290. © Cambridge University Press 2014doi:10.1017/S0266467414000236
Diet selection is related to breeding status in two frugivorous hornbillspecies of Central Africa
Aaron M. Lamperti∗,1, Aaron R. French∗, Ellen S. Dierenfeld†,2, Mark K. Fogiel∗,Kenneth D. Whitney∗,3, Donald J. Stauffer∗, Kimberly M. Holbrook‡, Britta D. Hardesty∗,4,Connie J. Clark∗,5, John R. Poulsen∗,5, Benjamin C. Wang∗, Thomas B. Smith∗,6 andV. Thomas Parker∗
∗ Department of Biology, San Francisco State University, 1600 Holloway Avenue, San Francisco, CA 94132, USA† Department of Wildlife Nutrition, Wildlife Conservation Society, 2300 Southern Blvd., Bronx, NY 10460, USA‡ The Nature Conservancy 4245 North Fairfax Drive, Suite 100 Arlington, VA 22203, USA
(Received 29 June 2013; revised 4 May 2014; accepted 5 May 2014)
Abstract: Avian diet selection is hypothesized to be sensitive to seasonal changes in breeding status, but few tests existfor frugivorous tropical birds. Frugivorous birds provide an interesting test case because fruits are relatively deficient inminerals critical for reproduction. Here, we quantify annual patterns of fruit availability and diet for two frugivoroushornbill (Bucerotidae) species over a 5.5-y period to test for patterns of diet selection. Data from the lowland tropicalrain forest of the Dja Reserve, Cameroon, are used to generate two nutritional indices. One index estimates the nutrientconcentration of the diet chosen by Ceratogymna atrata and Bycanistes albotibialis on a monthly basis using 3165 feedingobservations combined with fruit pulp sample data. The second index is an estimate of nutrient concentration of anon-selective or neutral diet across the study area based on tree fruiting phenology, vegetation survey and fruit-pulpsample data. Fifty-nine fruit pulp samples representing 40 species were analysed for 16 nutrient categories to contributeto both indices. Pulp samples accounted for approximately 75% of the observed diets. The results support expectedpatterns of nutrient selection. The two hornbill species selected a diet rich in calcium during the early breeding season(significantly so for B. albotibialis in July and August). Through the brooding and fledging periods, they switched froma calcium-rich diet to one rich in iron and caloric content as well as supplemental protein in the form of invertebrates.Calcium, the calcium to phosphorus ratio and fat concentration were the strongest predictors of breeding success(significant for calcium and Ca : P for B. albotibialis in June). We conclude that hornbills actively select fruit basedon nutritional concentration and mineral concentration and that the indices developed here are useful for assessingfrugivore diet over time.
Key Words: avian, Cameroon, Dja Reserve, frugivory, mineral nutrition, nutrition
1 Corresponding author. Current address: 557 New Boston Road,Norwich, Vermont 05055, USA. Email: [email protected] 4736 Gatesbury Drive, St. Louis, MO 63128, USA3 Department of Biology, University of New Mexico, Albuquerque, NM87131-0001, USA4 CSIRO Wealth from Oceans Flagship, Marine and AtmosphericResearch, Hobart, TAS 7000, Australia5 Nicholas School of the Environment, Duke University, PO Box 90328,Durham, NC 27708, USA6 Center for Tropical Research and Department of Ecology andEvolutionary Biology, University of California, Los Angeles, Box951496, Los Angeles, CA 90095-1496, USA
INTRODUCTION
In the wild, frugivorous birds experience a constantlychanging set of available diet options and a consequentvariation in overall nutrient availability. Dietary needsvary with the demands of the breeding season, moultingand for many, migration (Dhondt & Hochachka 2001,Garcıa-Navas & Sanz 2011, Herrera 1982, Hobson et al.2011, Karr 1976, Leighton & Leighton 1983, Poulinet al. 1992). This study seeks to test the hypothesisthat seasonal shifts in avian frugivore diets will trackreproductive nutritional needs rather than fruitingpatterns. A positive result will imply that avian frugivoresare choosing a fruit diet based on nutritional needs ratherthan simple availability.
274 AARON M. LAMPERTI ET AL.
Previous studies have proposed that seasonal shiftsin diet of tropical frugivorous birds are related toreproductive activity rather than to fruiting patterns(Kannan & James 1999, Karr 1976, Kinnaird & O’Brien1999, Poonswad et al. 2004, Poulin et al. 1992). Datafrom domestic birds indicate that individuals are capableof modifying their behaviour and diet choices to addresschanging mineral needs (Robbins 1993). Perhaps themost universal period of high mineral demand for birds isduring the breeding season, particularly the time leadingup to egg laying. Calcium requirements for egg laying areup to five times that of non-breeding birds. Birds have beenknown to go to great lengths to meet this requirement,including scavenging for bones and other high-calciumobjects (Barclay 1995, Dhondt & Hochachka 2001,Graveland & VanderWal 1996, Nager 2006, Robbins1993, Tilgar et al. 2002).
Tropical avian frugivores may have a hard timemeeting their mineral needs since many fruits are quitedeficient in individual minerals (Robbins 1993). Thuswe might expect to see behavioural responses to periodsof mineral stress such as egg laying and moulting.Specifically, one might expect that during the time leadingup to egg laying, a diet relatively high in calcium wouldbe selected, perhaps at the expense of other nutrients.After eggs are laid, energetic requirements are high forbrooding, so diet selection during this period might befor lipid-rich fruits, i.e. what have been traditionallyconsidered high-quality fruits (Dunn 1980, McKey 1975,Robbins 1993, Sibly et al. 2012). When eggs have hatchedand chicks are growing, protein becomes an importantnutritional component, which may mean a switch tohigher-protein fruits and/or more time spent foragingfor invertebrates and other high-protein, non-fruit foods(Foeken et al. 2008, Kinnaird & O’Brien 1999, Poonswadet al. 2004).
Traditionally, studies of avian nutrition have focusedon macronutrient analysis and energetics (Herrera 1982,McKey 1975, Robbins 1993, Stiles 1993). Existing studiesconcerning mineral nutrition tend to be relevant tocaptive populations and mineral deficiencies (Dierenfeld1996, Robbins 1993). Little work has been doneregarding wild populations, diet selection and mineralnutrition (Barclay 1995, O’Brien et al. 1998, Otten et al.2001, Ruby et al. 2000, Wendeln et al. 2000).
Our objective is to develop a method to quantifythe nutritional content of a frugivore diet and to testhypotheses regarding temporal shifts in diet. First weintroduce a pair of indices, and make a series oflogical assumptions to simplify their calculation forfield measurement. Second, we examine the questionof whether shifts in diet are related to reproductiveactivity rather than fruiting patterns. If reproductiondrives the diet of frugivorous birds, we expect that ashift in concentration of minerals and other nutrients
should be related to periods of reproduction and notseasonal change. We use data for two frugivoroushornbill species, the black-casqued hornbill Ceratogymnaatrata (Temminck, 1835) and the white-thighed hornbillBycanistes albotibialis (Cabanis & Reichenow, 1877), toillustrate the effectiveness of our indices and to testwhether reproduction or seasonal fruit availability drivetheir diets.
METHODS
Selected diet index
One way to analyse avian diet over time is to measure thetotal amount of each nutrient consumed during a givenperiod. This method requires data on the mass of eachfood item eaten and the nutrient concentration of thatitem during that period. An equation for total intake ofeach nutrient would be:
∑i
nti × mti
where nti is the fraction of the nutrient in food item i duringtime t, and mti is the total dry mass of item i eaten duringtime t. To calculate mt would require estimating theforaging efficiency of the birds with respect to each fruitingspecies, the time the birds spend in mature individuals ofeach fruiting species and the average dry mass of thefruit of that species. Collection of these data for wild birds,particularly in the tropics, is complicated by the expansivediets of most birds (Kitamura 2011, Poulsen et al. 2002,Whitney et al. 1998).
To ease data collection, we make a number ofassumptions. First, we assume that birds are consuming acalorically adequate diet and thus, that we can representthe nutritional content of the diet on a fractional ratherthan total basis. Next, we assume that samples offruit collected near peak ripeness make an acceptablesubstitute for a series of samples collected over time.Finally, we assume that a simple fraction of feedingobservations could serve as a substitute for measurementsof foraging efficiency and time spent in fruiting trees.
Incorporating these assumptions into the aboveequation, we get:
Nt =∑
i ni × pi t∑i pi t
where Nt is the fraction of the diet represented by a givennutrient during time t, ni is the concentration of thenutrient in ripe fruit of species i, and pit is the proportionof the feeding observations represented by that species inthat period over all the diet species for which there arenutritional data.
Avian nutrition over time in Africa 275
15
17
19
21
23
25
27
29
31
0
50
100
150
200
250
300
350
400
J F M A M J J A S O N D
Tem
per
atu
re (C
)
Rai
nfa
ll (m
m)
Rainfall High Temperature Average temperature Low temperature
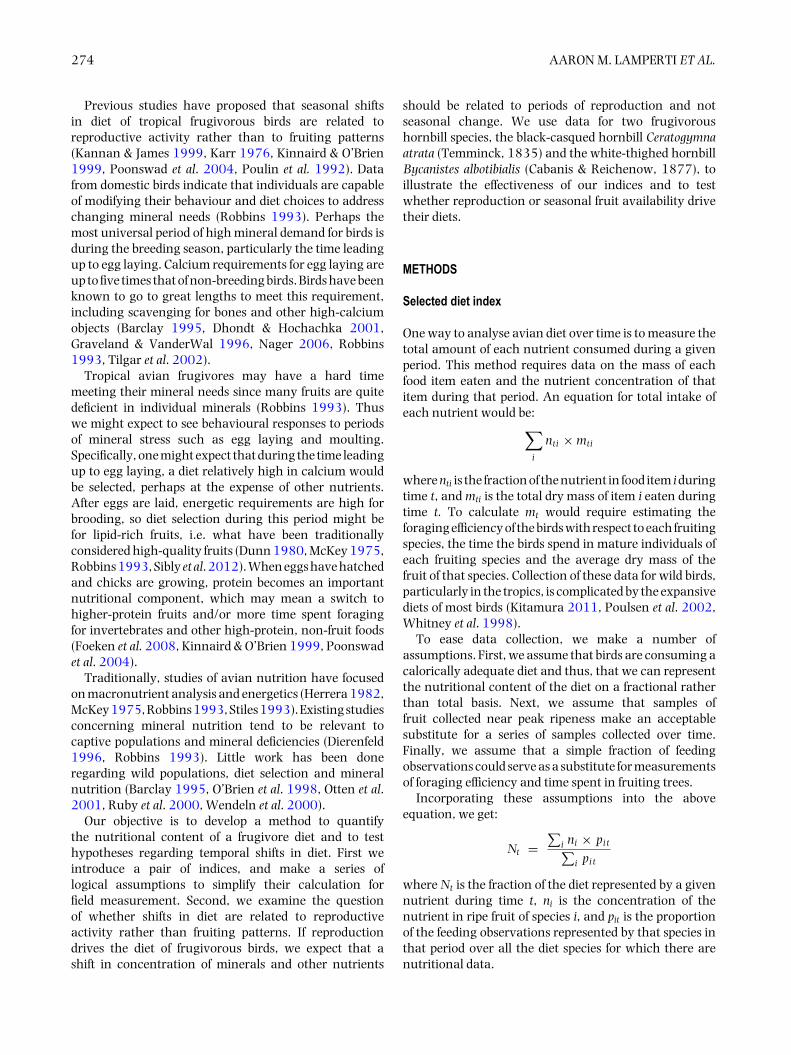
Figure 1. Rainfall and temperature data from the Bouamir Research Station in the Dja reserve, Cameroon. Data were collected from 1994 to 1999.Error bars represent 1 SD, N = 6 for all months.
Neutral diet index
To provide a baseline for comparison with the selecteddiet, we calculate an index of the nutrient concentrationsof the fruit of all species which we know these two hornbillspecies consume across the study area. This non-selectiveor neutral diet index allows us to assess whether hornbillsare selecting the fruit in their diet based on nutrientconcentration rather than simply randomly selecting adiet based on availability.
The neutral diet index begins with an estimate of thetotal quantity of fruit available from a given set of fruitingspecies in an area – the Fruit Availability Index (FAI; Fogiel2007, Holbrook et al. 2002, Stauffer & Smith 2004).
FAI t =∑
i
Di × Pti × Fti × dbh i
where Di is the density of a given fruiting species in thearea, Pti is the average proportion of the canopy of matureindividuals in fruit and Fti is the average fraction of fruitwhich are ripe of those trees with ripe fruit and dbhi is theaverage diameter at breast height for the species in thearea.
We converted the FAI into a Fruit Nutrition Index orFNI by dividing the FAI for each species i by the total FAIfor each period t to produce a proportion. This fraction wasthen multiplied by the nutrient concentration of the fruitof species i. The resulting values were summed for all dietspecies and the sum divided by the sum of the proportionsof all FAI values for which there were nutritional data.
FNI t =∑
i
(ni × F AI ti
FAI t
)∑
iF AI tiFAI t
=∑
i (ni ×FAI ti )∑i F AI ti
where the sums were taken for those species for whichthere were both FAI and nutrient data in a given period.The FNI was calculated for each month of the study periodwhere there were data for both fruiting phenology andfeeding observations, then a running 3-mo average ofboth diets was then further averaged by calendar monthover the 5-y study period to produce monthly averages.Statistics were calculated using microsoft Excel version2008 for Macintosh.
Study site and species
Diet observations were made between May 1994 andDecember 1999 at the Bouamir Research Station (BRS)in the Dja Faunal Reserve in southern Cameroon(3°11′27′′N, 12°48′41′′E). The Dja is a United Nations-designated biosphere reserve covering about 526 000ha and is surrounded on three sides by the Dja River,a tributary of the Congo. The area has never beencommercially logged. Although legally protected, the areadoes suffer hunting pressure from villages to the northand west (Muchaal & Ngandjui 1995, 1999). Bouamir isa 25-km2 study site situated in the approximate centreof the reserve in semi-deciduous tropical rain forest. Thestudy area includes areas of upland forest, Raphia swampand rocky outcrops known as rochers. Annual rainfall isapproximately 1600 mm and comes in two wet seasons,with rainfall peaks in late September and mid-May (Fogiel2007, Lamperti 2004, Poulsen et al. 2002, Whitney et al.1996, 1998). Rainfall data were collected daily with arain gauge placed in the centre of an approximately 0.5-ha clearing at the centre of the BRS (Figure 1).
276 AARON M. LAMPERTI ET AL.
There are three species of large hornbill (Aves:Bucerotidae) within the Dja Reserve. Two are predomi-nantly frugivorous, the black-casqued hornbill (Cerato-gymna atrata) and the white-thighed hornbill (Bycanistesalbotibialis). The third species, the piping hornbill (C.fistulator sharpii), is smaller and has a somewhat moregeneral diet (Kemp 2001).
There are approximately 230 tree species within thereserve. Ceratogymna atrata and B. albotibialis have beenobserved to eat the fruit of 22% of these species (Poulsenet al. 2002, Whitney et al. 1998).
The hornbill breeding season runs from early July tomid-October. Ceratogymna atrata and B. albotibialis beginto court and investigate nesting cavities in July. Femalesare walled into cavities by early August and eggs arepresumably laid soon after. In 1995, pieces of egg shellappeared in traps placed below nest cavities by mid-August likely indicating that chicks were hatching atthis time. In 1995, fledging was observed from the endof September to the middle of October (pers obs, Stauffer& Smith 2004).
Vegetation survey
Vegetation data were collected in the study area in 1994.Average dbh and species density (Di) were estimated fromsurveys of mature trees (greater than 10 cm dbh) in twobelt transects (10 × 400 m and 10 × 450 m), 32 40-m2
plots and three 100-m2 plots. Plots were randomly placedwithin the study area (Fogiel 2007). In all, almost 3300stems were marked with approximately 304 species in 41families identified (Appendix 1).
Fruiting phenology
Each month between December 1994 and November1999, we surveyed approximately 450 reproductivelymature trees representing over 40 hornbill-diet speciesfor flowering and fruiting phenology. In all, we madenearly 20 000 observations. As trees died or new dietspecies were added, mature trees were selected witha goal of surveying about 10 trees of each specieseach month. Selection methods varied by year. Forexample in 1995, three randomly generated numberswere used to select: (1) Which trail to leave camp on,(2) How far to go down that trail and (3) What compassbearing to take when leaving the trail. Then the firstmature tree of the species encountered was added to thelist.
Each tree was examined from the ground and given ascore from 0 to 4 for each of four categories: (1) fractionof canopy in flower, (2) fraction of canopy in fruit, (3)fraction of flowers in bud and (4) fraction of fruit that were
ripe. For flowers and fruit the scores translate as follows:0 indicates no sign of fruiting or flowering, 1 = 1 – 25%of the crown in flower or fruit, 2 = 26 – 50%, 3 = 51 –75% and 4 = 76 – 100% (relative to expectations for thatspecies). For flower buds and ripe fruit the same scale wasused except the score is relative to the fraction of canopyin flower or fruit, not to the full canopy. So, for example,a score of 3 for flower buds means that between 51%and 75% of the flowering was in bud. We also recordedobservations of flowers and fruit on the ground to reinforceour observations from the canopy (Fogiel 2007, Hardesty1999, Hardesty & Parker 2003, Holbrook & Smith 2000,Lamperti 2004, Whitney et al. 1998).
Feeding observations
The diets of B. albotibialis and C. atrata were quantifiedin the following manner. A series of six trail loops withinthe BRS were each walked approximately five times permonth for a total distance sampled of approximately175 km mo−1 (Poulsen et al. 2001). Trails were walkedat a steady pace and species, numbers of individuals, sexand feeding behaviours were recorded for each group ofarboreal frugivores encountered. Frugivores were locatedboth visually and by sound and observers left the trailfor short distances and times to collect data on groupsnot visible from the trail. Food species was recorded foreach observation of explicit or likely (feeding behavioursand fruit present, but no observed consumption) feeding(Lamperti 2004, Poulsen et al. 2002, Whitney & Smith1998, Whitney et al. 1998). Schoener’s index wascalculated to compare the diets of the two hornbill species(Schoener 1968).
Fruit collection/nutritional analysis
We collected samples of fruit pulp for nutritionalanalysis in 1995 and 1997. Ripe fruit were collectedopportunistically from the canopy of fruiting individualswhere possible and from the ground below fruitingindividuals when necessary. Fruit pulp was mechanicallyremoved from the seed(s) and placed in 70% ethanolfor preservation. Samples of pulp were weighed, driedin a kerosene oven and reweighed to estimate watercontent.
Samples collected in 1995 were tested for crude protein,dry matter, ash, cell wall constituents (neutral and aciddetergent fibre and lignin), water-soluble carbohydrates(or simple saccharides) and assorted minerals (Ca, Cu,Fe, Mg, Mn, Na, P, Zn) at the Department of Nutrition,Wildlife Conservation Society, Bronx, New York. Samplescollected in 1997 were analysed for the same componentswith the addition of crude fat.
Avian nutrition over time in Africa 277
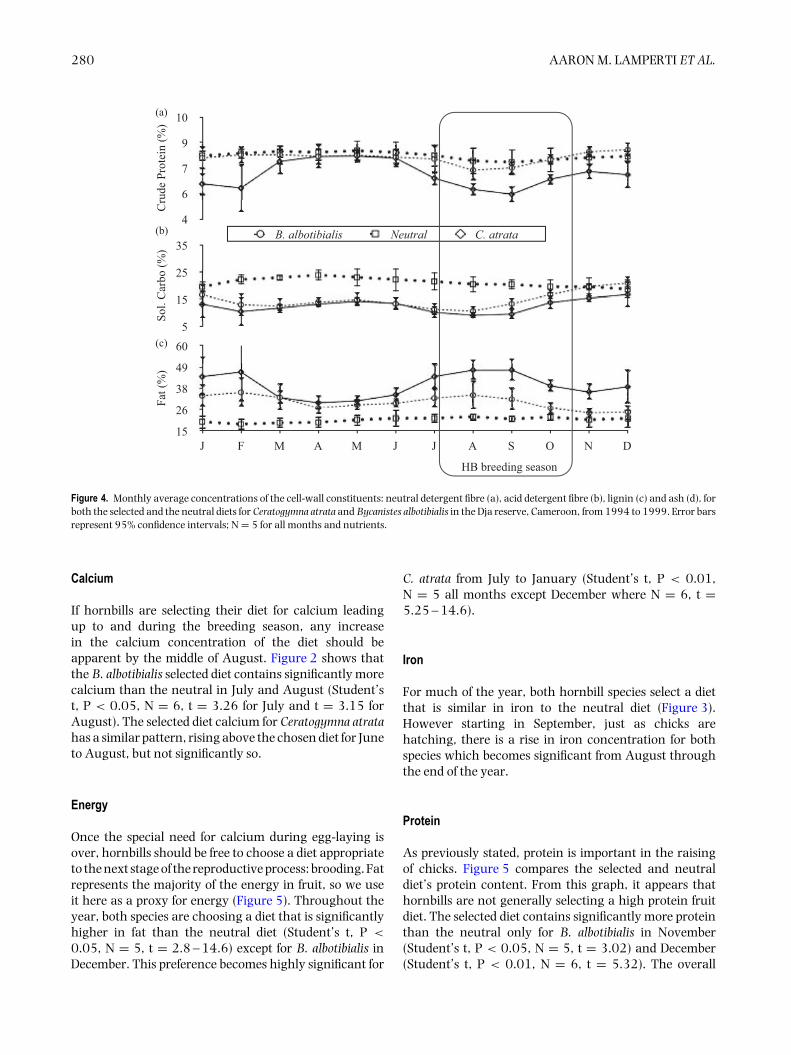
Table 1. Fruit tissue samples collected in the Dja reserve in 1995 and 1997. Samples were dried in a kerosene oven tomeasure water content.
Family Species Fruit wet weight (g)(N) Fruit % water (N) Year
Anacardiaceae Lannea welwitschii 0.36 (1) 1995Anisophylleaceae Anopyxis klaineana 4.26 ± 0.82 (8) 64.0 ± 25.9 (8) 1995Annonaceae Cleistopholis glauca 1.08 ± 0.06 (5) 66.5 ± 2.14 (5) 1995
Cleistopholis patens 6.03 ± 1.47 (10) 78.3 ± 2.14 (10) 1995Enantia chlorantha 1.32 ± 0.68 (21) 57.8 ± 25.5 (21) 1995Pachypodanthium staudtii 1.09 ± 0.46 (10) 46.1 ± 33.8 (15) 1995Polyalthia suaveolens 1.73 ± 0.31 (8) 74.8 ± 3.79 (8) 1995Xylopia aethiopica 1997Xylopia rubescens 1995Xylopia sp. 1997Xylopia staudtii 1997
Apocynaceae Rauwolfia macrophylla 1997Arecaceae Elaeis guineensis 1997
Eremospatha macrocarpa 2.87 ± 2.16 (8) 62.8 ± 11.9 (8) 1995Lacosperma secundiflorum 1.92 ± 0.26 (10) 66.6 ± 22.3 (11) 1995Raphia monbuttorum 15.21 ± 2.92 (2) 56.1 ± 1.48 (2) 1995
Burseraceae Canarium schweinfurtii 4.98 ± 0.37 (10) 51.5 ± 1.71 (10) 1997Dacryodes edulis 3.15 ± 1.94 (15) 44.8 ± 19.7 (15) 1995
Combretaceae Pteleopsis hylodendron 1997Connaraceae Unknown 1997Dracaenaceae Dracaena arborea 1997Euphorbiaceae Bridelia sp. 1995
Macaranga sp. 1997Uapaca paludosa 4.85 ± 1.8 (10) 29.7 ± 31.4 (10) 1995 & 1997Uapaca sp. 1997
Meliaceae Guarea cedrata 3.28 ± 2.12 (3) 78.7 ± 5.06 (3) 1995: 1 1997: 2Trichilia sp. 1997Trichilia sp. 1997Trichilia sp. 1997
Moraceae Ficus spp. 0.56 ± 0.13 (20) 74.9 ± 7.70 (20) 1995: 4 1997: 1Trilepisium madagascariense 1997
Myristicaceae Pycnanthus angolensis 1.47 ± 1.27 (16) 29.0 ± 22.3 (16) 1995Staudtia kamerunensis 0.74 (1) 66.2 (1) 1995
Olacaceae Heisteria zimmereri 0.5 ± 0.12 (15) 18.0 ± 26.4 (15) 1995Strombosiopsis tetrandra 10.89 ± 2.22 (12) 88.6 ± 2.79 (12) 1995
Rhamnaceae Maesopsis eminii 1.23 ± 0.24 (10) 76.5 ± 1.33 (10) 1995Sapindaceae Blighia welwitschii 1.13 ± 0.32 (10) 65.2 ± 3.42 (10) 1995
Eriocoelum macrocarpum 0.12 ± 0.03 (11) 24.7 ± 21.0 (11) 1995Sterculiaceae Eribroma oblongum 1997Ulmaceae Celtis tessmannii 1995
Crude protein was analysed using a macro-Kjeldahlmethod, which determined CP as total nitrogen × 6.25.Neutral detergent fibre, acid detergent fibre and ligninvalues were determined using Goering & Van Soest(1970). Water-soluble carbohydrates were analysed byusing a modification of Strickland & Parson (1972).Samples were extracted with boiling water for 10 min andthen 0.5 ml phenol and 2.5 ml sulphuric acid were added.After 1 h, sample absorption was determined on a Genysis5 spectrophotometer. Crude fat was measured using a1045 Tectaor Soxtec system to extract lipid fractions withpetroleum ether, following procedures outlined in AOACfor feeds and foods.
Mineral analyses were performed using standardatomic absorption spectrophotometer methods for plants(Perkin Elmer 1982). Duplicate samples were ashed in amuffle furnace at 550 ºC overnight, cooled in a desiccatorand weighed to determine ash content. They were thendissolved in 20% HCl with heat and then diluted to 25 mlwith a 1% lanthanum solution (when necessary sampleswere further diluted with 0.36 N HCl containing 1%La). Ca, Cu, Fe, Mg, Mn and Zn were individually runon a Perkin Elmer atomic absorption spectrophotometer(Model 3100) with an air acetylene flame and a 0.36 NHCl with 1% La blank. Phosphorus was measured usingmodified AOAC colorimetric methods (AOAC 1995).
278 AARON M. LAMPERTI ET AL.
Mag
nesi
um (%
)
0.05
0.09
0.13
0.16
0.20
Cal
cium
(%)
0.05
0.15
0.25
0.35
B. albotibialis Neutral C. atrata
Sodi
um (%
)
00.010.020.030.040.05
Phos
phor
us (%
)
0.03
0.10
0.18
0.25
Ca:
P
1.001.502.002.503.003.50
J F M A M J J A S O N D
NeNeNeNeNeNeNeNeNeNeNeNeNeNeNeNeNeNeNeNeNeutututututututututututututututututututututrararararararararararararararararararararalllllllllllllllllllll
(a)
(b)
(c)
(d)
(e)
HB breeding season
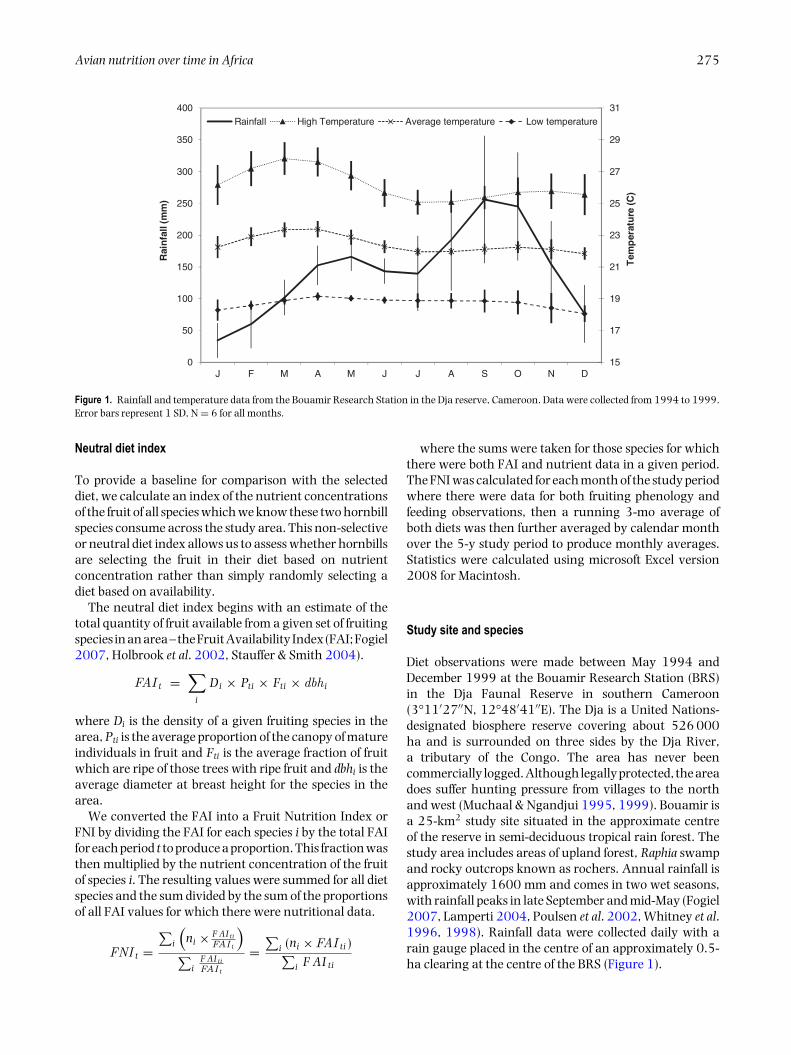
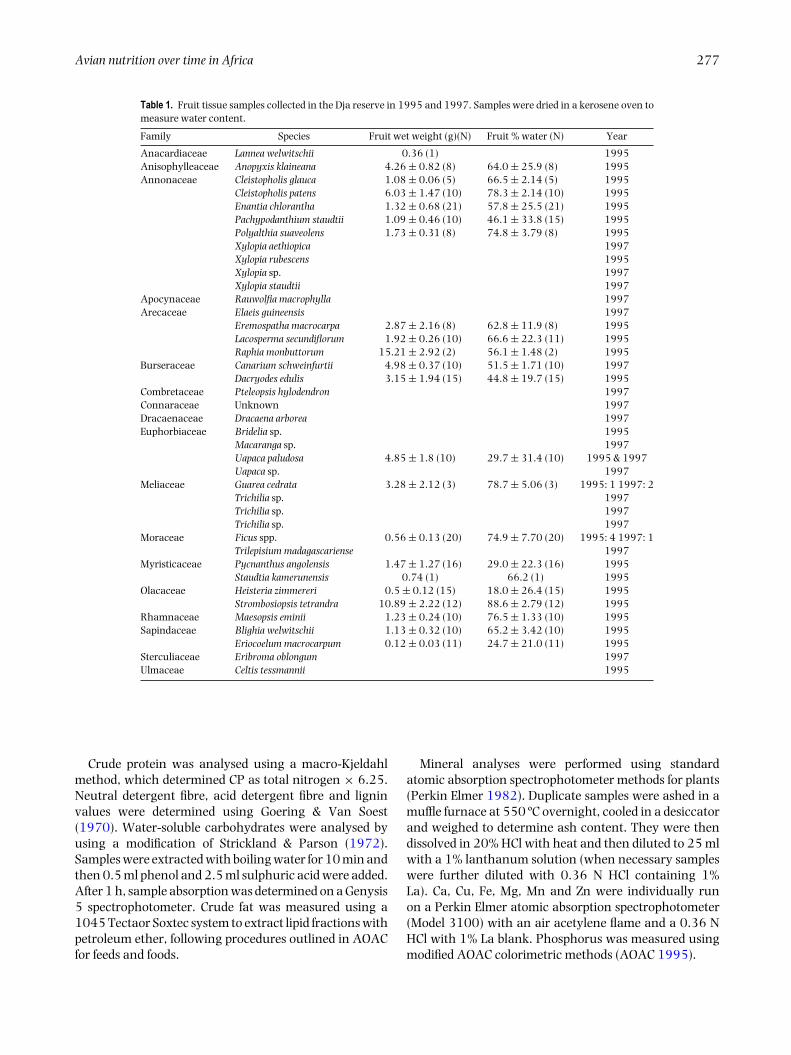
Figure 2. Monthly average concentrations of the macrominerals calcium (a), magnesium (b), phosphorus (c) and sodium (d) along with the calciumto phosphorus ratio (e) in both the selected and neutral diets for Ceratogymna atrata and Bycanistes albotibialis in the Dja reserve, Cameroon, from1994 to 1999. Error bars represent 95% confidence intervals; N = 5 for all months and nutrients.
RESULTS
Feeding observations
The number of feeding observations averaged 19.0(range = 0 – 91) mo−1 (B. albotibialis) and 27.7 (0 – 74)mo−1 (C. atrata) for the study period. In total we collected3165 feeding observations over 68 mo (Appendix 2). Thehornbills were observed to eat an average of 7.5 (0 – 16)spp. mo−1 (B. albotibialis) and 9.8 (0 – 26) spp. mo−1 (C.atrata) over the same time period. The diets of the twospecies were substantially similar, with a diet overlap of0.65 (Schoener’s index) for all feeding observations over
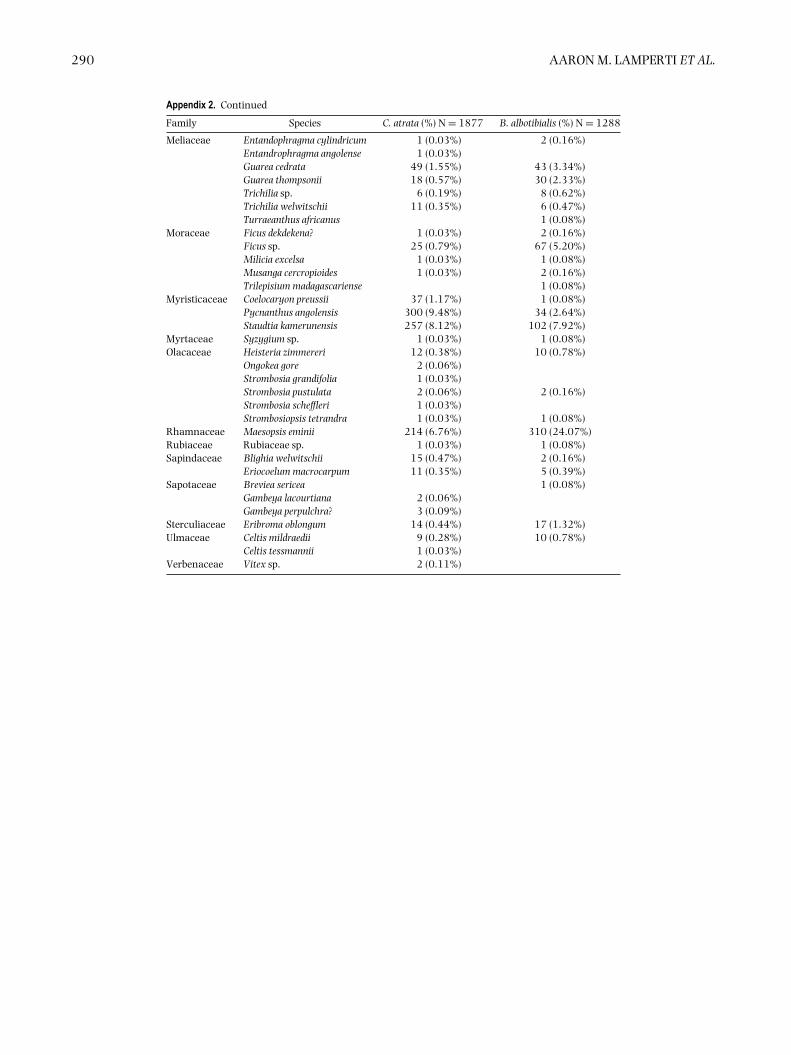
the study period. The difference between the diets wasprimarily due to two species which account for more thanhalf of the difference between the diets: Maesopsis eminiiand Pycnanthus angolensis. Bycanestes albotibialis appearsto prefer Maesopsis eminii while Ceratogymna atrata prefersPycnanthus angolensis.
Nutritional analysis
Samples of fruit tissue were collected from 78 trees of40 species in 1995 and 1997. Some of these collectionswere combined in the laboratory to create an adequate
Avian nutrition over time in Africa 279
25
55
85
115
145
1755
17.5
30
5
17.5
30
J F M A M J J A S O N D
B. albotibialis Neutral C. atrata
25
50
75
100
125
150
NeNeNeNeNeNeNeNeNeNeNeNeNeNeNeNeNeNeNeNeNeututututututututututuututututututututututrararararararararararararararararararararaNeNeNeNeNeNeNeNeNeNeNeNeNeNeNeNeNeNeNeNeNeutututututututututututututututututututututrarararararararararararararararararararaallllllllllllllllllllllllllllllllllllllllll
Iron
(ug
g-1)
Man
gane
se (u
g g-1
g gu( reppoC
)-1
)Zi
nc (u
g g-1
)
(a)
(b)
(c)
(d)
HB breeding season
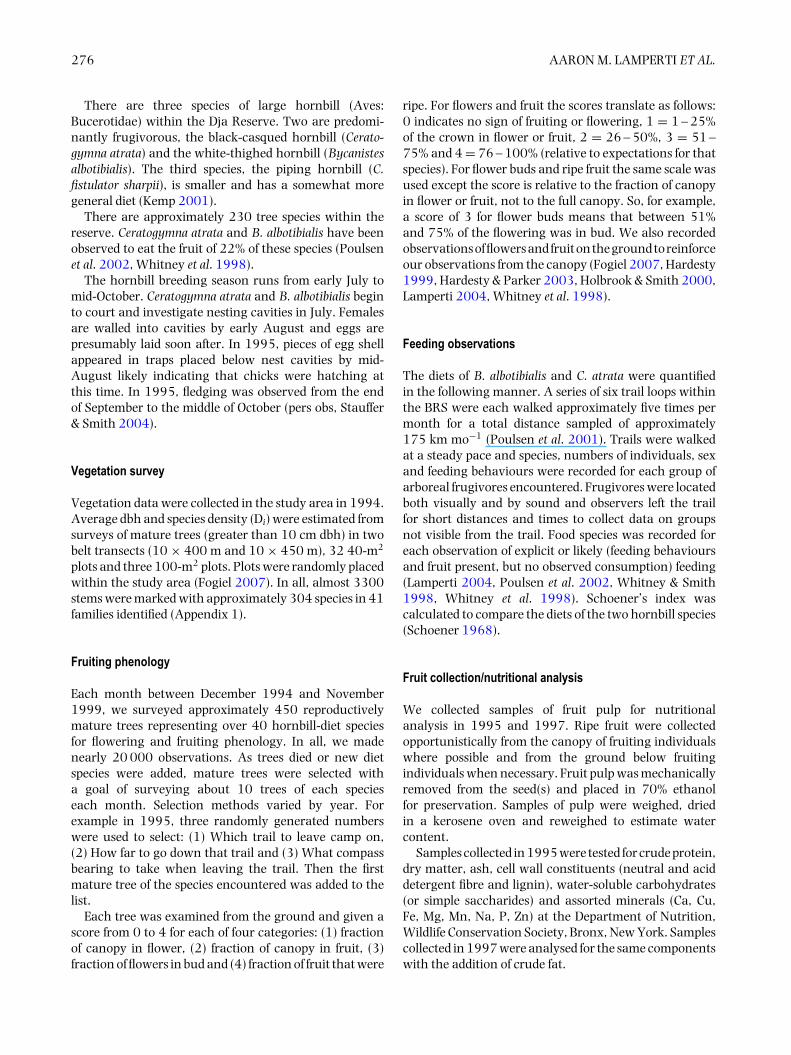
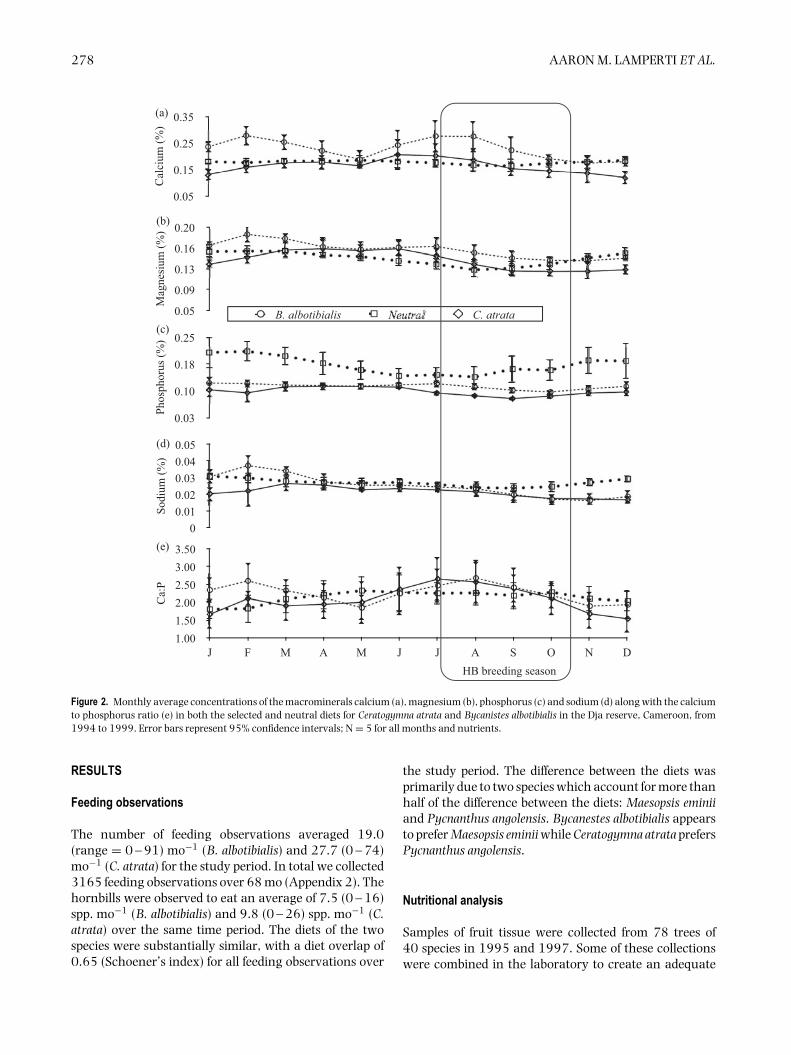
Figure 3. Monthly average concentrations of the microminerals copper (a), iron (b), manganese (c) and zinc (d) in the selected and neutral diets forCeratogymna atrata and Bycanistes albotibialis in the Dja reserve, Cameroon, from 1994 to 1999. Error bars represent 95% confidence intervals; N =5 for all months and nutrients.
sample for analysis. In all, 58 samples were analysed fortheir nutrient concentrations (Table 1). Together thesesamples provide nutritional data for 78.3% and 71.7% ofthe observed diet of C. atrata and B. albotibialis respectively(Appendix 2).
Monthly selected and neutral diet nutritional content
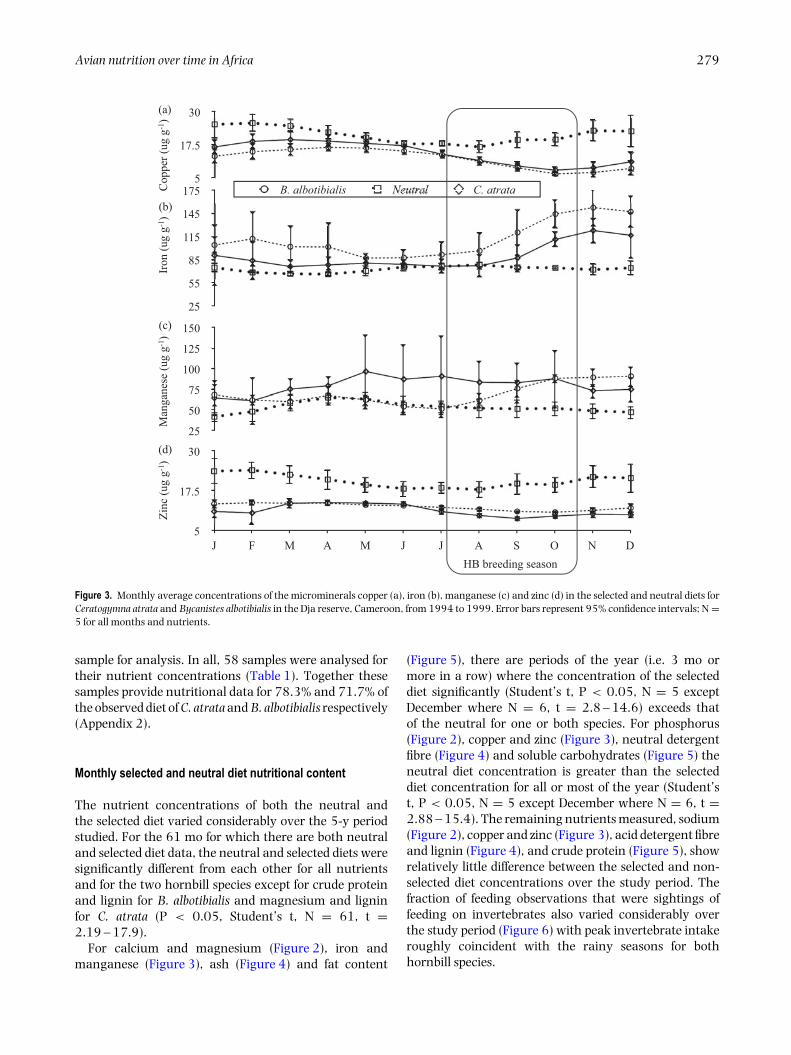
The nutrient concentrations of both the neutral andthe selected diet varied considerably over the 5-y periodstudied. For the 61 mo for which there are both neutraland selected diet data, the neutral and selected diets weresignificantly different from each other for all nutrientsand for the two hornbill species except for crude proteinand lignin for B. albotibialis and magnesium and ligninfor C. atrata (P < 0.05, Student’s t, N = 61, t =2.19 – 17.9).
For calcium and magnesium (Figure 2), iron andmanganese (Figure 3), ash (Figure 4) and fat content
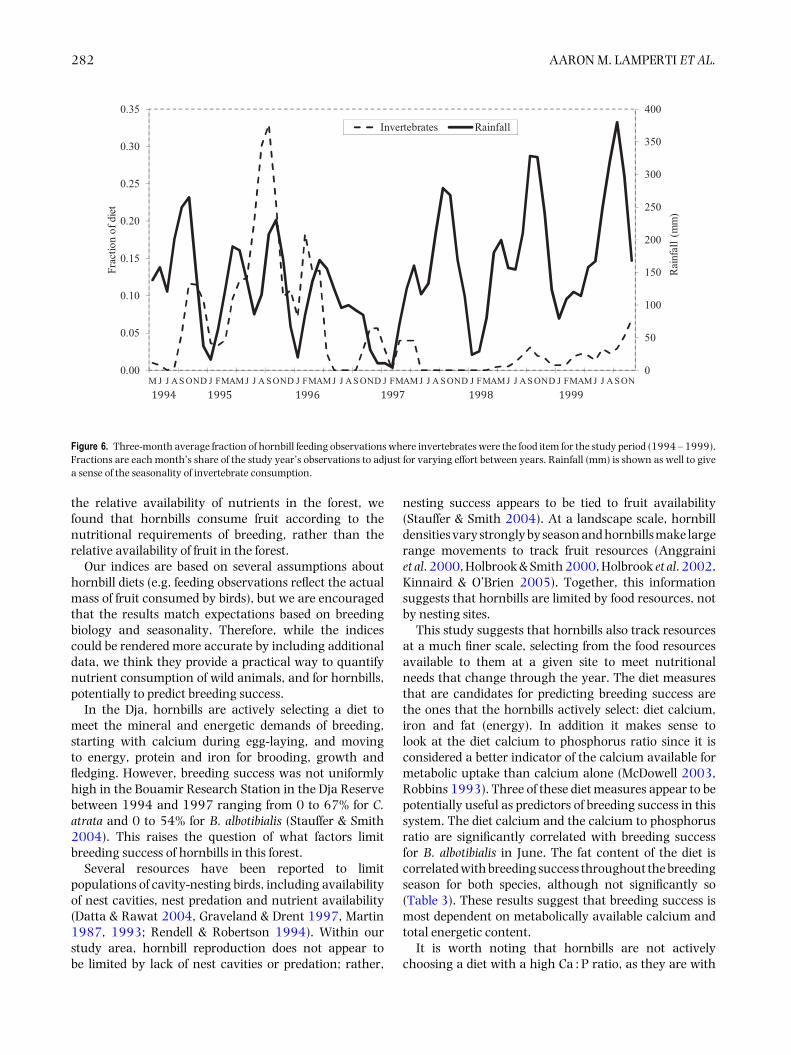
(Figure 5), there are periods of the year (i.e. 3 mo ormore in a row) where the concentration of the selecteddiet significantly (Student’s t, P < 0.05, N = 5 exceptDecember where N = 6, t = 2.8 – 14.6) exceeds thatof the neutral for one or both species. For phosphorus(Figure 2), copper and zinc (Figure 3), neutral detergentfibre (Figure 4) and soluble carbohydrates (Figure 5) theneutral diet concentration is greater than the selecteddiet concentration for all or most of the year (Student’st, P < 0.05, N = 5 except December where N = 6, t =2.88 – 15.4). The remaining nutrients measured, sodium(Figure 2), copper and zinc (Figure 3), acid detergent fibreand lignin (Figure 4), and crude protein (Figure 5), showrelatively little difference between the selected and non-selected diet concentrations over the study period. Thefraction of feeding observations that were sightings offeeding on invertebrates also varied considerably overthe study period (Figure 6) with peak invertebrate intakeroughly coincident with the rainy seasons for bothhornbill species.
280 AARON M. LAMPERTI ET AL.
Fat (
%)
15
26
38
49
60
J F M A M J J A S O N D
B. albotibialis Neutral C. atrata
Cru
de P
rote
in (%
)
4
6
7
9
10
Sol.
Car
bo (%
)
5
15
25
35
(a)
(b)
(c)
HB breeding season
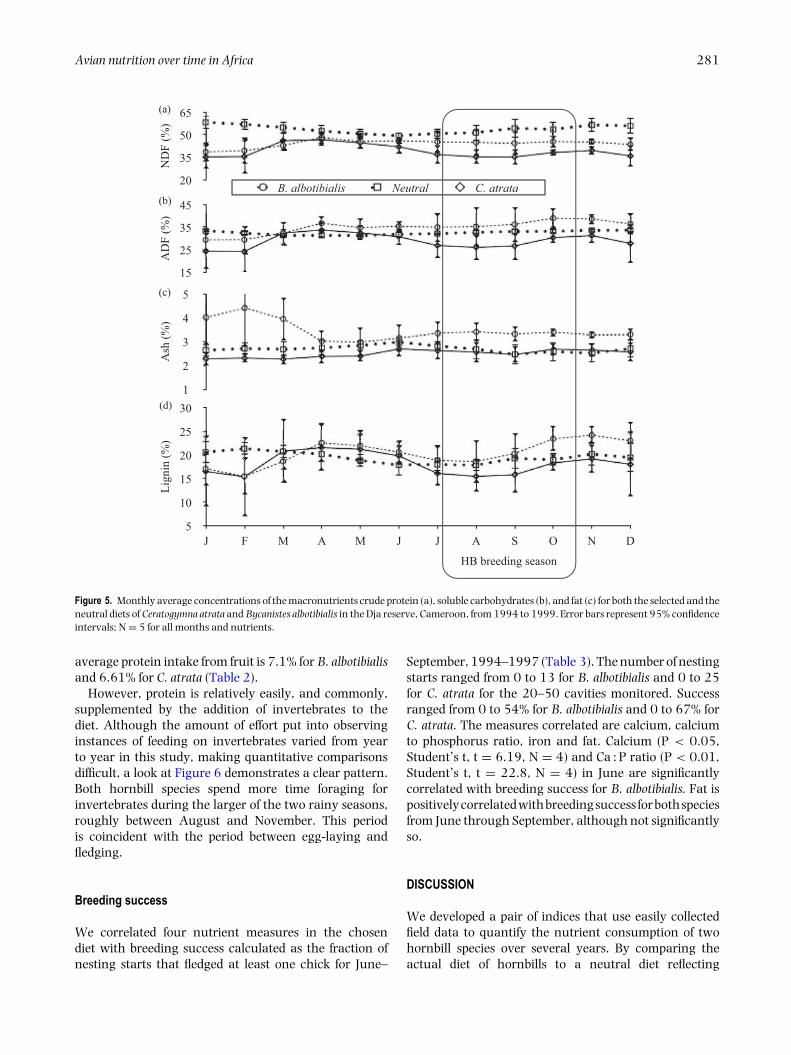
Figure 4. Monthly average concentrations of the cell-wall constituents: neutral detergent fibre (a), acid detergent fibre (b), lignin (c) and ash (d), forboth the selected and the neutral diets for Ceratogymna atrata and Bycanistes albotibialis in the Dja reserve, Cameroon, from 1994 to 1999. Error barsrepresent 95% confidence intervals; N = 5 for all months and nutrients.
Calcium
If hornbills are selecting their diet for calcium leadingup to and during the breeding season, any increasein the calcium concentration of the diet should beapparent by the middle of August. Figure 2 shows thatthe B. albotibialis selected diet contains significantly morecalcium than the neutral in July and August (Student’st, P < 0.05, N = 6, t = 3.26 for July and t = 3.15 forAugust). The selected diet calcium for Ceratogymna atratahas a similar pattern, rising above the chosen diet for Juneto August, but not significantly so.
Energy
Once the special need for calcium during egg-laying isover, hornbills should be free to choose a diet appropriateto the next stage of the reproductive process: brooding. Fatrepresents the majority of the energy in fruit, so we useit here as a proxy for energy (Figure 5). Throughout theyear, both species are choosing a diet that is significantlyhigher in fat than the neutral diet (Student’s t, P <
0.05, N = 5, t = 2.8 – 14.6) except for B. albotibialis inDecember. This preference becomes highly significant for
C. atrata from July to January (Student’s t, P < 0.01,N = 5 all months except December where N = 6, t =5.25 – 14.6).
Iron
For much of the year, both hornbill species select a dietthat is similar in iron to the neutral diet (Figure 3).However starting in September, just as chicks arehatching, there is a rise in iron concentration for bothspecies which becomes significant from August throughthe end of the year.
Protein
As previously stated, protein is important in the raisingof chicks. Figure 5 compares the selected and neutraldiet’s protein content. From this graph, it appears thathornbills are not generally selecting a high protein fruitdiet. The selected diet contains significantly more proteinthan the neutral only for B. albotibialis in November(Student’s t, P < 0.05, N = 5, t = 3.02) and December(Student’s t, P < 0.01, N = 6, t = 5.32). The overall
Avian nutrition over time in Africa 281
ND
F (%
)20
35
50
65
Lign
in (%
)
5
10
15
20
25
30
J F M A M J J A S O N D
B. albotibialis Neutral C. atrata
AD
F (%
)
15
25
35
45
Ash
(%)
1
2
3
4
5
(a)
(b)
(c)
(d)
HB breeding season
Figure 5. Monthly average concentrations of the macronutrients crude protein (a), soluble carbohydrates (b), and fat (c) for both the selected and theneutral diets of Ceratogymna atrata and Bycanistes albotibialis in the Dja reserve, Cameroon, from 1994 to 1999. Error bars represent 95% confidenceintervals; N = 5 for all months and nutrients.
average protein intake from fruit is 7.1% for B. albotibialisand 6.61% for C. atrata (Table 2).
However, protein is relatively easily, and commonly,supplemented by the addition of invertebrates to thediet. Although the amount of effort put into observinginstances of feeding on invertebrates varied from yearto year in this study, making quantitative comparisonsdifficult, a look at Figure 6 demonstrates a clear pattern.Both hornbill species spend more time foraging forinvertebrates during the larger of the two rainy seasons,roughly between August and November. This periodis coincident with the period between egg-laying andfledging.
Breeding success
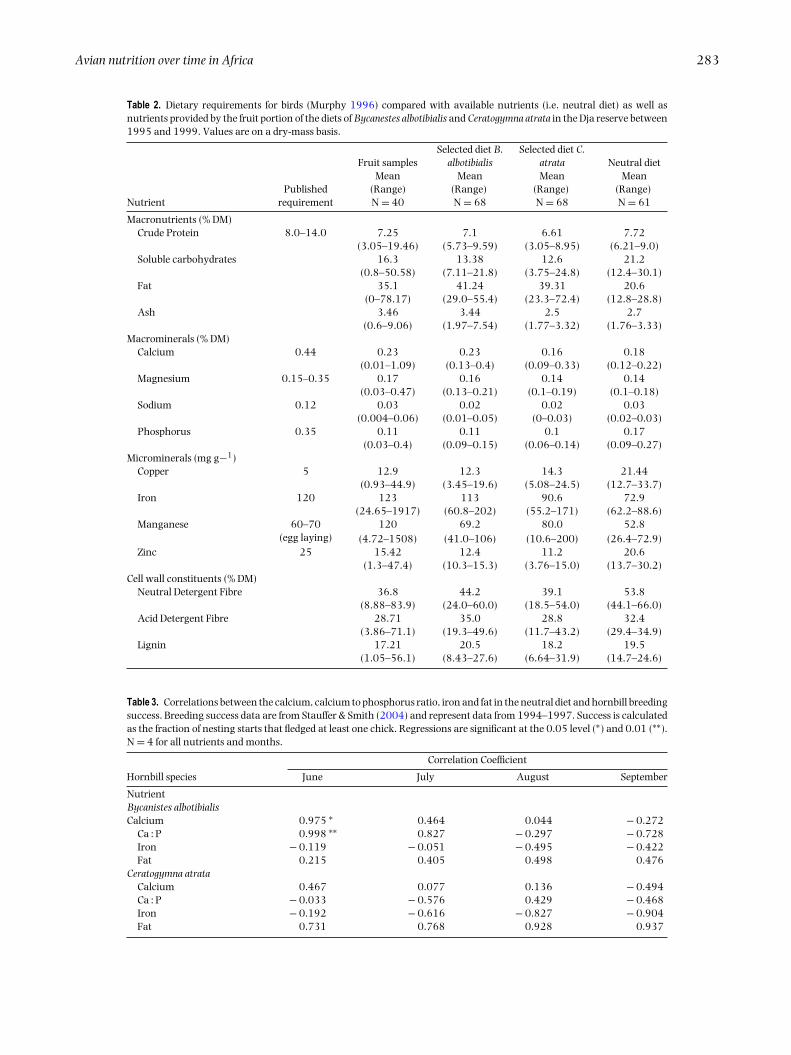
We correlated four nutrient measures in the chosendiet with breeding success calculated as the fraction ofnesting starts that fledged at least one chick for June–
September, 1994–1997 (Table 3). The number of nestingstarts ranged from 0 to 13 for B. albotibialis and 0 to 25for C. atrata for the 20–50 cavities monitored. Successranged from 0 to 54% for B. albotibialis and 0 to 67% forC. atrata. The measures correlated are calcium, calciumto phosphorus ratio, iron and fat. Calcium (P < 0.05,Student’s t, t = 6.19, N = 4) and Ca : P ratio (P < 0.01,Student’s t, t = 22.8, N = 4) in June are significantlycorrelated with breeding success for B. albotibialis. Fat ispositively correlated with breeding success for both speciesfrom June through September, although not significantlyso.
DISCUSSION
We developed a pair of indices that use easily collectedfield data to quantify the nutrient consumption of twohornbill species over several years. By comparing theactual diet of hornbills to a neutral diet reflecting
282 AARON M. LAMPERTI ET AL.
0
50
100
150
200
250
300
350
400
0.00
0.05
0.10
0.15
0.20
0.25
0.30
0.35
M J J A S OND J FMAM J J A S OND J FMAM J J A S OND J FMAM J J A S OND J FMAM J J A S OND J FMAM J J A S ON
Rai
nfal
l (m
m)
Frac
tion
of d
iet
Invertebrates Rainfall
1994 1995 1996 1997 1998 1999
Figure 6. Three-month average fraction of hornbill feeding observations where invertebrates were the food item for the study period (1994 – 1999).Fractions are each month’s share of the study year’s observations to adjust for varying effort between years. Rainfall (mm) is shown as well to givea sense of the seasonality of invertebrate consumption.
the relative availability of nutrients in the forest, wefound that hornbills consume fruit according to thenutritional requirements of breeding, rather than therelative availability of fruit in the forest.
Our indices are based on several assumptions abouthornbill diets (e.g. feeding observations reflect the actualmass of fruit consumed by birds), but we are encouragedthat the results match expectations based on breedingbiology and seasonality. Therefore, while the indicescould be rendered more accurate by including additionaldata, we think they provide a practical way to quantifynutrient consumption of wild animals, and for hornbills,potentially to predict breeding success.
In the Dja, hornbills are actively selecting a diet tomeet the mineral and energetic demands of breeding,starting with calcium during egg-laying, and movingto energy, protein and iron for brooding, growth andfledging. However, breeding success was not uniformlyhigh in the Bouamir Research Station in the Dja Reservebetween 1994 and 1997 ranging from 0 to 67% for C.atrata and 0 to 54% for B. albotibialis (Stauffer & Smith2004). This raises the question of what factors limitbreeding success of hornbills in this forest.
Several resources have been reported to limitpopulations of cavity-nesting birds, including availabilityof nest cavities, nest predation and nutrient availability(Datta & Rawat 2004, Graveland & Drent 1997, Martin1987, 1993; Rendell & Robertson 1994). Within ourstudy area, hornbill reproduction does not appear tobe limited by lack of nest cavities or predation; rather,
nesting success appears to be tied to fruit availability(Stauffer & Smith 2004). At a landscape scale, hornbilldensities vary strongly by season and hornbills make largerange movements to track fruit resources (Anggrainiet al. 2000, Holbrook & Smith 2000, Holbrook et al. 2002,Kinnaird & O’Brien 2005). Together, this informationsuggests that hornbills are limited by food resources, notby nesting sites.
This study suggests that hornbills also track resourcesat a much finer scale, selecting from the food resourcesavailable to them at a given site to meet nutritionalneeds that change through the year. The diet measuresthat are candidates for predicting breeding success arethe ones that the hornbills actively select: diet calcium,iron and fat (energy). In addition it makes sense tolook at the diet calcium to phosphorus ratio since it isconsidered a better indicator of the calcium available formetabolic uptake than calcium alone (McDowell 2003,Robbins 1993). Three of these diet measures appear to bepotentially useful as predictors of breeding success in thissystem. The diet calcium and the calcium to phosphorusratio are significantly correlated with breeding successfor B. albotibialis in June. The fat content of the diet iscorrelated with breeding success throughout the breedingseason for both species, although not significantly so(Table 3). These results suggest that breeding success ismost dependent on metabolically available calcium andtotal energetic content.
It is worth noting that hornbills are not activelychoosing a diet with a high Ca : P ratio, as they are with
Avian nutrition over time in Africa 283
Table 2. Dietary requirements for birds (Murphy 1996) compared with available nutrients (i.e. neutral diet) as well asnutrients provided by the fruit portion of the diets of Bycanestes albotibialis and Ceratogymna atrata in the Dja reserve between1995 and 1999. Values are on a dry-mass basis.
NutrientPublished
requirement
Fruit samplesMean
(Range)N = 40
Selected diet B.albotibialis
Mean(Range)N = 68
Selected diet C.atrataMean
(Range)N = 68
Neutral dietMean
(Range)N = 61
Macronutrients (% DM)Crude Protein 8.0–14.0 7.25 7.1 6.61 7.72
(3.05–19.46) (5.73–9.59) (3.05–8.95) (6.21–9.0)Soluble carbohydrates 16.3 13.38 12.6 21.2
(0.8–50.58) (7.11–21.8) (3.75–24.8) (12.4–30.1)Fat 35.1 41.24 39.31 20.6
(0–78.17) (29.0–55.4) (23.3–72.4) (12.8–28.8)Ash 3.46 3.44 2.5 2.7
(0.6–9.06) (1.97–7.54) (1.77–3.32) (1.76–3.33)Macrominerals (% DM)
Calcium 0.44 0.23 0.23 0.16 0.18(0.01–1.09) (0.13–0.4) (0.09–0.33) (0.12–0.22)
Magnesium 0.15–0.35 0.17 0.16 0.14 0.14(0.03–0.47) (0.13–0.21) (0.1–0.19) (0.1–0.18)
Sodium 0.12 0.03 0.02 0.02 0.03(0.004–0.06) (0.01–0.05) (0–0.03) (0.02–0.03)
Phosphorus 0.35 0.11 0.11 0.1 0.17(0.03–0.4) (0.09–0.15) (0.06–0.14) (0.09–0.27)
Microminerals (mg g−1)Copper 5 12.9 12.3 14.3 21.44
(0.93–44.9) (3.45–19.6) (5.08–24.5) (12.7–33.7)Iron 120 123 113 90.6 72.9
(24.65–1917) (60.8–202) (55.2–171) (62.2–88.6)Manganese 60–70
(egg laying)120 69.2 80.0 52.8
(4.72–1508) (41.0–106) (10.6–200) (26.4–72.9)Zinc 25 15.42 12.4 11.2 20.6
(1.3–47.4) (10.3–15.3) (3.76–15.0) (13.7–30.2)Cell wall constituents (% DM)
Neutral Detergent Fibre 36.8 44.2 39.1 53.8(8.88–83.9) (24.0–60.0) (18.5–54.0) (44.1–66.0)
Acid Detergent Fibre 28.71 35.0 28.8 32.4(3.86–71.1) (19.3–49.6) (11.7–43.2) (29.4–34.9)
Lignin 17.21 20.5 18.2 19.5(1.05–56.1) (8.43–27.6) (6.64–31.9) (14.7–24.6)
Table 3. Correlations between the calcium, calcium to phosphorus ratio, iron and fat in the neutral diet and hornbill breedingsuccess. Breeding success data are from Stauffer & Smith (2004) and represent data from 1994–1997. Success is calculatedas the fraction of nesting starts that fledged at least one chick. Regressions are significant at the 0.05 level (∗) and 0.01 (∗∗).N = 4 for all nutrients and months.
Correlation Coefficient
Hornbill species June July August September
NutrientBycanistes albotibialisCalcium 0.975 ∗ 0.464 0.044 − 0.272
Ca : P 0.998 ∗∗ 0.827 − 0.297 − 0.728Iron − 0.119 − 0.051 − 0.495 − 0.422Fat 0.215 0.405 0.498 0.476
Ceratogymna atrataCalcium 0.467 0.077 0.136 − 0.494Ca : P − 0.033 − 0.576 0.429 − 0.468Iron − 0.192 − 0.616 − 0.827 − 0.904Fat 0.731 0.768 0.928 0.937
284 AARON M. LAMPERTI ET AL.
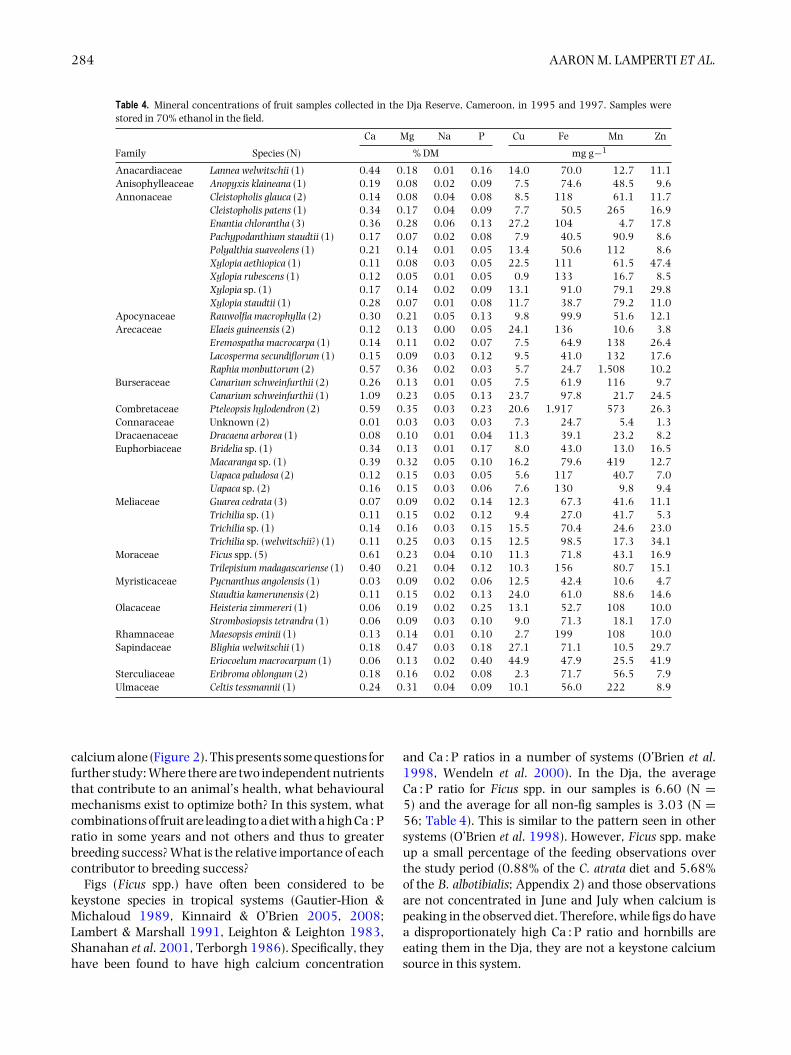
Table 4. Mineral concentrations of fruit samples collected in the Dja Reserve, Cameroon, in 1995 and 1997. Samples werestored in 70% ethanol in the field.
Ca Mg Na P Cu Fe Mn Zn
Family Species (N) % DM mg g−1
Anacardiaceae Lannea welwitschii (1) 0.44 0.18 0.01 0.16 14.0 70.0 12.7 11.1Anisophylleaceae Anopyxis klaineana (1) 0.19 0.08 0.02 0.09 7.5 74.6 48.5 9.6Annonaceae Cleistopholis glauca (2) 0.14 0.08 0.04 0.08 8.5 118 61.1 11.7
Cleistopholis patens (1) 0.34 0.17 0.04 0.09 7.7 50.5 265 16.9Enantia chlorantha (3) 0.36 0.28 0.06 0.13 27.2 104 4.7 17.8Pachypodanthium staudtii (1) 0.17 0.07 0.02 0.08 7.9 40.5 90.9 8.6Polyalthia suaveolens (1) 0.21 0.14 0.01 0.05 13.4 50.6 112 8.6Xylopia aethiopica (1) 0.11 0.08 0.03 0.05 22.5 111 61.5 47.4Xylopia rubescens (1) 0.12 0.05 0.01 0.05 0.9 133 16.7 8.5Xylopia sp. (1) 0.17 0.14 0.02 0.09 13.1 91.0 79.1 29.8Xylopia staudtii (1) 0.28 0.07 0.01 0.08 11.7 38.7 79.2 11.0
Apocynaceae Rauwolfia macrophylla (2) 0.30 0.21 0.05 0.13 9.8 99.9 51.6 12.1Arecaceae Elaeis guineensis (2) 0.12 0.13 0.00 0.05 24.1 136 10.6 3.8
Eremospatha macrocarpa (1) 0.14 0.11 0.02 0.07 7.5 64.9 138 26.4Lacosperma secundiflorum (1) 0.15 0.09 0.03 0.12 9.5 41.0 132 17.6Raphia monbuttorum (2) 0.57 0.36 0.02 0.03 5.7 24.7 1,508 10.2
Burseraceae Canarium schweinfurthii (2) 0.26 0.13 0.01 0.05 7.5 61.9 116 9.7Canarium schweinfurthii (1) 1.09 0.23 0.05 0.13 23.7 97.8 21.7 24.5
Combretaceae Pteleopsis hylodendron (2) 0.59 0.35 0.03 0.23 20.6 1,917 573 26.3Connaraceae Unknown (2) 0.01 0.03 0.03 0.03 7.3 24.7 5.4 1.3Dracaenaceae Dracaena arborea (1) 0.08 0.10 0.01 0.04 11.3 39.1 23.2 8.2Euphorbiaceae Bridelia sp. (1) 0.34 0.13 0.01 0.17 8.0 43.0 13.0 16.5
Macaranga sp. (1) 0.39 0.32 0.05 0.10 16.2 79.6 419 12.7Uapaca paludosa (2) 0.12 0.15 0.03 0.05 5.6 117 40.7 7.0Uapaca sp. (2) 0.16 0.15 0.03 0.06 7.6 130 9.8 9.4
Meliaceae Guarea cedrata (3) 0.07 0.09 0.02 0.14 12.3 67.3 41.6 11.1Trichilia sp. (1) 0.11 0.15 0.02 0.12 9.4 27.0 41.7 5.3Trichilia sp. (1) 0.14 0.16 0.03 0.15 15.5 70.4 24.6 23.0Trichilia sp. (welwitschii?) (1) 0.11 0.25 0.03 0.15 12.5 98.5 17.3 34.1
Moraceae Ficus spp. (5) 0.61 0.23 0.04 0.10 11.3 71.8 43.1 16.9Trilepisium madagascariense (1) 0.40 0.21 0.04 0.12 10.3 156 80.7 15.1
Myristicaceae Pycnanthus angolensis (1) 0.03 0.09 0.02 0.06 12.5 42.4 10.6 4.7Staudtia kamerunensis (2) 0.11 0.15 0.02 0.13 24.0 61.0 88.6 14.6
Olacaceae Heisteria zimmereri (1) 0.06 0.19 0.02 0.25 13.1 52.7 108 10.0Strombosiopsis tetrandra (1) 0.06 0.09 0.03 0.10 9.0 71.3 18.1 17.0
Rhamnaceae Maesopsis eminii (1) 0.13 0.14 0.01 0.10 2.7 199 108 10.0Sapindaceae Blighia welwitschii (1) 0.18 0.47 0.03 0.18 27.1 71.1 10.5 29.7
Eriocoelum macrocarpum (1) 0.06 0.13 0.02 0.40 44.9 47.9 25.5 41.9Sterculiaceae Eribroma oblongum (2) 0.18 0.16 0.02 0.08 2.3 71.7 56.5 7.9Ulmaceae Celtis tessmannii (1) 0.24 0.31 0.04 0.09 10.1 56.0 222 8.9
calcium alone (Figure 2). This presents some questions forfurther study: Where there are two independent nutrientsthat contribute to an animal’s health, what behaviouralmechanisms exist to optimize both? In this system, whatcombinations of fruit are leading to a diet with a high Ca : Pratio in some years and not others and thus to greaterbreeding success? What is the relative importance of eachcontributor to breeding success?
Figs (Ficus spp.) have often been considered to bekeystone species in tropical systems (Gautier-Hion &Michaloud 1989, Kinnaird & O’Brien 2005, 2008;Lambert & Marshall 1991, Leighton & Leighton 1983,Shanahan et al. 2001, Terborgh 1986). Specifically, theyhave been found to have high calcium concentration
and Ca : P ratios in a number of systems (O’Brien et al.1998, Wendeln et al. 2000). In the Dja, the averageCa : P ratio for Ficus spp. in our samples is 6.60 (N =5) and the average for all non-fig samples is 3.03 (N =56; Table 4). This is similar to the pattern seen in othersystems (O’Brien et al. 1998). However, Ficus spp. makeup a small percentage of the feeding observations overthe study period (0.88% of the C. atrata diet and 5.68%of the B. albotibialis; Appendix 2) and those observationsare not concentrated in June and July when calcium ispeaking in the observed diet. Therefore, while figs do havea disproportionately high Ca : P ratio and hornbills areeating them in the Dja, they are not a keystone calciumsource in this system.
Avian nutrition over time in Africa 285
Table 5. Macronutrient and cell wall constituent concentrations of fruit samples collected in the Dja Reserve,Cameroon, in 1995 and 1997. Samples were stored in 70% ethanol in the field. CP = Crude Protein, Sol CHO =soluble carbohydrates, NDF = Neutral Detergent Fibre and ADF = Acid Detergent Fibre.
Ash CP Sol CHO NDF ADF Lignin FatFamily Species (N) % DM
Anacardiaceae Lannea welwitschii (1) 3.9 6.0 3.1 64.2 51.5 23.1Anisophylleaceae Anopyxis klaineana (1) 3.4 6.9 5.5 54.0 46.8 26.8Annonaceae Cleistopholis glauca (2) 1.2 5.0 9.7 57.3 40.4 13.0
Cleistopholis patens (1) 3.3 6.4 32.0 29.7 25.4 14.2Enantia chlorantha (3) 4.8 12.7 13.0 44.6 32.2 12.6Pachypodanthium staudtii (1) 1.8 5.4 19.8 53.8 45.9 29.0Polyalthia suaveolens (1) 2.5 9.4 28.7 37.2 27.4 15.6Xylopia aethiopica (1) 1.3 4.8 0.8 35.2 26.5 10.4 59.0Xylopia rubescens (1) 2.2 4.9 3.9 52.4 32.6 7.6Xylopia sp. (1) 1.2 9.2 1.5 56.3 39.2 9.8 20.7Xylopia staudtii (1) 1.6 8.6 6.5 43.7 32.2 4.4 21.4
Apocynaceae Rauwolfia macrophylla (2) 7.5 7.6 10.5 24.1 19.3 8.4 10.4Arecaceae Elaeis guineensis (2) 2.2 3.1 3.7 18.5 11.7 6.6 69.4
Eremospatha macrocarpa (1) 3.0 7.4 24.5 45.5 29.9 17.3Lacosperma secundiflorum (1) 3.0 6.9 30.8 39.6 23.1 12.9Raphia monbuttorum (2) 3.0 3.7 14.3 32.0 23.3 9.4 29.7
Burseraceae Canarium schweinfurthii (2) 3.8 3.7 3.7 39.6 38.9 30.3 33.1Canarium schweinfurthii (1) 5.9 8.9 3.9 44.4 30.2 18.1
Combretaceae Pteleopsis hylodendron (2) 7.4 12.8 1.1 60.3 48.3 19.2 8.7Connaraceae Unknown (2) 9.1 5.5 5.3 16.9 9.4 7.6 67.5Dracaenaceae Dracaena arborea (1) 1.9 7.7 44.7 9.5 5.4 1.1 10.6Euphorbiaceae Bridelia sp. (1) 2.8 7.2 20.7 37.3 32.8 24.1
Macaranga sp. (1) 3.0 5.6 12.8 13.0 5.9 3.6 47.5Uapaca paludosa (2) 4.7 3.1 20.5 50.0 53.5 41.6 5.4Uapaca sp. (2) 4.5 3.7 7.1 68.6 71.1 56.1 2.5
Meliaceae Guarea cedrata (3) 2.5 8.2 41.9 8.9 3.9 1.4 14.0Trichilia sp. (1) 2.0 6.7 12.5 14.6 11.6 6.1 13.9Trichilia sp. (1) 2.9 7.0 12.6 14.3 10.9 5.4 20.9Trichilia sp. (welwitschii?) (1) 3.1 10.3 16.7 13.8 10.3 5.2 14.4
Moraceae Ficus spp. (5) 4.4 5.4 5.3 66.9 54.8 30.6 2.6Trilepisium madagascariense (1) 6.5 8.9 18.4 23.3 18.2 12.7
Myristicaceae Pycnanthus angolensis (1) 1.0 3.4 3.4 17.5 6.2 4.0Staudtia kamerunensis (2) 1.6 7.6 13.7 50.6 36.2 30.5
Olacaceae Heisteria zimmereri (1) 3.7 12.5 17.3 9.2 5.0 4.5Strombosiopsis tetrandra (1) 4.4 7.6 35.0 40.4 35.2 20.8
Rhamnaceae Maesopsis eminii (1) 3.4 8.9 22.5 46.7 43.1 28.2Sapindaceae Blighia welwitschii (1) 3.6 19.5 4.3 33.3 22.8 17.8
Eriocoelum macrocarpum (1) 0.6 6.3 30.6 83.9 34.8 34.8Sterculiaceae Eribroma oblongum (2) 5.0 5.2 0.9 40.6 33.3 7.6 29.9Ulmaceae Celtis tessmannii (1) 4.5 6.7 17.4 32.3 19.4 13.2
A major assumption made here was the substitution ofthe proportional representation of each fruit in hornbilldiets for the total dry mass of each food item eatenduring a time period. Even though feeding observationsare relatively simple data to collect in the field, it is notobvious how well they substitute for the actual dry massof fruit consumed. The fraction of feeding observationsis a sample more of how long birds are spending atfeeding sites (foraging time, tti) than of how much oftheir diet that item represents. If we assume that foragingtime is a good proxy for dry mass consumed, the systemis simplified and estimation of the water content andforaging efficiency is avoided. Differences in foragingefficiency between fruit may be partly compensated for
by differences in water content. It is plausible that largerwetter fruits will be more efficiently harvested (i.e. moremass consumed per unit time) than smaller, drier fruits.Thus the product of efficiency and dry mass may be closerto a constant than either alone. To the degree that this istrue, the simplification of removing dry mass and foragingefficiency from the calculation will not affect the varianceof the result.
In the Dja, hornbills appear to actively select a diet basedon nutritional content, including mineral concentration.They are eating a diet significantly higher in calciumbefore and during egg-laying and they are then selectinga fruit diet that is significantly higher in fat (energy)and iron through the end of the breeding season while

286 AARON M. LAMPERTI ET AL.
supplementing with invertebrates for protein to feed theiryoung (Table 5).
The two indices presented in this study show seasonalvariation in nutrient flows in the Dja, producing resultsthat match expectations based on known breeding biologyand timing. The assumptions of a calorically adequatediet, of consistent nutritional and water content of fruitover time, of the proportionality of foraging time to drymass consumed, and the proportionality of dbh to fruitproduction (to name a few) may lessen the precision ofthe results, but the indices accurately reflect expectationsof how these birds will modify their diets to meet seasonalshifts in nutrient and energy demands. We conclude thatthese indices are useful in making comparisons betweenthe chosen versus neutral diets and for predicting breedingsuccess from seasonal diet data for these tropical avianfrugivores.
ACKNOWLEDGEMENTS
We are grateful to the government of the Republic ofCameroon, in particular the Ministry of Environment andForests (MINEF) and the Ministry of Higher Educationand Scientific Research (MINREST), for permission toconduct this research. In particular we wish to thankJ. M. Mengang, J.-P. Boyogueno and V. S. Balinga.Financial and logistical support were generously providedby NYZS/The Wildlife Conservation Society, the NationalScience Foundation Graduate Fellowship Program, theGAANN and MIRT fellowship programmes of SanFrancisco State University, and ECOFAC Cameroun. Forassistance in the field we thank S. Benge, M. Biederman,A. L. Bowersox, B. L. Demarest, F. E. Eanet, C. Gjerdrum,E. R. Hekkala, N. A. Helme, C. Hess, D. A. Kilimnik, M.Kimura, D. LeFer, D. Marnel, T. W. Richardson, M. R.Russell, R. E. Rynning, J. G. Schuetz, A. P. Smyth, D.Sonwa, E. Springborn, J. Witkin, T. A. Worth and G. M.Yanega. Residents of Bifolone and Somalomo, particularlyA. Siec, D. Amazieh, J. Mann, M. Mbenge and B. Bokama,generously shared their knowledge of the forest withus. We wish to acknowledge the unique contributionsof J.-M. Froment, J.-P. Vautherin, R. C. Fotso, P.Muchaal, S. Weise, B. Brennand, S. Scheffler and T. &H. Hockey.
LITERATURE CITED
ANGGRAINI, K., KINNAIRD, M. & O’BRIEN, T. 2000. The
effects of fruit availability and habitat disturbance on an
assemblage of Sumatran hornbills. Bird Conservation International 10:
189–202.
AOAC 1995. Official methods of analysis of AOAC International. (Sixteenth
edition). AOAC International, Gaithersburg. 1200 pp.
BARCLAY, R. 1995. Does energy or calcium availability constrain
reproduction by bats? Pp. 245–258 in Racey, P. A. & Swift, S. M.
(eds.). Ecology, evolution and behaviour of bats. The Zoological Society
of London. Clarendon Press, London.
DATTA, A. & RAWAT, G. S. 2004. Nest-site selection and nesting
success of three hornbill species in Arunachal Pradesh, north-east
India: Great Hornbill Buceros bicornis, Wreathed Hornbill Aceros
undulatus and Oriental Pied Hornbill Anthracoceros albirostris. Bird
Conservation International 14.S1:S39–S52.
DHONDT, A. A. & HOCHACHKA, W. M. 2001. Variations in
calcium use by birds during the breeding season. The Condor 103:
592–598.
DIERENFELD, E. S. 1996. Nutritional wisdom: adding the science to the
art. Zoo Biology 15:447–448.
DUNN, E. H. 1980. On the variability in energy allocation of nestling
birds. The Auk (1980):19–27.
FOEKEN, S. G., DE VRIES, M., HUDSON, E., SHEPPARD, C. D. &
DIERENFELD, E. S. 2008. Determining nitrogen requirements of
Aceros and Buceros hornbills. Zoo Biology 27:282–293.
FOGIEL, M. F. 2007. An evaluation of fruit availability theory and
measurement in an afrotropical rainforest. M.S. Thesis, San Francisco
State University.
GARCIA-NAVAS, V. & SANZ, J. J. 2011. The importance of a main dish:
nestling diet and foraging behaviour in Mediterranean blue tits in
relation to prey phenology. Oecologia 165:639–649.
GAUTIER-HION, A. & MICHALOUD, G. 1989. Are figs always keystone
resources for tropical frugivorous vertebrates? A test in Gabon.
Ecology 70:1826–1833.
GOERING, H. K. & VAN SOEST, P. J. 1970. Forage fiber analysis.
Agricultural handbook #379. A.R.S., USDA Washington, DC.
24 pp.
GRAVELAND, J. & DRENT, R. H. 1997. Calcium availability limits
breeding success of passerines on poor soils. Journal of Animal Ecology
66:279–288.
GRAVELAND, J. & VANDERWAL, R. 1996. Decline in snail abundance
due to soil acidification causes eggshell defects in forest passerines.
Oecologia 105:351–360.
HARDESTY, B. D. 1999. Seed rain and dispersal patterns in a lowland
tropical rain forest. MA Thesis, San Francisco State University.
HARDESTY, B. D. & PARKER, V. T. 2003. Community seed rain patterns
and a comparison to adult community structure in a West African
tropical forest. Plant Ecology 164:49–64.
HERRERA, C. M. 1982. Seasonal variation in the quality of fruits and
diffuse coevolution between plants and avian dispersers. Ecology
63:773–785.
HOBSON, K. A., SHARP, C. M., JEFFERIES, R. L., ROCKWELL, R. F. &
ABRAHAM, K. F. 2011. Nutrient allocation strategies to eggs by
Lesser Snow Geese (Chen caerulescens) at a sub-Arctic colony. The Auk
128:156–165.
HOLBROOK, K. M. & SMITH, T. B. 2000. Seed dispersal and movement
patterns in two species of Ceratogymna hornbills in West African
tropical lowland forest. Oecologia 125:249–257.
HOLBROOK, K. M., SMITH, T. B. & HARDESTY, B. D. 2002. Long-
distance movements of frugivorous rainforest hornbills. Ecography
25:745–749.
Avian nutrition over time in Africa 287
KANNAN, R. & JAMES, D. A. 1999. Fruiting phenology and
the conservation of the Great Pied Hornbill (Buceros bicornis)
in the Western Ghats of Southern India. Biotropica 31:
167–177.
KARR, J. R. 1976. Seasonality, resource availability, and community
diversity in tropical bird communities. American Naturalist 110:973–
994.
KEMP, A. C. 2001. Family Bucerotidae (Hornbills). Pp. 436–523 in del
Hoyo, J., Elliott, A., & Sargatal, J. (eds.). Handbook of the birds of the
World. Vol. 6. Mousebirds to hornbills. Lynx Edicions, Barcelona.
KINNAIRD, M. F. & O’BRIEN, T. G. 1999. Breeding ecology of the
Sulawesi Red-Knobbed Hornbill Aceros cassidix. Ibis 141:60–69.
KINNAIRD, M. F. & O’BRIEN, T. G. 2005. Fast foods of the forest: the
influence of figs on primates and hornbills across Wallace’s line.
Pp. 155–184 in Dew, J. L. & Boubli, J. P. (eds.). Tropical fruits and
frugivores. Springer, the Netherlands.
KINNAIRD, M. F. & O’BRIEN, T. G. 2008. The ecology and conservation
of Asian hornbills: farmers of the forest. University of Chicago Press,
Chicago. 315 pp.
KITAMURA, S., THONG-AREE, S., MADSRI, S. & POONSWAD, P. 2011.
Characteristics of hornbill-dispersed fruits in lowland dipterocarp
forests of southern Thailand. The Raffles Bulletin of Zoology 24:137–
147.
LAMBERT, F. R. & MARSHALL, A. G. 1991. Keystone characteristics
of bird-dispersed Ficus in a Malaysian lowland rain forest. Journal of
Ecology 79:793–809.
LAMPERTI, A. M. 2004. Aspects of the seed dispersal ecology of
Ceratogymna hornbills in the Dja Reserve, Cameroon. MA Thesis, San
Francisco State University.
LEIGHTON, M. & LEIGHTON, D. R. 1983. Vertebrate responses to
fruiting seasonality within a Bornean rain forest. Pp. 181–196 in
Sutton, S. L., Whitmore, T. C. & Chadwick, A. C. (eds.). Tropical
rain forest: ecology and management. Blackwell Scientific Publications,
Oxford.
MARTIN, T. E. 1987. Food as a limit on breeding birds: a life-history
perspective. Annual Review of Ecology and Systematics 18:453–487.
MARTIN, T. E. 1993. Nest predation and nest sites. BioScience 43:523–
532.
MCDOWELL, L. R. 2003. Minerals in animal and human nutrition. (Second
edition). Elsevier, Amsterdam. 660 pp.
MCKEY, D. 1975. The ecology of coevolved seed dispersal systems.
Pp. 159–191 in Gilbert, L. E. & Austin, P. H. (eds.). Coevolution of
animals and plants. University of Texas Press, Austin.
MUCHAAL, P. K. & NGANDJUI, G. 1995. Wildlife populations in the
western Dja Reserve (Cameroon): an assessment of the impact of
village hunting and alternatives for sustainable utilization. Republic
of Cameroon Ministry of Environment and Forests and ECOFAC
(Conservation and Sustainable Utilization of Forest Ecosystems in
Central Africa). Yaounde, Cameroon.
MUCHAAL, P. K. & NGANDJUI, G. 1999. Impact of village hunting
on wildlife populations in the Western Dja Reserve, Cameroon.
Conservation Biology 13:385–396.
MURPHY, M. E. 1996. Nutrition and metabolism. Pp. 31–60 in Carey,
C. (ed.). Avian energetics and nutritional ecology. Chapman & Hall, New
York.
NAGER, R. G. 2006. The challenges of making eggs. Ardea-Wageningen
94.3:323.
O’BRIEN, T. G., KINNAIRD, M. F., DIERENFELD, E. S., CONKLIN-
BRITTAIN, N. L., WRANGHAM, R. W. & SILVER, S. C. 1998. What’s
so special about figs? Nature 392:668.
OTTEN, B. A., OROSZ, S. E., AUGE, S. & FRAZIER, D. L.2001. Mineral
content of food items commonly ingested by keel-billed toucans
(Ramphastos sulfuratus). Journal of Avian Medicine and Surgery
15:194–196.
PERKIN ELMER. 1982. Analytical methods for atomic absorption
spectrophotometry. Perkin Elmer, Norwalk. 300 pp.
POONSWAD, P., TSUJI, A. & JIRAWATKAVI, N. 2004. Estimation
of nutrients delivered to nest inmates by four sympatric species of
hornbills in Khao Yai National Park, Thailand. Ornithological Science
3:99–112.
POULIN, B., LEFEBVRE, G. & MCNEIL, R. 1992. Tropical avian
phenology in relation to abundance and exploitation of food
resources. Ecology 73:2295–2309.
POULSEN, J. R., CLARK, C. J. & SMITH, T. B. 2001. Seed dispersal by a
diurnal primate community in the Dja Reserve, Cameroon. Journal of
Tropical Ecology 17:787–808.
POULSEN, J. R., CLARK, C. J., CONNOR, E. F. & SMITH, T. B. 2002.
Differential resource use by primates and hornbills: implications for
seed dispersal. Ecology 83:228–240.
ROBBINS, C. T. 1993. Wildlife feeding and nutrition. Academic Press, New
York. 352 pp.
RENDELL, W. B. & ROBERTSON, R. J. 1994. Cavity-entrance orientation
and nest-site use by secondary hole-nesting birds. Journal of Field
Ornithology 65:27–35.
RUBY, J., NATHAN, P. T., BALASINGH, J. & KUNZ, T. H. 2000. Chemical
composition of fruits and leaves eaten by short-nosed fruit bat,
Cynopterus sphinx. Journal of Chemical Ecology 26:2825–2841.
SCHOENER, T. W. 1968. The Anolis lizards of Bimini: resource
partitioning in a complex fauna. Ecology 49:704–726.
SHANAHAN, M., SO, S., COMPTON, S. G. & CORLETT, R. 2001. Fig-
eating by vertebrate frugivores: a global review. Biological Reviews
76:529–572.
SIBLY, R. M., WITT, C. C., WRIGHT, N. A., VENDITTI, C., JETZ, W. &
BROWN, J. H. 2012. Energetics, lifestyle, and reproduction in birds.
Proceedings of the National Academy of Sciences, USA 109:10937–
10941.
STAUFFER, D. & SMITH, T. B. 2004. Breeding and nest site
characteristics of the Black-casqued Hornbill Ceratogymna atrata and
White-thighed Hornbill Ceratogymna cylindricus in south-central
Cameroon. Ostrich 75:79–88.
STILES, E. W. 1993. The influence of pulp lipids on fruit preference by
birds. Vegetatio 107/108:227–235.
STRICKLAND, J. D. H. & PARSON, T. R. 1972. A practical handbook of
seawater analysis. Fisheries Board of Canada, Ottawa. 310 pp.
TERBORGH, J. 1986. Keystone plant resources in the tropical forest.
Pp. 330–344 in Soule, M. E. (ed.). Conservation biology: the science of
scarcity and diversity. Sinauer, Sunderland.
TILGAR, V., MAND, R. & MAGI, M. 2002. Calcium shortage as
a constraint on reproduction in great tits Parus major: a field
experiment. Journal of Avian Biology 33:407–413.
288 AARON M. LAMPERTI ET AL.
WENDELN, M. C., RUNKLE, J. R. & KALKO, E. K. V. 2000. Nutritional
values of 14 fig species and bat feeding preferences in Panama.
Biotropica 32:489–501.
WHITNEY, K. D. & SMITH, T. B. 1998. Habitat use and resource
tracking by African Ceratogymna hornbills: implications for
seed dispersal and forest conservation. Animal Conservaton 1:
107–117.
WHITNEY, K. D., FOGIEL, M. K., SMITH, T. B., PARKER, V. T. &
STAUFFER, D. J. 1996. Dja Hornbill Project. EEP Hornbill Taxon
Advisory Group Newsletter 2:25.
WHITNEY, K. D., FOGIEL, M. K., LAMPERTI, A. M., HOLBROOK, K. M.,
STAUFFER, D. J., HARDESTY, B. D., PARKER, V. T. & SMITH, T. B.
1998. Seed dispersal by Ceratogymna hornbills in the Dja Reserve,
Cameroon. Journal of Tropical Ecology 14:351–371.
Appendix 1. Tree-plot data used to generate the model of nutrient availability (Fogiel 2007). Average dbhand species density were estimated from surveys of trees greater than 10 cm dbh in two belt transects,32 40-m2 plots and three 100-m2 plots in 1994.
SpeciesAverage dbh
(cm)Density
(stems ha−1)
Anopyxis klaineana Pierre 86.7 −Blighia welwitschii (Hiern.) Radlk. 37.1 −Canarium schweinfurtii Engl. 91.2 0.39Celtis tessmannii Rendle 40.6 −Cleistopholis glauca Pierre ex Engl. & Diels 26 1.76Cleistopholis patens Engl. & Diels 28.1 0.78Coelocaryon preussii Warb. 29.7 1.56Dacryodes edulis (G.Don) H.J.Lam 61.3 −Dracaena arborea Hort.Angl. ex Link 106 −Enantia chlorantha Oliv. 21.8 6.25Eriocoelum macrocarpum Gilg ex Engl. & Radlk. 21.1 6.84Eribroma oblongum (Mast.) Pierre ex A.Chev. 29.2 1.17Ficus sp. 47.4 0.2Heisteria zimmereri Engl. 55 −Lannea welwitschii (Hiern) Engl. 71.4 −Macaranga sp. Thouars 35.3 −Maesopsis eminii Engl. 13.4 0.2Pachypodanthium staudtii Engl. & Diels 47.5 −Polyalthia suaveolens Engl. & Diels 18.8 12.11Pycnanthus angolensis (Welw.) Exell 90.0 −Rauwolfia macrophylla Stapf 44.6 0.39Staudtia kamerunensis Warb. 26.1 0.59Strombosiopsis tetrandra Engl. 21.3 18.75Uapaca sp. 88.3 −Uapaca paludosa Aubrev. & Leandri 48.3 −Xylopia aethiopica A.Rich. 48.3 −Xylopia rubescens Oliv. 22.1 2.93Xylopia staudtii Engl. & Diels 38.5 0.98
Avian nutrition over time in Africa 289
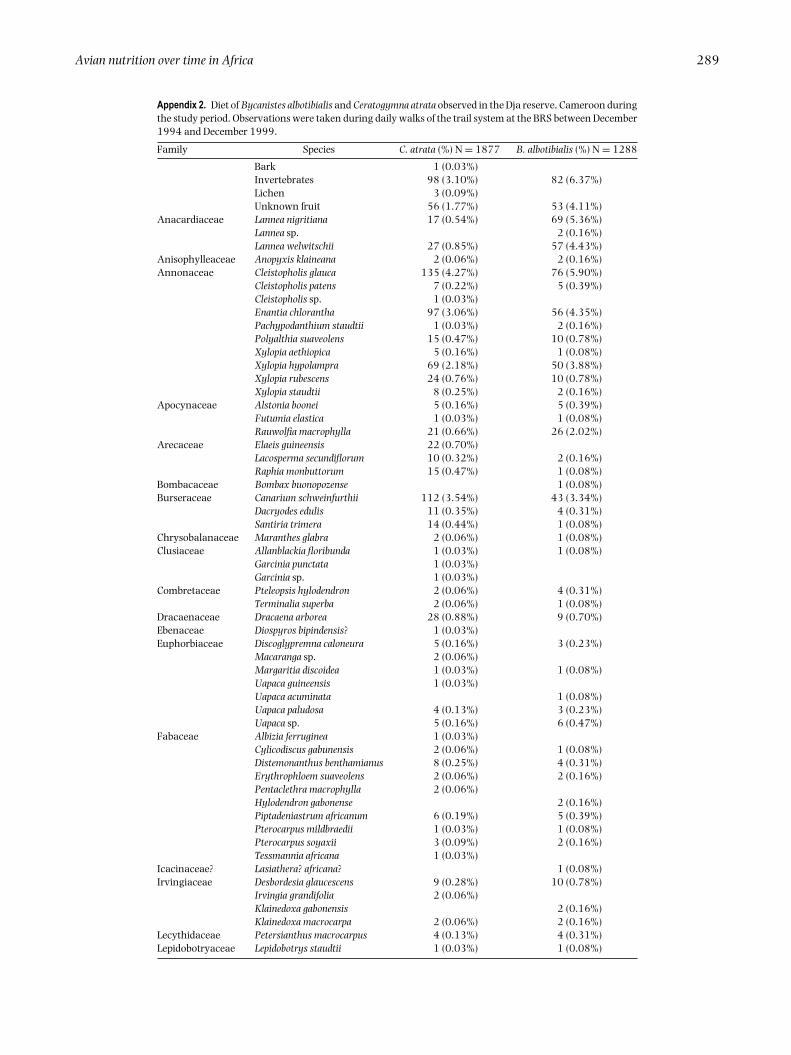
Appendix 2. Diet of Bycanistes albotibialis and Ceratogymna atrata observed in the Dja reserve, Cameroon duringthe study period. Observations were taken during daily walks of the trail system at the BRS between December1994 and December 1999.
Family Species C. atrata (%) N = 1877 B. albotibialis (%) N = 1288
Bark 1 (0.03%)Invertebrates 98 (3.10%) 82 (6.37%)Lichen 3 (0.09%)Unknown fruit 56 (1.77%) 53 (4.11%)
Anacardiaceae Lannea nigritiana 17 (0.54%) 69 (5.36%)Lannea sp. 2 (0.16%)Lannea welwitschii 27 (0.85%) 57 (4.43%)
Anisophylleaceae Anopyxis klaineana 2 (0.06%) 2 (0.16%)Annonaceae Cleistopholis glauca 135 (4.27%) 76 (5.90%)
Cleistopholis patens 7 (0.22%) 5 (0.39%)Cleistopholis sp. 1 (0.03%)Enantia chlorantha 97 (3.06%) 56 (4.35%)Pachypodanthium staudtii 1 (0.03%) 2 (0.16%)Polyalthia suaveolens 15 (0.47%) 10 (0.78%)Xylopia aethiopica 5 (0.16%) 1 (0.08%)Xylopia hypolampra 69 (2.18%) 50 (3.88%)Xylopia rubescens 24 (0.76%) 10 (0.78%)Xylopia staudtii 8 (0.25%) 2 (0.16%)
Apocynaceae Alstonia boonei 5 (0.16%) 5 (0.39%)Futumia elastica 1 (0.03%) 1 (0.08%)Rauwolfia macrophylla 21 (0.66%) 26 (2.02%)
Arecaceae Elaeis guineensis 22 (0.70%)Lacosperma secundiflorum 10 (0.32%) 2 (0.16%)Raphia monbuttorum 15 (0.47%) 1 (0.08%)
Bombacaceae Bombax buonopozense 1 (0.08%)Burseraceae Canarium schweinfurthii 112 (3.54%) 43 (3.34%)
Dacryodes edulis 11 (0.35%) 4 (0.31%)Santiria trimera 14 (0.44%) 1 (0.08%)
Chrysobalanaceae Maranthes glabra 2 (0.06%) 1 (0.08%)Clusiaceae Allanblackia floribunda 1 (0.03%) 1 (0.08%)
Garcinia punctata 1 (0.03%)Garcinia sp. 1 (0.03%)
Combretaceae Pteleopsis hylodendron 2 (0.06%) 4 (0.31%)Terminalia superba 2 (0.06%) 1 (0.08%)
Dracaenaceae Dracaena arborea 28 (0.88%) 9 (0.70%)Ebenaceae Diospyros bipindensis? 1 (0.03%)Euphorbiaceae Discoglypremna caloneura 5 (0.16%) 3 (0.23%)
Macaranga sp. 2 (0.06%)Margaritia discoidea 1 (0.03%) 1 (0.08%)Uapaca guineensis 1 (0.03%)Uapaca acuminata 1 (0.08%)Uapaca paludosa 4 (0.13%) 3 (0.23%)Uapaca sp. 5 (0.16%) 6 (0.47%)
Fabaceae Albizia ferruginea 1 (0.03%)Cylicodiscus gabunensis 2 (0.06%) 1 (0.08%)Distemonanthus benthamianus 8 (0.25%) 4 (0.31%)Erythrophloem suaveolens 2 (0.06%) 2 (0.16%)Pentaclethra macrophylla 2 (0.06%)Hylodendron gabonense 2 (0.16%)Piptadeniastrum africanum 6 (0.19%) 5 (0.39%)Pterocarpus mildbraedii 1 (0.03%) 1 (0.08%)Pterocarpus soyaxii 3 (0.09%) 2 (0.16%)Tessmannia africana 1 (0.03%)
Icacinaceae? Lasiathera? africana? 1 (0.08%)Irvingiaceae Desbordesia glaucescens 9 (0.28%) 10 (0.78%)
Irvingia grandifolia 2 (0.06%)Klainedoxa gabonensis 2 (0.16%)Klainedoxa macrocarpa 2 (0.06%) 2 (0.16%)
Lecythidaceae Petersianthus macrocarpus 4 (0.13%) 4 (0.31%)Lepidobotryaceae Lepidobotrys staudtii 1 (0.03%) 1 (0.08%)
290 AARON M. LAMPERTI ET AL.
Appendix 2. Continued
Family Species C. atrata (%) N = 1877 B. albotibialis (%) N = 1288
Meliaceae Entandophragma cylindricum 1 (0.03%) 2 (0.16%)Entandrophragma angolense 1 (0.03%)Guarea cedrata 49 (1.55%) 43 (3.34%)Guarea thompsonii 18 (0.57%) 30 (2.33%)Trichilia sp. 6 (0.19%) 8 (0.62%)Trichilia welwitschii 11 (0.35%) 6 (0.47%)Turraeanthus africanus 1 (0.08%)
Moraceae Ficus dekdekena? 1 (0.03%) 2 (0.16%)Ficus sp. 25 (0.79%) 67 (5.20%)Milicia excelsa 1 (0.03%) 1 (0.08%)Musanga cercropioides 1 (0.03%) 2 (0.16%)Trilepisium madagascariense 1 (0.08%)
Myristicaceae Coelocaryon preussii 37 (1.17%) 1 (0.08%)Pycnanthus angolensis 300 (9.48%) 34 (2.64%)Staudtia kamerunensis 257 (8.12%) 102 (7.92%)
Myrtaceae Syzygium sp. 1 (0.03%) 1 (0.08%)Olacaceae Heisteria zimmereri 12 (0.38%) 10 (0.78%)
Ongokea gore 2 (0.06%)Strombosia grandifolia 1 (0.03%)Strombosia pustulata 2 (0.06%) 2 (0.16%)Strombosia scheffleri 1 (0.03%)Strombosiopsis tetrandra 1 (0.03%) 1 (0.08%)
Rhamnaceae Maesopsis eminii 214 (6.76%) 310 (24.07%)Rubiaceae Rubiaceae sp. 1 (0.03%) 1 (0.08%)Sapindaceae Blighia welwitschii 15 (0.47%) 2 (0.16%)
Eriocoelum macrocarpum 11 (0.35%) 5 (0.39%)Sapotaceae Breviea sericea 1 (0.08%)
Gambeya lacourtiana 2 (0.06%)Gambeya perpulchra? 3 (0.09%)
Sterculiaceae Eribroma oblongum 14 (0.44%) 17 (1.32%)Ulmaceae Celtis mildraedii 9 (0.28%) 10 (0.78%)
Celtis tessmannii 1 (0.03%)Verbenaceae Vitex sp. 2 (0.11%)
Top Related
Copyright © 2022 FDOKUMEN

