


Bahasa
Halaman
Hukum


Determinants of Protein Abundanceand Translation Efficiency in S. cerevisiaeTamir Tuller
1,2*, Martin Kupiec
2, Eytan Ruppin
1,3*
1 School of Computer Science, Tel Aviv University, Tel Aviv, Israel, 2 Department of Molecular Microbiology and Biotechnology, Tel Aviv University, Tel Aviv, Israel, 3 School of
Medicine, Tel Aviv University, Tel Aviv, Israel
The translation efficiency of most Saccharomyces cerevisiae genes remains fairly constant across poor and rich growthmedia. This observation has led us to revisit the available data and to examine the potential utility of a proteinabundance predictor in reinterpreting existing mRNA expression data. Our predictor is based on large-scale data ofmRNA levels, the tRNA adaptation index, and the evolutionary rate. It attains a correlation of 0.76 with experimentallydetermined protein abundance levels on unseen data and successfully cross-predicts protein abundance levels inanother yeast species (Schizosaccharomyces pombe). The predicted abundance levels of proteins in known S. cerevisiaecomplexes, and of interacting proteins, are significantly more coherent than their corresponding mRNA expressionlevels. Analysis of gene expression measurement experiments using the predicted protein abundance levels yields newinsights that are not readily discernable when clustering the corresponding mRNA expression levels. Comparingprotein abundance levels across poor and rich media, we find a general trend for homeostatic regulation wheretranscription and translation change in a reciprocal manner. This phenomenon is more prominent near origins ofreplications. Our analysis shows that in parallel to the adaptation occurring at the tRNA level via the codon bias,proteins do undergo a complementary adaptation at the amino acid level to further increase their abundance.
Citation: Tuller T, Kupiec M, Ruppin E (2007) Determinants of protein abundance and translation efficiency in S. cerevisiae. PLoS Comput Biol 3(12): e248. doi:10.1371/journal.pcbi.0030248
Introduction
DNA microarrays are now commonly used to measure theexpression levels of large numbers of genes simultaneously[1]. Since proteins are the direct mediators of cellularprocesses, the abundance level of each protein is likely tobe a better indicator of the cellular state than its correspond-ing mRNA expression level. However, genome-wide technol-ogies to detect protein abundance are still lagging behindthose that measure mRNA, and only few studies that measureprotein abundance on a large scale are currently available [2–6].
The relationship between mRNA and protein abundancelevels has been studied by several groups. Genes with similarmRNA levels may have very different protein abundancelevels [7]. Yet, the correlation between protein and mRNAabundance after a log-transform was shown to be quite high[8]. A more recent study, combining three technologies formeasuring mRNA expression, has yielded correlation levels ofabout 0.7 with protein abundance [9]. Several studies haveaimed at correlating protein abundance to various otherfeatures of proteins, such as their codon bias, molecularweight, stop codon identity, and more [3,4,10,11] Theseinvestigations and other previous proteomic studies [12–14]were usually based on small- to medium-scale measurements.
The current study revisits these issues and presents acomprehensive investigation of the relationship betweenfactors that influence protein abundance and the associatedprotein levels. We begin by constructing a predictor forprotein abundance levels, which, in contrast to previousstudies, is tested and validated on unseen data (see Methods).To this end, we rely on two large-scale protein abundancedatasets [2,5]. Overall, to our knowledge this is the first timethat the whole body of data currently available is collated and
analyzed to this aim, and we obtain a predictor with acorrelation of 0.76 with experimentally determined abun-dance levels. Applying the resulting predictor to pertainingmRNA expression data testifies to its utility. Our analysisprovides new key insights concerning the regulation oftranslation efficiency and its evolution.
Results
Genome-wide studies have measured mRNA and proteinlevels in the yeast Saccharomyces cerevisiae growing either in richmedium (yeast extract, peptone, and dextrose [YEPD]) or onpoor, defined medium (synthetic dextrose [SD]) [2,3,5]. Whenprotein abundance is compared to the corresponding mRNAlevels in a given medium, the translation efficiency (TE), i.e.,the ratio between protein abundance and mRNA levels,exhibits a large variability among genes (spanning across sixorders of magnitude; Figure 1A and 1B). However, when theTEs of a given protein are compared across the two differentgrowth conditions, notably very little variation is observed
Editor: Mark B. Gerstein, Yale University, United States of America
Received May 14, 2007; Accepted October 30, 2007; Published December 21,2007
Copyright: � 2007 Tuller et al. This is an open-access article distributed under theterms of the Creative Commons Attribution License, which permits unrestricteduse, distribution, and reproduction in any medium, provided the original authorand source are credited.
Abbreviations: ARS, autonomously replicating sequence; CAI, codon adaptationindex; ER, evolutionary rate; GO, Gene Ontology; ORF, open reading frame; RTE,relative translation efficiency; SD, synthetic dextrose; SVM, support vector machine;tAI, tRNA adaptation index; TE, translation efficiency; YEPD, yeast extract, peptone,and dextrose
* To whom correspondence should be addressed. E-mail: [email protected](TT); [email protected] (ER)
PLoS Computational Biology | www.ploscompbiol.org December 2007 | Volume 3 | Issue 12 | e2482510

(Figure 1C): the ratios between the TEs of most proteins inthe two conditions are close to 1, with .90% of the proteinsshowing a ratio between 0.5 and 2. This observation, albeitcurrently limited to the two types of media for whichgenome-wide data are available, suggests that the efficiencyof translation per mRNA molecule of many genes may belargely invariable under different conditions. This fairlyconstant TE of yeast genes has motivated us to create alarge-scale predictor of protein abundance, with the aim ofstudying its utility for inferring protein abundance levelsacross different conditions.
The simplest predictor we studied is a linear one based onmRNA expression levels. Training this predictor on arandomly selected subset of the full complement of yeastmRNA and protein levels yields a Spearman rank correlationcoefficient of rs ¼ 0.55 on held-out test data (the proteinabundance was from [2] and mRNA levels were from [15]; seeMethods). To improve the prediction accuracy, we examinedthe potential utility of combining 32 additional proteinattributes into a multivariable linear predictor, some ofwhich have been previously shown to have predictive value(Table S1). A greedy feature selection algorithm identifiedtwo useful protein attributes, while the inclusion of all otherfeatures resulted in a marginal and insignificant improve-ment in the performance of the linear, mRNA-basedpredictor. Performing the prediction by a support vectormachine (SVM) using a variety of nonlinear kernels did notimprove the results (Methods).
The two protein features yielding a significant improve-ment in prediction accuracy were the tRNA adaptation index(tAI) [16,17], and the evolutionary rate (ER) [18,19]. tAI isbased on the synonymous codon usage bias and gene copynumber of different tRNAs and is related to the codonadaptation index (CAI) [16,17]. ER measures the rate ofevolution of a protein by comparing its orthologs acrossrelated species [18,19]. These two features have been shownpreviously to be correlated with protein abundance levels
[18,20]. Combining tAI with mRNA levels increases theprediction accuracy from the levels of rs ¼ 0.55 obtainedusing mRNA levels alone to a Spearman rank correlationcoefficient of rs ¼ 0.61 on the same dataset as above. Addingevolutionary rate values increases the correlation to 0.63. Theincremental improvement of consecutively adding these twofeatures to the basic linear regression protein abundancepredictor is statistically significant (Figure 2 and Methods).Large-scale measurements of mRNA and protein levels
tend to be noisy. Thus, in the (yet rare) cases where severalindependent measurements of mRNA and protein levels atthe same conditions are available, they can be used to reducepotential individual measurement biases by pooling themtogether [9] (the correlation between two proteomic datasetsgenerated by two different techniques and in different labsare between rs ¼ 0.6 and rs ¼ 0.8; see Text S1). We thusaveraged mRNA and protein abundance results obtained withdifferent technologies (see Methods for the description of thepertaining datasets used to this end). This results in a furthernotable improvement of prediction accuracy (rs¼0.76; Figure2), suggesting that a considerable fraction of the variability inthe datasets is due to experimental measurement errors (the
Figure 1. Distribution of TE and RTE in S. cerevisiae
(A) Top: S. cerevisiae genes sorted by their TE (log scale) in YEPD (rich)medium. A large variability of TE values (more than six orders ofmagnitude) is observed. Bottom: histogram, mean, and variance of TE inYEPD.(B) Top: S. cerevisiae genes sorted by their TE (log scale) in SD (poor)medium. A similar large variability of TE values is seen. Bottom:histogram, mean, and variance of TE in SD.(C) Top: S. cerevisiae genes sorted by the log-ratio of their TEs [RTE¼ (pSD/mSD)/(pYEPD/mYEPD)] in SD versus YEPD (log scale). A total of 91% of thegenes have an RTE value between 0.5 and 2. Bottom: histogram, mean,and variance of RTE.doi:10.1371/journal.pcbi.0030248.g001
PLoS Computational Biology | www.ploscompbiol.org December 2007 | Volume 3 | Issue 12 | e2482511
Author Summary
DNA microarrays measuring gene expression levels have been amainstay of systems biology research, but since proteins are moredirect mediators of cellular processes, protein abundance levels arelikely to be a better indicator of the cellular state. However, asproteomic measurements are still lagging behind gene expressionmeasurements, there has been considerable effort in recent years tostudy the correlations between gene expression (and a plethora ofprotein characteristics) and protein abundance. Addressing thischallenge, the current study is one of the first to introduce apredictor for protein abundance levels that is tested and validatedon unseen data using all currently available large-scale proteomicdata. The utility of this predictor is shown via a comprehensive set oftests and applications, including improved functional coherency ofcomplexes and interacting proteins, better fit with gene phenotypicdata, cross-species prediction of protein abundance, and mostimportantly, the reinterpretation of existing gene expression micro-array data. Finally, our revisit and analysis of the existing large-scaleproteomic data reveals new key insights concerning the regulationof translation efficiency and its evolution. Overall, a solid proteinabundance prediction tool is invaluable for advancing our under-standing of cellular processes; this study presents a further step inthis direction.
Determinants of Protein Abundance

improvement of the correlations observed upon averagingcan also be due to the blurring of the effects of differentposttranscriptional regulation processes taking place in thedifferent conditions in which the measurements were done[temperature, strains, media, technique], but since weaveraged over relatively similar conditions, we expect thiseffect to be relatively minor). In the following investigationsreported in this paper, multiple independent measurementsat the same conditions were not available, and the resultsreported are hence without pooling and averaging the data.
Examining the performance of our YEPD-trained predic-tor on a new unseen dataset of 238 genes whose proteinabundance levels were measured under very differentconditions (exposure to pheromone [13]) resulted in a highcorrelation of rs¼0.69. The correlation between mRNA levelssolely and protein abundance levels was 0.62, in comparison.
The standard deviation of 1,000 cross-validation runs of thepredictor was 0.016, and the improvement compared tomRNA-based prediction was significant, with p , 10�16.Further information on the predictors’ performance onspecific Gene Ontology (GO) annotation gene sets is providedin Table S2. This table also shows that the predictor improvesthe prediction of protein abundance levels (compared tomRNA levels) in 92% of the GO annotation categories. Ourpredictor obtains higher correlations with protein abun-dance levels than using mRNA alone across numerous rangesof protein abundance; however, this correlation is notstatistically significant in the lowest protein abundance range(Figure 2C).Using our multivariate linear predictor, expression of
genes whose products are members of the same complex(according to SGD [21]) exhibits significantly higher coher-
Figure 2. Performances of the Linear Predictor of (log) Protein Abundance
(A) The accuracy of various linear predictors of (log) protein abundance, measured by the Spearman rank correlation coefficient over a held-out test set,using a single data source of protein abundance [2] and mRNA levels [15]. ER values are from [19], and tAI data are taken from [20]. The numbers belowthe arrows denote the t-test p-values for checking the null hypothesis that the predictor with the new added feature has identical performance to itspredecessor (see Methods). The final predictor for protein abundance (PA) is log(PA) ¼ 3.97þ 0.4 3 log(mRNA) þ 10.34 3 tAI � 3.35 3 ER.(B) Accuracy of various linear predictors, in the case where protein and mRNA levels are generated by averaging measurements from at least two datasources. The final predictor for protein abundance obtained in this case is log(PA) ¼ 3.47þ 0.63 3 log(mRNA) þ 10.89 3 tAI � 2.923 3 ER.(C) The Spearman correlations (y-axis) of predicted protein abundance (mRNA) with measured protein abundance levels, binned at various levels ofprotein abundance p (x-axis, natural log). All the correlations are higher and significant in the case of predicted protein abundance (p , 2 3 10�5),except for the lowest bin log(p) , 7.doi:10.1371/journal.pcbi.0030248.g002
PLoS Computational Biology | www.ploscompbiol.org December 2007 | Volume 3 | Issue 12 | e2482512
Determinants of Protein Abundance

ency than when calculated from their corresponding mRNAlevels. Table 1 displays the pertaining Spearman rankcorrelation coefficients for pairs of genes that are part ofthe same complex. For the cases of experimentally deter-mined and predicted protein abundance levels, we alsocomputed the partial correlations after controlling for theeffect of mRNA expression levels (Methods). A similar, butweaker trend is also observed when examining the abundancecoherency of protein pairs that exhibit a protein–proteininteraction (Text S2). These results indicate that ourprediction approach is likely to be more appropriate forproteins in large macromolecular complexes than forproteins involved in signaling and transcriptional control,since the latter are heavily posttranslationally modified. Thisnotion is further supported by noting that in the highestprotein abundance bin (Figure 2C), there are 26 genes thatare related to the ‘‘Ribosome’’ GO category, providing ahyper-geometric enrichment of p , 4.2 3 10�4.
Given the observation that the TE of most proteins is fairlysimilar across the two different conditions analyzed, weexamined the utility of the protein abundance predictor ininterpreting the results of two yeast mRNA gene expressiondatasets, obtained under a variety of environmental con-ditions (see Text S3). The first dataset investigated the yeastresponse to low-shear modeled microgravity. It included 12different conditions (six under low-shear and six controls)[22]. To analyze this dataset, we clustered and bi-clustered thegenes in the microarray data in accordance with the mRNAexpression patterns, in a conventional manner. In parallel, weused our predictor to generate predicted protein abundancelevels from the expression levels, and repeated the clusteringand bi-clustering process on the resulting protein abundance
data. We then compared the resulting cluster sets withrespect to their functional enrichment in GO annotations(Methods). We performed a similar analysis on a geneexpression dataset consisting of 36 timepoints taken fromyeast cells growing in continuous, nutrient-limited conditions[23] (the first dataset includes gene expression measurementsof a system that is close to equilibrium, while the secondincludes gene expression measurements of a system in atransient state; see Text S4).Table 2 shows that the use of the predicted protein
abundance values in these datasets results in a significantincrease in the percentage of clusters that exhibit enrichmentfor specific GO terms (for comparison, random predictorssignificantly deteriorate the clustering enrichment scores; seeText S5). In the case of Sheehan’s data [22], the proteinabundance predictor improved both the separation and thehomogeneity. In the case of Tu’s data [23], the homogeneityimproved while the separation score deteriorated (Table 2). Acloser analysis provides evidence for the advantage of usingthe predictor: in the first dataset, a new bi-cluster is detected(cluster 4) in the protein abundance analysis that does notappear in the mRNA level analysis. This bi-cluster spans over11 of the 12 conditions and is enriched with many GOannotations (mainly related to metabolism; Table S4).Similarly, in the second dataset, cluster 7 in the predictedprotein abundance analysis is a novel group that does notappear when analyzing mRNA levels. This cluster shows astriking periodic expression that coincides with the respira-tory bursts observed under continuous nutrient-limitedconditions [23]. Thus, using predicted protein abundancelevels, a simple conventional clustering method suffices toreveal novel central clusters that were not apparent in the
Table 1. The Spearman Rank Correlation Coefficients and Partial Spearman Correlations between mRNA, Protein Abundance, andPredicted Protein Abundance Levels in YEPD and SD for Gene Pairs That Are Part of the Same Complex
Description Correlation p-Value Partial Correlation p-Value
YEPD, mRNA level 0.1378 6.31 3 10�10 — —
YEPD, protein abundance 0.1908 ,10�16 0.1296 1.2 3 10�8
YEPD, predicted protein abundance 0.1897 ,10�16 0.1 4.5 3 10�5
SD, mRNA level 0.0863 5.5 3 10�4 — —
SD, protein abundance 0.1758 1.4 3 10�12 0.1321 3.8 3 10�7
SD, predicted protein abundance 0.1487 2.3 3 10�9 0.0957 3.6 3 10�4
Measuring the coherency of expression levels of proteins that are part of the same complex or are interacting neighbors in the protein network. Methods and Text S8 include a detaileddescription of how these values were computed.doi:10.1371/journal.pcbi.0030248.t001
Table 2. The Percentage of GO-Enriched Clusters and the Percentage of GO-Enriched Bi-Clusters Obtained by Analyzing mRNA Levelsor Predicted Protein Abundance Levels in Two Gene Expression Datasets, and the Total Homogeneity and Separation Scores for theClustering Results
Dataset Percentage Enriched Clusters Homogeneity Separation Percentage Enriched Bi-Clusters
Sheehan et al. [22] mRNA 57 0.77 �0.58 100
Sheehan et al. [22] predicted protein abundance 85 0.78 �0.6 100
Tu et al. [23] mRNA 85 0.68 �0.28 100
Tu et al. [23]predicted protein abundance 100 0.71 �0.23 100
doi:10.1371/journal.pcbi.0030248.t002
PLoS Computational Biology | www.ploscompbiol.org December 2007 | Volume 3 | Issue 12 | e2482513
Determinants of Protein Abundance
original study at the mRNA expression level. Tables S3, S4, S5,and S6 provide a detailed analysis (list of clusters, bi-clusters,and GO enrichments) for the two datasets.
We used our protein abundance predictor to reanalyze theintriguing results reported by [24], showing that only a verysmall fraction of the genes whose expression is significantlyelevated under a specific condition actually cause a signifi-cant decrease in fitness when deleted. Overall, we find thatthe fraction of expressed genes that lead to a significantreduction in fitness when deleted is 2-fold to 3-fold higherthan the corresponding fraction reported using mRNA levels(e.g., 2.9% versus 0.76% in the case of yeast cells respondingto 1.5 M sorbitol, and 13.2% versus 6.4% in the case of 1 MNaCl). Although the absolute fraction of genes accounted forstill remains small, the relative increase observed by using thepredictor is substantial.
Finally, we tested our predictor’s ability to correctlyestimate protein abundance levels from mRNA expressiondata in a different organism, Schizosaccharomyces pombe. To thisend, we used mRNA and protein data from a recent genome-wide study that reported a Spearman rank correlationcoefficient of 0.61 between the two measurements [25].Focusing on a subset of S. pombe genes that have an orthologin S. cerevisiae, the Spearman rank correlation of the predictedprotein levels with actual protein abundance measurementswas 0.675. Notably, for the same subset of genes, theSpearman rank correlation between the protein abundanceand mRNA levels of S. pombe was only 0.629 (and the rankcorrelation between the mRNA levels of the two organismswas 0.48). These results are quite remarkable, since thepredictor used to predict protein abundance in S. pombe wasbased on the ER and tAI values of the correspondingorthologs in S. cerevisiae.
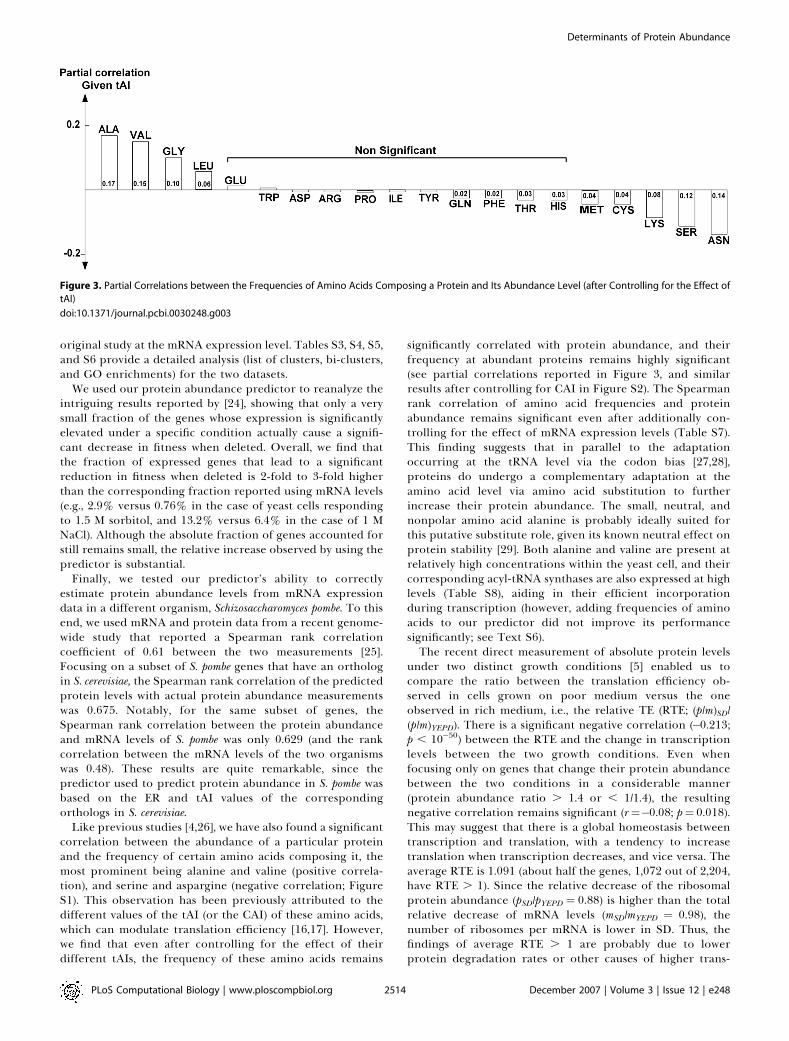
Like previous studies [4,26], we have also found a significantcorrelation between the abundance of a particular proteinand the frequency of certain amino acids composing it, themost prominent being alanine and valine (positive correla-tion), and serine and aspargine (negative correlation; FigureS1). This observation has been previously attributed to thedifferent values of the tAI (or the CAI) of these amino acids,which can modulate translation efficiency [16,17]. However,we find that even after controlling for the effect of theirdifferent tAIs, the frequency of these amino acids remains
significantly correlated with protein abundance, and theirfrequency at abundant proteins remains highly significant(see partial correlations reported in Figure 3, and similarresults after controlling for CAI in Figure S2). The Spearmanrank correlation of amino acid frequencies and proteinabundance remains significant even after additionally con-trolling for the effect of mRNA expression levels (Table S7).This finding suggests that in parallel to the adaptationoccurring at the tRNA level via the codon bias [27,28],proteins do undergo a complementary adaptation at theamino acid level via amino acid substitution to furtherincrease their protein abundance. The small, neutral, andnonpolar amino acid alanine is probably ideally suited forthis putative substitute role, given its known neutral effect onprotein stability [29]. Both alanine and valine are present atrelatively high concentrations within the yeast cell, and theircorresponding acyl-tRNA synthases are also expressed at highlevels (Table S8), aiding in their efficient incorporationduring transcription (however, adding frequencies of aminoacids to our predictor did not improve its performancesignificantly; see Text S6).The recent direct measurement of absolute protein levels
under two distinct growth conditions [5] enabled us tocompare the ratio between the translation efficiency ob-served in cells grown on poor medium versus the oneobserved in rich medium, i.e., the relative TE (RTE; (p/m)SD/(p/m)YEPD). There is a significant negative correlation (�0.213;p , 10�50) between the RTE and the change in transcriptionlevels between the two growth conditions. Even whenfocusing only on genes that change their protein abundancebetween the two conditions in a considerable manner(protein abundance ratio . 1.4 or , 1/1.4), the resultingnegative correlation remains significant (r¼�0.08; p¼ 0.018).This may suggest that there is a global homeostasis betweentranscription and translation, with a tendency to increasetranslation when transcription decreases, and vice versa. Theaverage RTE is 1.091 (about half the genes, 1,072 out of 2,204,have RTE . 1). Since the relative decrease of the ribosomalprotein abundance (pSD/pYEPD ¼ 0.88) is higher than the totalrelative decrease of mRNA levels (mSD/mYEPD ¼ 0.98), thenumber of ribosomes per mRNA is lower in SD. Thus, thefindings of average RTE . 1 are probably due to lowerprotein degradation rates or other causes of higher trans-
Figure 3. Partial Correlations between the Frequencies of Amino Acids Composing a Protein and Its Abundance Level (after Controlling for the Effect of
tAI)
doi:10.1371/journal.pcbi.0030248.g003
PLoS Computational Biology | www.ploscompbiol.org December 2007 | Volume 3 | Issue 12 | e2482514
Determinants of Protein Abundance

lation rates in SD, rather than increased ribosomes permRNA levels (Figure S3 depicts the mean RTE levels ofdifferent GO annotation groups; Text S7 displays thevariance in protein abundance levels in the two growthconditions).
While the large majority of the genes have RTE levelsranging between 0.5 and 2 (Figure 1B), two sets have extremeRTE values, one with RTE . 2.5 (48 genes), and the other withRTE , 0.45 (65 genes; Tables S9 and S10). The distribution ofmRNA and protein abundance levels of genes within each ofthese groups is similar to that of the rest of the genes (seeFigure S4A and S4B), and extreme ratios of proteinabundance or mRNA levels do not necessarily imply extremeRTE values (see Figure S4C). Interestingly, our predictorobtains more significant improvement in the correlationswith actual protein abundance levels on genes with extremeRTEs (see Figure S4D). In contrast to the inverse (homeo-static) relation observed in general, the set with extremelyhigh RTE also exhibits extremely high mSD/mYEPD ratios (anaverage mRNA ratio of 5.35, 14 times the general average).This indicates that the extreme RTE values reflect the factthat the cell is making a concerted effort to maintain theirprotein abundance levels at the extreme levels needed. By thesame token, the mean mRNA ratio for the set with extremelylow RTE is 0.36, somewhat below the total average.
The group of genes exhibiting extremely high RTE levels isenriched for mitochondrial genes (21/48 are mitochondrialgenes; chi-square p ¼ 10�16), with many of these genes beingrelated to mitochondrial biosynthesis and metabolism. Thus,the increase in the level of mitochondrial proteins, reflectingthe need for higher-yield energy production in poor growthconditions, is achieved mainly by boosting translationefficiency. Interestingly, the high RTE group is also enrichedwith genes that map very close to origins of replication(autonomously replicating sequence [ARS]), including four
genes abutting at the origin of replication (out of a total of 24genes with a similar location in the yeast genome, providing achi-square p¼ 1.1 3 10�6), and twice the expected number ofgenes located within 1 kbp from an ARS (p , 0.05; see Figure4). A possible explanation for this intriguing connection isthat the replication machinery, when binding to origins ofreplication, attenuates transcription, either by steric hin-drance or by competition for DNA binding [30]. Thisinterference is then compensated in turn by higher trans-lation efficiency and a more flexible regulation of translation,as reflected by its high RTE levels. Indeed, the average mSD /mYEPD ratios of genes that have extremely high RTE and thatare less than 1 kb from an ARS is only 0.8. One putativemechanism that may underlie this intriguing phenomenon isthat certain proteins that participate in replication andtranscription (e.g., Rap1 and Abs1) could be incorporatedinto the mRNA, exported from the nucleus, and differentiallyaffect the rate of translation at the ribosome. Similarmechanisms have been suggested for the activity of proteinssuch as Yra1, Sub2, and the THO complex, which affecttranscription, splicing efficiency, and nuclear export [31].
Discussion
The availability of whole-genome measurements of proteinabundance provides a unique opportunity to analyze theforces that affect protein translation and abundance.Combining several protein features yields a predictor ofprotein abundance that can serve as a useful tool foranalyzing gene expression measurements. Our results indi-cate that highly expressed proteins undergo adaptation at theamino acid level, and that proximity to an origin ofreplication enhances the efficiency of translation.Translation efficiency is determined by invariant, condi-
tion-independent factors such as the amino acid and codoncomposition of the protein and the availability of thedifferent tRNAs. It is also modulated by dynamic factorssuch as ribosome occupancy and ribosome density (determin-ing the total number of ribosomes per mRNA), which aredependent on environmental clues [10]. Assuming that TE isconstant to a first approximation for most genes (as its levelsacross poor and rich media testifies), this study has focused onthe first group of factors, and has shown the utility of such apredictor in interpreting biological data. We anticipate thatas information gradually accumulates concerning the secondgroup of factors, more accurate protein abundance predic-tors will emerge that can incorporate information onposttranscriptional regulation [32–34]. Recent work hassuggested that transcription factors and signaling genes tendto be posttranscriptionally regulated [32]. Indeed, a largeproportion of the genes with extreme RTE levels belong tothese two categories (see Tables S9 and S13). However, not allgenes regulated at the posttranscriptional level exhibitextreme RTE values: a recent genome-wide study in yeasthas identified 16 genes with extreme TE levels, presumablyregulated posttranscriptionally [9]. Examination of the RTElevels of these genes reveals that only one has extreme RTElevels (MET6, with RTE ¼ 0.47); the rest have RTE levelsbetween 0.93 and 1.38 (see Table S13). Finally, proteindegradation and turnover are obviously important modula-tors of protein abundance, and should be considered infuture predictors as pertaining reliable data accumulates.
Figure 4. The Distribution of Genes with High RTEs at Different Distances
from Origins of Replication
The distribution of genes with high RTE (RTE . 2.5), and distribution ofall genes at different distances from origins of replication. The number ofgenes with high RTE is 49; the total number of genes studied is 2,200.The number of genes with high RTE that are located within 1 kbp froman ARS is statistically significant using a hyper-geometric text (p , 0.05).doi:10.1371/journal.pcbi.0030248.g004
PLoS Computational Biology | www.ploscompbiol.org December 2007 | Volume 3 | Issue 12 | e2482515
Determinants of Protein Abundance

That said, it is interesting and encouraging to see how far onecan go in predicting protein abundance levels even withoutthis information.
An important corollary of our work is that gene expressionresults obtained with DNA microarray technology may insome cases be misleading. For example, Tables S11 and S12include a subset of genes that exhibit inversely correlatedregulatory trends at the transcription versus the translationlevel. An increase in mRNA expression levels of a particulargene does not necessarily mean a higher level of its protein.The corresponding protein abundance could not be differ-entially expressed or could even be differentially expressedbut in the opposite direction. As Tables S11 and S12 includeabout 5% of the yeast genes, this type of error may benonnegligible at times. Our predictor cannot solve thisproblem; its solution will probably require much largerbiological datasets than those currently available.
We demonstrated that our predictor (which is based on S.cerevisiae) can be used to successfully predict proteinabundance levels in a different organism (S. pombe), whichhas an evolutionary distance of 350–1,000 million y from S.cerevisiae [35]. It will be interesting to examine the effect thatevolutionary distance may have on determining the ‘‘trans-ferability’’ of protein predictors across species. However,answers to this question will need to wait until proteinabundance data of additional organisms becomes available.
Building on the existing large-scale protein abundancedata, this study has shown that a predictor of proteinabundance levels can improve the interpretation of geneexpression measurements and provide new insights into theregulation and evolution of protein translation. The utility ofsuch a tool should be further enhanced as our understandingof the determinants affecting protein abundance and trans-lation improves and the pertaining data continues toaccumulate.
Methods
Generating a predictor of protein abundance. For training thepredictors, we used all the genes whose required features (mRNAmeasurements, protein abundance, ER, tAI) were available. The seriesof linear predictors studied were generated using a linear regressorand using the following cross-validation procedure: (1) randomlychoose 80% of the genes (training set) and use them for generating alinear predictor; (2) use the resulting predictor for predicting theprotein abundance of the remaining 20% of the genes (test set); and(3) for the genes in the test set, calculate the Spearman rankcorrelation coefficient between the predicted and experimentallymeasured protein abundance values.
This cross-validation procedure is repeated 105 times, and themean of the Spearman rank correlation coefficient (computed in step3) is the predictor accuracy reported in the main text.
As reported in the main text, we generated a sequence of linearpredictors of protein abundance, each time adding the mostinformative feature in a greedy manner. During this process, wechecked if the resulting incremental improvement in predictionperformance is statistically significant by performing a t-test,comparing the distribution of Spearman rank correlation coefficientsobtained by each predictor over the 105 cross-validation runs. Notethat in the case of a multivariate linear predictor, this cross-validation procedure may lead to similar prediction accuracy valuesas those obtained by training a multivariate regressor on the wholedataset. However, in the general scope of nonlinear predictorsinvestigated in this study, the cross-validation prediction scenarioused is conceptually different from a multivariate regression, and theresults obtained significantly differ.
Going beyond a linear predictor, we used two implementations ofSVMs, SVM-light [36] and Partek (Partek Software, http://www.par-tek.com), and examined radial, polynomial, and sigmoid kernels. The
initial set of features included all the 32 features described in TableS1, and we also examined various forward and backward algorithmsfor feature selection. Quite surprisingly, none of these SVMpredictors gave a significant increase in prediction performancecompared to the best linear predictor reported upon in the maintext. In constructing the predictors we used the following datasources.
Protein abundance and mRNA expression data. We analyzed fourprotein abundance datasets: (1) a dataset generated by merging (withthe appropriate normalization) protein abundance data fromnumerous small-scale datasets [3]; (2) a large-scale measurement ofprotein abundance in yeast (normal log phase) [2]; and (3) proteinabundance large-scale measurements by [5] in two different growthmedia conditions (YEPD and SD). We analyzed two major mRNAexpression datasets: (1) one generated by combining 36 microarraydatasets (wild-type yeast grown in YEPD without any stress) [10]; and(2) an mRNA measurement of wild-type yeast grown in YEPD [21].
The dataset of [5] also includes the ratio (but not the absolutevalues) between the mRNA levels in the two conditions (SD andYEPD), mSD /mYEPD. This information, combined with the proteinabundance measurements in these two conditions, enabled us tocompute the RTEs across growth conditions. Combined with theabsolute mRNA measurements from [2], it was used to calculate theabsolute mRNA levels in SD.
For computing mean protein abundance levels in constructing thepooled-data predictor, we averaged at least two of three measure-ments reported in [2,5,8]. For computing mean mRNA abundancelevels to this construction, we averaged at least two of threemeasurements reported in [21,37,38]. The averaging was donefollowing the procedure described in [9].
Sources of additional data. Protein half-life measurements wereobtained from Belle et al. [39]. The protein properties examined inthe construction of the protein abundance predictor (properties 1–28 in Table S1) were obtained from the Saccharomyces genomedatabase [21]. The tAI data were downloaded from [20]. Evolutionaryrates of proteins were taken from Wall et al. [19]. The mRNA geneexpression data, protein abundance data, and list of 447 relevantorthologous genes needed for testing the predictor performance onS. pombe were from [25]. Relative protein abundance and mRNA levelsafter exposure to pheromone were downloaded from [13].
Clustering, bi-clustering, and GO enrichment analysis of mRNAand predicted protein abundance levels. We used two mRNA geneexpression datasets that were generated by the same technology asthat used for training the predictor. The two datasets are measure-ments by affymetrix GeneChip, and were downloaded from NationalCenter for Biotechnology Information (NCBI) Gene ExpressionOmnibus (GEO; http://www.ncbi.nlm.nih.gov/entrez/query.fcgi?db¼gds). The first dataset includes the 12 samples from [22].The second dataset includes the 36 samples from [23]. Clustering andbi-clustering was performed by using the Expander program [40]. Weused CLICK for clustering and SAMBA for bi-clustering. Geneenrichment was computed using the GO categories of [21] (bycomputing the hyper-geometric probability of seeing at least xnumber of genes out of the total n genes in the cluster/bi-clusterannotated to a particular GO term, given the proportion of genes inthe whole genome that are annotated to that GO term), examiningthe three ontologies of molecular function, biological process, andcellular components. The resulting enrichments were filtered by falsediscovery rate (FDR) to correct for multiple testing [41].
Measuring the coherency of expression levels of proteins that arepart of the same complex or are interacting neighbors in the proteinnetwork. Protein complex data were downloaded from [21]. Wemeasured coherency of mRNA levels, protein abundance, andpredicted protein abundance of genes that are part of the samecomplex (in SD and YEPD) by the following steps: (1) we listed allpairs of genes in the dataset which are both comembers in one of thecomplexes; (2) for each case (mRNA levels, protein abundance, andpredicted protein abundance), we generated two vectors, u and v,such that u(i) and v(i) denote a pair of proteins that are part of thesame complex; we calculated the Spearman rank correlationcoefficient between the two vectors (u and v); and we compared theresulting correlation to the correlations between pairs of vectors withthe same length that include measurements of randomly selectedpairs of genes.
For predicting protein abundance, we used a predictor that wastrained on a different dataset (i.e., the predictor used for YEPD wastrained on the SD measurements and vice versa; training thepredictor on the same dataset gives an even better result, so wewanted to demonstrate that the results are significantly good even ifthe trained set and the test set are different.). The computation of the
PLoS Computational Biology | www.ploscompbiol.org December 2007 | Volume 3 | Issue 12 | e2482516
Determinants of Protein Abundance

pertaining partial correlations and their associated p-values aredescribed in Text S8.
For computing the coherency of expression/abundance of neigh-boring proteins in the protein interaction network, we used the yeastprotein interaction network from the work of [42].
We used a similar procedure to that used to compute thecomplexes’ coherency, but this time u and v are composed of proteinpairs that are adjacent in the protein interaction network.
Comparing mRNA expression profiling and fitness profiling. Forcomparing the number of genes that exhibits both an increase inexpression levels (mRNA levels and predicted protein abundance)and a significant decrease in fitness when adding NaCl or sorbitol, weused the mRNA levels from [43] and fitness profiling from [24]. Foreach of the two cases (mRNA levels and predicted proteinabundance), we used five measurements of expression levels andfour measurements of fitness. We focused on the set of genes forwhich we had all the predictor’s features. In the case of fitnessprofiling, a gene was considered ‘‘significant’’ if it had significantvalue (as defined in [24]) in at least one of the four fitnessmeasurements. In both cases of protein abundance or mRNAexpression levels, a gene was considered significant if it exhibited alog ratio of at least 0.25 in one of the five measurements.
Supporting Information
Figure S1. Variables That Have Significant Correlation and PartialCorrelation with Protein Abundance, TE, and RTE
(A) Variables that have significant correlation with protein abun-dance, TE, and RTE.(B) Variables with significant correlation with protein abundancegiven mRNA, given CAI, and given mRNA and CAI. The full namesand the description of each variable appear in Table S1. Thecorrelation with amino acid distribution at the C and N terminus wassubstantially less significant than the general correlations of aminoacid distribution (it was not significant for most of the amino acids).
Found at doi:10.1371/journal.pcbi.0030248.sg001 (82 KB DOC).
Figure S2. Partial Correlations of Amino Acid Frequencies andProtein Abundance after Removing the Effect of CAI
Found at doi:10.1371/journal.pcbi.0030248.sg002 (53 KB DOC).
Figure S3. The Average RTE of GO Annotation Groups
The average RTE of each GO annotation group for the threeontologies (molecular function, cellular component, and biologicalprocess).
Found at doi:10.1371/journal.pcbi.0030248.sg003 (71 KB DOC).
Figure S4. mRNA Levels, Protein Abundance, mRNA Ratio, ProteinAbundance Ratio, and Correlation with Protein Abundance of mRNAand Predicted Protein Abundance of Genes with Extreme RTE
(A) mRNA levels and protein abundance of genes with RTE . 2.5(blue), RTE , 0.45 (red), and the rest of the genes (yellow) in YEPD.(B) mRNA levels and protein abundance of genes with RTE . 2.5(blue), RTE , 0.45 (red), and the rest of the genes (yellow) in SD.(C) mRNA ratio (mSD/mYEPD) levels and protein abundance ratio (pSD/pYEPD) of genes with RTE . 2.5 (blue), RTE , 0.45 (red), and the restof the genes (yellow).(D) Correlation with protein abundance of mRNA and predictedprotein abundance for genes with modest RTE (0.5 , RTE , 2), andfor genes with extreme RTE (RTE , 0.5 and RTE . 2). Thecorrelation increase after implementing the predictor is moresignificant for the group with extreme RTE.
Found at doi:10.1371/journal.pcbi.0030248.sg004 (86 KB DOC).
Table S1. Protein Features Used in the Study
Abbreviation and full description of all the protein features that wereused in our study. We also checked the frequency of amino acids atthe N and C terminus of the protein.
Found at doi:10.1371/journal.pcbi.0030248.st001 (52 KB DOC).
Table S2. The Correlation of the Predicted Protein Abundance of thePredictor with Real Protein Abundance, mRNA, tAI, and ER for EachGO Annotation Group Separately, and the Performances WhenInferring a Different Predictor for Each Cellular Component GO
(A–C) The correlation of the predicted protein abundance of ourpredictor with real protein abundance, mRNA, tAI, and ER for eachGO annotation group separately. The last column includes thecorrelation of mRNA level with protein abundance for each GO
group (blue, cases where the predictor improved the correlation withprotein abundance; red, cases where the mRNA level has highercorrelation with protein abundance).(A) The results for the cellular component GO annotation groups.(B) The results for the biological process GO annotation groups.(C) The results for the molecular function GO annotation groups.(D) The performances (correlation of predicted and real proteinabundance) when inferring a different predictor for each cellularcomponent GO annotation group. The average performances in thiscase are not better than the original predictor (one predictor for allthe GO groups).
Found at doi:10.1371/journal.pcbi.0030248.st002 (209 KB DOC).
Table S3. Clustering (Sheet 1) and Bi-Clustering (Sheet 2) of themRNA Gene Expression, from the Work of Sheehan et al.
The list of genes in each cluster and bi-cluster is depicted togetherwith the GO enrichment categories (for each of the ontologies:process, function, and component) of each cluster/bi-cluster. Thescore of each bi-cluster (by Expander) is depicted near the name ofthe bi-cluster (as mentioned by the authors of the pertainingExpander software used there, these scores are good only forcomparing bi-clusters with the same size). The mean pattern of eachbi-cluster and the index of conditions that are related to it (x-axis)appear near each bi-cluster.
Found at doi:10.1371/journal.pcbi.0030248.st003 (1.2 MB XLS).
Table S4. Clustering (Sheet 1) and Bi-Clustering (Sheet 2) of thePredicted Protein Abundance from the work of Sheehan et al.
The list of genes in each cluster and bi-cluster is depicted togetherwith the GO enrichment categories (for each of the ontologies:process, function, and component) of each cluster/bi-cluster. Thescore of each bi-cluster (by Expander) is depicted near the name ofthe bi-cluster (as mentioned by the authors of the pertainingExpander software used there, these scores are good only forcomparing bi-clusters with the same size). The mean pattern of eachbi-cluster and the index of conditions that are related to it (x-axis)appear near each bi-cluster.
Found at doi:10.1371/journal.pcbi.0030248.st004 (1.6 MB XLS).
Table S5. Clustering (Sheet 1) and Bi-Clustering (Sheet 2) of themRNA Gene Expression from the Work of Tu et al.
The list of genes in each cluster and bi-cluster is depicted togetherwith the GO enrichment categories (for each of the ontologies:process, function, and component) of each cluster/bi-cluster. Thescore of each bi-cluster (by Expander) is depicted near the name ofthe bi-cluster (as mentioned by the authors of the pertainingExpander software used there, these scores are good only forcomparing bi-clusters with the same size). The mean pattern of eachbi-cluster and the index of conditions that are related to it (x-axis)appear near each bi-cluster.
Found at doi:10.1371/journal.pcbi.0030248.st005 (3 MB XLS).
Table S6. Clustering (Sheet 1) and Bi-Clustering (Sheet 2) of thePredicted Protein Abundance from the Work of Tu et al.
The list of genes in each cluster and bi-cluster is depicted togetherwith the GO enrichment categories (for each of the ontologies:process, function, and component) of each cluster/bi-cluster. Thescore of each bi-cluster (by Expander) is depicted near the name ofthe bi-cluster (as mentioned by the authors of the pertainingExpander software used there, these scores are good only forcomparing bi-clusters with the same size). The mean pattern of eachbi-cluster and the index of conditions that are related to it (x-axis)appear near each bi-cluster.
Found at doi:10.1371/journal.pcbi.0030248.st006 (2.1 MB XLS).
Table S7. Partial Correlations of Amino Acid Frequencies andProtein Abundance for All the Genes and for Genes with Low mRNALevels and High Protein Abundance
(A) Partial correlations of amino acid frequencies and proteinabundance for all genes. The correlations for the amino acids alanineand valine are significant and positive, and the correlations forasparagine and serine are significant and negative.(B) Partial correlations of the frequencies of amino acids and proteinabundance for genes with low mRNA levels (lower 20%) and highprotein abundance (top 20%). The correlations for the amino acidsalanine and valine are positive but not significant (due to the lownumber of genes).
Found at doi:10.1371/journal.pcbi.0030248.st007 (13 KB XLS).
PLoS Computational Biology | www.ploscompbiol.org December 2007 | Volume 3 | Issue 12 | e2482517
Determinants of Protein Abundance
Table S8. Protein Abundance of the Various tRNA Synthetases andthe Stechiometry of the Different Amino Acids
Protein abundance of the various tRNA synthetases and thestechiometry of the different amino acids (downloaded from thework of Forster et al. [44]). Alanine and valine tRNA synthetases havehigh levels of protein abundance, and the amino acids exhibit a highconcentration in the yeast cell. These factors also make thetranslation of alanine and valine more efficient. Data that do notappear in our dataset are denoted by ###.
Found at doi:10.1371/journal.pcbi.0030248.st008 (15 KB XLS).
Table S9. Genes with RTE . 2.5
Table includes the open reading frame (ORF), name, RTE, anddescription of each gene. Genes that are related with regulation aremarked in blue. GO enrichments according to SGD for this group ofgenes appear below.
Found at doi:10.1371/journal.pcbi.0030248.st009 (27 KB XLS).
Table S10. Genes with RTE , 0.45
Table includes the ORF, name, RTE, and description of each gene.Genes that are related to regulation are marked in blue. GOenrichments according to SGD for this group of genes appear below.
Found at doi:10.1371/journal.pcbi.0030248.st010 (29 KB XLS).
Table S11. Subset of Genes That Exhibit Counteracting RegulatoryTrends at the Transcriptional versus the Translational Levels (RTE ,1/1.5 and mSD/mYEPD . 1.5)
Subset of genes that exhibit counteracting regulatory trends at thetranscriptional versus the translational levels. Each gene in the set hasRTE , 1/1.5 and mSD/mYEPD . 1.5. For each gene, the table includes itsORF ID, name, RTE, and the ratio between the mRNA levels in SDand YEPD.
Found at doi:10.1371/journal.pcbi.0030248.st011 (11 KB XLS).
Table S12. Subset of Genes That Exhibit Counteracting RegulatoryTrends at the Transcriptional Versus the Translational Levels (RTE .1/1.5 and mSD/mYEPD , 1.5)
Subset of genes that exhibit counteracting regulatory trends at thetranscriptional versus the translational levels. Each gene in the set hasRTE . 1/1.5 and mSD/mYEPD , 1.5. For each gene, the table includes itsORF ID, name, RTE, and the ratio between the mRNA levels.
Found at doi:10.1371/journal.pcbi.0030248.st012 (32 KB XLS).
Table S13. RTE of Genes with Extreme TE
(A) The RTE of the genes that were reported by Lu et al. as genes withhigh TE. The table includes the name, ORF, and RTE of each gene.(B) The RTE of the 14 genes with extreme TE; in this case, the TE wascalculated using the protein abundance of Ghaemmaghami et al. [2]and the mRNA levels of Holstege et al. [15] The table includes the
name, ORF ID, RTE, TE, and TE rank (among all the genes) of eachgene.
Found at doi:10.1371/journal.pcbi.0030248.st013 (12 KB XLS).
Text S1. Correlation Between Independent Measurements of ProteinAbundance
Found at doi:10.1371/journal.pcbi.0030248.sd001 (24 KB DOC).
Text S2. Correlation Between mRNA Levels, Protein Abundance, andPredicted Protein Abundance between Interacting Proteins
Found at doi:10.1371/journal.pcbi.0030248.sd002 (25 KB DOC).
Text S3. Clustering and Bi-Clustering Predicted Protein Abundance
Found at doi:10.1371/journal.pcbi.0030248.sd003 (24 KB DOC).
Text S4. The Analysis of Steady-State and Transient Gene ExpressionDatasets
Found at doi:10.1371/journal.pcbi.0030248.sd004 (21 KB DOC).
Text S5. Clustering the Protein Abundance Levels Obtained fromRandom Predictors of Protein Abundance
Found at doi:10.1371/journal.pcbi.0030248.sd005 (25 KB DOC).
Text S6. Nonsignificant Improvement of the Predictor when AddingAmino Acid Frequencies
Found at doi:10.1371/journal.pcbi.0030248.sd006 (20 KB DOC).
Text S7. Variance in Protein Abundance for the Two Sets withExtreme RTEs
Found at doi:10.1371/journal.pcbi.0030248.sd007 (24 KB DOC).
Text S8. Supplementary Methods
Found at doi:10.1371/journal.pcbi.0030248.sd008 (25 KB DOC).
Acknowledgments
We would like to thank Elhanan Borenstein, Tomer Shlomi, andRoded Sharan for helpful discussions.
Author contributions. TT, MK, and ER conceived and designed theexperiments. TT analyzed the data. TT, MK, and ER wrote the paper.
Funding. TT was supported by the Edmond J. Safra Bioinformaticsprogram at Tel Aviv University. This research was supported bygrants from the Israel Research Fund and the Israeli Ministry ofScience and Technology to MK, and by grants from the YishayahuHorowitz Center for Complexity Science, the Israeli ScienceFoundation (ISF), the German-Israeli Foundation for scientificresearch and development (GIF), and the Tauber fund to ER.
Competing interests. The authors have declared that no competinginterests exist.
References1. Brazma A, Parkinson H, Sarkans U, Shojatalab M, Vilo J, et al. (2003)
Arrayexpress—A public repository for microarray gene expression data atthe EBI. Nucleic Acids Res. 31: 68–71.
2. Ghaemmaghami S, Huh WK, Bower K, Howson RW, Belle A, et al. (2003)Global analysis of protein expression in yeast. Nature 425: 737–741.
3. Greenbaum D, Colangelo C, Williams K, Gerstein M (2003) Comparingprotein abundance and mRNA expression levels on a genomic scale.Genome Biol 4: 1–8.
4. Greenbaum D, Jansen R, Gerstein M (2002) Analysis of mRNA expressionand protein abundance data: An approach for the comparison of theenrichment of features in the cellular population of proteins andtranscripts. Bioinformatics 18: 585–596.
5. Newman JRS, Ghaemmaghami S, Ihmels J, Breslow DK, Noble M, et al.(2006) Single-cell proteomic analysis of S. Cerevisiae reveals the architectureof biological noise. Nature 441: 840–846.
6. Zhu H, Klemic J, Chang S, Bertone P, Casamayor A, et al. (2000) Analysis ofyeast protein kinases using protein chips. Nature Gen 26: 283–289.
7. Gygi SP, Rochon Y, Franza BR, Aebersold R (1999) Correlation betweenprotein and mRNA abundance in yeast. Mol. Cell Biol 19: 1720–1730.
8. Futcher B, Latter GI, Monardo P, McLaughlin CS, Garrels JI (1999) Asampling of the yeast proteome. Mol Cell Biol 19: 7357–7368.
9. Lu P, Vogel C, Wang R, Yao X, Marcotte EM (2006) Absolute proteinexpression profiling estimates the relative contributions of transcriptionaland translational regulation. Nature Biotech 25: 117–124.
10. Beyer A, Hollunder J, Nasheuer HP, Wilhelm T (2004) Post-transcriptionalexpression regulation in the yeast Saccharomyces cerevisiae on a genomic scale.Mol Cell Prot 3: 1083–1092.
11. Lithwick G, Margalit H (2003) Hierarchy of sequence-dependent featuresassociated with prokaryotic translation. Genome Res 13: 2665–2673.
12. Kolkman A, Daran-Lapujade P, Fullaondo A, Olsthoorn MMA, Pronk JT, etal. (2006) Proteome analysis of yeast response to various nutrientlimitations. Mol Syst Biol 2: 1–16.
13. MacKay VL, Li X, Flory MR, Turcott E, Law GL, et al. (2004) Geneexpression analyzed by high-resolution state array analysis and quantitativeproteomics: Response of yeast to mating pheromone. Mol Cell Prot 3: 478–489.
14. Washburn MP, Koller A, Oshiro G, Ulaszek RR, Plouffe D, et al. (2003)Protein pathway and complex clustering of correlated mRNA and proteinexpression analyses in Saccharomyces cerevisiae. Proc Natl Acad Sci U S A 100:3107–3112.
15. Holstege FC, Jennings EG, Wyrick JJ, Lee TI, Hengartner CJ, et al. (1998)Dissecting the regulatory circuitry of a eukaryotic genome. Cell 95: 717–728.
16. Reis M, Wernisch L, Savva R (2003) Unexpected correlation between geneexpression and codon usage bias from microarray data for the wholeEscherichia coli k-12 genome. Nucleic Acid Res 31: 6976–6985.
17. Reis M, Savva R, Wernisch L (2004) Solving the riddle of codon usagepreferences: A test for translational selection. Nucleic Acids Res 32: 5036–5044.
18. Drummond DA, Raval A, Wilke CO (2006) A single determinant dominatesthe rate of yeast protein evolution. Mol Biol Evol 23: 327–337.
19. Wall DP, Hirsh AE, Fraser HB, Kumm J, Giaever G, et al. (2005) Functionalgenomic analysis of the rates of protein evolution. Proc Natl Acad Sci U S A102: 5483–5488.
20. Man O, Pilpel Y (2007) Differential translation efficiency of orthologous
PLoS Computational Biology | www.ploscompbiol.org December 2007 | Volume 3 | Issue 12 | e2482518
Determinants of Protein Abundance

genes is involved in phenotypic divergence of yeast species. Nat Genet 39:415–421.
21. (2006) Saccharomyces genome database. Available: http://www.yeastgenome.org. Accessed 9 November 2007.
22. Sheehan KB, McInnerney K, Purevdorj-Gage B, Hyman LE (2007) Yeastgenomic expression patterns in response to low-shear modeled micro-gravity. BMC Genomics 8: 1–12.
23. Tu BP, Kudlicki A, Rowicka M, McKnight SL (2005) Logic of the yeastmetabolic cycle: Temporal compartmentalization of cellular processes.Science 310: 1152–1158.
24. 24 . Giaever G, Chu AM, Ni L, Connelly C, Riles L, et al. (2002) Functionalprofiling of the Saccharomyces cerevisiae genome. Nature 418: 387–391.
25. Schmidt MW, Houseman A, Lvanov AR, Wolf DA (2007) Comparativeproteomic and transcriptomic profiling of fission yeast SchizosaccharomycesPombe. Mol Sys Biol 3: 1–12.
26. Akashi H (2003) Translational selection and yeast proteome evolution.Genetics 164: 1291–1303.
27. Gouy M, Gautier C (1982) Codon usage in bacteria: Correlation with geneexpressivity. Nucleic Acid Res 10: 7055–7074.
28. Jansen R, Bussemaker HJ, Gerstein M (2003) Revisiting the codonadaptation index from a whole-genome perspective: Analyzing therelationship between gene expression and codon occurrence in yeast usinga variety of models. Nucleic Acids Res 31: 2242–2251.
29. Kortemme T, Kim DE, Baker D (2004) Computational alanine scanning ofprotein-protein interfaces. Sci STKE 219: 1–12.
30. Deshpande AM, Newlon CS (1996) DNA replication fork pause sitesdependent on transcription. Science 272: 1030–1033.
31. Jimeno S, Luna R, Garcia-Rubio M, Aguilera A (2006) Tho1, a novel hnRNP,and Sub2 provide alternative pathways for mRNP biogenesis in yeast THOmutants. Mol Cell Biol 26: 4387–4398.
32. Brockmann R, Beyer A, Heinisch JJ, Wilhelm T (2007) Posttranscriptionalexpression regulation: What determines translation rates. PLoS ComputBiol 3: 531–539.
33. Gebauer F, Hentze MW (2004) Molecular mechanisms of translationalcontrol. Nat Rev Mol Cell Biol 5: 827–835.
34. Holcik M, Sonenberg N (2005) Translational control in stress andapoptosis. Nat Rev Cell Biol 6: 318–327.
35. Berbee M, Taylor J (2001) Systematics and evolution. In: McLaughlin D,McLaughlin E, Lemke P, editors. The Mycota. Volume VIIB. Berlin:Springer. pp. 229–245.
36. Joachims T (2002) Learning to classify text using support vector machines.Boston: Kluwer Academic Publishers. 205 p.
37. Wang Y, Liu CL, Storey JD, Tibshirani RJ, Herschlag D, et al. (2002)Precision and functional specificity in mRNA decay. Proc Natl Acad Sci U SA 99: 5860–5865.
38. Velculescu VE, Zhang L, Zhou W, Vogelstein J, Basrai MA, et al. (1997)Characterization of the yeast transcriptome. Cell 88: 243–251.
39. Belle A, Tanay A, Bitincka L, Shamir R, O’Shea EK (2006) Quantification ofprotein half-lives in the budding yeast proteome. Proc Natl Acad Sci U S A103: 13004–13009.
40. Shamir R, Maron-Katz A, Tanay A, Linhart C, Steinfeld I, et al. (2005)Expander—An integrative program suite for microarray data analysis.BMC Bioinformatics 6: 1–12.
41. Benjamini Y, Hochberg Y (1995) Controlling the false discovery rate—Apractical and powerful approach to multiple testing. J R Stat Soc B Mat 57:289–300.
42. Sharan R, Suthram S, Kelley RM, Kuhn T, McCuine S, et al. (2005)Conserved patterns of protein interaction in multiple species. Proc NatlAcad Sci U S A 102: 1974–1979.
43. Causton HC, Ren B, Koh SS, Harbison CT, Kanin E, et al. (2001)Remodeling of yeast genome expression in response to environmentalchanges. Mol Biol Cell 12: 323–337.
44. Forster J, Famili I, Fu P, Palsson BØ, Nielsen J (2003) Genome-scalereconstruction of the Saccharomyces cerevisiae metabolic network. GenomeRes 13: 244–253.
PLoS Computational Biology | www.ploscompbiol.org December 2007 | Volume 3 | Issue 12 | e2482519
Determinants of Protein Abundance
Top Related
Copyright © 2022 FDOKUMEN

