


Bahasa
Halaman
Hukum

Avino et al. Chemistry Central Journal 2013, 7:173http://journal.chemistrycentral.com/content/7/1/173
RESEARCH ARTICLE Open Access
Deep investigation on inorganic fraction ofatmospheric PM in Mediterranean area byneutron and photon activation analysisPasquale Avino1*, Geraldo Capannesi2, Maurizio Manigrasso1, Alberto Rosada2 and Mario Vincenzo Russo3
Abstract
Background: Anthropogenic activities introduce materials increasing levels of many dangerous substances for theenvironmental quality and being hazardous to human health. Major attention has been given to those elementsable to alter the environment and endanger human health.The airborne particulate matter pollutant is considered one of the most difficult task in environmental chemistry forits complex composition and implications complicating notably the behavior comprehension. So, for investigatingdeeply the elemental composition we used two nuclear techniques, Neutron Activation Analysis and PhotonActivation Analysis, characterized by high sensitivity, precision and accuracy. An important task has been devoted tothe investigation of Quality Control (QC) and Quality Assurance (QA) of the methodology used in this study.This study was therefore extended as far back as possible in time (from 1965 until 2000) in order to analyze thetrend of airborne concentration of pollutant elements in connection with the industrial and lifestyle growth duringthe entire period.
Results: Almost all the elements may be attributed to long-range transport phenomena from other natural and/oranthropogenic sources: this behavior is common to all the periods studied even if a very light decreasing trend canbe evidenced from 1970 to 2002. Finally, in order to investigate a retrospective study of elements in PM10 and theirevolution in relationship with the natural or anthropogenic origins, we have investigated the Enrichment Factors.The study shows the EF trends for some elements in PM10 during four decades.
Conclusions: The two nuclear techniques have allowed to reach elevated sensibility/accuracy levels for determiningelements at very low concentrations (trace and ultra-trace levels). The element concentrations determined in this studydo not basically show a significant level of attention from a toxicological point of view.
Keywords: Element, PM10, PM2.5, Atmosphere, Urban air, Enrichment factor, INAA, IPAA
BackgroundOne of the most interesting and difficult task in environ-mental chemistry is the investigation of the inorganicchemical composition of the particulate matter. Differentreasons are the basis of this consideration: for instance,the very low levels of some elements (e.g., Cd, Hg, Se, atultra-trace levels), the sampling collection which is morerepresentative as possible, the availability of analyticalmethods (expecially, no-destructive but really sensitivemethodologies) [1-11].
* Correspondence: [email protected], INAIL settore Ricerca, Certificazione e Verifica, Via IV Novembre 144,Rome 00187, ItalyFull list of author information is available at the end of the article
© 2013 Avino et al.; licensee Chemistry CentraCommons Attribution License (http://creativereproduction in any medium, provided the or
The element distribution in air is fundamentally deter-mined by resuspension from soil and water of varioussubstances of natural and/or artificial origin, by theirtype of circulation due to the meteorological events andby the chemical element behavior. Anthropogenic activ-ities introduce species increasing levels of many sub-stances which may endanger the environmental qualityand represent a hazard to human health. Major attentionhas been given to those elements able to alter the envir-onment and endanger human health.The issue regarding the determination of trace ele-
ments in airborne particulate have a preeminent positiondue to the presence of some toxic elements (e.g., Cd, Hgand Pb): further, the airborne particulate matter enters
l Ltd. This is an open access article distributed under the terms of the Creativecommons.org/licenses/by/2.0), which permits unrestricted use, distribution, andiginal work is properly cited.
Table 1 Results of the Quality Control on IAEA air filtersamples (μg g-1)
Element Measured value Certified value Average value
mean ± s.d. mean mean 2σ (%)
As 4.9±0.5 5.6 4.59 43
Au 1.26±0.10 1.15 1.06 21
Ba 43.4±0.5 53.8 39.05 40
Cd 10.6±1.0 9.96 9.8 18
Co 1.3±0.1 1.12 1.18 38
Cr 4.7±0.8 5.6 4.8 13
Cu 51.6±0.5 48.8 44.8 16
Fe 193±17 207.9 200.1 8
Mn 31.2±1.0 31.9 30.1 14
Mo 1.26±0.2 1.14 1.56 70
Se 1.01±0.10 1.06 1.01 11
U 0.78±0.10 1.02 0.99 14
V 8.04±0.35 8.00 7.2 16
Zn 132±18 152 141 12
The “measured value” is the average of seven determinations on sevendifferent replicates. s.d.: standard deviation.
Avino et al. Chemistry Central Journal 2013, 7:173 Page 2 of 10http://journal.chemistrycentral.com/content/7/1/173
into the climate global change problem, giving place toincreasing global levels that may affect widely the bio-logical systems.The very complex composition and implications of the
airborne particulate matter pollutant PM10 and, expe-cially, the distribution and multielemental compositionof the fine fraction (i.e., particles with diameter <2.5 μm,PM2.5), complicate notably the behavior comprehension.The evaluation of background levels due to natural path-ways of circulation, seems the preliminar action to beundertaken. This study was therefore extended as farback as possible in time (from the seventies until now-days) in order to analyze the trend of airborne concen-tration of pollutant elements in connection with theindustrial and lifestyle growth during the entire period.Instrumental nuclear techniques are widely used in this
field [12] as they represent the most reliable method foranalyzing trace and/or ultra-trace elements in air particu-late PM10 and PM2.5. Instrumental Neutron ActivationAnalysis (INAA) as well Instrumental Photon ActivationAnalysis (IPAA) have been employed in this work to meas-ure interesting toxicologically elements. INAA is not uni-versally applicable with regard to the elements that can bedetermined, as the technique does not have sufficient sensi-tivity for Ca, Ti, Sr and Zr for example, and Nb, Pb, Tl andY are impossible to measure. Similarly, determination ofsome elements is complicated due to interfering nuclear re-actions or from the products of uranium fission (sampleswith elevated U concentration) [13,14]. An useful comple-mentary method to INAA is Instrumental Photon Activa-tion Analysis (IPAA), which enables the determination ofthe above elements. The IPAA method has been utilised ona much smaller scale in analytical field [15,16]. In IPAA,the nuclei can be activated through photonuclear process:in fact, contrary to INAA based mainly on the neutron cap-ture reaction (n, γ), PAA employs photonuclear reactions,particularly the (γ, n) reaction [17]. Activation is induced byhigh energy photons having energy of at least 10 MeV. Thephotonuclear reaction data of the elements require around30 MeV for activation energy. For analytical data interpret-ation, IPAA results have been considered only for the ele-ments that cannot be determined and/or are difficult todetermine by INAA [18-27], and for which IPAA providesresults of comparable or better quality. Determination ofother elements, such as Mn, Rb, Cs, Ba, Ce, U by IPAAshould be considered of subsidiary value because INAA ismore sensitive. Finally, as reported in literature [28], IPAAis not as commonly used as INAA but possibilities forelement determination by both INAA and IPAA dependstrongly on the matrix composition.In particular, over As, Cd, Cr, Hg, Pb, Sb and Zn, i.e.
metals considered of greater health concern, other el-ements, e.g. Au, Cs, La, Mo, Sc, Se, Sm, Th, W, weremeasured.
Results and discussionQuality controlTable 1 shows the analytical quality control performedon a Standard Reference Material (SRM). This controlwas performed through an intercomparison campaignfor 14 elements promoted by the International AtomicEnergy Agency (IAEA) on air filter samples among dif-ferent worldwide laboratories (130) using both spectro-chemical (colorimetry, fluorescence, x-ray fluorescence,infrared spectrometry, atomic absorption and emissionspectrometry, ICP-AES, ICP-MS), electrochemical (po-larography, voltammetry) and nuclear (INAA, IPAA, iso-topic dilution, beta counting) analytical techniques. Foreach element our values (“measured value”) and the“certified value” are reported: the third column (“averagevalue”) represents the value averaged among all the de-terminations performed by different laboratories inter-ested in the round-robin. As it can be noted, theagreement between our and the real value is quite goodexcept for some elements such as Ba, U and Zn. For Baand U this discrepancies can be due to the difficulty toanalyze such kind of elements even if for Ba our “mea-sured value” (43.4 ± 0.5) and the “average value” (39.05 ±15.62) are quite similar. For Zn the situation is little bitdifferent. The “measured value” (132 ± 18 μg g-1) fallsout the certified value (152 μg g-1) whereas it is in “aver-age value” range (141 ± 16 μg g-1): the two-tailed P valueis less than 0.001 and, by conventional criteria, this dif-ference is considered to be statistically significant.
Avino et al. Chemistry Central Journal 2013, 7:173 Page 3 of 10http://journal.chemistrycentral.com/content/7/1/173
Particulate matter resultsAverage concentration values, minimum and maximumlevels and standard deviation of the elements determinedin the PM2.5 fraction are shown in Table 2 whereas the cor-relation coefficients of the analyzed elements are reportedin Table 3. It should be noted that many elements cannotbe possible to determine in these samples: the main reasonsdepend on both the granulometric size fraction, 2.5 μm, asjust reported in literature [9], and the very low levelsreached by some elements (e.g., Nd is below LOD). Basic-ally, the concentration levels of the elements are very low.There is only a very significant correlation between Br andSb (correlation coefficient 0.95). The Br presence in air isessentially attributed to natural (e.g., marine aerosol) andanthropogenic (e.g., autovehicular traffic [7] sources. Thishigh correlation coefficient with Sb hypothesizes a stronganthropogenic contribution to the Br level. Furthermore, it
Table 2 Synoptic table (mean value, min-max values andstandard deviation) of elements concentration (ng m-3)determined in PM2.5 in downtown Rome (LOD: limit ofdetection; * expressed as pg m-3; ** expressed as μg m-3)
Element PM2.5
Mean Min-Max St. dev.
As 1.06 0.121-2.76 0.044
Au 0.009 0.000-0.050 0.012
Ba 3.76 1.91-6.45 2.38
Br 17.1 3.20-50.4 13.9
Ce 0.130 0.033-0.335 0.089
Co 0.167 0.077-0.331 0.065
Cr 3.03 1.29-6.40 1.30
Cs 0.047 0.004-0.124 0.037
Eu* 1.14 1.12-1.16 0.029
Fe** 0.074 0.005-0.212 0.059
Hf 0.018 0.006-0.032 0.010
Hg 0.818 0.195-2.12 0.655
La* 22.6 8.73-53.3 10.5
Mo 0.748 0.017-3.04 0.699
Nd <LOD
Ni 3.54 1.91-5.82 1.45
Rb 1.82 0.416-3.74 1.07
Sb 3.60 0.690-12.6 3.24
Sc* 3.14 0.208-7.49 2.41
Se 0.567 0.116-1.55 0.415
Sm* 3.88 0.208-7.78 2.13
Th 0.027 0.007-0.041 0.010
W 0.636 0.062-2.86 0.682
Yb 0.011 0.003-0.027 0.007
Zn 58.0 4.78-252 61.3
can be noted a wide scattering between the correlationcoefficients: only As, Co, Fe, Sc, Sb, Se are highly correlated(0.7 < correlation coefficient < 0.9, marked in bold inTable 3) whereas Au, Ba, Br, Ce, Cr, Cs, La, Sm resultscarcely correlated. This behavior can be expected consid-ering the chemical-physical properties of the elements andthe granulometric size (<2.5 μm), as previously evidencedin previous papers [7,9].In Tables 4 and 5 are reported for each element both
the summer and winter average levels as well as themaximum and minimum values for each season mea-sured in PM10 samples by INAA and IPAA. The sampleswere collected in outskirt of Rome and downtown [29],respectively, during summer and winter period. It maybe noted that elements of anthropogenic origin showwinter concentration levels higher than the summerones, probably owing to an enhanced production in thewinter period; in contrast elements of natural originshow summer concentration levels higher than the win-ter ones, possibly as a consequence of an increased re-suspension of soil matter in summer. The values in thetwo tables are quite similar for some elements whereasdifference distributions between the two time periodsare evident. This last issue influences the element behav-ior in atmosphere.As a very simple approach for understanding the elem-
ent behavior, they were grouped into three categories ac-cording to the value of the ratio (R) of summer towinter average levels (Table 6). The first group includeselements whose R is greater than 2; the second group el-ements whose R is less than 2 but greater than 0.5; thelast group includes elements whose R is less than 0.5.Looking at the table, it can be noted a ratio differencebetween the elements determined in outskirt and indowntown: only 6 elements, such as Al, Br, K, Na, Ti, U,show R > 2 in samples collected in downtown whereas20 elements, i.e. Al, Ba, Ca, Ce, Cs, Eu, Fe, Hf, K, La,Mg, Na, Rb, Sc, Ta, Tb, Th, Ti, U, Zr, show ratios > 2 insamples collected in outskirt.Elements of natural origin are only found in the first
group, while elements of both natural and anthropo-genic origin are present in the second group. The thirdgroup includes only pollutant elements (Cd, Cr, Mo,Ni, Pb, V, Zn).An intersting considerations, coming from the data
analysis, are obviously strictly related to the general me-teorological characteristics of Italy and therefore containsome peculiarity. If they are compared to similar resultsobtained in other countries under different meteoro-logical conditions, it can be seen that they agree fairlywell for the pollutant elements, whereas for most ele-ments of natural origin there are sensible differencesthat may be related to the geomorphological and me-teorological characteristics. In fact, the higher values
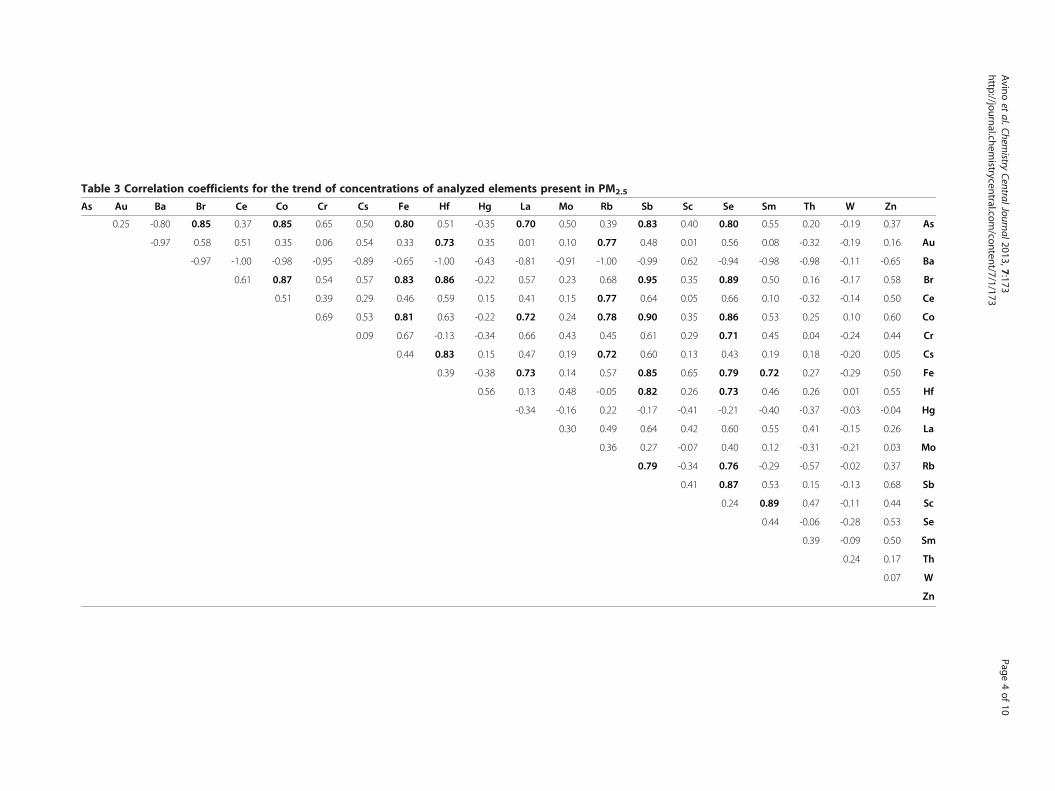
Table 3 Correlation coefficients for the trend of concentrations of analyzed elements present in PM2.5
As Au Ba Br Ce Co Cr Cs Fe Hf Hg La Mo Rb Sb Sc Se Sm Th W Zn
0.25 -0.80 0.85 0.37 0.85 0.65 0.50 0.80 0.51 -0.35 0.70 0.50 0.39 0.83 0.40 0.80 0.55 0.20 -0.19 0.37 As
-0.97 0.58 0.51 0.35 0.06 0.54 0.33 0.73 0.35 0.01 0.10 0.77 0.48 0.01 0.56 0.08 -0.32 -0.19 0.16 Au
-0.97 -1.00 -0.98 -0.95 -0.89 -0.65 -1.00 -0.43 -0.81 -0.91 -1.00 -0.99 0.62 -0.94 -0.98 -0.98 -0.11 -0.65 Ba
0.61 0.87 0.54 0.57 0.83 0.86 -0.22 0.57 0.23 0.68 0.95 0.35 0.89 0.50 0.16 -0.17 0.58 Br
0.51 0.39 0.29 0.46 0.59 0.15 0.41 0.15 0.77 0.64 0.05 0.66 0.10 -0.32 -0.14 0.50 Ce
0.69 0.53 0.81 0.63 -0.22 0.72 0.24 0.78 0.90 0.35 0.86 0.53 0.25 0.10 0.60 Co
0.09 0.67 -0.13 -0.34 0.66 0.43 0.45 0.61 0.29 0.71 0.45 0.04 -0.24 0.44 Cr
0.44 0.83 0.15 0.47 0.19 0.72 0.60 0.13 0.43 0.19 0.18 -0.20 0.05 Cs
0.39 -0.38 0.73 0.14 0.57 0.85 0.65 0.79 0.72 0.27 -0.29 0.50 Fe
0.56 0.13 0.48 -0.05 0.82 0.26 0.73 0.46 0.26 0.01 0.55 Hf
-0.34 -0.16 0.22 -0.17 -0.41 -0.21 -0.40 -0.37 -0.03 -0.04 Hg
0.30 0.49 0.64 0.42 0.60 0.55 0.41 -0.15 0.26 La
0.36 0.27 -0.07 0.40 0.12 -0.31 -0.21 0.03 Mo
0.79 -0.34 0.76 -0.29 -0.57 -0.02 0.37 Rb
0.41 0.87 0.53 0.15 -0.13 0.68 Sb
0.24 0.89 0.47 -0.11 0.44 Sc
0.44 -0.06 -0.28 0.53 Se
0.39 -0.09 0.50 Sm
0.24 0.17 Th
0.07 W
Zn
Avino
etal.Chem
istryCentralJournal2013,7:173
Page4of
10http://journal.chem
istrycentral.com/content/7/1/173
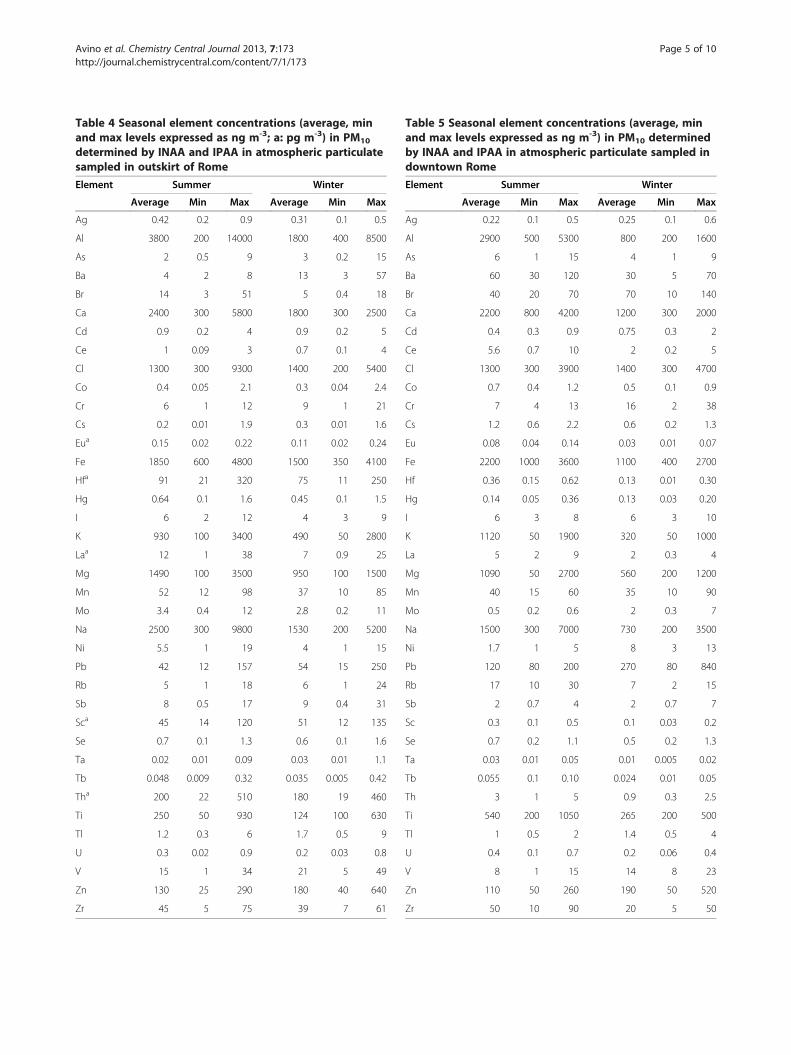
Table 4 Seasonal element concentrations (average, minand max levels expressed as ng m-3; a: pg m-3) in PM10
determined by INAA and IPAA in atmospheric particulatesampled in outskirt of Rome
Element Summer Winter
Average Min Max Average Min Max
Ag 0.42 0.2 0.9 0.31 0.1 0.5
Al 3800 200 14000 1800 400 8500
As 2 0.5 9 3 0.2 15
Ba 4 2 8 13 3 57
Br 14 3 51 5 0.4 18
Ca 2400 300 5800 1800 300 2500
Cd 0.9 0.2 4 0.9 0.2 5
Ce 1 0.09 3 0.7 0.1 4
Cl 1300 300 9300 1400 200 5400
Co 0.4 0.05 2.1 0.3 0.04 2.4
Cr 6 1 12 9 1 21
Cs 0.2 0.01 1.9 0.3 0.01 1.6
Eua 0.15 0.02 0.22 0.11 0.02 0.24
Fe 1850 600 4800 1500 350 4100
Hfa 91 21 320 75 11 250
Hg 0.64 0.1 1.6 0.45 0.1 1.5
I 6 2 12 4 3 9
K 930 100 3400 490 50 2800
Laa 12 1 38 7 0.9 25
Mg 1490 100 3500 950 100 1500
Mn 52 12 98 37 10 85
Mo 3.4 0.4 12 2.8 0.2 11
Na 2500 300 9800 1530 200 5200
Ni 5.5 1 19 4 1 15
Pb 42 12 157 54 15 250
Rb 5 1 18 6 1 24
Sb 8 0.5 17 9 0.4 31
Sca 45 14 120 51 12 135
Se 0.7 0.1 1.3 0.6 0.1 1.6
Ta 0.02 0.01 0.09 0.03 0.01 1.1
Tb 0.048 0.009 0.32 0.035 0.005 0.42
Tha 200 22 510 180 19 460
Ti 250 50 930 124 100 630
Tl 1.2 0.3 6 1.7 0.5 9
U 0.3 0.02 0.9 0.2 0.03 0.8
V 15 1 34 21 5 49
Zn 130 25 290 180 40 640
Zr 45 5 75 39 7 61
Table 5 Seasonal element concentrations (average, minand max levels expressed as ng m-3) in PM10 determinedby INAA and IPAA in atmospheric particulate sampled indowntown Rome
Element Summer Winter
Average Min Max Average Min Max
Ag 0.22 0.1 0.5 0.25 0.1 0.6
Al 2900 500 5300 800 200 1600
As 6 1 15 4 1 9
Ba 60 30 120 30 5 70
Br 40 20 70 70 10 140
Ca 2200 800 4200 1200 300 2000
Cd 0.4 0.3 0.9 0.75 0.3 2
Ce 5.6 0.7 10 2 0.2 5
Cl 1300 300 3900 1400 300 4700
Co 0.7 0.4 1.2 0.5 0.1 0.9
Cr 7 4 13 16 2 38
Cs 1.2 0.6 2.2 0.6 0.2 1.3
Eu 0.08 0.04 0.14 0.03 0.01 0.07
Fe 2200 1000 3600 1100 400 2700
Hf 0.36 0.15 0.62 0.13 0.01 0.30
Hg 0.14 0.05 0.36 0.13 0.03 0.20
I 6 3 8 6 3 10
K 1120 50 1900 320 50 1000
La 5 2 9 2 0.3 4
Mg 1090 50 2700 560 200 1200
Mn 40 15 60 35 10 90
Mo 0.5 0.2 0.6 2 0.3 7
Na 1500 300 7000 730 200 3500
Ni 1.7 1 5 8 3 13
Pb 120 80 200 270 80 840
Rb 17 10 30 7 2 15
Sb 2 0.7 4 2 0.7 7
Sc 0.3 0.1 0.5 0.1 0.03 0.2
Se 0.7 0.2 1.1 0.5 0.2 1.3
Ta 0.03 0.01 0.05 0.01 0.005 0.02
Tb 0.055 0.1 0.10 0.024 0.01 0.05
Th 3 1 5 0.9 0.3 2.5
Ti 540 200 1050 265 200 500
Tl 1 0.5 2 1.4 0.5 4
U 0.4 0.1 0.7 0.2 0.06 0.4
V 8 1 15 14 8 23
Zn 110 50 260 190 50 520
Zr 50 10 90 20 5 50
Avino et al. Chemistry Central Journal 2013, 7:173 Page 5 of 10http://journal.chemistrycentral.com/content/7/1/173
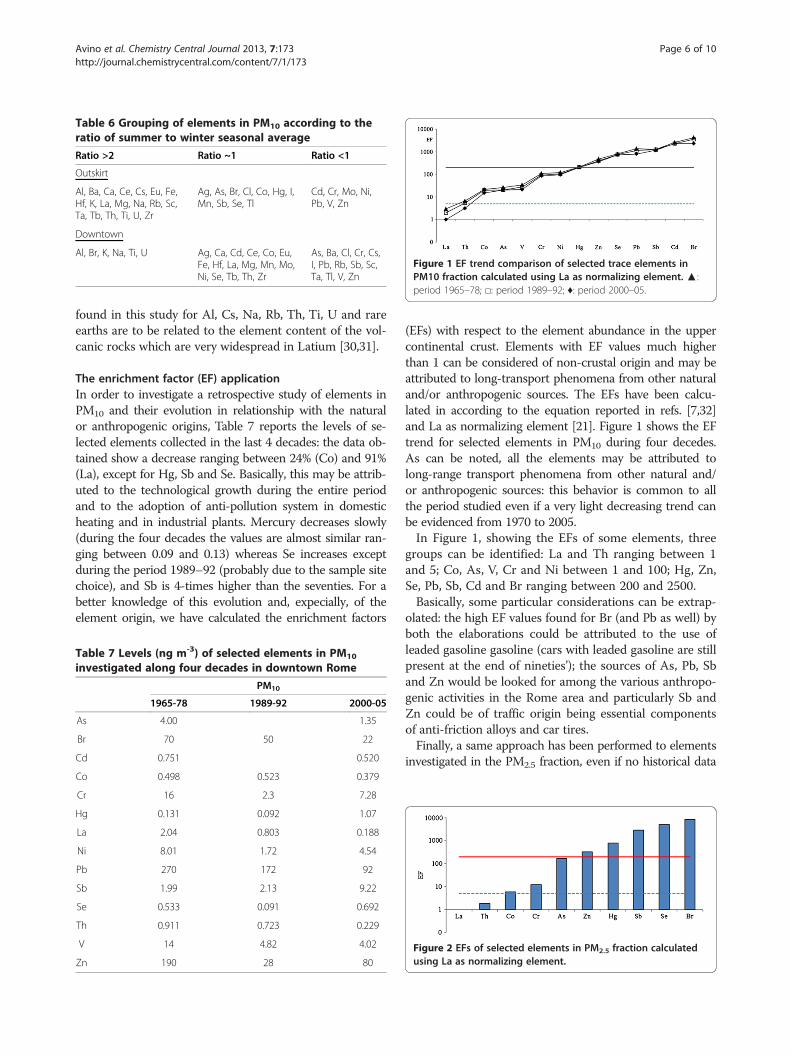
Table 6 Grouping of elements in PM10 according to theratio of summer to winter seasonal average
Ratio >2 Ratio ~1 Ratio <1
Outskirt
Al, Ba, Ca, Ce, Cs, Eu, Fe,Hf, K, La, Mg, Na, Rb, Sc,Ta, Tb, Th, Ti, U, Zr
Ag, As, Br, Cl, Co, Hg, I,Mn, Sb, Se, Tl
Cd, Cr, Mo, Ni,Pb, V, Zn
Downtown
Al, Br, K, Na, Ti, U Ag, Ca, Cd, Ce, Co, Eu,Fe, Hf, La, Mg, Mn, Mo,Ni, Se, Tb, Th, Zr
As, Ba, Cl, Cr, Cs,I, Pb, Rb, Sb, Sc,Ta, Tl, V, Zn
Figure 1 EF trend comparison of selected trace elements inPM10 fraction calculated using La as normalizing element. ▲:period 1965–78; □: period 1989–92; ♦: period 2000–05.
Avino et al. Chemistry Central Journal 2013, 7:173 Page 6 of 10http://journal.chemistrycentral.com/content/7/1/173
found in this study for Al, Cs, Na, Rb, Th, Ti, U and rareearths are to be related to the element content of the vol-canic rocks which are very widespread in Latium [30,31].
The enrichment factor (EF) applicationIn order to investigate a retrospective study of elements inPM10 and their evolution in relationship with the naturalor anthropogenic origins, Table 7 reports the levels of se-lected elements collected in the last 4 decades: the data ob-tained show a decrease ranging between 24% (Co) and 91%(La), except for Hg, Sb and Se. Basically, this may be attrib-uted to the technological growth during the entire periodand to the adoption of anti-pollution system in domesticheating and in industrial plants. Mercury decreases slowly(during the four decades the values are almost similar ran-ging between 0.09 and 0.13) whereas Se increases exceptduring the period 1989–92 (probably due to the sample sitechoice), and Sb is 4-times higher than the seventies. For abetter knowledge of this evolution and, expecially, of theelement origin, we have calculated the enrichment factors
Table 7 Levels (ng m-3) of selected elements in PM10
investigated along four decades in downtown Rome
PM10
1965-78 1989-92 2000-05
As 4.00 1.35
Br 70 50 22
Cd 0.751 0.520
Co 0.498 0.523 0.379
Cr 16 2.3 7.28
Hg 0.131 0.092 1.07
La 2.04 0.803 0.188
Ni 8.01 1.72 4.54
Pb 270 172 92
Sb 1.99 2.13 9.22
Se 0.533 0.091 0.692
Th 0.911 0.723 0.229
V 14 4.82 4.02
Zn 190 28 80
(EFs) with respect to the element abundance in the uppercontinental crust. Elements with EF values much higherthan 1 can be considered of non-crustal origin and may beattributed to long-transport phenomena from other naturaland/or anthropogenic sources. The EFs have been calcu-lated in according to the equation reported in refs. [7,32]and La as normalizing element [21]. Figure 1 shows the EFtrend for selected elements in PM10 during four decedes.As can be noted, all the elements may be attributed tolong-range transport phenomena from other natural and/or anthropogenic sources: this behavior is common to allthe period studied even if a very light decreasing trend canbe evidenced from 1970 to 2005.In Figure 1, showing the EFs of some elements, three
groups can be identified: La and Th ranging between 1and 5; Co, As, V, Cr and Ni between 1 and 100; Hg, Zn,Se, Pb, Sb, Cd and Br ranging between 200 and 2500.Basically, some particular considerations can be extrap-
olated: the high EF values found for Br (and Pb as well) byboth the elaborations could be attributed to the use ofleaded gasoline gasoline (cars with leaded gasoline are stillpresent at the end of nineties’); the sources of As, Pb, Sband Zn would be looked for among the various anthropo-genic activities in the Rome area and particularly Sb andZn could be of traffic origin being essential componentsof anti-friction alloys and car tires.Finally, a same approach has been performed to elements
investigated in the PM2.5 fraction, even if no historical data
Figure 2 EFs of selected elements in PM2.5 fraction calculatedusing La as normalizing element.
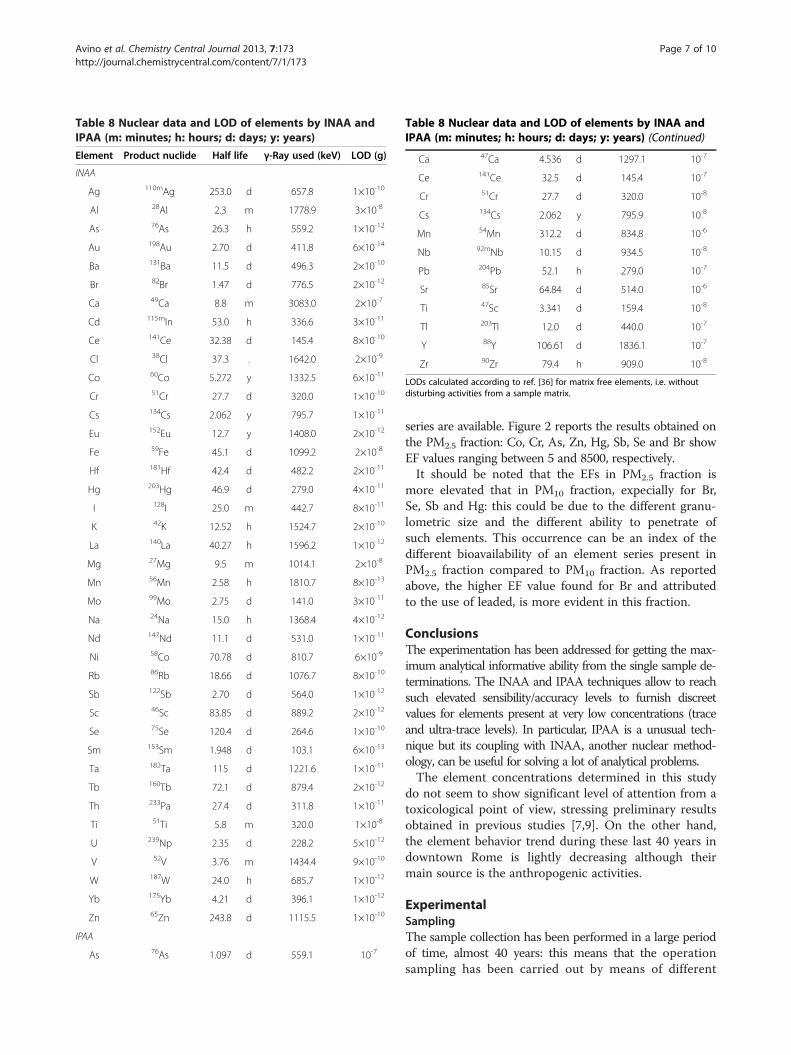
Table 8 Nuclear data and LOD of elements by INAA andIPAA (m: minutes; h: hours; d: days; y: years)
Element Product nuclide Half life γ-Ray used (keV) LOD (g)
INAA
Ag 110mAg 253.0 d 657.8 1×10⁻¹⁰
Al 28Al 2.3 m 1778.9 3×10⁻⁸
As 76As 26.3 h 559.2 1×10-12
Au 198Au 2.70 d 411.8 6×10-14
Ba 131Ba 11.5 d 496.3 2×10⁻¹⁰
Br 82Br 1.47 d 776.5 2×10-12
Ca 49Ca 8.8 m 3083.0 2×10⁻⁷
Cd 115mIn 53.0 h 336.6 3×10-11
Ce 141Ce 32.38 d 145.4 8×10⁻¹⁰
Cl 38Cl 37.3 . 1642.0 2×10⁻⁹
Co 60Co 5.272 y 1332.5 6×10-11
Cr 51Cr 27.7 d 320.0 1×10⁻¹⁰
Cs 134Cs 2.062 y 795.7 1×10-11
Eu 152Eu 12.7 y 1408.0 2×10-12
Fe 59Fe 45.1 d 1099.2 2×10⁻⁸
Hf 181Hf 42.4 d 482.2 2×10-11
Hg 203Hg 46.9 d 279.0 4×10-11
I 128I 25.0 m 442.7 8×10-11
K 42K 12.52 h 1524.7 2×10⁻¹⁰
La 140La 40.27 h 1596.2 1×10-12
Mg 27Mg 9.5 m 1014.1 2×10⁻⁸
Mn 56Mn 2.58 h 1810.7 8×10-13
Mo 99Mo 2.75 d 141.0 3×10-11
Na 24Na 15.0 h 1368.4 4×10-12
Nd 147Nd 11.1 d 531.0 1×10-11
Ni 58Co 70.78 d 810.7 6×10⁻⁹
Rb 86Rb 18.66 d 1076.7 8×10⁻¹⁰
Sb 122Sb 2.70 d 564.0 1×10-12
Sc 46Sc 83.85 d 889.2 2×10-12
Se 75Se 120.4 d 264.6 1×10⁻¹⁰
Sm 153Sm 1.948 d 103.1 6×10-13
Ta 182Ta 115 d 1221.6 1×10-11
Tb 160Tb 72.1 d 879.4 2×10-12
Th 233Pa 27.4 d 311.8 1×10-11
Ti 51Ti 5.8 m 320.0 1×10⁻⁸
U 239Np 2.35 d 228.2 5×10-12
V 52V 3.76 m 1434.4 9×10⁻¹⁰
W 187W 24.0 h 685.7 1×10-12
Yb 175Yb 4.21 d 396.1 1×10-12
Zn 65Zn 243.8 d 1115.5 1×10⁻¹⁰
IPAA
As 76As 1.097 d 559.1 10-7
Table 8 Nuclear data and LOD of elements by INAA andIPAA (m: minutes; h: hours; d: days; y: years) (Continued)
Ca 47Ca 4.536 d 1297.1 10-7
Ce 141Ce 32.5 d 145.4 10-7
Cr 51Cr 27.7 d 320.0 10-8
Cs 134Cs 2.062 y 795.9 10-8
Mn 54Mn 312.2 d 834.8 10-6
Nb 92mNb 10.15 d 934.5 10-8
Pb 204Pb 52.1 h 279.0 10-7
Sr 85Sr 64.84 d 514.0 10-6
Ti 47Sc 3.341 d 159.4 10-8
Tl 203Tl 12.0 d 440.0 10-7
Y 88Y 106.61 d 1836.1 10-7
Zr 90Zr 79.4 h 909.0 10-8
LODs calculated according to ref. [36] for matrix free elements, i.e. withoutdisturbing activities from a sample matrix.
Avino et al. Chemistry Central Journal 2013, 7:173 Page 7 of 10http://journal.chemistrycentral.com/content/7/1/173
series are available. Figure 2 reports the results obtained onthe PM2.5 fraction: Co, Cr, As, Zn, Hg, Sb, Se and Br showEF values ranging between 5 and 8500, respectively.It should be noted that the EFs in PM2.5 fraction is
more elevated that in PM10 fraction, expecially for Br,Se, Sb and Hg: this could be due to the different granu-lometric size and the different ability to penetrate ofsuch elements. This occurrence can be an index of thedifferent bioavailability of an element series present inPM2.5 fraction compared to PM10 fraction. As reportedabove, the higher EF value found for Br and attributedto the use of leaded, is more evident in this fraction.
ConclusionsThe experimentation has been addressed for getting the max-imum analytical informative ability from the single sample de-terminations. The INAA and IPAA techniques allow to reachsuch elevated sensibility/accuracy levels to furnish discreetvalues for elements present at very low concentrations (traceand ultra-trace levels). In particular, IPAA is a unusual tech-nique but its coupling with INAA, another nuclear method-ology, can be useful for solving a lot of analytical problems.The element concentrations determined in this study
do not seem to show significant level of attention from atoxicological point of view, stressing preliminary resultsobtained in previous studies [7,9]. On the other hand,the element behavior trend during these last 40 years indowntown Rome is lightly decreasing although theirmain source is the anthropogenic activities.
ExperimentalSamplingThe sample collection has been performed in a large periodof time, almost 40 years: this means that the operationsampling has been carried out by means of different
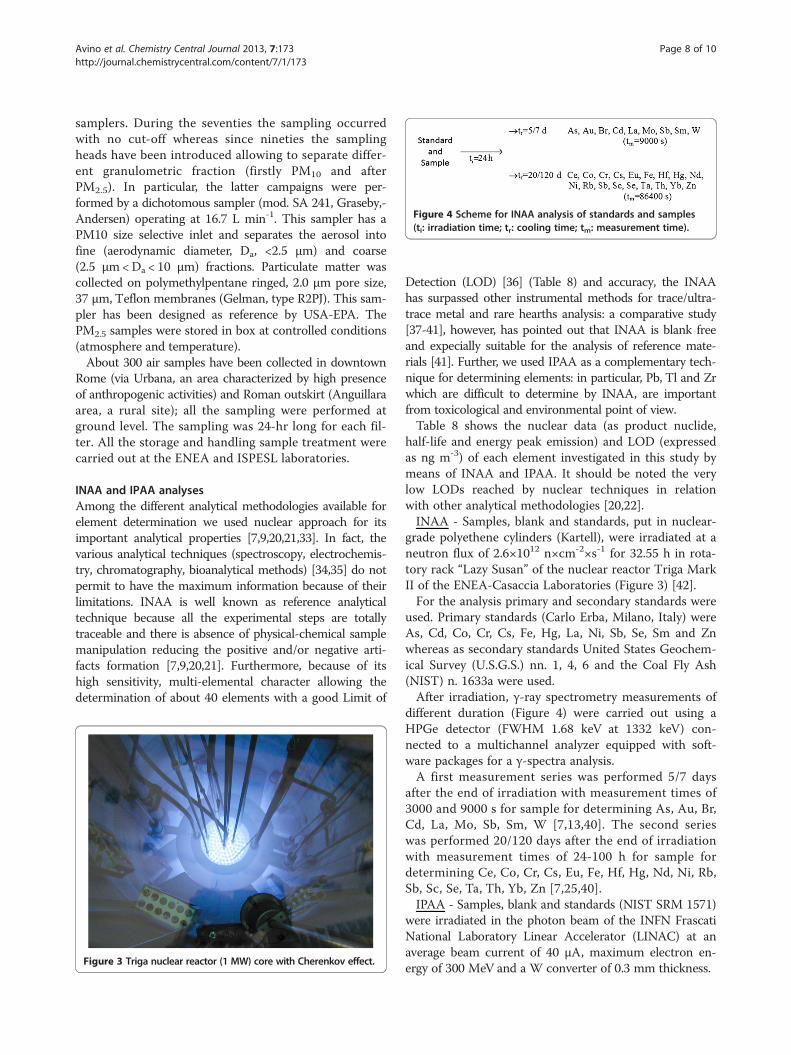
Figure 4 Scheme for INAA analysis of standards and samples(ti: irradiation time; tr: cooling time; tm: measurement time).
Avino et al. Chemistry Central Journal 2013, 7:173 Page 8 of 10http://journal.chemistrycentral.com/content/7/1/173
samplers. During the seventies the sampling occurredwith no cut-off whereas since nineties the samplingheads have been introduced allowing to separate differ-ent granulometric fraction (firstly PM10 and afterPM2.5). In particular, the latter campaigns were per-formed by a dichotomous sampler (mod. SA 241, Graseby,-Andersen) operating at 16.7 L min-1. This sampler has aPM10 size selective inlet and separates the aerosol intofine (aerodynamic diameter, Da, <2.5 μm) and coarse(2.5 μm<Da < 10 μm) fractions. Particulate matter wascollected on polymethylpentane ringed, 2.0 μm pore size,37 μm, Teflon membranes (Gelman, type R2PJ). This sam-pler has been designed as reference by USA-EPA. ThePM2.5 samples were stored in box at controlled conditions(atmosphere and temperature).About 300 air samples have been collected in downtown
Rome (via Urbana, an area characterized by high presenceof anthropogenic activities) and Roman outskirt (Anguillaraarea, a rural site); all the sampling were performed atground level. The sampling was 24-hr long for each fil-ter. All the storage and handling sample treatment werecarried out at the ENEA and ISPESL laboratories.
INAA and IPAA analysesAmong the different analytical methodologies available forelement determination we used nuclear approach for itsimportant analytical properties [7,9,20,21,33]. In fact, thevarious analytical techniques (spectroscopy, electrochemis-try, chromatography, bioanalytical methods) [34,35] do notpermit to have the maximum information because of theirlimitations. INAA is well known as reference analyticaltechnique because all the experimental steps are totallytraceable and there is absence of physical-chemical samplemanipulation reducing the positive and/or negative arti-facts formation [7,9,20,21]. Furthermore, because of itshigh sensitivity, multi-elemental character allowing thedetermination of about 40 elements with a good Limit of
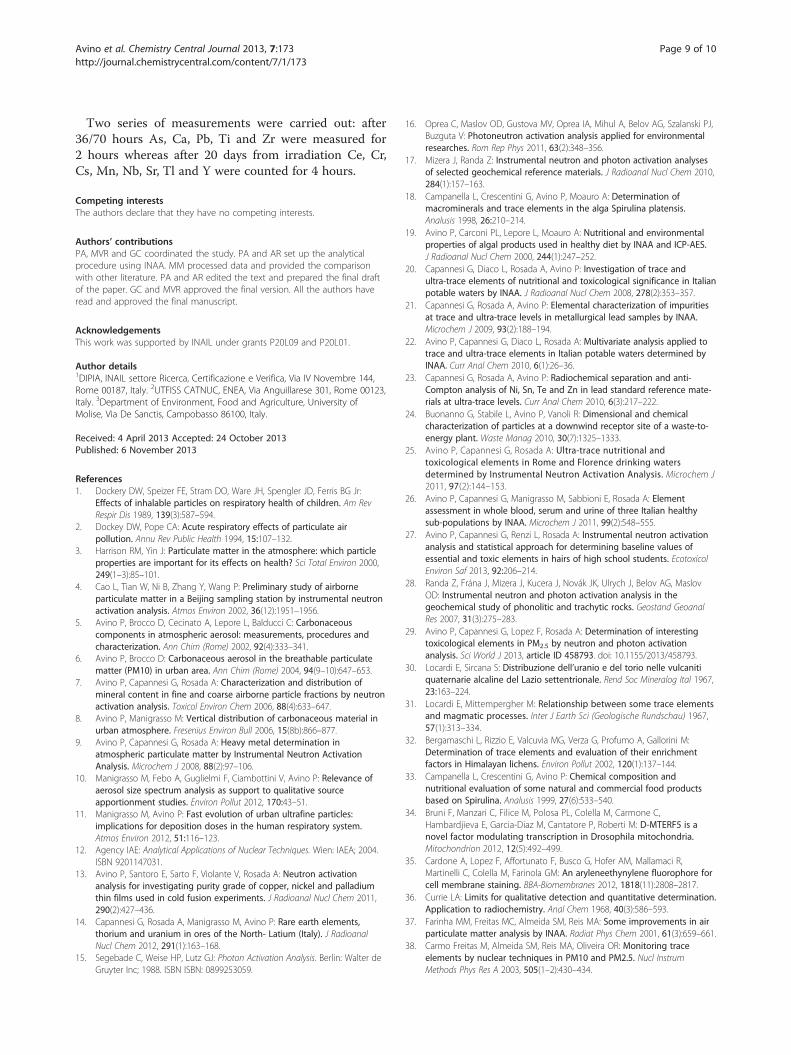
Figure 3 Triga nuclear reactor (1 MW) core with Cherenkov effect.
Detection (LOD) [36] (Table 8) and accuracy, the INAAhas surpassed other instrumental methods for trace/ultra-trace metal and rare hearths analysis: a comparative study[37-41], however, has pointed out that INAA is blank freeand expecially suitable for the analysis of reference mate-rials [41]. Further, we used IPAA as a complementary tech-nique for determining elements: in particular, Pb, Tl and Zrwhich are difficult to determine by INAA, are importantfrom toxicological and environmental point of view.Table 8 shows the nuclear data (as product nuclide,
half-life and energy peak emission) and LOD (expressedas ng m-3) of each element investigated in this study bymeans of INAA and IPAA. It should be noted the verylow LODs reached by nuclear techniques in relationwith other analytical methodologies [20,22].INAA - Samples, blank and standards, put in nuclear-
grade polyethene cylinders (Kartell), were irradiated at aneutron flux of 2.6×10¹² n×cm-2×s-1 for 32.55 h in rota-tory rack “Lazy Susan” of the nuclear reactor Triga MarkII of the ENEA-Casaccia Laboratories (Figure 3) [42].For the analysis primary and secondary standards were
used. Primary standards (Carlo Erba, Milano, Italy) wereAs, Cd, Co, Cr, Cs, Fe, Hg, La, Ni, Sb, Se, Sm and Znwhereas as secondary standards United States Geochem-ical Survey (U.S.G.S.) nn. 1, 4, 6 and the Coal Fly Ash(NIST) n. 1633a were used.After irradiation, γ-ray spectrometry measurements of
different duration (Figure 4) were carried out using aHPGe detector (FWHM 1.68 keV at 1332 keV) con-nected to a multichannel analyzer equipped with soft-ware packages for a γ-spectra analysis.A first measurement series was performed 5/7 days
after the end of irradiation with measurement times of3000 and 9000 s for sample for determining As, Au, Br,Cd, La, Mo, Sb, Sm, W [7,13,40]. The second serieswas performed 20/120 days after the end of irradiationwith measurement times of 24-100 h for sample fordetermining Ce, Co, Cr, Cs, Eu, Fe, Hf, Hg, Nd, Ni, Rb,Sb, Sc, Se, Ta, Th, Yb, Zn [7,25,40].IPAA - Samples, blank and standards (NIST SRM 1571)
were irradiated in the photon beam of the INFN FrascatiNational Laboratory Linear Accelerator (LINAC) at anaverage beam current of 40 μA, maximum electron en-ergy of 300 MeV and a W converter of 0.3 mm thickness.
Avino et al. Chemistry Central Journal 2013, 7:173 Page 9 of 10http://journal.chemistrycentral.com/content/7/1/173
Two series of measurements were carried out: after36/70 hours As, Ca, Pb, Ti and Zr were measured for2 hours whereas after 20 days from irradiation Ce, Cr,Cs, Mn, Nb, Sr, Tl and Y were counted for 4 hours.
Competing interestsThe authors declare that they have no competing interests.
Authors’ contributionsPA, MVR and GC coordinated the study. PA and AR set up the analyticalprocedure using INAA. MM processed data and provided the comparisonwith other literature. PA and AR edited the text and prepared the final draftof the paper. GC and MVR approved the final version. All the authors haveread and approved the final manuscript.
AcknowledgementsThis work was supported by INAIL under grants P20L09 and P20L01.
Author details1DIPIA, INAIL settore Ricerca, Certificazione e Verifica, Via IV Novembre 144,Rome 00187, Italy. 2UTFISS CATNUC, ENEA, Via Anguillarese 301, Rome 00123,Italy. 3Department of Environment, Food and Agriculture, University ofMolise, Via De Sanctis, Campobasso 86100, Italy.
Received: 4 April 2013 Accepted: 24 October 2013Published: 6 November 2013
References1. Dockery DW, Speizer FE, Stram DO, Ware JH, Spengler JD, Ferris BG Jr:
Effects of inhalable particles on respiratory health of children. Am RevRespir Dis 1989, 139(3):587–594.
2. Dockey DW, Pope CA: Acute respiratory effects of particulate airpollution. Annu Rev Public Health 1994, 15:107–132.
3. Harrison RM, Yin J: Particulate matter in the atmosphere: which particleproperties are important for its effects on health? Sci Total Environ 2000,249(1–3):85–101.
4. Cao L, Tian W, Ni B, Zhang Y, Wang P: Preliminary study of airborneparticulate matter in a Beijing sampling station by instrumental neutronactivation analysis. Atmos Environ 2002, 36(12):1951–1956.
5. Avino P, Brocco D, Cecinato A, Lepore L, Balducci C: Carbonaceouscomponents in atmospheric aerosol: measurements, procedures andcharacterization. Ann Chim (Rome) 2002, 92(4):333–341.
6. Avino P, Brocco D: Carbonaceous aerosol in the breathable particulatematter (PM10) in urban area. Ann Chim (Rome) 2004, 94(9–10):647–653.
7. Avino P, Capannesi G, Rosada A: Characterization and distribution ofmineral content in fine and coarse airborne particle fractions by neutronactivation analysis. Toxicol Environ Chem 2006, 88(4):633–647.
8. Avino P, Manigrasso M: Vertical distribution of carbonaceous material inurban atmosphere. Fresenius Environ Bull 2006, 15(8b):866–877.
9. Avino P, Capannesi G, Rosada A: Heavy metal determination inatmospheric particulate matter by Instrumental Neutron ActivationAnalysis. Microchem J 2008, 88(2):97–106.
10. Manigrasso M, Febo A, Guglielmi F, Ciambottini V, Avino P: Relevance ofaerosol size spectrum analysis as support to qualitative sourceapportionment studies. Environ Pollut 2012, 170:43–51.
11. Manigrasso M, Avino P: Fast evolution of urban ultrafine particles:implications for deposition doses in the human respiratory system.Atmos Environ 2012, 51:116–123.
12. Agency IAE: Analytical Applications of Nuclear Techniques. Wien: IAEA; 2004.ISBN 9201147031.
13. Avino P, Santoro E, Sarto F, Violante V, Rosada A: Neutron activationanalysis for investigating purity grade of copper, nickel and palladiumthin films used in cold fusion experiments. J Radioanal Nucl Chem 2011,290(2):427–436.
14. Capannesi G, Rosada A, Manigrasso M, Avino P: Rare earth elements,thorium and uranium in ores of the North- Latium (Italy). J RadioanalNucl Chem 2012, 291(1):163–168.
15. Segebade C, Weise HP, Lutz GJ: Photon Activation Analysis. Berlin: Walter deGruyter Inc; 1988. ISBN ISBN: 0899253059.
16. Oprea C, Maslov OD, Gustova MV, Oprea IA, Mihul A, Belov AG, Szalanski PJ,Buzguta V: Photoneutron activation analysis applied for environmentalresearches. Rom Rep Phys 2011, 63(2):348–356.
17. Mizera J, Randa Z: Instrumental neutron and photon activation analysesof selected geochemical reference materials. J Radioanal Nucl Chem 2010,284(1):157–163.
18. Campanella L, Crescentini G, Avino P, Moauro A: Determination ofmacrominerals and trace elements in the alga Spirulina platensis.Analusis 1998, 26:210–214.
19. Avino P, Carconi PL, Lepore L, Moauro A: Nutritional and environmentalproperties of algal products used in healthy diet by INAA and ICP-AES.J Radioanal Nucl Chem 2000, 244(1):247–252.
20. Capannesi G, Diaco L, Rosada A, Avino P: Investigation of trace andultra-trace elements of nutritional and toxicological significance in Italianpotable waters by INAA. J Radioanal Nucl Chem 2008, 278(2):353–357.
21. Capannesi G, Rosada A, Avino P: Elemental characterization of impuritiesat trace and ultra-trace levels in metallurgical lead samples by INAA.Microchem J 2009, 93(2):188–194.
22. Avino P, Capannesi G, Diaco L, Rosada A: Multivariate analysis applied totrace and ultra-trace elements in Italian potable waters determined byINAA. Curr Anal Chem 2010, 6(1):26–36.
23. Capannesi G, Rosada A, Avino P: Radiochemical separation and anti-Compton analysis of Ni, Sn, Te and Zn in lead standard reference mate-rials at ultra-trace levels. Curr Anal Chem 2010, 6(3):217–222.
24. Buonanno G, Stabile L, Avino P, Vanoli R: Dimensional and chemicalcharacterization of particles at a downwind receptor site of a waste-to-energy plant. Waste Manag 2010, 30(7):1325–1333.
25. Avino P, Capannesi G, Rosada A: Ultra-trace nutritional andtoxicological elements in Rome and Florence drinking watersdetermined by Instrumental Neutron Activation Analysis. Microchem J2011, 97(2):144–153.
26. Avino P, Capannesi G, Manigrasso M, Sabbioni E, Rosada A: Elementassessment in whole blood, serum and urine of three Italian healthysub-populations by INAA. Microchem J 2011, 99(2):548–555.
27. Avino P, Capannesi G, Renzi L, Rosada A: Instrumental neutron activationanalysis and statistical approach for determining baseline values ofessential and toxic elements in hairs of high school students. EcotoxicolEnviron Saf 2013, 92:206–214.
28. Randa Z, Frána J, Mizera J, Kucera J, Novák JK, Ulrych J, Belov AG, MaslovOD: Instrumental neutron and photon activation analysis in thegeochemical study of phonolitic and trachytic rocks. Geostand GeoanalRes 2007, 31(3):275–283.
29. Avino P, Capannesi G, Lopez F, Rosada A: Determination of interestingtoxicological elements in PM2.5 by neutron and photon activationanalysis. Sci World J 2013, article ID 458793. doi: 10.1155/2013/458793.
30. Locardi E, Sircana S: Distribuzione dell’uranio e del torio nelle vulcanitiquaternarie alcaline del Lazio settentrionale. Rend Soc Mineralog Ital 1967,23:163–224.
31. Locardi E, Mittempergher M: Relationship between some trace elementsand magmatic processes. Inter J Earth Sci (Geologische Rundschau) 1967,57(1):313–334.
32. Bergamaschi L, Rizzio E, Valcuvia MG, Verza G, Profumo A, Gallorini M:Determination of trace elements and evaluation of their enrichmentfactors in Himalayan lichens. Environ Pollut 2002, 120(1):137–144.
33. Campanella L, Crescentini G, Avino P: Chemical composition andnutritional evaluation of some natural and commercial food productsbased on Spirulina. Analusis 1999, 27(6):533–540.
34. Bruni F, Manzari C, Filice M, Polosa PL, Colella M, Carmone C,Hambardjieva E, Garcia-Diaz M, Cantatore P, Roberti M: D-MTERF5 is anovel factor modulating transcription in Drosophila mitochondria.Mitochondrion 2012, 12(5):492–499.
35. Cardone A, Lopez F, Affortunato F, Busco G, Hofer AM, Mallamaci R,Martinelli C, Colella M, Farinola GM: An aryleneethynylene fluorophore forcell membrane staining. BBA-Biomembranes 2012, 1818(11):2808–2817.
36. Currie LA: Limits for qualitative detection and quantitative determination.Application to radiochemistry. Anal Chem 1968, 40(3):586–593.
37. Farinha MM, Freitas MC, Almeida SM, Reis MA: Some improvements in airparticulate matter analysis by INAA. Radiat Phys Chem 2001, 61(3):659–661.
38. Carmo Freitas M, Almeida SM, Reis MA, Oliveira OR: Monitoring traceelements by nuclear techniques in PM10 and PM2.5. Nucl InstrumMethods Phys Res A 2003, 505(1–2):430–434.
Avino et al. Chemistry Central Journal 2013, 7:173 Page 10 of 10http://journal.chemistrycentral.com/content/7/1/173
39. Almeida SM, Reis MA, Freitas MC, Pio CA: Quality assurance in elementalanalysis of airborne particles. Nucl Instrum Methods Phys Res, Sect B 2003,207(4):434–446.
40. Djingova R, Arpadjan S, Kuleff I: INAA and flame AAS of various vegetablereference materials. Fresenius J Anal Chem 1991, 339(3):181–186.
41. Djingova R, Kuleff I: Instrumental techniques for trace analysis. In Trace Elements -Their Distribution and Effects in the Environment. Edited by Markert B, Friese K.Amsterdam, The Netherlands: Elsevier; 2000:137–185. ISBN ISBN-13: 9780444505323.
42. Di Palo L, Focaccia G, Lo Prato E, Marsili F, Paletti A, Perni M, Prosperi D,Sciuti S, Verri A: Il reattore RC-1 ad 1 MW del Centro Studi Nucleari dellaCasaccia. Caratteristiche generali e programmi di ricerca. Ener Nuc 1967,14:659–664.
doi:10.1186/1752-153X-7-173Cite this article as: Avino et al.: Deep investigation on inorganic fractionof atmospheric PM in Mediterranean area by neutron and photonactivation analysis. Chemistry Central Journal 2013 7:173.
Open access provides opportunities to our colleagues in other parts of the globe, by allowing
anyone to view the content free of charge.
Publish with ChemistryCentral and everyscientist can read your work free of charge
W. Jeffery Hurst, The Hershey Company.
available free of charge to the entire scientific communitypeer reviewed and published immediately upon acceptancecited in PubMed and archived on PubMed Centralyours you keep the copyright
Submit your manuscript here:http://www.chemistrycentral.com/manuscript/
Top Related
Copyright © 2022 FDOKUMEN

