


Bahasa
Halaman
Hukum


REPORT DOCUMENTATION PAGE Form Approved
OMB No. 0704-0188 Public reporting burden for this collection of information is estimated to average t hour per response, including the time for reviewing instructions, searching existing data sources, gathering and maintaining the data needed, and completing and reviewing this collection of information Send comments regarding this burden estimate or any other aspect of this collection of information, including suggestions for reducing this burden to Department of Defense, Washington Headquarters Services, Directorate for Information Operations and Reports (0704-0188), 1215 Jefferson Davis Highway, Suite 1204, Arlington, VA 22202- 4302. Respondents should be aware that notwithstanding any other provision of law, no person shall be subject to any penalty for failing to comply with a collection of information if it does not display a currently valid OMB control number PLEASE DO NOT RETURN YOUR FORM TO THE ABOVE ADDRESS.
1. REPORT DATE (DD-MM-YYYY) 30-Sep-2009
2. REPORT TYPE REPRINT
3. DATES COVERED (From - To)
4. TITLE AND SUBTITLE CRUSTAL STRUCTURE FROM IN-COUNTRY AND GROUND-TRUTH DATA
5a. CONTRACT NUMBER FA8718-08-C-0020
5b. GRANT NUMBER
5c. PROGRAM ELEMENT NUMBER 6260IF
6. AUTHOR(S)
Eric A. Bergman . E. Robert Engdahl, Michael H. Ritzwoller, and Stephen C. Myers 5d. PROJECT NUMBER
mm 5e. TASK NUMBER
SM
5f. WORK UNIT NUMBER Al
7. PERFORMING ORGANIZATION NAME(S) AND ADDRESS(ES)
University of Colorado at Boulder 3100 Marine St. Boulder, CO 80303-1058
8. PERFORMING ORGANIZATION REPORT NUMBER
9. SPONSORING / MONITORING AGENCY NAME(S) AND ADDRESS(ES) Air Force Research Laboratory 29 Randolph Road Hanscom AFB, MA 01731-3010
10. SPONSOR/MONITOR'S ACRONYM(S) AFRL/RVBYE
11. SPONSOR/MONITOR'S REPORT NUMBER(S)
AFRL-RV-HA-TR-2009-1078 12. DISTRIBUTION / AVAILABILITY STATEMENT Approved for Public Release; Distribution Unlimited.
I 2
University of Colorado and Lawrence Livermore National Laboratory
13. SUPPLEMENTARY NOTES Reprinted from: Proceedings of the 2009 Monitoring Research Review - Ground-Based Nuclear Explosion Monitoring Technologies, 21 - 23 September 2009, Tucson, AZ, Volume I pp 22 - 31. 14. ABSTRACT
We are investigating the crustal and upper mantle structure of the region in central Asia bounded approximately by longitude 41-67°E and latitude 20-44°N by using in-country datasets of seismic phase arrival times, supplemented by gTound truth datasets developed from our previous research efforts. We present the results of Pn tomography using a dataset consisting entirely of GT5 events in the region. From 27 calibrated earthquake clusters we extract 832 events that qualify as ground truth (GT)5 at the 90** confidence level. The raypaths of Pn readings from these events provide good coverage of most of the region except for the Makran region in the southeast. To determine an appropriate reference model for the region we compared empirical travel times calculated from the GT5 dataset to those predicted by several models: the akl35 global model {Kennett et al.. 1995). the CUB2.0 model (Ritzwoller et al.. 2003). and the so-called "Unified" model a 3-D velocity model of the crust and upper mantle in Eurasia, constructed from models developed by researchers at Lawrence Livermore National Laboratory (LLNL) and Los Alamos National Laboratory (LAND (Pasyanos et al. 2004: Begnaud et al.. 2004; Steck et al.. 2004; Flanagan et al.. 2007). Although the CLJB2.0 and Unified models do vary laterally, in the study region they vary quite slowly and capture little of the variability of observed travel times. All three models predict Pn travel times that are systematically too fast. These baseline errors range from 2-4 seconds. For this initial round of tomography we stretched the akl.35 model to a crustal thickness of 45 km for the reference model.
Tomography is first performed in a "traditional" way. allowing for individual event corrections as well as station corrections. Through relative event relocation, however, these clusters of GT5 events have very strong constraints on relative location, depth, and origin time of the associated earthquakes. For each cluster, then, we can assign a single "cluster correction". This dramatically reduces the number of free parameters and stabilizes the inversion This exercise helps reveal problems in the GT5 dataset that can in some cases (e.g.. erroneous station coordinates) be corrected, enhancing the value of the GT5 dataset for validation of tomography based on larger, uncalibrated datasets. It also reveals patterns in Pn velocities in the study region which have much shorter wavelength than previous studies We also investigated the possible contribution of crustal thickness variations to account for the observed variability of empirical travel times for Pn. The experiment is based on a simple model of a single-layer crust over a halfspace. A digital terrain map is filtered at 100 km and converted to Moho depth, under the asumption of full isostatic compensation, which is almost certainly an over-estimate. For reasonable density contrast the Moho depth variation is about 5 times the topography. For a set of raypaths based on the locations of the actual events in the GT dataset and actual stations we calculate the Pn travel time through the crust and along the crust- mantle boundary of the perturbed model and also through the unperturbed fiat-layered model, and take the difference. The variance of these differences is about Ack of the variance of observed Pn travel times in the study region, suggesting that crustal thickness variations contribute only at a low level to the observed variability. Most of the variability in Pn uavel times presumably arrises from lateral variations in bulk velocity, perturbations to the ray paths caused by those lateral variations, errors in cluster calibration, and phase identification errors.
15. SUBJECT TERMS Seismic velocity models, Seismic clusters, Middle East
16. SECURITY CLASSIFICATION OF:
a. REPORT UNCLAS
b. ABSTRACT UNCLAS
c. THIS PAGE UNCLAS
17. LIMITATION OF ABSTRACT
SAR
18. NUMBER OF PAGES
19a. NAME OF RESPONSIBLE PERSON Robert J. Raistrick 19b. TELEPHONE NUMBER (include urea code)
Standard Form 298 (Rev. 8-98) Prescribed by ANSI Std. 239.18
2009 Monitoring Research Review: Ground-Based Nuclear Explosion Monitoring Technologies
CRUSTAL STRUCTURE FROM IN-COUNTRY AND GROUND-TRUTH DATA
Eric A. Bergman', E. Robert Engdahl1, Michael H. Ritzwoller', and Stephen C. Myers2
University of Colorado1 and Lawrence Livermore National Laboratory2
Sponsored by the Air Force Research Laboratory and the by the National Nuclear Security Administration
Award Nos. FA8718-08-C-00201 and DE-AC52-07NA273442
Proposal No. BAA08-69
ABSTRACT
We are investigating the crustal and upper mantle structure of the region in central Asia bounded approximately by longitude 41-67°E and latitude 20-44°N by using in-country datasets of seismic phase arrival times, supplemented by ground truth datasets developed from our previous research efforts. We present the results of Pn tomography using a dataset consisting entirely of GT5 events in the region. From 27 calibrated earthquake clusters we extract 832 events that qualify as ground truth (GT)5 at the 90% confidence level. The raypaths of Pn readings from these events provide good coverage of most of the region except for the Makran region in the southeast. To determine an appropriate reference model for the region we compared empirical travel times calculated from the GT5 dataset to those predicted by several models: the akl35 global model (Kennett et al., 1995), the CUB2.0 model (Ritzwoller et
^>- al., 2003), and the so-called "Unified" model a 3-D velocity model of the crust and upper mantle in Eurasia, f) constructed from models developed by researchers at Lawrence Livermore National Laboratory (LLNL) and Los Q Alamos National Laboratory (LANL) (Pasyanos et al, 2004; Begnaud et al., 2004; Steck et al., 2004; Flanagan et al., e N 2007). Although the CUB2.0 and Unified models do vary laterally, in the study region they vary quite slowly and
capture little of the variability of observed travel times. All three models predict Pn travel times that are O systematically too fast. These baseline errors range from 2-4 seconds. For this initial round of tomography we J"" stretched the akl 35 model to a crustal thickness of 45 km for the reference model. P- O Tomography is first performed in a "traditional" way, allowing for individual event corrections as well as station
corrections. Through relative event relocation, however, these clusters of GT5 events have very strong constraints on relative location, depth, and origin time of the associated earthquakes. For each cluster, then, we can assign a single "cluster correction". This dramatically reduces the number of free parameters and stabilizes the inversion. This exercise helps reveal problems in the GT5 dataset that can in some cases (e.g., erroneous station coordinates) be corrected, enhancing the value of the GT5 dataset for validation of tomography based on larger, uncalibratcd datasets. It also reveals patterns in Pn velocities in the study region which have much shorter wavelength than previous studies. We also investigated the possible contribution of crustal thickness variations to account for the observed variability of empirical travel times for Pn. The experiment is based on a simple model of a single-layer crust over a halfspace. A digital terrain map is filtered at 100 km and converted to Moho depth, under the asumption of full isostatic compensation, which is almost certainly an over-estimate. For reasonable density contrast the Moho depth variation is about 5 times the topography. For a set of raypaths based on the locations of the actual events in the GT dataset and actual stations we calculate the Pn travel time through the crust and along the crust-mantle boundary of the perturbed model and also through the unperturbed flat-layered model, and take the difference. The variance of these differences is about 4% of the variance of observed Pn travel times in the study region, suggesting that crustal thickness variations contribute only at a low level to the observed variability. Most of the variability in Pn travel times presumably arrises from lateral variations in bulk velocity, perturbations to the ray paths caused by those lateral variations, errors in cluster calibration, and phase identification errors.
20090914207 22
2009 Monitoring Research Review: Ground-Based Nuclear Explosion Monitoring Technologies
OBJECTIVES
This research has the goal of developing in-country datasets that can be used to improve ground-based monitoring capabilities in the study region, by providing information needed to develop and test more accurate travel time models for seismic phases that propagate in the crust and upper mantle. The main dataset to be produced is a bulletin of earthquakes in the region at magnitudes of 2.5 and higher, associated with readings from seismograph stations operating in-country for the period 1995-2005. These events and readings will be integrated with the best available catalog of regional seismicity for that period that includes associated regional and teleseismic phase arrival times. All events will be relocated, carefully reviewed, and calibrated, where possible, with ground truth data. We will conduct preliminary modeling experiments with these data, using Pn/Sn tomography to image broad-scale features of the crust and upper mantle in the region. The tomographic experiments will also help reveal problems in the datasets of earthquake locations and phase identifications, and thus serve a quality control function. The resulting datasets and model results will provide a solid foundation for further research.
RESEARCH ACCOMPLISHED
In-Country Data
The main sources of in-country data are the seismic networks operated by the International Institute of Earthquake Engineering and Seismology (IIEES) and the University of Tehran Institute of Geophysics (UTIG). We have acquired all phase reading data from these networks through 2005, and integrated the data with other readings from regional and global networks. We have also acquired phase reading data from 2005 through 2008 for both networks but this data is still being processed.
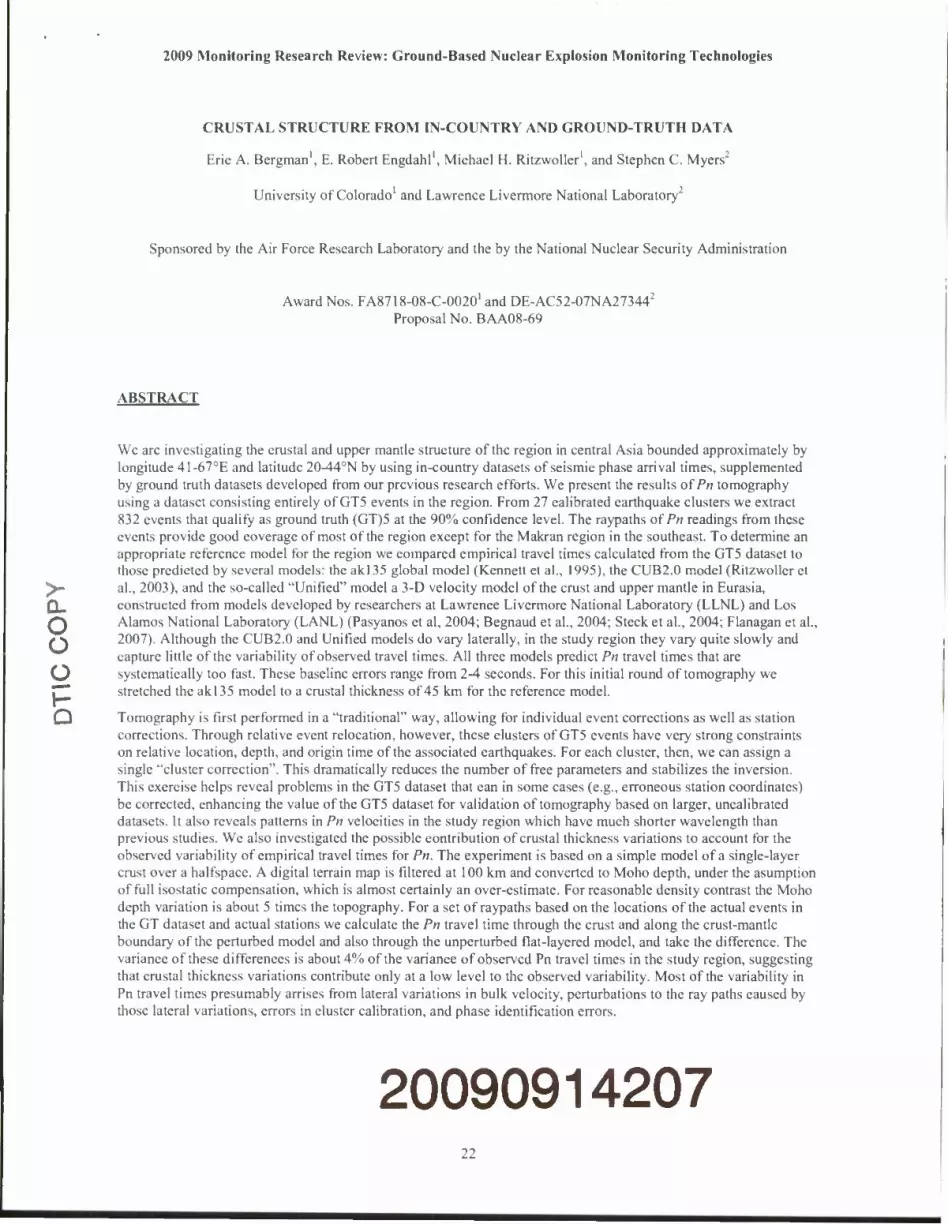
We have also acquired independent datasets of phase readings from the Oman network (2004-2007) (Figure 1) and the Kuwait network (2000-2008) for earthquakes in the study region and these are being merged with other readings. The Oman data in particular is of great value for improving location accuracy in the southernmost part of the study region.
Figure 1. Locations of events determined by the Oman network during 2005-2007, for which phase readings have been acquired. These network locations are extremely poor and it is a difficult task to properly associate these readings with well-constrained events in our main catalog.
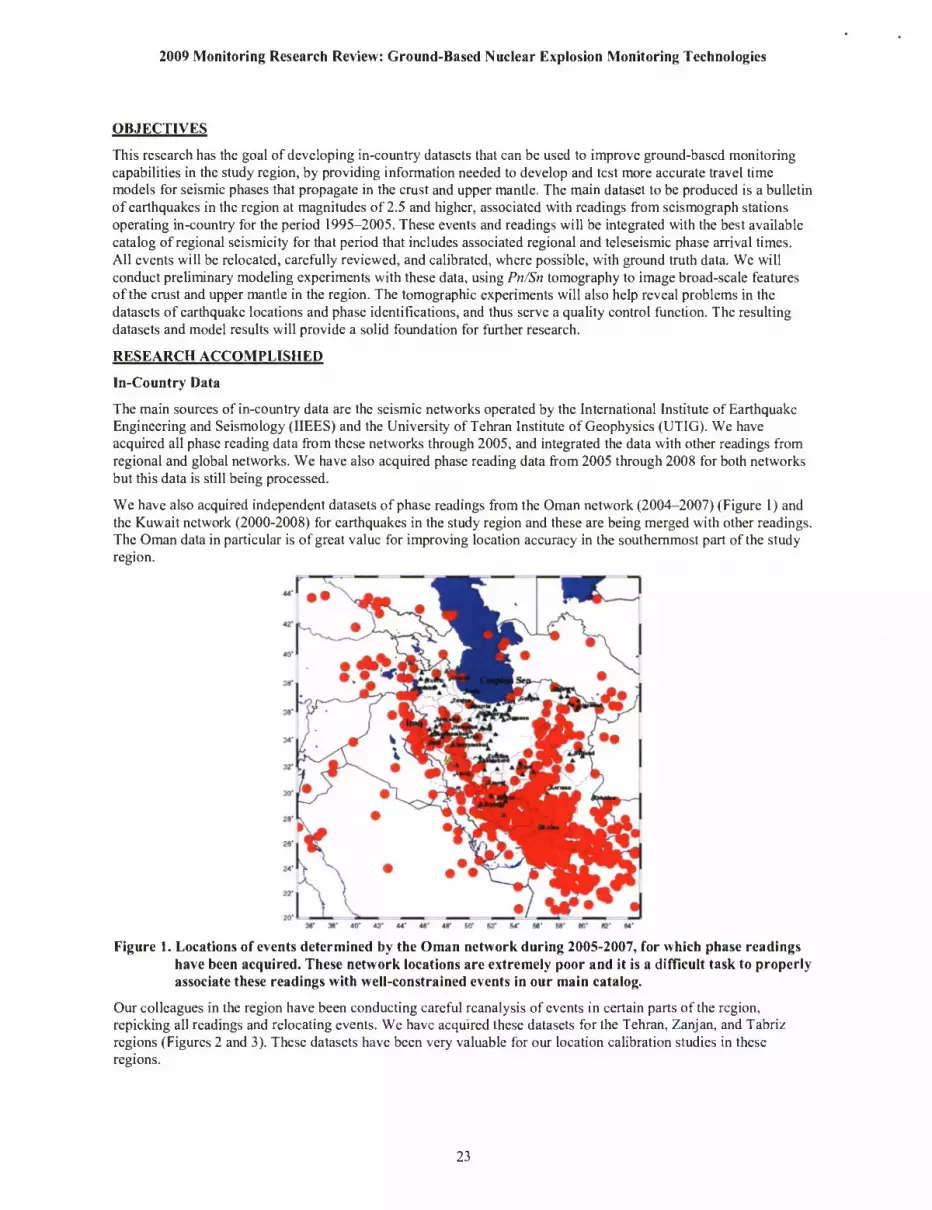
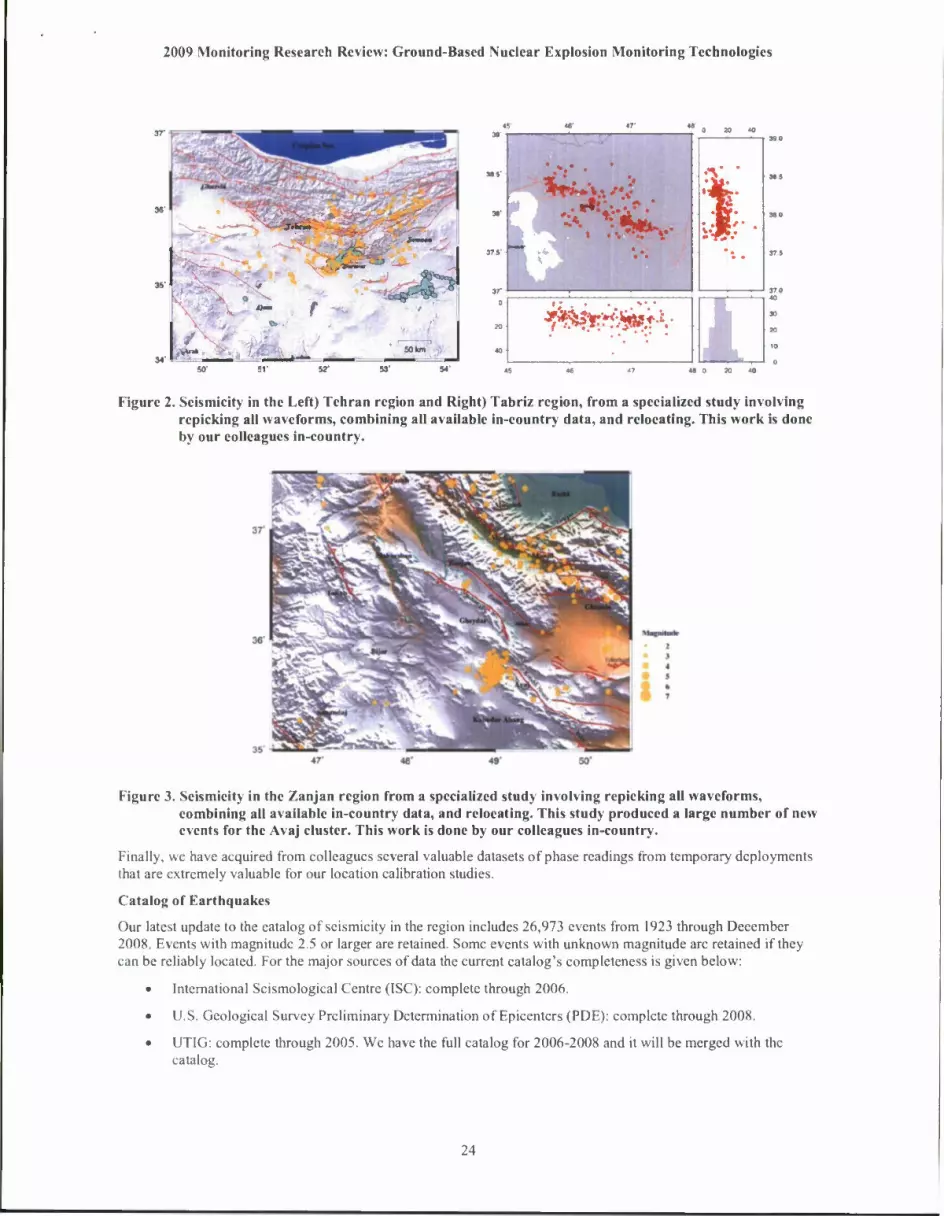
Our colleagues in the region have been conducting careful reanalysis of events in certain parts of the region, repicking all readings and relocating events. We have acquired these datasets for the Tehran, Zanjan, and Tabriz regions (Figures 2 and 3). These datasets have been very valuable for our location calibration studies in these regions.
23
2009 Monitoring Research Review: Ground-Based Nuclear Explosion Monitoring Technologies
Mr»
W N
M— — _ ^r _
•.-:• • '
• ^3
0 20 W
••
$ft^#£fV __ 0 X <0
Figure 2. Seismicity in the Left) Tehran region and Right) Tabriz region, from a specialized study involving repicking all waveforms, combining all available in-country data, and relocating. This work is done by our colleagues in-country.
Figure 3. Seismicity in the Zanjan region from a specialized study involving repicking all waveforms, combining all available in-country data, and relocating. This study produced a large number of new events for the Avaj cluster. This work is done by our colleagues in-country.
Finally, we have acquired from colleagues several valuable datasets of phase readings from temporary deployments that are extremely valuable for our location calibration studies.
Catalog of Earthquakes
Our latest update to the catalog of seismicity in the region includes 26,973 events from 1923 through December 2008. Events with magnitude 2.5 or larger are retained. Some events with unknown magnitude are retained if they can be reliably located. For the major sources of data the current catalog's completeness is given below:
• International Seismological Centre (ISC): complete through 2006.
• U.S. Geological Survey Preliminary Determination of Epicenters (PDE): complete through 2008.
• UTIG: complete through 2005. We have the full catalog for 2006-2008 and it will be merged with the catalog.
24
2009 Monitoring Research Review: Ground-Based Nuclear Explosion Monitoring Technologies
• IIEES: complete through 2008 for data reported to the ISC, but not all readings are reported that way. We have the full IIEES catalog through 2008 and it will be merged with the catalog.
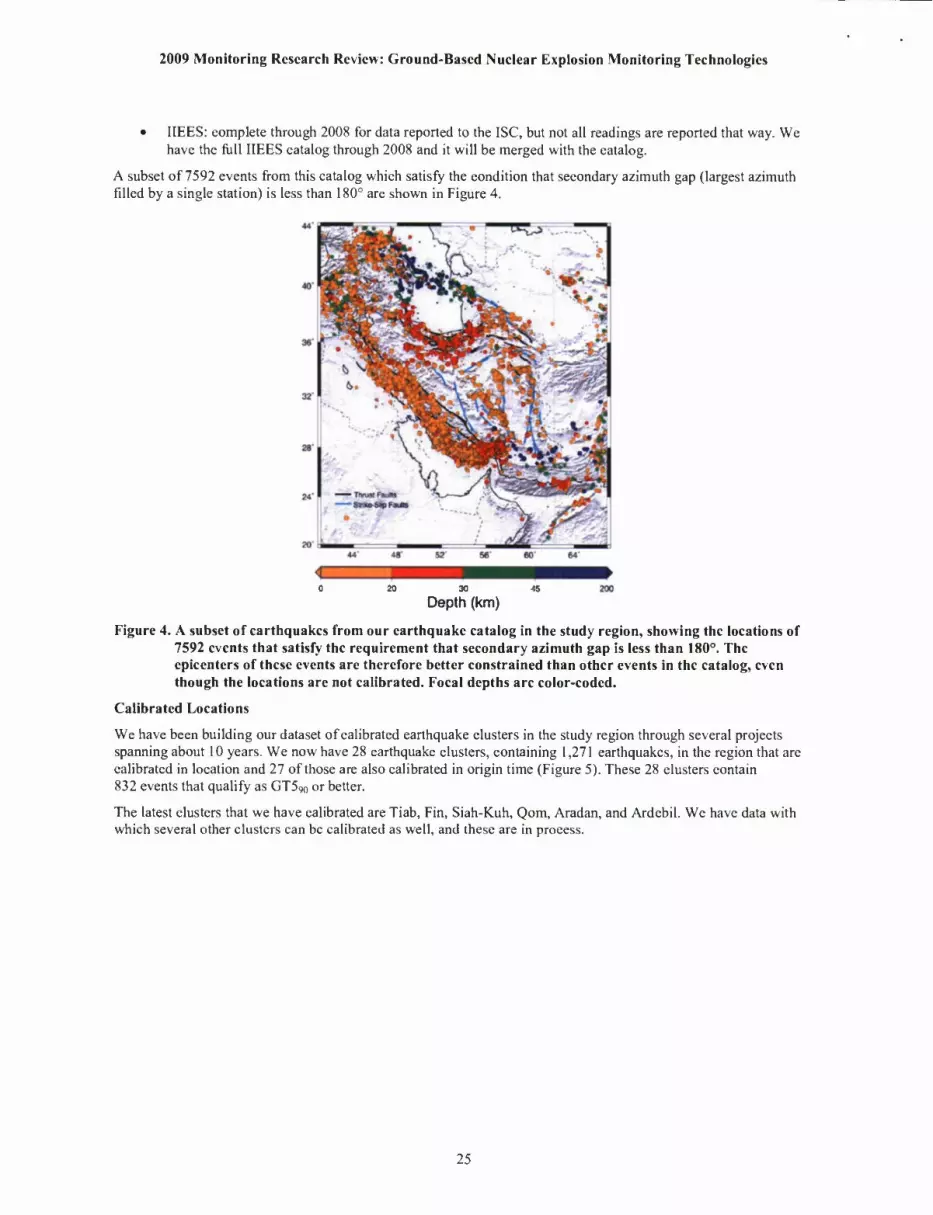
A subset of 7592 events from this catalog which satisfy the condition that secondary azimuth gap (largest azimuth filled by a single station) is less than 180° are shown in Figure 4.
20 30 45
Depth (km)
Figure 4. A subset of earthquakes from our earthquake catalog in the study region, showing the locations of 7592 events that satisfy the requirement that secondary azimuth gap is less than 180°. The epicenters of these events are therefore better constrained than other events in the catalog, even though the locations are not calibrated. Focal depths are color-coded.
Calibrated Locations
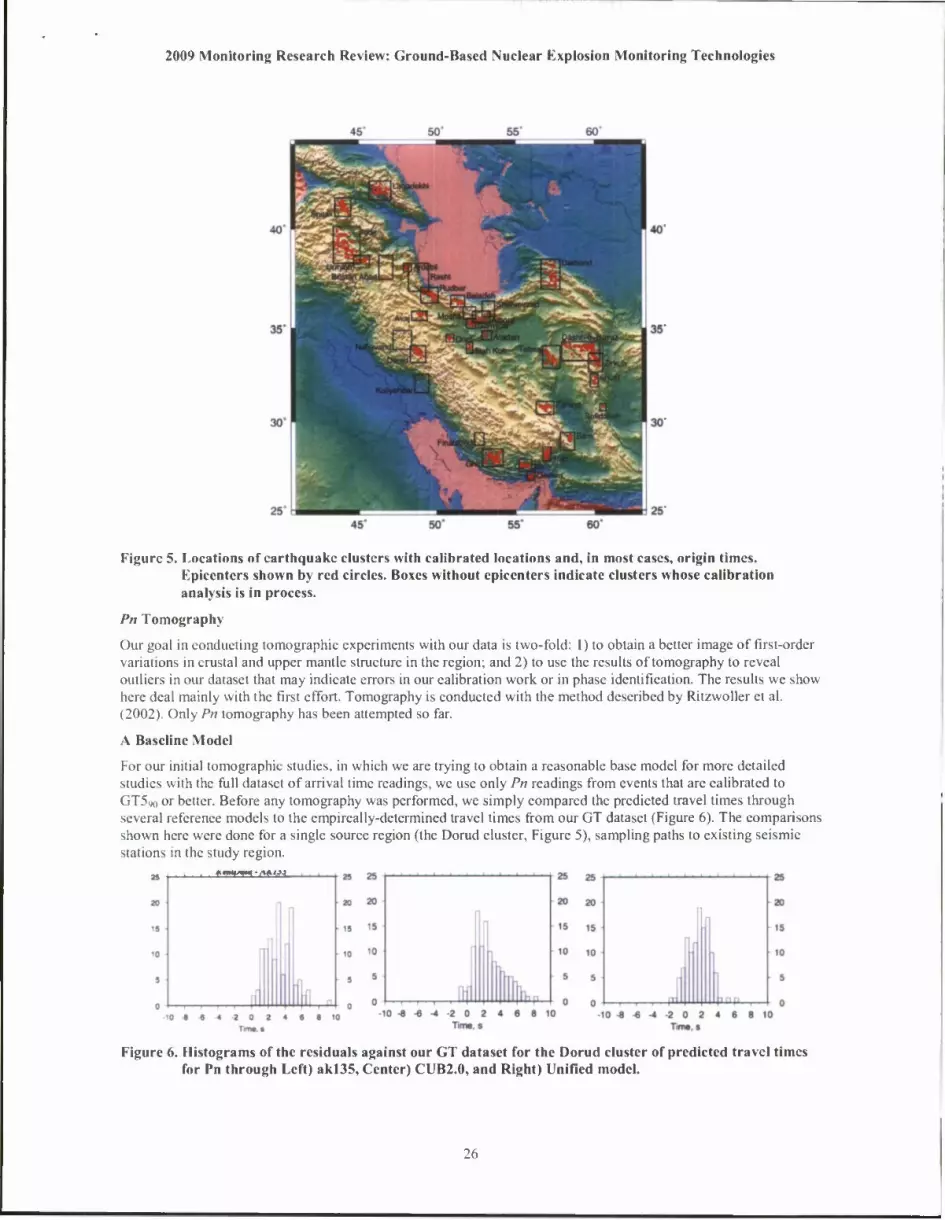
We have been building our dataset of calibrated earthquake clusters in the study region through several projects spanning about 10 years. We now have 28 earthquake clusters, containing 1,271 earthquakes, in the region that are calibrated in location and 27 of those are also calibrated in origin time (Figure 5). These 28 clusters contain 832 events that qualify as GT590 or better.
The latest clusters that we have calibrated are Tiab, Fin, Siah-Kuh, Qom, Aradan, and Ardebil. We have data with which several other clusters can be calibrated as well, and these are in process.
25
2009 Monitoring Research Review: Ground-Based Nuclear Explosion Monitoring Technologies
Figure 5. Locations of earthquake clusters with calibrated locations and, in most cases, origin times. Epicenters shown by red circles. Boxes without epicenters indicate clusters whose calibration analysis is in process.
Pn Tomography
Our goal in conducting tomographic experiments with our data is two-fold: 1) to obtain a better image of first-order variations in crustal and upper mantle structure in the region; and 2) to use the results of tomography to reveal outliers in our dataset that may indicate errors in our calibration work or in phase identification. The results we show here deal mainly with the first effort. Tomography is conducted with the method described by Ritzwoller et al. (2002). Only Pn tomography has been attempted so far.
A Baseline Model
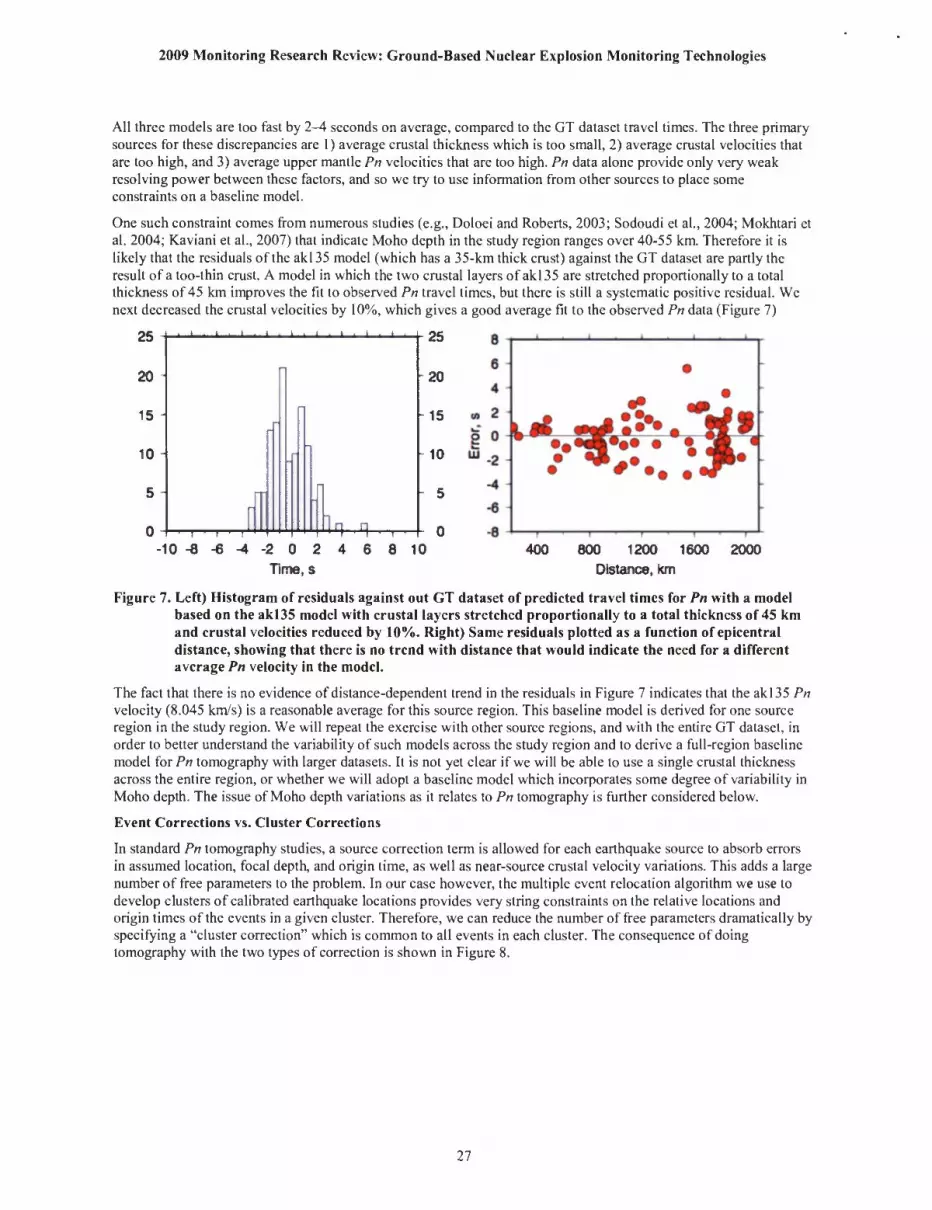
For our initial tomographic studies, in which we are trying to obtain a reasonable base model for more detailed studies with the full dataset of arrival time readings, we use only Pn readings from events that are calibrated to GT5vo or better. Before any tomography was performed, we simply compared the predicted travel times through several reference models to the empircally-determined travel times from our GT dataset (Figure 6). The comparisons shown here were done for a single source region (the Dorud cluster, Figure 5), sampling paths to existing seismic stations in the study region.
Figure 6. Histograms of the residuals against our GT dataset for the Dorud cluster of predicted travel times for Pn through Left) ak!35, Center) CUB2.0, and Right) Unified model.
26
2009 Monitoring Research Review: Ground-Based Nuclear Explosion Monitoring Technologies
All three models are too fast by 2-4 seconds on average, compared to the GT dataset travel times. The three primary sources for these discrepancies are 1) average crustal thickness which is too small, 2) average crustal velocities that are too high, and 3) average upper mantle Pn velocities that are too high. Pn data alone provide only very weak resolving power between these factors, and so we try to use information from other sources to place some constraints on a baseline model.
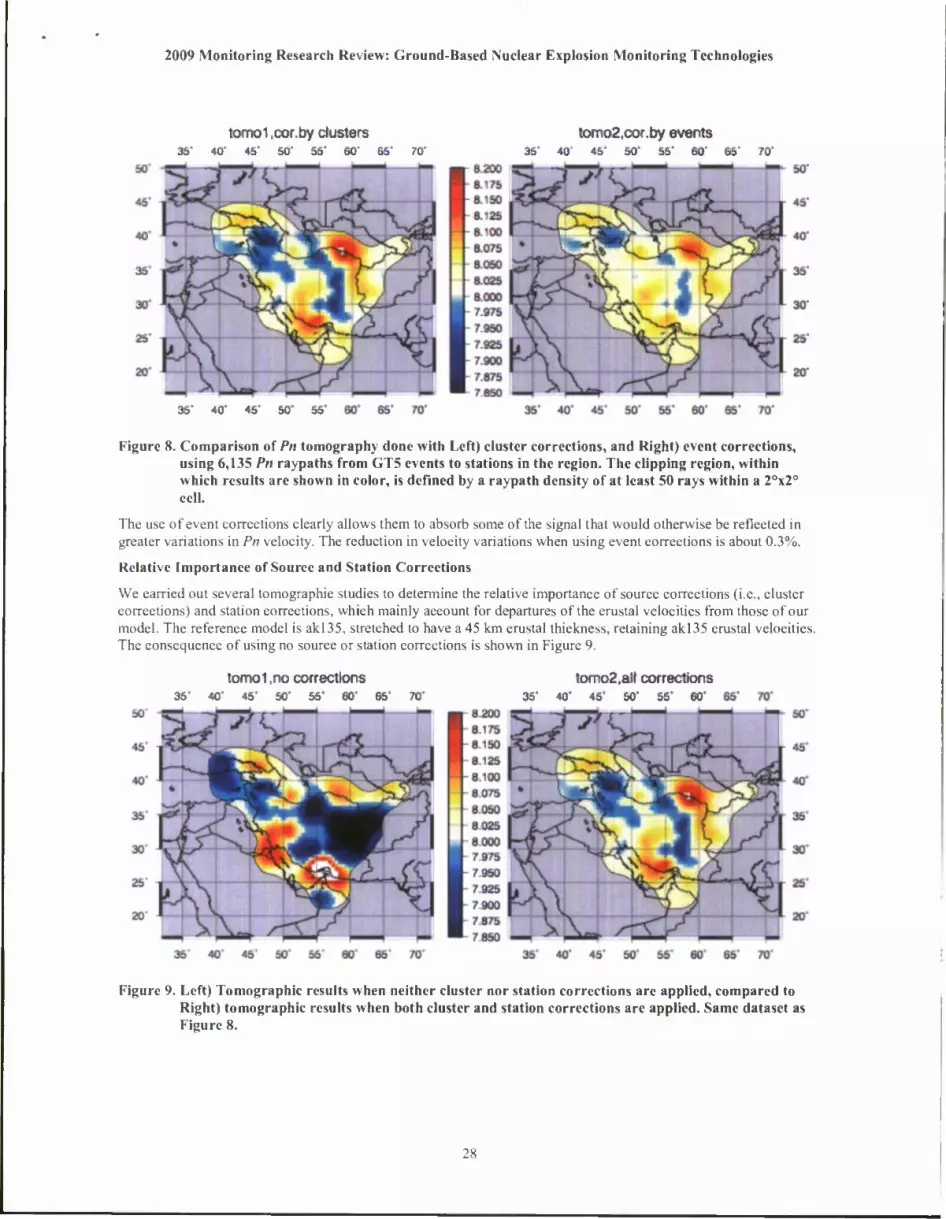
One such constraint comes from numerous studies (e.g., Doloei and Roberts, 2003; Sodoudi et al., 2004; Mokhtari et al. 2004; Kaviani et al., 2007) that indicate Moho depth in the study region ranges over 40-55 km. Therefore it is likely that the residuals of the akl35 model (which has a 35-km thick crust) against the GT dataset are partly the result of a too-thin crust. A model in which the two crustal layers of akl35 are stretched proportionally to a total thickness of 45 km improves the fit to observed Pn travel times, but there is still a systematic positive residual. We next decreased the crustal velocities by 10%, which gives a good average fit to the observed Pn data (Figure 7)
25
20
15
10
5
25
20
15 •
10 "
5 u r
0 - J Hinn .n • . -10 -8 -6 -4 -2 0 2
Time, s 4 6 8 10 400 800 1200 1600
Distance, km 2000
Figure 7. Left) Histogram of residuals against out GT dataset of predicted travel times for Pn with a model based on the akl35 model with crustal layers stretched proportionally to a total thickness of 45 km and crustal velocities reduced by 10%. Right) Same residuals plotted as a function of epicentral distance, showing that there is no trend with distance that would indicate the need for a different average Pn velocity in the model.
The fact that there is no evidence of distance-dependent trend in the residuals in Figure 7 indicates that the akl35 Pn velocity (8.045 km/s) is a reasonable average for this source region. This baseline model is derived for one source region in the study region. We will repeat the exercise with other source regions, and with the entire GT dataset, in order to better understand the variability of such models across the study region and to derive a full-region baseline model for Pn tomography with larger datasets. It is not yet clear if we will be able to use a single crustal thickness across the entire region, or whether we will adopt a baseline model which incorporates some degree of variability in Moho depth. The issue of Moho depth variations as it relates to Pn tomography is further considered below.
Event Corrections vs. Cluster Corrections
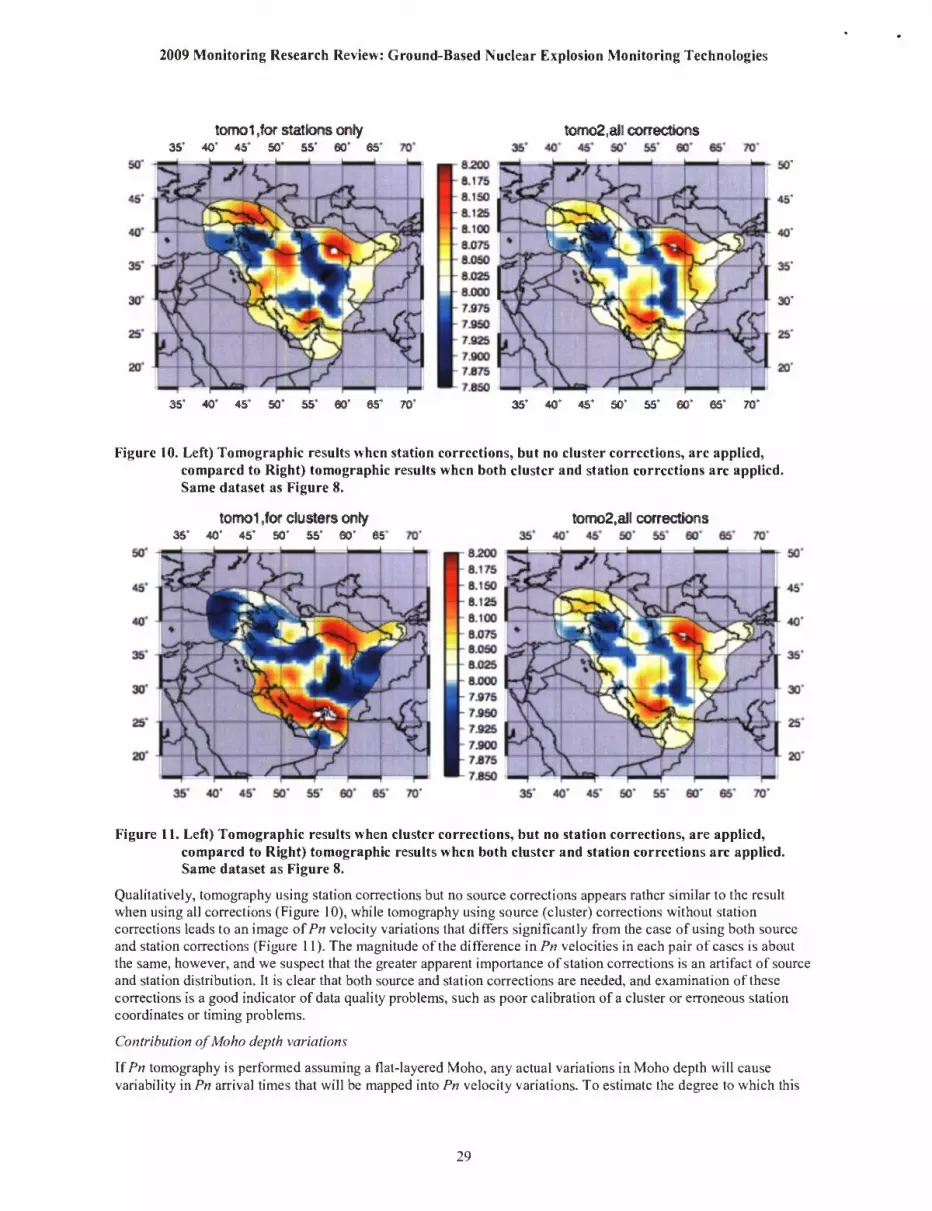
In standard Pn tomography studies, a source correction term is allowed for each earthquake source to absorb errors in assumed location, focal depth, and origin time, as well as near-source crustal velocity variations. This adds a large number of free parameters to the problem. In our case however, the multiple event relocation algorithm we use to develop clusters of calibrated earthquake locations provides very string constraints on the relative locations and origin times of the events in a given cluster. Therefore, we can reduce the number of free parameters dramatically by specifying a "cluster correction" which is common to all events in each cluster. The consequence of doing tomography with the two types of correction is shown in Figure 8.
27
2009 Monitoring Research Review: Ground-Based Nuclear Explosion Monitoring Technologies
tomol cor.by clusters 3S" 40' 45' SO" 5S' 60" 65' '0
tomo2,oof .by events 3S' 40' 45' 50' 55' 60' 65' 70'
40" 45' 50' 55
Figure 8. Comparison of Pn tomography done with Left) cluster corrections, and Right) event corrections, using 6,135 Pn raypaths from GT5 events to stations in the region. The clipping region, within which results are shown in color, is defined by a raypath density of at least 50 rays within a 2°x2° cell.
The use of event corrections clearly allows them to absorb some of the signal that would otherwise be reflected in greater variations in Pn velocity. The reduction in velocity variations when using event corrections is about 0.3%.
Relative Importance of Source and Station Corrections
We carried out several tomographic studies to determine the relative importance of source corrections (i.e., cluster corrections) and station corrections, which mainly account for departures of the crustal velocities from those of our model. The reference model is akl35, stretched to have a 45 km crustal thickness, retaining akl35 crustal velocities. The consequence of using no source or station corrections is shown in Figure 9.
Ji>
tomol no corrections 40" 45' 50' 55' 60' 65' A) J6
tomo2,all corrections 40' 45' 50' 55' 60'
Figure 9. Left) Tomographic results when neither cluster nor station corrections are applied, compared to Right) tomographic results when both cluster and station corrections are applied. Same dataset as Figure 8.
2S
2009 Monitoring Research Review: Ground-Based Nuclear Explosion Monitoring Technologies
tomol ,for stations only 35' 40" 45' 50" 55" GO" 65
tomo2.all corrections 40' 4S' SO' 55' 60' 65'
35' 40' 45' 50' 55' 60' 65' 70' 35' 40' 45' SO' 55' 60' 65* 70'
Figure 10. Left) Tomographic results when station corrections, but no cluster corrections, are applied, compared to Right) tomographic results when both cluster and station corrections are applied. Same dataset as Figure 8.
3b'
tomol .for clusters only 40" 45' SO' 55' 60' 65
tomo2,all corrections 40* 45* SO' 55' 60' 65'
Figure 11. Left) Tomographic results when cluster corrections, but no station corrections, are applied, compared to Right) tomographic results when both cluster and station corrections are applied. Same dataset as Figure 8.
Qualitatively, tomography using station corrections but no source corrections appears rather similar to the result when using all corrections (Figure 10), while tomography using source (cluster) corrections without station corrections leads to an image of Pn velocity variations that differs significantly from the case of using both source and station corrections (Figure 11). The magnitude of the difference in Pn velocities in each pair of cases is about the same, however, and we suspect that the greater apparent importance of station corrections is an artifact of source and station distribution. It is clear that both source and station corrections are needed, and examination of these corrections is a good indicator of data quality problems, such as poor calibration of a cluster or erroneous station coordinates or timing problems.
Contribution ofMoho depth variations
If Pn tomography is performed assuming a flat-layered Moho, any actual variations in Moho depth will cause variability in Pn arrival times that will be mapped into Pn velocity variations. To estimate the degree to which this
29
2009 Monitoring Research Review: Ground-Based Nuclear Explosion Monitoring Technologies
could occur in the study region we calculated travel times through a model with variable Moho depth based on observed topography, and compared their variability with that of the observed dataset of calibrated Pn travel times.
To generate a model of Moho depth variability we converted topography to Moho depth through the assumption of full isostatic compensation. With reasonable assumptions about density contrast, the surface topography (low pass filtered at a wavelength of 100 km) transforms into inverse Moho depth variations that are larger by a factor of 5.
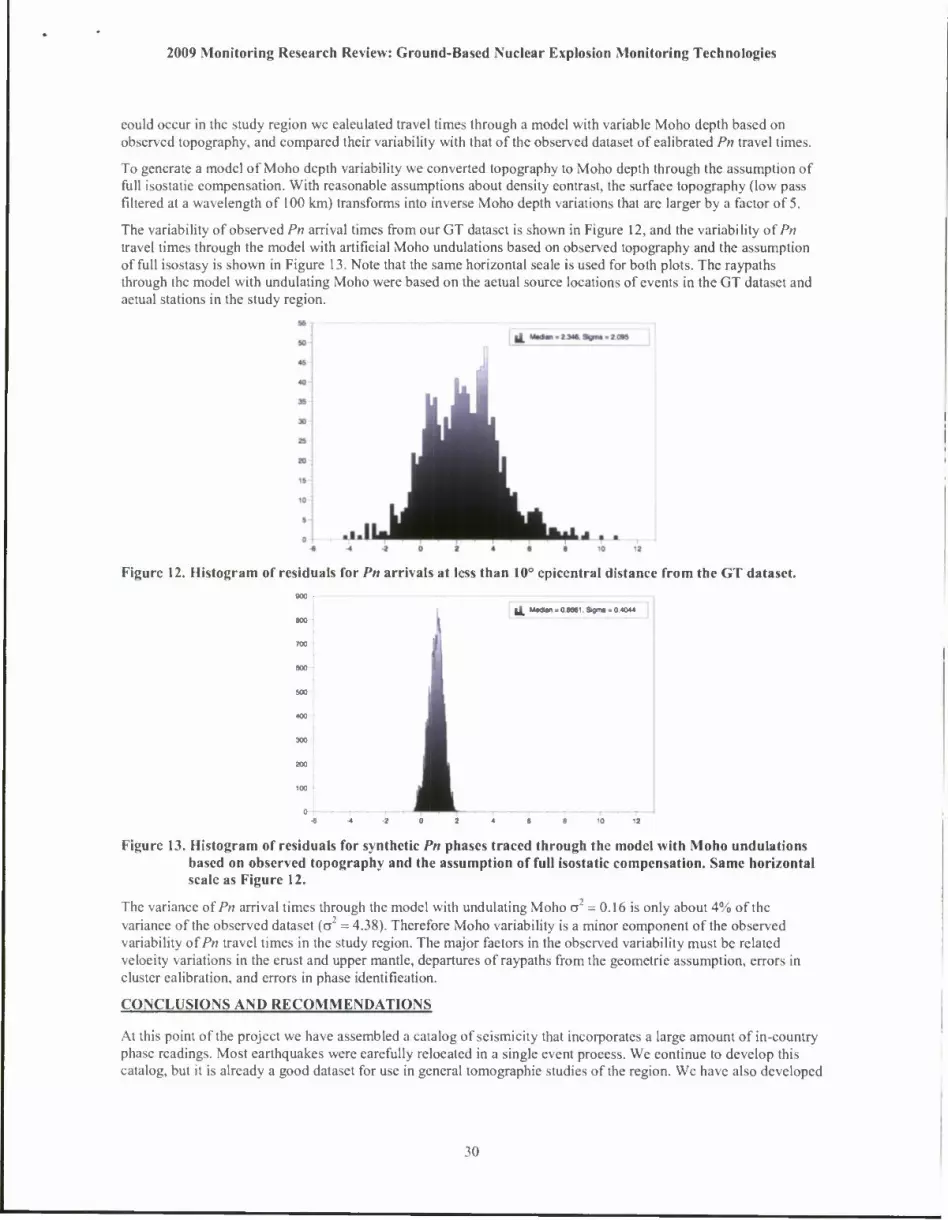
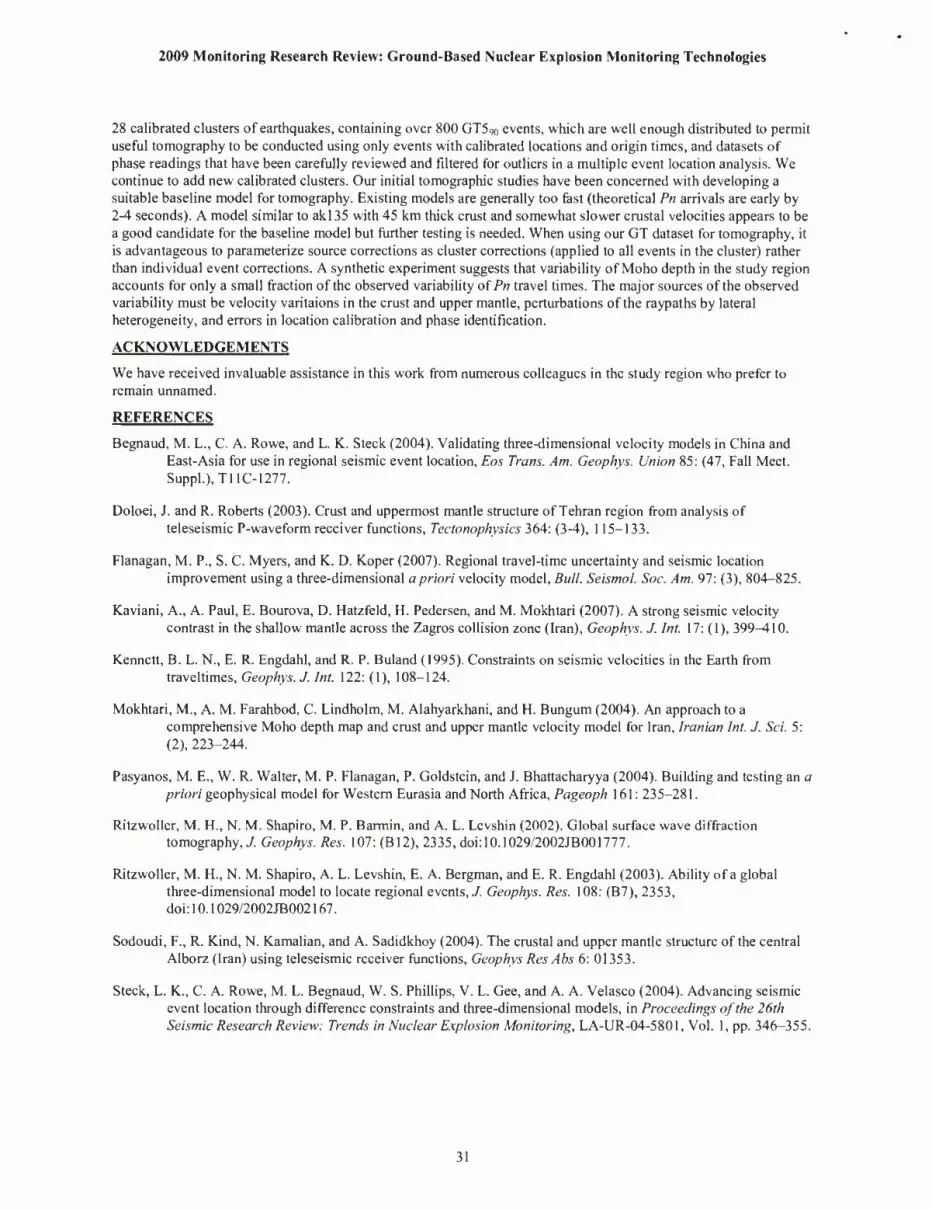
The variability of observed Pn arrival times from our GT dataset is shown in Figure 12, and the variability of Pn travel times through the model with artificial Moho undulations based on observed topography and the assumption of full isostasy is shown in Figure 13. Note that the same horizontal scale is used for both plots. The raypaths through the model with undulating Moho were based on the actual source locations of events in the GT dataset and actual stations in the study region.
Figure 12. Histogram of residuals for Pn arrivals at less than 10° epicentral distance from the GT dataset.
mo
600
W0
MO
100
||_ Uxttn.0M61.S4m>- 04O41
0 1 ' 1 ' 1 ' 1 4 -4 -2 0 : 4 a 6 10 12
Figure 13. Histogram of residuals for synthetic /'/; phases traced through the model with Moho undulations based on observed topography and the assumption of full isostatic compensation. Same horizontal scale as Figure 12.
The variance of Pn arrival times through the model with undulating Moho a" = 0.16 is only about 4% of the variance of the observed dataset (a = 4.38). Therefore Moho variability is a minor component of the observed variability of Pn travel times in the study region. The major factors in the observed variability must be related velocity variations in the crust and upper mantle, departures of raypaths from the geometric assumption, errors in cluster calibration, and errors in phase identification.
CONCLUSIONS AND RECOMMENDATIONS
At this point of the project we have assembled a catalog of seismicity that incorporates a large amount of in-country phase readings. Most earthquakes were carefully relocated in a single event process. We continue to develop this catalog, but it is already a good dataset for use in general tomographic studies of the region. We have also developed
30
2009 Monitoring Research Review: Ground-Based Nuclear Explosion Monitoring Technologies
28 calibrated clusters of earthquakes, containing over 800 GT5Q0 events, which are well enough distributed to permit useful tomography to be conducted using only events with calibrated locations and origin times, and datasets of phase readings that have been carefully reviewed and filtered for outliers in a multiple event location analysis. We continue to add new calibrated clusters. Our initial tomographic studies have been concerned with developing a suitable baseline model for tomography. Existing models are generally too fast (theoretical Pn arrivals are early by 2-4 seconds). A model similar to akl35 with 45 km thick crust and somewhat slower crustal velocities appears to be a good candidate for the baseline model but further testing is needed. When using our GT dataset for tomography, it is advantageous to parameterize source corrections as cluster corrections (applied to all events in the cluster) rather than individual event corrections. A synthetic experiment suggests that variability of Moho depth in the study region accounts for only a small fraction of the observed variability of Pn travel times. The major sources of the observed variability must be velocity varitaions in the crust and upper mantle, perturbations of the raypaths by lateral heterogeneity, and errors in location calibration and phase identification.
ACKNOWLEDGEMENTS
We have received invaluable assistance in this work from numerous colleagues in the study region who prefer to remain unnamed.
REFERENCES
Begnaud, M. L., C. A. Rowe, and L. K. Steck (2004). Validating three-dimensional velocity models in China and East-Asia for use in regional seismic event location, Eos Trans. Am. Geophys. Union 85: (47, Fall Meet. Suppl.),TllC-1277.
Doloei, J. and R. Roberts (2003). Crust and uppermost mantle structure of Tehran region from analysis of teleseismic P-waveform receiver functions, Tectonophysics 364: (3-4), 115-133.
Flanagan, M. P., S. C. Myers, and K. D. Koper (2007). Regional travel-time uncertainty and seismic location improvement using a three-dimensional a priori velocity model, Bull. Seismol. Soc. Am. 97: (3), 804-825.
Kaviani, A., A. Paul, E. Bourova, D. Hatzfeld, H. Pedersen, and M. Mokhtari (2007). A strong seismic velocity contrast in the shallow mantle across the Zagros collision zone (Iran), Geophys. J. Int. 17: (1), 399-410.
Kennett, B. L. N., E. R. Engdahl, and R. P. Buland (1995). Constraints on seismic velocities in the Earth from traveltimes, Geophys. J. Int. 122: (1), 108-124.
Mokhtari, M., A. M. Farahbod, C. Lindholm, M. Alahyarkhani, and H. Bungum (2004). An approach to a comprehensive Moho depth map and crust and upper mantle velocity model for Iran, Iranian Int. J. Sci. 5: (2), 223-244.
Pasyanos, M. E., W. R. Walter, M. P. Flanagan, P. Goldstein, and J. Bhattacharyya (2004). Building and testing an a priori geophysical model for Western Eurasia and North Africa, Pageoph 161: 235-281.
Ritzwoller, M. H., N. M. Shapiro, M. P. Barmin, and A. L. Levshin (2002). Global surface wave diffraction tomography,/ Geophys. Res. 107: (B12), 2335,doi:10.1029/2002JB001777.
Ritzwoller, M. H., N. M. Shapiro, A. L. Levshin, E. A. Bergman, and E. R. Engdahl (2003). Ability of a global three-dimensional model to locate regional events, J. Geophys. Res. 108: (B7), 2353, doi:10.1029/2002JB002167.
Sodoudi, F., R. Kind, N. Kamalian, and A. Sadidkhoy (2004). The crustal and upper mantle structure of the central Alborz (Iran) using teleseismic receiver functions, Geophys Res Abs 6: 01353.
Steck, L. K., C. A. Rowe, M. L. Begnaud, W. S. Phillips, V. L. Gee, and A. A. Velasco (2004). Advancing seismic event location through difference constraints and three-dimensional models, in Proceedings of the 26th Seismic Research Review: Trends in Nuclear Explosion Monitoring, LA-UR-04-5801, Vol. 1, pp. 346-355.
31
Copyright © 2022 FDOKUMEN

