


Bahasa
Halaman
Hukum


IJMSS Vol.03 Issue-10 (October, 2015) ISSN: 2321-1784 International Journal in Management and Social Science (Impact Factor- 4.358)
A Monthly Double-Blind Peer Reviewed Refereed Open Access International e-Journal - Included in the International Serial Directories
International Journal in Management and Social Science
http://www.ijmr.net.in email id- [email protected] Page 481
CONSUMERS PERCEPTION TOWARDS MTR FOOD PRODUCTS IN PALACE
CITY OF KARNATAKA
Dr. D. Seethanaik
Assistant Prof. Dept of MBA
University of Mysore, Mysore
Abstract
This paper examines the history of MTR and its products. The paper analyses
uniqueness or products, consumer behavior towards products. Focuses on consumer
opinion towards pricing of products. The paper evaluates the distribution effectiveness of
products. And also this paper offers suggestions for future development.
Keywords: MTR, Uniqueness of Products, Consumer Behaviour, Distribution
Effectiveness.
INTRODUCTION
MTR Foods Ltd. is one of the India‘s leading of packaged foods. Its products
include a variety of vegetarian snack foods and chips, ready to eat meals, and partially
pre-cooked meals, emphasizing the cuisine of southern India. Other products include
pickles, vermicelli, and over 30 varieties of ice creams and ice cream cones. The
company is one of only a few that sells packaged food nationwide. MTR Foods also
exports canned foods to the United States in an arrangement with the grocery chain
Kroger and sells spices in the United Kingdom through the British company Centura
Foods. In 2002, MTR Foods began opening franchised fast-food restaurants across India
that served its vegetarian specialties. These are called MTR Super Shops. the company is
the first Indian processed food company to pass strict global food safety and hygiene
standards, preparing the way for MTR‘s penetration into a broader export market in the
2000s.
MTR Foods Limited is amongst the top five processed food manufacturers in
India. They manufacture, market and export a wide range of packaged foods to global
markets that include USA, UK, Australia, New Zealand, Malaysia, Singapore, UAE and
Omen.
MTR‘s wide range processed foods is synonymous with quality, taste and convenience.

IJMSS Vol.03 Issue-10 (October, 2015) ISSN: 2321-1784 International Journal in Management and Social Science (Impact Factor- 4.358)
A Monthly Double-Blind Peer Reviewed Refereed Open Access International e-Journal - Included in the International Serial Directories
International Journal in Management and Social Science
http://www.ijmr.net.in email id- [email protected] Page 482
That is why a growing family of consumers across the globe has made MTR a part of
their daily lives.
METHODOLOGY:
Research methodology is an organized and systematic way of finding answers to
questions. This is a descriptive research project entitled as Consumers Perception towards
MTR Food Products in Palace City of Karnataka.
PERCEPTION TOWARDS MTR FOOD products. It is a descriptive research
project because the study is a fact finding investigation with adequate interpretation. It
focuses on one dimension of the problem studied i.e. consumer perception towards MTR
products.
This research is a descriptive and analytical study where survey is used to collect
data. The data is collected using a structured questionnaire. Random sampling technique
was used to select the sample for customer. The sample size is 50 customers.
Sources of data: the data has been collected from both primary and secondary sources.
a. Primary Sources: Primary data is the data gathered at first hand. It is
collected by survey, observation, and questionnaire and discussing with the
respondents.
b. Secondary Sources: Secondary data are collected from Journals, magazine,
Websites and Text books of marketing management.
Statistical Tools: Used statistical tools like, graphs, tables, charts.
Research Sample Design:
The type of research conducted was descriptive. The method of data collection is
through a survey of consumer with the help of a structured questionnaire. Locations
selected for the research were residential areas like, kuvempunagar and Jailakshmipuram
of Mysore city. The customers of MTR products were selected as the respondents for the
study and sample size is 50 customers.
Sampling
Sample technique used in this study was simple random sampling.

IJMSS Vol.03 Issue-10 (October, 2015) ISSN: 2321-1784 International Journal in Management and Social Science (Impact Factor- 4.358)
A Monthly Double-Blind Peer Reviewed Refereed Open Access International e-Journal - Included in the International Serial Directories
International Journal in Management and Social Science
http://www.ijmr.net.in email id- [email protected] Page 483
LIMITATIONS OF THE STUDY:
The research investigation is confined to 50 respondents in Mysore
City. Limited sample size due to time and resource constraints.
The study focuses only on MTR food products.
OBJECTIVE OF THE STUDY:
1. To describe the history of MTR and its products.
2. To analyze the uniqueness of MTR products.
3. To focus on the consumer behavior towards MTR products.
4. To evaluate the consumer opinion towards pricing of MTR products.
5. To evaluate the distribution effectiveness of MTR products.
6. To offer suggestions for future development.
MTR- A PROFILE:
Heritage of MTR:
MTR has a rich heritage. Their tradition of food and hospitality began in 1924
with the establishment of the Mavalli Tiffin Room by the Maiya family in Bangalore,
India. This restaurant is a city land mark today and people is a city land mark today and
people still stand in queue to savor its unique completely authentic dishes. Over the year,
they played proud host money distinguished personalities who dropped by the excellent
copy and the stimulating conversation culinary secrets have been protected and handed
down over the generations and the food is based on truly authentic recipes from their
region of origin. MTR‘s journey to India‘s premier, processed food company has been
marked by innovation and the adoption of new technology. However, every MTR product
will always embody the tradition of unmatched taste, purity and quality.
MTR Foods Limited is amongst the top five processed food manufacturers in
India. They manufacture, market and export a wide range of packaged foods to global
markets that include USA, UK, Australia, New Zealand, Malaysia, Singapore, UAE and
Oman.

IJMSS Vol.03 Issue-10 (October, 2015) ISSN: 2321-1784 International Journal in Management and Social Science (Impact Factor- 4.358)
A Monthly Double-Blind Peer Reviewed Refereed Open Access International e-Journal - Included in the International Serial Directories
International Journal in Management and Social Science
http://www.ijmr.net.in email id- [email protected] Page 484
Starting with the legendary MTR restaurant in Bangalore, India‘s Silicon Valley, MTR
now offer ''complete meal solutions. Their wide range of products include ready-to-eat
curries and rice, ready-to-cook gravies, frozen foods, ice cream, instant snack and dessert
mixes, spices and a variety of accompaniments like pickles and papads.
MTR‘s deep understanding of culinary expectations and needs has resulted in
many new and innovative products. Their investment in infrastructure and technology
ensures that they scale rapidly and bring these to market. Today, consumers across the
globe count on MTR to bring them all-natural, wholesome and delicious food that is also
convenient and no-fuss.

IJMSS Vol.03 Issue-10 (October, 2015) ISSN: 2321-1784 International Journal in Management and Social Science (Impact Factor- 4.358)
A Monthly Double-Blind Peer Reviewed Refereed Open Access International e-Journal - Included in the International Serial
Directories
International Journal in Management and Social Science
http://www.ijmr.net.in email id- [email protected] Page 485
Milestone:
IJMSS Vol.03 Issue-10 (October, 2015) ISSN: 2321-1784 International Journal in Management and Social Science (Impact Factor- 4.358)
A Monthly Double-Blind Peer Reviewed Refereed Open Access International e-Journal - Included in the International Serial
Directories
International Journal in Management and Social Science
http://www.ijmr.net.in email id- [email protected] Page 486
DATA ANALYSIS AND INTERPRETATION:
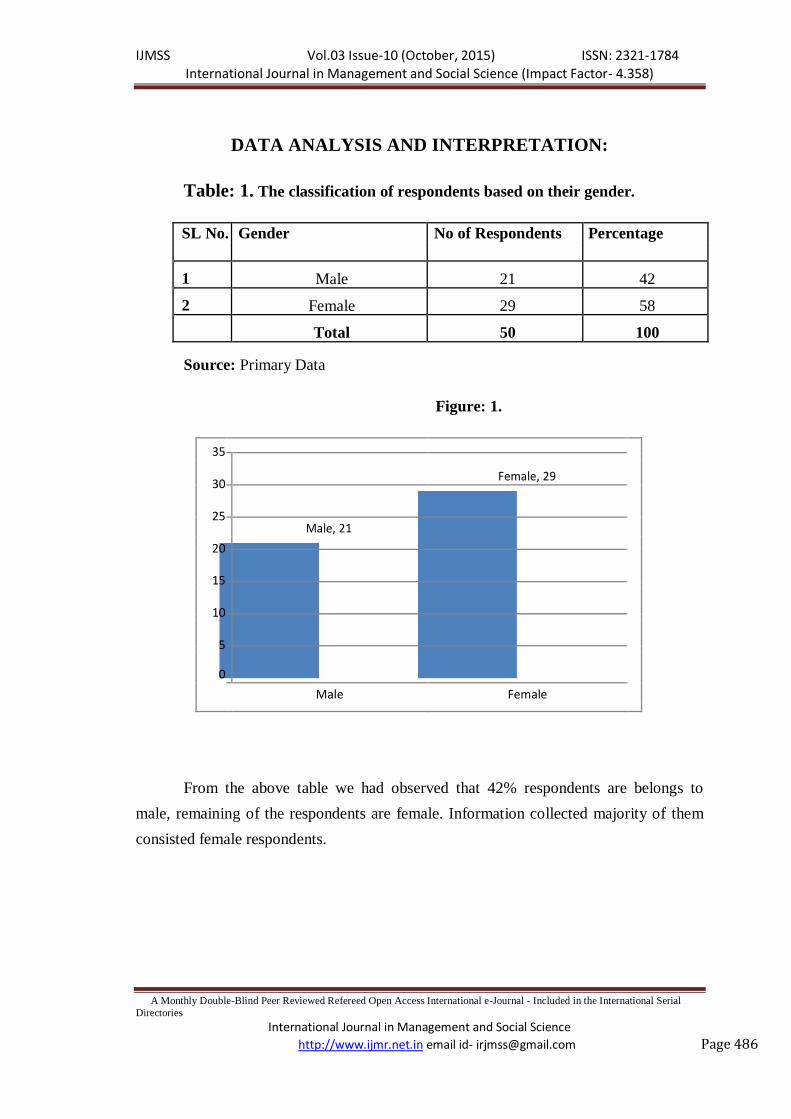
Table: 1. The classification of respondents based on their gender.
SL No. Gender No of Respondents Percentage
1 Male 21 42
2 Female 29 58
Total 50 100
Source: Primary Data
Figure: 1.
35
Female, 29
30
25
Male, 21
20
15
10
5
0
Male Female
From the above table we had observed that 42% respondents are belongs to
male, remaining of the respondents are female. Information collected majority of them
consisted female respondents.

IJMSS Vol.03 Issue-10 (October, 2015) ISSN: 2321-1784 International Journal in Management and Social Science (Impact Factor- 4.358)
A Monthly Double-Blind Peer Reviewed Refereed Open Access International e-Journal - Included in the International Serial
Directories
International Journal in Management and Social Science
http://www.ijmr.net.in email id- [email protected] Page 487
Table: 2. The classification of respondents based on their qualification.
SL No. Education No. of respondents Percentage
1 Less than SSLC 13 26
2 Above SSLC 9 18
3 Graduation 21 42
4 Post Graduation 7 14
Total 50 100
Source: Primary Data
Figure: 2.
45
Graduation, 42
40
35
Less than SSLC,
30
26
25
Above SSLC, 18
20 Post
15 Graduation, 14
10
5
0
Less than SSLC Above SSLC Graduation Post Graduation
From the above table we can observe that 42% of respondent‘s
qualifications is Graduation, 26% of respondents qualification less than SSLC, 18% of
respondents qualification more than SSLC and remaining 14% of respondents
qualification is Post Graduation.
IJMSS Vol.03 Issue-10 (October, 2015) ISSN: 2321-1784 International Journal in Management and Social Science (Impact Factor- 4.358)
A Monthly Double-Blind Peer Reviewed Refereed Open Access International e-Journal - Included in the International Serial
Directories
International Journal in Management and Social Science
http://www.ijmr.net.in email id- [email protected] Page 488
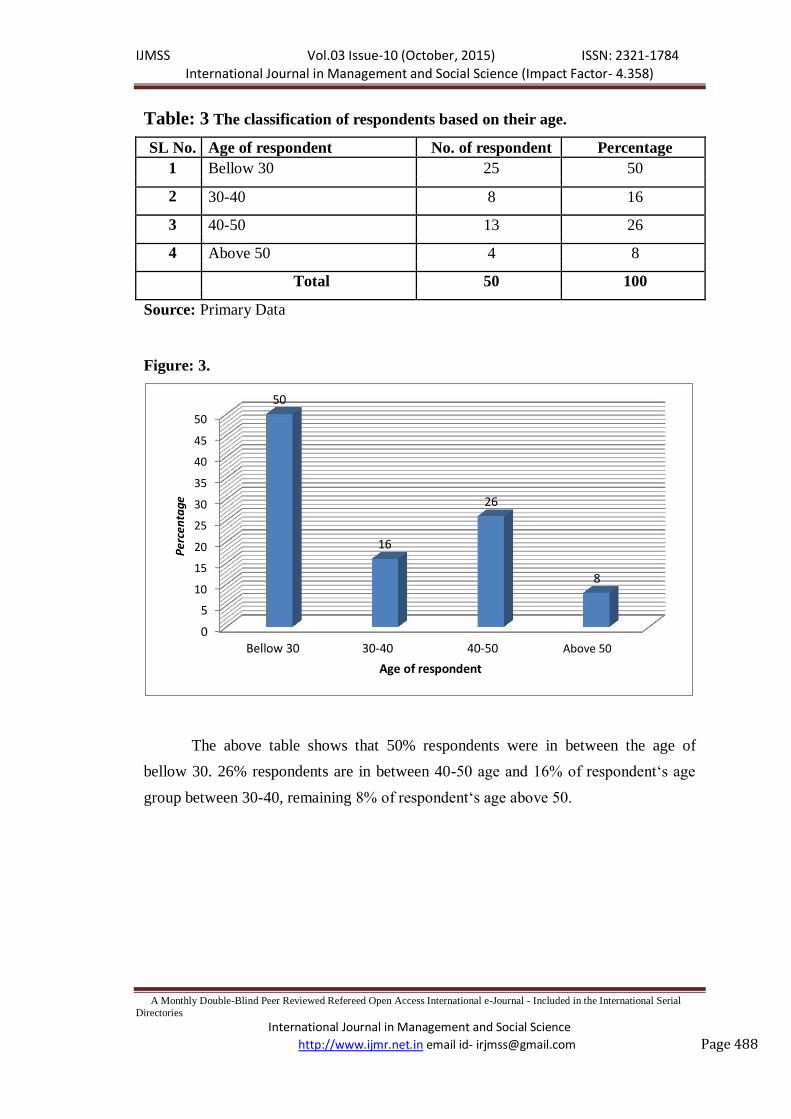
Table: 3 The classification of respondents based on their age.
SL No. Age of respondent No. of respondent Percentage
1 Bellow 30 25 50
2 30-40 8 16
3 40-50 13 26
4 Above 50 4 8
Total 50 100
Source: Primary Data
Figure: 3.
Percentage
50 45 40 35 30 25 20 15 10
5
0
50
26
16
8
Bellow 30 30-40 40-50 Above 50
Age of respondent
The above table shows that 50% respondents were in between the age of
bellow 30. 26% respondents are in between 40-50 age and 16% of respondent‘s age
group between 30-40, remaining 8% of respondent‘s age above 50.
IJMSS Vol.03 Issue-10 (October, 2015) ISSN: 2321-1784 International Journal in Management and Social Science (Impact Factor- 4.358)
A Monthly Double-Blind Peer Reviewed Refereed Open Access International e-Journal - Included in the International Serial
Directories
International Journal in Management and Social Science
http://www.ijmr.net.in email id- [email protected] Page 489
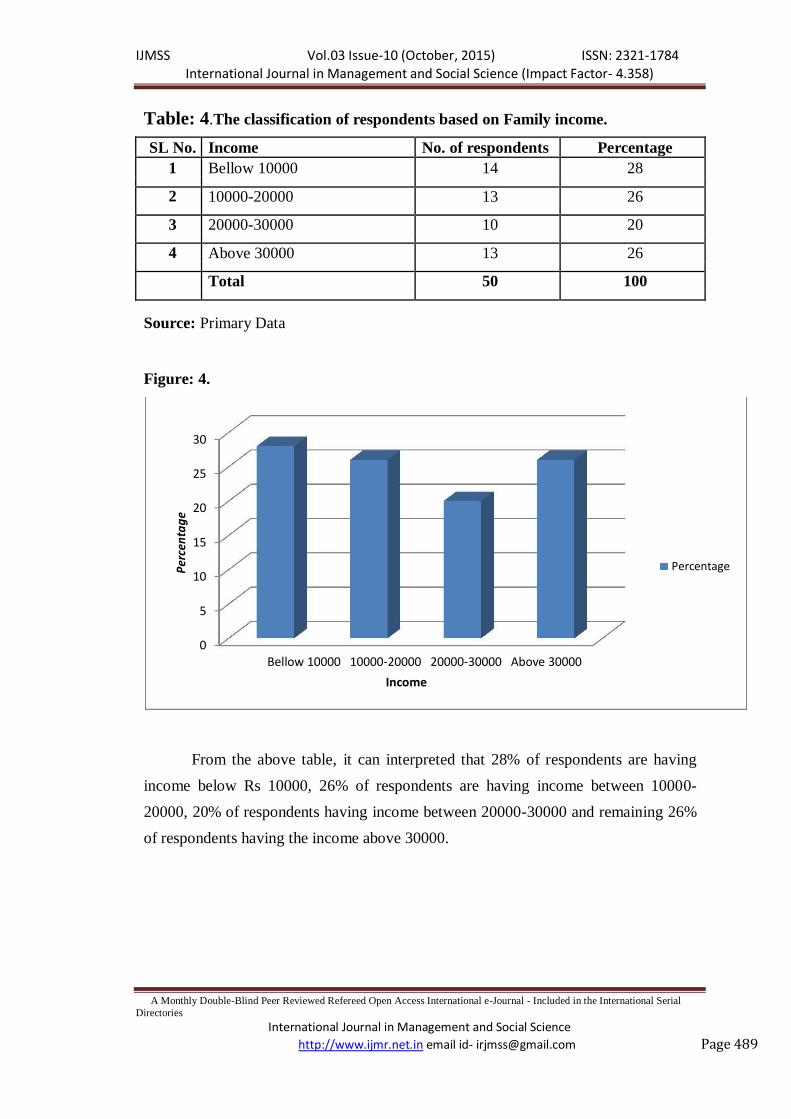
Table: 4.The classification of respondents based on Family income.
SL No. Income No. of respondents Percentage
1 Bellow 10000 14 28
2 10000-20000 13 26
3 20000-30000 10 20
4 Above 30000 13 26
Total 50 100
Source: Primary Data
Figure: 4.
30
25
Percentage 20
15
10
5
0
Bellow 10000 10000-20000 20000-30000 Above 30000
Income
Percentage
From the above table, it can interpreted that 28% of respondents are having
income below Rs 10000, 26% of respondents are having income between 10000-
20000, 20% of respondents having income between 20000-30000 and remaining 26%
of respondents having the income above 30000.

IJMSS Vol.03 Issue-10 (October, 2015) ISSN: 2321-1784 International Journal in Management and Social Science (Impact Factor- 4.358)
A Monthly Double-Blind Peer Reviewed Refereed Open Access International e-Journal - Included in the International Serial
Directories
International Journal in Management and Social Science
http://www.ijmr.net.in email id- [email protected] Page 490
Table: 5.The classification of respondents based on their occupation.
SL No. Occupation No. of respondent Percentage
1 Employee 18 36
2 House wife 10 20
3 Business 14 28
4 Farmer 8 16
Total 50 100
Source: Primary Data
Figure: 5.
Percentage
40
36 35
30 28
25
20 20
16 15
10
5
0
Employee House wife Business farmer
In the above table indicates 36% of respondents are Employee, 28% of them are
business men, 20% of them are house wife and remaining 16% of respondents are
farmers.

IJMSS Vol.03 Issue-10 (October, 2015) ISSN: 2321-1784 International Journal in Management and Social Science (Impact Factor- 4.358)
A Monthly Double-Blind Peer Reviewed Refereed Open Access International e-Journal - Included in the International
Serial Directories
International Journal in Management and Social Science
http://www.ijmr.net.in email id- [email protected] Page 491
Table: 6.What product do you like in MTR ?
SL No. Particular No. of respondent Percentage
1 Ready to eat 15 30
2 Instants mix 15 30
3 Spices powder 20 40
4 MTR soups 00 00
Total 50 100
Source: Primary Data
Figure: 6.
45
40
40
35
30 30
percentage
30
25
20
15
10
5
0
0
Ready to eat Instants mix Spices powder MTR soups
particular
The above table shows that 40% of the respondents are using spices
powder and 30% of respondents are uses ready to eat and remaining 30%
of respondents uses instants mix, by this chart, MTR soups users are nil
this shows that the company should concentrate on this product in getting
awareness in Mysore city.
IJMSS Vol.03 Issue-10 (October, 2015) ISSN: 2321-1784 International Journal in Management and Social Science (Impact Factor- 4.358)
A Monthly Double-Blind Peer Reviewed Refereed Open Access International e-Journal - Included in the International
Serial Directories
International Journal in Management and Social Science
http://www.ijmr.net.in email id- [email protected] Page 492
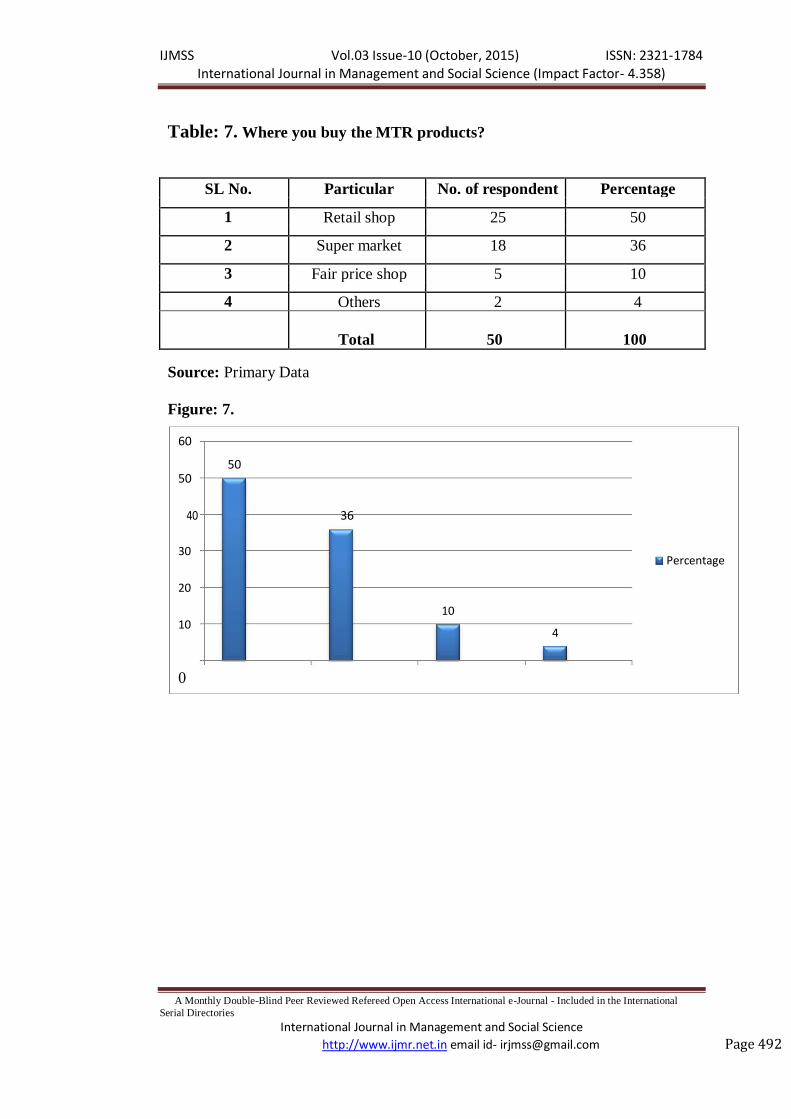
Table: 7. Where you buy the MTR products?
SL No. Particular No. of respondent Percentage
1 Retail shop 25 50
2 Super market 18 36
3 Fair price shop 5 10
4 Others 2 4
Total 50 100 Source: Primary Data
Figure: 7.
60
50 50
40 36
30
20
Percentage
10
10 0
4
IJMSS Vol.03 Issue-10 (October, 2015) ISSN: 2321-1784 International Journal in Management and Social Science (Impact Factor- 4.358)
A Monthly Double-Blind Peer Reviewed Refereed Open Access International e-Journal - Included in the International
Serial Directories
International Journal in Management and Social Science
http://www.ijmr.net.in email id- [email protected] Page 493
The above table interpret that 50% of respondents are buying the MTR
products in retail shop, 36% respondents buying the MTR products in super markets,
10% of respondents are buying from fair price shop and remaining 4% of respondent
buying from other.
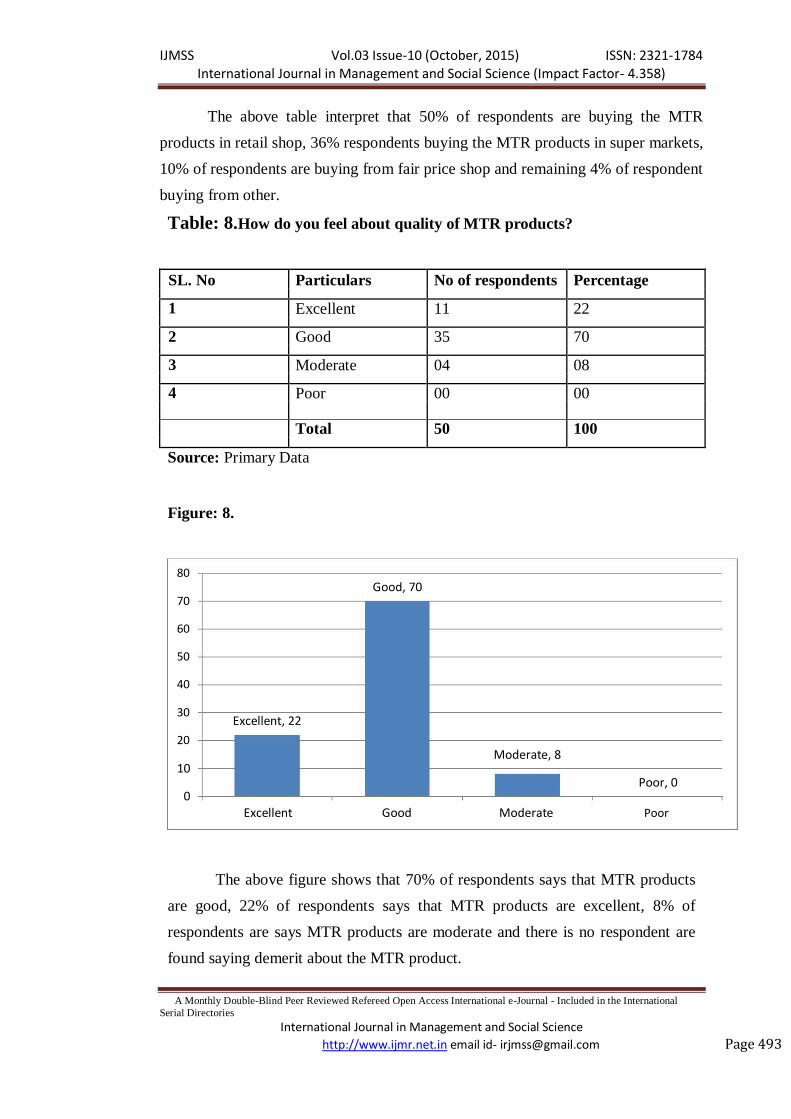
Table: 8.How do you feel about quality of MTR products?
SL. No Particulars No of respondents Percentage
1 Excellent 11 22
2 Good 35 70
3 Moderate 04 08
4 Poor 00 00 Total 50 100
Source: Primary Data
Figure: 8. 80 70 60 50 40 30 20
Good, 70
Excellent, 22
Moderate, 8 10
Poor, 0 0
Excellent Good Moderate Poor
The above figure shows that 70% of respondents says that MTR products
are good, 22% of respondents says that MTR products are excellent, 8% of
respondents are says MTR products are moderate and there is no respondent are
found saying demerit about the MTR product.

IJMSS Vol.03 Issue-10 (October, 2015) ISSN: 2321-1784 International Journal in Management and Social Science (Impact Factor- 4.358)
A Monthly Double-Blind Peer Reviewed Refereed Open Access International e-Journal - Included in the International
Serial Directories
International Journal in Management and Social Science
http://www.ijmr.net.in email id- [email protected] Page 494
Table: 9.How do you feel about Pricing of MTR products?
SL NO Particulars No. of Percentage
Respondents
1 Expensive 9 18
2 Moderate 17 34
3 Affordable 24 48
4 Low cost 0 0 Total 50 100
Source: Primary Data
Figure: 9.
percentage
60 50 40 30
48
percentage
20
34
10 18
0 0
Expensive Moderate Affordable Low cost Particular
The above table indicates that 48% of the respondents says that about the
price of MTR products are affordable, 34 % of respondent are says that the
product price are moderate and 18% of respondents says that the product price are
expensive and there is no respondent says the MTR product price low cost.

IJMSS Vol.03 Issue-10 (October, 2015) ISSN: 2321-1784 International Journal in Management and Social Science (Impact Factor- 4.358)
A Monthly Double-Blind Peer Reviewed Refereed Open Access International e-Journal - Included in the International
Serial Directories
International Journal in Management and Social Science
http://www.ijmr.net.in email id- [email protected] Page 495
Table: 10. How often do you buy MTR Products?
SLNO Particulars No of respondent Percentage
1 Daily 3 06
2 Weekly 35 70
3 Monthly 12 24
4 Yearly 0 00
Total 50 100 Source: Primary Data
Figure: 10.
80
Weekly, 70 70
60
50
40
30
Monthly, 24
20
10 Daily , 6
Yearly, 0 0
Daily Weekly Monthly Yearly
It is clear from the above chart that 70% of the respondents are buying
weekly, 24% of respondents buying monthly and 6% of respondents buying
daily and there are no respondents who buy the MTR product yearly.

IJMSS Vol.03 Issue-10 (October, 2015) ISSN: 2321-1784 International Journal in Management and Social Science (Impact Factor- 4.358)
A Monthly Double-Blind Peer Reviewed Refereed Open Access International e-Journal - Included in the International
Serial Directories
International Journal in Management and Social Science
http://www.ijmr.net.in email id- [email protected] Page 481
FINDINGS
The study shows that the package food market has grown in India and so
the consumption rate, but still it is facing problems to capture the Indian
consumers. Some of the findings, encountered during working on this research,
are:
Indian consumers still prefer freshly cooked home food over instant food
products due to the usage of preservatives and other chemicals in the
instant food. Rumors that instant food is toxic in nature have stopped
many consumers to consume the product.
Doubts still exist on the nutrient and hygiene of these instant food
products as news of bad conditions of the factory outlets is constantly
seen.
Instant food is not used on a regular basis and is only used for certain
occasions or in times of emergency when time is a constrain.
Advantage that MTR has when compared to other competitors brands is
that the consumers feel the products tastes like home food.
Extensive advertisement or sales promotion activities is not required in
case of MTR as it is a home brand and consumer are well aware of it.
MTR products are widely available, from super markets to small next to
door Kirana shops. The distribution network is widely spread and strong.
MTR has always brought innovation into their products and thus it has the
appeal with their customers and also has built brand loyalty.
The stocks are supplied on weekly basis and the supply is regular thus
making the availability continues.

IJMSS Vol.03 Issue-10 (October, 2015) ISSN: 2321-1784 International Journal in Management and Social Science (Impact Factor- 4.358)
A Monthly Double-Blind Peer Reviewed Refereed Open Access International e-Journal - Included in the International
Serial Directories
International Journal in Management and Social Science
http://www.ijmr.net.in email id- [email protected] Page 482
RECOMMENDATIONS AND SUGGESTIONS:
MTR should create awareness that instant food can be used regularly and it
does not have any harmful effects.
MTR should also increase their promotional activities as in Bangalore
consumer area ware of the brand, but consumers in north region and other
parts of India are not that aware of the brand.
The packaging can be more attractive and appealing. The packaging should
be made keeping in mind the convenience of the consumers.
Sales representatives‘ should be sent on a regular basis to retail outlets where
to adhere to any complaints or suggestion given by consumers.
The taste of the instant food products can be improved in case of North
Indian dishes and Soups.
New items can be introduced in the instant food, but MTR should stick to
Indian food only because consumer perception towards MTR food products
will not welcome western dishes in a positive way.
CONCLUSION:
Consumer Perception towards MTR products is very good it has created a
good brand image for itself for providing good quality, packaging and taste. Now
a day‘s most of the company considering sales promotion as an important part of
their marketing strategy. From the analysis of the survey it becomes too clear that
consumers do response to the sales promotion campaign, but there are customers
who strongly prefers to stick to brand name.

IJMSS Vol.03 Issue-10 (October, 2015) ISSN: 2321-1784 International Journal in Management and Social Science (Impact Factor- 4.358)
A Monthly Double-Blind Peer Reviewed Refereed Open Access International e-Journal - Included in the International
Serial Directories
International Journal in Management and Social Science
http://www.ijmr.net.in email id- [email protected] Page 483
In today‘s competitive business environment is only due to the positive
perception of the consumer that the company is being able to compete in the
market with its other competitors. From this survey we could know that more than
95% of the peoples are using MTR products especially they use spices powder of
MTR, it shows that the company should concentrate on other products of MTR.
It is finally conclude from the study that MTR Products Company is the
top food processing company in India attracts more customers. The products of
MTR have increased its sales by its best promotional activities.
The customers like much of spices powder because it is very familiar for
the women‘s, the company needs to provide same more attractive offers to
maintain and increase its sales so it is finally conclude that the products of MTR
are acquiring the global market. The marketing performance of MTR products are
relatively more as per the result of the study.

IJMSS Vol.03 Issue-10 (October, 2015) ISSN: 2321-1784 International Journal in Management and Social Science (Impact Factor- 4.358)
A Monthly Double-Blind Peer Reviewed Refereed Open Access International e-Journal - Included in the International Serial
Directories
International Journal in Management and Social Science
http://www.ijmr.net.in email id- [email protected] Page 484
BIBLIOGRAPHY:
Journal of Services Marketing, ICFAI Publications
Marketing Mastermind, ICFAI Publications
Journal of Marketing, ICFAI Publications
Business Standard (Strategist)
Business Line (Catalyst)
Economic Times (Brand Equity)
Financial Express (Brand Wagon)
Harvard Business Review
Economist
The Hindu
The Financial Express
Consumer Behavior by Tyagi Cl, Arun Kumar
Consumer Behavior, 9th Edition by Leon G. Schiffman, Leslie Lazar Kanuk. Published by Prentice hall of India.
Consumer Behavior by Matin Khan
Consumer perception, 3rd
edition by Schiffman, Bednall, O'Cass, Paladino
Top Related
Copyright © 2022 FDOKUMEN

