


Bahasa
Halaman
Hukum


Confocal Raman Microscopy; Applications in Tissue
Engineering
DISSERTATION
to obtain the doctor’s degree at the University of Twente, on the authorithy of the rector magnificus,
prof. dr. W.H.M. Zijm, on the account of the decision of the graduation committee,
to be publicly defended on Friday November 4th 2005 at 13:15
by Aart Alexander van Apeldoorn
born on February 27th, 1968 in Utrecht, the Netherlands

2
Promotor: Prof.Dr. Clemens Antoni van Blitterswijk Faculty of Technological Sciences
Department of Polymer Chemistry and Biomaterials University of Twente
The Netherlands
Copromotor:Dr. C. Otto Faculty of Technological Sciences
Department of Biophysical Engineering University of Twente
The Netherlands
Committee members: Prof. Dr. Ir. A. Bliek, University of Twente, the Netherlands Prof. Dr. V. Subramaniam, University of Twente, the Netherlands Prof. Dr. J. Greve, University of Twente, the Netherlands Prof. Dr. J.D. de Bruijn, Queen Mary University of London, United Kingdom Prof. Dr. G.F.J.M. Vrensen, University of Leiden, the Netherlands Dr. H.K. Koerten, University of Leiden, the Netherlands

3
This dissertation describes the results of the second part of a research project funded by the Dutch Technology foundation (STW) project nr; 4554. The project was a collaboration between the department of polymer chemistry and biomaterials and the department of biophysical techniques of the faculty of technological sciences at the University of Twente, Bilthoven and Enschede, The Netherlands. The author wishes to thank the following sponsors for the funding of this thesis: Roper scientific BV, the Netherlands IsoTis Orthobiologics, USA Harlan Nederland BV, the Netherlands Sanyo biomedical Europe BV, the Netherlands Stichting Anna fonds Email: [email protected]

Contents
4
Contents
Introduction 8
Characterization of PEOT PBT block polymers by confocal Raman spectroscopy 41
In vivo degradation of PEOT PBT block copolymers evaluated by confocal Raman microscopy 62
A preliminary study on the application of confocal Micro Raman Spectroscopy for the analysis of in vivo PEOT PBT Degradation. 87
Raman Imaging of PLGA Microsphere Degradation inside Macrophages 95
Combined confocal Raman spectroscopic and SEM study of protein incorporation into biomimetic coatings 106
Parallel high resolution Confocal Raman SEM analysis of inorganic and organic bone matrix constituents 125
The physicochemical composition of osteoporotic bone in the TTD premature aging mouse determined by confocal Raman microscopy 141
Color figures belonging to the different chapters can be found at the end of this dissertation after page 180.

Contents
5
Almost all objects in the universe emit, reflect and/or transmit some form of light. The distribution of this light along the electromagnetic spectrum (called the spectrum of the object) is determined by the object's composition. Several types of spectra can be distinguished depending upon the nature of the radiation coming from an object:
If the spectrum is composed primarily of thermal radiation emitted by the object itself, an emission spectrum occurs.
Some bodies emit light more or less according to the blackbody spectrum.
If the spectrum is composed of background light, parts of which the object transmits and parts of which it absorbs, an absorption spectrum occurs.
Spectroscopy is the branch of physics that deals with the characterization of matter by its spectra.
There are three main categories of spectroscopy
Absorption spectroscopy uses the range of electromagnetic spectra in which a substance absorbs. for example in atomic absorption spectroscopy, the sample is atomized and then light of a particular frequency is passed through the vapour. After calibration, the amount of absorption can be related to the concentrations of various metal ions through the Beer-Lambert law. The method can be automated and can be used to measure concentrations of ions such as sodium and calcium in blood for example. Other types of spectroscopy may not require sample atomization. For example, ultraviolet/visible (UV/ Vis) absorption spectroscopy is most often performed on liquid samples to detect molecular content and infrared (IR) spectroscopy is most often performed on liquid, semi-liquid (paste or grease), dried, or solid samples to determine molecular information, including structural information.
Emission spectroscopy uses the range of electromagnetic spectra in which a substance radiates. The substance first absorbs energy and then radiates this energy as light. This energy can be from a variety of sources, including collision (either due to high temperatures or otherwise), chemical reactions, and light.
Scattering spectroscopy measures certain physical properties by measuring the amount of light that a substance scatters at certain wavelengths, incident angles, and polarization angles. Scattering spectroscopy differs from emission spectroscopy due to the fact that the scattering process is much faster than the absorption/emission process. One of the most useful applications of light scattering spectroscopy is Raman spectroscopy.
In biophysics one makes use of techniques derived from physics to study biology.

Introduction
6
Introduction
Introduction
7
The logical next step in electron microscopy is the combination of Confocal Raman Microscopy with Scanning Electron Microscopy. The above figure shows the integrated system described in this dissertation used for the analysis of biomaterial and tissue engineered samples. The confocal Raman microscope setup (the black apparatus on the right hand side) is in situation connected to a FEI XL30 FEG environmental scanning electron microscope.

A brief history of Microscopy
8
Introduction
A brief history of Microscopy
In the year 2004 AD a Dutch television broadcasting station organized an election
on who would be the greatest Dutchman in history. The Dutch could vote for
politicians, scientists, painters, writers, sportsmen, etc., basically anybody who
meant anything in the history of the Netherlands. In the final round of these
elections a group of ten people was selected from which the greatest Dutchman
was selected, amongst these were; Willem van Oranje, Desiderius Erasmus,
Rembrandt van Rijn, Johan Cruijff but also a man called Antoni van Leeuwenhoek1.
Why Antoni van Leeuwenhoek? Van Leeuwenhoek lived around 1700 AD in Delft
where he owned a fancy-textile shop and used magnifying glasses to investigate the
quality of textile. He received only an elementary education and spoke only Dutch.
Van Leeuwenhoek designed and built several hundred small microscopes of similar
design and function. The dimensions of his microscopes were fairly constant at
around 5 centimetres long and 2.5 centimetres wide. The core of these
microscopes consists of two flat and thin brass plates. In between the plates a small
bi-convex lens capable of magnifications ranging from 70x to over 250x, depending
upon the lens quality, was placed (see figure 1).
Figure 1: Original Antonie van Leeuwenhoek Microscope property of the Utrecht University museum, the Netherlands. The instrument consists of two brass plates (2.4x4.6 cm) riveted together at 3 locations. The hole contains a lens. On the tip of the sharp pin an object can be placed for observation. By using the screw on the pin one is able to focus the image. Van Leeuwenhoek made about 500 microscopes of which 9 have survived. This Utrecht example has a magnification of 266 X,

A brief history of Microscopy
9
while the other remaining magnify between 70 until 170 X. The Utrecht microscope allows for the observation of samples with a size of 0,00135 mm. Only after 1840 AD it was possible to build microscopes which could be used to study smaller objects. Antonie van Leeuwenhoek was not the original inventor of the microscope. Around 1600 a spectacles maker from Middelburg in the Netherlands found out that smaller objects could be more easily observed when placing two lenses at certain distance from each other. The microscope shown here was discovered around 1850 in the physics laboratory at the Minrebroederstraat in Utrecht the Netherlands by Prof. P. Harting. It was kept in a leather lined box with the inscriptions BB. Focal point 0,94 mm, Magnification 266x, Lens aperture 0,7 mm, Resolving power 1,35 mm. The painting showing van Leeuwenhoek using his microscope is by Robert A. Thom and appeared in "Great Moments in Medicine" published by Parke Davis & Company, in 1966.
He used these microscopes to study many different biological specimens and
published his findings in letters, many of which he sent to the Royal Society in
London. His findings earned him the title of “Fellow” and laid the foundation of
microscopy as it is used today.
In 1662 Robert Hooke was named Curator of Experiments of the Royal Society of
London he became responsible for the demonstration of new experiments at the
Society's weekly meetings2. Hooke's reputation in the history of biology mainly rests
on the book Micrographia, which he published in 1665 (see figure 2).
Figure 2: Cover of “Micrographia” by R. Hooke in which he described his microscopical observations

A brief history of Microscopy
10
Hooke designed a compound microscope including an illumination system based
upon van Leeuwenhoek’s microscope. He observed insects, sponges, bryozoans
(aquatic moss like organisms), foraminifera (tiny single-celled organisms that
construct shells), and bird feathers. Based on his findings Hooke described fleas for
example as "adorn'd with a curiously polish'd suite of sable Armour, neatly jointed"
(see figure 3).
Figure 3: Drawing of a flea made by R. Hooke as it was published in “Micrographia” 1665.
Some readers criticized Hooke for investigating such unimportant subjects, a satirist
of the time poked fun at him as "a Sot, that has spent 2000 £ in Microscopes, to
find out the nature of Eels in Vinegar, Mites in Cheese, and the Blue of Plums
which he has cunningly found out to be living creatures." One of his most
renowned microscopical observations was from the study of thin slices of cork. He
wrote: “I could exceedingly plainly perceive it to be all perforated and porous,
much like a Honey-comb, but that the pores of it were not regular, these pores, or
cells, were indeed the first microscopical pores I ever saw, and perhaps, that were
ever seen, for I had not met with any Writer or Person, that had made any mention
of them before this”. The cells Hooke described were plant cells. Hooke invented
the term "cells" because the boxlike cells of cork reminded him of the cells of a
monastery. Hooke also described comparable structures in wood and in other
plants. After van Leeuwenhoek had written to the Royal Society on September 7th
1674 with a report of the discovery of “animalcula” (bacteria and protozoa) in a

Practical problems of optics
11
sample of water from the Berckelse meer (an inland lake close to Delft)3. In 1678,
Hooke was asked by the Society to verify Leeuwenhoek's findings in which he
succeeded after two attempts which had initially failed. Although van
Leeuwenhoek's simple microscopes gave clearer images than his own compound
microscope, Hooke found simple microscopes difficult to use and called them
"offensive to the eye" and that they "much strained and weakened the sight”.
Practical problems of optics
The optimization of light microscopes dealt with 3 basic problems; chromatic
aberration, spherical aberration and reaching the theoretical limit of resolution.
Chester Hall found a solution to the problem of chromatic aberration around 1730.
The problem of the usage of a single lens system was the unequal bending of
different colors (wavelength) of light that occurs in a lens. Hall discovered that
combining highly refractive lead glass, which was used for chandeliers and goblets
in those days, with regular glass in a proper combination could correct for
chromatic aberration. Since the refractive indices of the materials used for the two
lenses were different, light passing the two lenses is bended at different angles. By
using a second lens, of different shape and light bending properties, alignment of
the wavelengths without losing all of the magnification of the first lens became
possible (see figure 4). Around 1830 Joseph Jackson Lister solved the problem of
spherical aberration, which is the unequal bending of light that hits different parts
The smallest distance between two points which can be resolved with an oil immersion objective of high quality and white light was studied by Abbe in Jena in the 19thcentury. The resolving power of a microscope can be described according to the following formula;
Resolving power:
2 sins
n i
λ=×
(1)
n is the refractive index of the oil, λ is the wavelength of the light and i is half the angle subtended by the objective front
lens at the object plane. sinn i× is called the numerical aperture (NA) of the objective (see also figure 5)

Practical problems of optics
12
of a lens. He discovered that by placing lenses at exact distances from each other
the aberration from all except the first lens could be eliminated.
Figure 4: The problem of chromatic aberration could be solved by placing an extra the achromatic lens behind the initial single lens.
By then it was already possible to produce low power low curvature lenses having
minimal aberration, so by using a lens of this type as the first in a series, spherical
aberration could be nearly eliminated. In order to obtain the most optimal
microscope it has to collect a cone of light that is as broad as possible. Ernst Abbe
worked out the solution to this problem around 1870. Just a year after Carl Zeiss
began the manufacture of the compound microscope; Abbe released a scientific
paper in 1873 in which he described the mathematics leading to further
improvement of the microscope. He described the physical laws about the
collection of light by an objective and was able to maximize this collection by using
water and oil immersion lenses. Abbe managed to accomplish about 10 times
better resolution than van Leeuwenhoek had achieved about 100 years earlier.

Confocal microscopy
13
Figure 5: Resolution is the minimal distance at which two point objects still can be recongnized from each other. Airy diffraction pattern sizes and their corresponding radial intensity distribution functions are depended on the combination of numerical apertures from the objective and condenser, as well as the wavelength of light used. For a well-corrected objective with a uniform circular aperture, two adjacent points are just resolved when the centres of their airy patterns are separated by a minimum distance which is equal to the radius of the central disk in the airy pattern. In this example λ=685nm and the NA=0.6 and resolution r = 1.22 λ /2NAobj.
Confocal microscopy
Conventional wide field light microscopes are based upon the fact that an entire
sample of interest is illuminated and can subsequently be observed by the naked
eye or imaging device. The image is focused by one, or more lenses which can be
moved opposite each other in order to obtain a sharp image of the object. The
source for illumination in these microscopes consist of a bulky light source like the
sun or candlelight in the early days, and electric light bulbs or more recently
halogen light bulbs nowadays. In 1964, C.H. Townes, N.G. Basov and A.M.
Prochorov received the Nobel Prize for physics for the invention of the laser, which
allowed for the production of coherent radiation from electrons and atoms4. In
other words they discovered a means to generate light (radiation) composed of
photons pulsating with a well defined frequency. In this same period Minsky
applied for a patent describing a stage scanning confocal microscope5 (see figure 6).
In his own words “An ideal microscope would examine each point of the specimen
and measure the amount of light scattered or absorbed by that point. But, if we try
to make many such measurements at the same time then every focal image point
will be clouded by aberrant rays of scattered light deflected points of the specimen

Confocal microscopy
14
that are not the point you're looking at. Most of those extra rays would be gone if
we could illuminate only one specimen point at a time”6.
Figure 6: Original drawing of the confocal microscope design by Minsky in figure 3 a scheme of the working principle can be seen.
The fundamental difference between the confocal microscope and the
conventional microscope is the use of a small focussed beam of light which scans
across a sample in the confocal microscope, whereas in conventional microscopes
whole samples are illuminated. The scattered light from the specimen is directed
through a pinhole or slit, which blocks all “out of focus light”, and is then
reconstructed into an image (see figure 7). These microscopes have a number of
advantages over the conventional microscopes; control of depth of field, reduction

Electron microscopy
15
or elimination of background information away from the focal plane, which causes
image blurring, and the ability to collect serial optical sections from thick specimens.
Figure 7: Principle of Confocality: by placing a pinhole in the pathway of light coming from the objective lens the out of focus light can be blocked, leading to an improved image because only the in focus light is observed.
Confocality basically makes use of spatial filtering techniques in order to eliminate
out-of-focus light or so called glare in specimens whose thickness exceeds the
immediate plane of focus. This concept of confocal microscopy was improved
upon by Egger who used a laser to develop a working confocal scanning optical
microscope7. The demonstration of it’s applicability in biology however took 10
years more when Brakenhoff et al. showed its real potential in studies on 3-
dimensional chromatin distribution inside the nucleus of mammalian and insect
cells8-14.
Electron microscopy
Although conventional microscopes had improved the quality of imaging
tremendously the wavelength of light puts a limit on the amount of magnification at
which objects still can be resolved. Using light, it is impossible to distinguish details
smaller than the wavelength of the light. For a conventional microscope using

Electron microscopy
16
visible light, the distance between two points of an image that still can be resolved
is about 0.2 μm. This made it impossible to study for example the organelles within
cells, so another method had to be developed which could allow for these studies.
A big step forward in microscopy came when it was found possible to produce an
image of an object using an electron beam. Ernst Ruska, together with his
supervisor Max Knoll, began studying simple magnetic coils4, 15-19. They discovered
that the use of suitably-designed iron encapsulation improved the electron-optical
properties. Moreover, they found that magnetic coils could be used like an optical
lens. By using a lens of this type, enlarged images could be generated of a sample
irradiated with electrons. Ruska subsequently worked on improvement of the
details, and in 1933 the first electron microscope in the modern sense was
constructed. Since then electron microscopes have been improved tremendously.
Electrons are point like particles, and therefore the resolving power of Electron
microscopes is theoretically unlimited. However, quantum mechanics dictate that
every particle has wave properties which cause an uncertainty into the
determination of its position. This sets a theoretical limit to resolution for the
acceleration potentials normally used in the order of 0.5 - 1 Å. An interesting side
effect of using a beam of electrons to observe the morphology of samples is the
generation of X-rays. The electrons from the electron beam can interact with the
electrons present in the atoms from which a sample is composed of. The
interaction causes electrons to be ejected from an inner shell of an atom
(excitation), in order to restore the charge; the ejected electron is then replaced
with an electron from a higher shell, during which energy in the form of X-rays is
released. Since the X-rays have a specific energy depending on the atoms by which
the X-rays are released from, the detection of these can be used to build an atom
specific spectrum.

The Raman effect
17
Raman spectroscopy
Another analysis technique dealing with the excitation of electrons is Raman
spectroscopy. The source of Raman spectroscopy is an inelastic scattering effect,
where the excited molecule, induced by photons from a monochromatic light
source, relaxes to a different vibration level than its original ground state. The
energy difference between the incident and scattered radiations appears as a
frequency shift from the incident light. These frequency shifts are specific for a
given chemical bond and allow therefore molecular analysis.
The phenomenon called Raman Effect
The Raman effect was first discovered by C.V Raman, the story goes that he was
fascinated by the spectacular blue color of the Mediterranean Sea, who studied the
scattering of light by liquids. Raman together with Krishnan published a paper in
1928 on what they called “A New Type of Secondary Radiation”20. They described
this radiation as follows: “in the case of ordinary light two types of scattering, one
determined by the normal optical properties of the atoms or molecules, and
another representing the effect of their fluctuations from their normal state are to
be expected”. They did several experiments in which they converged bright
sunlight by a series of lenses into several liquids and used complementary colored
light-filters in order to filter out the scattered light. They discovered that although
they had filtered out the light with the color (wavelength) scattered by a specific
sample another color could still be observed. Soon after, these observations were
confirmed by several others and the Raman effect was born.
The Raman effect
A qualitative description can of Raman scattering can be found in figure 8. In
literature several descriptions of Raman scattering can be found21-23. Based on
these a brief explanation of Raman scattering is given here. When a photon with
certain energy interacts with a molecule, the energy state of the molecule increases.

The Raman effect
18
The increase in energy of the molecule is equal to the energy of the interacting
photon.
Figure 8: Schematic presentation of the energy level diagram in Raman scattering, hv0 the initial energy of the incident photon, hvvib the energy of the scattered photon influenced by molecular vibrations.
The alterations in energy state are not fixed, meaning any of an infinite number of
energy levels, or virtual states, can be assumed. The thus excited molecules do not
remain stationary at these virtual states. The change in energy is in fact a distortion
of a covalent bond and therefore the molecule immediately relaxes back to the
original electronic (ground) state by emitting a photon. If no energy is transferred to
the molecule the emitted photon will have the same energy as the initial photon.
The light scattering observed will therefore consist of the same wavelength as was
initially applied; this is what is referred to as Rayleigh scattering. If the molecule
returns to a different electronic state (higher or lower) than the original ground state,
photons will be emitted having either less energy, in case of Stokes Raman
scattering, or more energy, in case of anti-Stokes Raman scattering. Molecules are
basically composed of point masses (atoms) connected by springs (chemical bonds).
Moreover, the vibrational frequency of a small group of atoms bound together is
almost independent from the rest of the molecule. The vibrational spectrum of a

The Raman effect
19
molecule can be depicted as the total sum of vibrational frequencies of each
chemical bond present.
There are a number of factors which can influence Raman band intensities;
A) Vibrations of polar chemical bonds produce weak Raman bands. Strong dipole
moments localize the electron cloud which composes a chemical bond making the
cloud harder to be moved by light.
B) Crystalline materials have stronger and more intense Raman bands than non
crystalline materials.
C) Stretching vibrations are in general stronger scatterers than bending vibrations.
D) Raman intensity of stretching vibrations increases with bond order.
E) Symmetric vibrations are in general stronger than anti symmetric vibrations.
Since Raman spectroscopy uses a monochromatic light source for the molecular
analysis of samples one can apply the basic principles of light microscopy in order
to construct a confocal Raman spectroscope. In confocal Raman spectroscopy one
uses the capabilities of a normal confocal microscope. The confocal Raman
spectroscope, (sometimes referred to as micro Raman meter) is basically a confocal
light microscope converted into a Raman microscope. It uses a laser as a
monochromatic light source, which is focussed on a sample by an objective. The
induced Raman scatter is collected by this objective and than directed through a
Raman data is usually displayed as a plot of Raman scattering intensity as a fuction of wavelength. At the x-axis the Raman shift is displayed in wavenumbers. Wavenumber is the reciprocal of wavelength in centimeters. One wavenumber is equal to a unit of energy E (see formula 2). The x-axis in Raman spectra displays the difference between the excitation wavelength and the Raman wavelength (see formula 3).
h cE h v h c ω
λ= = = (2)
h = Planck’s constant, v = frequency of light, c = speed of light, λ = wavelength of light, ω = wavenumber of light
0
1 1Raman shift=
Ramanλ λ− (cm-1) (3)
λ0 is excitation wavelength, λraman is Raman wavelength

The logical next step: combining Confocal Raman Microscopy with Electron Microscopy
20
pinhole into a spectograph containing a holographic grating, which diverts different
wavelengths at different angles. The decomposed wavelengths are then collected
by a deep cooled CCD camera, of which the data is then recorded by a computer.
By using the high resolution capabilities of this system one can not only analyse
samples on a sub micrometer scale, by measuring a single point, but when
combining such a “microscope” with either a scanning mirror or a scanning sample
stage, so called Raman images (images revealing molecular information) can be
generated. I would like to define the technology which is frequently described in
literature as being confocal or micro Raman spectroscopy, as Confocal Raman
Microscopy, when imaging is used and as Confocal or Micro Raman Spectroscopy
when only point analysis are done.
The logical next step: combining Confocal Raman Microscopy with Electron
Microscopy
The most commonly used types of electron microscopes in biology are scanning
and transmission electron microscopes. The first type is used for studying the 3 D
morphology of samples, while the second one is used for the observation of ultra-
thin sections of samples. Both microscopes can reveal morphological and chemical
information as well, whenever X-ray microanalysis is used. However, a
disadvantage of X-Ray microanalysis is the difficult detection of atoms with a low
atomic number, especially in case of fluor and nitrogen, while atoms with a
number lower than that of carbon (5), cannot be detected. A second disadvantage
of X-ray microanalysis is the fact that no discrimination between atoms can be
made which belong to either organic or inorganic molecules. Moreover, no
information can be obtained about the type of molecule the atom belongs to. In
life sciences, X-ray microanalysis is used for studies at the organelle level in the cell,
but information obtained from these measurements is severely restricted because of
limitations of the measurement technique, as was mentioned before. In the past 2
decades the technique of Raman spectroscopy has been refined, which eventually

Working principle of the combined system
21
led to the design of compact confocal Raman spectro- and microscopes. The main
drawback of Raman spectroscopy however is the fact that the signal obtained is
very weak due to the low efficiency of Raman scattering. Nevertheless, studies
done at the Biophysical Techniques department at the University of Twente led to
a tremendous optimization of this analytical technique. Puppels et al. wrote a thesis
on the development of a confocal Raman micro spectroscope for studying cells and
chromosomes. This thesis lead to a publication in Nature in 199024, describing the
study of live single cells and chromosomes by this technique. Nowadays, there are
numerous studies on nucleic acids, lipids and proteins being performed by using
confocal Raman spectroscopy. Recently, a thesis describing the development of a
compact confocal Raman spectroscope was published by Aksenov et al.25. Herein,
the design of a confocal Raman system is described which can be combined with a
scanning electron microscope. The rationale behind this research was the fact that
the use of X-ray microanalysis for studying biological samples is not sufficient, while
only the presence of carbon, oxygen and other atoms can be revealed. The
information on physicochemical properties of samples is crucial for a researcher in
the field of tissue engineering, where he would benefit from additional information
about molecular composition and distribution in samples of interest. X-Ray
microanalysis is currently the most common technique used in electron microscopy
which allows for the chemical analysis without any pre-treatment of microscopic
samples. Therefore, the combination of electron microscopy with confocal Raman
microscopy and/or X-ray microanalysis is therefore a logical next step and can
greatly expand the analytical capabilities, allowing the analysis of molecular
composition at a sub micrometer scale without complicated sample preparations.
Working principle of the combined system
Let us see how the Confocal Raman Module functions in more detail. A schematic
drawing of the system is given in figure 9. Once the coordinates of a location of

Working principle of the combined system
22
interest for Raman analysis is found by electron microscopy, the sample is shifted
towards the exact position of the laser spot. This position is determined beforehand
by calibrating the system by using small beads and using the capabilities of the
module which allows for observing samples by transmission light microscopy as well.
Figure 9: schematic representation of the combined confocal Raman microscope with a scanning electron microscope. Samples are analyzed by selecting a location by EM using the electron beam (EB) subsequently moving the sample into the confocal laser spot at exact coordinates. The laser source consists of a laserdiode (LD) with a wavelength of 685nm and is diverted through a side port into the vacuum chamber by a beamsplitter (BS). The laser is then emitted onto the sample by a set of gold coated mirrors through a 60 x objective (MO). The induced Raman scatter is then collected by the same objective and diverted in the opposite direction, passing a notch filter (NF) to eliminate the laser light obscuring the Raman signal and focussed by a pinhole objective (PO) on a pinhole allowing for confocality of the system. Inside the spectrograph monochromator, the Raman scattering is subsequently focused on a holographic diffraction grating and the decomposed wavelengths are then detected by a thermo-electrically cooled CCD. The sample stage (allowing for nanometer movements) is equipped with a small light source to use transmission light microscopic observation for easy calibration of stage movement.
The system is composed of a spectrograph and laser diode outside the vacuum
chamber of the scanning electron microscope and a mirror and lens system inside
the vacuum chamber. A collimated laser beam, emitted by the laser diode is
directed into the vacuum chamber through a vacuum sealed window. The beam is
then diverted by a series of gold coated mirrors, through the objective lens. By
focussing, an optimal focal spot is then obtained on the sample of interest. The
induced Raman scattering, is collected in the opposite direction by the objective
lens and guided by the mirror system through the vacuum window. The signal

Raman imaging in the Scanning Electron Microscope
23
subsequently passes the beam splitter and a notch filter, which blocks most photons
with the initial wavelength from the diode laser. The remaining photons are
focused by a small lens on a pinhole, which allows for confocality of the system.
Inside the spectrograph the photons with different wavelengths are diverted by a
holographic grating onto a thermo electrically cooled CCD chip connected to a
computer, by which the signal can be analyzed.
Raman imaging in the Scanning Electron Microscope
Imaging of a sample can be performed as follows. A scanning stage is placed on the
original sample stage of the electron microscope. This scanning stage should allow
for stepwise controlled movement of the sample with high enough resolution, at
least the laser spot size resolution. The scanning stage can be a piezo element or a
step motor driven system depending on the dimensions of the vacuum chamber.
The stage is then linked to measurement software, trough laboratory processing
software, allowing for stepwise movement and collection of spectra during each
step. This leads to the generation of spectroscopic images which can be depicted as
image files, which in turn can be related to the electron micrograph collected
beforehand of the same area, a few examples of these images can be found in
figure 10.
Figure 10: Examples of Raman imaging on different SEM samples. Micrographs A and B; surface of human cancellous bone
and corresponding Raman image on phosphate C: typical backscatter sample of bone filler and overlaying PO43- distribution.
Tissue engineering and materials
24
D: electron micrograph of bone ECM produced by osteoprogenitor cells and (E) corresponding Raman image of mineralized
matrix. F: Surface of rat femoral bone and corresponding Raman images on protein (red), carbonate (green) and phosphate
(blue).
Now, not only point analyses of interesting structures can be done, but also
chemical maps can be made. The chemical maps can show the distribution of
specific molecules in the sample, which then can be related to the morphology
observed by scanning electron microscopy. This can for example give valuable
information about tissue interaction with implants, phagocytosis, extra cellular
matrix production, the dynamics of intra-cellular processes, etc. in the case of tissue
engineering studies.
Tissue engineering and materials
In tissue engineering, one strives to combine several scientific disciplines like
material science, biology, physics etc., in order to create new technologies for the
repair of damaged tissues, which in most cases can not heal themselves because of
the defect size. In the past 2 decades many different definitions of tissue
engineering have been put forward and changes in the description have been
influenced by personal opinions, background and scientific and technological
developments. The central dogma here is that materials or cells alone, or in
combination with (other) cells and/or bioactive factors are processed into an end
product which can support new tissue formation in order to heal a defect or
provide replacement for lost tissue. In case of degradable materials being applied in
tissue engineering the ultimate material would be one which degrades while new
tissue replaces the implanted material in the same time. Depending on their
molecular composition materials can degrade in different ways a scheme of
possible processes participating in degradation is depicted in figure 11. The
mechanisms by which polymer (bio) materials can degrade can be described by
either surface erosion or bulk erosion. Surface erosion can be defined as the

Tissue engineering and materials
25
gradual degradation of a material from the surface towards the inside, layer by layer
the surface is eroded away, while in bulk erosion, degradation takes place
throughout the whole polymer structure26.
Figure 11: Schematic presentation of the processes involved in degradation of materials after implantation. Source: Dr. D. Grijpma, Dept. of Polymer Chemistry and Biomaterials, University of Twente, the Netherlands.
During surface erosion a significant mass loss can be detected while the molecular
weight and mechanical properties remain largely unchanged, whereas during bulk
erosion a decrease in molecular weight and mechanical properties mostly precedes
mass loss27. An excellent example of surface erosion was shown by Wang et al.28,
who studied the enzymatic degradation of poly(L-lactide)-poly(2-ethyl-2-
oxazoline)-poly(L-lactide) triblock copolymers (PLLA-PEOZ-PLLA). The polymer
used in this study consisted of a so called ABA triblock copolymer containing
biodegradable PLLA A-blocks and water-soluble polyelectrolyte poly(2-ethyl-2-
oxazoline) (PEOz) B-blocks. At least 60% weight was lost after 34 hours of
incubation in a buffered solution containing a hydrolytic enzyme in order to
facilitate fast degradation. After electron microscopic observations they found that
degradation had taken place mainly at the surface of these polymers and that the
overall pore sizes had increased after incubation. In contrast is the observation of

Tissue engineering and materials
26
the change in composition of Poly(ether ester) block copolymers, which are based
on polyethyle glycol and polybutylene terephtalate after implantation29 (see figure
12).
Figure 12: Polyethylene oxide terephtalate (PEOT) and poly butylene terephtalate (PBT) block copolymer. The initial length of the polyethylene oxide (PEG) segment can be varied, as can be the molar ratio of the PEOT to PBT segments. The composition is denoted as a / b / c, where a represents the poly(ethylene glycol) (PEG) molecular weight (MW g/mol), and b and c represent the weight percentage (wt%) of PEGT and PBT blocks respectively.
These blockcopolymers are being used as degradable materials for tissue
engineering (brandname: Polyactive™) by several companies in relation to either
tissue repair or drug release applications. These so called PEOT/PBT (or sometimes
referred to as PEGT/PBT) multi block copolymers are thermoplastic elastomers. By
varying the polyethyleneglycol terephtalate block (PEOT) and polybutylene
terephtalate (PBT) block ratio and the molecular weight of the polyethyleglycol
(PEG) used for synthesis a vast range of different block copolymers can be
produced with different mechanical, swelling and degradation properties an
extensive description of these characteristics can be found elsewhere30. Depending
on their composition, PEOT/PBT block copolymers have been applied as alloplastic
tympanic membranes as middle ear prosthesis31 in skin32-40, cartilage41-44 and
bone45-54tissue engineering studies. An interesting observation was made when
PEOT/PBT copolymers were used with high PEO content. In several studies it was
found that after implantation these polymers showed signs of calcification31, 51, 55.
Several authors have described a continuity in apatite crystals across the interface of
PEOT/PBT implants and bone51, 52, 56 indicating the bone bonding capabilities of
these polymers. More recently a number of studies have been done on adding
either biomimetic calcium phosphate coatings57, 58 or mesenchymal stem cells54, 59,

Bone and Raman spectroscopy
27
60 to tissue engineering scaffolds made from PEOT/PBT block copolymers indicating
the possibility to use these materials for bone tissue engineering.
Bone and Raman spectroscopy
Bone is a highly dynamic tissue undergoing constant self renewal under the
influence of outside pressure. Moreover, it is essentially a composite elastic material
with high stiffness composed of carbonated apatite and mainly collagen type I
fibers, packed into a dense material. Depending on the location in the body it can
either have a porous appearance, trabecular bone found in the marrow cavities of
long bones, ileum and claviculae for example, or a dense appearance, like the
compact bone layering present in the long bones and calvaria. Raman spectroscopy
is a well suited technique to investigate the physico chemical properties of bone
tissue. The most prominent band which can be found in bone spectra belongs to
the asymmetric stretch mode (v1) of phosphate (960 cm-1), while a carbonate
specific band can be found around 1070 cm-1, these bands can be used as markers
for the mineral content of bone (see figure 13).
Figure 13: Typical example of a Raman spectrum of Bone showing the band positions specific for the different bone matrix constituents.

Bone and Raman spectroscopy
28
Other important Raman bands which can be found are the so called amide I
(around 1650 cm-1) and amide III bands (around 1250 cm-1), specific for the
organic matrix of bone. Morris et al.61-63 have described the chemical composition
of bone studied by Raman spectroscopy extensively. In a study done on cortical
bone using Raman transects63, a number of lines composed of fifty to hundred
Raman spectra, they found that around osteons, the structures that form the
Haversian channels in cortical bone, three distinct phosphate signatures could be
found. The transects indicated a range varying from a disordered more amorphous
mineral phase close to the center of the osteon towards a ordered and more
crystalline phase away from the center of the osteon. A similar method was used by
Schulze et al.64, who studied the qualitative mineral content across different dental
layers. Interestingly they found no change in phosphate mineral phase between
dentin, enamel and cementum in teeth. However, the intensity of the C-H
stretching mode (belonging to the organic matrix) was higher in enamel than in
dentin and a steep increase in the interface between these two layers, the so called
dental calcified junction, could be measured. These results show that Raman
spectroscopy not only can be used to analyse the molecular composition of bone
tissues, but can reveal information about the organisation of these hard tissues as
well. Another interesting feature of Raman spectroscopy is that it can be used to
study the structural changes of materials and tissues induced by mechanical
pressure by monitoring the position of specific Raman bands. When bovine femora
were subjected to mechanical loading, through indentation of the cortical region, it
was found that Raman bands belonging to the organic matrix, related to crosslink
ruptures in the Collagen network, had shifted, predominantly when shear forces
were present65. Compression of the cortex on the other hand, resulted mainly in
the alteration of the mineral phase content. Although the authors could not fully
explain this last mentioned result, they hypothesized that structural changes and or
movements in the crystal lattice of hydroxyl and carbonate groups could have been

Cells, tissues, materials and confocal Raman spectroscopy
29
induced by increased pressure during the indentation process. More recently, in a
study performed on Rat femoral bone, Raman microprobe measurements revealed
that with increased age the mineral crystal lattice of bone becomes more organised
and more carbonate ions are present66. Furthermore, it was found that increasing
mineral matrix ratio, crystallinity and type-B carbonate substitution were correlated
to a deterioration of structural and tissue-level mechanical properties of aging
compact bone.
Cells, tissues, materials and confocal Raman spectroscopy
One of the approaches towards tissue repair, while using tissue engineering
techniques is the isolation of the patients own cells, which can then be culture
expanded, eventually differentiated into the proper phenotype and seeded onto
scaffold material of any shape which subsequently can be implanted into the defect
area. The idea is that the cells present on these scaffolds can speed up the healing
process, by either providing growth factors which can attract other cells to the
implant site, or support tissue-repair itself. Without describing all the details of the
different approaches taken for different types of tissues, it is evident that a selection
of the proper cell source and the subsequent analysis of its performance must be
crucial to the outcome of a tissue engineering study involving cells. Confocal
Raman spectro- or microscopy can provide the researcher with a non destructive
technique by which cells can be investigated. In the early 90’s Puppels et al.24, 67-69,
have shown the feasibility of such a system to study single cells and chromosomes.
Since these first studies, others have used comparable systems to study different cell
types and their organelles. Confocal Raman spectroscopy was used to distinguish
different types of bone cell lines commonly used in tissue engineering of bone, in
order to develop a phenotypic identification method70. The authors showed the
feasibility of using confocal Raman microscopy to identify phenotype differences
between human primary osteoblasts (HOB), SV40 transfected human alveolar bone

Cells, tissues, materials and confocal Raman spectroscopy
30
cells (SV40 AB) and osteoblast like human osteosarcoma MG63 cells in vitro. By
using complex statistical analysis techniques they were able to classify 70% of all
the cells observed correctly, based upon spectral differences determined by
principal component analysis techniques. Although this number seems not to be
extremely high, the interpretation of minute differences in the obtained spectra and
the fact that single cell Raman measurements are still very technical strenuous
enterprises makes it a very promising study for future research into topics as cell
differentiation. Spectroscopy has been used in some studies to monitor cell
proliferation and differentiation based upon the biochemical differences detected.
For instance, Fourier transform infrared (FTIR) and Raman spectroscopy have been
used to study proliferation of mammalian cells. FTIR measurements on different Rat
fibroblast cell lines revealed that the ratio of RNA versus lipid and protein versus
lipid of all cell lines increased when they were in the exponential phase of growth.
These findings were confirmed by using Raman spectroscopy on the nuclei and
cells derived from the same cell lines71. Moreover, the Raman data provided also
detailed information about the distribution of lipid, protein, RNA and DNA in cells
and nuclei. Confocal Raman measurements of murine embryonic stem cells
revealed that undifferentiated and differentiated cells could be easily distinguished
from each other by simply comparing their respective Raman spectra. It was found
that differentiated cells had a higher RNA content than non differentiated cells,
which reflected results found in previous studies on embryonic stem cells. An
alternative system to study bone mineralization is the osteoblast culture.
Osteoblasts are highly specialized cells involved in bone formation by producing a
collagen type I containing extra cellular matrix which in turn calcifies. Primary
mouse calvarial osteoblasts exhibited signs of mineralization comparable to poorly
carbonated apatite after 8 days of culture in osteogenic medium, which was
represented by the presence of Raman bands belonging to phosphate (960 and
1030 cm-1) and B-type carbonate (1070 cm-1)72. In addition it was found that in

Cells, tissues, materials and confocal Raman spectroscopy
31
time the amount of carbonate increased slightly as the intensity of the carbonate
specific Raman band increased which mimics more or less the development found
in young mouse bone.
As was mentioned before, materials used for orthopaedic implants in bone
replacement must be gradually resorbable so that they can be replaced by new
bone. In bone, osteoclasts play a major role in the resorption of bone during bone
remodelling. Redey and coworkers showed that crystals of type B carbonated
apatite could be found in the resorption pits formed by osteoclasts on the surface
of calcium carbonate by confocal Raman spectroscopy, while this could not be
found in control bone slices, or pure HA73. This indicated that not only calcium
carbonate could be readily absorbed by these cells but that the surface changes
induced by these cells could also be easily detected by using non destructive
Confocal Raman microscopy. Another application of Confocal Raman spectroscopy
for the analysis of biomaterials was published by de Grauw et al.74, who showed
that the physical state (being crystalline or amorphous) of a plasma sprayed calcium
phosphate coating can be examined by using this technique. They established that
the local degree of crystallinity in various heat treated plasma spray coatings could
be determined with a precision of 0.7%. The examples of studies dedicated to
bone and bone tissue engineering where Raman spectroscopy and confocal Raman
microscopy is used as an important investigative tool, in order to gain in depth
information on either the behaviour of cells or materials, given in this chapter prove
that Raman spectro- and microscopy can be a valuable analysis method in the field
of tissue engineering. The usage of different materials and biological components in
this field of research provides an excellent opportunity for the usage of Raman
microscopy, while this technique can provide physicochemical information on both
topics in a relatively easy manner.

References
32
References
1. Katholieke Radio Omroep, De grootste Nederlander. http://www.degrootstenederlander.nl 2004. 2. Chapman, A., England's Leonardo: Robert Hooke (1635-1703) and the art of experiment in Restoration England. Proceedings of the Royal Institution of Great Britain 1996, 67, 239 - 275. 3. van Leeuwenhoek, A., Letter no. 11. Philosophical Transactions 1674, IX, (108), 178-182. 4. The Nobel Foundation, Nobelprize.org. www.nobelprize.org 2005. 5. Minsky, M. Microscopy Apparatus. US patent no. 3013467, 19 Dec. 1961, 1961. 6. Minsky, M., Memoir on Inventing the Confocal Scanning Microscope. Scanning 1988, 10, 128-138. 7. Davidovits, P.; Egger, M. D., Scanning laser microscope. Nature 1969, 223, (208), 831. 8. Brakenhoff, G. J.; van Spronsen, E. A.; van der Voort, H. T.; Nanninga, N., Three-dimensional confocal fluorescence microscopy. Methods Cell Biol 1989, 30, 379-98. 9. Brakenhoff, G. J.; van der Voort, H. T.; van Spronsen, E. A.; Nanninga, N., 3-dimensional imaging of biological structures by high resolution confocal scanning laser microscopy. Scanning Microsc 1988, 2, (1), 33-40. 10. Brakenhoff, G. J.; van der Voort, H. T.; Baarslag, M. W.; Mans, B.; Oud, J. L.; Zwart, R.; van Driel, R., Visualization and analysis techniques for three dimensional information acquired by confocal microscopy. Scanning Microsc 1988, 2, (4), 1831-8. 11. Brakenhoff, G. J.; van der Voort, H. T.; van Spronsen, E. A.; Nanninga, N., Three-dimensional imaging by confocal scanning fluorescence microscopy. Ann N Y Acad Sci 1986, 483, 405-15. 12. Valkenburg, J. A.; Woldringh, C. L.; Brakenhoff, G. J.; van der Voort, H. T.; Nanninga, N., Confocal scanning light microscopy of the Escherichia coli nucleoid: comparison with phase-contrast and electron microscope images. J Bacteriol 1985, 161, (2), 478-83. 13. Brakenhoff, G. J.; van der Voort, H. T.; van Spronsen, E. A.; Linnemans, W. A.; Nanninga, N., Three-dimensional chromatin distribution in neuroblastoma nuclei shown by confocal scanning laser microscopy. Nature 1985, 317, (6039), 748-9. 14. Grond, C. J.; Derksen, J.; Brakenhoff, G. J., The banding pattern of the segment 46A-48C in Drosophila hydei polytene chromosomes as studied by confocal scanning light microscopy (CSLM). Exp Cell Res 1982, 138, (2), 458-62. 15. Ruska, E., [A modern electron microscope.]. Minerva Med 1955, 46, (18), 597-9. 16. Ruska, E., [Memories of the beginnings of electron microscopy]. Arb Paul Ehrlich Inst Georg Speyer Haus Ferdinand Blum Inst Frankf A M 1970, 66, 19-34. 17. Ruska, E., The early development of electron lenses and electron microscopy. Microsc Acta Suppl 1980, (Suppl 5), 1-140. 18. Ruska, E., Nobel lecture. The development of the electron microscope and of electron microscopy. Biosci Rep 1987, 7, (8), 607-29. 19. Ruska, E., www.ernst.ruska.de 1998.

References
33
20. C. V. Raman; Krishnan, K. S., A New Type of Secondary Radiation. Nature 1928, 121(3048), 501. 21. Pelletier, M. J., Analytical applications of Raman spectroscopy. first ed.; Blackwell Science Ltd.: Oxford, 1999; p 1-478. 22. Long, D. A., The Raman effect: A unified treatment of the theory of Raman scattering by molecules. ed.; John Wiley and Sons Ltd.: Chichester, UK, 2002; p 1-624. 23. Lin-Vien, D.; Colthup, N. B.; Fateley, W. G.; Grasselli, J. G., The handbook of infrared and Raman characteristic frequencies of organic molecules. ed.; Academic Press: San Diego, USA, 1991; p 1-499. 24. Puppels, G. J.; de Mul, F. F.; Otto, C.; Greve, J.; Robert-Nicoud, M.; Arndt-Jovin, D. J.; Jovin, T. M., Studying single living cells and chromosomes by confocal Raman microspectroscopy. Nature 1990, 347, (6290), 301-3. 25. Aksenov, Y. Raman microscopy in an electron microscope: combining chemical and morphological analyses. Doctoral thesis, University of Twente, Enschede, The Netherlands, 2003. 26. Tamada, J. A.; Langer, R., Erosion Kinetics of Hydrolytically Degradable Polymers. PNAS 1993, 90, (2), 552-556. 27. D.W. Grijpma, P. B. M., Fac. Technological Sciences, University of Twente, The Netherlands, Personal communication. 2005. 28. Wang, C.-H.; Fan, K.-R.; Hsiue, G.-H., Enzymatic degradation of PLLA-PEOZ-PLLA triblock copolymers. 2005, 26, (16), 2803. 29. Deschamps, A.; van Apeldoorn, A.; Hayen, H.; de Bruijn, J.; Karst, U.; Grijpma, D.; Feijen, J., In vivo and in vitro degradation of poly(ether ester) block copolymers based on poly(ethylene glycol) and poly(butylene terephthalate). Biomaterials 2004, 25, (2), 247-258. 30. Deschamps, A. A. Segmented Poly (ether ester)s and poly (ether ester amide)s for use in tissue engineering. Doctoral, University of Twente, The Netherlands, Enschede, The Netherlands, 2002. 31. Grote, J. J.; Bakker, D.; Hesseling, S. C.; van Blitterswijk, C. A., New alloplastic tympanic membrane material. Am J Otol 1991, 12, (5), 329-35. 32. van Dorp, A. G.; Verhoeven, M. C.; Koerten, H. K.; van Blitterswijk, C. A.; Ponec, M., Bilayered biodegradable poly(ethylene glycol)/poly(butylene terephthalate) copolymer (Polyactive) as substrate for human fibroblasts and keratinocytes. J Biomed Mater Res 1999, 47, (3), 292-300. 33. Beumer, G.; van, B. C.; Bakker, D.; Ponec, M., A new biodegradable matrix as part of a cell seeded skin substitute for the treatment of deep skin defects: a physico-chemical characterisation. Clin Mater 1993, 14, (1), 21-7. 34. Beumer, G.; van, B. C.; Ponec, M., Biocompatibility of a biodegradable matrix used as a skin substitute: an in vivo evaluation. J Biomed Mater Res 1994, 28, (5), 545-52. 35. Beumer, G. J.; van Blitterswijk, C. A.; Bakker, D.; Ponec, M., A new biodegradable matrix as part of a cell seeded skin substitute for the treatment of deep skin defects: a physico-chemical characterisation. Clin Mater 1993, 14, (1), 21-7.

References
34
36. Beumer, G. J.; van Blitterswijk, C. A.; Ponec, M., Biocompatibility of a biodegradable matrix used as a skin substitute: an in vivo evaluation. J Biomed Mater Res 1994, 28, (5), 545-52. 37. van Dorp, A. G.; Verhoeven, M. C.; Koerten, H.; van der Nat-van der Meij, T. H.; van Blitterswijk, C. A.; Ponec, M., Dermal regeneration in full-thickness wounds in Yucatan miniature pigs using a biodegradable copolymer. Wound Repair Regen 1998, 6, (6), 556-68. 38. van Dorp, A. G.; Verhoeven, M. C.; Koerten, H. K.; van Blitterswijk, C. A.; Ponec, M., Bilayered biodegradable poly(ethylene glycol)/poly(butylene terephthalate) copolymer (Polyactive) as substrate for human fibroblasts and keratinocytes. J Biomed Mater Res 1999, 47, (3), 292-300. 39. van Dorp, A. G.; Verhoeven, M. C.; Koerten, H. K.; Van Der Nat-Van Der Meij, T. H.; Van Blitterswijk, C. A.; Ponec, M., Dermal regeneration in full-thickness wounds in Yucatan miniature pigs using a biodegradable copolymer. Wound Repair Regen 1998, 6, (6), 556-68. 40. Xiao, Y. L.; Riesle, J.; Van Blitterswijk, C. A., Static and dynamic fibroblast seeding and cultivation in porous PEO/PBT scaffolds. J Mater Sci Mater Med 1999, 10, (12), 773-7. 41. Malda, J.; Woodfield, T. B.; van der Vloodt, F.; Kooy, F. K.; Martens, D. E.; Tramper, J.; van Blitterswijk, C. A.; Riesle, J., The effect of PEGT/PBT scaffold architecture on oxygen gradients in tissue engineered cartilaginous constructs. Biomaterials 2004, 25, (26), 5773-80. 42. Malda, J.; Woodfield, T. B.; van der Vloodt, F.; Wilson, C.; Martens, D. E.; Tramper, J.; van Blitterswijk, C. A.; Riesle, J., The effect of PEGT/PBT scaffold architecture on the composition of tissue engineered cartilage. Biomaterials 2005, 26, (1), 63-72. 43. Woodfield, T. B.; Bezemer, J. M.; Pieper, J. S.; van Blitterswijk, C. A.; Riesle, J., Scaffolds for tissue engineering of cartilage. Crit Rev Eukaryot Gene Expr 2002, 12, (3), 209-36. 44. Woodfield, T. B.; Malda, J.; de Wijn, J. R.; Peters, F.; Riesle, J.; van Blitterswijk, C. A., Design of porous scaffolds for cartilage tissue engineering using a three-dimensional fiber-deposition technique. Biomaterials 2004, 25, (18), 4149-61. 45. Bouwmeester, S. J.; Kuijer, R.; Sollie-Drees, M. M.; van der Linden, A. J.; Bulstra, S. K., Quantitative histological analysis of bony ingrowth within the biomaterial Polyactive implanted in different bone locations: an experimental study in rabbits. J Mater Sci Mater Med 1998, 9, (4), 181-5. 46. Bulstra, S. K.; Geesink, R. G.; Bakker, D.; Bulstra, T. H.; Bouwmeester, S. J.; van der Linden, A. J., Femoral canal occlusion in total hip replacement using a resorbable and flexible cement restrictor. J Bone Joint Surg Br 1996, 78, (6), 892-8. 47. Kellomaki, M.; Niiranen, H.; Puumanen, K.; Ashammakhi, N.; Waris, T.; Tormala, P., Bioabsorbable scaffolds for guided bone regeneration and generation. Biomaterials 2000, 21, (24), 2495-505. 48. Kuijer, R.; Bouwmeester, S. J.; Drees, M. M.; Surtel, D. A.; Terwindt-Rouwenhorst, E. A.; Van Der Linden, A. J.; Van Blitterswijk, C. A.; Bulstra, S. K., The polymer
References
35
Polyactive as a bone-filling substance: an experimental study in rabbits. J Mater Sci Mater Med 1998, 9, (8), 449-55. 49. Li, P.; Bakker, D.; van Blitterswijk, C., The bone-bonding polymer Polyactive 80/20 induces hydroxycarbonate apatite formation in vitro. J Biomed Mater Res 1997, 34, (1), 79-86. 50. Meijer, G. J.; van Dooren, A.; Gaillard, M. L.; Dalmeijer, R.; de Putter, C.; Koole, R.; van Blitterwijk, C. A., Polyactive as a bone-filler in a beagle dog model. Int J Oral Maxillofac Surg 1996, 25, (3), 210-16. 51. Radder, A.; Leenders, H.; van Blitterswijk, C., Interface reactions to PEO/PBT copolymers (Polyactive) after implantation in cortical bone. J Biomed Mater Res 1994, 28, (2), 141-51. 52. Sakkers, R.; Dalmeyer, R.; de Wijn, J.; van Blitterswijk, C., Use of bone-bonding hydrogel copolymers in bone: an in vitro and in vivo study of expanding PEO-PBT copolymers in goat femora. J Biomed Mater Res 2000, 49, (3), 312-8. 53. van Blitterswijk, C. A.; Bakker, D.; Hesseling, S. C.; Koerten, H. K., Reactions of cells at implant surfaces. Biomaterials 1991, 12, (2), 187-93. 54. Claase, M. B.; Grijpma, D. W.; Mendes, S. C.; De Bruijn, J. D.; Feijen, J., Porous PEOT/PBT scaffolds for bone tissue engineering: preparation, characterization, and in vitro bone marrow cell culturing. J Biomed Mater Res A 2003, 64, (2), 291-300. 55. Li, P.; Bakker, D.; van Blitterswijk, C. A., The bone-bonding polymer Polyactive 80/20 induces hydroxycarbonate apatite formation in vitro. J Biomed Mater Res 1997, 34, (1), 79-86. 56. Meijer, G. J.; Dalmeijer, R. A.; de Putter, C.; van Blitterswijk, C. A., A comparative study of flexible (Polyactive) versus rigid (hydroxylapatite) permucosal dental implants. II. Histological aspects. J Oral Rehabil 1997, 24, (2), 93-101. 57. Du, C.; Klasens, P.; Haan, R.; Bezemer, J.; Cui, F.; de Groot, K.; Layrolle, P., Biomimetic calcium phosphate coatings on Polyactive 1000/70/30. J Biomed Mater Res 2002, 59, (3), 535-46. 58. Du, C.; Meijer, G. J.; van de Valk, C.; Haan, R. E.; Bezemer, J. M.; Hesseling, S. C.; Cui, F. Z.; de Groot, K.; Layrolle, P., Bone growth in biomimetic apatite coated porous Polyactive 1000PEGT70PBT30 implants. Biomaterials 2002, 23, (23), 4649-56. 59. Claase, M. B.; Olde Riekerink, M. B.; de Bruijn, J. D.; Grijpma, D. W.; Engbers, G. H.; Feijen, J., Enhanced bone marrow stromal cell adhesion and growth on segmented poly(ether ester)s based on poly(ethylene oxide) and poly(butylene terephthalate). Biomacromolecules 2003, 4, (1), 57-63. 60. Mendes, S. C.; Bezemer, J.; Claase, M. B.; Grijpma, D. W.; Bellia, G.; Degli-Innocenti, F.; Reis, R. L.; de Groot, K.; van Blitterswijk, C. A.; de Bruijn, J. D., Evaluation of Two Biodegradable Polymeric Systems as Substrates for Bone Tissue Engineering. Tissue Engineering 2003, 9, (supplement 1), 91. 61. Morris, M.; Tarnowski, C.; Timlin, J., Multivariate Raman microscopy: application to biological materials and synthetic materials. Microbeam Analysis 2000, Proceedings 2000, (165), 55-56. 62. Timlin, J.; Carden, A.; Morris, M., Chemical microstructure of cortical bone probed by Raman transects. Applied Spectroscopy 1999, 53, (11), 1429-1435.
References
36
63. Timlin, J.; Carden, A.; Morris, M.; Bonadio, J.; Hoffler, C.; Kozloff, K.; Goldstein, S., Spatial distribution of phosphate species in mature and newly generated mammalian bone by hyperspectral Raman imaging. Journal of Biomedical Optics 1999, 4, (1), 28-34. 64. Schulze, K. A.; Balooch, M.; Balooch, G.; Marshall, G. W.; Marshall, S. J., Micro-Raman spectroscopic investigation of dental calcified tissues. J Biomed Mater Res A 2004, 69, (2), 286-93. 65. Carden, A.; Rajachar, R.; Morris, M.; Kohn, D., Ultrastructural changes accompanying the mechanical deformation of bone tissue: a Raman imaging study. Calcif Tissue Int 2003, 72, (2), 166-75. 66. Akkus, O.; Adar, F.; Schaffler, M. B., Age-related changes in physicochemical properties of mineral crystals are related to impaired mechanical function of cortical bone. Bone 2004, 34, (3), 443-53. 67. Puppels, G. J.; Garritsen, H. S.; Kummer, J. A.; Greve, J., Carotenoids located in human lymphocyte subpopulations and natural killer cells by Raman microspectroscopy. Cytometry 1993, 14, (3), 251-6. 68. Puppels, G. J.; Garritsen, H. S.; Segers-Nolten, G. M.; de Mul, F. F.; Greve, J., Raman microspectroscopic approach to the study of human granulocytes. Biophys J 1991, 60, (5), 1046-56. 69. Puppels, G. J.; Olminkhof, J. H.; Segers-Nolten, G. M.; Otto, C.; de Mul, F. F.; Greve, J., Laser irradiation and Raman spectroscopy of single living cells and chromosomes: sample degradation occurs with 514.5 nm but not with 660 nm laser light. Exp Cell Res 1991, 195, (2), 361-7. 70. Notingher, I.; Jell, G.; Lohbauer, U.; Salih, V.; Hench, L. L., In situ non-invasive spectral discrimination between bone cell phenotypes used in tissue engineering. J Cell Biochem 2004, 92, (6), 1180-92. 71. Short, K. W.; Carpenter, S.; Freyer, J. P.; Mourant, J. R., Raman Spectroscopy Detects Biochemical Changes Due to Proliferation in Mammalian Cell Cultures. Biophysical Journal 2005, 4274-4288. 72. Stewart, S., Shea, D.A., Tarnowski, C.P., Morris, M.D., Wang, D., Franscheschi, R., Lin, D.L., Keller, E., Trends in early mineralization of murine calvarial osteoblastic cultures: a raman microscopic study. Journal of raman spectroscopy 2002, 33, 536-543. 73. Redey, S.; Razzouk, S.; Rey, C.; Bernache-Assollant, D.; Leroy, G.; Nardin, M.; Cournot, G., Osteoclast adhesion and activity on synthetic hydroxyapatite, carbonated hydroxyapatite, and natural calcium carbonate: relationship to surface energies. J Biomed Mater Res 1999, 45, (2), 140-7. 74. de Grauw, C. J., Otto, C., Greve, J., de Bruijn, J.D, Investigation of Bone and Calcium Phosphate Coatings, and crystallinity Determination using Raman Microspectroscopy. Cells and materials 1996, 6, (1-3), 57-62.

Characterization of PEOT PBT block copolymers by confocal Raman spectroscopy
37
Characterization of PEOT PBT block
copolymers by confocal Raman
spectroscopy

Characterization of PEOT PBT block copolymers by confocal Raman spectroscopy
38
Schematic representation of the distribution of amorphous polyethyleneglycol terephtalate (PEOT), soft block, and crystalline polybutylene terephtalate (PBT), hard block, within PEOT PBT materials. By varying the PEG molecular weight (300 or 1000 in the example), and the wt% ratio of PEOT to PBT (55/45 or 70/30 in the example), a range of polymers can be obtained with different mechanical and degradation properties. Higher PEG MW and wt% PEOT content (i.e. 1000/70/30) results not only in a decrease in material stiffness, but also in a higher degradability.

Abstract
39
Abstract
In this study the feasibility of using confocal Raman spectroscopy for the analysis of
PEOT PBT block copolymer degradation was investigated. PEOT PBT block
copolymers are thermoplastic elastomers, composed of soft hydrophilic segment
called poly ethylene glycol terephtalate (PEOT) and a hard hydrophobic segment
called poly butylene terephtalate (PBT). The material properties, i.e. stiffness,
thermal behaviour and degradability, can be tailored by either varying the
molecular weight of PEG, used for the production of these polymers and/or the
PEOT to PBT mass ratio in the polymer. PEOT PBT copolymers are currently being
used as degradable materials for the use in medicine and are sold under the brand
name Polyactive™. A number of studies have shown the good biocompatibility of
PEOT PBT made materials in vitro as well as in vivo in several different animals
varying from rats to goats. Since the unique composition of these materials allows
for the preparation of devices with a broad range of physical and biological
properties, these materials are intensively being studied for tissue engineering
applications. Several destructive chemical analysis techniques, i.e. nucleo magnetic
resonance spectroscopy, gel permeation chromatography and differential scanning
calorimetry, have been used in the past to study the degradation of these polymers.
However, when valuable morphological information is needed to examine the
effect of degradation on tissue engineering a non destructive analysis technique is
preferred. Raman spectroscopy is a non destructive molecular analysis technique
which uses a monochromatic light source for the detection of wavelength shifts
caused by chemical bond vibrations. Until now, no studies have been done on
PEOT PBT polymers by using Raman spectroscopy. Therefore it is necessary to
characterize Raman spectra obtained from these polymers, not only to gain
knowledge about their spectral properties for future analysis, but also to check the
feasibility of using this analysis technique for studying these materials. We used a
custom made confocal Raman microscope to analyze a series of different
Abstract
40
copolymer compositions and basic building blocks from which PEOT PBT
copolymers are composed in order to characterize spectra of PEOT PBT
copolymers. Furthermore, we studied the degradation of 1000 PEOT70PBT30
copolymers in a fast in vitro degradation model by using the Raman band
assignments found in this study.

Introduction
41
Characterization of PEOT PBT block copolymers by confocal Raman spectroscopy
A.A. van Apeldoorn1, J. de Wijn1, Y. Aksenov2, F.L.A.M.A. Peters3, C. Otto2, C.A.
van Blitterswijk1
1Department of Polymer Chemistry and Biomaterials, Faculty of Technology and
Sciences, University of Twente, PO Box 98, 3720AB Bilthoven, the Netherlands, 2Department of Biophysical Techniques, Faculty of Technology and Sciences,
University of Twente, PO Box 217, 7500AE Enschede, The Netherlands, Isotis NV,
PO Box 98, 3720AB Bilthoven, The Netherlands
Introduction
Degradation of (bio)materials is especially important in tissue engineering, the
general accepted idea is that the ideal tissue engineering scaffold is composed of a
degradable material which can support cells and/or tissue in such a way that
suitable time is left to heal a defect effectively, while the (bio)material is replaced
by newly formed tissue. Techniques by which degradation can be studied non-
destructively are preferred because valuable histological information remains,
which can provide valuable information about morphologic changes. Raman
spectroscopy uses a monochromatic light source to study molecular vibrations, thus
providing specific information about chemical bonds in a non invasive manner.
Raman spectroscopy is based on the Raman effect, which is the inelastic scattering
of photons by molecules. The energy of the scattered radiation is less or more than
the incident radiation. Moreover, the energy increase or decrease from the
excitation is related to the vibrational energy spacing in the ground electronic state
of a molecule. Therefore, the wavenumbers in Raman spectra are a direct measure
of the vibrational energies of the chemical bonds in a molecule thus allowing for
molecular analysis. A major part of the (bio)materials used in tissue engineering are
Materials and methods
42
composed of synthetic polymers. Polymers enable the design of scaffolds for tissue-
engineering with different mechanical and biological properties and degradation
rates depending on the requirements of their application. The physical and
chemical properties have to be tailored in such a way that these meet the demands
of the implant site. Thermoplastic elastomeres composed of polyethylene oxide
terephtalate (PEOT) and polybutylene-terephtalate (PBT) have been studied
extensively to be used as a biomaterial1-6 for tissue engineering applications. The
polymer is a block copolymer composed of a hard PBT block and a soft hydrophilic
PEOT block. The soft to hard block ratio and the molecular weight of
polyethyleglycol (PEG) can be varied to change elasticity, swelling and degradation
of the material. The use of several different compositions of PEOT PBT polymers
has been studied in relation to bone healing7-10, cartilage repair11-15, design of
material composites16, 17, skin wound repair18-22 and even as a tissue engineering
scaffold for artificial fish skin23. As no studies have been performed on PEOT PBT
polymers by Raman spectroscopy in the past, it is necessary to characterize Raman
spectra obtained from these polymers, in order to gain knowledge about their
spectral properties for future analysis, and to check the feasibility of using this
analysis technique for studying these materials as well. We have used a custom
made confocal Raman microscope to analyze a series of different copolymer
compositions and basic building blocks from which PEOT PBT copolymers are
composed in order to characterize spectra of PEOT PBT copolymers. Furthermore
we studied the degradation of 1000 PEOT70PBT30 copolymers in a fast in vitro
degradation model by using the Raman band assignments found in this study.
Materials and methods
The materials used in this study were either compression molded blocks (in case of
block copolymers) or pure chemicals. The copolymers are composed of
Polyethylene oxide terephtalate (PEOT) and poly butylene terephtalate (PBT) (see

Degradation
43
figure 1). The initial length of the polyethylene oxide (PEG) segment can be varied,
as can be the molar ratio of the PEOT to PBT segments. The composition is
denoted as a / b / c, where a represents the poly(ethylene glycol) (PEG) molecular
weight (MW g/mol), and b and c represent the weight percentage (wt%) of PEGT
and PBT blocks respectively.
Figure 1: Molecular formula of PEOT PBT block copolymers.
Reference Raman spectra from different polymer compositions and their building
blocks were generated by using confocal Raman spectroscopy on dense blocks or
gels (in case of Polyethylene glycol). The following pure chemicals were measured:
Dimethyl terephtalate (DMT), Polybutylene terephtalate, Polyethyleneglycol (m.w.
1000) (PEG). In addition, a range of different copolymer compositions, as depicted
in table 1, were measured in order to gain insight into band positions.
Table 1: PEOT PBT block copolymer compositions used for analysis
Degradation
In vitro fast degradation was carried out with 1000/70/30 material in Borax buffer,
pH 10 at 50 ºC. The samples were incubated for 0, 1, 2, 3, 10, 14, 21, 28 and 42
Polymer type (x/PEOTa/PBTb) Specifications (mw and mass-ratio)
300/80/20 PEG mw 300, PEOT:PBT=8:2
600/80/20 PEG mw 600, PEOT:PBT=8:2
1000/80/20 PEG mw 1000, PEOT:PBT=8:2
4000/30/70 PEG mw 4000, PEOT:PBT=3:7
4000/55/45 PEG mw 4000, PEOT:PBT=5,5:2,5
4000/80/20 PEG mw 4000, PEOT:PBT=8:2
10000/80/20 PEG mw 10000, PEOT:PBT=8:2

Results
44
days, after which they were analyzed by Raman spectroscopy and gel permeation
chromatography (GPC).
Confocal Raman spectroscope
We used a in house build confocal Raman spectroscope, which was integrated with
a scanning electron microscope (Philips XL-30 FEG). The system operates as follows;
a collimated and circularly symmetrical beam from a diode laser (LD) with a
frequency of 685nm is reflected by a dichroïc beam splitter (BS) into the vacuum
chamber of the SEM through a coupling window (CW). The beam is then focused
by a 60X objective(MO), na=0.65, on a sample of interest. The excited Raman
scattering is collected by the same objective and the Stokes components of Raman
frequencies pass through the BS and a notch filter (NF), which blocks photons with
the initial laser wavelength. Subsequently, the scattering is focussed by a small lens
on a pinhole (∅ 25 μm) allowing for confocality of the system. The scattering is
then collected in a spectrograph-monochromator where the incoming light is
decomposed by a concave holographic diffraction grating and focused on a
thermo-electrically cooled CCD (1056x256 pixels, Princeton Instruments Spec10).
The theoretical spatial resolution of the system is ~700nm with an effective laser
power of around 6mW on the sample. The CCD is connected with a computer for
data collection and analysis using WinSpec (Roper Scientific Inc., USA) and
Microcal Origin (Microcal software inc., USA) data analysis software.
Results
Raman spectra were collected of the building blocks of the block copolymer to
have a reference for the active Raman bands present in these molecules. The
collected spectra of PBT, poly(ethylene glycol) (PEG) and dimethyltherephtalate
(DMT) show several prominent bands which are summarized in table 2. The
average spectrum of the 3 components was also calculated and is very similar to
the spectra of the actual block copolymer (see figure 2).

Results
45
Raman shift (cm-1) Group assignment Ref.
630 aromatic 35
705 υ aromatic ring 35
800 υ aromatic C-H out of plane, rCH2 36, 37
845 rCH2, gauche-trans-gauche glycol, C-C aromatic 24, 36
888-890 rCH2, υ CO(vw) 36-38
964
1045 υ CO, rCH2, υ C-C in PEG 36
1107
1180
1285 tCH2, υ C-H 24, 36
1310
1400-1480 srCH2, υ C-H 24, 36
1620 υ C=C aromatic ring 39
1725 υ C=O 40
Table 2: Molecular group assignments of Raman bands present in PEOT PBT spectra.
Figure 2: Raman spectra of PBT, PEG and DMT and the resultant average spectrum of the three spectra.

Results
46
In figure 3 one can observe that the spectra obtained from block copolymers with
similar mass ratio (PEOT:PBT=80:20) composition, but with different mw of the
PEG component, show an increase in intensity of Raman bands specific for PEO at
840-850 cm-1 (skeleton vibrations24), 1050-1120 cm-1 (mainly CH2 vibrations),
1230-1280 cm-1 (C-H and CH2 vibrations) and 1430-1480 cm-1 (CH2 and C-H
vibrations).
Figure 3: Raman spectra of PEOT PBT block copolymers with similar mass ratio but different molecular weight of PEG.
One has to keep in mind that the intensity of the Raman band at 1620 cm-1
belonging to the aromatic ring group, a fairly constant moiety in the polymer, was
set at 100% to have a fair comparison between the different polymer compositions.
Interestingly, the polymers with a PEG molecular weight of 300 to 1000, do not
appear to show big spectral differences in their respective spectra, only around
1050-1120 cm-1 and the shoulder around 1230 cm-1, which belong mainly to C-H
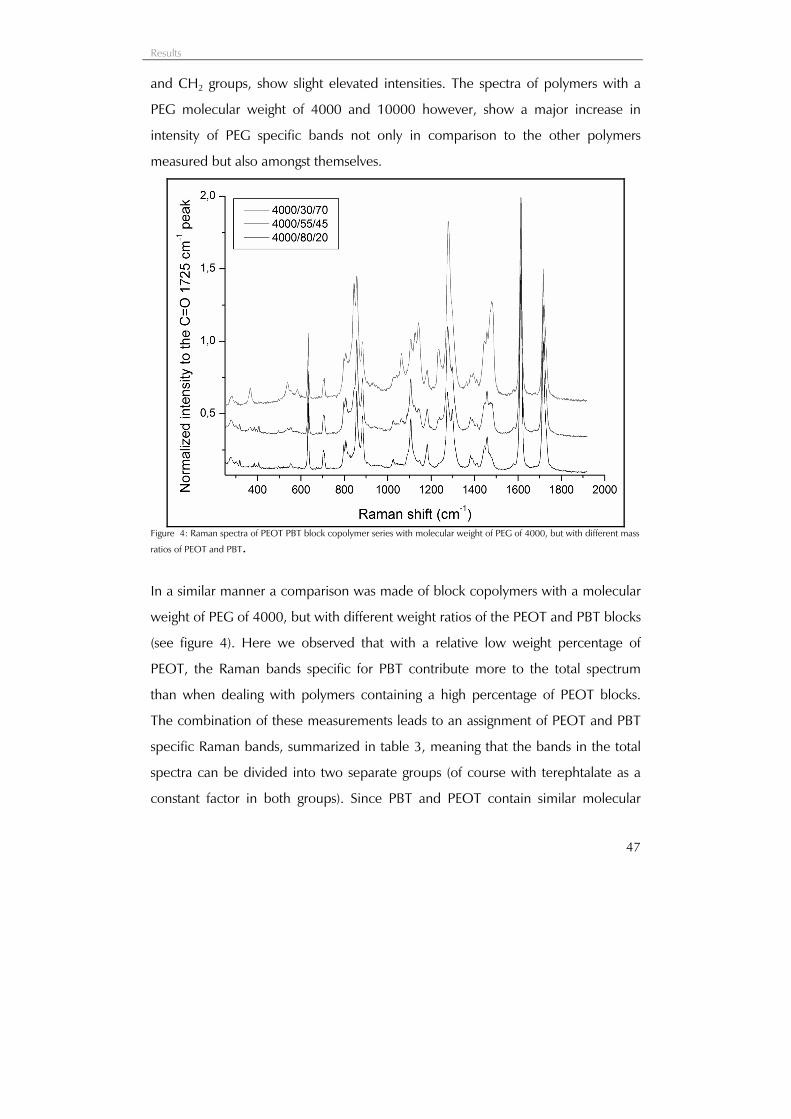
Results
47
and CH2 groups, show slight elevated intensities. The spectra of polymers with a
PEG molecular weight of 4000 and 10000 however, show a major increase in
intensity of PEG specific bands not only in comparison to the other polymers
measured but also amongst themselves.
Figure 4: Raman spectra of PEOT PBT block copolymer series with molecular weight of PEG of 4000, but with different mass
ratios of PEOT and PBT.
In a similar manner a comparison was made of block copolymers with a molecular
weight of PEG of 4000, but with different weight ratios of the PEOT and PBT blocks
(see figure 4). Here we observed that with a relative low weight percentage of
PEOT, the Raman bands specific for PBT contribute more to the total spectrum
than when dealing with polymers containing a high percentage of PEOT blocks.
The combination of these measurements leads to an assignment of PEOT and PBT
specific Raman bands, summarized in table 3, meaning that the bands in the total
spectra can be divided into two separate groups (of course with terephtalate as a
constant factor in both groups). Since PBT and PEOT contain similar molecular

Degradation study
48
groups, contributions of both blocks to the total spectrum can be found at the same
band position.
Raman band
position (cm-1)
Copolymer moiety
assignment
635 PBT, PEOT
708 PBT, PEOT
800 PBT, DMT
843 PEOT
859 PBT
888 PBT
1008 PBT
1106 PBT
1126 PEOT
1062 PEOT
1142 PEOT
1179 PBT
1232 PEOT
1279 PEOT
1300 PBT
1448 PBT, PEO
1465 PBT
1478 PEOT
1620 PBT, PEOT
1724 PBT, PEOT
Table 3: Raman band assignments of the PEOT and PBT block in PEOT PBT block copolymers.
Degradation study
As a model for fast in vitro degradation, samples of composed of 1000/70/30
polymers were incubated in Borax, pH 10 at 50ºC, in order to simulate fast
degradation in a short time span. The samples were observed at 0, 1, 2, 3, 10, 14,
21, 28 and 42 days after incubation (figure 5). Raman spectroscopy revealed that
the intensity of the Raman band around 1280 cm-1 decreases in time while the
band at 1300 cm-1 remains approximately the same. Another interesting trend
occurring is that the shape of the Raman band around 1450 cm-1 seems to become
more sharper in time, indicative of a decrease in intensity of bands around this
frequency since this a band composed of several active Raman frequencies.

Degradation study
49
Figure 5: Raman spectra of in vivo implanted 1000/70/30 samples explanted at different time points.
Furthermore, the shape of the peak around 1100 cm-1 seems to slightly become
more narrow, especially on the left hand side, indicating a decrease in intensity of a
shoulder band around this position. In order to gain more knowledge of the
differences observed, the spectra of non-degraded material (day 0) and degraded
material (day 42) were subtracted from each other (after scaling to 1620 cm-1).
After subtraction, the resultant was smoothed using 10 point adjacent averaging to
show only the major differences. Comparison of this data with spectra of PEG and
PBT showed that after degradation bands specific for PEG have decreased,
indicated by the negative intensities, implying a decrease in PEG content in these
polymers (figure 6).

Discussion
50
Figure 6: Comparison of Raman spectra of 1000/70/30 material before and after implantation (left panel). Raman spectra of PBT and PEG (top right panel). Difference spectrum of 1000/70/30 polymer (lower right panel) showing the intensity decrease of bands mainly belonging to PEO (under the x-axis) and bands belonging to mainly PBT (above the x-axis) after 42 days of implantation.
GPC
The relative molecular weight of the degraded polymer series was determined by
GPC at each time point. The relative molecular weight, as can be observed in figure
5, has decreased to a plateau already after one week of degradation, according to
an exponential decay model. Indicating that loss of PEO mainly occurs during the
first week of fast in vitro degradation in our experimental model.
Discussion
Evaluation of Raman data
The use of polymers for tissue engineering has a direct influence on the properties
of these materials. Depending on their use their physical and chemical properties
have to be modified in such a manner that these meet the demands of the implant

Discussion
51
location. Polyactive™ a poly(ether ester) copolymer composed of PEOT and PBT,
has been studied in the past for its use in medicine. PEOT/PBT block copolymers
have been investigated for their biocompatibility in vivo and no adverse tissue
reactions have been observed after subcutaneous implantation studies in Goats19, 25,
rabbits10 and rats3. Cell adhesion, proliferation as well as differentiation of different
cell types on these materials were found to be good especially after plasma
treatment1, 2, 26, 27. These poly(ether ester) copolymers can therefore be good
candidates for scaffolds used in soft28 and hard tissue engineering29, 30.
Figure 7: Change in the molecular weight of 1000/70/30 blockcopolymers in time after fast in vitro degradation in Borax at pH 10 and 50 ºC
A prerequisite for biomaterials in tissue engineering is that they should be
degradable so that the implanted material is gradually replaced in time by native
tissue after implantation. In this study confocal Raman spectroscopy was used to

Discussion
52
study PEOT/PBT block polymers in general and the degradation of 1000/70/30
block copolymers in a fast in vitro degradation model in more detail. In order to
determine which Raman bands are specific for which molecular groups in the
polymer spectra, measurements of the basic building block were taken and
compared to the actual polymers. In figure 1 the average spectrum of PEG, PBT
and DMT shows great similarity with the spectra from the different polymer
compositions depicted in figure 3. We conclude that one can consider these
polymers as being build up of separate molecular groups belonging to either PBT
and/or PEO. The data obtained from the polymer series where the weight ratio of
PEOT and PBT is kept equal (8:2), but the molecular weight of PEG is varied from
300-10000 g/mole (figure 3) clearly show an increase in intensity of PEO specific
Raman bands at higher MW, which further supports our conclusion. Based on
these results and what has been published by others on similar polymers,
assignments of the different Raman bands could be made (a summary can be found
in table 2). Moreover, we observed that Raman bands specific for PEG at 840-850
cm-1 (skeleton vibrations24), 1050-1120 cm-1 (mainly CH2 vibrations), 1230-1280
cm-1 (C-H and CH2 vibrations) and 1430-1480 cm-1 (CH2 and C-H vibrations)
increase in intensity with increase of the molecular weight of PEG. Likewise, the
intensity of these bands increases dramatically in polymers where the molecular
weight of PEG is 4000 and higher. This is probably indicative of the increasing
importance of the contribution of the PEO group vibrations to the total spectrum,
caused by the fact that the chain length of PEO in these materials becomes very
long (increase in the number of CH2 groups) and therefore the skeletal vibrations
become more important in these spectra, of these polymers. The clear increase in
intensity of the band around 840-850 cm-1 specific for skeleton vibrations supports
this finding.

Discussion
53
Results obtained from polymers with molecular weight of PEG of 4000, but with
different weight ratios of PEOT/PBT (figure 4) showed that the bands in the spectra
can be divided into two separate groups, summarized in table 3, one belonging to
the soft block and one to the hard block. The assignments made here are similar to
what van Loon et al.31 found when studying PEOT PBT copolymers after
intramuscular implantation in goats for 1 year by confocal Raman spectroscopy.
Difficulty in the interpretation of these bands is that overlap of certain Raman band
assigned to PBT or PEOT is caused by the fact that both groups contain similar
molecular groups. These bands are mainly caused by similar C-H and CH2
vibrations present in both blocks and which can therefore be found at similar wave
number positions.
Degradation
PEOT/PBT polymers can undergo degradation through hydrolysis an oxidation,
which was established after using in vitro experiments32. The main process for
degradation of these polymers in vivo, seems to be hydrolysis, although many
macrophage like cells, known for their ability to produce oxidative reagents, can be
seen surrounding these materials after implantation33. The fact that hydrolysis
seems to be the main driving factor during degradation of these polymers, a
decrease in intensity of bands belonging to the PEO group can be expected and
our findings seem to concur this. The GPC results show a rapid decrease of the
molecular weight, from approximately 1.4 E 5 to 2E4 g/mole, already after the first
week of our in vitro degradation experiment. This steep decline levels of after one
week to a plateau decreasing at much lower rate. In a comparable study these
polymers were found to degrade in a similar way, be it much slower, when they
were immersed in PBS at 37 ºC for 37 days reaching the plateau after 20 days at
2.8E4 g/mole34. After degradation the samples became more and more brittle
depending on the time point of observation, until the polymer samples had fallen

Discussion
54
apart completely after 42 days. This is similar to results published elsewhere33
where we submersed the same material for 14 days, at 100 ºC in phosphate
buffered saline. These results suggest that mainly the soft segment and PEO content
is reduced during degradation. The Raman data shown in figures 5 and 6 confirm
these findings. These spectra show decrease of intensity of certain PEO Raman
bands, indicating a possible loss of PEO specific molecular groups. The resultant
after subtraction of the spectra of untreated material from the 42 days degraded
material, clearly shows that PEO specific bands, around 850 cm-1, 1100-1150 cm-1,
1250 and 1300 cm-1, and at 1440-1480 cm-1, have decreased to some extent as
they appear as negative bands beneath the x-axis. When comparing the Raman
spectra of the different time points the intensity of the PEOT specific band around
1280cm-1 appear to decrease during prolonged degradation. The negative trend
becomes apparent after 14 days of degradation, which might indicate that only
after a longer period of incubation a loss of PEO content can be found. The
abovementioned observation is in contrast with the GPC data, which show a rapid
decrease of molecular weight already in the first week of degradation (figure 7). A
possible explanation for this could be that Raman spectra are a representation of all
the molecular groups present in the material. The PBT and PEOT segments in these
materials contain similar chemical bonds and a decrease of soft segment content
does apparently not show up immediately in this data. A possible reason for this
could be that PEO chains, which are scissioned from the block copolymer, stay
confined in the bulk material and only after longer time have had the ability to
diffuse out of the bulk material. The Raman spectra shown in figure 2 more or less
confirms this hypothesis as the average spectrum of PEG, PBT and DMT shows a
Raman spectrum very much similar to the actual spectrum of the block copolymer.
This indicates that although these polymers can be seen as composed of two
separate blocks, a mixture of the building blocks without any chemical bond
between them also shows a spectrum equal to the Raman spectrum of the actual

Conclusions
55
block copolymer. As a result differences between the spectra of polymers when
PEG has a molecular weight of 300-1000 are not only very small, a chain scission
caused by degradation, either through hydrolysis or oxidation, can not very well be
detected as well. In addition the heat of fusion and melting temperature of the
PBT segment from PEOT PBT block copolymers were found to have increased after
in vitro and in vivo degradation studies33 indicating that crystallinity of these had
increased because of degradation. The positive bands specific for PBT observed in
figure 6 are likely to be a result of this increase in crystallinity of these polymers.
Raman bands will become sharper and increase in intensity with increasing
crystallinity of materials. The reason for this is that chemical bonds in crystalline
materials are more constricted in their movements, meaning the molecular
vibrations will be more restrained than when dealing with more amorphous
materials. As a result a narrowing and increase in intensity of Raman bands can be
observed.
Conclusions
The differences between degradaded and non degradaded samples in the Raman
spectra found in this study are caused by a combination of changes in crystallinity
and a loss of PEO from these polymers. Raman spectroscopy can be used to
evaluate PEOT/PBT block copolymers mainly in a qualitative manner because of
the similarity in molecular composition of the soft and hard block. The loss of PEO
content observed in this study confirms the results found by others on the
degradation of these polymers. The use of Raman spectroscopy for future in vivo
degradation studies could provide information whether these polymers degrade in
a similar manner or that the presence of macrophages, actively involved in the
uptake and removal of implanted materials, leads to different degradation
behaviour.

References
56
References
1. Claase, M. B.; Grijpma, D. W.; Mendes, S. C.; De Bruijn, J. D.; Feijen, J., Porous PEOT/PBT scaffolds for bone tissue engineering: preparation, characterization, and in vitro bone marrow cell culturing. J Biomed Mater Res A 2003, 64, (2), 291-300. 2. Claase, M. B.; Olde Riekerink, M. B.; de Bruijn, J. D.; Grijpma, D. W.; Engbers, G. H.; Feijen, J., Enhanced bone marrow stromal cell adhesion and growth on segmented poly(ether ester)s based on poly(ethylene oxide) and poly(butylene terephthalate). Biomacromolecules 2003, 4, (1), 57-63. 3. Beumer, G. J.; van Blitterswijk, C. A.; Ponec, M., Biocompatibility of a biodegradable matrix used as a skin substitute: an in vivo evaluation. J Biomed Mater Res 1994, 28, (5), 545-52. 4. Grote, J. J.; Bakker, D.; Hesseling, S. C.; van Blitterswijk, C. A., New alloplastic tympanic membrane material. Am J Otol 1991, 12, (5), 329-35. 5. Meijer, G. J.; Heethaar, J.; Cune, M. S.; De Putter, C.; Van Blitterswijk, C. A., Flexible (Polyactive) versus rigid (hydroxyapatite) dental implants. Int J Oral Maxillofac Surg 1997, 26, (2), 135-40. 6. van Blitterswijk, C. A.; Bakker, D.; Hesseling, S. C.; Koerten, H. K., Reactions of cells at implant surfaces. Biomaterials 1991, 12, (2), 187-93. 7. Bulstra, S. K.; Geesink, R. G.; Bakker, D.; Bulstra, T. H.; Bouwmeester, S. J.; van der Linden, A. J., Femoral canal occlusion in total hip replacement using a resorbable and flexible cement restrictor. J Bone Joint Surg Br 1996, 78, (6), 892-8. 8. Du, C.; Meijer, G. J.; van de Valk, C.; Haan, R. E.; Bezemer, J. M.; Hesseling, S. C.; Cui, F. Z.; de Groot, K.; Layrolle, P., Bone growth in biomimetic apatite coated porous Polyactive 1000PEGT70PBT30 implants. Biomaterials 2002, 23, (23), 4649-56. 9. Sakkers, R.; Dalmeyer, R.; de Wijn, J.; van Blitterswijk, C., Use of bone-bonding hydrogel copolymers in bone: an in vitro and in vivo study of expanding PEO-PBT copolymers in goat femora. J Biomed Mater Res 2000, 49, (3), 312-8. 10. Kuijer, R.; Bouwmeester, S. J. M.; Drees, M. M. W. E.; Surtel, D. A. M.; Terwindt-Rouwenhorst, E. A. W.; van der Linden, A. J.; van Blitterswijk, C. A.; Bulstra, S. K., The polymer Polyactive as a bone-filling substance: an experimental study in rabbits. Journal of Materials Science: Materials in Medicine 1998, 9, (8), 449-55. 11. Malda, J.; Woodfield, T. B.; van der Vloodt, F.; Kooy, F. K.; Martens, D. E.; Tramper, J.; van Blitterswijk, C. A.; Riesle, J., The effect of PEGT/PBT scaffold architecture on oxygen gradients in tissue engineered cartilaginous constructs. Biomaterials 2004, 25, (26), 5773-80. 12. Malda, J.; Woodfield, T. B.; van der Vloodt, F.; Wilson, C.; Martens, D. E.; Tramper, J.; van Blitterswijk, C. A.; Riesle, J., The effect of PEGT/PBT scaffold architecture on the composition of tissue engineered cartilage. Biomaterials 2005, 26, (1), 63-72. 13. Miot, S.; Woodfield, T.; Daniels, A. U.; Suetterlin, R.; Peterschmitt, I.; Heberer, M.; van Blitterswijk, C. A.; Riesle, J.; Martin, I., Effects of scaffold composition and architecture on human nasal chondrocyte redifferentiation and cartilaginous matrix deposition. Biomaterials 2005, 26, (15), 2479-89. 14. Woodfield, T. B.; Bezemer, J. M.; Pieper, J. S.; van Blitterswijk, C. A.; Riesle, J., Scaffolds for tissue engineering of cartilage. Crit Rev Eukaryot Gene Expr 2002, 12, (3), 209-36. 15. Woodfield, T. B.; Malda, J.; de Wijn, J. R.; Peters, F.; Riesle, J.; van Blitterswijk, C. A., Design of porous scaffolds for cartilage tissue engineering using a three-dimensional fiber-deposition technique. Biomaterials 2004, 25, (18), 4149-61. 16. Du, C.; Klasens, P.; Haan, R.; Bezemer, J.; Cui, F.; de Groot, K.; Layrolle, P., Biomimetic calcium phosphate coatings on Polyactive 1000/70/30. J Biomed Mater Res 2002, 59, (3), 535-46.

References
57
17. Liu, Q.; de Wijn, J.; van Blitterswijk, C., Composite biomaterials with chemical bonding between hydroxyapatite filler particles and PEG/PBT copolymer matrix. J Biomed Mater Res 1998, 40, (3), 490-7. 18. AG, v. D.; Verhoeven, M.; Koerten, H.; van, B. C.; Ponec, M., Bilayered biodegradable poly(ethylene glycol)/poly(butylene terephthalate) copolymer (Polyactive) as substrate for human fibroblasts and keratinocytes. J Biomed Mater Res 1999, 47, (3), 292-300. 19. Beumer, G.; van, B. C.; Ponec, M., Biocompatibility of a biodegradable matrix used as a skin substitute: an in vivo evaluation. J Biomed Mater Res 1994, 28, (5), 545-52. 20. Beumer, G. J.; van Blitterswijk, C. A.; Bakker, D.; Ponec, M., A new biodegradable matrix as part of a cell seeded skin substitute for the treatment of deep skin defects: a physico-chemical characterisation. Clin Mater 1993, 14, (1), 21-7. 21. van Dorp, A. G.; Verhoeven, M. C.; Koerten, H. K.; van Blitterswijk, C. A.; Ponec, M., Bilayered biodegradable poly(ethylene glycol)/poly(butylene terephthalate) copolymer (Polyactive) as substrate for human fibroblasts and keratinocytes. J Biomed Mater Res 1999, 47, (3), 292-300. 22. van Dorp, A. G.; Verhoeven, M. C.; Koerten, H. K.; Van Der Nat-Van Der Meij, T. H.; Van Blitterswijk, C. A.; Ponec, M., Dermal regeneration in full-thickness wounds in Yucatan miniature pigs using a biodegradable copolymer. Wound Repair Regen 1998, 6, (6), 556-68. 23. Pouliot, R.; Azhari, R.; Qanadilo, H. F.; Mahmood, T. A.; Triantafyllou, M. S.; Langer, R., Tissue engineering of fish skin: behavior of fish cells on poly(ethylene glycol terephthalate)/poly(butylene terephthalate) copolymers in relation to the composition of the polymer substrate as an initial step in constructing a robotic/living tissue hybrid. Tissue Eng 2004, 10, (1-2), 7-21. 24. Kozielski, M.; Muhle, M.; Blaszczak, Z., The Raman scattering study of selected polyoxyethyleneglycols. 2004, 111, (1-3), 1. 25. Jansen, J. A.; de Ruijter, J. E.; Janssen, P. T.; Paquay, Y. G., Histological evaluation of a biodegradable Polyactive/hydroxyapatite membrane. Biomaterials 1995, 16, (11), 819-27. 26. Mendes, S. C.; Bezemer, J.; Claase, M. B.; Grijpma, D. W.; Bellia, G.; Degli-Innocenti, F.; Reis, R. L.; de Groot, K.; van Blitterswijk, C. A.; de Bruijn, J. D., Evaluation of two biodegradable polymeric systems as substrates for bone tissue engineering. Tissue Eng 2003, 9 Suppl 1, S91-101. 27. Papadaki, M.; Mahmood, T.; Gupta, P.; Claase, M.; Grijpma, D.; Riesle, J.; van Blitterswijk, C.; Langer, R., The different behaviors of skeletal muscle cells and chondrocytes on PEGT/PBT block copolymers are related to the surface properties of the substrate. J Biomed Mater Res 2001, 54, (1), 47-58. 28. Xiao, Y. L.; Riesle, J.; van Blitterswijk, C. A., Static and dynamic fibroblast seeding and cultivation in porous PEO/PBT scaffolds. Journal of Materials Science: Materials in Medicine 1999, 10, (12), 773. 29. Deschamps, A. A.; Claase, M. B.; Sleijster, W. J.; de Bruijn, J. D.; Grijpma, D. W.; Feijen, J., Design of segmented poly(ether ester) materials and structures for the tissue engineering of bone. J Control Release 2002, 78, (1-3), 175-86. 30. Radder, A.; Leenders, H.; van, B. C., Application of porous PEO/PBT copolymers for bone replacement. J Biomed Mater Res 1996, 30, (3), 341-51. 31. van Loon, J. A. Biocompatibilty testing of degradable polymers. Dissertation, Leiden University, Leiden, 1995. 32. Deschamps, A.; Grijpma, D.; Feijen, J., Poly(ethylene oxide)/poly(butylene terephthalate) segmented block copolymers: the effect of copolymer composition on physical properties and degradation behavior. Polymer 2001, 42, (23), 9335-9345. 33. Deschamps, A.; van Apeldoorn, A.; Hayen, H.; de Bruijn, J.; Karst, U.; Grijpma, D.; Feijen, J., In vivo and in vitro degradation of poly(ether ester) block copolymers based on poly(ethylene glycol) and poly(butylene terephthalate). Biomaterials 2004, 25, (2), 247-258.

References
58
34. Bezemer, J.; Grijpma, D.; Dijkstra, P.; van Blitterswijk, C.; Feijen, J., A controlled release system for proteins based on poly(ether ester) block-copolymers: polymer network characterization. Journal of controlled release 1999, 62, (3), 393-405. 35. Fernandez, M.; Merino, J.; Pastor, J., Injection molding of poly(ethylene terephthalate): Differential Scanning Calorimetry and Confocal Micro-Raman Spectroscopy investigations of the skin-core morphology. Polymer engineering and science 2000, 40, (1), 95-107. 36. Di Noto, V.; Zago, V.; Biscazzo, S.; Vittadello, M., Hybrid inorganic-organic polymer electrolytes: synthesis, FT-Raman studies and conductivity of {Zr[(CH2CH2O)8.7][rho]/(LiClO4)z}n network complexes. 2003, 48, (5), 541. 37. Mak, C. L.; Wong, Y. W.; Chan, W. N., Application of Raman spectroscopy to determine the strain-level in polybutylene terephthalate (PBT). 1998, 17, (6), 451. 38. Ellis, G.; Roman, F.; Marco, C.; Gomez, M. A.; Fatou, J. G., FT Raman study of orientation and crystallization processes in poly(ethylene terephthalate). 1995, 51, (12), 2139. 39. Lesko, C. C. C.; Rabolt, J. F.; Ikeda, R. M.; Chase, B.; Kennedy, A., Experimental determination of the fiber orientation parameters and the Raman tensor of the 1614 cm-1 band of poly(ethylene terephthalate). 2000, 521, (1-3), 127. 40. Pellow-Jarman, M. V.; Hendra, P. J.; Hetem, M. J. J., Poly(butylene terephthalate) polycarbonate transesterification: monitoring its progress with Fourier transform Raman spectroscopy. 1995, 51, (12), 2107.

In vivo degradation of PEOT PBT block copolymers evaluated by confocal Raman microscopy
59
In vivo degradation of PEOT PBT block
copolymers evaluated by confocal
Raman microscopy

In vivo degradation of PEOT PBT block copolymers evaluated by confocal Raman microscopy
60
After implantation of block copolymers composed of polyethylene oxide
terephtalate and polybutylene-terephtalate. Certain compositions show fast
degradation, especially the materials were the molecular weight of polyethylene
glycol is 1000 9/mole and higher. In many occasions so called giant cells, which are
fused macrophages, can be found surrounding polymer fragments (A and B) and
macrophages containing small polymer fragments (D). An interesting feature of this
material is that it can mineralise in vivo, which is thought to enhance the bone
bonding capability of this material, which appears as dark purple granulated regions
in the polymer (C).

Abstract
61
Abstract
Synthetic polymers comprise a large number of the (bio)materials used for tissue
engineering applications. One of the major advantages of using polymers is that
they enable the design of scaffolds for tissue-engineering with different mechanical
and biological properties and degradation rates depending on the requirements for
their application. Block copolymers composed of polyethylene oxide terephtalate
(PEOT) and polybutylene-terephtalate (PBT) are thermoplastic elastomeres which
have been studied extensively for their utility as a biomaterial in tissue engineering.
In order to sustain scaffold structure after implantation, which allows for the
observation of structural changes and tissue reactions to the implant, techniques by
which degradation can be studied in a non-destructive manner are preferred. In
this manner important chemical information can be studied whilst in the same time
the scaffold morphology is preserved. One of the techniques which can be used for
non-destructive analysis is Raman spectroscopy. We have investigated the feasibility
of using confocal Raman spectroscopy for the analysis of in vivo degradaded PEOT
PBT polymers. As a simulation model for degradation we analyzed
300PEOT55PBT45, 300PEOT70PBT30 and 1000PEOT70PBT30 copolymers after
submersion for 14 days in PBS at 100 ºC in order to evaluate the spectra obtained
here with the spectra obtained after subcutaneous implantation. Only for
1000PEOT70PBT30 polymer discs clear signs of degradation could be detected, by
a loss in PEOT content, while for 300PEOT70PBT30 and 300PEOT55PBT45 no
change in composition was found after 12 weeks of implantation. Additionally,
histology revealed that macrophage-like cells clearly play an active role in the
removal of these materials through phagocytosis and possible further degradation of
polymer fragments. Furthermore, Raman and histological data revealed that
mineralized spots start to appear already after 4 weeks of subcutaneous
implantation in 2 of the 3 different polymer compositions observed which is
comparable to previous studies done by others on these materials.

Introduction
62
In vivo degradation of PEOT PBT block copolymers evaluated by confocal Raman
microscopy
A.A. van Apeldoorn1, J. de Wijn1, Y. Aksenov2, A.A. Deschamps1, F.L.A.M.A.
Peters3, , J.D. de Bruijn1, C. Otto2, C.A. van Blitterswijk1
1Department of Polymer Chemistry and Biomaterials, Faculty of Technology and
Sciences, University of Twente, PO Box 98, 3720AB Bilthoven, the Netherlands, 2Department of Biophysical Techniques, Faculty of Technology and Sciences,
University of Twente, PO Box 217, 7500AE Enschede, The Netherlands, Isotis NV,
PO Box 98, 3720AB Bilthoven, The Netherlands
Introduction
Materials applied for tissue replacement in tissue engineering are frequently
composed of materials which are degradable. The conventional idea is that the
optimal tissue engineering scaffold should be composed of a degradable material
which can sustain cells or tissue in such a way that sufficient time is left to repair a
defect, while in the same time the material is exchanged by native tissue. The
selection of material properties is to a great extent influenced by the location of the
implant site. Depending on the location the physical and chemical properties of
materials have to be customized in such a way that these meet the mechanical and
physiological demands of the implant site. Thermoplastic materials, such as
Polyactive™, a block copolymer composed of a hard hydrophobic polybutylene
therephtalate (PBT) block and a soft hydrophilic poly ethylene glycol therephatalate
(PEOT) block, have been extensively studied as a material for tissue engineering
applications. The advantage of using such a polymer is that its properties can be
tailored, by not only varying the soft to hard block ratio, but the molecular weight
of poly ethylene glycol (PEO) as well, in order to change elasticity, water uptake
Introduction
63
and degradability of the material. PEOT PBT block copolymers are thought to
degrade through hydrolysis of the ester bond and to a smaller extent oxidation of
the ether bond present in these polymers1. PEOT PBT polymers were the molecular
weight of polyethyleneglycol is 300 g/mole and the mass ratio of the soft versus the
hard block is equal to 55:45 have been used in studies related to cartilage2-4 and
skin repair5-7 because of their optimal elastic properties. In addition, copolymers
were the molecular weight of PEG is 1000 g/mole and the mass ratio of PEOT and
PBT is 70:30 have been extensively studied for use as bone fillers8-11 and material
for dental implants12 because of their tissue interaction. Moreover, interesting
properties of these copolymers are that, depending on their composition, they can
not only have bone bonding capacity13, but have the ability to mineralize as well14,
15. In the past these materials were studied by using destructive chemical analysis
techniques, such as nuclear magnetic resonance spectroscopy, gel permeation
chromatography and differential scanning calorimetry, which do not allow for the
observation of morphological changes during degradation studies. Techniques by
which degradation can be studied in a non-destructive manner are preferred
because valuable chemical information can be studied while in the same time the
scaffold structure is preserved. One of the techniques which can be used for non-
destructive analysis is Raman spectroscopy. Raman spectroscopy is based on
inelastic scattering of photons by molecules16. The energy of the scattered radiation
can be less or more than the incident radiation. The energy increase, or decrease,
from the excitation is related to the vibrational energy spacing in the ground
electronic state of a molecule. Therefore, the wavenumbers in Raman spectra are a
direct measure of the vibrational energies of the chemical bonds in a molecule.
Since Raman spectroscopy uses a monochromatic light (Laser) source to study
molecular vibrations, it allows for chemical analysis in a non-destructive manner. In
this study we investigated the feasibility of using confocal Raman spectroscopy for
the study of in vivo degradaded PEOT PBT polymers by characterizing Raman

Polymer processing
64
spectra obtained from PEOT PBT block copolymers of 3 different compositions
after subcutaneous implantation. Raman and histological data revealed that the
onset of mineralized spots appears already at 4 weeks of subcutaneous
implantation in 2 of the 3 different polymer compositions.
Material and methods
Polymers
Several different polymers and their separate building blocks were used for
characterization. The nomenclature of the polymers is as follows aPEOTbPBTc, The
composition is denoted as a / b / c, where a represents the poly(ethylene glycol)
(PEG) molecular weight (MW g/mol), and b and c represent the weight percentage
(wt%) of PEOT and PBT blocks respectively. In this study the following
compositions were measured by confocal Raman spectroscopy after subcutaneous
implantation in Wistar rats; 300PEOT55PBT45, 300PEOT70PBT30 and
1000PEOT70PBT30.
Formula 1: Molecular composition of PEOT/PBT block copolymers
Polymer processing
Samples were provided by the Department of Chemical Technology, Twente
University, The Netherlands. In short, polymer samples were created by
compression molding (laboratory press THB008, Fontijne, The Netherlands). The
molding temperatures were 140°C for 1000PEGT70PBT30, 150°C for
300PEGT70PBT30 and 300PEGT55PBT45. In this manner 400-600μm thick
samples were produced. Subsequently, 15 mm diameter discs for degradation
experiments were cored out.

Confocal Raman spectroscopy
65
In vivo implantation
The melt pressed discs (n=8) were implanted subcutaneously in the back of young
male Wistar rats (Harlan BV, the Netherlands) along the dorso-medial line. Before
implantation, the discs were sterilized by γ-irradiation under vacuum. The
sterilization method is known not to affect the polymer properties. The samples
were implanted according to a randomized square method, 4 samples per animal.
After insertion of the discs, the wounds were closed with Vicryl® suture. The
samples were explanted after 1, 2, 4, 12 weeks. Simulation of degradation was
done by immersion of the samples in phosphate buffered saline (PBS), pH 7.4, for
14 days at a 100°C.
Confocal Raman spectroscopy
A collimated and circularly symmetrical beam from a diode laser (LD) (Mitsubishi
electronics) with a frequency of 685nm is reflected by a dichroïc beam splitter (BS)
into the vacuum chamber of a FEI ESEM XL30-FEG through a coupling window.
The beam is then focused by a 60X objective (n.a. 0.65) on a sample of interest.
The excited Raman scattering is collected by the same objective and the Stokes
components of Raman frequencies pass through the BS and a notch filter on a
pinhole (∅ 25µm) allowing confocality of the system. The scattering is collected in
a spectrograph-monochromator where the incoming light is decomposed by a
concave holographic diffraction grating and focused on a thermo-electrically cooled
CCD (1056x256 pixels, Princeton Instruments Spec10). The theoretical spatial
resolution of the system is ~700nm with an effective laser power of 6mW on the
sample. The CCD is connected with a computer for data collection and analysis
using WinSpec (Roper Scientific Inc., USA) and Microcal Origin (Microcal software
inc., USA) data analysis software.

Confocal Raman spectroscopy
66
Confocal Raman measurements were done on wet samples after retrieval and
fixation. In general 8 random locations on the samples were measured 10 times to
account for measurement errors. The difference spectra were determined by
subtracting Raman spectra of 1 week implanted samples from Raman spectra of the
implanted samples at later time points. In order to ensure all spectra were
compared in the same way, the data were corrected by relating all intensities to the
1725 cm-1 band belonging to the carboxyl stretch mode from the terephtalate
group in the polymer. An internal standard like this makes subtraction of the
spectra possible, because major absolute intensities generated by measurement
differences, due to differences in surface characteristics for example, can than be
accounted for. The method of using an internal standard was applied to both the in
vitro and in vivo degradaded samples
Figure 1: Raman spectra of PEOT PBT block copolymers before degradation

Raman spectroscopy on 300PEOT55PBT45 polymers
67
Histology
In order to observe morphological changes during implantation at the different time
points mentioned before, the explanted samples were fixed in a 4%
paraformaldehyde solution (Sigma, the Netherlands) and washed in PBS.
Subsequently, the samples were dehydrated in an increasing ethanol series. After
dehydration, samples were embedded in GMA (Sigma, the Netherlands). After
embedding 5 μm sections were made on a microtome (HM 355S, microtome,
Germany) and stained with hematoxilin/eosin staining (Sigma, the Netherlands) to
be evaluated by light microscopy.
Results
Raman spectroscopy on 300PEOT55PBT45 polymers
After in vitro degradation of 300PEOT55PBT45 polymers no difference in intensity
of Raman bands observed in spectra obtained before and after degradation could
be found. Subtracting the spectrum obtained before degradation from the one
obtained after degradation resulted in a difference spectrum showing several peaks
above and under the baseline (see figure 2). The absence of single negative or
positive peaks in these spectra, which can be related to a decrease in the amount
of either PEOT or PBT, and the fact that positive or negative peaks are preceded or
followed by an opposite peak indicated that the resultant spectra were mainly
showing peak shape differences (narrowing or widening) of Raman bands. After
implantation of these polymers, subtraction of the spectrum obtained after 1 week
of implantation from the spectra obtained at 2, 4 and 12 weeks (figure 3) did not
show a clear decrease in time of Raman bands in any of the spectra observed. In
addition, the spectra obtained from the implanted samples showed a result similar
to what was found for the in vitro degradaded samples.

Raman spectroscopy on 300PEOT55PBT45 polymers
68
Figure 2: Raman spectra of 300/55/45 polymer before and after in vitro degradation as well as the difference spectrum.

Raman spectroscopy on 300PEOT55PBT45 polymers
69
Figure 3; A) Raman spectra of 300PEOT55PBT45 polymers after implantation at different time points. B) Raman difference spectra of implanted samples.

Raman spectroscopy on 300PEOT70PBT30 polymers
70
Raman spectroscopy on 300PEOT70PBT30 polymers
After subtraction of spectra obtained before degradation from the spectra of in vitro
degradaded 300PEOT70PBT30 polymers a decrease in intensity of Raman bands at
positions specific for PEO, especially around 1280 cm-1, which is a band specific for
tCH2 and υC-H vibrations within this group, was found (figure 4). In contrast, the
resultant spectra of the in vivo degradation experiment (figure 5) did not show a
clear decrease of any molecular group specific Raman band at all of the different
time points observed. However, after 4 weeks of implantation a small peak around
960 cm-1 begins to appear, which seemed to have increased after 12 weeks.
Figure 4: Raman spectra of 300PEOT70PBT30 polymer before and after in vitro degradation as well as the difference spectrum.

Raman spectroscopy on 300PEOT70PBT30 polymers
71
Figure 5: A) Raman spectra of 300PEOT70PBT30 polymers after implantation at different time points. B) Raman difference spectra of implanted samples, note the appearance of the phosphate specific Raman band.

Raman spectroscopy of 1000PEOT70PBT30 polymers
72
Raman spectroscopy of 1000PEOT70PBT30 polymers
The Raman difference spectrum of in vitro degradaded 1000PEOT70PBT30
polymers showed a clear appearance of a shoulder band around 1300 cm-1, while
in the same time the intensity of the 1285 cm-1 band had decreased (figure 6). A
slight reduction in intensity around 1470 cm-1 was found. In addition, between 850
and 890 cm-1 the appearance of 2 positive bands could be found. Furthermore
after subtraction, around 1180 cm-1a positive band could be observed which
indicates an increase in intensity of this Raman band. The difference spectra of
subcutaneous implanted samples had a similar appearance as the in vitro
degradaded samples, be it that the intensity of the resultant bands in the Raman
difference spectra of implanted samples was much lower (figure 7). After 12 weeks
of implantation the difference spectrum showed considerably more noise than
what could be observed for 2 and 4 weeks. Another observation we did during the
analysis was that a high intensity Raman band around 960 cm-1 in certain regions of
the implant could be found. Moreover, the presence of this Raman positive band
was found to be non-homogenous, meaning some regions showed clearly higher
intensity than other regions. The difference spectra in figure 7 all show a slight
elevated intensity band around this position. Whereas the spectra in figure 8 show
the results from a Raman measurement at a location were a very high intensity 960
cm-1 band could be found. Whenever this Raman band was detected when
measuring 1000PEOT70PBT30 material it always had a much higher intensity than
what could be observed for the 300PEOT70PBT30 polymer.

Raman spectroscopy of 1000PEOT70PBT30 polymers
73
Figure 6: Raman spectra of 1000PEOT70PBT30 polymer before and after in vitro degradation as well as the difference spectrum.

Raman spectroscopy of 1000PEOT70PBT30 polymers
74
Figure 7: A) Raman spectra of 1000PEOT70PBT30 polymers after implantation at different time points. B) Raman difference spectra of implanted samples

Histology
75
Figure 8: Raman spectra of 1000PEOT70PBT30 polymers before (bottom) and after (top) implantation (12 weeks) showing the high intensity band for phosphate indicating vast calcification of the polymer.
Histology
In general the polymers with a molecular weight of PEG of 300 showed less
fragmentation than the 1000PEOT70PBT30 block copolymer. In case of
300PEOT55PBT45 no real changes in structure of the polymer discs could be
observed apart from slight surface erosion after 12 weeks of implantation (figure 9).
The samples had remained intact and could easily be retrieved from the
implantation site. Furthermore, the samples were surrounded by a rim of
connective tissue, indicative of a mild foreign body reaction. The
300PEOT70PBT30 samples showed some fragmentation of the surface at 12 weeks
as can be observed in figure 10.

Histology
76
Figure 9: Light micrograph of 300PEOT55PBT45 polymer at 1 week (left) and 12 weeks of implantation (right). Apart from a slight change of surface morphology no effects on polymer morphology can be observed after 12 weeks of implantation. Scalebars are 100μm.
In general the samples appeared to be intact after retrieval from the implantation
sites. Moreover, by using polarized light microscopy (a technique by which
polymers and connective fibers can be observed as bright light scattering structures
in the microscope sections), at this time point several small polymer fragments,
present in the surrounding connective tissue, were found. In addition, a thin layer
of what appears to be mineralization on the surface was found from 4 weeks on.
This mineralization showed as a layer of dark blue and purple colored patchwork
on the surface of the polymer, with a thickness of around 5 μm. However, no
regions other than the interface between tissue and polymer could be found
showing signs of calcification. During retrieval of the 1000PEOT70PBT30 samples it
became clear that these samples were much more defragmented, especially at the
later time points, than the other polymers observed in this study (figure 11). After 1
week of implantation no major morphological changes were observed on the
surface. The samples were surrounded by connective tissue like the other materials
used in this study. However, after 2 weeks of implantation, clear signs of surface
erosion could be detected in the form of lacunae present on the surface.

Histology
77
Figure 10: Light micrographs of 300PEOT70PBT30 polymer at 1 (top left) 4 (top right) and 12 (bottom left) weeks of implantation. Bottom right small polymer fragments observed by normal light microscopy (bottom right top) and polarized light microscopy (bottom right bottom) at 12weeks. The dark blue granulation at he polymer surface at 12 weeks, indicates calcification of the polymer. Scalebars are 100 μm.
Additionally, Macrophage-like cells could be observed on the surface were the
lacunae had formed. After 4 weeks of implantation, cracks had formed, which were
filled with connective tissue, throughout the sample causing the discs to fragment.
In some regions intensely stained dark blue and purple granular regions could be
found, which indicated possible mineralization. These calcified regions were not

Histology
78
only found close to the surface of the polymer, but also within the polymer itself
(especially after 12 weeks of implantation).
Figure 11: Light micrographs of 1000PEOT70PBT30 polymer at 1 (A), 2 (B), 4 (C) and 12 weeks (E-H) of implantation. A shows the onset of beginning lacunae formation on the polymer (p) surface, which progressed after 2 weeks (B), where macrophage-like cells (arrow) occupying the lacunae can be observed. After 4 weeks of implantation (C) large cracks have

Discussion
79
formed throughout the polymer filled with connective tissue. After 12 weeks of implantation severe defragmentation of the polymer discs was observed (D and E), and also signs of extensive calcification (dark blue and purple granulation) not only at the surface (G) but also inside the polymer (F). Figure G and H not only show that a large number of small polymer fragments were present in the connective tissue surrounding the implant, but in the cytoplasm of macrophage-like cells as well (arrow). Scalebars are 100 μm.
Moreover, a distribution of large and smaller polymer fragments surrounded by
Macrophage like cells were present in the connective tissue around the implant
(see figure 11G). In some areas, using high magnification, macrophage like cells
could be observed containing small polymer fragments within their cytoplasm of
which a typical example can be seen in figure 11H).
Discussion
Polymers used for tissue engineering or implantations should be biocompatible and
have specific mechanical, water absorption and degradation properties depending
upon their application. The aim of this study was to investigate the possibility of
applying confocal Raman spectroscopy for the analysis of degradation of PEOT PBT
block copolymers with different composition after subcutaneous implantation. As a
simulation model for degradation we analyzed 300PEOT55PBT45,
300PEOT70PBT30 and 1000PEOT70PBT30 after submersion for 14 days in PBS at
100 ºC in order to compare the data obtained with the data derived from
subcutaneous implanted samples. The simulated degradation of 300PEOT55PBT45
samples revealed no large changes in Raman band intensities when comparing
degradaded with non-degradaded material. The absence of single freestanding
negative or positive bands in the difference spectra between the treated and non-
treated material, confirms the idea that the small bands observed in these spectra
are mainly caused by slight shape changes of these bands rather than intensity
differences. Interesting is the fact that these shape changes seem to occur mainly
around positions were bands specific for PEOT are located (850 and 1280 cm-1)
belonging to rCH2, gauche-trans-gauche glycol and tCH2, υC-H vibrations17, 18
respectively. The simulated degradation of 300PEOT70PBT30 polymers resulted in

Discussion
80
a slight decrease in intensity of the 1280 cm-1 band similar to 300PEOT55PBT45,
however, the effect on the Raman band around 850 cm-1 seems to be much
smaller. Based on these data it seems that hardly any changes in the molecular
composition took place after in vitro degradation of these polymers. The effects
observed here are more likely results of a change in crystallinity and or
conformational changes of these polymers. In a previous study done with the exact
same batch of polymers we determined the ΔH and Tm of the hard block after fast
simulated degradation by using differential scanning calorimetry (DSC). The ΔHhard
and Tm of these polymers were found to change from 4 to 14 J/g and 131 to 148 ºC
for 300PEOT70PBT30 and from 10 to 32 J/g and 169 to 178 ºC for
300PEOT55PBT45, after degradation19. The increase in heat of fusion and melting
temperature indicated an increase in crystallinity, which in turn is known to lead to
an increase in intensity and narrowing of Raman bands. This observation is also
illustrated by the fact that for all polymer compositions observed a shoulder band
around 1300 cm-1, known to be specific for PBT, begins to appear after
degradation, which indicates a possible narrowing of the neighbouring 1280 cm-1
band. Moreover, the change in shape of the 850 cm-1 band specific for gauche-
trans-gauche glycol skeletal vibrations also indicates a possible change in the
physical state of the polymer. Although less clear, he data obtained from the
subcutaneous implanted samples were similar to those found after simulated
degradation in PBS. As difference spectra between 1 week and the other time
points did not reveal a clear change of band intensities in time for both implanted
300PEOT55PBT45 and 300PEOT70PBT30 polymers, it is likely that no major
changes in molecular composition of 300PEOT55PBT45 and 300PEOT70PBT30
during 12 weeks of implantation had occurred. Interestingly, the appearance of a
minor positive band around 960 cm-1, known to be specific for the PO43- υ1 stretch
mode, in 300PEOT70PBT30 polymers after 4 weeks of implantation showed the
on start of mineralization of these polymers. The granular lining of the polymer

Discussion
81
surface after 4 weeks revealed by histology, indicative of mineralization, confirms
this observation. Some small polymer fragments in the tissue surrounding
300PEOT70PBT30 discs were found after 12 weeks at the implantation site.
Moreover, macrophage-like cells were always found in the vicinity of these
fragments, likely to be involved in the uptake of these particles for further
degradation. In contrast, 300PEOT55PBT45 polymers did not show clear changes
in morphology and the structural integrity after implantation remained largely intact;
While the abovementioned block copolymers showed only minor changes in
histology, with respect to structural integrity, and Raman spectroscopy, with respect
to chemical composition, 1000PEOT70PBT30 polymers showed more clear effects
of degradation after implantation.
Simulated degradation of 1000PEOT70PBT30 polymers resulted in similar
difference spectra as for the other two polymer compositions. However, the
decrease of the Raman band around 1470 cm-1, belonging to C-H and CH2
vibrational modes of mainly the PEO group, in combination with the much clearer
shape changes, caused by both narrowing and decreasing intensities, are indicative
of not only changes in polymer composition but crystallinity as well. The Raman
difference spectra of in vivo implanted samples showed a decrease in intensity of
the 1280 cm-1 PEOT specific band in time, while another PEOT specific band
around 850 cm-1 also seems to have decreased especially after 12 weeks of
implantation. The decrease of these PEOT specific Raman bands implies a possible
loss of PEOT content. The positive bands observed after in vitro and in vivo
degradation are probably related to a change in crystallinity comparable to the
other polymers observed in this study, as the ΔHhard and Tm increased from 9.9 to
36.5 J/g and 157 to 165 ºC for in vitro, and from 9.9 to 14.9 J/g and 157 to 160 ºC
in vivo (results published by us elsewhere19) degradaded samples. The fact that the
amount of noise in these spectra increases in time, caused by increasing
Mineralization
82
background fluorescence, indicates that more and more proteins and other
biological factors infiltrate the material with prolonged implantation time. Light
microscopy showed that the implanted samples begin to collapse already after 4
weeks of implantation. After 12 weeks of implantation further fragmentation of
these materials lead to the presence of numerous small polymer fragments which
are surrounded by macrophage-like cells. Moreover, similar cells can be found
around the implant containing internalized polymer particles in their cytoplasm,
which indicates an active role for these cells in possible further degradation of these
polymers. The presence of dark purple granular patches on the surface and inside
of the polymer discs and the fact that Raman measurements revealed an intense
Raman band at 960 cm-1 belonging to the asymmetric stretch mode of PO43-,
typically present in calcium phosphate materials, indicates that this material
becomes heavily calcified after in vivo implantation. Our results regarding the
calcification of 1000PEOT70PBT30 are similar to what others have found after
implantation of similar compositions, showing the bone bonding capabilities of
these materials12, 15, 20, 21.
Mineralization
The interesting finding of mineralization in the 300PEOT70PBT30 and
1000PEOT70PBT30 polymers, are in line with a study done by Sakkers et al.20.
They suggested that PEOT PBT polymers with a high PEO content were likely to
calcify. Although the molecular weight of PEO in the 300 series is lower than for
the 1000PEOT70PBT30 series, the amount of PEO chains is relatively high, in order
to compensate for the mass ratio of soft versus hard blocks in the polymer, which
might in turn facilitate mineralization. The COOH groups produced by hydrolysis
during degradation of PEOT PBT copolymers are thought to play a role in
mineralization of these polymers15. The length of PEO chains and uptake of water
in the last mentioned polymer are higher, which increases the changes of these

Mineralization
83
materials to be hydrolyzed more than 300PEOT70PBT30 polymers because of the
shorter PEO molecular chain length in the last mentioned material. This might
explain the observation that calcification in 300PEOT70PBT30 polymers occurs
after 4 weeks at a much lower level than was observed for the 1000PEOT70PBT30
polymers.
The effects of degradation, picked up by Raman spectroscopy, related to changes
in chemical composition seem to be small in all material compositions observed.
The reason for this could be two fold, the two major molecular groups in PEOT
PBT polymers are very similar. The only real difference in the two groups is the
chain length of PEO, a repetition of ethylene glycol groups, whereas PBT consists of
a steady number of four C atoms linked to each other in a butyl formation coupled
to a terephtalate group by an ester bond, which is similar for both PBT and PEOT.
Moreover, the blocks are distributed in the polymer as phase separated soft and
hard blocks in areas ranging from 5 to 20 nm size22. As the spot size of the
microscope can only reach around 700 nm in the spatial direction, in the most
optimal setup, confocal Raman measurements will always show a mixed signal from
both PEOT and PBT molecular groups. A recent study on the degradation of PEOT
PBT copolymers showed that the amount of the soft block in the total polymer
decreases in time, while the amount of PBT remained relatively constant1 during
degradation. It was found that PEOT PBT polymers are degraded through 2
mechanisms; one being hydrolysis and the other oxidation, which mainly take
place in the soft segment of the polymer. Because degradation through oxidation
requires the presence of oxygen radicals and hydrogen peroxides, hydrolysis is a
more likely event to occur during in vivo degradation of these materials. The
process of hydrolysis leads to chain scissoring of the ester bond, mainly in the PEOT
block, resulting in free PEO chains in the polymer. Therefore, one would expect a
decrease in intensity of the Raman band which can be assigned to the ester bond.

Mineralization
84
However, Raman spectra show the resultant of a mixture of all Raman active
chemical bonds present in a sample. Therefore, the decrease in intensity of the
Raman band belonging to the ester bond in PEOT PBT copolymers can be
obscured by the total number of Raman bands in the spectra, which are obtained
from both the PBT and PEOT blocks and to lesser extent from the free PEO chains
still present in the bulk of the sample, since these are located at similar positions.
The most important reason for this is the fact that the molecular groups of which
PEOT PBT copolymers are composed are comparable to each other, making it very
hard to pick up small changes in the chemical composition of these materials by
Raman spectroscopy. Another important factor contributing to the difficult
interpretation of these data is the fact that changes in crystallinity or conformation
can cause shape changes in certain Raman bands. An increase in crystallinity
generally leads not only to a narrowing of Raman bands, but also to an increase in
intensity of these bands16. Since the polymers observed in this study show
increased crystallinity after degradation, based on heat of fusion and melting
temperature of the hard block, it is likely that some of the positive bands found in
the difference spectra are caused by this change. Only for 1000PEOT70PBT30
polymer discs clear signs of degradation could be detected, by a loss in PEOT
content, while for 300PEOT70PBT30 and 300PEOT55PBT45 no change in
composition was found even after 12 weeks. Interestingly, histology revealed that
macrophage-like cells clearly play an active role in the uptake and possible further
degradation of these materials. Since a number of authors have described the
presence of macrophages or giant cells containing polymeric particles in the vicinity
of PEOT PBT implants10, 23, 24 our observations seem to be in line with these findings.
For future experiments a study regarding the intracellular degradation of these
materials could shed some light on the advanced in vivo degradation by
macrophages. After phagocytosis by these cells, degradation possibly will continue
inside the phagosome, an organelle which plays a crucial role in the degradation of

References
85
internalized materials. Macrophages are known to produce oxidative reagents and
enzymes which can contribute to further degradation of internalized polymeric
particles. The creation of an in vitro system by which the uptake and subsequent
degradation of small polymer particles inside single cells can be studied is therefore
recommended.
References
1. Deschamps, A.; Grijpma, D.; Feijen, J., Poly(ethylene oxide)/poly(butylene terephthalate) segmented block copolymers: the effect of copolymer composition on physical properties and degradation behavior. Polymer 2001, 42, (23), 9335-9345. 2. Miot, S.; Woodfield, T.; Daniels, A. U.; Suetterlin, R.; Peterschmitt, I.; Heberer, M.; van Blitterswijk, C. A.; Riesle, J.; Martin, I., Effects of scaffold composition and architecture on human nasal chondrocyte redifferentiation and cartilaginous matrix deposition. Biomaterials 2005, 26, (15), 2479-89. 3. Woodfield, T. B.; Bezemer, J. M.; Pieper, J. S.; van Blitterswijk, C. A.; Riesle, J., Scaffolds for tissue engineering of cartilage. Crit Rev Eukaryot Gene Expr 2002, 12, (3), 209-36. 4. Woodfield, T. B.; Malda, J.; de Wijn, J. R.; Peters, F.; Riesle, J.; van Blitterswijk, C. A., Design of porous scaffolds for cartilage tissue engineering using a three-dimensional fiber-deposition technique. Biomaterials 2004, 25, (18), 4149-61. 5. Wang, H. J.; Bertrand-De Haas, M.; Riesle, J.; Lamme, E.; van Blitterswijk, C. A., Tissue engineering of dermal substitutes based on porous PEGT/PBT copolymer scaffolds: comparison of culture conditions. J Mater Sci Mater Med 2003, 14, (3), 235-40. 6. van Dorp, A. G.; Verhoeven, M. C.; Koerten, H. K.; Van Der Nat-Van Der Meij, T. H.; Van Blitterswijk, C. A.; Ponec, M., Dermal regeneration in full-thickness wounds in Yucatan miniature pigs using a biodegradable copolymer. Wound Repair Regen 1998, 6, (6), 556-68. 7. Beumer, G. J.; van Blitterswijk, C. A.; Ponec, M., Biocompatibility of a biodegradable matrix used as a skin substitute: an in vivo evaluation. J Biomed Mater Res 1994, 28, (5), 545-52. 8. Du, C.; Meijer, G. J.; van de Valk, C.; Haan, R. E.; Bezemer, J. M.; Hesseling, S. C.; Cui, F. Z.; de Groot, K.; Layrolle, P., Bone growth in biomimetic apatite coated porous Polyactive 1000PEGT70PBT30 implants. Biomaterials 2002, 23, (23), 4649-56. 9. Kuijer, R.; Bouwmeester, S. J.; Drees, M. M.; Surtel, D. A.; Terwindt-Rouwenhorst, E. A.; Van Der Linden, A. J.; Van Blitterswijk, C. A.; Bulstra, S. K., The polymer Polyactive as a bone-filling substance: an experimental study in rabbits. J Mater Sci Mater Med 1998, 9, (8), 449-55. 10. Meijer, G. J.; van Dooren, A.; Gaillard, M. L.; Dalmeijer, R.; de Putter, C.; Koole, R.; van Blitterwijk, C. A., Polyactive as a bone-filler in a beagle dog model. Int J Oral Maxillofac Surg 1996, 25, (3), 210-16. 11. Bulstra, S. K.; Geesink, R. G.; Bakker, D.; Bulstra, T. H.; Bouwmeester, S. J.; van der Linden, A. J., Femoral canal occlusion in total hip replacement using a resorbable and flexible cement restrictor. J Bone Joint Surg Br 1996, 78, (6), 892-8. 12. Meijer, G.; Radder, A.; Dalmeijer, R.; de Putter, C.; van Blitterswijk, C., Observations of the bone activity adjacent to unloaded dental implants coated with Polyactive or HA. J Oral Rehabil 1995, 22, (3), 167-74. 13. Radder, A.; Leenders, H.; van Blitterswijk, C., Interface reactions to PEO/PBT copolymers (Polyactive) after implantation in cortical bone. J Biomed Mater Res 1994, 28, (2), 141-51.

References
86
14. Radder, A.; Davies, J.; Leenders, H.; van Blitterswijk, C., Interfacial behavior of PEO/PBT copolymers (Polyactive) in a calvarial system: an in vitro study. J Biomed Mater Res 1994, 28, (2), 269-77. 15. Li, P.; Bakker, D.; van Blitterswijk, C. A., The bone-bonding polymer Polyactive 80/20 induces hydroxycarbonate apatite formation in vitro. J Biomed Mater Res 1997, 34, (1), 79-86. 16. Pelletier, M. J., Analytical applications of Raman spectroscopy. first ed.; Blackwell Science Ltd.: Oxford, 1999; p 1-478. 17. Kozielski, M.; Muhle, M.; Blaszczak, Z., The Raman scattering study of selected polyoxyethyleneglycols. 2004, 111, (1-3), 1. 18. Di Noto, V.; Zago, V.; Biscazzo, S.; Vittadello, M., Hybrid inorganic-organic polymer electrolytes: synthesis, FT-Raman studies and conductivity of {Zr[(CH2CH2O)8.7][rho]/(LiClO4)z}n network complexes. 2003, 48, (5), 541. 19. Deschamps, A.; van Apeldoorn, A.; Hayen, H.; de Bruijn, J.; Karst, U.; Grijpma, D.; Feijen, J., In vivo and in vitro degradation of poly(ether ester) block copolymers based on poly(ethylene glycol) and poly(butylene terephthalate). Biomaterials 2004, 25, (2), 247-258. 20. Radder, A. M.; Leenders, H.; van Blitterswijk, C. A., Interface reactions to PEO/PBT copolymers (Polyactive) after implantation in cortical bone. J Biomed Mater Res 1994, 28, (2), 141-51. 21. Radder, A. M.; Davies, J. E.; Leenders, H.; van Blitterswijk, C. A., Interfacial behavior of PEO/PBT copolymers (Polyactive) in a calvarial system: an in vitro study. J Biomed Mater Res 1994, 28, (2), 269-77. 22. Deschamps, A. A. Segmented Poly (ether ester)s and poly (ether ester amide)s for use in tissue engineering. Doctoral, University of Twente, The Netherlands, Enschede, The Netherlands, 2002. 23. Radder, A. M.; Loon, J. A.; Puppels, G. J.; Blitterswijk, C. A., Degradation and calcification of a PEO/PBT copolymer series. Journal of Materials Science: Materials in Medicine (Historical Archive) 1995, 6, (9), 510. 24. van Dijkhuizen-Radersma, R.; Hesseling, S. C.; Kaim, P. E.; de Groot, K.; Bezemer, J. M., Biocompatibility and degradation of poly(ether-ester) microspheres: in vitro and in vivo evaluation. 2002, 23, (24), 4719.

Introduction
87
Annex
This short study was presented as a poster at the European society for biomaterials
conference in september 2001 in London (UK) and indicated that our in house
build confocal Raman system could actually be used to study implanted
biomaterials. The outcome of this preliminary study lead to two ideas. First the
degradation of PEOT PBT block copolymers had to be studied in a well defined in
vivo model in combination with a simulated degradation model. Second, since the
uptake of small polymer fragments by cells seemed to play a major role in polymer
degradation a model had to be defined for the study of intra cellular biomaterial
degradation.
A preliminary study on the application of confocal Micro Raman Spectroscopy for the
analysis of in vivo PEOT PBT Degradation.
A. A. van Apeldoorn1,3, Y. Aksenov2, J.D. de Bruijn1, C.Otto2, C.A. van Blitterswijk1,3 1Isotis NV, P.O box 98, 3723AB Bilthoven, The Netherlands, 2Dept.of Biophysical
Techniques, Technical Physics, University of Twente, The Netherlands, 3Dept.
Chemical Technology, University of Twente, The Netherlands.
Introduction
Polyactive™ (PA) is a degradable block copolymer composed of poly
(butylene)terephtalate (PBT) and poly (ethyleneglycol) terephatalate (PEOT). The
composition and therefore the mechanical and chemical properties of the
copolymer can be tailored depending on the application, by varying the ratio of
PEOT:PBT and changing the Mw of PEG, a basic component in the production of
the polymer. As a major application of PA include its use as implant material in the
form of a tissue-engineering scaffold, it is crucial to study the in vivo degradation of
this material. Confocal Raman spectroscopy could be a valuable tool for the study
of intra and extra cellular degradation processes as it can be used for non

Histology
88
destructive molecular analysis of biological samples at a high resolution. In this
study we used an in house build confocal micro Raman spectrometer, which
collects Raman scattering, through an infinity-corrected objective, in a backscatter
configuration. A pinhole is chosen such that it functions as a confocal diaphragm.
The system uses a thermo electrically cooled CCD, which can be used for spectrum
and image formation with a high signal to noise ratio. We found signs of
degradation of in vivo implanted PA similar to samples degradaded by using a
simulated degradation protocol. Furthermore, we were able to make Raman
images of polymer fragments found by histology with our in house build confocal
Raman system.
Materials and methods
The nomenclature of the polymers used in this study is as follows aPEOTbPBTc,
The composition is denoted as a / b / c, where a represents the poly (ethylene
glycol) (PEG) molecular weight (MW g/mol), and b and c represent the weight
percentage (wt%) of PEOT and PBT blocks respectively. As a model for simulated
degradation samples were submersed in phosphate buffered saline for 14 days at
100ºC
Implantation
Sterile 1000PEOT70PBT30 discs of 15.5mm diameter were implanted for 3 years
into the os ilium of adult Dutch milk goats. After implantation the ilia were
explanted, fixated in a 4% paraformaldehyde solution, dehydrated in an increasing
ethanol series and embedded in Methylmetacrylate.
Histology
Saw sections were prepared with a diamond innerlock saw (Leica microsystems,
Germany) and stained either with methylene blue and basic fuchsin for histology,

Results
89
or were left unstained. The stained sections were examined by light microscopy
and the unstained material was used for Raman measurements.
Raman spectroscopy
Measurements were done with a custom made confocal Raman microscope using a
diode laser (λ=685 nm) with 15-20 mW effective power at the sample surface and
having a spatial resolution of 700nm. Non degradaded and in vitro degradaded, PA
1000/70/30 was measured as a reference.
Results
Raman spectroscopy
The retrieved fragments were characterized as being PA (see figure 1).
Several bands, 800, 1280, 1623 and 1725 cm-1, typical for PA were used for
imaging the observed fragments (figure 2C). A clear peak shape change around
1280 cm-1 was found not only after in vitro degradation but in vivo implantation as
well.

Histology
90
Figure 1 A: Raman spectra of non degraded vs. degraded PA. C: 1280 cm-1 band (magnification of 1A). B: Raman spectra of implanted PA vs. in vitro degraded PA, D: 1280 cm-1 band of implanted PA, note the similarity in shape with 1C.
Histology
Fragmentation of implant material was observed. Concentrations of macrophage
like cells, containing PA fragments, in the area of fragmentation were observed
Figure 2). Bone surrounding the implant had a normal appearance and showed
signs of bone remodelling.

Conclusions
91
Figure 2. A: Light micrograph (100x) of cells containing polymer fragments (arrow) B: Light micrograph of macrophage like cells containing polymer fragments (arrow) C: Composite Raman image (90x90 μm) of an in vivo polymer fragment showing the intensity of the 800 (blue), 1280 (green), 1623 (dark Red) and 1725 cm-1(red) Raman bands.
Conclusions
We were able to measure PA fragments found by histology.
The observed PA fragments showed possible signs of degradation similar to in vitro
degradaded specimens.
By selecting typical Raman bands we were able to image the observed PA
fragments by selecting specific Raman bands.
These results show that confocal micro Raman spectroscopy can be a valuable tool
to characterize and study the degradation of PA in vitro and in vivo.

Raman imaging of PLGA microsphere degradation inside macrophages
92
Raman imaging of PLGA microsphere
degradation inside macrophages

Raman imaging of PLGA microsphere degradation inside macrophages
93
In order to study material degradation by single cells we developed an in vitro cell
culture model. Adding microspheres composed of polylactic-co-glycolic-acid
(PLGA), which were first incubated with serum, to a macrophage cell line allowed
the study of material degradation in individual cells. In literature there is a debate
whether, autocatalytic degradation, a rapid self sustaining degradation process
caused by an accumulation of acidic end groups in the interior of implants
composed of PLGA, also takes place in small devices. Observing the degradation by
confocal Raman imaging, lead to the finding that both fast autocatalytic (inside out)
and slow homogenous (outside in) degradation processes were present. Moreover,
PLGA degradation seems to occur for the most part through scissioning of the
glycolic acid bonds. By using this information we were able to design a schematic
model depicting the aforementioned degradation process.
Abstract
94
Abstract
Understanding the degradation behavior of polymeric microspheres is crucial for
the successful application of such devices in controlled drug delivery. The
degradation mechanism of poly(lactic-co-glycolic acid) (PLGA) microspheres inside
phagocytic cells is not known, but different models for degradation in aqueous
solution have been proposed. We have used confocal Raman spectroscopy and
imaging to study the intracellular degradation of PLGA microspheres inside
individual macrophages. Our results show that ingested microspheres degrade in a
heterogeneous manner, with a more rapid degradation in the center. Comparison
of Raman spectra from degrading beads with those of non-ingested beads reveals
that ester hydrolysis occurs throughout the phagocytosed microspheres, with a
selective loss of glycolic acid units. Furthermore, we show that PLGA degradation is
a cell-mediated process, possibly caused by the low pH of the phagosome and/or
the presence of hydrolytic enzymes. In conclusion, we have demonstrated that the
chemical composition of degrading polymers inside cells can be probed by Raman
spectral imaging. This technique will expand the capabilities of investigating
biomaterial degradation in vivo.

Introduction
95
Raman Imaging of PLGA Microsphere Degradation inside Macrophages
Aart A. van Apeldoorn1, Henk-Jan van Manen2, Jeroen M. Bezemer3, Joost D. de
Bruijn1, Clemens A. van Blitterswijk1 and Cees Otto2
1Polymer Chemistry and Biomaterials Group, and 2Biophysical Engineering Group,
Faculty of Science & Technology, Biomedical Technology Institute, University of
Twente, P.O. Box 98, 3723 AB Bilthoven, The Netherlands, and 3Octoplus
Technologies BV, Zernikedreef 12, 2333 CL Leiden, The Netherlands
Introduction
One of the key issues in successful application of biomaterials for tissue engineering
and drug delivery is a well-characterized in vivo biodegradation behavior.
Poly(lactic-co-glycolic acid) (PLGA) has been used for a wide variety of medical
applications, from resorbable sutures to bone screws and microspheres for drug
delivery. Degradation of PLGA in vitro as well as in vivo mainly takes place through
either hydrolysis of the ester linkages and/or enzymatic degradation1, 2 (see the
chemical structure in Figure 1). It has been reported that devices of PLGA degrade
in a heterogeneous manner3. A model describing this process was proposed by
Park4 based on work by Vert and coworkers, in which the degradation proceeds
more rapidly in the center than at the exterior3, 5, 6. This phenomenon is thought to
be caused by autocatalytic action of the carboxylic acid end groups of the
degrading material trapped in the internal milieu. It has been questioned whether
this model is also valid when dealing with microspheres7. A more homogenous
microsphere degradation, has been postulated on the basis of observation of
homogenous degradation of small devices such as thin films8. In many cases,
implantation of a biomaterial results in a foreign body reaction involving
macrophages, which phagocytose small particles of the degrading materials. After

Materials and methods
96
phagocytosis by these cells, degradation may continue inside the phagosome,
which plays a crucial role in degradation of internalized materials.
Figure 1. Raman spectrum and chemical structure of PLGA. In the structure, two glycolic acid units are shown on the left, whereas lactic acid units are displayed on the right. The ester bonds (marked “~”), which are hydrolyzed upon degradation, are characterized by a carbonyl stretching vibration at 1768 cm-1.
The in vivo response to implanted biomaterials is in general studied by histology,
which examines the tissue reaction by light microscopy. The limitation of these
studies is that, although morphological changes can be studied, no information
about the chemical composition of the degrading materials can be obtained from
such measurements. Raman spectroscopy allows one to study the chemical bonds
involved in degradation of these polymers by detecting intensity and wavelength
changes in the vibrational bands of these bonds. We studied the degradation of
PLGA microspheres, after macrophage phagocytosis in vitro, by nonresonant
confocal Raman spectroscopy and imaging.
Materials and methods
The PLGA microspheres (50:50% glycolide/lactide by weight) were produced by a
so-called salting-out procedure described before9, 10. Scanning Electron Microscopy

Results and discussion
97
(SEM) showed that their size varied between 1-10 μm in diameter and that they
were of solid nature (Figure 3E). The microspheres were sterilized in 70% ethanol
for 15 min and then washed in sterile PBS. After washing, the material was
opsonized for 30 min using human serum. The microspheres were then added to a
macrophage cell line (RAW 264.7) cultured on poly-L-lysine coated CaF2 slides, in
RPMI 1640 medium containing 10% FBS, 2 mM L-glutamine, and antibiotics. The
cells were cultured for 1 and 2 weeks at which point they were fixed using 4%
paraformaldehyde for 30 min. The samples were washed and placed in PBS for
Raman measurements, which were performed using a home-built confocal Raman
microscope as described previously11. A pinhole of 15 μm diameter was employed,
providing an axial resolution (FWHM) of 1.5 μm. During Raman imaging, we
scanned an intracellular area of 7.5 × 7.5 μm2, using a signal accumulation time of
1 s per pixel at 100 mW 647.1 nm excitation.
Results and discussion
The internalized microspheres showed signs of intracellular degradation already
after 1 week of cell culture. Light microscopy revealed what appeared to be a
cavity in the center of the microspheres at 1 and 2 weeks of cell culture (Figure 3A
and C). Confocal Raman spectroscopy and imaging of degraded PLGA spheres
confirmed these observations. In contrast, PLGA microspheres incubated under
identical conditions, but in the absence of macrophages (insets Figure 3C and D),
did not show any signs of degradation. Raman images of phagocytosed
microspheres constructed in the 1768 cm-1 band specific for the ester groups of
PLGA clearly show a low intensity of this band in the internal area of several
particles already after 1 week (Figure 3B). This indicates the loss of PLGA ester
bonds from the center of these microspheres. We scaled both the pure PLGA
spectrum (Figure 1) and averaged spectra taken from the high- and low-intensity
regions of the PLGA microsphere in Figure 3D to the 875 cm-1 band, which is

Results and discussion
98
assigned to the C−COO stretch vibration of lactic acid12 and is not affected by
hydrolysis. Analysis of the spectroscopic data after Raman imaging revealed that 2
weeks after phagocytosis a ~30% reduction in the ester bond intensity was found
in both the low- and high-intensity area of the internalized microsphere, compared
to pure PLGA. This is demonstrated by the negative band in Figure 2A and B at
1768 cm-1 after subtraction of the scaled spectra of pure PLGA. Moreover, the
difference spectrum in Figure 2A shows bands specific for the cell cytoplasm. Based
on the presence of bands at 1004 cm-1 (phenylalanine) and 1662 cm-1 (amide I)
and the 1440 cm-1 band assigned to CH2 groups predominantly found in lipids, we
conclude that both proteins and lipids are present in the degradation-induced void
present in the microspheres. It is unlikely that these molecules have diffused
through the intact outer shell of the microspheres, since this particular composition
of PLGA is rather hydrophobic. Proteins and lipids have probably traveled through
one or more pores formed by degradation which connect the cavity in the centre
to the phagosomal milieu. Such a mechanism is also indicated by the collapsed
microsphere in the top right corner of the Raman image in Figure 3B. Using either
3D Raman imaging or observation of the microsphere surface by SEM after isolation
from the macrophages will probably resolve these issues.

Results and discussion
99
Figure 2. Raman spectra (in black) of the low- (A) and high-intensity (B) regions of the PLGA microsphere in Figure 3D. Pure PLGA is shown in red, and difference spectra (after scaling to the 875 cm-1 band) in green. Note the negative band at 1768 cm-1, indicating a decrease of ester bonds, and the negative bands specific for glycolic acid at 845, 890, 1274, and 1424 cm-1.12

Results and discussion
100
Figure 3. (A and C) Light micrographs of macrophages containing phagocytosed beads cultured for 1 and 2 weeks,
respectively (scale bar 5 μm). The Raman images (7.5 × 7.5 μm2) of these beads are shown in B and D. The scale in B and D shows the relative intensity of the 1768 cm-1 band used for imaging (specific for PLGA ester bonds). Insets in C and D show
controls (image size 7.5 × 7.5 μm2). The Raman image in 3F depicts the intensity of the 1527-1714 cm-1 region, which contains bands from cytoplasmic species. (E) Electron micrograph of PLGA microspheres after freezing and crushing in liquid
nitrogen. A cross-section of a broken sphere, showing the solid center, can be seen (arrow) (scale bar 10 μm).
Acknowledgement
101
The outcome of our study adds not only histological but also chemical data to the
model proposed by Park4 and Vert,3, 5, 6 describing heterogeneous degradation of
PLGA starting from the center and going outwards. The degradation of PLGA
leading to the induction of concentric cavities in the microspheres after uptake by
macrophages, as described here, is in favor of that model. However, analysis of the
spectroscopic data strongly suggests that degradation takes place throughout the
whole microsphere by hydrolysis of the ester bonds preferentially related to the
glycolic acid block in the polymer, as indicated by the negative bands in Figure 2A
and B. This finding is more related to the suggestion of homogenous degradation by
Li when dealing with microspheres7. As existing models do not take into account
the influence of the cell on the microsphere degradation process, they must be
different from a phagosomal degradation mechanism. Our results indicate that the
PLGA degradation behavior shown here is a cell-mediated process, caused by
either the low pH (~5.5) and/or the presence of hydrolytic enzymes in the
phagosome, since control samples lacking macrophages did not show any
degradation after 1 and 2 weeks (insets Figure 3).
Conclusions
In conclusion, we have demonstrated that confocal Raman spectroscopy and
microscopy are unique, label-free tools to study intracellular microsphere
degradation after in vitro phagocytosis. These techniques allow detailed
information about the chemical composition of the degrading polymer particles to
be obtained. In addition, they will enable studies directed at the chemical
investigation of biomaterial degradation in vivo.
Acknowledgement
We thank Ms. S. Métairie from Octoplus Technologies BV for preparing the
microspheres. Funding was provided by the Dutch Technology Foundation (STW).

References
102
References
1. Edlund, U., Albertsson, A.C., Degradable polymer microspheres for controlled drug delivery. Advances in polymer science 2002, 157, 67-112. 2. Schliecker, G.; Schmidt, C.; Fuchs, S.; Wombacher, R.; Kissel, T., Hydrolytic degradation of poly(lactide-co-glycolide) films: effect of oligomers on degradation rate and crystallinity. Int J Pharm 2003, 266, (1-2), 39-49. 3. Therin, M.; Christel, P.; Li, S.; Garreau, H.; Vert, M., In vivo degradation of massive poly(alpha-hydroxy acids): validation of in vitro findings. Biomaterials 1992, 13, (9), 594-600. 4. Park, T. G., Degradation of poly(lactic-co-glycolic acid) microspheres: effect of copolymer composition. Biomaterials 1995, 16, (15), 1123-30. 5. Li, S. M., Garreau, M., Vert, M., Structure-property relationships in the case of the degradation of massive aliphatic poly-(alfa-hydroxy acids) in aqueous media, part 1: poly(DL-lactic acid). Journal of materials science: materials in medicine 1990, 1, 123-130. 6. Li, S. M., Garreau, M., Vert, M., Structure-property relationships in the case of the degradation of massive aliphatic poly-(alfa-hydroxy acids) in aqueous media, part 2: Degradation of lactide-glycolide copolymers: PLA37.5GA25 and PLA75GA25. Journal of materials science: materials in medicine 1990, 1, 131-139. 7. Li, S., Hydrolytic degradation characteristics of aliphatic polyesters derived from lactic and glycolic acids. J Biomed Mater Res 1999, 48, (3), 342-53. 8. Grizzi, I.; Garreau, H.; Li, S.; Vert, M., Hydrolytic degradation of devices based on poly(DL-lactic acid) size-dependence. Biomaterials 1995, 16, (4), 305-11. 9. Maa, Y. F.; Hsu, C. C., Effect of primary emulsions on microsphere size and protein-loading in the double emulsion process. J Microencapsul 1997, 14, (2), 225-41. 10. Lu, W.; Park, T. G., Protein release from poly(lactic-co-glycolic acid) microspheres: protein stability problems. PDA J Pharm Sci Technol 1995, 49, (1), 13-9. 11. Uzunbajakava, N.; Lenferink, A.; Kraan, Y.; Volokhina, E.; Vrensen, G.; Greve, J.; Otto, C., Nonresonant confocal Raman imaging of DNA and protein distribution in apoptotic cells. Biophys J 2003, 84, (6), 3968-81. 12. Geze, A.; Chourpa, I.; Boury, F.; Benoit, J. P.; Dubois, P., Direct qualitative and quantitative characterization of a radiosensitizer, 5-iodo-2'-deoxyuridine within biodegradable polymeric microspheres by FT-Raman spectroscopy. Analyst 1999, 124, (1), 37-42.

Combined confocal Raman spectroscopic and SEM study of protein incorporation into biomimetic coatings
103
Combined confocal Raman
spectroscopic and SEM study of protein
incorporation into biomimetic coatings

Combined confocal Raman spectroscopic and SEM study of protein incorporation into biomimetic coatings
104
Sometimes the outcome of research can result in wonderful pieces of art. The
coprecipitation of proteins with a different charge (pI-value), but equal in size, into
biomimetic carbonated apatite like coatings resulted in interesting changes in
surface topography of these materials. A and B; electron micrographs of a regular
biomimetic carbonated apatite like coating. C and D; incorporation of bovine
serum albumin, results in curved crystals and cauliflower shaped structures. E and F;
haemoglobin, the oxygen carrying protein in red blood cells, incorporation resulted
in areas containing small and larger crystals which seem to be stacked on each
other. G and H; the incorporation of poly aspartic acid resulted in an astounding
surface structure composed of globules, which seem to grow on top of each other.
Scale bars on the left are all 2 μm, while the scalebars on the right are all 1μm.

Abstract
105
Abstract
Biomimetic calcium phosphate coatings on the contrary to plasma spray coatings
are in general produced at ambient temperatures and a controlled pH and
consequently allow the incorporation of proteins. Recent studies on protein
incorporation in biomimetic calcium phosphate coatings showed an effect of
protein on crystal shape. In these studies bovine serum albumin (BSA) was used at
different concentrations in the precipitation solution in order to study its
incorporation into the coating. The outcome of these studies was that not only BSA
had coprecipitated with a carbonate apatite like coating, but the crystal structure
had been affected as well. The use of increasing concentrations of BSA lead to
alterations in crystal size and shape which could observed by scanning electron
microscopy (SEM). Nonetheless, the precise effect of the alteration in crystal size
and shape on the crystallinity remained unclear. In this study the consequence of
different concentrations of BSA incorporated into biomimetic carbonated apatite
coatings in relation to the effect on crystal size, crystallinity and physical
appearance was studied. The biomimetic coatings were examined by thin film X-
ray diffraction (TF-XRD), and a combination of confocal Raman spectroscopy and
SEM. Results obtained during this study showed that not only the presence of
protein could be detected in a non destructive manner, but also information about
the relative amount of protein present in the coating could be obtained as well by
using confocal Raman microscopy. Although, the increase of the BSA concentration
did not seem to influence the crystallinity towards a great extend, the increase in
standard deviation of the calculated values together with SEM observations suggest
that the coating structure had become more heterogeneous in its nature. The
combination of SEM and confocal Raman spectroscopy proved to be a feasible
analysis technique to investigate not only the morphology of these coatings but also
their physiochemical composition.

Introduction
106
Combined confocal Raman spectroscopic and SEM study of protein incorporation into
biomimetic coatings
A. A. van Apeldoorn1, Y. Aksenov2, M. Stigter3, J. D. de Bruijn1, J. Greve2, C. Otto2,
C. A. van Blitterswijk1
1Department of Polymer Chemistry and Biomaterials, Faculty of Technology and
Sciences,University of Twente, PO Box 98, 3720 AB Bilthoven, The Netherlands,
2Department of Biophysical Techniques, Faculty of Technology and Sciences,
University of Twente, PO Box 217, 7500AE Enschede, The Netherlands, 3Isotis NV,
PO Box 98, 3720 AB Bilthoven, The Netherlands
Introduction
Titanium and its alloys are generally used to design orthopedic implants mainly
because of their excellent mechanical properties. In order to enhance bone-
bonding capacities these implants can be coated with calcium phosphate coatings.
Nowadays, coatings are mainly deposited on these surfaces by using the plasma
spray technique. However, the plasma spray technology is a line of sight process at
extremely high temperature, and does not allow for the incorporation of proteins,
like growth factors and antibiotics. The use of specific growth factors in order to
stimulate bone formation, like bone morphogenic proteins, could speed up the
process of integration of an implant with bone1-3. In contrast, biomimetic calcium
phosphate coatings are generally produced at ambient temperatures at a controlled
pH4,5 and therefore allow the incorporation of proteins. Recently protein
incorporation was studied on biomimetic calcium phosphate coatings6,7. In these
studies bovine serum albumin (BSA) was used at different concentrations in the
precipitation solution in order to study its incorporation. Results showed that not
Introduction
107
only BSA had coprecipitated with a carbonate apatite like coating, but the crystal
structure of this coating was affected as well. The use of increasing concentrations
of BSA lead to an alteration in crystal size and shape as was observed by scanning
electron microscopy. However, the exact effect of the change in crystal size and
shape on the crystallinity remained unclear. Crystallinity and crystal structure of
calcium phosphate coatings are well described factors which can influence the
dissolution behavior of these materials8,9. A study on the effect of calcium
phosphate on bone cell mineralization revealed that release of calcium ions from
calcium phosphates promotes mineralization and could be crucial for the
bioactivity10 of coatings and ceramics. Coathup and coworkers found that
hydroxyapatite coatings have a significantly greater interfacial contact with bone
when compared to a roughened titanium surface, and significantly more bone had
attached to a crystalline HA coating compared with the HA coating of lower
crystallinity, though significantly more bone had formed in the vicinity of the lower
crystalline HA coating11. In our study the effect of different concentrations of BSA
incorporated into biomimetic carbonated apatite coatings in relation to the effect
on crystal size, crystallinity and physical appearance was investigated. We used thin
film X-ray diffraction (TF-XRD), and a combination of confocal Raman spectroscopy
and scanning electron microscopy to study these biomimetic coatings. In a previous
study we showed the advantage of using a confocal Raman microscope (CRM)
integrated with a scanning electron microscope (SEM) to study osteoblast
mineralization on titanium alloy surfaces. In this particular study it was found that
by using the CRM in combination with SEM inorganic (calcium phosphate) and
organic (protein) components of mineralized bone matrix and their distribution
related to the morphology could be analyzed on these samples12. Since Raman
spectroscopy allows for the non-destructive molecular analysis of samples by
measurement of wavelength shifts from an incident monochromatic light source
(Laser), which are caused by chemical bond vibrations, it is highly suitable for

Preparation of carbonated apatite coatings (CO3-AP)
108
studying the effects of protein incorporation into biomimetic calcium phosphate
coatings when combined with a SEM. We were not only able to detect the
presence of BSA, but also its effect on the relative crystallinity of carbonated apatite
like biomimetic coatings which were deposited on a titanium alloy surface.
Furthermore, it was found that by increasing concentrations of BSA in the
precipitation solution the surface morphology was altered from consisting of sharp
rectangular crystals in a fairly homogenous distribution to small and big rounded
crystals with an irregular distribution.
Materials and methods
Preparation of carbonated apatite coatings (CO3-AP)
All CO3-AP coatings (5 samples per group) were prepared on sandblasted Ti6Al4V
(Smitford Staal BV, The Netherlands) square plates with a surface area of 10 mm2
and 1 mm thickness. The plates were ultrasonically cleaned for 15 min. in acetone,
70% ethanol and demineralized water in sequence. The CO3-AP coatings with
different crystallinity were prepared according to a precipitation method developed
by Barrere et al.4,13. In short, coatings were prepared from different salt solutions as
shown in table 1.
Table 1: Composition of the precipitation solutions
The precipitation process took place at 37 ºC for 24 hours. Increasing the Mg2+
concentration inhibits the precipitation process and favors the formation of an
amorphous calcium phosphate coating. In addition a series of coatings was
prepared similar to the high crystalline coating mentioned before in which bovine
Biomimetic coatings:
Low crystalline Medium crystalline High crystalline 733.5 mmol/l NaCl 733.5 mmol/l NaCl 733.5 mmol/l NaCl 7.5 mmol/l MgCl
2 1.5 mmol/l MgCl
2 0.75 mmol/l MgCl
2
12.5 mmol/l CaCl2 12.5 mmol/l CaCl
2 12.5 mmol/l CaCl
2
10 mmol/l HCO3 10 mmol/l HCO
3 7.5 mmol/l HCO
3
5 mmol/l HPO4 5 mmol/l HPO
4 5 mmol/l HPO
4

Combined Confocal Raman Scanning Electron Microscope (CRESEM)
109
serum albumin (BSA) was added to a concentration of 1, 10 and 100 mg/l. The
coatings were analyzed by TF-XRD and a scanning electron microscope using a FEI
ESEM, model XL-30 FEG in which an in house built confocal Raman microscope
was fitted. As a reference 100% crystalline stoichiometric hydroxyapatite (HA)
material calcined at 1000 ºC for 10 hours was used and measured both with
Raman spectroscopy and TF-XRD.
Combined Confocal Raman Scanning Electron Microscope (CRESEM)
We have integrated a confocal Raman microscope with a FEI XL-30 FEG ESEM, a
schematic drawing of this system can be seen in figure 1.
Figure 1: schematic drawing of the CRESEM setup (for an elaborate explanation se materials and methods).
A collimated and circularly symmetrical beam from a diode laser (LD) (Mitsubishi
electron corp.) with a frequency of 685nm is reflected by a dichroic beam splitter
(BS) into the vacuum chamber of the SEM through a coupling window (CW). The
beam is then focused by a 60X microscope objective (MO) (Zeiss, West-Germany)
on a sample of interest. The excited Raman scattering is collected by the same
objective and the Stokes components of Raman frequencies pass through the BS, a
notch filter (NF), which blocks photons with the initial laser wavelength, and a
pinhole (∅ 25μm), allowing for confocality of the system. Subsequently, the

TF-XRD analysis
110
scattering is collected in a spectrograph-monochromator where the incoming light
is decomposed by a concave holographic grating and focused on a thermo-
electrically cooled CCD (1056x256 pixels, Princeton Instruments Spec10). The
theoretical spatial resolution of the system is ~700nm with an effective laser power
of 6mW on the sample14. The CCD is connected with a computer for data
collection and analysis by using WinSpec and Microcal Origin data analysis
software. The setup was calibrated by using 5 and 20 μm ∅ polystyrene beads to
establish the coordinates needed for lateral movement from the electron gun to the
laser spot.
CRESEM on biomimetic CO3-AP coatings
In order to ensure that all samples were measured in a similar manner, CRESEM
measurements were collected in the centre from cross sections of the coating. The
samples were positioned in such a way that the coordinates of the laser spot would
fall in the middle of a cross-section of the coating thus ensuring similar
measurements for each sample. Various measurements, at least 10 per sample,
were done at different locations and sufficient time was taken to ensure a relatively
low signal to noise ratio of each measurement. We used a method developed by
others15 to calculate the relative crystallinity of the obtained coatings. The full width
half maximum (FWHM) of the 960 cm-1 peak was determined after Gaussian curve
fitting of at least 10 different measurements per sample. The relative crystallinity
was then determined according to the following formula:
Relative crystallinity=FWHMcoat/FWHMHA*100% (1)
TF-XRD analysis
X-ray diffraction measurements were taken with a Rikagu miniflex goniometer with
Cu radiation (Cu Kα, λ=1.54Å, 30kV, 15mA) directly at the sample surface. A
single peak was chosen from the spectrum of each sample at around 25 degrees
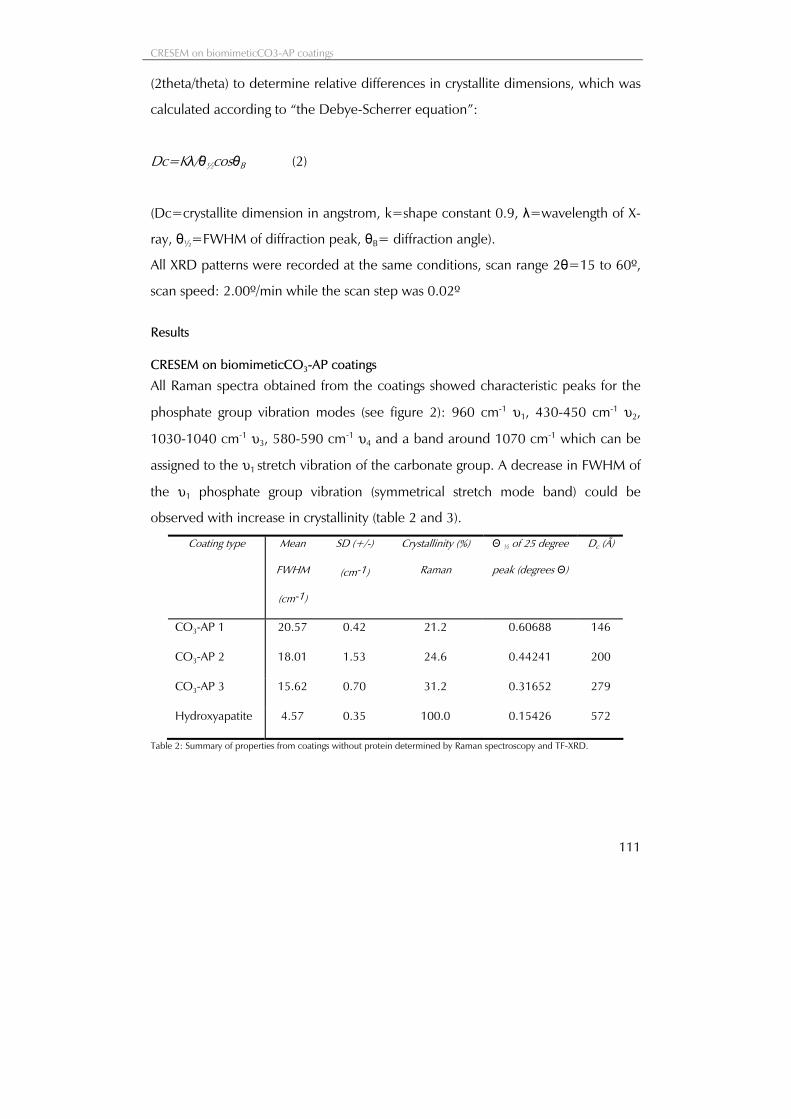
CRESEM on biomimeticCO3-AP coatings
111
(2theta/theta) to determine relative differences in crystallite dimensions, which was
calculated according to “the Debye-Scherrer equation”:
Dc=Kλ/θ½cosθB (2)
(Dc=crystallite dimension in angstrom, k=shape constant 0.9, λ=wavelength of X-
ray, θ½=FWHM of diffraction peak, θB= diffraction angle).
All XRD patterns were recorded at the same conditions, scan range 2θ=15 to 60º,
scan speed: 2.00º/min while the scan step was 0.02º
Results
CRESEM on biomimeticCO3-AP coatings
All Raman spectra obtained from the coatings showed characteristic peaks for the
phosphate group vibration modes (see figure 2): 960 cm-1 υ1, 430-450 cm-1 υ2,
1030-1040 cm-1 υ3, 580-590 cm-1 υ4 and a band around 1070 cm-1 which can be
assigned to the υ1 stretch vibration of the carbonate group. A decrease in FWHM of
the υ1 phosphate group vibration (symmetrical stretch mode band) could be
observed with increase in crystallinity (table 2 and 3).
Coating type Mean
FWHM
(cm-1)
SD (+/-)
(cm-1)
Crystallinity (%)
Raman
Θ ½ of 25 degree
peak (degrees Θ)
Dc (Å)
CO3-AP 1 20.57 0.42 21.2 0.60688 146
CO3-AP 2 18.01 1.53 24.6 0.44241 200
CO3-AP 3 15.62 0.70 31.2 0.31652 279
Hydroxyapatite 4.57 0.35 100.0 0.15426 572
Table 2: Summary of properties from coatings without protein determined by Raman spectroscopy and TF-XRD.

CRESEM on biomimeticCO3-AP coatings
112
Coating type Mean
FWHM
(cm-1)
SD (+/-)
(cm-1)
Crystallinity
(%)
Raman
Θ ½ of 25 degree
peak (degrees Θ)
Dc (Å)
1 mg/l BSA 16.71 0.37 27.9 0.21846 404
10 mg/l BSA 16.08 0.53 28.4 0.25749 343
100 mg/l BSA 18.12 1.16 25.2 0.29785 296
Hydroxyapatite 4.57 0.35 100.0 0.15426 572
Table 3: Summary of properties from BSA containing coatings determined by Raman spectroscopy and TF-XRD.
In addition bands (1450 cm-1, 1580 cm-1) known to be protein related began to
appear when higher concentrations of BSA (10 and 100mg/l) were used for the
preparation of the BSA containing coatings (figure 2).

CRESEM on biomimeticCO3-AP coatings
113
Figure 2: Typical Raman spectrum of carbonated apatite coating showing the different band assignments (top). Raman spectra of BSA containing coatings, the arrows indicate the protein specific bands at 1450 cm-1, 1660 cm-1.

TF-XRD analysis
114
TF-XRD analysis
X-ray diffraction spectra (see figure 3) of coatings were collected directly from the
surface of the samples without any other treatment in order to maintain the surface
structure. In order to calculate crystallite dimensions the band at 25 degrees (2-θ)
was Gaussian curve fitted and from these fits the FWHM was determined. The
obtained values were compared to 100% crystalline hydroxyapatite and their
respective relative values were calculated (table 2 and 3). The results presented in
table 2 show that with increase in crystallinity the FWHM (θ½) of the peak
occurring around 25 degrees is decreasing and therefore the crystallite dimension
in the 002 direction is increasing. The presence of BSA lead to a slight decrease in
crystallinity from 27.9, for 1 mg/l BSA, to 25.2, for 100 mg/l BSA, while crystallite
dimensions decreased from 404 Å towards 296 Å .
Figure 3: TF-XRD spectra of protein containing coatings compared to the coating containing no protein with high crystallinity the 002 peak was used to determine the D value along the c-axis.

Scanning Electron Microscopy
115
Scanning Electron Microscopy
All the coatings prepared without protein showed a similar morphology of which a
representative electron micrograph is shown in figure 4A.
Figure 4: Scanning electron micrographs of different CO3-AP coatings. A) no protein containing coating (CO3-AP3). B-D) Coatings prepared with a solution containing 1, 10 and 100 mg/l BSA, note the decreasing crystal size with increasing protein concentration. E and F) Cross-section view of coatings prepared with a solution containing no protein (E) and 100 mg/l BSA (F) showing the morphological changes, sharp crystals versus rounded crystals) when protein is present in the precipitation solution.
In these samples a fairly homogenous distribution of sharp rectangular crystals of
similar size can be seen. In this case adding different concentrations of Mg2+ does
not seem to affect crystal dimensions to the extent protein does. Even though, XRD
measurements showed that the crystallite dimensions, the individual units of which
the crystals are composed, decrease when more Mg2+ or BSA is present in the
precipitation solution as was determined by XRD (table 1 and 2). As can be
observed on the electron micrographs the surface texture of the coatings changes
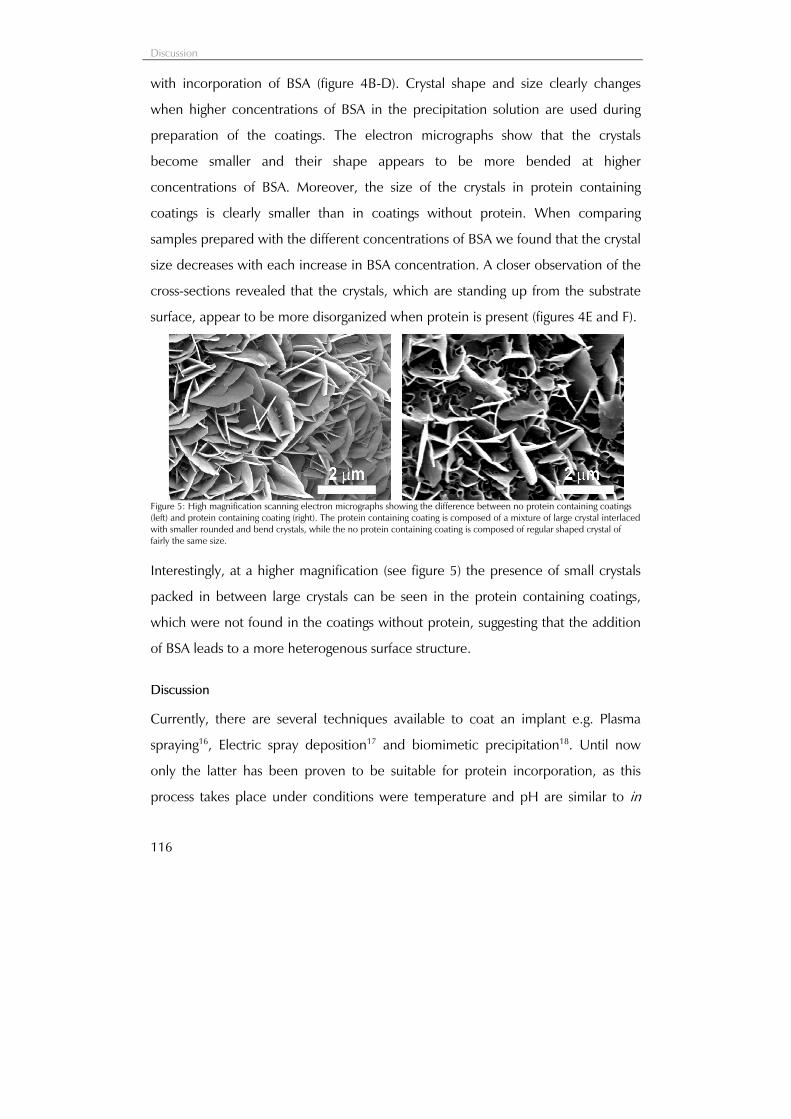
Discussion
116
with incorporation of BSA (figure 4B-D). Crystal shape and size clearly changes
when higher concentrations of BSA in the precipitation solution are used during
preparation of the coatings. The electron micrographs show that the crystals
become smaller and their shape appears to be more bended at higher
concentrations of BSA. Moreover, the size of the crystals in protein containing
coatings is clearly smaller than in coatings without protein. When comparing
samples prepared with the different concentrations of BSA we found that the crystal
size decreases with each increase in BSA concentration. A closer observation of the
cross-sections revealed that the crystals, which are standing up from the substrate
surface, appear to be more disorganized when protein is present (figures 4E and F).
Figure 5: High magnification scanning electron micrographs showing the difference between no protein containing coatings (left) and protein containing coating (right). The protein containing coating is composed of a mixture of large crystal interlaced with smaller rounded and bend crystals, while the no protein containing coating is composed of regular shaped crystal of fairly the same size.
Interestingly, at a higher magnification (see figure 5) the presence of small crystals
packed in between large crystals can be seen in the protein containing coatings,
which were not found in the coatings without protein, suggesting that the addition
of BSA leads to a more heterogenous surface structure.
Discussion
Currently, there are several techniques available to coat an implant e.g. Plasma
spraying16, Electric spray deposition17 and biomimetic precipitation18. Until now
only the latter has been proven to be suitable for protein incorporation, as this
process takes place under conditions were temperature and pH are similar to in

Discussion
117
vivo conditions. Incorporating growth factors or antibiotics provide the possibility to
increase the bioactivity of these coatings. However, incorporation of these factors
can not only influence the crystal and surface structure but the crystallinity of these
coatings as well. In this study we have used BSA as a model protein for
coprecipitation into a biomimetic carbonated apatite coating using 3 different
concentrations (1, 10 and 100 mg/l). Scanning Electron Microscopy revealed that
with increase of protein concentration the surface structure of these coatings alters.
The crystal plates observed in coatings without protein are rectangular and flat,
while protein containing coatings seem to be composed of smaller thin crystals
curved in shape; this observation is comparable to what others have found in
similar studies19-21. Although crystallite dimensions are larger in protein containing
coatings, increasing the concentration of BSA in the precipitation solution causes
the formation of a coating composed of smaller CO32- containing apatite crystals
than when no protein is present. This finding implies that there is an inhibitory
effect of the protein on crystal formation. The crystals decrease with increasing
protein concentration ultimately leading to a surface structure composed of small
crystals packed in between larger crystals as could be observed by SEM. Based on
these observations the change in shape is likely to be caused by the interference of
the protein during crystal growth. Determination of the c-axis by XRD showed that
with increasing protein concentrations, the Dc value along the c-axis decreases from
404 towards 296 Å. Interestingly; a similar observation can be made as the
crystallinity of coatings without protein is decreased by increasing the Mg2+
concentration. In these coatings a decrease in crystallinity of approximately 10%,
leads to a decrease from a crystal size of 279 to 146Å. However, the morphology of
these coatings was not affected by the change in crystallinity. It has been described
that in hydroxyapatite, organic ligands are aligned parallel and/or absorbed to the
crystallographic c-axis and mainly influence nucleation from the 100 side planes22,
23. This could explain the fact that the c-axis decreases with increase in protein

Discussion
118
concentration. In addition, the intensity of the 002 peak clearly increases, as can be
seen from the XRD spectra, when more protein is added to the precipitation
solution, which is indicative of the increase in apatite nature of the coating. Raman
spectra showed that at higher concentrations of BSA the bands specific for protein
(1450 cm-1 COO, CH2 and CH3, 1660 cm-1 amide I), as can be seen in figure 2,
increase in intensity, meaning that more and more protein is likely to have
incorporated into the coating when the concentration of BSA is increased. In
several studies regarding protein incorporation into calcium phosphate coatings
fluorescent labels, protein-staining techniques and ELISA have been used to
determine if protein was present21, 24. This study shows that not only the presence
of protein can be detected in a non destructive manner by using confocal Raman
spectroscopy, but also information about the relative amount of protein present in
the coating can be obtained as well. Determination of the relative crystallinity by
Raman spectroscopy, which was done by measurement of the FWHM of the 960
cm-1 band (ν1 PO43- asymmetric stretch mode), proved to be a relatively easy
technique to use. Raman spectroscopy is based on the detection of wavelength
shifts caused by molecular vibrations and measures the freedom of movement of
these vibrations. The more crystalline a ceramic becomes, the more confined the
movements of chemical bonds become, leading ultimately to more narrow Raman
bands. However, one has to keep in mind that the presence of carbonate in the
hydroxyapatite lattice can induce a minor line broadening25, which could lead to a
slight underestimation of crystallinity when using pure hydroxyapatite as 100%
crystalline standard. In this study all samples were prepared under similar
conditions therefore the effect of carbonate is likely to be the same in all of the
samples observed. The presence of BSA does not seem to influence the crystallinity
towards a great extend as a decrease from an average of 27.9 to 25.2 % could be
observed when the concentration in the precipitation solution is decreased.
However, the standard deviations of these measurements increase when more

Discussion
119
protein is present, indicating that the coating structure probably becomes more
heterogeneous in its nature. Electron microscopy on the cross-sections of the
coatings, as shown in the electron micrographs of figure 4, seems to confirm this
observation. The coating prepared with 1 mg/l BSA shows regular sharp crystals
standing up from the titanium alloy substrate, while the coating prepared with 100
mg/ml shows a more disorganized structure containing small irregular crystals with
rounded edges packed in between larger crystals. Whereas, the structure of these
coatings seems to be build up of a mixture of small crystals packed in between
large crystals, only large crystals packed together in a relatively homogenous
manner can be observed in the coatings containing no protein (see figure 4 and 5).
Combes and Rey26 suggested that there might be two complex processes taking
place during precipitation of calcium phosphate coatings in the presence of protein.
First, quick absorption of BSA to the metal surface can cause a decrease of surface
tension between substrate and liquid, leading to the inhibition of nuclei
multiplication (the smaller nuclei however are also more stable by the presence of
protein, than without protein). Second, the presence of protein can lead to
inhibition of crystal growth rate. In addition, at low protein concentration the
multiplication of nuclei is most important while the growth inhibition effect might
be weak, which is the opposite when a high concentration of protein is present.
Since the formation of these coatings is a dynamic process, the protein
concentration in the solution is decreasing in time; the amount of protein able to
interact with the already formed crystals is decreasing in time, which in turn leads
to less inhibition of crystal growth. At low concentrations of protein there might be
a lot of nuclei initially, which can grow relatively uninhibited to a certain size. In
contrast at high concentrations of protein the crystal growth, from an initial lower
number of nuclei, is hampered leading to smaller size crystals being formed. While
at a later stage, when less protein is present, bigger crystals are allowed to form and
also more nuclei can appear. This might explain the fact that at a low concentration,

References
120
low inhibition of crystal growth, a more homogenous coating seems to be formed
while at higher concentrations, initially a high inhibition of crystal growth which
decreases in time, the coating becomes more heterogenous in respect to crystal
size and shape. The initial larger Dc value for protein containing coatings as
compared to coatings without protein can probably be explained by the stabilizing
effect of protein on the initial nuclei which can lead to larger crystallite formation.
As all coatings were produced in the same time frame this seems to be a plausible
explanation. In order to gain more insight into the performance of these coatings an
in vivo study would be of interest. It is evident that the smaller crystals in these
coatings lead to a larger surface area, which in turn may lead to a faster dissolution
of Ca2+ from these coatings after implantation. The faster dissolution of Ca2+ could
enhance new bone formation so coatings having a higher surface area due to
protein incorporation might initially perform better after implantation. In
conclusion, the combination of SEM and confocal Raman spectroscopy seems to be
a valuable tool to investigate not only the morphology of these coatings but their
physiochemical composition as well.
References
1. Takagi, K.; Urist, M. R., The reaction of the dura to bone morphogenetic protein (BMP) in repair of skull defects. Ann Surg 1982, 196, (1), 100-9. 2. Takagi, K.; Urist, M. R., The role of bone marrow in bone morphogenetic protein-induced repair of femoral massive diaphyseal defects. Clin Orthop 1982, (171), 224-31. 3. Lind, M., Growth factor stimulation of bone healing. Effects on osteoblasts, osteomies, and implants fixation. Acta Orthop Scand Suppl 1998, 283, 2-37. 4. Barrere, F.; Layrolle, P.; van, B. C.; de, G. K., Biomimetic calcium phosphate coatings on Ti6AI4V: a crystal growth study of octacalcium phosphate and inhibition by Mg2+ and HCO3-. Bone 1999, 25, (2 Suppl), 107S-111S. 5. Barrere, F., Layrolle, P., van Blitterswijk, C.A., de Groot, K., Biomimetic coatings on titanium: a crystal growth study of octacalcium phosphate. Journal of materials research: Materials in medicine 2001, 12, 529-534. 6. Wen, H. B.; de Wijn, J. R.; van Blitterswijk, C. A.; de Groot, K., Incorporation of bovine serum albumin in calcium phosphate coating on titanium. J Biomed Mater Res 1999, 46, (2), 245-52. 7. Liu, Y.; Layrolle, P.; de Bruijn, J.; van Blitterswijk, C.; de Groot, K., Biomimetic coprecipitation of calcium phosphate and bovine serum albumin on titanium alloy. J Biomed Mater Res 2001, 57, (3), 327-35.

References
121
8. Fazan, F.; Marquis, P. M., Dissolution behavior of plasma-sprayed hydroxyapatite coatings. Journal of Materials Science: Materials in Medicine 2000, 11, (12), 787. 9. Zhang, Q.; Chen, J.; Feng, J.; Cao, Y.; Deng, C.; Zhang, X., Dissolution and mineralization behaviors of HA coatings. Biomaterials 2003, 24, (26), 4741-8. 10. Chang, Y. L.; Stanford, C. M.; Keller, J. C., Calcium and phosphate supplementation promotes bone cell mineralization: implications for hydroxyapatite (HA)-enhanced bone formation. J Biomed Mater Res 2000, 52, (2), 270-8. 11. Coathup, M. J.; Bates, P.; Cool, P.; Walker, P. S.; Blumenthal, N.; Cobb, J. P.; Blunn, G. W., Osseo-mechanical induction of extra-cortical plates with reference to their surface properties and geometric designs. 1999, 20, (8), 793. 12. A. A. van Apeldoorn, Y. A., M. Stigter, I. Hofland, J. D. de Bruijn, H. K. Koerten, C. Otto, J. Greve, C. A. van Blitterswijk, Parallel high-resolution confocal Raman SEM analysis of inorganic and organic bone matrix constituents. J. R. Soc. Interface 2005, 2, (2), 39-45. 13. Barrere, F.; van, B. C.; de, G. K.; Layrolle, P., Nucleation of biomimetic Ca-P coatings on ti6A14V from a SBF x 5 solution: influence of magnesium. Biomaterials 2002, 23, (10), 2211-20. 14. Aksenov, Y. Raman microscopy in an electron microscope: combining chemical and morphological analyses. Doctoral thesis, University of Twente, Enschede, The Netherlands, 2003. 15. de Grauw, C. J., Otto, C., Greve, J., de Bruijn, J.D, Investigation of Bone and Calcium Phosphate Coatings, and crystallinity Determination using Raman Microspectroscopy. Cells and materials 1996, 6, (1-3), 57-62. 16. de Groot, K.; Geesink, R.; Klein, C. P.; Serekian, P., Plasma sprayed coatings of hydroxylapatite. J Biomed Mater Res 1987, 21, (12), 1375-81. 17. Ducheyne, P.; Radin, S.; Heughebaert, M.; Heughebaert, J. C., Calcium phosphate ceramic coatings on porous titanium: effect of structure and composition on electrophoretic deposition, vacuum sintering and in vitro dissolution. 1990, 11, (4), 244. 18. Kokubo, T.; Kushitani, H.; Abe, Y.; Yamamuro, T., Apatite coating on various substrates in simulated body fluids. Bioceramics 1989, 2, 235-242. 19. Wen, H. B.; de Wijn, J. R.; van Blitterswijk, C. A.; de Groot, K., Incorporation of bovine serum albumin in calcium phosphate coating on titanium. J Biomed Mater Res 1999, 46, (2), 245-52. 20. Liu, Y.; Hunziker, E. B.; Randall, N. X.; de Groot, K.; Layrolle, P., Proteins incorporated into biomimetically prepared calcium phosphate coatings modulate their mechanical strength and dissolution rate. Biomaterials 2003, 24, (1), 65-70. 21. Liu, Y.; Layrolle, P.; de Bruijn, J.; van Blitterswijk, C.; de Groot, K., Biomimetic coprecipitation of calcium phosphate and bovine serum albumin on titanium alloy. J Biomed Mater Res 2001, 57, (3), 327-35. 22. Wierzbicki, A.; Cheung, H. S., Molecular modeling of inhibition of hydroxyapatite by phosphocitrate. 2000, 529, (1-3), 73. 23. Fujisawa, R.; Kuboki, Y., Preferential adsorption of dentin and bone acidic proteins on the (100) face of hydroxyapatite crystals. Biochim Biophys Acta 1991, 1075, (1), 56-60. 24. Liu, Y.; Hunziker, E. B.; Layrolle, P.; De Bruijn, J. D.; De Groot, K., Bone morphogenetic protein 2 incorporated into biomimetic coatings retains its biological activity. Tissue Eng 2004, 10, (1-2), 101-8. 25. de Mul, F. F.; Hottenhuis, M. H.; Bouter, P.; Greve, J.; Arends, J.; ten Bosch, J. J., Micro-Raman line broadening in synthetic carbonated hydroxyapatite. J Dent Res 1986, 65, (3), 437-40. 26. Combes, C.; Rey, C., Adsorption of proteins and calcium phosphate materials bioactivity. Biomaterials 2002, 23, (13), 2817-23.

Parallel high resolution confocal Raman SEM analysis of inorganic and organic bone matrix constituents
122
Parallel high resolution confocal Raman
SEM analysis of inorganic and organic
bone matrix constituents

Parallel high resolution confocal Raman SEM analysis of inorganic and organic bone matrix constituents
123
Although humans can build incredibly complex structures, cells are able to build
structures engineers can only dream of and they do this seemingly without any
effort. Compare the façade of the famous Casa Batlló by Antoni Gaudí with a
culture of rat osteoblasts depositing bone extra cellular matrix after 2 weeks and
one can see that millions of years of evolution will not easily be surpassed by 2
decades of tissue engineering.

Abstract
124
Abstract
In many multidisciplinary fields of science, such as tissue engineering
where material and biological sciences are combined, there is a need for
a tool which combines ultra structural and chemical data analysis in a
non destructive manner at high resolution. We show that combining
confocal Raman spectroscopy (CRS) with Scanning electron microscopy
(SEM) can be used for such analysis. Studies of atomic composition can
be done by x-ray microanalysis (XRMA) in SEM, but this is only possible
for atom numbers >5 and does not reveal molecular identity. Raman
spectroscopy however, can provide information on molecular
composition and identity by detection of wavelength shifts caused by
molecular vibrations. In this study, CRS-SEM revealed that early in vitro
formed bone ECM produced by rat osteoprogenitor cells resembles
mature bone chemically. We gained insight in the structure and
chemical composition of the ECM, which was composed of mainly
mineralized collagen type I fibers and areas of dense carbonated calcium
phosphate related to the collagen fiber density, as revealed by Raman
imaging of SEM samples. We found that CRS-SEM allows study of
specimens in a non-destructive manner and provides high resolution
structural and chemical information about inorganic and organic
constituents by parallel measurements on the same sample.

Introduction
125
Parallel high resolution Confocal Raman SEM analysis of inorganic and organic bone
matrix constituents
A.A. van Apeldoorn1, Y. Aksenov2, M.Stigter3, I. Hofland3, J.D. de Bruijn3, H.K.
Koerten4, C.Otto2, J. Greve2, C.A. van Blitterswijk1 1University of Twente, Faculty of Science and Technology, Dept. of Polymer
Chemistry and Biomaterials, PO box 98, 3720 AB Bilthoven, The Netherlands, 2University of Twente, Faculty of Science and Technology, Dept of Biophysical
Techniques, PO Box 217, 7500AE Enschede, The Netherlands, 3Isotis NV, PO box
98, 3720 AB Bilthoven, The Netherlands, 4Leiden University Medical Center, Dept.
of Molecular Cell Biology, PO box 9503, 2300 RA Leiden, The Netherlands
Introduction
Raman spectroscopy provides information on molecular vibrations. Raman
spectroscopy is a method based on an inelastic scattering effect. In short, a
monochromatic light source (laser) irradiation can excite molecules to a higher
vibration state, which then relax to a different vibration level as their original state.
As a result a photon is emitted with less energy, therefore a longer wavelength than
the initial photons from the laser. This event is called Stokes Raman scattering. The
energy difference between the incident and scattered radiations appears as a
frequency shift from the incident light. These frequency shifts are specific for a
given chemical bond and allow therefore molecular analysis. Scanning electron
microscopy (SEM) can not only be used for structural analysis but can also provide
chemical information as well, by using x-ray microanalysis (XRMA). XRMA is
however limited because no molecular information can be obtained from these
data and moreover, detection of elements is limited to the higher atomic numbers
(>5). In contrast, Raman spectroscopy can give information on molecular identity,
composition, orientation and crystal form by detection of wavelength shifts caused
by molecular vibrations. Therefore, combining SEM with confocal Raman

Introduction
126
spectroscopy (CRS) allows not only structural and elemental analysis of a sample
but, can also provide information about the presence of inorganic and organic
molecules in a noninvasive manner. In general, highly sensitive systems, containing
high power lasers and liquid cooled CCD-camera’s are needed to obtain high signal
to noise ratio data when studying biological samples with Raman spectroscopy. A
clear example of such a system was shown in a study done on polytene
chromosomes showing different DNA-protein ratios in their interbands1. The
abovementioned systems are however in general too large to fit in a vacuum
chamber of a SEM. We have built a compact confocal Raman microscope which
was incorporated into the vacuum chamber of an environmental SEM, thus
allowing us to do non-invasive chemical and ultra structure research on typical
biological samples. In tissue engineering (bio) materials are commonly combined
with biological components, like adding specific cells or proteins for drug release
etc. In most cases inorganic and organic components are present and preferably
need to be evaluated in the most non invasive way possible, in order to maintain
the structure of the sample. Several different authors investigated the mineralization
of a collagen matrix made by osteoprogenitor cells in vitro on different substrata by
electron microscopy. In these cases a network of collagen fibers was observed
which had undergone calcification 2-4. Separate FTIR and XRD analysis showed that
the observed mineralization consisted of carbonated apatite like calcium phosphate
(CO3-AP) comparable to bone 2, 5. In previous studies on bone by using Raman
spectroscopy in all cases the samples used were bulk-like and sometimes treated
specifically with hydrazine 6, 7 or H2O28, 9 to decrease fluorescence of the samples.
Although giving compositional data, these approaches does not allow for both
chemical and ultra structural analysis at the same time. Recently, a combination of
transmission light microscopy and Raman spectroscopy has been used to study
micro damage in bovine bone and to image damage at low magnifications10,
showing that different types of carbonated apatite were present around micro

Cell culture
127
cracks. This proved that high resolution Raman analysis on a micrometer scale can
reveal crucial information about sample composition, which can then be related to
two-dimensional histology. In three dimensional cell cultures it was found, by
confocal Raman spectroscopy, that human osteoblasts produced bone cell
spheroids under the influence of TGF-β1, containing microspicules composed of
carbonated apatite (CO3-AP) similar to mature bone11. These examples illustrate
that there is an increasing demand for combining ultra structural with chemical
analysis, at high resolution, to gain better understanding in active cellular processes
as the formation of extra cellular matrix (ECM). In this study we investigated in vitro
formed bone ECM, produced by osteoprogenitor cells obtained from rats, on
titanium alloy plates.
Methods
Biomimetic CO3-AP coatings were provided by IsoTis SA (The Netherlands). The
coatings were prepared according to a precipitation method by Barrere et al. (1999;
2001) on sandblasted Ti6Al4V (Smitford Staal BV, The Netherlands) square plates
with a surface area of 100 mm2 and 1 mm thickness. The plates were ultrasonically
cleaned for 15 min. in acetone, 70% ethanol and demi water in sequence. The
coatings were analyzed by XRMA, scanning electron microscopy (FEI, model XL-30
ESEM-FEG) and combined confocal Raman scanning electron microscopy
described in this article.
Cell culture
Rat bone marrow cells (RBMCs) were isolated from the femora of young (150 g)
male wistar rats12 and cultured in T75 flasks. Cell culture medium used during
culture and seeding was composed of α-MEM medium (Life technologies, The
Netherlands) containing 0.2∗10-3 M L-ascorbic-acid-2 phosphate (ASAP, Life
technologies, The Netherlands), 0.01 M β-glycerophosphate (βGP, Sigma, The
Netherlands), 1∗10–8 M dexamethasone (DEX, Sigma, The Netherlands), 15% fetal

Combined confocal Raman scanning electron microscope
128
bovine serum (FBS, Life technologies, The Netherlands), and 1% penicillin-
streptomycin. At the third passage the cells were seeded onto Ti6Al4V plates at a
density of 1E4 cells/cm2 and then cultured for 2 weeks to allow sufficient extra
cellular matrix (ECM) formation. As a control, the cells were also seeded on tissue
culture polystyrene (TCPS) to monitor the growth and morphology of the cells. After
14 days of culture the cells were fixated with 1.5% glutaraldehyde in 0.14 M
cacoadylate buffer (pH 7.4). After fixation the cells were dehydrated by immersion
in an increasing ethanol series (70-100%) and then critical point dried (Balzers CPD
030). In order to reveal the ECM structure underneath the cultured cells, the top
cell layer was removed by gently applying either pressurized air to blow of the cell-
layer or scotch tape to reveal the underlying ECM and cells. The samples were
analyzed by confocal Raman scanning electron microscopy and XRMA. Pure
Collagen type I (Sigma, The Netherlands) from bovine tendon was used as a
positive control for collagen present in the ECM measured by Raman spectroscopy.
Combined confocal Raman scanning electron microscope
A collimated and circularly symmetrical beam from a diode laser with a frequency
of 685nm is reflected by a dichroic beam splitter (BS) into the vacuum chamber of
the SEM through a coupling window (Fig. 1). The beam is then focused by a 60X
objective (n.a. 0.65) on a sample of interest. The excited Raman scattering is
collected by the same objective and the Stokes components of Raman frequencies
pass through the BS, a notch filter and a pinhole (∅ 25 μm), which allows for
confocality of the system. The scattering is collected by spectrograph-
monochromator, in which the incoming light is decomposed by a concave
holographic diffraction grating and focused on a thermo-electrically cooled CCD
(1056x256 pixels, Princeton Instruments Spec10). The theoretical spatial resolution
of the system is ~700nm with an effective laser power of 6mW on the sample. The
CCD is connected with a computer for data collection and analysis using WinSpec

Combined confocal Raman scanning electron microscope
129
(Roper Scientific Inc., USA) and Microcal Origin (Microcal software inc., USA) data
analysis software.
Figure 1: Schematic drawing of the CRSEM. Samples are analyzed by selecting a location by EM and than shifting the sample into the confocal laser spot at exact coordinates. The lasersource consists of a laserdiode with a wavelength of 685nm and is diverted through a side port into the vacuum chamber by a beamsplitter. The laser is then emitted onto the sample by a set of gold coated mirrors through a 60 x objective. The induced Raman scatter is then collected by the same objective and diverted in the opposite direction, passing the beamsplitter and a notch filter, through a pinhole allowing for confocality of the system. Inside the spectrograph, the Raman scattering is subsequently focused on a holographic diffraction grating and the decomposed wavelengths are then detected by a thermo-electrically cooled CCD. The scanning stage (nanometer movement) is equipped with a small light source to use transmission light microscopic observation for easy calibration of stage movement.
The setup was calibrated by using 2, 5 and 10 μm ∅ polystyrene beads to establish
the coordinates needed for lateral movement from the electron gun to the laser
spot. Raman measurements were taken of the ECM observed by SEM, in such a
way that the focal plane always just touched the titanium alloy substrate surface, in
this way all measurement were done in the same way. After collection of whole
Raman spectra, images were collected on chosen frequencies by using a nanometer
scanning stage (Kleindiek, Germany). The stage was controlled by LabView software
(National instruments, USA) and images were then generated from WinSpec data
files, by programming in LabView.

Confocal Raman scanning electron microscopy (CRSEM)
130
Results
Confocal Raman scanning electron microscopy (CRSEM)
We used polystyrene beads of sizes (10-2 μm) to calibrate sample stage positioning.
In this manner we established, the exact movement of our samples from our
electron micrograph to the laser spot of the confocal Raman microscope. We were
able to obtain clear polystyrene spectra (Fig.2A) from these samples, and
furthermore were able to select a specific band (1004 cm-1) for vibration of the
aromatic ring group of polystyrene for chemically imaging. We decided to image
(Fig.2D) the samples with a step size of 1 μm, by using a nanometer scanning stage
build onto the SEM sample stage, to show the efficacy of the system. We found that
sample movement was very accurate and analysis of very small samples was
possible.
Figure 2: Raman spectrum (A) of the first bead from the left, showed in electron micrograph B. Inset C: 5 µm diameter polystyrene beads, transmission light micrograph observed trough the objective lens. Inset D: Corresponding Raman image (1 pixel=1 µm) using the 1004 cm-1 band of polystyrene. Scalebar in B represents 10 µm, C and D 5 µm.

CRSEM and bone ECM by rat osteoprogenitor cells
131
CRSEM and biomimetic carbonated apatite like coatings (CO3-AP)
After establishing the feasibility of our measurement system, we measured several
cross-sections of thin CO3-AP coatings on titanium alloy plates, to check if we
could reproducibly measure a more complex sample. Cross-sections of coatings
were all measured in the center to ensure that all measurements were performed in
the same manner (Fig. 3). The obtained spectra (Fig. 4A) show Raman bands
belonging to the phosphate group vibration modes: 960 cm-1 υ1, 430-450 cm-1 υ2,
1030-1040 cm-1 υ3, 580-590 cm-1 υ4 and also a band around 1070 cm-1, which is
due to the presence of CO32- stretch vibration of the carbonate group13.
Figure 3: Electron micrograph showing a cross-section of CO3-AP coating, Raman spectra were collected at the center of the cross-section (asterices). Scalebar represents 20 µm.
CRSEM and bone ECM by rat osteoprogenitor cells
After 14 days of culture in osteogenic medium rat osteoprogenitor cells had
produced a vast amount of well-organized ECM on the surface of the Ti alloy discs.
In all cases the samples were covered with smooth layer of cells. In order to reveal
the underlying ECM structure and study the matrix without interference of possible
contribution of cells to our Raman spectra we had to gently remove this top-layer.
After removing the top layer of cells according to method described in the material

CRSEM and bone ECM by rat osteoprogenitor cells
132
and methods, a network of fibers could be observed, which upon closer
examination had a roughened surface (figures. 4C and 4D).
Figure 4: A: Raman spectra of femoral rat bone, CO3-AP, B: ECM and collagen type I. C, D, E: Electron micrographs of ECM produced by rat osteoprogenitor cells, showing mineralized collagen fiber bundles (width 0.1-0.5μm). F: Raman image from an area of E, which was subsequently imaged using the 960 cm-1 PO4
2- band (1pixel=0.5 µm). Scale bar C, E represent 5 µm and D 1 µm.
We selected locations free of cells and with abundant ECM for our Raman
measurements. As a reference, although not exactly similar to native rat bone
collagen type I, we measured biochemically purified bovine collagen type I
obtained from tendons (commercially available from Sigma, the Netherlands). The
Raman spectra of ECM (figure. 4A) show both, bands belonging to carbonated
apatite, as well as bands belonging to protein, mainly collagen type I. The spectra
obtained from ECM were comparable to spectra from mature bone. Raman

Discussion
133
imaging revealed that mineralization of the matrix was found to be heterogeneous
(figure. 4F), whereas in mature bone this is found to be homogenous (figure. 5A).
XRMA of the same areas revealed the presence of calcium, phosphorus, carbon
and oxygen, which confirms the data obtained by Raman spectroscopy (figures. 5
and 6).
Figure 5A: Electron micrograph of the surface of bone, showing a 15-20μm microcrack and subsequent corresponding Raman images 50x50 µm (1pixel=1µm) of protein (1400-1440 cm-1, red square), CO3
2- (1070 cm-1, green square) and PO43-
(960 cm-1, blue square). Fig 5B: XRMA maps for C, O, P, and Ca, the white squared area corresponds with electron-micrograph in A. Scale bar in A 50 µm and B 25 µm.
Figure 6: XRMA spectra of bone and ECM, all measurement parameters were kept the same (15 KeV, spotsize 4, collection-time 260 sec. working-distance 10 mm)
Discussion
In this study we investigated the feasibility of combining CRS with SEM and report
on the performance of this system on tissue engineered samples. Measurements of
10 to 2 μm diameter polystyrene beads showed that clear Raman spectra, with low
signal to noise ratio can be obtained, which in turn can be used for chemical
imaging. Investigation of thin layers of carbonated apatite, a major component of

Discussion
134
bone, on titanium alloy plates revealed the presence of Raman bands belonging to
both PO43- and CO3
2- 13. SEM investigation of rat osteoprogenitor cells on titanium
alloy plates after 14 days showed that ECM had formed, that was composed of a
network of fibers which have a mineralized appearance. Measurements taken from
different spots of this matrix revealed that Raman bands belonging to PO43-, CO3
2-
and protein, could be found, which could not be deduced initially from x-ray
microanalysis data from the same sites. It is clear that when comparing the ECM
spectra to the spectra of CO3-AP coatings, pure collagen type I, and the histological
observations made by SEM, the extra bands in these spectra are mainly contributed
by the presence of collagen type I in the ECM. This was also concluded in studies
done on dentin14, 15, bone16, 17 and osteoblast cultures18 in which confocal Raman
spectroscopy showed similar bands for collagen as in our study. The spectra of pure
collagen type I show differences in intensity of peaks when compared to the
spectra of ECM. This can be explained by the fact that we measured biochemically
purified protein as a standard, whereas the ECM contains also other proteins and
inorganic components each contributing to the total ECM spectrum. The amide III
protein band position observed in both ECM (1270-1300 cm-1) and pure collagen
type I (1242-1282 cm-1) spectra, indicate that Collagen type I in the ECM is likely to
be in the form of a α-helical structure, while the purified collagen type I is probably
more disordered and in an irregular form19-22 probably caused by the biochemical
purification process of this material. Collagen type I is the major contributing
protein to bone extra cellular matrix, but certainly not the only one present in the
matrix. It is well established that bone ECM contains also proteins like, osteopontin,
bone sialoprotein, bone morphogenic proteins, osteocalcin and many more,
however in much lower amounts. The abovementioned added to the fact that the
amount and purified form are different, might explain the slight shape differences
in the collagen type I specific peaks observed in figure 4. Interestingly, the ratio of
the protein to phosphate group Raman band intensities seems to be higher in

Discussion
135
mature bone, than in ECM. It is know that during the development of bone ECM
deposition of carbonated apatite takes place before a collagen network can
accumulate23, 24, this probably explains the difference in ratio found in our study.
High resolution Raman imaging revealed that ECM contains areas which are more
mineralized than others, caused by the distribution of collagen fibers and the
presence of small spherical structures composed of carbonated apatite. Raman
images and XRMA maps of mature bone on amide III, CO32- and PO4
3- revealed
that the composition of bone is much more homogenous than ECM, possibly
because in bone the ECM is compacted to a dense structure. Raman imaging of
these surfaces showed that with the increase of surface topography complexity, the
interpretation of the generated Raman image becomes increasingly more difficult.
The difficulty in analysis can be explained by the fact that the confocality of the
system allows for so-called “optical sectioning”, meaning that scanning of the
surface of a sample is done in one focal plane. The focal spot in turn, has a certain
measuring volume and therefore the appearance of electron micrograph, which is a
3D observation, and Raman micrograph, which is a 2D observation, can be slightly
different. An example of this effect is shown in figure 2, were the edges of the
polystyrene beads show clearly a lower intensity than in the center and also to
some extent in the Raman micrographs of bone shown in figure 5. The information
in the Raman image does not only reveal chemical, but topographical data as well,
more than could be found by XRMA (see figure 5), which adds to structural
information obtained by SEM. Future research on in vivo bone formation using the
abovementioned combined technique can possibly reveal more detailed
information on bone growth in defect areas, the data found in this study suggests
that bone forming cells start producing ECM resembling mature bone from an early
time point. The use of CRS in a SEM can enlarge the field of applications of sample
analysis by electron microscopy to a great extent. Although in this paper we
investigated bone extra cellular matrix, this application can also be used for other

References
136
sample types were information about molecular composition is necessary. Newly,
non resonant Raman imaging of single cells has been used to map DNA and
protein distributions in human cells25, 26. This revealed that protein distribution
varies with cell type and that the presence of RNA inside the nucleus of HeLA cells
could be detected for the first time. However, light microscopy used in these
studies in order to study these distributions, is extremely limited in that the physical
properties of light limit the ultimate resolution for observation. Combining confocal
Raman spectroscopy with SEM like described in this manuscript could be
interesting for studying intra-cellular processes, like phagocytosis, cellular
differentiation and apoptosis, while in the same time being able to study cell
morphology with very high resolution at very high magnifications. Moreover, this
technique allows one to pinpoint structures with submicron dimensions by SEM,
and then subsequently analyze them by confocal Raman spectroscopy. In addition,
Raman imaging in combination with environmental SEM, would allow one to
image directly, without prior labeling of molecules of interest, while in the
meantime maintaining the normal functioning of the cells.
References
1. Puppels, G. J.; de Mul, F. F.; Otto, C.; Greve, J.; Robert-Nicoud, M.; Arndt-Jovin, D. J.; Jovin, T. M., Studying single living cells and chromosomes by confocal Raman microspectroscopy. Nature 1990, 347, (6290), 301-3. 2. Oghusi, H., Dohi, Y., Katuda, T., Tamai, S., Tabata, S., Suwa, Y., In vitro bone formation by rat marrow cell culture. Journal of biomedical materials research 1992, 32, 333-340. 3. Yoshikawa, T.; Ohgushi, H.; Dohi, Y.; Davies, J., Viable bone formation in porous hydroxyapatite: marrow cell-derived in vitro bone on the surface of ceramics. Biomed Mater Eng 1997, 7, (1), 49-58. 4. Yamamoto, N.; Furuya, K.; Hanada, K., Progressive development of the osteoblast phenotype during differentiation of osteoprogenitor cells derived from fetal rat calvaria: model for in vitro bone formation. Biol Pharm Bull 2002, 25, (4), 509-15. 5. Ou-Yang, H.; Paschalis, E.; Mayo, W.; Boskey, A.; Mendelsohn, R., Infrared microscopic imaging of bone: spatial distribution of CO3(2-). J Bone Miner Res 2001, 16, (5), 893-900. 6. Walters, M.; Leung, Y.; Blumenthal, N.; Le, G. R.; Konsker, K., A Raman and infrared spectroscopic investigation of biological hydroxyapatite. J Inorg Biochem 1990, 39, (3), 193-200. 7. Rehman, I.; Smith, R.; Hench, L. L.; Bonfield, W., Structural evaluation of human and sheep bone and comparison with synthetic hydroxyapatite by FT-Raman spectroscopy. J Biomed Mater Res 1995, 29, (10), 1287-94.

References
137
8. Penel, G., Leroy, G., Bres, E., New preparation method of bone samples for raman microspectroscopy. Applied spectroscopy 1998, 52, (2), 312-313. 9. Freeman, J. J., Silva, M.J., Separation of the raman spectral signatures of bioapatite and collagen in compact mouse bone bleached with hydrogen peroxide. Applied Spectroscopy 2002, 56, (6), 770-775. 10. Timlin, J. A.; Carden, A.; Morris, M. D.; Rajachar, R. M.; Kohn, D. H., Raman spectroscopic imaging markers for fatigue-related microdamage in bovine bone. Anal Chem 2000, 72, (10), 2229-36. 11. Kale, S.; Biermann, S.; Edwards, C.; Tarnowski, C.; Morris, M.; Long, M. W., Three-dimensional cellular development is essential for ex vivo formation of human bone. Nat Biotechnol 2000, 18, (9), 954-8. 12. Maniatopoulos, C.; Sodek, J.; Melcher, A., Bone formation in vitro by stromal cells obtained from bone marrow of young adult rats. Cell Tissue Res 1988, 254, (2), 317-30. 13. Penel, G.; Leroy, G.; Rey, C.; Bres, E., MicroRaman spectral study of the PO4 and CO3 vibrational modes in synthetic and biological apatites. Calcif Tissue Int 1998, 63, (6), 475-81. 14. Kirchner, M. T., Edwards, H.G.M., Ancient and modern specimens of human teeth: a fourier transform raman spectroscopic study. Journal of raman spectroscopy 1997, 28, 171-178. 15. Wang, Y.; Spencer, P., Analysis of acid-treated dentin smear debris and smear layers using confocal Raman microspectroscopy. J Biomed Mater Res 2002, 60, (2), 300-8. 16. Tarnowski, C. P.; Ignelzi, M. A., Jr.; Morris, M. D., Mineralization of developing mouse calvaria as revealed by Raman microspectroscopy. J Bone Miner Res 2002, 17, (6), 1118-26. 17. Dopner, S.; Muller, F.; Hildebrandt, P.; Muller, R. T., Integration of metallic endoprotheses in dog femur studied by near-infrared Fourier-transform Raman microscopy. Biomaterials 2002, 23, (5), 1337-45. 18. Stewart, S., Shea, D.A., Tarnowski, C.P., Morris, M.D., Wang, D., Franscheschi, R., Lin, D.L., Keller, E., Trends in early mineralization of murine calvarial osteoblastic cultures: a raman microscopic study. Journal of raman spectroscopy 2002, 33, 536-543. 19. Guan, Y., Lewis, E.N., Levin, I.W., Biomedical application of raman spectroscopy: Tissue differentiation and potential clinical usage. In Raman spectroscopy, ed.; Pelletier, M. J., 'Ed.'^'Eds.' Blackwell Science Ltd.: London, 1991; 'Vol.' p^pp. 20. Renugopalakrishnan, V.; Carreira, L.; Collette, T.; Dobbs, J.; Chandraksasan, G.; Lord, R., Non-uniform triple helical structure in chick skin type I collagen on thermal denaturation: Raman spectroscopic study. Z Naturforsch [C] 1998, 53, (5-6), 383-8. 21. Barron, L., Hecht, L., Blanch, E.W., Bell, A.F., Solution structure and dynamics of biomolecules from raman optical activity. Progress in Biophysics and moleculr biology 2000, 73, 1-49. 22. Carden, A.; Rajachar, R.; Morris, M.; Kohn, D., Ultrastructural changes accompanying the mechanical deformation of bone tissue: a Raman imaging study. Calcif Tissue Int 2003, 72, (2), 166-75. 23. Davies, J. E., In vitro modeling of the bone/implant interface. Anat Rec 1996, 245, (2), 426-45. 24. Davies, J., Mechanisms of endosseous integration. Int J Prosthodont 1998, 11, (5), 391-401. 25. Uzunbajakava, N.; Lenferink, A.; Kraan, Y.; Willekens, B.; Vrensen, G.; Greve, J.; Otto, C., Nonresonant Raman imaging of protein distribution in single human cells. Biopolymers 2003, 72, (1), 1-9. 26. Uzunbajakava, N.; Lenferink, A.; Kraan, Y.; Volokhina, E.; Vrensen, G.; Greve, J.; Otto, C., Nonresonant confocal Raman imaging of DNA and protein distribution in apoptotic cells. Biophys J 2003, 84, (6), 3968-81.

The physicochemical composition of osteoporotic bone in the TTD premature aging mouse determined by
138
The physicochemical composition of
osteoporotic bone in the TTD
premature aging mouse determined by
confocal Raman microscopy

Definitions of bone found on the internet
139
Definitions of bone found on the internet
cram: study intensively, as before an exam; "I had to bone up on my Latin verbs before the final exam" wordnet.princeton.edu/perl/webwn Bone is a popular independent comic book series by Jeff Smith. Smith's drawings are inspired by animated cartoons and comic strips, a notable influence being Walt Kelly's Pogo. However, although the series contains a great deal of both visual and character-based comedy, the main storyline is dark and serious, drawing its inspiration from J. R. R. Tolkien and others. en.wikipedia.org/wiki/Bone_(comic) In corsetry, a bone is one of the rigid parts of a corset that forms its frame, gives it rigidity, and helps to shape the wearer's body. en.wikipedia.org/wiki/Bone_(corsetry) Bone refers either to a hardened connective tissue or to one of the individual structures, or organs, into which it is formed, found in many animals. Bones support body structures, protect internal organs, and (in conjunction with muscles) facilitate movement; are also involved with cell formation, calcium metabolism, and mineral storage. The bones of an animal are, collectively, known as the skeleton. en.wikipedia.org/wiki/Bone hard type of connective tissue, primarily made up of osteoblasts, osteocytes, and collagen, that supports and protects the body. www.urologychannel.com/common/glossary/index_a_d.shtml living tissue that makes up the body's skeleton. www.health.uab.edu/show.asp Dense tissue that forms the skeleton. Bone can be donated and transplanted. www.organdonor.gov/glossary.html the hard form of connective tissue that constitutes the majority of the skeleton of most vertebrates; it consists of an organic component (the cells and matrix] and an inorganic, or mineral, component; the matrix contains a framework of collagenous fibers and is impregnated with the mineral component, chiefly calcium phosphate (85%] and calcium carbonate [10%], which imparts the quality of rigidity to bone. Called Osseous

Definitions of bone found on the internet
140
tissue. 2. Any distinct piece of the osseous framework, or skeleton, of the body. www.cranialtherapies.com/glossary.html a trick where you bone out your leg means you straighten it all the way out. A "boned out grab" is one where your leg or legs are straightened out while grabbing your board. www.kitesurfingschool.org/glossary.htm the hard extremely dense material that forms the skeleton of the body. It is composed of fibres of a material called collagen filled in with minerals - mainly calcium salts - rather like reinforced concrete. The bones of the skeleton have a thick outer shell or 'cortex' inside which there is a meshwork of 'trabecular' bone. www.arc.org.uk/about_arth/glossary.htm Bone is the substance that forms the skeleton of the body. It is composed chiefly of calcium phosphate and calcium carbonate. It also serves as a storage area for calcium, playing a large role in calcium balance in the blood. www.bdid.com/termsb.htm the hard tissue, composed of both organic and inorganic materials, which makes up the skeletons of adult vertebrates. Because of their density, bones may survive in the archaeological record long after the decomposition of the soft tissue. www.umanitoba.ca/faculties/arts/anthropology/manarchnet/appendices/glossary.html Bone is living, growing tissue – made mostly of collagen, a protein that provides a soft framework, and calcium phosphate, a mineral that adds strength and hardens the framework. This combination of collagen and calcium makes bone strong yet flexible to withstand stress. More than 99% of the body’s calcium is contained in the bones and teeth. www.osteoporosisflorida.org/Definitions.htm This raw material was used by native Americans for many tools and ornaments. Bone tools included hide fleshers, fishhooks, hide grainers, arrowheads, paintbones, needles, knife handles, quill flatteners, and agricultural tools such as hoes and rakes. www.natureshift.org/history/glossary/g_first.html A connective tissue that contains a hardened matrix of mineral salts and collagen fibers. Its cells include osteocytes, which are embedded within lacunae, and the free-roaming osteoblasts and osteoclasts. www.sci.sdsu.edu/histology/gloss_a.htm a horse's 'bone' is measured just below the knee. www.horsescanada.com/glossary.htm The hard tissue that provides structural support to the body, It is primarily composed of hydroxyapatite crystals and collagen. Individual bones may be classed as long, short, or flat. www.spinaldoc.com/Webpages.asp Any of numerous anatomically distinct structures making up the skeleton of a vertebrate animal. There are more than 200 different bones in the human body. www.clover.okstate.edu/fourh/aitc/lessons/glossary/bisfor.html to remove the bones from meat of fish to facilitate either stuffing or rolling. www.great-cooking-made-easy.com/glossary-A-C.html

Abstract
141
Abstract
We previously established a mouse model for trichothiodystrophy (TTD), exhibiting
many of the typical features of this human syndrome, including a number of
features of premature ageing. A key characteristic of TTD mouse strain is
osteoporosis with concomittant skeletal kyphosis as well as osteosclerosis of the
calvaria. Although we established that TTD mice display decreased bone mineral
density (BMD), typical of osteoporosis, the exact changes in physicochemical
properties of the mice remained to be elucidated. We used Confocal Raman
microscopy together with histology to study the properties of femora of TTD mice.
To establish that Raman microscopy can be applied to measure differences in bone
composition, we first measured femora of bones isolated from XPA/TTD double
mutant mice. Based on histology, we observed a severe form of osteoporosis, with
strongly reduced cortical bone thickness. Accordingly, Raman data obtained from
the XPA/TTD mice showed remarkable differences in bone mineral composition
compared to wildtype animals. Next, we used Raman spectroscopy to analyse bone
composition in mice of 10 wildtype and 10 TTD animals. We observed a
decreased level of phosphate and carbonate content in cortical bone of the femora
isolated from TTD mice compared to wildtype animals. In contrast, the protein
fraction of the bone, representing the bone matrix, was not affected, leading to the
conclusion that collagen type I content is not changed in these mice. In conclusion,
decreased mineralization rather than a change in bone matrix composition
underlies osteoporosis in the TTD mouse model.

Introduction
142
The physicochemical composition of osteoporotic bone in the TTD premature aging
mouse determined by confocal Raman microscopy
A.A. van Apeldoorn1, J. de Boer1, H. van Steeg 2, J.H.J. Hoeijmakers3, C. Otto4, C.A.
van Blitterswijk1
1Department of Polymer Chemistry and Biomaterials, Faculty of Technology and
Sciences, University of Twente, PO Box 98, 3720 AB Bilthoven, the Netherlands, 2Department of Carcinogenesis, Mutagenesis and Aging, The national institute for
public health and the environment (RIVM), P.O.Box 1, 3720BA Bilthoven, the
Netherlands, 3University Medical Center Rotterdam, Department of Genetics, P.O.
Box 1738, 3000DR, Rotterdam, the Netherlands, 4Department of Biophysical
Techniques, Faculty of Technology and Sciences, University of Twente, PO Box
217, 7500AE Enschede, the Netherlands
Introduction
Trichothiodystrophy (TTD) is a rare autosomal recessive disorder; patients are
characterized by premature aging showing symptoms as brittle hair, postnatal
mental and growth retardation, peculiar face, ichthyosis, and photosensitivity and
skeletal disorders1. Mice harbouring TTD specific point mutation in the Xeroderma
pigmentosum group D gene were found to show symptoms similar to those found
in the human disease2, 3. One of the key features found in this mouse strain are
skeletal abnormalities, as kyphosis, osteosclerosis of the calvaria and osteoporosis in
the vertebrea and limbs4. Osteoporosis is a condition of the bone were a decreased
bone mineral density (BMD) can be found5, 6. In humans osteoporosis can be
found in women and man especially at later age (>55 years), in the Netherlands
alone around an estimated number of 430.000 people are thought to be positive

Animals
143
for this bone defect7. The usage of premature aging mice models as a TTD mouse
seems to be an ideal candidate therefore to investigate whether decreased BMD
has an effect on the physicochemical bone composition. Nowadays, Raman
spectroscopy is more and more used to study biological samples because there is
little hindrance from water and complex sample preparation is unnecessary. Several
different authors have used Raman spectroscopy to study early mineralization of
osteoblasts8, mechanical deformation of cortical bone9 and fatigue related
microdamage of bovine bone samples10. In order to eliminate the protein
background fluorescence that frustrates the detection of the Raman spectra of bone
near-infrared excitation can be used 11. Frozen or embedded sample sections with
thicknesses ranging from less than 1 μm to samples of intact tissues or cells can be
analyzed by using a confocal setup. In hydroxyapatite, a major component of bone,
the phosphate υ1 vibration is found at 960 cm-1. When hydroxyapatite becomes
less perfect, for example, the mineral lattice has decreased crystalline-to-
amorphous ratio, or vacancies and/or substitutions, the Raman band of phosphate
can broaden or shift to lower wavenumbers. The phosphate υ1 vibration (960 cm-1)
and monohydrogen phosphate υ1 vibration (1003 cm-1) are considered accurate
markers of substitution and structure of the mineral at hand12, 13. In addition, the
Raman bands positioned around 1200–1300 (amide III), 1600–1700 (amide I)
cm−1 and, 1400–1470 and 2800–3100 cm−1 (bending and stretching modes of CH
groups, respectively) are markers for the organic component of bone matrix (mainly
collagen type I). We have used Confocal Raman microscopy together with histology
to study the femora of TTD mice.
Material and methods
Animals
In this study two mouse strains were examined by confocal Raman spectroscopy
and histology. The first cohort consisted of mice in a C57BL/6 background, which

Confocal Raman microscopy
144
were either wildtype (WT mice) or homozygous for the mutation XPDR722w (TTD
mice). A group of 8 TTD female mice were observed at 18 months postnatal, at
which time points the mice were euthanized and the femora removed to be used
for Confocal Raman microscopy.
The second cohort consisted of mice with a mixed C57Bl/6:129 background all
with a homozygous mutation in the XPA gene14. In addition, mice were either
wildtype (XPA mice) or homozygous for the mutation in XPDR722w (XPA-TTD mice).
A group of 4 female XPA-TTD mice used as a positive control for decreased mineral
content was the same as the one previously described earlier.4. Since XPA-TTD
mice show a very low neonatal survival, and fail to thrive at 3 weeks of age at
which point most animals die, the number of animals observed in this group was
low (n=4), because of their limited survival. Therefore the data obtained from the
XPA-TTD mice can only be used to describe the phenotype in a qualitative manner.
The femora from these mice were explanted for confocal Raman microscopy and
histology in the same manner as the TTD mice.
Femora
After removal, the femora were fixated in a 4 % paraformaldehyde solution for at
least 24 hours, after which excessive tissue, mainly connective tissue and muscle,
was removed. The samples were then dehydrated in an increasing ethanol series
from 70% until 100% after which they were critical point dried using a BAL-TEC
CPD 030 Critical Point Dryer machine. In case of femora obtained from XPA-TTD
mice, the left leg was used for histological evaluation while the right leg was used
for critical point drying and Raman spectroscopy.
Confocal Raman microscopy
We used an in house build confocal Raman microscope, extensively described
elsewhere15-18, to measure the isolated femora at the bone surface. In short, the

Histology
145
excitation wavelength used was the 647.1 nm line from a Kr ion laser. The field of
view is approximately 58 μm in diameter when a 63× NA = 1.2 water immersion
objective (Zeiss Plan Neofluar) is used. A blazed holographic grating with 600
grates/mm (Jobin-Yvon, Paris) was used for dispersion. The lateral resolution is
limited by the diffraction and is 550 nm for this system. The definition of the
resolution is based on the diameter of the laser beam waist at which the beam
intensity has fallen to 1/e2 of its peak value. In all cases the specimens were
measured with 30 mW for 45 seconds in order not to damage the specimens by
overexposure and to ensure a good signal to noise ratio. The CCD is connected
with a computer for data collection and analysis using WinSpec (Roper Scientific
Inc., USA) and Microcal Origin (Microcal software inc., USA) data analysis software.
All measurements (n=10) per femora (n=8) were performed in a randomized
manner at the cortex surface. Femora of the wild type mouse strain were measured
in the same way for comparison. After data correction for background fluorescence
the intensity of specific bone mineral and bone matrix Raman bands was
determined. Based on data published by de Boer et al.4 of these mice, we expect
the TTD bone mineral content to be lower than in the wild type. The average
intensities of both wild type and TTD mouse strain bone mineral bands (phosphate
and carbonate) were compared using a one–tailed Student T-test with homo-
scedastic sampling. The intensities of bone matrix specific bands, mostly related to
collagen type I, were compared using a two-tailed distribution, while no data on
the bone matrix content of these bones was known beforehand.
Histology
In order to study its histology, the complete left hind leg of XPA-TTD mice and
control animals were fixated in 4 % paraformaldehyde for at least 24 hours. After
fixation the samples were dehydrated in an increasing ethanol series (70-100%)
after which they were immersed in a methyl methacrylate (MMA) solution. Vacuum

Results
146
was applied for 2 hours to ensure air bubbles were removed before placing the
samples in a waterbath at 37 ºC for 2 days in order to polymerize the MMA. After
embedding serial sections were made on a Leica SP 1600 innerlock diamond saw
(Leica microsystems, Germany). The obtained sections were stained using
methylene blue (Sigma, The Netherlands) and basic fuchsine (Sigma, The
Netherlands) for light microscopic examination.
Results
The Raman spectra obtained from one of the four XPA-TTD mice observed in this
study showed remarkable differences in respect to the control group. Although the
number of animals did not allow for a sound statistical analysis and the differences
in the other animals observed were not as extreme, the differences in these spectra
are quite noteworthy. In figure 1 an example of a spectrum in which the
differences were most extreme from a XPA-TTD mouse is shown in comparison to
spectra obtained from a control group animal.
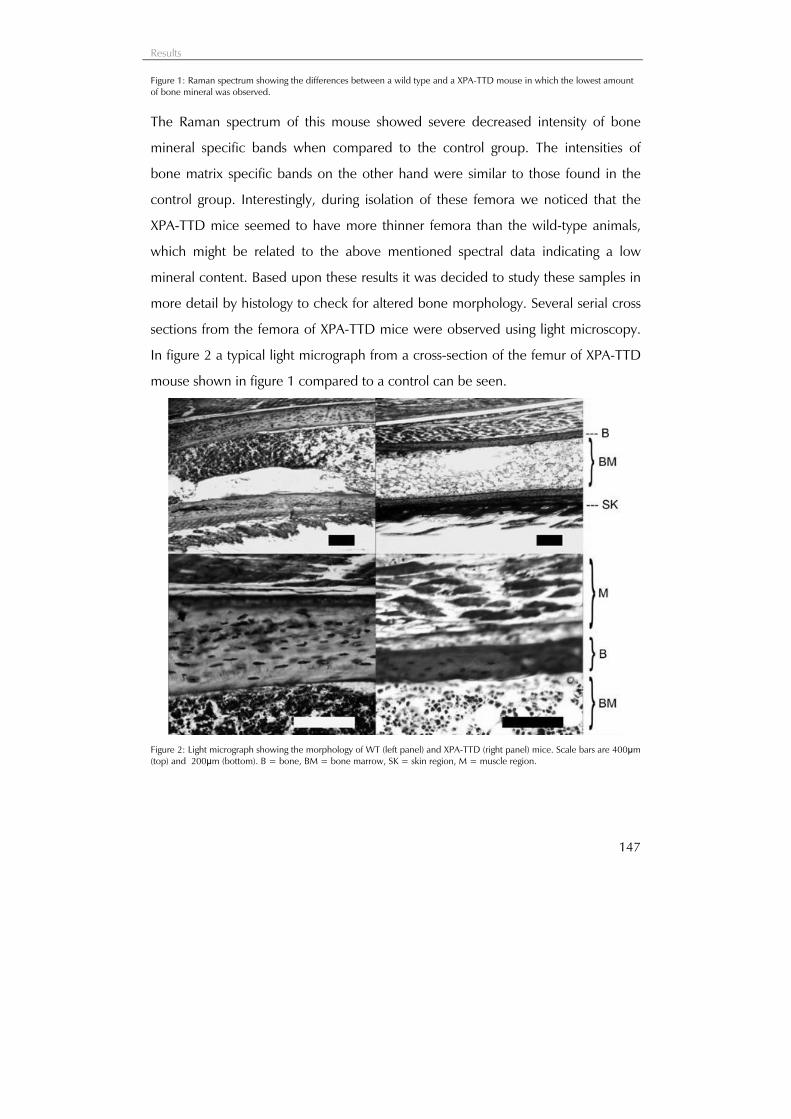
Results
147
Figure 1: Raman spectrum showing the differences between a wild type and a XPA-TTD mouse in which the lowest amount of bone mineral was observed.
The Raman spectrum of this mouse showed severe decreased intensity of bone
mineral specific bands when compared to the control group. The intensities of
bone matrix specific bands on the other hand were similar to those found in the
control group. Interestingly, during isolation of these femora we noticed that the
XPA-TTD mice seemed to have more thinner femora than the wild-type animals,
which might be related to the above mentioned spectral data indicating a low
mineral content. Based upon these results it was decided to study these samples in
more detail by histology to check for altered bone morphology. Several serial cross
sections from the femora of XPA-TTD mice were observed using light microscopy.
In figure 2 a typical light micrograph from a cross-section of the femur of XPA-TTD
mouse shown in figure 1 compared to a control can be seen.
Figure 2: Light micrograph showing the morphology of WT (left panel) and XPA-TTD (right panel) mice. Scale bars are 400μm (top) and 200μm (bottom). B = bone, BM = bone marrow, SK = skin region, M = muscle region.

Results
148
In both XPA-TTD and XPA mice a similar appearance of bone marrow and
osteocytes can be found. However, in case of the XPA-TTD mouse shown here, the
thickness of the cortical bone was at least two fold less than what was observed in
the controls. These results relate to what was observed initially during explantation
of the femora, at which we found XPA-TTD mouse femora to be more delicate
than compared to wild type and TTD femora.

Results
149
Figure 3: Raman spectra from femora of TTD (A) and WT (B) mice showing both the molecular assignment and band position of bone mineral and matrix specific Raman bands.
In case of TTD mice average Raman spectra were used for determination of peak
intensities. Raman spectra of both the controls and TTD mice showed specific bone

Results
150
mineral and bone matrix Raman bands (see figure 3A and B). The bone mineral
bands observed were the phosphate (PO4–3) v1 symmetric stretch at 960 cm-1 and
the B-type carbonate (CO3–2) v1 symmetric stretch at 1070 cm–1. The bone matrix
bands markers for the collagen backbone, amide I at 1655 cm–1, amide III at 1250
cm-1, methylene (CH2)-wag at 1450 cm–1 and phenylalanine at 1004 cm-1 could all
clearly be observed in both groups. The average spectra of the total number of
spectra of TTD mice showed a slightly lower intensity of the main phosphate band
in respect to the control mice (see figure 4). In figure 5A and B the average
intensities of the individual mice of the most important Raman bands described in
table 1 at 960, 1004, 1042, 1070, 1453 and 1669 cm-1 were plotted, showing the
variation in mineral content within the group of animals investigated.
Figure 4: Comparison of average Raman spectra of TTD and wild type mice, showing the difference in intensity of the ν1 asymmetric stretch mode belonging to PO4
3-, indicating a lower mineral content in TTD mice.

Results
151
Figure 5: Comparison of the variation of the intensities of the main Raman bands observed in the TTD mouse and the wild type cohort.

Discussion
152
A summary of the average intensities of these different Raman bands can be found
in table 1.
Table 1: Bone mineral and bone matrix protein Raman bands obtained from wildtype and TTD mice (n=8).
The data seem to suggest that mineral content in non TTD mice is slightly above
that of TTD mice. Results after statistical analysis showed that the average mineral
content in TTD mice was lower than could be found in the wildtype group. The
band for the ν1 PO43- symmetrical stretch (960 cm-1) and CO3
2- (1070 cm-1) were
both lower in the TTD mice than the wild type mice (p=0.029 and p=0.033
respectively), indicating a change in physicochemical content. The bone matrix
specific bands, which can be found around 1250, 1450 and 1650 cm-1 do not
seem to be affected in the TTD mice as the intensities of these bands did not show
any differences in respect to the control group.
Discussion
TTD mice show many symptoms of early aging, including a decreased mineral
density in vertebrae and limbs leading to osteoporosis. TTD-XPA mutant mice
exhibit an even faster rate of aging resulting in amongst others a severely shortened
lifespan (3 weeks) and spinal kyphosis, which is indicative for osteoporosis,
compared to TTD mice4. The primary indication for osteoporosis is loss of bone,
which can be measured by decreased BMD. Raman spectroscopy and/or imaging
Strain Wild type (BL/6) TTD
Raman
shift (cm-1)
Average
Intensity
(a.u.)
sd Ratio
(Ixcm-1/I960cm
-1)
Average
Intensity
(a.u.)
sd Ratio
(Ixcm-1/I960cm-1)
Assignment
960 3583.50 724.38 1 3002.13 638.34 1 PO4 3-
1004 451.38 87.92 7.939 381.38 93.44 7.872 Phenylalanine
1042 565.63 126.47 6.336 473.13 68.89 6.345 CO3 2-
1070 723.50 132.48 4.953 617.13 124.39 4.865 CO3 2-
1453 515.00 104.44 6.958 440.75 114.06 6.811 CH2 CH3 COO
1669 363.00 71.65 9.872 339.50 85.93 8.843 Amide I

Discussion
153
have been used in several studies to evaluate bone mineral and bone matrix
composition of bone samples10, 19-23. In this study we have used Confocal Raman
microscopy to investigate the physicochemical composition of femoral bone from
TTD and XPA-TTD mice. Raman measurements of one the XPA-TTD mice used in
this study showed remarkable differences in bone mineral composition compared
to wildtype animals. Although the data presented here did not allow for a statistical
analysis, because of the number of animals observed, the amount of bone mineral
seems to be reduced in the femora from these animals. The XPA-TTD mouse
showing the lowest amount of bone mineral observed in this study appeared not
only to have less bone mineral, but less bone mass as well. The fact that femora
isolated from these animals seemed to be more fragile than TTD or WT femora at
first glance concurs with these observations. In addition, histology revealed that the
thickness of cortical bone for these mice was around two fold less than what could
be found in the control mice. The histo- and morphological observations made on
XPA-TTD mice were confirmed by the outcome of confocal Raman microscopic
observations; this allowed us to use this technique to study TTD mouse femora in
more detail. Raman spectroscopy showed a decreased level of phosphate and
carbonate content present in cortical bone of femora isolated from TTD mice
compared to WT animals. In contrast, the bone matrix content was not affected,
leading to the conclusion that collagen type I content is not changed in these mice.
The variation in bone mineral content per femora between TTD mice was similar to
what was observed for TTD mice where X-ray radiographs were used to determine
bone density4. Although the differences in bone mineral content in TTD and WT
mice found in this study are not large, it might explain the decreased bone density
found in the abovementioned study. A study in Sprague-Dawley rats has shown
that bone stiffness increased with increase of degree of mineralization, carbonate
content and crystallinity of bone mineral24. Although no crystallinity and
mechanical measurements were done during our study the differences found in

Discussion
154
bone composition of TTD and XPA-TTD mice compared to the control animals
could mean that bone stiffness in these animals is lower than that of the wildtype
animals. Bone formation is highly dependent on the presence of sufficient
osteoblasts, which actively deposit bone extra cellular matrix. However, the
amount of cells with osteogenic potential which are present depends of the
individual’s age and physiological state. Research, done on the effect of donor age
and the capacity of mesenchymal stem cells isolated from patients, showed a
significant decrease in osteogenic potential of these cell populations at age 50 years
and higher. The decrease in osteogenicity was related to proliverative capacity of
the mesenchymal stem cells (MSCs) in culture, especially at older age25. The ability
to form so called colony forming units, or CFU’s, from human bone marrow was
also found to be negatively influenced at later age26. Furthermore, studies
perfomed in animals 27 and humans 28, 29 showed that the capacity to express
alkaline phosphatase, an osteoblast specific marker, also decreases during aging in
these cells. For future experiments it would be interesting to isolate MSCs from TTD
and XPA-TTD mice to gain insight in their proliferative and differentiation capacity.
Since these mice show fast premature aging, MSCs isolated from these animals
could very well be hampered in their ability to form bone, like was shown for MSCs
from human origin. In this study we concentrated on the usage of confocal Raman
microscopy for the analysis of bone physicochemical composition derived from a
well known premature aging mouse model in called trichothiodystrophy. The data
found by Raman spectroscopy presented in this paper adds to results published by
us on these mouse models, bone mineral content in TTD mice was found to be
lower, while bone matrix protein content was similar to the WT animals observed
in this study.
Acknowledgements
This research was funded by the Dutch technology foundation (STW).
References
155
References
1. Bergmann, E.; Egly, J.-M., Trichothiodystrophy, a transcription syndrome. 2001, 17, (5), 279. 2. de Boer, J.; de Wit, J.; van Steeg, H.; Berg, R. J.; Morreau, H.; Visser, P.; Lehmann, A. R.; Duran, M.; Hoeijmakers, J. H.; Weeda, G., A mouse model for the basal transcription/DNA repair syndrome trichothiodystrophy. Mol Cell 1998, 1, (7), 981-90. 3. de Boer, J.; Donker, I.; de Wit, J.; Hoeijmakers, J. H.; Weeda, G., Disruption of the mouse xeroderma pigmentosum group D DNA repair/basal transcription gene results in preimplantation lethality. Cancer Res 1998, 58, (1), 89-94. 4. de Boer, J.; Andressoo, J. O.; de Wit, J.; Huijmans, J.; Beems, R. B.; van Steeg, H.; Weeda, G.; van der Horst, G. T.; van Leeuwen, W.; Themmen, A. P.; Meradji, M.; Hoeijmakers, J. H., Premature aging in mice deficient in DNA repair and transcription. Science 2002, 296, (5571), 1276-9. 5. Kanis, J. A., Osteoporosis and osteopenia. J Bone Miner Res 1990, 5, (3), 209-11. 6. Kanis, J. A., Assessment of fracture risk and its application to screening for postmenopausal osteoporosis: synopsis of a WHO report. WHO Study Group. Osteoporos Int 1994, 4, (6), 368-81. 7. van der Klift, M.; Burger, H.; de Laet, C. E. D. H.; Pols, H. A. P.; Gijsen, R.; Poos, M. J. J. C., Hoe vaak komt osteoporose voor en hoeveel mensen sterven eraan? In Volksgezondheid Toekomst Verkenning, Nationaal Kompas Volksgezondheid, ed.; RIVM: 2003. 8. Stewart, S., Shea, D.A., Tarnowski, C.P., Morris, M.D., Wang, D., Franscheschi, R., Lin, D.L., Keller, E., Trends in early mineralization of murine calvarial osteoblastic cultures: a raman microscopic study. Journal of raman spectroscopy 2002, 33, 536-543. 9. Carden, A.; Rajachar, R.; Morris, M.; Kohn, D., Ultrastructural changes accompanying the mechanical deformation of bone tissue: a Raman imaging study. Calcif Tissue Int 2003, 72, (2), 166-75. 10. Timlin, J.; Carden, A.; Morris, M.; Rajachar, R.; Kohn, D., Raman spectroscopic imaging markers for fatigue-related microdamage in bovine bone. Anal Chem 2000, 72, (10), 2229-36. 11. Pezzuti, J. A.; Morris, M. D.; Bonadio, J. F.; Goldstein, S. A., Hyperspectral Raman imaging of bone growth and regrowth chemistry. Proc. SPIE 1998, 3261, (Three-Dimensional and Multidimensional Microscopy: Image Acquisition and Processing V), 270-276. 12. Timlin, J.; Carden, A.; Morris, M., Chemical microstructure of cortical bone probed by Raman transects. Applied Spectroscopy 1999, 53, (11), 1429-1435. 13. Penel, G.; Leroy, G.; Rey, C.; Bres, E., MicroRaman spectral study of the PO4 and CO3 vibrational modes in synthetic and biological apatites. Calcif Tissue Int 1998, 63, (6), 475-81. 14. Vries, A. d.; van Oostrom, C. T. M.; Hofhuis, F. M. A.; Dortant, P. M.; Berg, R. J. W.; Gruijl, F. R. d.; Wester, P. W.; van Kreijl, C. F.; Capel, P. J. A.; Steeg, H. v.; Verbeek, S. J., Increased susceptibility to ultraviolet-B and carcinogens of mice lacking the DNA excision repair gene XPA. 1995, 377, (6545), 169. 15. Uzunbajakava, N.; Lenferink, A.; Kraan, Y.; Volokhina, E.; Vrensen, G.; Greve, J.; Otto, C., Nonresonant confocal Raman imaging of DNA and protein distribution in apoptotic cells. Biophys J 2003, 84, (6), 3968-81. 16. Uzunbajakava, N.; Lenferink, A.; Kraan, Y.; Willekens, B.; Vrensen, G.; Greve, J.; Otto, C., Nonresonant Raman imaging of protein distribution in single human cells. Biopolymers 2003, 72, (1), 1-9. 17. Uzunbajakava, N.; Otto, C., Combined Raman and continuous-wave-excited two-photon fluorescence cell imaging. Opt Lett 2003, 28, (21), 2073-5. 18. van Manen, H. J.; Uzunbajakava, N.; van Bruggen, R.; Roos, D.; Otto, C., Resonance Raman imaging of the NADPH oxidase subunit cytochrome b558 in single neutrophilic granulocytes. J Am Chem Soc 2003, 125, (40), 12112-3. 19. Bohic, S.; Rey, C.; Legrand, A.; Sfihi, H.; Rohanizadeh, R.; Martel, C.; Barbier, A.; Daculsi, G., Characterization of the trabecular rat bone mineral: effect of ovariectomy and bisphosphonate treatment. Bone 2000, 26, (4), 341-8. 20. Carden, A.; Rajachar, R. M.; Morris, M. D.; Kohn, D. H., Ultrastructural Changes Accompanying the Mechanical Deformation of Bone Tissue: A Raman Imaging Study. Calcif Tissue Int 2002. 21. Freeman, J.; Wopenka, B.; Silva, M.; Pasteris, J., Raman spectroscopic detection of changes in bioapatite in mouse femora as a function of age and in vitro fluoride treatment. Calcif Tissue Int 2001, 68, (3), 156-62. 22. Penel, G.; Leroy, G.; Leroy, N.; Behin, P.; Langlois, J.; Libersa, J.; Dupas, P., Raman spectrometry applied to calcified tissue and calcium-phosphorus biomaterials. Bull Group Int Rech Sci Stomatol Odontol 2000, 42, (2-3), 55-63. 23. Tarnowski, C. P.; Ignelzi, M. A., Jr.; Morris, M. D., Mineralization of developing mouse calvaria as revealed by Raman microspectroscopy. J Bone Miner Res 2002, 17, (6), 1118-26. 24. Akkus, O.; Adar, F.; Schaffler, M. B., Age-related changes in physicochemical properties of mineral crystals are related to impaired mechanical function of cortical bone. Bone 2004, 34, (3), 443-53. 25. Mendes, S. C.; Tibbe, J. M.; Veenhof, M.; Bakker, K.; Both, S.; Platenburg, P. P.; Oner, F. C.; de Bruijn, J. D.; van Blitterswijk, C. A., Bone tissue-engineered implants using human bone marrow stromal cells: effect of culture conditions and donor age. Tissue Eng 2002, 8, (6), 911-20. 26. Bab, I.; Passi-Even, L.; Gazit, D.; Sekeles, E.; Ashton, B. A.; Peylan-Ramu, N.; Ziv, I.; Ulmansky, M., Osteogenesis in in vivo diffusion chamber cultures of human marrow cells. Bone Miner 1988, 4, (4), 373-86. 27. Knight, S. M.; Gowen, M., The effect of age and sex on bone cell function. Cacified Tissue International 1992, 50, A12. 28. D'Ippolito, G.; Schiller, P. C.; Ricordi, C.; Roos, B. A.; Howard, G. A., Age-related osteogenic potential of mesenchymal stromal stem cells from human vertebral bone marrow. J Bone Miner Res 1999, 14, (7), 1115-22.

References
156
29. Glowacki, J., Influence of age on human marrow. Calcif Tissue Int 1995, 56 Suppl 1, S50-1.

Summary
157
Summary
This dissertation describes the use of confocal Raman microscopy and spectroscopy
in the field of tissue engineering. Moreover, it describes the combination of two
already existing technologies, namely scanning electron microscopy and confocal
Raman spectroscopy in one apparatus for the enhancement of the chemical
analytical capabilities of the electron microscope. The combined technology is
described in two chapters; one focussing on the analysis of typical tissue
engineered specimens where cells are combined with materials, and the other one
focussing on the alteration of the physicochemical properties of biomimetic calcium
phosphate coating materials by introduction of a model protein. Furthermore, in
this dissertation the use of Raman spectroscopy for the analysis of the degradation
of a polymer used for tissue engineering applications is described in two chapters.
These two chapters led to the idea of designing a simple cell culture model which
could be used to observe biomaterial degradation inside single cells by using a
technique called Raman imaging. Last but not least a study on the quality of bone
obtained from two premature aging mice strains showing altered bone composition
in comparison to normal mice is described.
In tissue engineering the analysis of degradation of biomaterials has always been an
important issue. An optimal biomaterial should remain intact long enough to
support healing of damaged or diseased tissue in order to restore its function.
Although this sounds relatively simple, one has to take numerous factors into
account. For example, the location were an implant is to be placed could demand
certain biomechanical properties, such as elasticity and/or stability. In addition, the
rate of degradation, slow or fast, the ability to take up water or inorganic molecules,
as well as issues like toxicity and biocompatibility are of great importance. This
means that biomaterials should be easy to tailor, for this allows a scientist in tissue
Summary
158
engineering to alter the mechanical, chemical and physical properties to the
implant site’s specific needs.
In chapter one a brief history of microscopy and the role Raman microscopy plays
during the development of microscopy is described. In chapters two and three the
use of confocal Raman spectroscopy for the analysis of poly ethylene glycol
terephtalate poly butylene terephtalate elastomeres is investigated. These
thermoplastic elastomers are composed of a soft hydrophilic segment called poly
ethylene glycol terephtalate (PEOT) and a hard hydrophobic segment called poly
butylene terephtalate (PBT). The material properties, i.e. stiffness, thermal
behaviour and degradability, can be customized by either varying the molecular
weight of PEG, used for the production of these polymers and/or the PEOT to PBT
mass ratio in the polymer. PEOT PBT copolymers are currently being used as
degradable materials for the use in medical applications and are sold under the
brand name Polyactive™. A number of studies have revealed the good
biocompatibility of PEOT PBT made materials in vitro as well as in vivo in several
different animals species varying from rats to goats. Since the unique composition
of these materials allows for the manufacturing of devices with a broad range of
physical and biological properties, these materials are intensively being studied for
tissue engineering applications. Several destructive chemical analysis techniques, i.e.
nucleo magnetic resonance spectroscopy, gel permeation chromatography and
differential scanning calorimetry, have been used in the past to study the
degradation of these polymers. However, when valuable morphological
information is needed to examine the effect of degradation on tissue engineering, a
non destructive analysis technique is preferred. Raman spectroscopy is a non
destructive molecular analysis technique which uses a monochromatic light source
for the detection of wavelength shifts caused by chemical bond vibrations. Until
now, no studies have been done on PEOT PBT polymers by using Raman

Summary
159
spectroscopy. Therefore it is necessary to characterize Raman spectra obtained
from these polymers, not only to gain knowledge about their spectral properties,
but also to check the feasibility of using this analysis technique for studying the
degradation of these materials in in vitro and in vivo models. In chapter two an
assessment was done of the Raman bands present in the spectra belonging to these
types of materials. We were able to assign several Raman bands to corresponding
molecular groups present in PEOT PBT polymers. Moreover, we could show in a
relatively simple laboratory degradation model, that Raman spectroscopy could
qualitatively be used to show signs of degradation by evaluating the decrease and
shape changes of certain specific Raman bands. In chapter three a more elaborate
investigation of degradation was done on certain specific polymer compositions
often used for tissue engineering applications in an animal model. We were not
only able to show similar signs of degradation in vivo as could be found in the
laboratory model, but we found that certain types of compositions, especially those
with a high polyethylene glycol content, were able to take up calcium phosphate,
leading to a so-called calcification of the polymeric material. Furthermore, it was
shown that the more soft and flexible materials with relatively high ratio of PEOT
versus PBT degraded faster than when a lower ratio of these blocks was present
and that macrophage like cells probably play a crucial role in the extended
degradation of these materials. In chapter four a simple intra cellular degradation
model was studied in combination with Raman imaging in order to investigate how
small polymeric fragments composed of poly lactic co glycolic acid (PLGA), would
be degradaded inside single macrophages. The idea was that PLGA microspheres
would either degradade in a homogenous manner from the outside in, or by a
autocatalytic degradation process, where a build up of acidic endgroups in the
center of the material cause a faster degradation from the inside out. The latter
process can be observed in large implants composed of this particular material. The
rationale behind this study was the observation of polymeric fragments inside

Summary
160
macrophage like cells, during our in vivo degradation study with PEOT PBT
materials, and the fact that in literature a controversy exists on the issue of
degradation behaviour of small PLGA devices. The use of Raman imaging showed
that PLGA microspheres, are degrading through both autocatalytic and
homogenous degradation and that this degradation takes place mainly through a
scissoring of the ester bond belonging to the glycolic acid groups. In chapter five
the use of a combination of scanning electron microscopy with confocal Raman
spectroscopy for the analysis of a ceramic coating containing biological factors is
described. Orthopedic implants are generally composed of titanium and its alloys
mainly because of its excellent mechanical properties. In order to enhance bone-
bonding capacities of these implants they can be coated with calcium phosphate
coatings. The benefit of using a biomimetic calcium phosphate coating is that these
are produced at 37 ºC and a controlled pH and as a result permit for the
incorporation of antibiotics and proteins. Previous studies on protein incorporation
in biomimetic calcium phosphate coatings showed an effect of protein on crystal
shape. In these studies bovine serum albumin (BSA) was used at different
concentrations in the precipitation solution in order to study its incorporation into
the coating. The result of these studies was that not only BSA had coprecipitated
with a carbonate apatite like coating, but the crystal structure had been altered as
well. Scanning electron microscopy revealed that the use of increasing
concentrations of BSA lead to a decrease in crystal size and changes in shape.
Nonetheless, the precise effect of the changes in crystal size and shape on
crystallinity of these coatings remained unclear. In this chapter the consequence of
different concentrations of BSA incorporated into biomimetic carbonated apatite
coatings in relation to the effect on crystal size, crystallinity and physical
appearance is described. The biomimetic carbonated apatite coatings were
examined by thin film X-ray diffraction (TF-XRD), and a combination of confocal
Raman spectroscopy and SEM. Results obtained during this study showed that not

Summary
161
only the presence of protein could be detected in a non destructive manner, but
information about the relative amount of protein present in the coating could be
obtained as well by using confocal Raman microscopy. Although the increase of the
BSA concentration did not seem to influence the crystallinity towards a great
extend, the increase in standard deviation of the calculated values together with
scanning electron microscopic observations suggest that the coating structure had
become more heterogeneous in its nature. The combination of SEM and confocal
Raman spectroscopy proved to be feasible analysis technique to investigate both
the morphology of these coatings and their physiochemical composition.
In chapter six another application of combined confocal Raman microscopy and
Scanning electron microscopy is shown for the analysis of typical bone tissue
engineered samples. In this chapter it is shown that a combination of confocal
Raman spectroscopy and scanning electron microscopy can be used for a non
destructive analysis with high resolution of cellular matrix deposited by specific cells
on a biomaterial surface. By using confocal Raman scanning electron microscopy
we could reveal that early in vitro formed bone extra cellular matrix produced by
rat osteoprogenitor cells chemically resembles mature bone. However, ratio
differences were observed with regard to phosphate versus protein specific Raman
bands, indicating that the in vitro cultured bone matrix is likely to be in a very early
state of bone formation. In addition we gained insight in the structure and chemical
composition of the ECM, which was composed of mainly mineralized collagen type
I fibers and areas of dense carbonated calcium phosphate related to the collagen
fiber density, as revealed by Raman imaging of SEM samples. We also established
that CRS-SEM allows the study of scanning electron microscopy specimens in a
non-destructive manner and provides high resolution structural and chemical
information about inorganic and organic constituents by parallel measurements on
the same sample.

Summary
162
In the last chapter confocal Raman spectroscopy was used for the analysis of
physicochemical composition of bone obtained from mice showing symptoms of
accelerated aging. In previous studies mice mutated in the human
trichothiodystrophy (TTD) alelle were found to show symptoms similar to those
found in the human disease. TTD is a rare autosomal recessive disorder with
patients showing clear signs of premature aging. Some of the key characteristics of
this mouse strain are skeletal abnormalities, such as kyphosis, osteosclerosis of the
calvaria and osteoporosis in the vertebrea and limbs. Osteoporosis is a condition of
the bone were a decreased bone mineral density (BMD) can be found. We used
Confocal Raman microscopy together with histology to investigate the femora of
two mice models for premature aging. The first model, a so called XPA-TTD mouse
known for its severe premature aging was shown to have decreased BMD in its
vertebrae. The second model we studied was a so called TTD mouse model. The
XPA-TTD model consisted of mice with a mixed C57Bl/6:129 background all with
a homozygous mutation in the xeroderma pigmentosum A (XPA) gene and
homozygous for the mutation in XPDR722w (TTD). The TTD mouse model was
comprised of mice from a C57BL/6 background, which were only homozygous for
the mutation in XPDR722w. Raman data obtained from the XPA-TTD mice showed
remarkable differences in bone mineral composition compared to wildtype animals.
Additionally, histology revealed that the thickness of cortical bone for this mouse
was about two fold less than the thickness of cortical bone of control mice of the
same age. Raman spectroscopy showed a decreased level of phosphate and
carbonate content in cortical bone of the femora isolated from TTD mice
compared to wildtype animals. In contrast, the bone matrix composition was not
affected, leading to the conclusion that collagen type I content is not changed in
these mice. The data found by Raman spectroscopy presented in this manuscript
add to results published by others on these mouse models; bone mineral content in

Samenvatting
163
TTD mice was found to be lower, whilst bone matrix protein content was
comparable to the wildtype animals observed in this study.
Samenvatting
Dit proefschrift beschrijft de toepassing van confocale Raman microscopie en
spectroscopie op het gebied van de weefsel vervangings techniek (“tissue
engineering”). Verder beschrijft dit proefschrift het gebruik van een confocale
Raman microscoop in combinatie met een scanning elektronen microscoop om de
chemische analytische mogelijkheden van de elektronenmicroscoop te vergroten.
Het gebruik van de gecombineerde technologie wordt beschreven in twee
hoofdstukken; één waarin de analyse van objecten waarin cellen worden
gecombineerd met materialen wordt beschreven, en het andere waarin de invloed
van een model eiwit op de fysico-chemisch eigenschappen van biomimetische
coatings, bestaande uit calciumfosfaat, afgezet op een titanium legering wordt
beschreven. Verder wordt in dit proefschrift het gebruik van Raman spectroscopie
voor de analyse van de afbraak van een polymeer biomateriaal dat voor tissue
engineering wordt gebruikt geëvalueerd in twee hoofdstukken. Deze twee
hoofdstukken leidden tot het ontwerp van een eenvoudig celkweek model dat kan
worden gebruikt om materiaal afbraak binnen individuele cellen te bestuderen
door een techniek te gebruiken die “Raman imaging” wordt genoemd. In het
laatste hoofdstuk wordt confocale Raman spectroscopie toegepast in een studie van
de kwaliteit van femoraal bot afkomstig van twee muizen stammen die specifieke
symptomen van versnelde veroudering vertonen.
In “tissue engineering” is de analyse van afbraak zgn. “biomaterialen” altijd een
belangrijke kwestie geweest. Een optimaal “biomateriaal” zou lang genoeg intact
moeten blijven om de reparatie van beschadigd of ziek weefsel te kunnen
ondersteunen of bevorderen om de functie te kunnen herstellen. Hoewel dit vrij

Samenvatting
164
simpel klinkt moet men met talrijke factoren rekenschap houden; bijvoorbeeld de
locatie in het lichaam waar een implant wordt toegepast kan bepaalde
biomechanische eigenschappen, zoals elasticiteit en/of stabiliteit, of een langzame
of snelle afbraak, of de mogelijkheid om water of anorganische molecules op te
nemen vereisen, ook zaken als cytotoxiciteit en biocompatibiliteit kunnen van
groot belang zijn. Dit houdt in dat biomaterialen relatief eenvoudig aan te passen
zouden moeten zijn, om een wetenschapper die zich bezig houdt met “tissue
engineering” makkelijk verandering kan maken aan mechanische, chemische en
fysieke eigenschappen van een implantaat naargelang de specifieke eigenschappen
die een toepassingslocatie vereist.
Afgezien van de introductie in hoofdstuk 1 waarin een overzicht van de
ontwikkeling en geschiedenis van microscopie en de rol die Raman microscopie
hierin speelt wordt gegeven, wordt in hoofdstuk 2 en 3 het gebruik van confocale
Raman spectroscopie voor de analyse van een veelgebruikt biomateriaal in tissue
engineering, bestaande uit een elastomeer samengesteld uit polyethyleenglycol
terephtalaat en polybutyleen terephtalaat, beschreven. Deze zgn. thermoplastische
elastomeren zijn samengesteld uit een zacht waterminnend segment polyethyleen
glycol terephtalaat (PEOT) en een hard waterafstotend segment polybutyleen
terephtalaat (PBT) genoemd. De materiaal eigenschappen, i.e. de stijfheid, het
thermische gedrag en afbreekbaarheid, kunnen worden aangepast door of het
molecuul gewicht van polyethyleenglycol, dat voor de productie van deze
polymeren wordt gebruikt, en/of de massaverhouding van PEOT en PBT in het
polymeer te variëren. Deze zogenaamde blok co-polymeren worden momenteel
gebruikt als afbreekbare materialen voor het gebruik in medische applicaties en
worden verkocht onder de merknaam Polyactive™. Een aantal studies hebben de
uitstekende biocompatibiliteit aangetoond van PEOT PBT materialen in vitro (in het
laboratorium), in celkweek modellen en in vivo (in het lichaam), door middel van

Samenvatting
165
studies in verschillende diersoorten variërend van ratten tot geiten. Aangezien de
unieke samenstelling van deze materialen de productie van implantaten toestaat
met een scala van verschillende fysieke en biologische eigenschappen worden deze
materialen intensief bestudeerd voor toepassingen in tissue engineering. Tot nog
toe zijn er verscheidene destructieve chemische analysetechnieken, zoals; nucleo
magnetische resonantie spectroscopie, gel permeatie chromatografie en
differentieel scanning calorimetrie gebruikt om de afbraak van deze polymeren te
bestuderen. Nochtans, wanneer waardevolle morfologische informatie nodig is om
te onderzoeken wat het effect van afbraak is op door tissue engineering
geproduceerde implantaten zal een niet destructieve analyse techniek de voorkeur
hebben. Een belangrijk voordeel van Raman spectroscopie is dat het een niet
destructieve moleculaire analyse techniek betreft die een monochromatische
lichtbron (laser) voor de detectie van golflengte verschuivingen, die door chemische
binding vibraties worden veroorzaakt, gebruikt. Tot nu toe, zijn er geen studies
gedaan van polymeren bestaande uit PEOT PBT door middel van Raman
spectroscopie van enige importantie. Daarom was het noodzakelijk om de Raman
spectra te karakteriseren die van deze polymeren kunnen worden verkregen. Dit is
nodig om niet alleen kennis over de spectrale eigenschappen te verkrijgen, maar
ook om de haalbaarheid van het gebruik van Raman spectroscopie als
analysetechniek voor de studie van afbraak van deze materialen binnen in vitro en
in vivo modellen te kunnen toetsen. In hoofdstuk 2 is een analyse gemaakt van de
banden die aanwezig zijn in de Raman spectra verkregen van bovengenoemde
materialen. Verscheidene Raman banden konden worden toegewezen aan hun
overeenkomstige moleculaire groepen die aanwezig zijn in PEOT PBT polymeren.
Verder was het mogelijk om met behulp van confocale Raman spectroscopie in
een vrij eenvoudig laboratoriummodel de afbraak van deze materialen aan te
tonen. Het is gebleken dat Raman spectroscopie voornamelijk kwalitatief kan
worden gebruikt om afbraak van deze polymeren aan te kunnen tonen door een

Samenvatting
166
evaluatie van de afname en vormveranderingen van bepaalde specifieke Raman
banden. In hoofdstuk 3 werd een meer uitgebreid onderzoek van de afbraak in
een diermodel gedaan van bepaalde specifieke polymeersamenstellingen die vaak
voor de toepassingen in tissue engineering worden gebruikt. Het bleek niet alleen
mogelijk vergelijkbare resultaten van degradatie aan te tonen in vivo zoals die in
het in vitro laboratoriummodel waren gevonden, maar ook bleek dat bepaalde
soorten samenstellingen, vooral die met een hoog polyethyleenglycol gehalte,
calciumfosfaat konden opnemen wat leidt tot een zogenaamde verkalking van het
polymeer materiaal. Verder hebben we aangetoond dat meer zachte en flexibele
materialen met een relatieve hoge verhouding van PEOT ten opzichte van PBT
sneller afgebroken worden dan wanneer een lagere verhouding van deze blokken
aanwezig is, en dat macrophaag achtige cellen waarschijnlijk een essentiële rol
spelen in de verdere afbraak van deze materialen. In hoofdstuk 4 is een eenvoudig
intra cellulair afbraakmodel bestudeerd met behulp van Raman imaging. Hierbij is
onderzocht of kleine micrometer grote polymeer fragmenten die uit een
combinatie van poly melkzuur en glycol zuur (PLGA) bestonden, afbreken vanaf de
buitenkant naar binnen, op relatief homogene wijze, of door een autokatalytisch
afbraak proces, waarbij een opeenhoping van zuurrijke eindgroepen in het
centrum van deze materialen een snellere afbraak veroorzaken waardoor een
uitholling plaatsvindt. Dit laatste proces is vergelijkbaar met wat wordt gevonden in
grote implantaten die uit dit materiaal zijn samengesteld. De reden voor deze
studie was de observatie van kleine polymeer fragmenten in macrofaag-achtige
cellen tijdens onze studie van afbraak van PEOT PBT materialen in een diermodel,
en het feit dat in literatuur een controverse bestaat over de kwestie van afbraak van
kleine uit PLGA samengestelde implantaten. Door gebruik te maken van Raman
imaging kon worden aangetoond dat in microbolletjes van PLGA zowel een
autokatalytisch als een homogeen afbraak proces plaatsvindt, en dat deze afbraak
hoofdzakelijk veroorzaakt wordt door het uiteenvallen van een esterverbinding die

Samenvatting
167
tot de glycol zuur groepen behoort. In hoofdstuk 5 wordt het gebruik van een
combinatie van de elektronenmicroscopie met confocale Raman spectroscopie
beschreven voor de analyse van een keramische coating die biologische factoren
bevat. Orthopedische implantaten zijn over het algemeen samengesteld uit
titanium of een titanium legering voornamelijk vanwege de uitstekende
mechanische eigenschappen van dit materiaal. Om de bot hechtende
eigenschappen van deze implantaten te verbeteren worden deze met een laagje
calciumfosfaat bedekt. Het voordeel van biomimetisch geproduceerde
calciumfosfaat coatings is dat deze bij een lichaamstemperatuur kunnen worden
geproduceerd en een gecontroleerde pH en dientengevolge de integratie van
antibiotica en proteïnen tijdens het coating proces mogelijk maken. Deze factoren
kunnne de biologische eigenschappen van deze coatings verder verhogen.
Voorgaande studies over eiwitintegratie in biomimetische calciumfosfaat coatings
toonden een effect van de aanwezigheid van eiwit op de kristalvorm aan. Tijdens
dit onderzoek werd albumine verkregen uit runderserum (BSA) gebruikt in
verschillende concentraties in de precipitatie oplossing bij het coating proces om
integratie hiervan in de coating te bestuderen. Het resultaat van deze studies was
dat niet alleen BSA aanwezig was in de geprecipiteerde carbonaat apatiet coating,
maar dat tevens de kristalstructuur was beïnvloed. Het gebruik van stijgende
concentraties van BSA leidde dan ook tot wijzigingen in de kristal grootte en vorm
welke konden waargenomen door middel van scanning elektronen microscopie.
Niettemin bleef het daadwerkelijke effect van de wijziging in kristalgrootte en de
vorm op de kristalliniteit van deze coatings onduidelijk. In dit hoofdstuk wordt dan
ook het effect van verschillende concentraties BSA die in biomimetische carbonaat
apatiet coatings kan worden opgenomen met betrekking tot het effect op
kristalgrootte, kristalliniteit en structuur beschreven. De biomimetische carbonaat
apatiet coatings werden onderzocht door middel van dunne film röntgen diffractie
(TF-XRD), en een combinatie van confocale Raman spectroscopie en scanning

Samenvatting
168
electronen microscopie. De resultaten die tijdens deze studie werden verkregen
toonden aan dat niet alleen de aanwezigheid van eiwit in deze coatings op een
niet destructieve manier kan worden aangetoond, maar dat ook informatie over de
relatieve hoeveelheid eiwit aanwezig in de coating kan worden verkregen door
gebruik te maken van confocale Raman spectroscopie in een electronen
microscoop. Hoewel, de verhoging van de concentratie BSA in de precipitatie
oplossing niet de kristalliniteit leek te beïnvloeden, bleek uit het hoger worden van
standaardafwijking, berekend uit de waarden verkregen d.m.v. confocale Raman
spectroscopie, samen met de electronen microscopische observaties dat structuur
van de coatings meer heterogeen van aard werd. De combinatie van scanning
electronen microscopie en confocale Raman spectroscopie bleek een analyse
techniek te zijn die niet alleen onderzoek en observatie van de structuur en de
fysiochemische samenstelling van deze materialen mogelijk maakte.
In hoofdstuk 6 wordt wederom een toepassing van gecombineerde confocale
Raman microscopie en elektronenmicroscopie beschreven. Dit maal voor de
analyse van uit bot-cellen geweekte en biomateriaal bestaande preparaten veel
voorkomend in tissue engineering onderzoek. In dit hoofdstuk wordt aangetoond
dat de combinatie van confocale Raman spectroscopie en scanning electronen
microscopie voor een niet destructieve hoge resolutie analyse van bot cel matrix,
die door botvormende cellen op een materiaal oppervlakte is afgezet, gebruikt kan
worden. Door confocale Raman scanning electronen microscopie te gebruiken kon
worden aangetoond dat in vitro gevormd bot afgezet door rat osteoprogenitor
cellen grote chemische overeenkomsten vertoond met volwassen bot. Nochtans,
konden er verschillen in de verhouding van fosfaat en eiwit specifieke Raman
banden worden waargenomen die erop wijzen dat de in vitro gevormde botmatrix
een zeer vroeg stadium van botvorming representeert. Daarnaast is er meer inzicht
verkregen in de structuur en de chemische samenstelling van bot extra cellulaire
Samenvatting
169
matrix, welke hoofdzakelijk uit gemineraliseerde collageentype I vezels bestaat.
Verder is vastgesteld dat confocale Raman scanning electrone microscopie de
studie van de elektronenmicroscopie preparaten op een niet destructieve manier
mogelijk maakt en dat structurele en chemische informatie, over de anorganische
en organische samenstelling van deze preparaten door parallelle metingen met
hoge resolutie verkregen kan worden.
In het laatste hoofdstuk wordt het gebruik van confocale Raman spectroscopie
beschreven voor de analyse van fysico-chemische samenstelling van bot verkregen
uit muizen welke symptomen van een versneld verouderings-syndroom vertonen.
Uit voorgaande studies aan muizen die een mutatie hebben in het zogenaamde
trichothiodystrophy (TTD) alell is gebleken dat deze symptomen vertonen gelijkend
aan het menselijke syndroom. TTD is een zeldzame autosomale recessieve
afwijking waarbij de patiënten duidelijke tekenen van vroegtijdige veroudering
vertonen. Enkele zeer belangrijke kenmerken van deze muizen stam is de
aanwezigheid van skelet abnormaliteiten, zoals kyfose, osteosclerose van de
schedel en osteoporose in wervels en de ledematen. Osteoporose wordt
gekenmerkt doordat in bot een verminderde bot mineraal dichtheid (BMD) word
gevonden. Wij hebben confocale Raman spectroscopie gebruikt in combinatie met
histologisch onderzoek om femora verkregen van twee verschillende muizen
stammen specifiek voor versnelde veroudering te onderzoeken. Het eerste model,
een zogenaamde XPA-TTD muis gekenmerkt door extreem versnelde veroudering
werd eerder aangetoond een verminderde BMD te bezitten in de ruggewervels.
Het tweede model dat wij hebben bestudeerd was een zogenaamd TTD
muismodel. Het XPA-TTD model bestond uit muizen met van gemengde
C57Bl/6:129 achtergrond allen met een homozygote mutatie in het
xerodermapigmentosum A (XPA) gen en homozygooot voor een mutatie in
XPDR722w (TTD). Het TTD muismodel bestond uit muizen van een C57BL/6
achtergrond, die slechts homozygoot waren voor een mutatie in XPDR722w. De
Samenvatting
170
Raman gegevens die van een van de XPA-TTD muizen konden worden verkregen
toonden opmerkelijke verschillen aan in de bot minerale samenstelling in
vergelijking met normale dieren. Bovendien, liet de histologie zien dat de dikte van
het corticale bot in deze muis ongeveer twee maal zo dun was als in normale
muizen van de zelfde leeftijd. Verder werd door middel van Raman spectroscopie
gevonden dat er een verminderde hoeveelheid van fosfaat en carbonaat in
corticaal bot van femora geïsoleerd uit TTD muizen in vergelijking met normale
dieren aanwezig is. Daarentegen was de organische botmatrix samenstelling niet
beïnvloed, leidend tot de conclusie dat de collageen type I inhoud niet veranderd
was in deze muizen. De gegevens die door middel van Raman spectroscopie
werden gevonden zoals beschreven in dit hoofdstuk voegen nieuwe informatie toe
aan resultaten toe aan de kennis en data die door anderen werden gepubliceerd
over deze muismodellen.

Acknowledgement
171
Acknowledgement
Dear family, friends and colleagues, It looks like I’ve made it after all. I would like to thank all you who have supported me throughout these harsh years of research. Clemens and Cees thanks for your trust in me and allowing me to do this project. Although not always ideal, working in a company and a University at the same time provided me with unique experiences and opportunities I would probably not have had otherwise. I am grateful for having worked together with an amazing group of colleagues. A melting pot of different nationalities and scientific backgrounds makes doing science with you a lot of fun. Thanks for all your help, discussions, arguments, suggestions, drinks, special international lunches, BBQ’s and parties during my PhD project, you all know who you are. A special thank you goes out to my climbing buddies for not having dropped me down yet; I hope we can continue to have more high altitude adventures in the future. To all my other friends and family thanks for all the good times we have had in all those years we know each other. A very special thank you goes out to my direct family, Maggie and Bert (mom and dad), Fréderique and Paul, Bertel and Raven, for supporting me and enduring my good and bad times throughout my live, you guys have never let me down, love you always.
Aart "….to me, everything I see is incredible, something absolutely incredible. We take it all for granted. But I think the essence of the scientific spirit is to look beyond and to realize what a wonderful world it is we live in ….The moment you ask ‘Why is the sky blue?’ you go deeper and deeper into the problems of physics…." Chandrasekhara Venkata Raman -- born 1888; died 1970 (winner of the Nobel Prize in Physics 1930 "for his work on the scattering of light and for the discovery of the effect named after him)

Curriculum Vitae
172
Curriculum Vitae
Aart A. van Apeldoorn was born on February 27th 1968 in Utrecht, the Netherlands. In 1987 he started to study Zoology at the higher laboratory school for laboratory technicians in Utrecht (Hogeschool Utrecht). After successfully finishing his studies by doing a research project at the Complutense University of Madrid, Spain. He started a partime study of Biology at the University of Utrecht. During this period (1997) he started working at Isotis BV, the Netherlands which was then a start-up company dedicated to several aspects of Tissue Engineering as a research technician in the bone tissue engineering group. After 3 years of research experience in the bone tissue engineering group he started to work as a pHd student on a STW funded research project at the University of Twente. This project entitled “the integration of confocal Raman spectroscopy with electron microscopy” was a close cooperation between the department of polymer chemistry and biomaterials (Prof. Dr. C.A. van Blitterswijk) and the department of biophysical techniques (Dr. C.Otto and Y. Aksenov) at the University and IsoTis BV (Prof. Dr. J.D. de Bruijn). The research involved with this project, was the basis for the articles used in the current dissertation and a number of presentations at (inter0national conferences. Based on the outcome of this work he obtained a first stage Biopartner grant from the ministry of economic affairs for research into the commercialization of the combination of confocal Raman spectroscopy and scanning electron microscopy
Publications and conferences related to this dissertation
173
Publications and conferences related to this dissertation
S.C. Mendes, J.D. de Bruijn, K. Bakker, A.A. van Apeldoorn, P.P. Platenburg, G.J.M. Tibbe and C.A. van Blitterswijk, "Human bone marrow stromal cells for bone tissue engineering: In vitro and in vivo characterisation", In: Bone Engineering, JE Davies (Ed), EM Square Inc., Toronto, pp. 505-515 (2000). A. A. Deschamps, A. A. van Apeldoorna, H. Hayen, J. D. de Bruijn, U. Karst, D. W. Grijpma and J. Feijen. In vivo and in vitro degradation of poly(ether ester) block copolymers based on poly(ethylene glycol) and poly(butylene terephthalate), Biomaterials. 2004 Jan;25(2):247-58. A. A. Deschamps, A. A. van Apeldoorn, J. D. de Bruijn, D. W. Grijpma and J. Feijen, Poly(ether ester amide)s for tissue engineering, Biomaterials. 2003 Jul;24(15):2643-52. A.A. van Apeldoorn, Structuur en chemie volgen in weefsel, Chemisch weekblad, 2004, 100 (4), 16-17 A.A. van Apeldoorn, H.J. van Manen, J.M. Bezemer, J.D. de Bruijn, C.A. van Blitterswijk, C Otto, Raman imaging of PLGA microsphere degradation inside macrophages, J Am Chem Soc. 2004 Oct 20;126(41):13226-7. A.A. van Apeldoorn, Y.Aksenov, M.Stigter, I.Hofland, J.D.deBruijn, H.K.Koerten, C.Otto, J.Greve and C.A. van Blitterswijk, Parallel high resolution confocal Raman SEM analysis of inorganic and organic bone matrix constituents, Journal of the Royal Soc. Interface, 2005, 2 (2), 39-45. R.Siddappa, C.Gaspar, A.A. van Apeldoorn, R. Fodde, C.A. van Blitterswijk J. de Boer, Wnt signalling inhibits osteogenic differentiation of human mesenchymal stem cells, Bone, 34(2004), 818–826 A.A. van Apeldoorn, Confocal Raman Scanning Electron Microscopy: Parallel high resolution Confocal Raman SEM analysis of inorganic and organic bone matrix consituents IRDG (Infrarood & Raman Discussie Groep) najaarsbijeenkomst 2004. A.A. van Apeldoorn, H.J. van Manen, J.M. Bezemer, J.D. de Bruijn, C.A. van Blitterswijk, C Otto, Raman imaging of PLGA microsphere degradation inside macrophages, In J. Feijen & W.M.G.F. Pontenagel (Eds.), Proceedings of the 11th Dutch annual conference on biomedical engineering (pp. 134-135).
Publications and conferences related to this dissertation
174
A.A. van Apeldoorn, Keynote lecture on the commercialization of confocal Raman spectroscopy for scanning electron microscopes, the 11th Dutch annual conference on biomedical engineering, Papendal, 2004 A.A. van Apeldoorn & Y. Aksenov & M. Stigter & J.D. de Bruijn & C. Otto & C.A. van Blitterswijk Confocal raman scanning electron microscopy a method for parallel non-invasive high resolution analysis of bone samples. NVVM (Nederlandse Vereniging voor Microscopie) bijeenkomst November 2004, Papendal. A.A. van Apeldoorn & H.-J. van Manen & J.M. Bezemer & J.D. de Bruijn & C.A. van Blitterswijk & C. Otto Raman imaging of PLGA microsphere degradation inside macrophages. NVVM (Nederlandse Vereniging voor Microscopie) bijeenkomst November 2004, Papendal. A.A. van Apeldoorn, Y. Aksenov, I.Hofland, J.D. de Bruijn , C.Otto, J. Greve & C.A. van Blitterswijk, Combined confocal raman spectroscopy and scanning electron microscopy reveals early in vitro bone formation is comparable to organinized mature bone, Genova 2003 ETES Meeting 2nd Annual Meeting of the European Tissue Engineering Society, Genua (Genova), Italy. Apeldoorn, A.A. van, Aksenov, Y., Hofland, I., Bruijn, J.D. de, Otto, C., Greve, J., & Blitterswijk, C.A. van (2003). Combined confocal raman spectroscopy and scanning electron microscopy reveals early in vitro bone formation comparable to organinized mature bone. In J. Feijen & W.M.G.F. Pontenagel (Eds.), Proceedings of the 10th Dutch annual conference on biomedical engineering (pp. 64-65). Apeldoorn, A.A. van, Aksenov, Y., Stigter, M., Hofland, I., Bruijn, J.D. de, Otto, C., Greve, J., & Blitterswijk, C.A. van (2002, September). Confocal Raman scanning electron microscopy; parallel analysis of tissue engineered bone synthesized by rat osteoprogenitor cells. Barcelona (ESP), ESB 2002. Apeldoorn, A.A. van, Bruijn, J.D. de, Otto, C., Greve, J., Blitterswijk, C.A. van, Aksenov, Y., Stigter, M., & Hofland, I. (2002, September). Confocal raman scanning electron microscopy: parallel analysis of tissue engineered bone synthesized by rat osteoprogenitor cells. Durban (South-Africa), ICEM 15. Aksenov, Y., Apeldoorn, A.A. van, Bruijn, J.D de, Blitterswijk, C.A. van, Greve, J., & Otto, C. (2002). Combined electron and Raman microscopy: SEM/ESEM - CRM.. In W.M.G.F. Pontenagel & J. Feijen (Eds.), Proceedings of The Dutch Annual Conference on BioMedical Engineering (pp. 5-6).

Publications and conferences related to this dissertation
175
Aksenov, Y., Apeldoorn, A.A. van, Blitterswijk, C.A. van, Greve, J., Otto, C., & Bruijn, J.D. de (2002). Combined Confocal Raman Microscope with Scanning Electron Microscope; Degradation of the Bio-Degradable Polymers.. In J. Mink, G. Jalsovszky & G. Keresztury (Eds.), XVIIIth International Conference on Raman Spectroscopy (pp. 193-194). Budapest, Hungary. Aksenov, Y., Reinders, E.G.J., Greve, J., Blitterswijk, C.A. van, Apeldoorn, A.A. van, Otto, C., & Bruijn, J.D de (2001). Integration of a Confocal Raman Microscope with a Scanning Electron Microscope. In V. Kopecky, K. Ruszova & J. Stepanek (Eds.), 9th European Conference on the Spectroscopy of Biological Molecules (pp. 23-23). Prague: Institute of Physics, Charles University. Aksenov, Y., Reinders, E.G.J., Greve, J., Blitterswijk, C.A. van, Apeldoorn, A.A. van, Otto, C., & Bruijn, J.D de (2000). Confocal Raman microspectrometer (CRM) for combination with electron microscope.. In (Ed.), Proceedings of the Dutch Annual Conference on BioMedical Engineering (pp. 5-7). Papendal. A. A. van Apeldoorn, Y. Aksenov, J.D. de Bruijn, C.Otto, C.A. van Blitterswijk, A preliminary study on the application of confocal Micro Raman Spectroscopy for the analysis of in vivo PEOT PBT Degradation, London (UK), ESB 2001

Table of contents
176
Table of contents
Contents 4
Introduction 6
Introduction 8
A brief history of Microscopy 8
Practical problems of optics 11
Confocal microscopy 13
Electron microscopy 15
Raman spectroscopy 17
The phenomenon called Raman Effect 17
The Raman effect 17
The logical next step: combining Confocal Raman Microscopy with Electron Microscopy 20
Working principle of the combined system 21
Raman imaging in the Scanning Electron Microscope 23
Tissue engineering and materials 24
Bone and Raman spectroscopy 27
Cells, tissues, materials and confocal Raman spectroscopy 29
References 32
Characterization of PEOT PBT block copolymers by confocal Raman spectroscopy 37
Abstract 39
Characterization of PEOT PBT block copolymers by confocal Raman spectroscopy 41
Introduction 41
Materials and methods 42
Degradation 43
Confocal Raman spectroscope 44
Results 44
Degradation study 48
GPC 50
Discussion 50

Table of contents
177
Conclusions 55
References 56
In vivo degradation of PEOT PBT block copolymers evaluated by confocal Raman microscopy 59
Abstract 61
In vivo degradation of PEOT PBT block copolymers evaluated by confocal Raman microscopy 62
Introduction 62
Material and methods 64
Polymers 64
Polymer processing 64
In vivo implantation 65
Confocal Raman spectroscopy 65
Histology 67
Results 67
Raman spectroscopy on 300PEOT55PBT45 polymers 67
Raman spectroscopy on 300PEOT70PBT30 polymers 70
Raman spectroscopy of 1000PEOT70PBT30 polymers 72
Histology 75
Discussion 79
Mineralization 82
References 85
Annex 87
A preliminary study on the application of confocal Micro Raman Spectroscopy for the analysis of in vivo PEOT PBT Degradation. 87
Introduction 87
Materials and methods 88
Histology 88
Raman spectroscopy 89
Results 89
Histology 90
Table of contents
178
Conclusions 91
Raman imaging of PLGA microsphere degradation inside macrophages 92
Abstract 94
Raman Imaging of PLGA Microsphere Degradation inside Macrophages 95
Introduction 95
Materials and methods 96
Results and discussion 97
Conclusions 101
Acknowledgement 101
References 102
Combined confocal Raman spectroscopic and SEM study of protein incorporation into biomimetic coatings 103
Abstract 105
Combined confocal Raman spectroscopic and SEM study of protein incorporation into biomimetic coatings 106
Introduction 106
Materials and methods 108
Preparation of carbonated apatite coatings (CO3-AP) 108
Combined Confocal Raman Scanning Electron Microscope (CRESEM) 109
CRESEM on biomimetic CO3-AP coatings 110
TF-XRD analysis 110
Results 111
CRESEM on biomimeticCO3-AP coatings 111
TF-XRD analysis 114
Scanning Electron Microscopy 115
Discussion 116
References 120
Parallel high resolution confocal Raman SEM analysis of inorganic and organic bone matrix constituents 122
Abstract 124

Table of contents
179
Parallel high resolution Confocal Raman SEM analysis of inorganic and organic bone matrix constituents 125
Introduction 125
Methods 127
Cell culture 127
Combined confocal Raman scanning electron microscope 128
Results 130
Confocal Raman scanning electron microscopy (CRSEM) 130
CRSEM and biomimetic carbonated apatite like coatings (CO3-AP) 131
CRSEM and bone ECM by rat osteoprogenitor cells 131
Discussion 133
References 136
The physicochemical composition of osteoporotic bone in the TTD premature aging mouse determined by confocal Raman microscopy 138
Definitions of bone found on the internet 139
Abstract 141
The physicochemical composition of osteoporotic bone in the TTD premature aging mouse determined by confocal Raman microscopy 141
Introduction 142
Material and methods 142
Animals 143
Femora 143
Confocal Raman microscopy 144
Histology 145
Results 146
Discussion 152
References 155
Summary 157
Samenvatting 163
Acknowledgement 171
Table of contents 176

Color Figures
180
Color Figures

181
Chapter 1
Figure 1: Original Antonie van Leeuwenhoek Microscope property of the Utrecht University museum, the Netherlands. The instrument consists of two brass plates (2.4x4.6 cm) riveted together at 3 locations. The hole contains a lens. On the tip of the sharp pin an object can be placed for observation. By using the screw on the pin one is able to focus the image. Van Leeuwenhoek made about 500 microscopes of which 9 have survived. This Utrecht example has a magnification of 266 X, while the other remaining magnify between 70 until 170 X. The Utrecht microscope allows for the observation of samples with a size of 0,00135 mm. Only after 1840 AD it was possible to build microscopes which could be used to study smaller objects. Antonie van Leeuwenhoek was not the original inventor of the microscope. Around 1600 a spectacles maker from Middelburg in the Netherlands found out that smaller objects could be more easily observed when placing two lenses at certain distance from each other. The microscope shown here was discovered around 1850 in the physics laboratory at the Minrebroederstraat in Utrecht the Netherlands by Prof. P. Harting. It was kept in a leather lined box with the inscriptions BB. Focal point 0,94 mm, Magnification 266x, Lens aperture 0,7 mm, Resolving power 1,35 mm. The painting showing van Leeuwenhoek using his microscope is by Robert A. Thom and appeared in "Great Moments in Medicine" published by Parke Davis & Company, in 1966.
Figure 4: The problem of chromatic aberration could be solved by placing an extra the achromatic lens behind the initial single lens.

182
Figure 5: Resolution is the minimal distance at which two point objects still can be recongnized from each other. Airy diffraction pattern sizes and their corresponding radial intensity distribution functions are depended on the combination of numerical apertures from the objective and condenser, as well as the wavelength of light used. For a well-corrected objective with a uniform circular aperture, two adjacent points are just resolved when the centres of their airy patterns are separated by a minimum distance which is equal to the radius of the central disk in the airy pattern. In this example λ=685nm and the NA=0.6 and resolution r = 1.22 λ /2NAobj.
Figure 9: schematic representation of the combined confocal Raman microscope with a scanning electron microscope. Samples are analyzed by selecting a location by EM using the electron beam (EB) subsequently moving the sample into the confocal laser spot at exact coordinates. The laser source consists of a laserdiode (LD) with a wavelength of 685nm and is diverted through a side port into the vacuum chamber by a beamsplitter (BS). The laser is then emitted onto the sample by a set of gold coated mirrors through a 60 x objective (MO). The induced Raman scatter is then collected by the same objective and diverted in the opposite direction, passing a notch filter (NF) to eliminate the laser light obscuring the Raman signal and focussed by a pinhole objective (PO) on a pinhole allowing for confocality of the system. Inside the spectrograph monochromator, the Raman scattering is subsequently focused on a holographic diffraction grating and the decomposed wavelengths are then detected by a thermo-electrically cooled CCD. The sample stage (allowing for nanometer movements) is equipped with a small light source to use transmission light microscopic observation for easy calibration of stage movement.

183
Figure 10: Examples of Raman imaging on different SEM samples. Micrographs A and B; surface of human cancellous bone
and corresponding Raman image on phosphate C: typical backscatter sample of bone filler and overlaying PO43- distribution.
D: electron micrograph of bone ECM produced by osteoprogenitor cells and (E) corresponding Raman image of mineralized
matrix. F: Surface of rat femoral bone and corresponding Raman images on protein (red), carbonate (green) and phosphate
(blue).
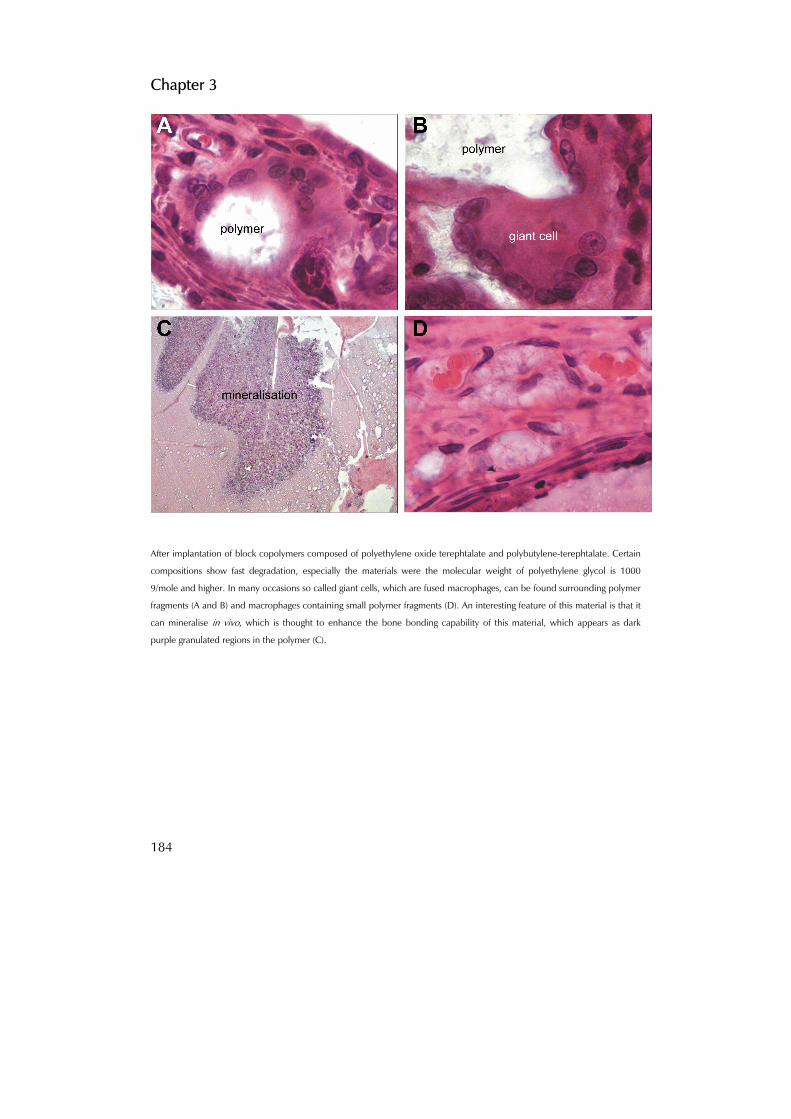
184
Chapter 3
After implantation of block copolymers composed of polyethylene oxide terephtalate and polybutylene-terephtalate. Certain
compositions show fast degradation, especially the materials were the molecular weight of polyethylene glycol is 1000
9/mole and higher. In many occasions so called giant cells, which are fused macrophages, can be found surrounding polymer
fragments (A and B) and macrophages containing small polymer fragments (D). An interesting feature of this material is that it
can mineralise in vivo, which is thought to enhance the bone bonding capability of this material, which appears as dark
purple granulated regions in the polymer (C).
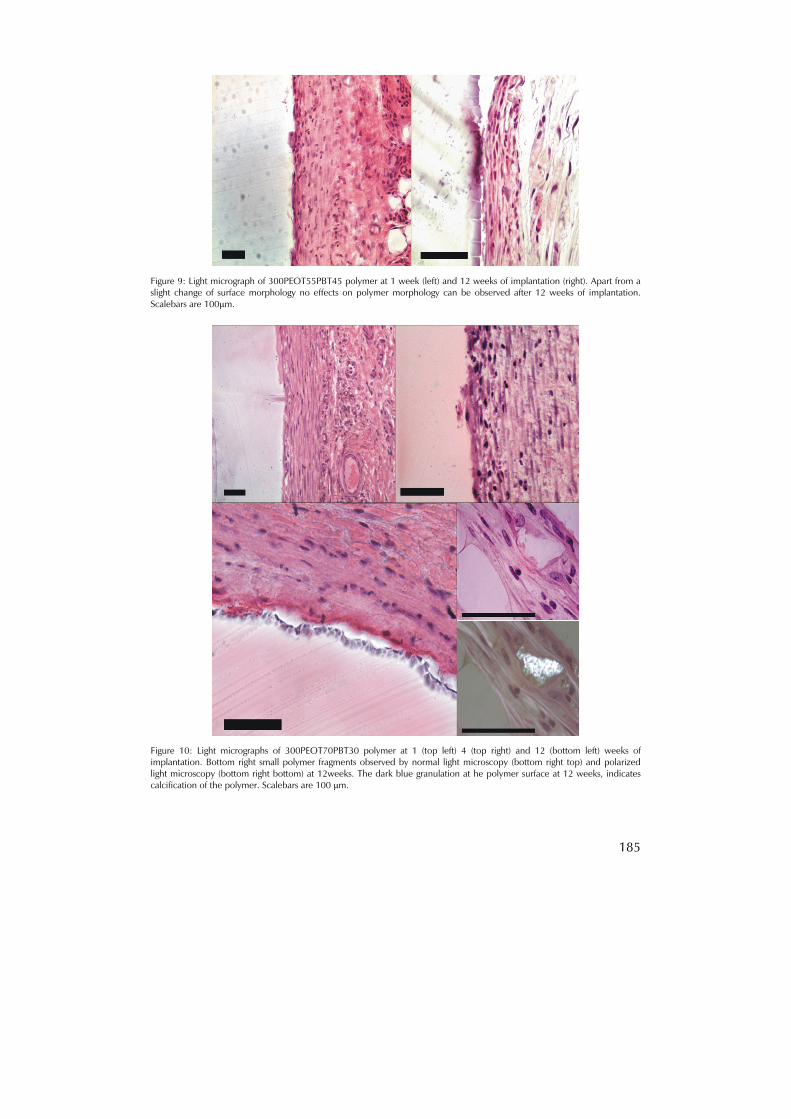
185
Figure 9: Light micrograph of 300PEOT55PBT45 polymer at 1 week (left) and 12 weeks of implantation (right). Apart from a slight change of surface morphology no effects on polymer morphology can be observed after 12 weeks of implantation. Scalebars are 100µm.
Figure 10: Light micrographs of 300PEOT70PBT30 polymer at 1 (top left) 4 (top right) and 12 (bottom left) weeks of implantation. Bottom right small polymer fragments observed by normal light microscopy (bottom right top) and polarized light microscopy (bottom right bottom) at 12weeks. The dark blue granulation at he polymer surface at 12 weeks, indicates calcification of the polymer. Scalebars are 100 µm.

186
Figure 11: Light micrographs of 1000PEOT70PBT30 polymer at 1 (A), 2 (B), 4 (C) and 12 weeks (E-H) of implantation. A shows the onset of beginning lacunae formation on the polymer (p) surface, which progressed after 2 weeks (B), where macrophage-like cells (arrow) occupying the lacunae can be observed. After 4 weeks of implantation (C) large cracks have formed throughout the polymer filled with connective tissue. After 12 weeks of implantation severe defragmentation of the polymer discs was observed (D and E), and also signs of extensive calcification (dark blue and purple granulation) not only at the surface (G) but also inside the polymer (F). Figure G and H not only show that a large number of small polymer fragments were present in the connective tissue surrounding the implant, but in the cytoplasm of macrophage-like cells as well (arrow). Scalebars are 100 µm.

187
Annex chapter 3
Figure 2. A: Light micrograph (100x) of cells containing polymer fragments (arrow) B: Light micrograph of macrophage like
cells containing polymer fragments (arrow) C: Composite Raman image (90x90 μm) of an in vivo polymer fragment showing
the intensity of the 800 (blue), 1280 (green), 1623 (dark Red) and 1725 cm-1(red) Raman bands.
Chapter 4
In order to study material degradation by single cells we developed an in vitro cell culture model. Adding microspheres
composed of polylactic-co-glycolic-acid (PLGA), which were first incubated with serum, to a macrophage cell line allowed
the study of material degradation in individual cells. In literature there is a debate whether, autocatalytic degradation, a rapid
self sustaining degradation process caused by an accumulation of acidic end groups in the interior of implants composed of
PLGA, also takes place in small devices. Observing the degradation by confocal Raman imaging, lead to the finding that both
fast autocatalytic (inside out) and slow homogenous (outside in) degradation processes were present. Moreover, PLGA
degradation seems to occur for the most part through scissioning of the glycolic acid bonds. By using this information we
were able to design a schematic model depicting the aforementioned degradation process.

188
Figure 2. Raman spectra (in black) of the low- (A) and high-intensity (B) regions of the PLGA microsphere in Figure 3D. Pure PLGA is shown in red, and difference spectra (after scaling to the 875 cm-1 band) in green. Note the negative band at 1768 cm-1, indicating a decrease of ester bonds, and the negative bands specific for glycolic acid at 845, 890, 1274, and 1424 cm-1.12

189
Figure 3. (A and C) Light micrographs of macrophages containing phagocytosed beads cultured for 1 and 2 weeks,
respectively (scale bar 5 μm). The Raman images (7.5 × 7.5 μm2) of these beads are shown in B and D. The scale in B and D shows the relative intensity of the 1768 cm-1 band used for imaging (specific for PLGA ester bonds). Insets in C and D show
controls (image size 7.5 × 7.5 μm2). The Raman image in 3F depicts the intensity of the 1527-1714 cm-1 region, which contains bands from cytoplasmic species. (E) Electron micrograph of PLGA microspheres after freezing and crushing in liquid
nitrogen. A cross-section of a broken sphere, showing the solid center, can be seen (arrow) (scale bar 10 μm).

190
Chapter 6
Figure 2: Raman spectrum (A) of the first bead from the left, showed in electron micrograph B. Inset C: 5 µm diameter polystyrene beads, transmission light micrograph observed trough the objective lens. Inset D: Corresponding Raman image (1 pixel=1 µm) using the 1004 cm-1 band of polystyrene. Scalebar in B represents 10 µm, C and D 5 µm.

191
Figure 4: A: Raman spectra of femoral rat bone, CO3-AP, B: ECM and collagen type I. C, D, E: Electron micrographs of ECM produced by rat osteoprogenitor cells, showing mineralized collagen fiber bundles (width 0.1-0.5μm). F: Raman image from an area of E, which was subsequently imaged using the 960 cm-1 PO4
2- band (1pixel=0.5 µm). Scale bar C, E represent 5 µm and D 1 µm.
Figure 5A: Electron micrograph of the surface of bone, showing a 15-20μm microcrack and subsequent corresponding Raman images 50x50 µm (1pixel=1µm) of protein (1400-1440 cm-1, red square), CO3
2- (1070 cm-1, green square) and PO43-
(960 cm-1, blue square). Fig 5B: XRMA maps for C, O, P, and Ca, the white squared area corresponds with electron-micrograph in A. Scale bar in A 50 µm and B 25 µm.

192
Chapter 7
Figure 2: Light micrograph showing the morphology of WT (left panel) and XPA-TTD (right panel) mice. Scale bars are 400μm (top) and 200μm (bottom). B = bone, BM = bone marrow, SK = skin region, M = muscle region.
Top Related
Copyright © 2022 FDOKUMEN

