


Bahasa
Halaman
Hukum


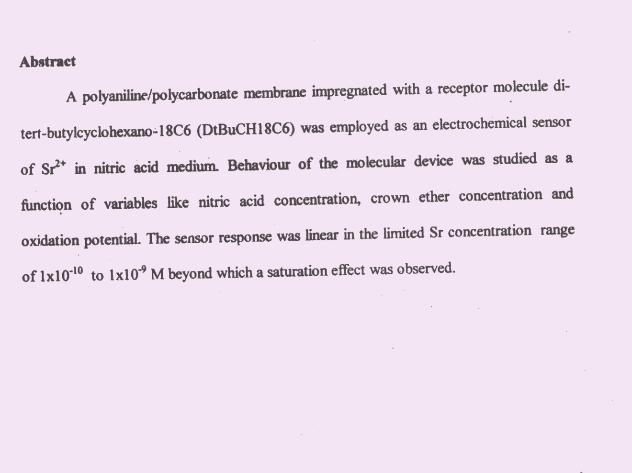
CROWN ETHER BASED POLYMERIC
ELECTROCHEMICAL SENSOR FOR STRONTIUM
G.H.Rizvi, P.V.Ragini*, A.Q.Contractor* and V.K.Manchanda
Radiochemistry Division,
Bhabha Atomic Research Centre, Trombay, Mumbai-400 085
Department of Chemistry,
Indian Institute of Technology, Powai, Mumbai-400 070
1. INTRODUCTION
Molecular devices based on the electronic switching properties of conducting
polymers are well known [1-4]. However, in recent years electronic switches activated
as a result of binding of a metal ion to its specific receptor anchored in the polymer phase
have been reported. There have been attempts to impart ion specificity by covalent
linking of azacrown ethers to polypyrrole [1], pseudorotaxanes to polythiophene [2] and
functionalisation of polythiophenes with calix[4]arene based receptors [3]. These
systems did show ion specific response but at concentrations of 0.1 M of the metal ions
like Na+, K+ and Li+ in non aqueous media. Polyaniline (PANI) is a well studied
conducting material
whose electronic conductivity is sensitive to its chemical state. Polyaniline, based
electrochemical sensing devices for the estimation of glucose, urea, and triglycerides
have been reported earlier [4]. Changes in electronic conductivity can also be effected by
causing local conformational defects in the polymer backbone. Thus when a molecular
recognition unit such as a crown ether anchored into its matrix was brought in proximity
to a complexing metal ion, it resulted in a conformational change in the polymer chain
influencing its electronic conductivity. Such a molecular electronic device was reported
earlier by one of the authors for the detection of K+, Ba2+ and Sr2+ ions using 18 crown 6
(18C6) adsorbed on PANI/polycarbonate membrane [5]. The conformational changes
could be correlated with the mean molecular area which was found to increase with the
increase of concentration of appropriate metal ion (in the range 10-9 – 10-7 M). It was
attributed to the fact that the molecular recognition unit viz. crown ether was loosely
attached to the polymer and thus more accessible to the metal ion. It was thus fascinating
to work with an electronic switching device which responded to the trace concentration
of a metal ion on the basis of its binding ability.
The device configuration used in the earlier work was gold interdigited
microelectrode pair (IMP) deposited on an oxidised silicon wafer and two closely spaced
Pt wires. But this configuration had marked disadvantages viz., i) its fabrication was
expensive and time consuming and ii) it required delicate handling during measurements
especially with polymer grown on Pt twin wires which could unbridge. These hurdles
were overcome with highly improved alternate technique employed during the present
studies. A cost effective ion activated molecular device was fabricated using polyaniline
as a conducting polymer grown on polycarbonate membrane and doped with
DtBuCH18C6. DtBuCH18C6 was chosen in view of its favourable cavity size as well as
conformation towards selective complexation of Sr2+ [6,7]. 90Sr is a fission product which
needs to be monitored in the environmental samples at very low concentration in view of
its radiological as well as biological half lives. The performance of the molecular device
has been evaluated as a function of several factors like oxidation potential, HNO3
concentration, crown ether concentration and the loading time.
2. EXPERIMENTAL
2.1 Reagents and Instrumentation
Aniline (E.Merck) distilled under nitrogen atmosphere was used for preparing
monomer solution. Di-t-butylcyclohexano-18-crown-6 procured from Eichrom
Industries, USA, BaCO3, (E.Merck, GR) and SrCO3 (specpure) were used as such. Water
from Millipore ultrapurification system was used throughout. Polycarbonate (PC)
membranes of 10 µ thickness and 1.2 µ pore diameter, produced by "track etch" method
were obtained from Millipore Corporation.
EG & G Model 362 Scanning potentiostat (for the preparation of the reference
electrode), Pine Model AFRDE Bipotentiostat (for cyclic voltammogram (CV) and insitu
resistance measurements) connected independently to Linseis XYt recorder were used.
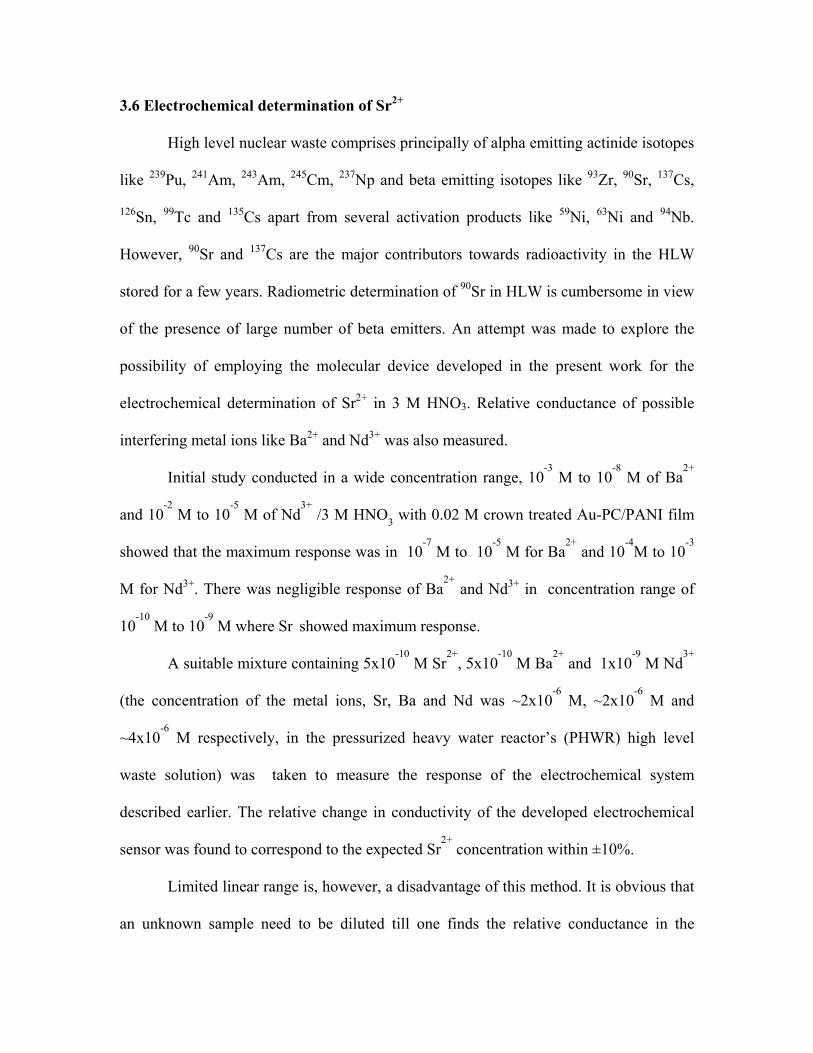
2.1.1 Working Electrode Fabrication
The masks were made by cutting equidistant stripes of 3 mm width at a distance
of 0.85 mm on an aluminium sheet for gold coating (thickness 0.1 µm) employing an
indigenously made vacuum evaporation system. This way gold strips of 3 mm width
were obtained on the PC membrane by placing the mask on each side of the membrane
successively. One cm long gold coated strips were used as electrode. The strip was held
in a plastic clip holder (Fig.1) containing thin Pt tips on both sides for contact. The gold
strips on either side acted as electrodes during polymerisation and subsequently as the
'source' and 'drain' during conductivity measurements (Fig.2).
2.1.2 Electrode Assembly
Gold strip (PC membrane coated with moderately thick film of PANI), Pt foil and
Pt coated with PANI (Pt/PANI) were used as working, counter and reference electrodes
respectively. The reference electrode (Pt/PANI) was prepared freshly before each
experiment. Its potential was found to be +0.6V vs SCE in 0.5 M H2SO4. The resistance
across unbridged gold strip electrode used in this study was > 200 M ohms.
2.1.3 Electrochemical polymerisation of PANI (preparation of working electrode)
Prior to growing PANI on to the working electrode, its surface was cleaned by
cycling five times a potential between -0.2 to +1.6 V vs SCE across the gold strip
immersed in 0.5 M H2SO4 and if the CV showed the characteristic peaks of gold then it
was used for growing PANI film. PANI was grown onto the gold strip and into the pores
of the membrane by electropolymerisation of a monomer solution of 0.1 M aniline in 0.5
M H2SO4 by potentiodynamic cycling between -0.2 to +0.8V vs SCE for 25 minutes. A
moderately thick film of PANI was formed on both sides of the membrane as well as on
the walls of the pores inside the PC membrane since the polycationic species of PANI is
completely insoluble in 0.5 M H2SO4. The PANI coated membrane, Au-PC/PANI thus
obtained was used for measurements.
2.1.4 Preparation of Reference Electrode
The Pt wire (0.5 mm thick) was cleaned using chromic/sulfuric acid mixture. It
was followed by electrochemical cleaning in 0.5 M H2SO4 for 15 min. CV was recorded
to check the surface of Pt by cycling between - 0.2 to + 1.2V vs SCE in 0.5 M H2SO4.
When characteristic CV peaks for Pt surface were obtained PANI was grown
electrochemically (by cycling between -0.2 to +0.8V vs SCE at a sweep rate of 50 mV s-
1 in 0.1 M aniline monomer solution) in 0.5 M H2SO4. It was rinsed with MilliQ water to
free it from traces of aniline, held at -0.2V vs SCE in 0.5 M H2SO4 for 5 min and stored
in MilliQ water before use.
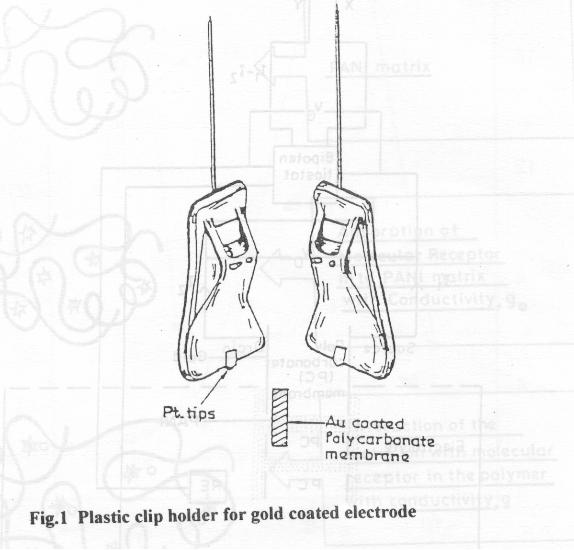
2.1.5 Insitu resistance measurement
A schematic representation of the set up for insitu resistance measurement is
shown in Fig. 2. A fixed potential was applied on the working electrode and the current
was measured. The gate voltage, VG, from -0.8 to -0.4 V vs reference electrode was
applied for various concentration of HNO3. A difference of 20 mV was kept as the drain
voltage, VD. The current obtained is designated as Id. Then the drain voltage was kept at
0 mV and the current obtained is designated as Io. Direct determination of Id-Io is made in
one step for each value of VG. The resistance was measured by the formula
V D R = ---------- Id - Io
The conductance was measured in 0.1 M, 2 M, 3 M and 4 M nitric acid. The
DtBuCH18C6 (of a particular concentration ranging from 0.2 mM to 20 mM in n-
butanol) was adsorbed into the PANI matrix by physisorption. Conductance was
measured both before and after loading crown. The crown loaded film was exposed
thereafter to the analyte solution of Sr2+ (Ba2+, Nd3+). The sensor "response" is
represented by relative change in conductance, ∆g/go where go is the conductance of the
sensor in the supporting electrolyte in the absence of analyte and ∆g = g-go (where g is
the conductance of the sensor in the presence of analyte). The ratio, ∆g/go, normalises
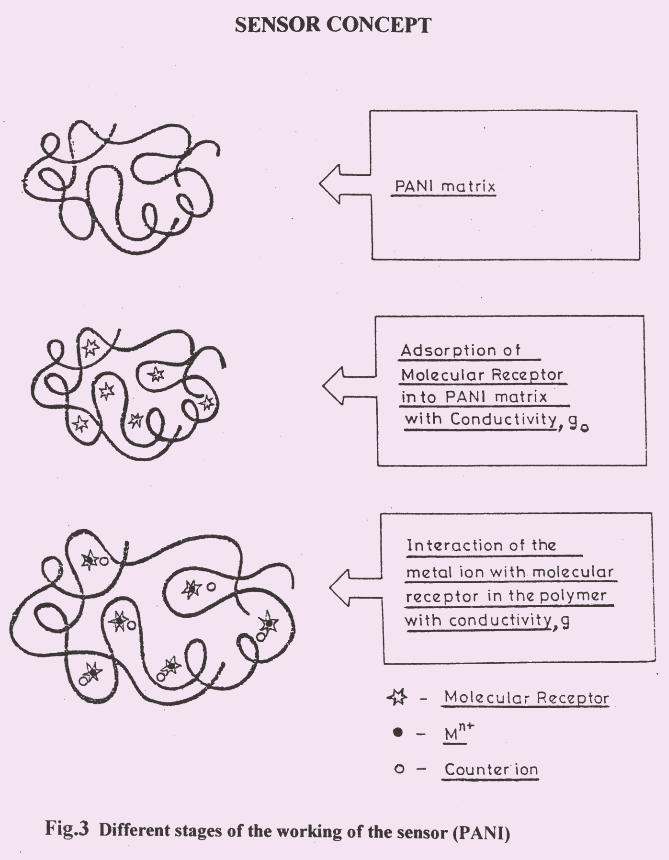
the sensor response and minimises variations from sensor to sensor. The sensor concept
is given in Fig.3.
3. RESULTS AND DISCUSSION
In view of the extensive use of n-octanol as diluent for DtBuCH18C6 in Sr
solvent extraction process [8], it was employed initially for the preparation of
DtBuCH18C6 solution for PANI impregnation experiments. But n-octanol being a
relatively high boiling solvent (b.p.=196 oC), difficulties arose due to its incomplete
evaporation after impregnation. Organic solvents such as dichloroethane (DCE), 1,1,2,2-
tetrachloroethane (TCE) were found to be unsuitable since the PC membrane was soluble
in such solvents. In view of the exhaustive work carried out by one of the authors [8] on
the role of diluents in extraction of Sr using DtBuCH18C6, n-butanol was found to be a
promising alternative. It has relatively lower boiling point (118 oC) that helped in the
faster evaporation of the diluent.
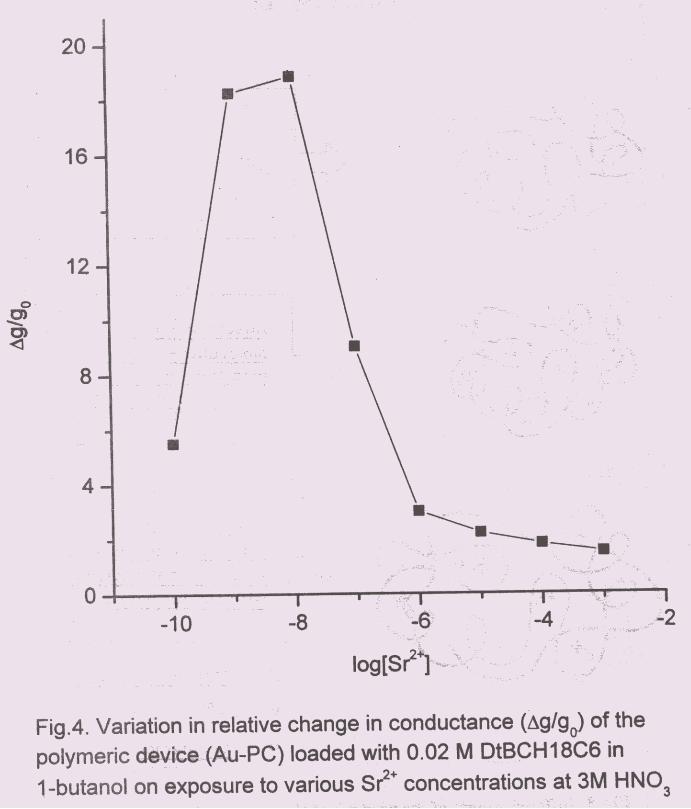
Initial studies were carried out in the range of 10-10
to 10-3
M of Sr in 3M HNO3.
The plot, ∆g/go vs log[Sr2+
] reached a maxima between 10-9
to 10-8
M and then fell
rapidly with higher [Sr2+] viz, 10-8
to 10-3
M (Fig.4). Thus a switching type of behaviour
was observed when PANI film was loaded with 0.02 M DtBuCH18C6 in 1-butanol.
Thereafter, the study was carried out in the range 10-10
M to 10-8
M of Sr2+
. The ratio
∆g/go increases from 10-10
M of Sr and reaches a maximum at 7x10⁻¹⁰
M and is steady
thereafter up to 10-8
M. This could be explained by the fact that the crown sites
(molecular recognition unit, in polymer matrix, transducer) were occupied first gradually
and then completely by Sr2+
. Thereafter the response fell sharply which could be due to
the degradation of the polymer film as suggested by the fact that the polymer did not
regain its previous electroactivity. Thus a noncovalent interaction existed between the
molecular recognition unit, DtBuCH18C6 and the transducer, PANI.
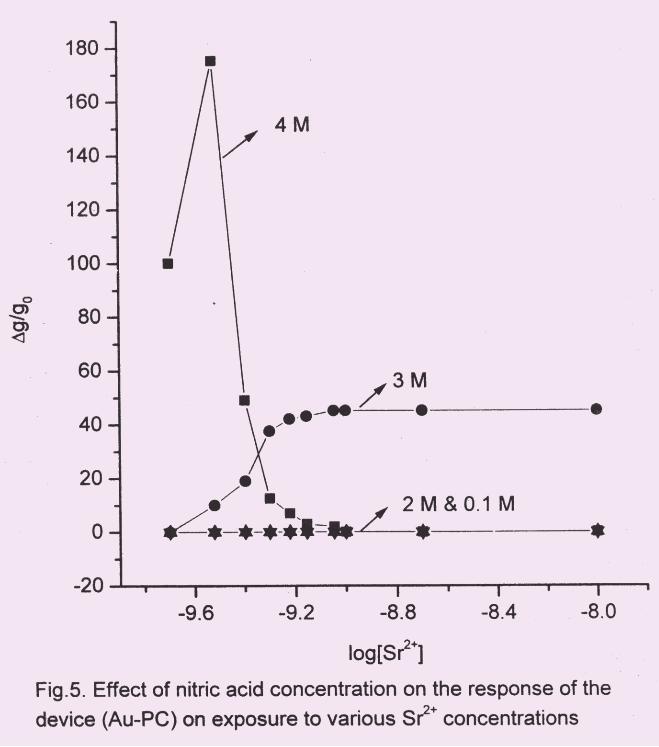
3.1 Effect of nitric acid concentration
The HNO3 concentration range investigated in the present study was 0.1 to 4 M.
The results are shown in Fig.5. No significant change in response was noticed for varying
concentrations of Sr2+
at either 0.1 M or 2 M HNO3. At 4 M HNO3, the system showed
very good response but only in a very narrow range of Sr2+
concentration. However, the
measurement in this medium was not reproducible. Degradation of the film under these
conditions was suspected since the colour of the PANI film changed from light blue to
dull yellow. At 3 M HNO3, the system showed a switching characteristics and the
measurements were reproducible. Thus, 3 M HNO3 appears to be the most suitable
medium for Sr2+
detection.
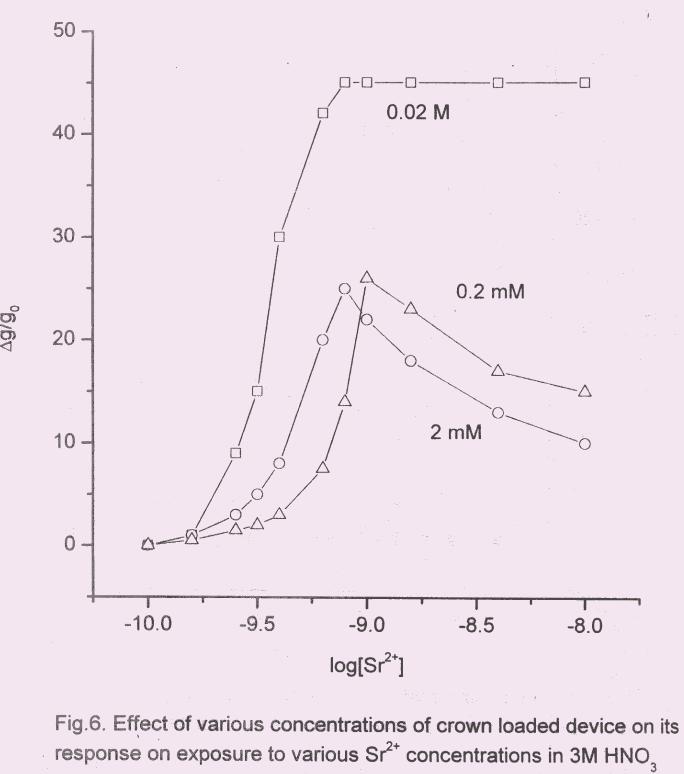
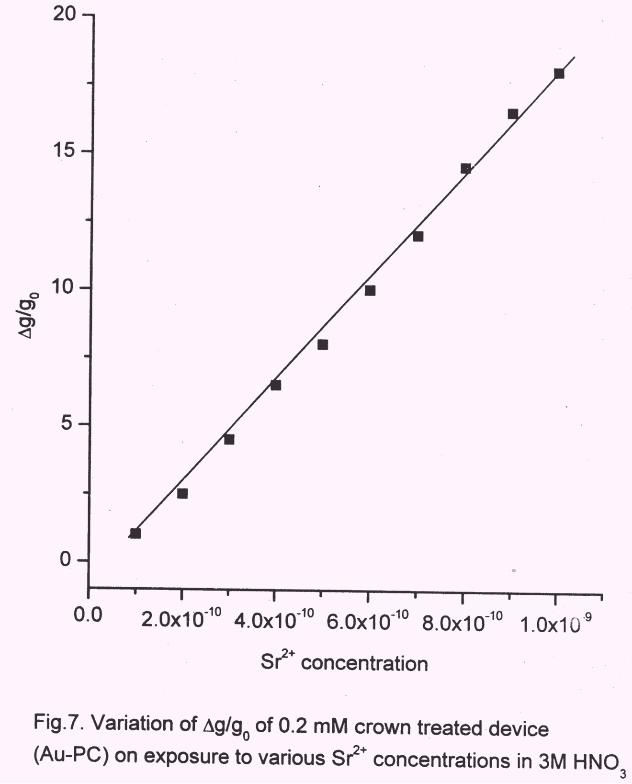
3.2 Effect of crown ether concentration
The sensor response ∆g/go vs log [Sr2+
], for various concentrations of the crown
is shown in Fig.6. This was attempted to understand the role of crown sites availability
for binding Sr. At higher concentration of the crown viz., 0.02 M, saturation occurred at
10-8
M of Sr2+
beyond which the response decreased sharply (Fig.4). PANI film treated
with lower concentration of the crown showed linear behaviour instead of switching type
as could be seen in Fig.7, from the plot of ∆g/go vs [Sr2+
] in 3 M HNO3. The observed
response was found to be linear between 1x10⁻¹⁰ M to 1x10⁻⁹ M of Sr for the crown
concentration of 0.2 mM. Control experiment was also carried out in the absence of
crown. Hence the response was due to the Sr2+
binding to DtBuCH18C6 present in the
bulk PANI.
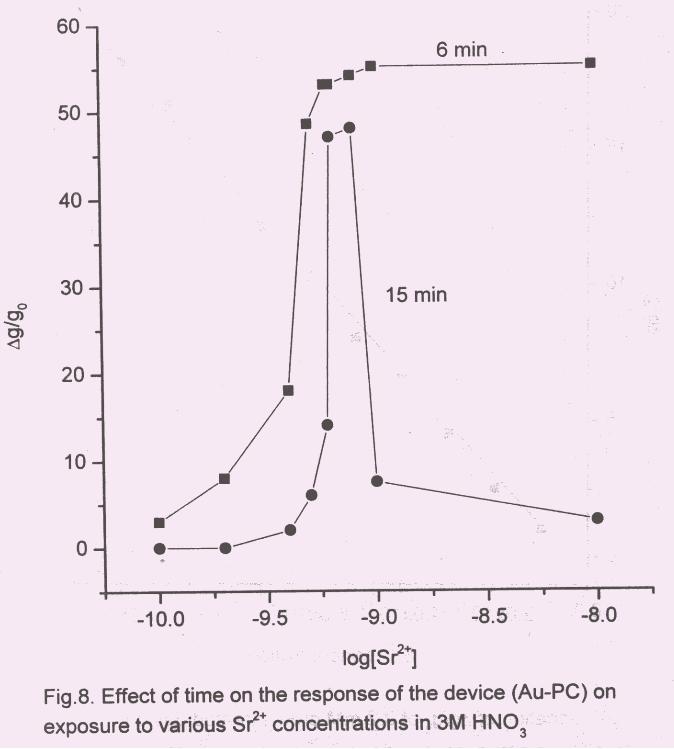
3.3 Effect of time on crown ether loading
The effect of variation in time of loading of crown (0.02 M) on Au-PC/PANI film
was studied in the range of 3 to 20 minutes. As the time of loading increased initially, the
amount of crown ether that went into the film too increased, thereby improving the
sensitivity of the sensor. Such behaviour was observed only when loading time increased
from 3 to 6 min. On further increase of loading time to 10 min the conductance decreased
but the nature of the curve did not change. But for loading time of 15 and 20 min, not
only the response of the electrode deteriorated but also the nature of curve changed
significantly. The results of 6 min and 15 min of crown loading are shown in Fig.8.
Plateau region clearly seen for loading time upto 10 min disappeared for the longer
loading periods. It appears that the transduction ability of PANI film deteriorated on
longer exposure.
3.4 Effect of oxidation potential
It was thought of interest to study the influence of over oxidizing PANI film at
100 mV more (anodic) than the usual potential limit by cycling 2,5 and 10 times at 3 M
HNO3 before measurements in order to achieve the linear response in a broader
concentration range of Sr. The change in conductivity before growing PANI and after
growing PANI was found to be 1.3, 1.0 and 0.6 order of magnitude respectively. Then
crown was loaded from 0.02 M solution. It was observed that irrespective of number of
cycles, the increasing response was found upto 4x10⁻¹⁰
M of Sr2+
, beyond which response
decreased. The decreased response could be due to the presence of lesser amount of
electroactive polymer in the over oxidised film.
3.5 Reproducibility of Sr2+ measurement
The Au-PC/PANI film treated with 10-4
M DtBuCH18C6 was used for repeated
measurement of 2x10⁻¹⁰
M and 7x10⁻¹⁰
M of Sr2+
in 3 M HNO3 in order to examine the
reproducibility of the sensor. Each measurement was preceded by rinsing the sensor with
3 M HNO3 solution. The results showed that the sensor response was reproducible with a
relative standard deviation (RSD) of ±6.1% (15 determinations) and ±5.8% (8
determinations) for 2x10⁻¹⁰
M and 7x10⁻¹⁰
M of Sr2+ respectively.
3.6 Electrochemical determination of Sr2+
High level nuclear waste comprises principally of alpha emitting actinide isotopes
like 239Pu, 241Am, 243Am, 245Cm, 237Np and beta emitting isotopes like 93Zr, 90Sr, 137Cs,
126Sn, 99Tc and 135Cs apart from several activation products like 59Ni, 63Ni and 94Nb.
However, 90Sr and 137Cs are the major contributors towards radioactivity in the HLW
stored for a few years. Radiometric determination of 90Sr in HLW is cumbersome in view
of the presence of large number of beta emitters. An attempt was made to explore the
possibility of employing the molecular device developed in the present work for the
electrochemical determination of Sr2+ in 3 M HNO3. Relative conductance of possible
interfering metal ions like Ba2+ and Nd3+ was also measured.
Initial study conducted in a wide concentration range, 10-3 M to 10
-8 M of Ba
2+
and 10-2 M to 10
-5 M of Nd
3+ /3 M HNO3 with 0.02 M crown treated Au-PC/PANI film
showed that the maximum response was in 10-7
M to 10-5
M for Ba2+
and 10-4
M to 10-3
M for Nd3+. There was negligible response of Ba2+
and Nd3+ in concentration range of
10-10 M to 10
-9 M where Sr showed maximum response.
A suitable mixture containing 5x10⁻¹⁰
M Sr2+
, 5x10⁻¹⁰
M Ba2+
and 1x10⁻⁹
M Nd3+
(the concentration of the metal ions, Sr, Ba and Nd was ~2x10⁻⁶
M, ~2x10⁻⁶
M and
~4x10⁻⁶
M respectively, in the pressurized heavy water reactor’s (PHWR) high level
waste solution) was taken to measure the response of the electrochemical system
described earlier. The relative change in conductivity of the developed electrochemical
sensor was found to correspond to the expected Sr2+
concentration within ±10%.
Limited linear range is, however, a disadvantage of this method. It is obvious that
an unknown sample need to be diluted till one finds the relative conductance in the
expected range of Sr2+ solution of 1x10⁻¹⁰ M to 1x10⁻⁹ M. One can correlate the
concentration obtained from the calibration graph with the unknown concentration by
using the exact dilution factor.
4. ACKNOWLEDGEMENT
The authors are thankful to Dr.S.B.Manohar, Head, Radiochemistry Division for
his keen interest in this work
5. REFERENCES
[1]. H.K.Youssoufi, M.Hmyene, F.Garnier and D.Delabouglise; J.Chem.Soc,
Chem.Commun., (1993) 1550
[2]. M.J.Marsella, P.J.Caroll and T.M.Swager; J. Amer. Chem. Soc., 116 (1994) 9347
[3]. M.J.Marsella, R.J.Newland, P.J.Caroll and T.M.Swager: J. Amer. Chem. Soc., 117
(1995) 9842
[4]. H.Sangodkar, S.Sukeerthi, R.S.Srinivas, R.Lal and A.Q.Contractor, Anal.Chem., 68
(1996) 779
[5]. R.B.Dabke, G.D.Singh, A.Dhanabalan, R.Lal and A.Q.Contractor, Anal.Chem., 69
(1997) 724
[6]. E.P.Horwitz, M.L.Dietz and D.E.Fisher, Solv.Extr.Ion Exch., 9 (1991) 1
[7]. R.M.Izzat, J.S.Bradshaw, S.A.Nielsen, J.D.Lamb, J.J.Christensen, D.Sen;
Chem.Rev., 85 (1985) 271-339
[8]. Amar Kumar, P.K.Mohapatra, P.N.Pathak and V.K.Manchanda, Talanta, 45 (1997)
395
Top Related
Copyright © 2022 FDOKUMEN

