


Bahasa
Halaman
Hukum

Computational Fluid Dynamics based Fault Simulations of a
Vertical Axis Wind Turbines
Kyoo-seon Park, Taimoor Asim and Rakesh Mishra School of Computing & Engineering,
University of Huddersfield,
Queensgate, Huddersfield HD1 3DH, UK
E-mail: [email protected], [email protected], [email protected]
Abstract. Due to depleting fossil fuels and a rapid increase in the fuel prices globally, the search
for alternative energy sources is becoming more and more significant. One of such energy source is
the wind energy which can be harnessed with the use of wind turbines. The fundamental principle
of wind turbines is to convert the wind energy into first mechanical and then into electrical form.
The relatively simple operation of such turbines has stirred the researchers to come up with
innovative designs for global acceptance and to make these turbines commercially viable.
Furthermore, the maintenance of wind turbines has long been a topic of interest. Condition based
monitoring of wind turbines is essential to maintain continuous operation of wind turbines. The
present work focuses on the difference in the outputs of a vertical axis wind turbine (VAWT) under
different operational conditions. A Computational Fluid Dynamics (CFD) technique has been used
for various blade configurations of a VAWT. The results indicate that there is significant
degradation in the performance output of wind turbines as the number of blades broken or missing
from the VAWT increases. The study predicts the faults in the blades of VAWTs by monitoring its
output.
1. IntroductionThe need for sustainable energy sources becomes greater each year due to the continued depletion of fossil
fuels. To harness such types of energy, wind turbines are now seen as the most logical choice due to their
well-established performance credentials along with relatively short payback times. Among the different
types of wind turbines, the most common type is Horizontal Axis (HAWT) in which the primary axis of
rotation is parallel to the ground. Another type of wind turbine in use is the vertical axis wind turbine in
which the rotational axis is normal to the ground. The main attraction of the VAWT is its simplicity of
design which allows for energy conversion at any wind angle. Furthermore its requirement of low starting
torque, coupled with low noise, makes it an ideal candidate for use within urban areas where wind speeds
are relatively low [1,2,3].
According to Gareth et. al [4], the important performance parameters for wind turbines are the torque
output, power output and the tip speed ratio (TSR). The tip speed ratio of a VAWT can be calculated by:
Nomenclature
r Radius of VAWT (m)
ω Angular velocity (rads/sec)
V Linear velocity (m/sec)
P Power (W)
T Torque (N-m)
� ��∗�
� (1)
Power of a VAWT, which is a function of the rotational speed and the torque output of the wind
turbine, can be calculated using the following expression:
� � ∗ (2)
The wind farms need to continuously operate at peak efficiency to maintain consistent output.
Extensive research is currently being carried out to investigate effects of various fault conditions
on the output of such systems. In the present study, an attempt has been made to simulate some
common faults and their effects on torque/power outputs of a single vertical axis wind turbine.
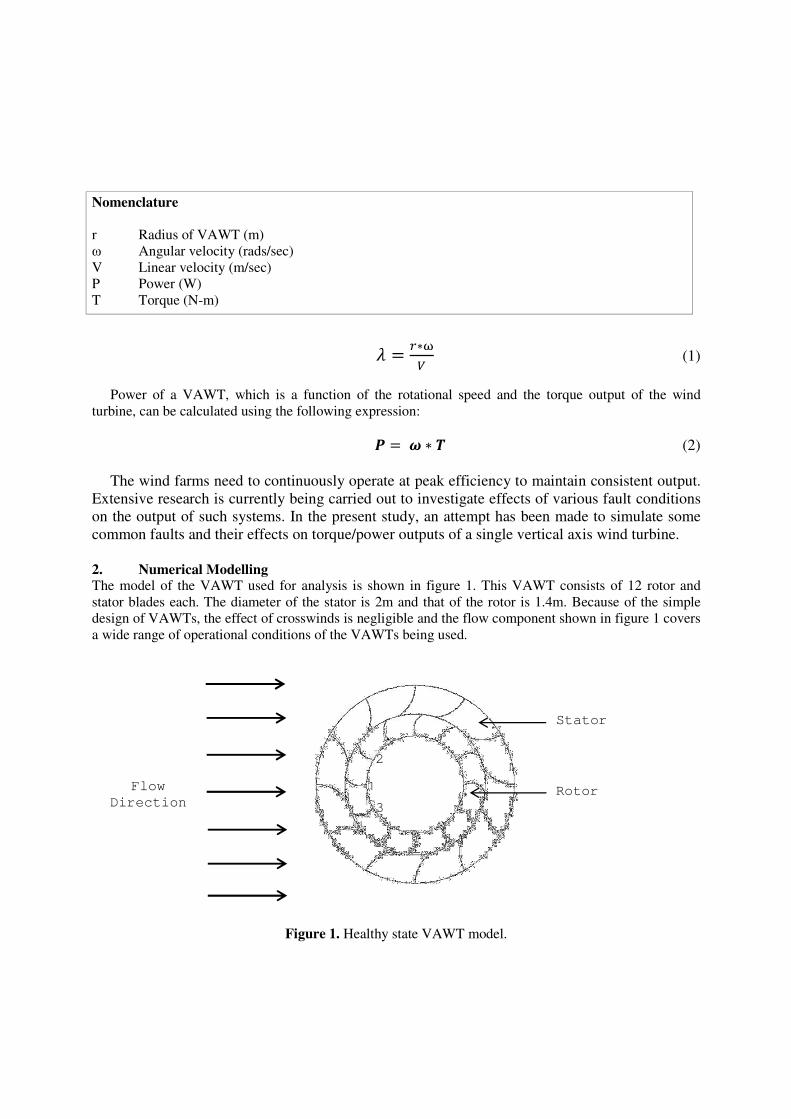
2. Numerical ModellingThe model of the VAWT used for analysis is shown in figure 1. This VAWT consists of 12 rotor and
stator blades each. The diameter of the stator is 2m and that of the rotor is 1.4m. Because of the simple
design of VAWTs, the effect of crosswinds is negligible and the flow component shown in figure 1 covers
a wide range of operational conditions of the VAWTs being used.
Figure 1. Healthy state VAWT model.
1
2
3
Flow
Direction
Stator
Rotor
In order to effectively use CFD as a condition monitoring tool for VAWTs, four different blade
configurations have been selected for analysis to cover a wide range of faults in the wind turbines. The
first configuration is termed as healthy state and is shown in figure 1. In this configuration all the blades of
the VAWT are in their original shape and positions. The details of all the configurations that were taken
into account are summarised in table 1.
Table 1. Geometric configurations of VAWTs being analysed.
Condition Missing Blade/s
Healthy N/A
One blade missing 1
Two blades missing 1 and 2
Three blades missing 1, 2 and 3
Due to limited computational resources, only two dimensional model as shown in figure 1 has been
taken into account for the analysis. Transient Navier-Stokes equations are solved numerically for a
turbulent flow of air at a speed of 4m/sec into the VAWT. This corresponds to a tip speed ratio of 0.2. The
Sliding Mesh technique is used in order to rotate the blades in the rotor at ω = 1.143 rad/sec which
corresponds to 11rpms for the VAWT. The equations are solved using iterative method such that each
time step corresponds to 3º rotation of the rotor blades. Second order spatial and temporal schemes have
been specified with SIMPLE pressure-velocity coupling in the solver. The torque output of the VAWT is
monitored throughout the iterative process. For transient models, the solution needs to become statistically
steady first in order to accurately obtain the results from them. In the present work, the model becomes
statistically steady after four revolutions of the VAWT. The data is collected only in the fifth revolution
which depicts that the non-uniformities in the solution have died out. The convergence is summarised in
table 2.
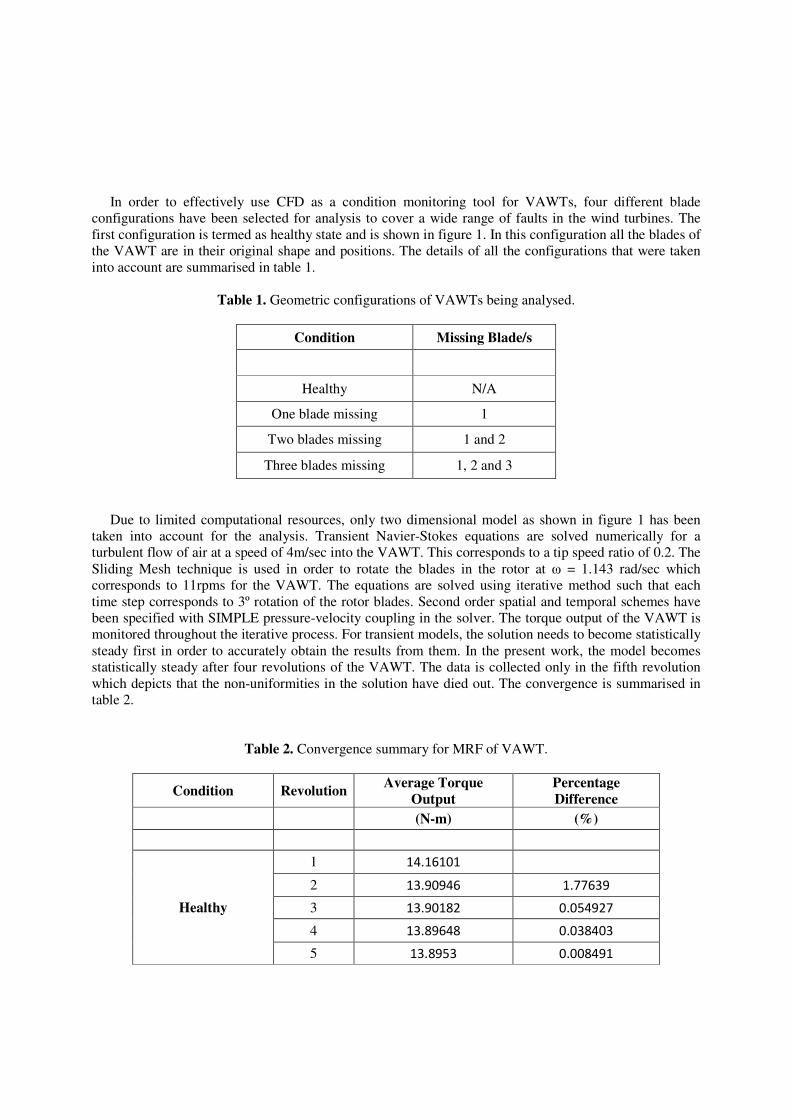
Table 2. Convergence summary for MRF of VAWT.
Condition Revolution Average Torque
Output
Percentage
Difference
(N-m) (%)
Healthy
1 14.16101
2 13.90946 1.77639
3 13.90182 0.054927
4 13.89648 0.038403
5 13.8953 0.008491
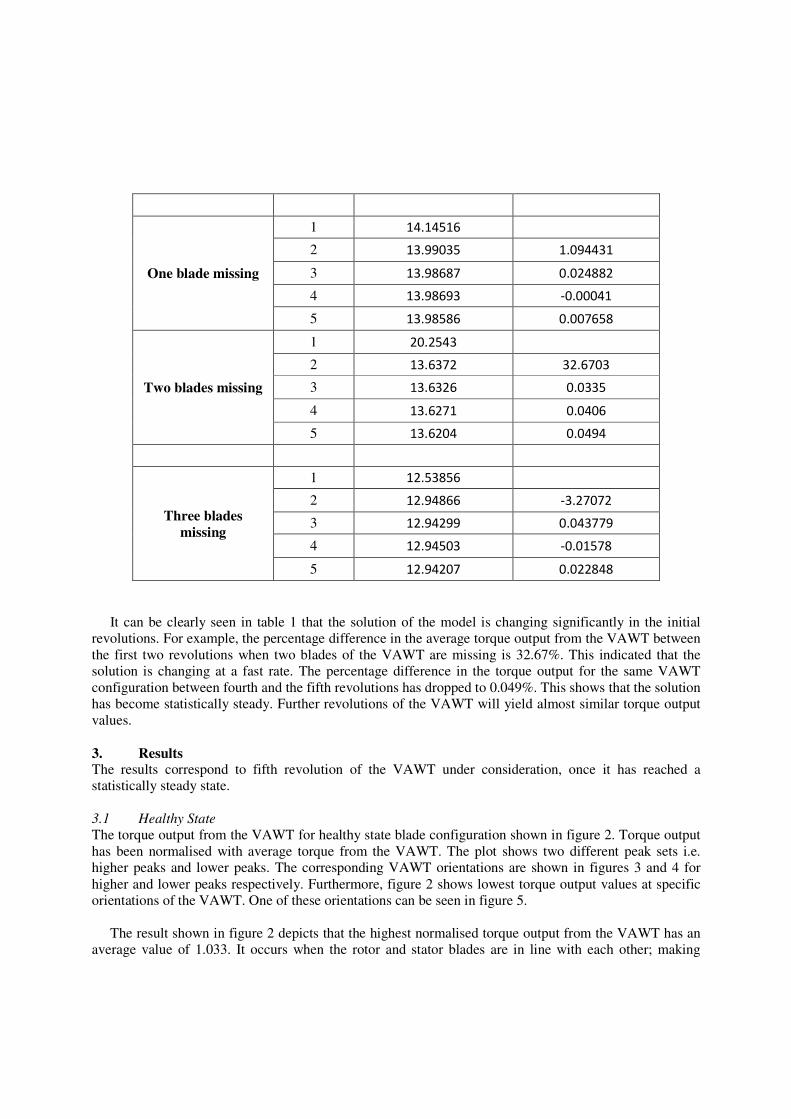
One blade missing
1 14.14516
2 13.99035 1.094431
3 13.98687 0.024882
4 13.98693 -0.00041
5 13.98586 0.007658
Two blades missing
1 20.2543
2 13.6372 32.6703
3 13.6326 0.0335
4 13.6271 0.0406
5 13.6204 0.0494
Three blades
missing
1 12.53856
2 12.94866 -3.27072
3 12.94299 0.043779
4 12.94503 -0.01578
5 12.94207 0.022848
It can be clearly seen in table 1 that the solution of the model is changing significantly in the initial
revolutions. For example, the percentage difference in the average torque output from the VAWT between
the first two revolutions when two blades of the VAWT are missing is 32.67%. This indicated that the
solution is changing at a fast rate. The percentage difference in the torque output for the same VAWT
configuration between fourth and the fifth revolutions has dropped to 0.049%. This shows that the solution
has become statistically steady. Further revolutions of the VAWT will yield almost similar torque output
values.
3. Results The results correspond to fifth revolution of the VAWT under consideration, once it has reached a
statistically steady state.
3.1 Healthy State
The torque output from the VAWT for healthy state blade configuration shown in figure 2. Torque output
has been normalised with average torque from the VAWT. The plot shows two different peak sets i.e.
higher peaks and lower peaks. The corresponding VAWT orientations are shown in figures 3 and 4 for
higher and lower peaks respectively. Furthermore, figure 2 shows lowest torque output values at specific
orientations of the VAWT. One of these orientations can be seen in figure 5.
The result shown in figure 2 depicts that the highest normalised torque output from the VAWT has an
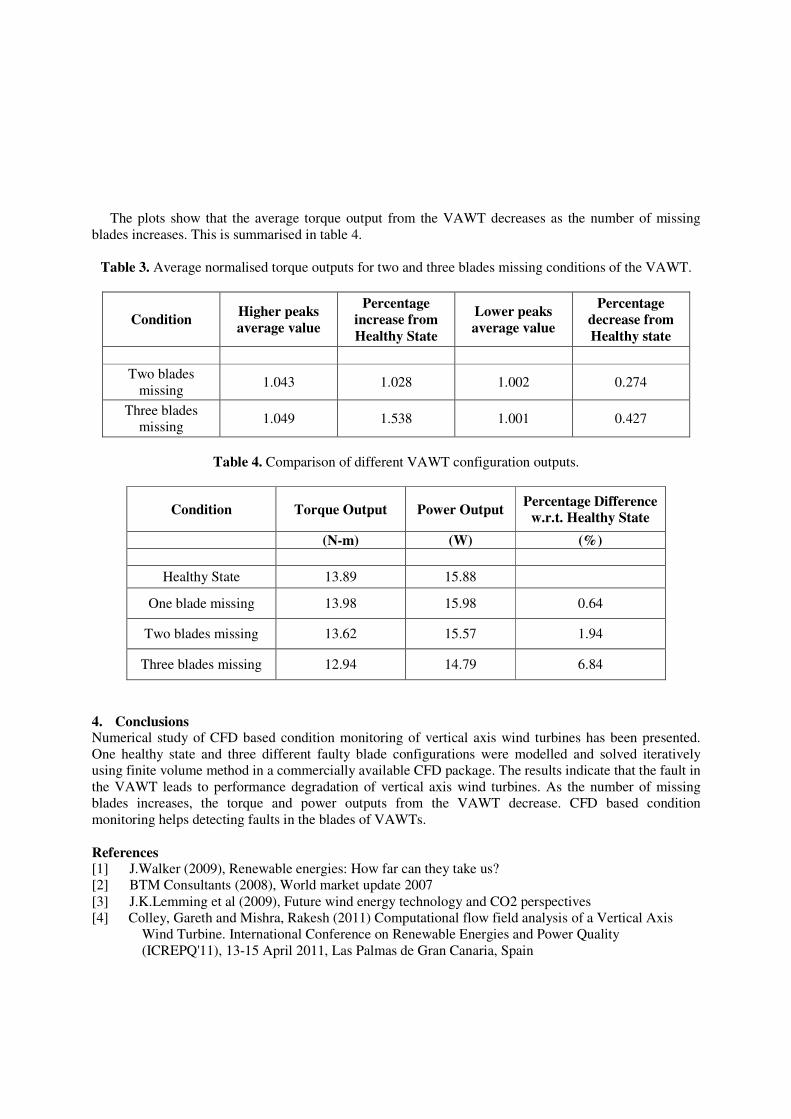
average value of 1.033. It occurs when the rotor and stator blades are in line with each other; making
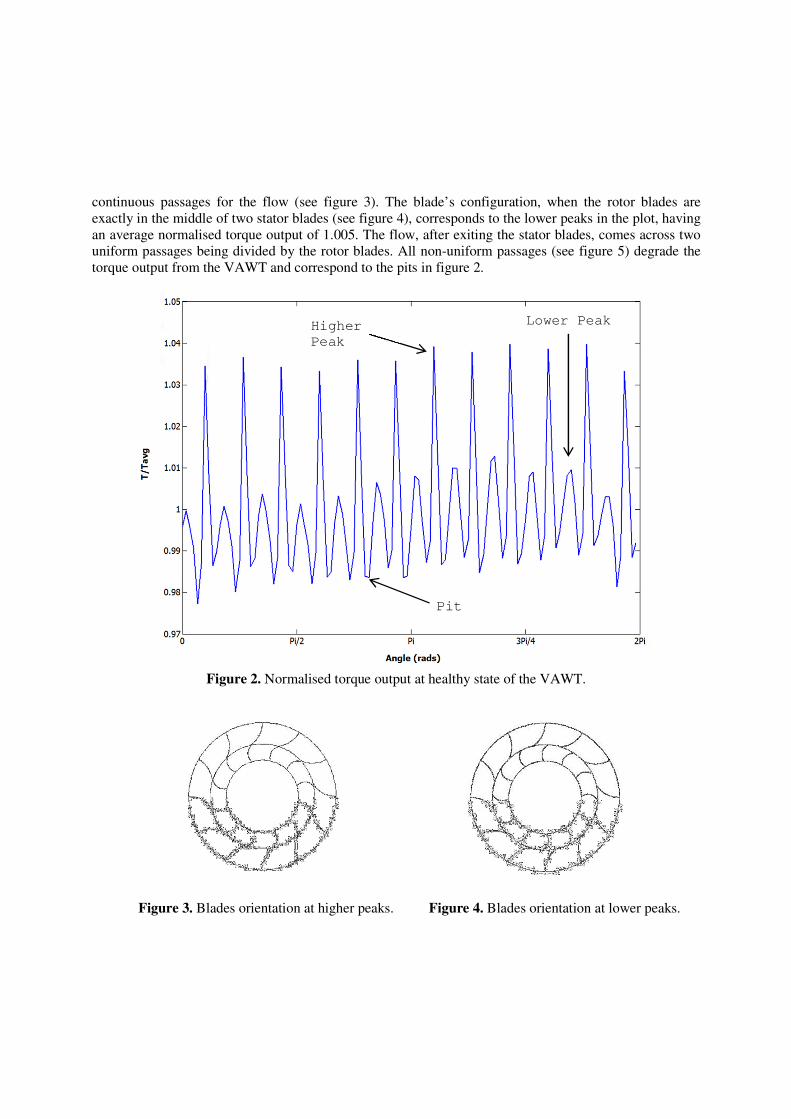
continuous passages for the flow (see figure 3). The blade’s configuration, when the rotor blades are
exactly in the middle of two stator blades (see figure 4), corresponds to the lower peaks in the plot, having
an average normalised torque output of 1.005. The flow, after exiting the stator blades, comes across two
uniform passages being divided by the rotor blades. All non-uniform passages (see figure 5) degrade the
torque output from the VAWT and correspond to the pits in figure 2.
Figure 2. Normalised torque output at healthy state of the VAWT.
Figure 3. Blades orientation at higher peaks. Figure 4. Blades orientation at lower peaks.
Higher
Peak
Lower Peak
Pit

Figure 5. Blades orientation at pits.
3.2 One Blade Missing Condition
Figure 6 shows the normalised torque output from the VAWT when blade number 1, shown in figure 1, is
missing from the model. The plot shows that the difference between the values of higher and lower peaks
has been reduced significantly due to the degradation of the VAWT’s performance. The average value of
normalised torque output for in-line stator and rotor blades, which corresponds to higher peaks, is 1.031.
Similarly, the average value of normalised torque output for the blade configurations when the rotor
blades are in middle of two consecutive stator blades, and vice versa, is 1.009. Hence, there is a decrease
of 0.138% in the value of higher peaks and an increase of 0.37% in the values of lower peaks on average
as compared to the corresponding healthy state average torque output values from the VAWT.
Furthermore, the difference in the average torque output between the highest peak and the lowest pit is
0.34 for one blade missing condition. This value is 0.058 in the case of healthy state VAWT. This increase
in the torque output variations is due to the vibration of the VAWT which makes it more sensitive and
degrades its performance.
Figure 6. Normalised torque output for one blade missing condition of the VAWT.

There exists a pit in the above plot at 204º orientation of the rotor blades. The reason for this further
degradation of the VAWT’s performance is due to the fact that there exists a low pressure region in the
stator of the VAWT. This can be clearly seen in the static pressure distribution in the VAWT shown in
figure 7.
Figure 7. Static pressure (Pa) variations in the VAWT for one blade missing condition.
The corresponding power output of the VAWT is shown in figure 8. It can be seen that the power
output from the VAWT is highly dependent on the orientation of the missing rotor blade.
Figure 8. Normalised power output for one blade missing condition of the VAWT.
Low Pressure
Region

3.3 Two and Three Blades Missing Conditions
The performance of the VAWT for two and three blades missing configurations show the same trend as
that for one blade missing configuration. The results for the normalised torque outputs are shown in
figures 9 and 10. The average values of higher and lower peaks are summarised in table 3.
Figure 9. Normalised torque output for two blades missing condition of the VAWT.
Figure 10. Normalised torque output for three blades missing condition of the VAWT.
The plots show that the average torque output from the VAWT decreases as the number of missing
blades increases. This is summarised in table 4.
Table 3. Average normalised torque outputs for two and three blades missing conditions of the VAWT.
Condition Higher peaks
average value
Percentage
increase from
Healthy State
Lower peaks
average value
Percentage
decrease from
Healthy state
Two blades
missing 1.043 1.028 1.002 0.274
Three blades
missing 1.049 1.538 1.001 0.427
Table 4. Comparison of different VAWT configuration outputs.
Condition Torque Output Power Output Percentage Difference
w.r.t. Healthy State
(N-m) (W) (%)
Healthy State 13.89 15.88
One blade missing 13.98 15.98 0.64
Two blades missing 13.62 15.57 1.94
Three blades missing 12.94 14.79 6.84
4. Conclusions Numerical study of CFD based condition monitoring of vertical axis wind turbines has been presented.
One healthy state and three different faulty blade configurations were modelled and solved iteratively
using finite volume method in a commercially available CFD package. The results indicate that the fault in
the VAWT leads to performance degradation of vertical axis wind turbines. As the number of missing
blades increases, the torque and power outputs from the VAWT decrease. CFD based condition
monitoring helps detecting faults in the blades of VAWTs.
References [1] J.Walker (2009), Renewable energies: How far can they take us?
[2] BTM Consultants (2008), World market update 2007
[3] J.K.Lemming et al (2009), Future wind energy technology and CO2 perspectives
[4] Colley, Gareth and Mishra, Rakesh (2011) Computational flow field analysis of a Vertical Axis
Wind Turbine. International Conference on Renewable Energies and Power Quality
(ICREPQ'11), 13-15 April 2011, Las Palmas de Gran Canaria, Spain
Copyright © 2022 FDOKUMEN

