
Bahasa
Halaman
Hukum

doi: 10.1111/j.1365-2796.2007.01865.x
Clinical and biochemical implications of low thyroidhormone levels (total and free forms) in euthyroid patientswith chronic kidney disease
J. J. Carrero1, A. R. Qureshi1, J. Axelsson1, M. I. Yilmaz1, S. Rehnmark2, M. R. Witt2, P. Barany1,O. Heimburger1, M. E. Suliman1, A. Alvestrand1, B. Lindholm1 & P. Stenvinkel1
From the 1Divisions of Renal Medicine and Baxter Novum; Department of Clinical Science, Intervention and Technology,Karolinska Institutet, Stockholm, Sweden, 2Karo Bio AB, Novum, Huddinge, Sweden
Abstract. Carrero JJ, Qureshi AR, Axelsson J, Yilmaz
MI, Rehnmark S, Witt MR, Barany P, Heimburger O,
Suliman ME, Alvestrand A, Lindholm B, Stenvinkel
P (Karolinska Institutet, Stockholm; and Karo
Bio AB, Novum, Huddinge; Sweden). Clinical and
biochemical implications of low thyroid hormone
levels (total and free forms) in euthyroid
patients with chronic kidney disease. J Intern Med
2007; 262: 690–701.
Objectives. In this study, we explore the associations
of decreased thyroid hormone levels with inflamma-
tion, wasting and survival in biochemically euthyroid
patients with end-stage renal disease (ESRD).
Design. After exclusion of 23 patients with thyroid-
stimulating hormone (TSH) values outside the normal
range (0.1–4.5 mIU L)1), 187 clinically and biochem-
ically euthyroid incident ESRD stage 5 patients start-
ing dialysis were followed for a median of 20 (range
1–60) months. Measurements of total and free forms
of thyroid hormones, s-albumin, hs-CRP, interleukin
(IL)-6, vascular adhesion molecule (VCAM)-1 and
insulin-like growth factor 1 (IGF-1) were performed
at baseline.
Results. In this population, 17 out of 210 patients (8%)
were defined as subclinically hypothyroid. Multivariate
analysis, according to receiver operating characteristic
(ROC) curves, showed that mortality was best pre-
dicted by total triiodothyronine (T3). When using the
cut-off levels derived from ROC, low T3 levels were
associated with increased inflammation (higher
hs-CRP, IL-6 and VCAM-1) and lower concentration
of both s-albumin and IGF-1. Finally, low T3 but not
low free triiodothyronine was associated with worse
all-cause (Likelihood ratio = 45.4; P < 0.0001) and
cardiovascular mortality (Likelihood ratio = 47.8;
P < 0.0001) after adjustment for confounding factors.
Conclusion. This study showed that low T3 levels are
independent predictors of all-cause and also cardio-
vascular disease mortality in biochemically euthyroid
patients, perhaps due to an intimate association with
inflammation. Based on these results, the use of T3
levels in studies assessing the relationship between
thyroid dysfunction and mortality risk is recom-
mended.
Keywords: chronic kidney disease, inflammation,
mortality, Triiodothyronine, wasting.
Introduction
Chronic kidney disease (CKD) causes alterations in
thyroid hormones in the absence of an underlying
intrinsic thyroid disorder, known as the syndrome of
nonthyroidal illness [1, 2]. This syndrome is mainly
characterized by a decrease in total (T3) and free tri-
iodothyronine (fT3) plasma concentration, whilst thy-
roid-stimulating hormone (TSH) levels are usually
normal. Indeed, Lo et al. [3] recently reported that
approximately one fourth of end-stage renal disease
(ESRD) patients present with low levels of fT3.
690 ª 2007 Blackwell Publishing Ltd
Original Article |
Traditionally, decreases in plasma T3 concentration
have been interpreted as an attempt to conserve body
energy stores by reducing metabolic rate, e.g. in peri-
ods of starvation [4]. There are, however, data indicat-
ing that low T3 and fT3 concentrations are patterns
present in approximately 30% of patients with con-
gestive heart failure (CHF) [5, 6]. As low T3 and fT3
are independent predictors of death in the general
population [7–9], it has been suggested that the thy-
roid system can also play a role in the development
of cardiac disease. Indeed, decreased active thyroid
hormone levels are considered to be part of the
deranged neuroendocrine ⁄proinflammatory system that
is associated with CHF [10]. This proinflammatory
stimuli and in particular interleukin (IL) signalling,
has been reported to downregulate the peripheral con-
version of total thyroxine (T4) into T3 in both experi-
mental [11, 12] and clinical studies [13, 14].
Therefore, low T3 could be associated with pathologi-
cal conditions and maladaptation leading to decreased
survival rather than a sign of physiological adaptation
to energy shortage.
A constellation of wasting, persistent subclinical
inflammation and cardiovascular disease (CVD), pres-
ent in a large proportion of ESRD patients [15] could
be explained in part by these alterations in the thyroid
system, acting as intermediate link between the
inflammatory stress and the impaired cardiovascular
response. This hypothesis was recently presented by
Zoccali et al. [16] in prevalent dialysis patients, show-
ing that subjects with low fT3 levels presented with
increased inflammatory markers and a worse all-cause
mortality when compared to those with higher fT3
levels [16–18]. However, these studies assessed only
fT3 levels, not providing information on the whole
thyroid system. On the other hand, the ‘low T3 syn-
drome’ is known to specifically affect cardiovascular
mortality in the general population [7, 9], yet the
impact of low T3 syndrome in cardiovascular-CKD
related mortality is unknown. Furthermore, subclinical
hypothyroidism has been associated to increased
cardiovascular risk [19]. Previous analyses included
patients with TSH values above the normal range
[16–18], which could have masked some of
the reported findings. Taking into consideration the
possible clinical significance of alterations in thyroid
hormone levels in CKD, we studied total and free lev-
els of thyroid hormones in relation to inflammation,
wasting and survival in incident CKD 5 patients start-
ing dialysis therapy who were followed prospectively
for upto 60 months.
Patients and methods
The Ethics Committee of the Karolinska Institute,
Sweden, approved the study at the Karolinska Univer-
sity Hospital at Huddinge. Informed consent was
obtained from each patient. Incident CKD 5 patients
were investigated as part of an ongoing prospective
cohort study part of which have been published else-
where [15]. In the present study, post hoc analyses
were performed to examine the association between
thyroid hormones, inflammation and mortality. The
study population consisted of 210 consecutive patients
with CKD stage 5 [glomerular filtration rate (GFR)
<15 mL min)1; 63% males, median and range; age
55 (19–70) years] who were enrolled at initiation of
renal replacement therapy in the renal program of the
Karolinska University Hospital Huddinge (Sweden)
between 1994 and 2006. The study exclusion criteria
were age below 18 years or above 70 years, clinical
signs of acute infection, active vasculitis or liver
disease at the time of evaluation, or unwillingness
to participate. The causes of CKD were chronic
glomerulonephritis in 52 patients, diabetic nephro-
pathy in 69 patients, polycystic kidney disease in 23
patients, nephrosclerosis in eight patients and other, or
unknown, etiologies in 58 patients. Thirty-two (15%)
patients were diagnosed as type-1 diabetics whilst 38
patients (18%) were diagnosed as type-2 diabetics.
Most of the patients initially taking oral antiglycemic
agents or on restricted diets had been switched to
insulin therapy at the time of inclusion in the study.
The majority of patients were on antihypertensive
medications (angiotensin-converting enzyme inhibitors
and ⁄or angiotensin II receptor antagonists; n = 107,
betablockers; n = 123, calcium-channel blockers;
n = 73) and other commonly used drugs in CKD,
such as phosphate and potassium binders, diuretics,
erythropoesis-stimulating agents, iron substitution and
vitamin B, C and D supplementation. Only 49
J. J. Carrero et al. | Low total triiodothyronine levels in chronic kidney disease
ª 2007 Blackwell Publishing Ltd Journal of Internal Medicine 262; 690–701 691
patients were on lipid-lowering medication (HMG-
CoA-reductase inhibitors).
None of the patients showed clinical signs of hyper or
hypothyroidisms. However, 187 patients were defined
as biochemically euthyroid, presenting both TSH
(0.1–4.5 mIU L)1) and T4 (57.9–169.9 nmol L)1;
4.5–13.2 lg dL)1) within the normal range [3, 20].
Because subclinical hypothyroidism has been associ-
ated with increased cardiovascular risk [19], 17 (8%)
subclinically hypothyroid patients [TSH > 4.5
mIU L)1 and T4 < 57.9 nmol L)1 (4.5 lg dL)1)] [3,
20], and six subclinically hyperthyroid patients [3, 20]
were excluded from this analysis. For comparative
purposes, analysis including all 210 investigated
subjects will, in some cases, be also presented.
Methods
After an overnight fast, venous blood samples were
drawn and stored at )70 �C for biochemical analyses.
In the patients, GFR was estimated as the mean of
creatinine and urea clearance from a 24 h collection
of urine. Plasma analysis of thyroid hormones were
performed on an Immulite� system (Immulite; DPC
Corp, Los Angeles, CA, USA) using their commer-
cially available immunometric assays for T3 [analyti-
cal sensitivity (AS), 0,54 nmol L)1; total coefficient
of variation (CVs), 13.2% and 5.4% at the levels of
0.95 and 6.02 nmol L)1], fT3 (AS, 0.97 pg mL)1;
total CVs, 7.1% and 4.5% at the levels of 4.43 and
12.63 pg mL)1), T4 (AS, 5 nmol L)1; total CVs,
8.4% and 6.3% at the levels of 49 and
167 nmol L)1), free thyroxine (fT4; AS,
0.31 ng dL)1; total CVs, 9% and 6% at the levels of
0.69 and 2.09 ng dL)1), TSH (AS, 0.004 mIU L)1;
total CVs, 12.5%, and 4.6% at the levels of 0.016
and 1.3 mIU L)1) and thyroxine-binding globulin
(TGB; AS, 1.1 lg mL)1; total CVs, 9.2% and 7.3%
at the levels of 13 and 52 lg mL)1). Results are
expressed as the average of two measurements. The
plasma concentrations of insulin-like growth-factor
(IGF)-1 and serum levels of IL-6 were quantified on
the Immulite� system (Immulite; DPC Corp). Plasma
concentration of vascular adhesion molecule
(VCAM)-1 and levels of high sensitivity (hs)-CRP
were measured using commercially available ELISA
kits (R&D System Inc., Minneapolis, MN, USA). The
levels of serum cholesterol and triacylglycerols were
analysed by standard enzymatic procedures (Roche
Diagnostics GmbH, Mannheim, Germany). The
remaining biochemical analyses were performed using
routine methods at the Department of Clinical Chem-
istry at Huddinge Hospital.
Subjective global assessment (SGA) was used to eval-
uate overall protein-energy nutritional status [21, 22],
and patients presenting with an SGA score of 2–4 were
defined as malnourished. Body mass index (BMI) was
calculated as weight in kg per (height in m)2.
Survival was determined from the day of examination,
with a median follow-up period of 20 (range 1–60)
months. Patients were censored at transplantation or
when completing the follow-up period, with no loss
of follow-up of any patient. Within the follow-up
period, 66 patients died and 73 patients underwent
transplantation. Cardiovascular mortality was defined
as death due to coronary heart disease, sudden death,
stroke or complicated peripheral vascular disease.
Statistical analysis
Results are expressed as mean and standard deviation
or median and range unless otherwise indicated.
A P-value <0.05 was considered to be statistically
significant. Comparisons between two groups were
assessed for continuous variables with the Student’s
unpaired t-test, Mann–Whitney test or Fisher exact test,
as appropriate. As many values were not normally
distributed, Spearman’s rank correlation was used to
determine correlations between thyroid hormones lev-
els and other variables. To evaluate the sensitivity and
specificity of total and free thyroid forms as predictors
of mortality, a receiver operating characteristic (ROC)
analysis was performed [23], using the statistical soft-
ware NCSS 2007 and PASS 2005 (Number Cruncher
Statistical Systems, Keysville, UT, USA). The optimum
cut-off value, with the combination of the highest
sensitivity and specificity, was calculated. Survival
analyses were made with the Kaplan–Meier survival
curve or the Cox proportional hazard model. The
J. J. Carrero et al. | Low total triiodothyronine levels in chronic kidney disease
692 ª 2007 Blackwell Publishing Ltd Journal of Internal Medicine 262; 690–701
relative risks for mortality were determined by multi-
variate Cox regression analysis and presented as hazard
ratio [Hazards ratio (HR); 95% confidence intervals
(CI)]. Finally, stepwise method of variable selection
was employed to choose the ‘best’ Cox proportional
hazard model in the survival analyses for all-cause and
cardiovascular mortality. The statistical analysis was
performed using statistical software SAS version 9.1
(SAS Campus Drive, Cary, NC, USA).
Results
Associations with inflammation and wasting
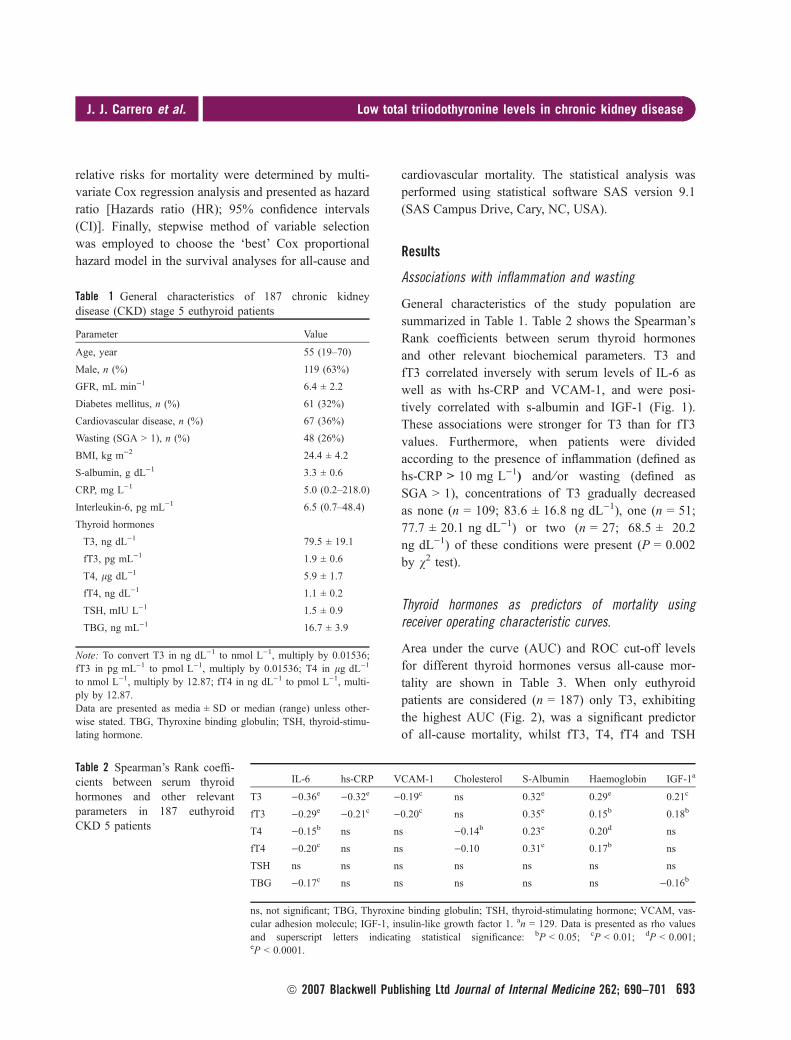
General characteristics of the study population are
summarized in Table 1. Table 2 shows the Spearman’s
Rank coefficients between serum thyroid hormones
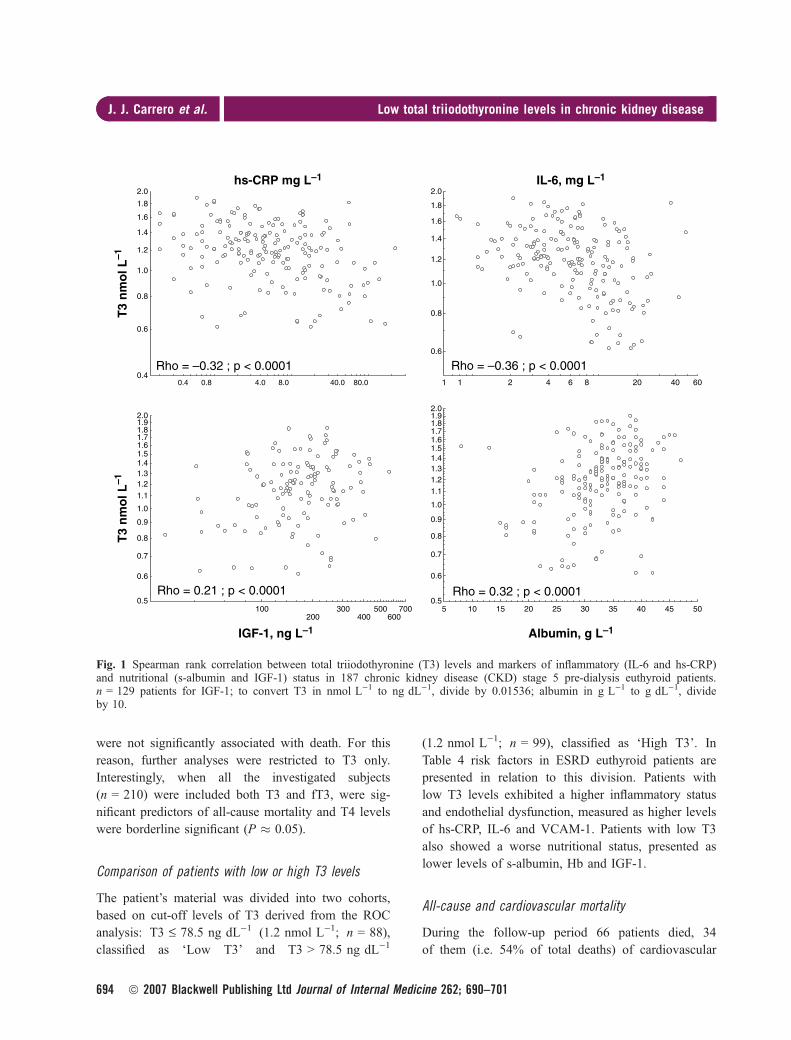
and other relevant biochemical parameters. T3 and
fT3 correlated inversely with serum levels of IL-6 as
well as with hs-CRP and VCAM-1, and were posi-
tively correlated with s-albumin and IGF-1 (Fig. 1).
These associations were stronger for T3 than for fT3
values. Furthermore, when patients were divided
according to the presence of inflammation (defined as
hs-CRP > 10 mg L)1) and ⁄or wasting (defined as
SGA > 1), concentrations of T3 gradually decreased
as none (n = 109; 83.6 ± 16.8 ng dL)1), one (n = 51;
77.7 ± 20.1 ng dL)1) or two (n = 27; 68.5 ± 20.2
ng dL)1) of these conditions were present (P = 0.002
by v2 test).
Thyroid hormones as predictors of mortality usingreceiver operating characteristic curves.
Area under the curve (AUC) and ROC cut-off levels
for different thyroid hormones versus all-cause mor-
tality are shown in Table 3. When only euthyroid
patients are considered (n = 187) only T3, exhibiting
the highest AUC (Fig. 2), was a significant predictor
of all-cause mortality, whilst fT3, T4, fT4 and TSH
Table 1 General characteristics of 187 chronic kidneydisease (CKD) stage 5 euthyroid patients
Parameter Value
Age, year 55 (19–70)
Male, n (%) 119 (63%)
GFR, mL min)1 6.4 ± 2.2
Diabetes mellitus, n (%) 61 (32%)
Cardiovascular disease, n (%) 67 (36%)
Wasting (SGA > 1), n (%) 48 (26%)
BMI, kg m)2 24.4 ± 4.2
S-albumin, g dL)1 3.3 ± 0.6
CRP, mg L)1 5.0 (0.2–218.0)
Interleukin-6, pg mL)1 6.5 (0.7–48.4)
Thyroid hormones
T3, ng dL)1 79.5 ± 19.1
fT3, pg mL)1 1.9 ± 0.6
T4, lg dL)1 5.9 ± 1.7
fT4, ng dL)1 1.1 ± 0.2
TSH, mIU L)1 1.5 ± 0.9
TBG, ng mL)1 16.7 ± 3.9
Note: To convert T3 in ng dL)1 to nmol L)1, multiply by 0.01536;fT3 in pg mL)1 to pmol L)1, multiply by 0.01536; T4 in lg dL)1
to nmol L)1, multiply by 12.87; fT4 in ng dL)1 to pmol L)1, multi-ply by 12.87.Data are presented as media ± SD or median (range) unless other-wise stated. TBG, Thyroxine binding globulin; TSH, thyroid-stimu-lating hormone.
Table 2 Spearman’s Rank coeffi-cients between serum thyroidhormones and other relevantparameters in 187 euthyroidCKD 5 patients
IL-6 hs-CRP VCAM-1 Cholesterol S-Albumin Haemoglobin IGF-1a
T3 )0.36e )0.32e )0.19c ns 0.32e 0.29e 0.21c
fT3 )0.29e )0.21c )0.20c ns 0.35e 0.15b 0.18b
T4 )0.15b ns ns )0.14b 0.23e 0.20d ns
fT4 )0.20c ns ns )0.10 0.31e 0.17b ns
TSH ns ns ns ns ns ns ns
TBG )0.17c ns ns ns ns ns )0.16b
ns, not significant; TBG, Thyroxine binding globulin; TSH, thyroid-stimulating hormone; VCAM, vas-cular adhesion molecule; IGF-1, insulin-like growth factor 1. an = 129. Data is presented as rho valuesand superscript letters indicating statistical significance: bP < 0.05; cP < 0.01; dP < 0.001;eP < 0.0001.
J. J. Carrero et al. | Low total triiodothyronine levels in chronic kidney disease
ª 2007 Blackwell Publishing Ltd Journal of Internal Medicine 262; 690–701 693
were not significantly associated with death. For this
reason, further analyses were restricted to T3 only.
Interestingly, when all the investigated subjects
(n = 210) were included both T3 and fT3, were sig-
nificant predictors of all-cause mortality and T4 levels
were borderline significant (P � 0.05).
Comparison of patients with low or high T3 levels
The patient’s material was divided into two cohorts,
based on cut-off levels of T3 derived from the ROC
analysis: T3 £ 78.5 ng dL)1 (1.2 nmol L)1; n = 88),
classified as ‘Low T3’ and T3 > 78.5 ng dL)1
(1.2 nmol L)1; n = 99), classified as ‘High T3’. In
Table 4 risk factors in ESRD euthyroid patients are
presented in relation to this division. Patients with
low T3 levels exhibited a higher inflammatory status
and endothelial dysfunction, measured as higher levels
of hs-CRP, IL-6 and VCAM-1. Patients with low T3
also showed a worse nutritional status, presented as
lower levels of s-albumin, Hb and IGF-1.
All-cause and cardiovascular mortality
During the follow-up period 66 patients died, 34
of them (i.e. 54% of total deaths) of cardiovascular
0.4 0.8 4.0 8.0 40.0 80.00.4
0.6
0.8
1.0
1.2
1.4
1.6
1.8
2.0hs-CRP mg L–1
T3
nm
ol L
–1
Rho = –0.32 ; p < 0.0001
100200
300400
500600
7000.5
0.6
0.7
0.8
0.9
1.0
1.1
1.21.31.41.51.61.71.81.92.0
IGF-1, ng L–1
T3
nm
ol L
–1
Rho = 0.21 ; p < 0.0001
1 1 2 4 6 8 20 40 60
0.6
0.8
1.0
1.2
1.4
1.6
1.8
2.0IL-6, mg L–1
Rho = –0.36 ; p < 0.0001
5 10 15 20 25 30 35 40 45 500.5
0.6
0.7
0.8
0.9
1.0
1.1
1.21.31.41.51.61.71.81.92.0
Albumin, g L–1
Rho = 0.32 ; p < 0.0001
Fig. 1 Spearman rank correlation between total triiodothyronine (T3) levels and markers of inflammatory (IL-6 and hs-CRP)and nutritional (s-albumin and IGF-1) status in 187 chronic kidney disease (CKD) stage 5 pre-dialysis euthyroid patients.n = 129 patients for IGF-1; to convert T3 in nmol L)1 to ng dL)1, divide by 0.01536; albumin in g L)1 to g dL)1, divideby 10.
J. J. Carrero et al. | Low total triiodothyronine levels in chronic kidney disease
694 ª 2007 Blackwell Publishing Ltd Journal of Internal Medicine 262; 690–701
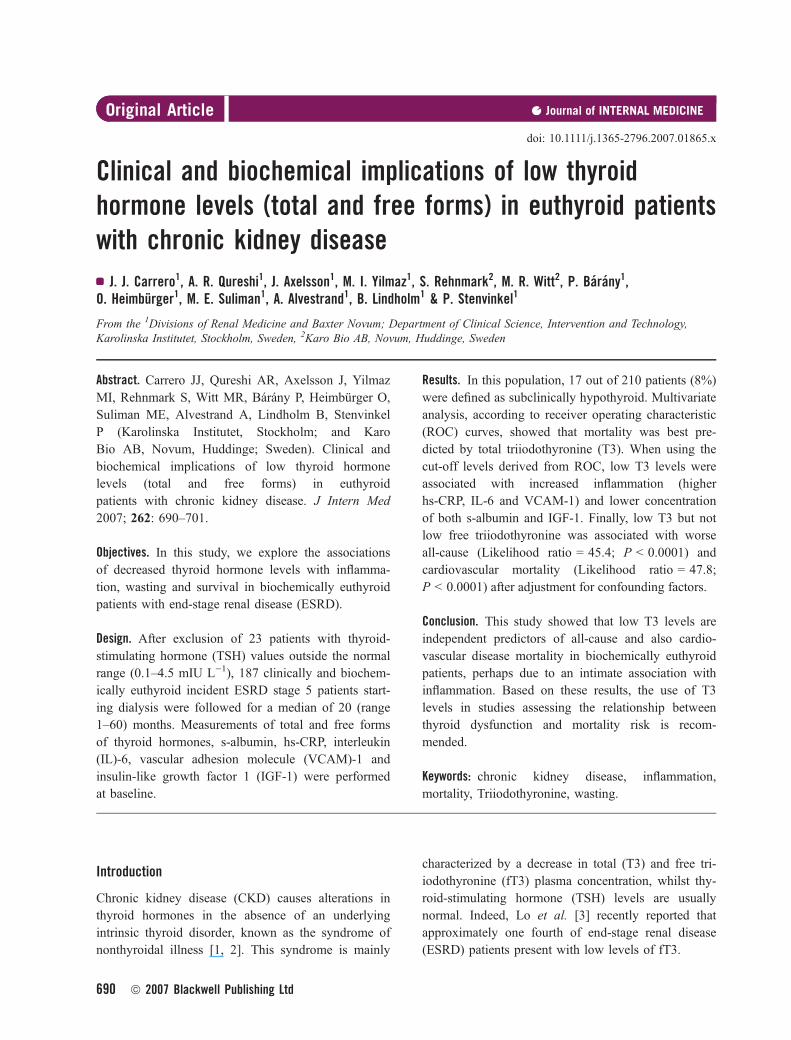
complications. Survival curves for all-cause mortality
in euthyroid patients (n = 187) are shown in Fig. 3.
In the non-adjusted analysis, low plasma T3 (Log-
Rank (v2) = 9.41; P = 0.002), but not low plasma fT3
(Log-Rank (v2) = 1.43; ns), was associated with a
higher all-cause mortality (Fig. 4, Panel A), even after
adjustment for confounding factors (age, gender, pres-
ence of diabetes mellitus, CVD and inflammation
(hs-CRP > 10 mg mL)1); Fig. 4, Panel B; Likelihood
ratio for low T3 = 45.4; P < 0.0001). Low plasma T3
concentration was associated to an increased all-cause
mortality (HR 2.0; 95% CI: 1.1–3.5, P = 0.02).
Interestingly, when all the investigated patients
(n = 210, including those biochemically non-euthy-
roid) were considered, both low plasma T3 (Log-Rank
(v2) = 14.9; P < 0.0001) and low plasma fT3 (Log-
Rank (v2) = 3.6; P < 0.05) had an impact on survival,
that persisted after adjustment for confounding factors
(Likelihood ratio for low T3 = 35.9; P < 0.0001 and
Likelihood ratio for low fT3 = 35.7; P < 0.0001). In
this scenario, presenting with low T3 concentrations
conferred a risk of death 3.0 higher (HR; 95%
CI: 1.7–5.3, P = 0.0002).
Figure 4 shows similar results in the survival curves
for cardiovascular mortality in biochemically euthy-
roid patients. In the nonadjusted analysis, low plasma
T3 (Figure 4, Panel A. Log-Rank (v2) = 6.13;
P = 0.01), but not low plasma fT3 (Log-Rank
(v2) = 2.30; ns) was associated with increased cardio-
vascular mortality (Figure 4, Panel A) that persisted
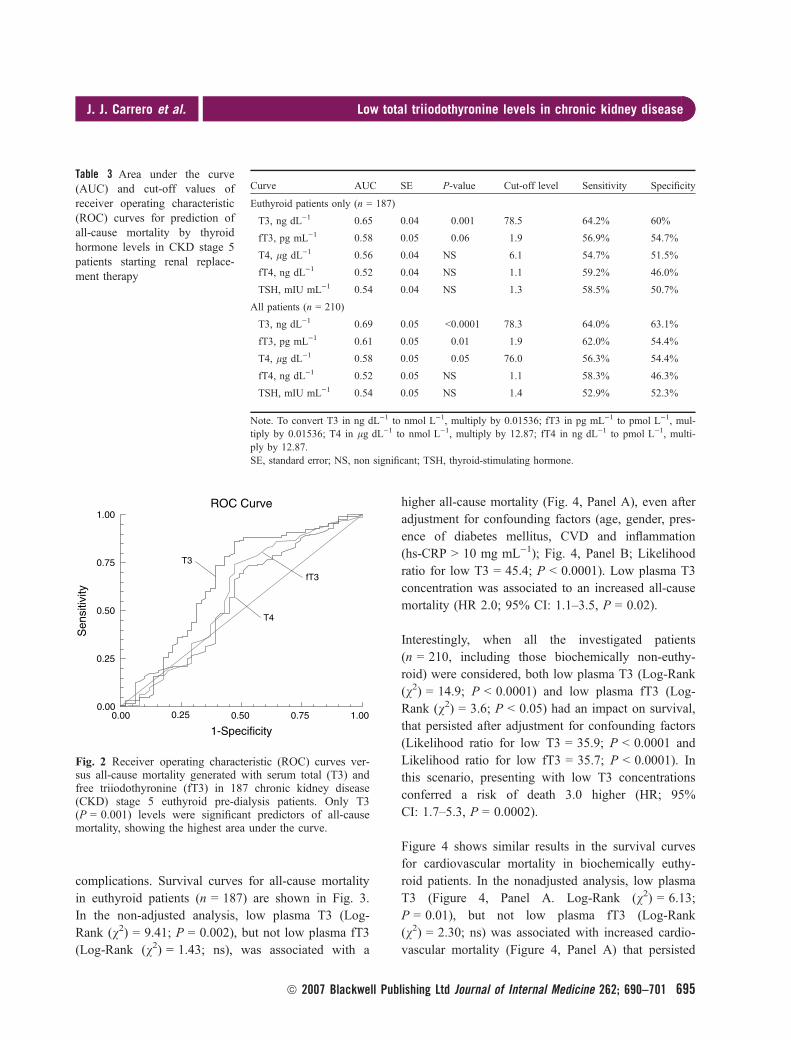
Table 3 Area under the curve(AUC) and cut-off values ofreceiver operating characteristic(ROC) curves for prediction ofall-cause mortality by thyroidhormone levels in CKD stage 5patients starting renal replace-ment therapy
Curve AUC SE P-value Cut-off level Sensitivity Specificity
Euthyroid patients only (n = 187)
T3, ng dL)1 0.65 0.04 0.001 78.5 64.2% 60%
fT3, pg mL)1 0.58 0.05 0.06 1.9 56.9% 54.7%
T4, lg dL)1 0.56 0.04 NS 6.1 54.7% 51.5%
fT4, ng dL)1 0.52 0.04 NS 1.1 59.2% 46.0%
TSH, mIU mL)1 0.54 0.04 NS 1.3 58.5% 50.7%
All patients (n = 210)
T3, ng dL)1 0.69 0.05 <0.0001 78.3 64.0% 63.1%
fT3, pg mL)1 0.61 0.05 0.01 1.9 62.0% 54.4%
T4, lg dL)1 0.58 0.05 0.05 76.0 56.3% 54.4%
fT4, ng dL)1 0.52 0.05 NS 1.1 58.3% 46.3%
TSH, mIU mL)1 0.54 0.05 NS 1.4 52.9% 52.3%
Note. To convert T3 in ng dL)1 to nmol L)1, multiply by 0.01536; fT3 in pg mL)1 to pmol L)1, mul-tiply by 0.01536; T4 in lg dL)1 to nmol L)1, multiply by 12.87; fT4 in ng dL)1 to pmol L)1, multi-ply by 12.87.SE, standard error; NS, non significant; TSH, thyroid-stimulating hormone.
Sen
sitiv
ity
T3
T4
fT3
1.00
0.75
0.50
0.25
0.001.000.750.500.250.00
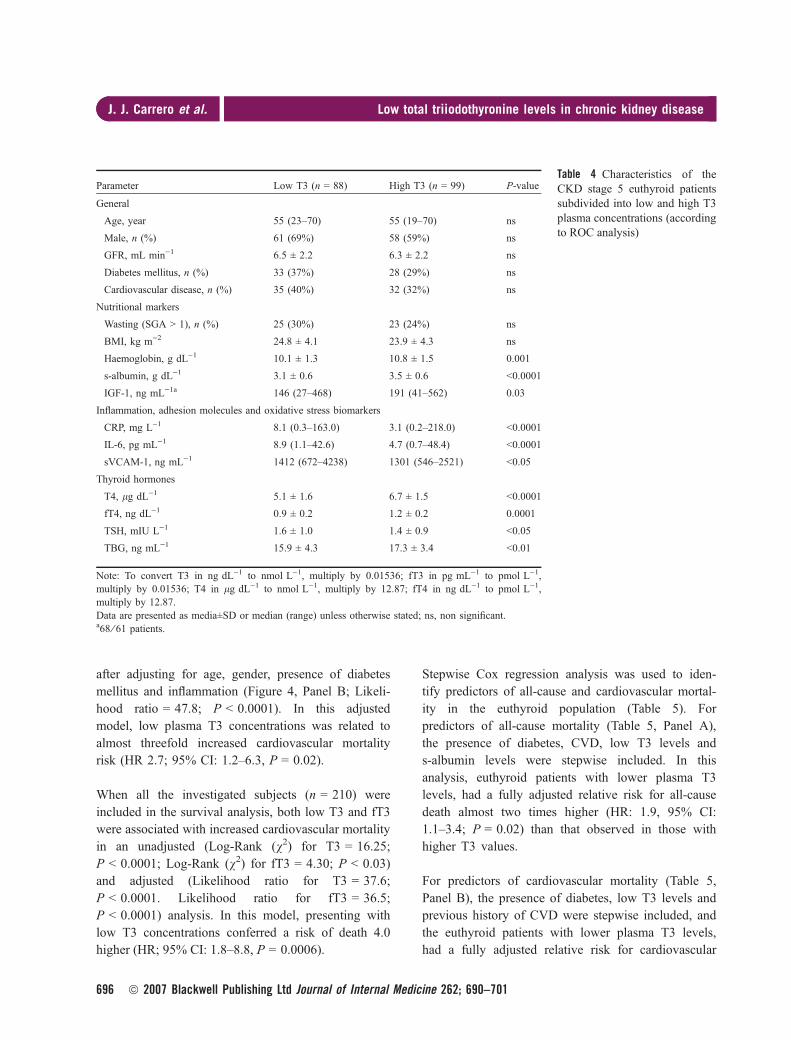
1-Specificity
ROC Curve
Fig. 2 Receiver operating characteristic (ROC) curves ver-sus all-cause mortality generated with serum total (T3) andfree triiodothyronine (fT3) in 187 chronic kidney disease(CKD) stage 5 euthyroid pre-dialysis patients. Only T3(P = 0.001) levels were significant predictors of all-causemortality, showing the highest area under the curve.
J. J. Carrero et al. | Low total triiodothyronine levels in chronic kidney disease
ª 2007 Blackwell Publishing Ltd Journal of Internal Medicine 262; 690–701 695
after adjusting for age, gender, presence of diabetes
mellitus and inflammation (Figure 4, Panel B; Likeli-
hood ratio = 47.8; P < 0.0001). In this adjusted
model, low plasma T3 concentrations was related to
almost threefold increased cardiovascular mortality
risk (HR 2.7; 95% CI: 1.2–6.3, P = 0.02).
When all the investigated subjects (n = 210) were
included in the survival analysis, both low T3 and fT3
were associated with increased cardiovascular mortality
in an unadjusted (Log-Rank (v2) for T3 = 16.25;
P < 0.0001; Log-Rank (v2) for fT3 = 4.30; P < 0.03)
and adjusted (Likelihood ratio for T3 = 37.6;
P < 0.0001. Likelihood ratio for fT3 = 36.5;
P < 0.0001) analysis. In this model, presenting with
low T3 concentrations conferred a risk of death 4.0
higher (HR; 95% CI: 1.8–8.8, P = 0.0006).
Stepwise Cox regression analysis was used to iden-
tify predictors of all-cause and cardiovascular mortal-
ity in the euthyroid population (Table 5). For
predictors of all-cause mortality (Table 5, Panel A),
the presence of diabetes, CVD, low T3 levels and
s-albumin levels were stepwise included. In this
analysis, euthyroid patients with lower plasma T3
levels, had a fully adjusted relative risk for all-cause
death almost two times higher (HR: 1.9, 95% CI:
1.1–3.4; P = 0.02) than that observed in those with
higher T3 values.
For predictors of cardiovascular mortality (Table 5,
Panel B), the presence of diabetes, low T3 levels and
previous history of CVD were stepwise included, and
the euthyroid patients with lower plasma T3 levels,
had a fully adjusted relative risk for cardiovascular
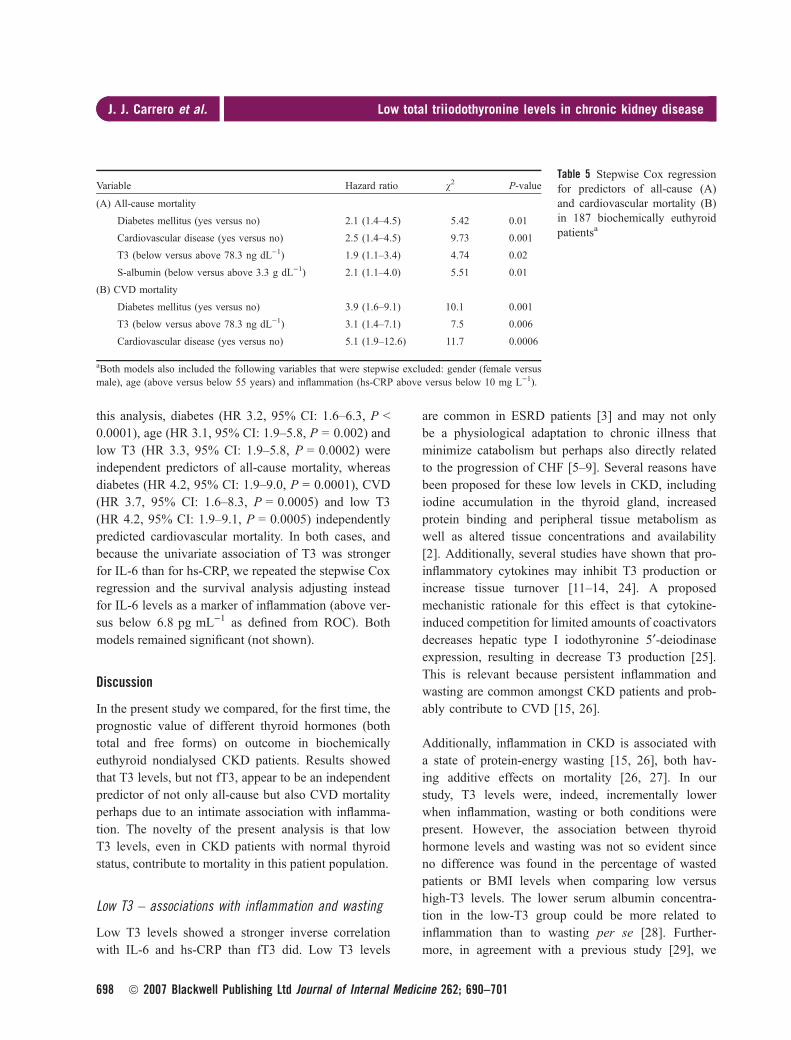
Table 4 Characteristics of theCKD stage 5 euthyroid patientssubdivided into low and high T3plasma concentrations (accordingto ROC analysis)
Parameter Low T3 (n = 88) High T3 (n = 99) P-value
General
Age, year 55 (23–70) 55 (19–70) ns
Male, n (%) 61 (69%) 58 (59%) ns
GFR, mL min)1 6.5 ± 2.2 6.3 ± 2.2 ns
Diabetes mellitus, n (%) 33 (37%) 28 (29%) ns
Cardiovascular disease, n (%) 35 (40%) 32 (32%) ns
Nutritional markers
Wasting (SGA > 1), n (%) 25 (30%) 23 (24%) ns
BMI, kg m)2 24.8 ± 4.1 23.9 ± 4.3 ns
Haemoglobin, g dL)1 10.1 ± 1.3 10.8 ± 1.5 0.001
s-albumin, g dL)1 3.1 ± 0.6 3.5 ± 0.6 <0.0001
IGF-1, ng mL)1a 146 (27–468) 191 (41–562) 0.03
Inflammation, adhesion molecules and oxidative stress biomarkers
CRP, mg L)1 8.1 (0.3–163.0) 3.1 (0.2–218.0) <0.0001
IL-6, pg mL)1 8.9 (1.1–42.6) 4.7 (0.7–48.4) <0.0001
sVCAM-1, ng mL)1 1412 (672–4238) 1301 (546–2521) <0.05
Thyroid hormones
T4, lg dL)1 5.1 ± 1.6 6.7 ± 1.5 <0.0001
fT4, ng dL)1 0.9 ± 0.2 1.2 ± 0.2 0.0001
TSH, mIU L)1 1.6 ± 1.0 1.4 ± 0.9 <0.05
TBG, ng mL)1 15.9 ± 4.3 17.3 ± 3.4 <0.01
Note: To convert T3 in ng dL)1 to nmol L)1, multiply by 0.01536; fT3 in pg mL)1 to pmol L)1,multiply by 0.01536; T4 in lg dL)1 to nmol L)1, multiply by 12.87; fT4 in ng dL)1 to pmol L)1,multiply by 12.87.Data are presented as media±SD or median (range) unless otherwise stated; ns, non significant.a68 ⁄ 61 patients.
J. J. Carrero et al. | Low total triiodothyronine levels in chronic kidney disease
696 ª 2007 Blackwell Publishing Ltd Journal of Internal Medicine 262; 690–701

death three times higher (HR: 3.1, 95% CI: 1.4–7.1;
P = 0.006) than that observed in those with higher
values.
When all patients (n = 210) were considered in the
stepwise regression, the hazard ratio for patients pre-
senting with low T3 levels was in general higher: In
100
80
60
40
Pat
ient
s su
rviv
al, %
20
00 365 730 1095
Days
1460
Low T3
High T3
1825
100
80
60
40
Pat
ient
s su
rviv
al, %
20
00 365 730 1095
Days
1460
Low T3
High T3
1825
Log-Rank (χ2) = 9.41
p = 0.002
Likelihood ratio = 45.4
p < 0.0001
(b)
(a)
Fig. 3 Unadjusted (Panel A) and adjusted (Panel B) all-cause mortality according to plasma levels of T3 in 187CKD stage 5 euthyroid pre-dialysis patients. Adjustment forpotential confounding factors [age, gender, presence of dia-betes mellitus, cardiovascular disease and inflammation(hs-CRP > 10 mg mL)1)] was done with the Cox propor-tional hazards model. Cut-off value for T3 was assessedfrom the ROC analysis.
00
20
40
60
80High T3
Pat
ient
s su
rviv
al, %
Pat
ient
s su
rviv
al, %
Low T3
100
(b)
(a)
0
20
40
60
80
100
365 730 1095
Days
1460 1825
0 365 730 1095Days
1460 1825
High T3
Low T3
Log-Rank (χ2) = 6.13
p = 0.01
Likelihood ratio = 47.8
p < 0.0001
Fig. 4 Unadjusted (Panel A) and adjusted (Panel B) cardio-vascular mortality according to plasma levels of T3 in 187chronic kidney disease (CKD) stage 5 euthyroid pre-dialysispatients. Adjustment for potential confounding factors (age,gender, presence of diabetes mellitus, cardiovascular diseaseand inflammation [hs-CRP > 10 mg mL)1]) was done withthe Cox proportional hazards model. Cut-off value for T3was assessed from the ROC analysis.
J. J. Carrero et al. | Low total triiodothyronine levels in chronic kidney disease
ª 2007 Blackwell Publishing Ltd Journal of Internal Medicine 262; 690–701 697
this analysis, diabetes (HR 3.2, 95% CI: 1.6–6.3, P <
0.0001), age (HR 3.1, 95% CI: 1.9–5.8, P = 0.002) and
low T3 (HR 3.3, 95% CI: 1.9–5.8, P = 0.0002) were
independent predictors of all-cause mortality, whereas
diabetes (HR 4.2, 95% CI: 1.9–9.0, P = 0.0001), CVD
(HR 3.7, 95% CI: 1.6–8.3, P = 0.0005) and low T3
(HR 4.2, 95% CI: 1.9–9.1, P = 0.0005) independently
predicted cardiovascular mortality. In both cases, and
because the univariate association of T3 was stronger
for IL-6 than for hs-CRP, we repeated the stepwise Cox
regression and the survival analysis adjusting instead
for IL-6 levels as a marker of inflammation (above ver-
sus below 6.8 pg mL)1 as defined from ROC). Both
models remained significant (not shown).
Discussion
In the present study we compared, for the first time, the
prognostic value of different thyroid hormones (both
total and free forms) on outcome in biochemically
euthyroid nondialysed CKD patients. Results showed
that T3 levels, but not fT3, appear to be an independent
predictor of not only all-cause but also CVD mortality
perhaps due to an intimate association with inflamma-
tion. The novelty of the present analysis is that low
T3 levels, even in CKD patients with normal thyroid
status, contribute to mortality in this patient population.
Low T3 – associations with inflammation and wasting
Low T3 levels showed a stronger inverse correlation
with IL-6 and hs-CRP than fT3 did. Low T3 levels
are common in ESRD patients [3] and may not only
be a physiological adaptation to chronic illness that
minimize catabolism but perhaps also directly related
to the progression of CHF [5–9]. Several reasons have
been proposed for these low levels in CKD, including
iodine accumulation in the thyroid gland, increased
protein binding and peripheral tissue metabolism as
well as altered tissue concentrations and availability
[2]. Additionally, several studies have shown that pro-
inflammatory cytokines may inhibit T3 production or
increase tissue turnover [11–14, 24]. A proposed
mechanistic rationale for this effect is that cytokine-
induced competition for limited amounts of coactivators
decreases hepatic type I iodothyronine 5¢-deiodinaseexpression, resulting in decrease T3 production [25].
This is relevant because persistent inflammation and
wasting are common amongst CKD patients and prob-
ably contribute to CVD [15, 26].
Additionally, inflammation in CKD is associated with
a state of protein-energy wasting [15, 26], both hav-
ing additive effects on mortality [26, 27]. In our
study, T3 levels were, indeed, incrementally lower
when inflammation, wasting or both conditions were
present. However, the association between thyroid
hormone levels and wasting was not so evident since
no difference was found in the percentage of wasted
patients or BMI levels when comparing low versus
high-T3 levels. The lower serum albumin concentra-
tion in the low-T3 group could be more related to
inflammation than to wasting per se [28]. Further-
more, in agreement with a previous study [29], we
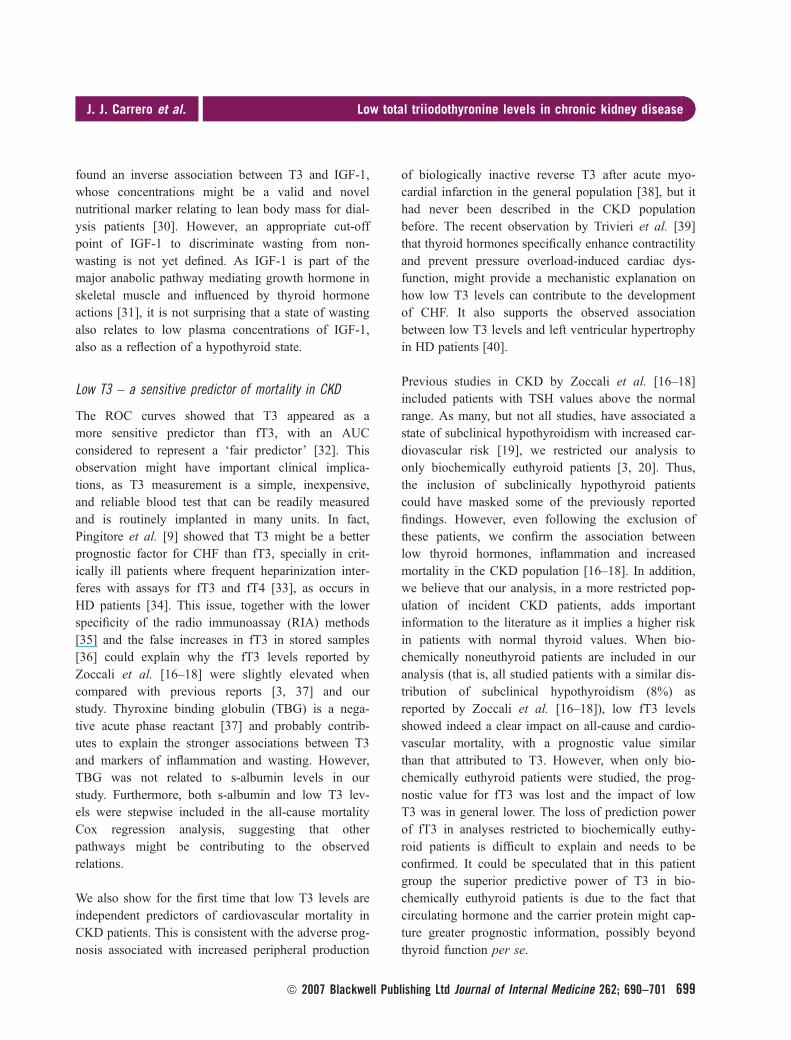
Table 5 Stepwise Cox regressionfor predictors of all-cause (A)and cardiovascular mortality (B)in 187 biochemically euthyroidpatientsa
Variable Hazard ratio v2 P-value
(A) All-cause mortality
Diabetes mellitus (yes versus no) 2.1 (1.4–4.5) 5.42 0.01
Cardiovascular disease (yes versus no) 2.5 (1.4–4.5) 9.73 0.001
T3 (below versus above 78.3 ng dL)1) 1.9 (1.1–3.4) 4.74 0.02
S-albumin (below versus above 3.3 g dL)1) 2.1 (1.1–4.0) 5.51 0.01
(B) CVD mortality
Diabetes mellitus (yes versus no) 3.9 (1.6–9.1) 10.1 0.001
T3 (below versus above 78.3 ng dL)1) 3.1 (1.4–7.1) 7.5 0.006
Cardiovascular disease (yes versus no) 5.1 (1.9–12.6) 11.7 0.0006
aBoth models also included the following variables that were stepwise excluded: gender (female versusmale), age (above versus below 55 years) and inflammation (hs-CRP above versus below 10 mg L)1).
J. J. Carrero et al. | Low total triiodothyronine levels in chronic kidney disease
698 ª 2007 Blackwell Publishing Ltd Journal of Internal Medicine 262; 690–701
found an inverse association between T3 and IGF-1,
whose concentrations might be a valid and novel
nutritional marker relating to lean body mass for dial-
ysis patients [30]. However, an appropriate cut-off
point of IGF-1 to discriminate wasting from non-
wasting is not yet defined. As IGF-1 is part of the
major anabolic pathway mediating growth hormone in
skeletal muscle and influenced by thyroid hormone
actions [31], it is not surprising that a state of wasting
also relates to low plasma concentrations of IGF-1,
also as a reflection of a hypothyroid state.
Low T3 – a sensitive predictor of mortality in CKD
The ROC curves showed that T3 appeared as a
more sensitive predictor than fT3, with an AUC
considered to represent a ‘fair predictor’ [32]. This
observation might have important clinical implica-
tions, as T3 measurement is a simple, inexpensive,
and reliable blood test that can be readily measured
and is routinely implanted in many units. In fact,
Pingitore et al. [9] showed that T3 might be a better
prognostic factor for CHF than fT3, specially in crit-
ically ill patients where frequent heparinization inter-
feres with assays for fT3 and fT4 [33], as occurs in
HD patients [34]. This issue, together with the lower
specificity of the radio immunoassay (RIA) methods
[35] and the false increases in fT3 in stored samples
[36] could explain why the fT3 levels reported by
Zoccali et al. [16–18] were slightly elevated when
compared with previous reports [3, 37] and our
study. Thyroxine binding globulin (TBG) is a nega-
tive acute phase reactant [37] and probably contrib-
utes to explain the stronger associations between T3
and markers of inflammation and wasting. However,
TBG was not related to s-albumin levels in our
study. Furthermore, both s-albumin and low T3 lev-
els were stepwise included in the all-cause mortality
Cox regression analysis, suggesting that other
pathways might be contributing to the observed
relations.
We also show for the first time that low T3 levels are
independent predictors of cardiovascular mortality in
CKD patients. This is consistent with the adverse prog-
nosis associated with increased peripheral production
of biologically inactive reverse T3 after acute myo-
cardial infarction in the general population [38], but it
had never been described in the CKD population
before. The recent observation by Trivieri et al. [39]that thyroid hormones specifically enhance contractility
and prevent pressure overload-induced cardiac dys-
function, might provide a mechanistic explanation on
how low T3 levels can contribute to the development
of CHF. It also supports the observed association
between low T3 levels and left ventricular hypertrophy
in HD patients [40].
Previous studies in CKD by Zoccali et al. [16–18]
included patients with TSH values above the normal
range. As many, but not all studies, have associated a
state of subclinical hypothyroidism with increased car-
diovascular risk [19], we restricted our analysis to
only biochemically euthyroid patients [3, 20]. Thus,
the inclusion of subclinically hypothyroid patients
could have masked some of the previously reported
findings. However, even following the exclusion of
these patients, we confirm the association between
low thyroid hormones, inflammation and increased
mortality in the CKD population [16–18]. In addition,
we believe that our analysis, in a more restricted pop-
ulation of incident CKD patients, adds important
information to the literature as it implies a higher risk
in patients with normal thyroid values. When bio-
chemically noneuthyroid patients are included in our
analysis (that is, all studied patients with a similar dis-
tribution of subclinical hypothyroidism (8%) as
reported by Zoccali et al. [16–18]), low fT3 levels
showed indeed a clear impact on all-cause and cardio-
vascular mortality, with a prognostic value similar
than that attributed to T3. However, when only bio-
chemically euthyroid patients were studied, the prog-
nostic value for fT3 was lost and the impact of low
T3 was in general lower. The loss of prediction power
of fT3 in analyses restricted to biochemically euthy-
roid patients is difficult to explain and needs to be
confirmed. It could be speculated that in this patient
group the superior predictive power of T3 in bio-
chemically euthyroid patients is due to the fact that
circulating hormone and the carrier protein might cap-
ture greater prognostic information, possibly beyond
thyroid function per se.
J. J. Carrero et al. | Low total triiodothyronine levels in chronic kidney disease
ª 2007 Blackwell Publishing Ltd Journal of Internal Medicine 262; 690–701 699
Limitations of the study and future perspectives
To properly address the implications of the present
study, several limitations should be taken into account.
First, the classification of CVD and cardiovascular
mortality included only patients with clinically signifi-
cant disease, which may limit and underestimate the
true prevalence of CVD [41]. Moreover, measurements
of the peripheral concentration of thyroid hormones do
not describe the intracellular thyroid hormone effect
on the different intracellular receptor sites. Clearly, we
need to further elucidate the role of thyroid dysregula-
tion in CKD. Although the use of thyroid hormone
therapy in nonthyroidal illnesses is still controversial
[42], interventional studies designed to reduce CVD in
renal disease is a tempting idea. In this regard, it
should be emphasized that a recent 8-week dietary
intervention with low protein diet in CKD patients
decreased levels of proinflammatory cytokines with
concomitant increases of both T3 and T4 [43].
Conclusion
About 8% of the clinically euthyroid incident CKD
five patients showed biochemical signs of subclinical
hypothyroidism [3, 20]. Furthermore, the present
study showed that T3 levels appear to be an indepen-
dent predictor of not only all-cause but also CVD
mortality in biochemically euthyroid patients, perhaps
due to its intimate association with inflammation.
Based on these results, the use of T3 in studies
assessing the relationship between thyroid dysfunction
and mortality risk is recommended.
Conflict of interest statement
BL is employed by Baxter Healthcare. SR and MRW
are employed by Karo Bio AB. The other authors
declare no conflict of interest.
Acknowledgements
The authors wish to express their appreciation to Ann
Dreiman-Lif, Annika Nilsson and Anki Emmoth (clini-
cal studies), Dr Bjorn Anderstam, Monica Eriksson and
Ann-Christin Bragfors-Helin (biochemical analysis).
This study was partially supported by unrestricted
grants from the Swedish Research Council, Heart-
Lung Foundation, MEC (EX2006-1670), Baxter
Healthcare, Karolinska Institutet Center for Gender-
based Research, the General Export Association of
Sweden and the ERA-EDTA. Analyses of thyroid
hormones were supported by Karo Bio AB, Sweden.
References
1 Chopra IJ. Nonthyroidal illness syndrome or euthyroid sick
syndrome? Endocr Pract 1996; 2: 45–52.
2 Kaptein EM. Thyroid hormone metabolism and thyroid diseases
in chronic renal failure. Endocr Rev 1996; 17: 45–63.
3 Lo JC, Chertow GM, Go AS, Hsu CY. Increased prevalence of
subclinical and clinical hypothyroidism in persons with chronic
kidney disease. Kidney Int 2005; 67: 1047–52.
4 Douyon L, Schteingart DE. Effect of obesity and starvation on
thyroid hormone, growth hormone, and cortisol secretion.
Endocrinol Metab Clin North Am 2002; 31: 173–89.
5 Manowitz NR, Mayor GH, Klepper MJ, DeGroot LJ. Subclini-
cal Hypothyroidism and Euthyroid Sick Syndrome in Patients
with Moderate-to-Severe Congestive Heart Failure. Am J Ther
1996; 3: 797–801.
6 Kozdag G, Ural D, Vural A et al. Relation between free triiodo-
thyronine ⁄ free thyroxine ratio, echocardiographic parameters
and mortality in dilated cardiomyopathy. Eur J Heart Fail
2005; 7: 113–8.
7 Iervasi G, Pingitore A, Landi P et al. Low-T3 syndrome: a
strong prognostic predictor of death in patients with heart
disease. Circulation 2003; 107: 708–13.
8 Hamilton MA, Stevenson LW, Luu M, Walden JA. Altered
thyroid hormone metabolism in advanced heart failure. J Am
Coll Cardiol 1990; 16: 91–5.
9 Pingitore A, Landi P, Taddei MC, Ripoli A, L’Abbate A, Iervasi
G. Triiodothyronine levels for risk stratification of patients with
chronic heart failure. Am J Med 2005; 118: 132–6.
10 Opie LH. Cellular basis for therapeutic choices in heart failure.
Circulation 2004; 110: 2559–61.
11 Ozawa M, Sato K, Han DC, Kawakami M, Tsushima T,
Shizume K. Effects of tumor necrosis factor-alpha ⁄ cachectin on
thyroid hormone metabolism in mice. Endocrinology 1988; 123:
1461–7.
12 Torpy DJ, Tsigos C, Lotsikas AJ, Defensor R, Chrousos GP,
Papanicolaou DA. Acute and delayed effects of a single-dose
injection of interleukin-6 on thyroid function in healthy humans.
Metabolism 1998; 47: 1289–93.
13 Bartalena L, Brogioni S, Grasso L, Velluzzi F, Martino E. Rela-
tionship of the increased serum interleukin-6 concentration to
changes of thyroid function in nonthyroidal illness. J Endocri-
nol Invest 1994; 17: 269–74.
14 Van der Poll T, Romijn JA, Wiersinga WM, Sauerwein HP.
Tumor necrosis factor: a putative mediator of the sick euthyroid
syndrome in man. J Clin Endocrinol Metab 1990; 71: 1567–72.
J. J. Carrero et al. | Low total triiodothyronine levels in chronic kidney disease
700 ª 2007 Blackwell Publishing Ltd Journal of Internal Medicine 262; 690–701
15 Stenvinkel P, Heimburger O, Paultre F et al. Strong association
between malnutrition, inflammation, and atherosclerosis in
chronic renal failure. Kidney Int 1999; 55: 1899–911.
16 Zoccali C, Tripepi G, Cutrupi S, Pizzini P, Mallamaci F. Low
triiodothyronine: a new facet of inflammation in end-stage renal
disease. J Am Soc Nephrol 2005; 16: 2789–95.
17 Zoccali C, Mallamaci F, Tripepi G, Cutrupi S, Pizzini P. Low
triiodothyronine and survival in end-stage renal disease. Kidney
Int 2006; 70: 523–8.
18 Enia G, Panuccio V, Cutrupi S et al. Subclinical hypothyroidism
is linked to micro-inflammation and predicts death in continuous
ambulatory peritoneal dialysis. Nephrol Dial Transplant 2007;
22: 538–44.
19 Surks MI, Ortiz E, Daniels GH et al. Subclinical thyroid dis-
ease: scientific review and guidelines for diagnosis and manage-
ment. JAMA 2004; 291: 228–38.
20 Hollowell JG, Staehling NW, Flanders WD et al. Serum TSH,
T(4), and thyroid antibodies in the United States population
(1988 to 1994): National Health and Nutrition Examination
Survey (NHANES III). J Clin Endocrinol Metab 2002; 87:
489–99.
21 Qureshi AR, Alvestrand A, Danielsson A et al. Factors predict-
ing malnutrition in hemodialysis patients: a cross-sectional
study. Kidney Int 1998; 53: 773–82.
22 Detsky AS, McLaughlin JR, Baker JP et al. What is subjective
global assessment of nutritional status? JPEN J Parenter
Enteral Nutr 1987; 11: 8–13.
23 Obuchowski NA. Receiver operating characteristic curves and
their use in radiology. Radiology 2003; 229: 3–8.
24 Boelen A, Platvoet-Ter Schiphorst MC, Wiersinga WM. Associ-
ation between serum interleukin-6 and serum 3,5,3¢-triiodothyro-nine in nonthyroidal illness. J Clin Endocrinol Metab 1993; 77:
1695–9.
25 Yu J, Koenig RJ. Regulation of hepatocyte thyroxine 5¢-deiodin-ase by T3 and nuclear receptor coactivators as a model of the
sick euthyroid syndrome. J Biol Chem 2000; 275: 38296–301.
26 Qureshi AR, Alvestrand A, Divino-Filho JC et al. Inflammation,
malnutrition, and cardiac disease as predictors of mortality in
hemodialysis patients. J Am Soc Nephrol 2002; 13(Suppl 1):
S28–36.
27 Avesani CM, Carrero JJ, Axelsson J, Qureshi AR, Lindholm B,
Stenvinkel P. Inflammation and wasting in chronic kidney
disease: Partners in crime. Kidney Int Suppl 2006; 70: S8–13.
28 Heimburger O, Qureshi AR, Blaner WS, Berglund L, Stenvin-
kel P. Hand-grip muscle strength, lean body mass, and plasma
proteins as markers of nutritional status in patients with chronic
renal failure close to start of dialysis therapy. Am J Kidney Dis
2000; 36: 1213–25.
29 Iglesias P, Bayon C, Mendez J, Gancedo PG, Grande C, Diez
JJ. Serum insulin-like growth factor type 1, insulin-like growth
factor-binding protein-1, and insulin-like growth factor-binding
protein-3 concentrations in patients with thyroid dysfunction.
Thyroid 2001; 11: 1043–8.
30 Axelsson J, Qureshi AR, Divino-Filho JC et al. Are insulin-like
growth factor and its binding proteins 1 and 3 clinically useful
as markers of malnutrition, sarcopenia and inflammation in
end-stage renal disease? Eur J Clin Nutr 2006; 60: 718–26.
31 Hussain MA, Schmitz O, Jorgensen JO et al. Insulin-like
growth factor I alters peripheral thyroid hormone metabolism in
humans: comparison with growth hormone. Eur J Endocrinol
1996; 134: 563–7.
32 Swets JA. Measuring the accuracy of diagnostic systems.
Science 1988; 240: 1285–93.
33 Peeters RP, Van der Geyten S, Wouters PJ et al. Tissue thyroid
hormone levels in critical illness. J Clin Endocrinol Metab
2005; 90: 6498–507.
34 Sonawane S, Kasbekar N, Berns JS. The safety of heparins in
end-stage renal disease. Semin Dial 2006; 19: 305–10.
35 Squire CR. Methods for the investigation of thyroid function.
Methods Mol Biol 2006; 324: 91–108.
36 Kilinc AS, Duzoylum A, Uncugil CF, Yucel D. Falsely
increased free triiodothyronine in sera stored in serum separator
tubes. Clin Chem 2002; 48: 2296–7.
37 Lim VS. Thyroid function in patients with chronic renal failure.
Am J Kidney Dis 2001; 38: S80–4.
38 Friberg L, Werner S, Eggertsen G, Ahnve S. Rapid down-regu-
lation of thyroid hormones in acute myocardial infarction: is it
cardioprotective in patients with angina? Arch Intern Med 2002;
162: 1388–94.
39 Trivieri MG, Oudit GY, Sah R et al. Cardiac-specific elevations
in thyroid hormone enhance contractility and prevent pressure
overload-induced cardiac dysfunction. Proc Natl Acad Sci U S A
2006; 103: 6043–8.
40 Zoccali C, Benedetto F, Mallamaci F et al. Low triiodothyro-
nine and cardiomyopathy in patients with end-stage renal
disease. J Hypertens 2006; 24: 2039–46.
41 Lauer MS, Blackstone EH, Young JB, Topol EJ. Cause of death
in clinical research: time for a reassessment? J Am Coll Cardiol
1999; 34: 618–20.
42 Bartalena L. The dilemma of non-thyroidal illness syndrome: to
treat or not to treat? J Endocrinol Invest 2003; 26: 1162.
43 Rosolowska-Huszcz D, Kozlowska L, Rydzewski A. Influence
of low protein diet on nonthyroidal illness syndrome in chronic
renal failure. Endocrine 2005; 27: 283–8.
Correspondence: Peter Stenvinkel, Division of Renal Medicine,
K56, Karolinska University Hospital at Huddinge, 141 86 Stock-
holm, Sweden.
(fax: +46 8 7114742; e-mail: [email protected]).
J. J. Carrero et al. | Low total triiodothyronine levels in chronic kidney disease
ª 2007 Blackwell Publishing Ltd Journal of Internal Medicine 262; 690–701 701
Top Related
Copyright © 2022 FDOKUMEN

