


Bahasa
Halaman
Hukum


ORIGINALARTICLE
Climate oscillations and speciesinteractions: large-scale congruence butregional differences in thephylogeographic structures of an alpineplant and its monophagous insect
Matthias Borer1�, Nils Arrigo2�, Sven Buerki3,4�, Russell E. Naisbit5 and
Nadir Alvarez6*
1Museum of Natural History Neuchatel, 2000
Neuchatel, Switzerland, 2Department of
Ecology and Evolutionary Biology, University
of Arizona, PO Box 210088, Tucson, AZ 85721,
USA, 3Molecular Systematics Section, Jodrell
Laboratory, Royal Botanic Gardens, Kew,
Richmond, Surrey TW9 3DS, UK,4Department of Biodiversity and Conservation,
Real Jardin Botanico, CSIC, 28014 Madrid,
Spain, 5Unit of Ecology and Evolution,
Department of Biology, University of Fribourg,
1700 Fribourg, Switzerland, 6Department of
Ecology and Evolution, University of Lausanne,
Biophore Building, 1015 Lausanne,
Switzerland
*Correspondence: Nadir Alvarez, Department of
Ecology and Evolution, University of Lausanne,
Biophore building, 1015 Lausanne, Switzerland.
E-mail: [email protected]�These authors contributed equally to this work
and are considered as joint first authors.
ABSTRACT
Aim To predict the fate of alpine interactions involving specialized species, using
a monophagous beetle and its host plant as a case study.
Location The Alps.
Methods We investigated genetic structuring of the herbivorous beetle Oreina
gloriosa and its specific host-plant Peucedanum ostruthium. We used genome
fingerprinting (in the insect and the plant) and sequence data (in the insect) to
compare the distribution of the main gene pools in the two associated species and
to estimate divergence time in the insect, a proxy for the temporal origin of the
interaction. We quantified the similarity in spatial genetic structures by
performing a Procrustes analysis, a tool from shape theory. Finally, we
simulated recolonization of an empty space analogous to the deglaciated Alps
just after ice retreat by two lineages from two species showing unbalanced
dependence, to examine how timing of the recolonization process, as well as
dispersal capacities of associated species, could explain the observed pattern.
Results Contrasting with expectations based on their asymmetrical dependence,
patterns in the beetle and plant were congruent at a large scale. Exceptions
occurred at a regional scale in areas of admixture, matching known suture zones
in Alpine plants. Simulations using a lattice-based model suggested these
empirical patterns arose during or soon after recolonization, long after the
estimated origin of the interaction c. 0.5 million years ago.
Main conclusions Species-specific interactions are scarce in alpine habitats
because glacial cycles have limited the opportunities for co-evolution. Their fate,
however, remains uncertain under climate change. Here we show that whereas
most dispersal routes are paralleled at a large scale, regional incongruence implies
that the destinies of the species might differ under changing climate. This may be
a consequence of the host dependence of the beetle, which locally limits the
establishment of dispersing insects.
Keywords
AFLP, congruence testing, Europe, Oreina gloriosa, Peucedanum ostruthium,
phylogeography, Procrustean analyses, Quaternary, random walk model, spatial
genetic structure.
Published in
which should be cited to refer to this work.
http
://do
c.re
ro.c
h

INTRODUCTION
Species-specific ecological interactions are scarce in alpine
habitats because the ebb and flow of Quaternary glaciations
has limited the time-scale over which long-term co-evolution-
ary processes occur due to recurrent local extinctions and
continually moving species ranges (Rasmann et al., in press;
see also Jablonski, 2008). Exceptions are found in several
biological groups, notably plants and phytophagous insects
(Dobler et al., 1996). However, the fate of such interactions
remains uncertain under scenarios of climate change, and
species involved in the interaction might be threatened unless
they have evolved strategies for co-dispersing in order to follow
their abiotic and biotic ecological clines (Alvarez et al., 2009).
A proxy for evaluating whether species demonstrating highly
specific interactions may be able to track climate change is to
examine their phylogeographic patterns, and thus the level of
spatial congruence in their dispersal routes and refugia
occupied during Quaternary climatic oscillations (Emerson &
Hewitt, 2005).
Pleistocene climatic oscillations strongly influenced the
genetic structure of organisms in the Palaearctic (Bennett,
1990; Hewitt, 1996). This has been best studied for the glacial
refugia and recolonization patterns of lowland temperate
species, and several paradigms have been identified (Taberlet
et al., 1998; Hewitt, 2000). For instance, Mediterranean insects
have been shown to occupy latitudes as high as the British
Isles during the Eemian interglacial (Coope, 1990). When the
climate cooled during the last glacial cycle, their ranges
retracted to the southern edge of the European continent and
they subsequently recolonized northern territories during the
current interglacial (Schmitt, 2007). In contrast, such effects
are less well documented in cold-adapted taxa such as those
with current alpine distributions. In the past, these species
would have been much more broadly distributed than they are
today, especially during the ice age maxima when some of
them occupied the extensive European steppe (see reviews in
Willis & van Andel, 2004; Stewart et al., 2010). Not all cold-
adapted species experienced similar changes in their genetic
structure; for instance, the genetic diversity of alpine plants
has been shown to depend on specific life-history traits (e.g.
Thiel-Egenter et al., 2009). From such evidence it can be
expected that climatic oscillations not only influenced the
evolutionary histories of single species, but also ecological
interactions (Jablonski & Sepkoski, 1996; Mouritsen & Poulin,
2002): from one glacial cycle to another, the species compo-
sition of alpine communities would have differed according to
the ability of populations to recolonize suitable habitats, but
also due to stochastic processes in population dynamics
(Jackson & Overpeck, 2000). Hence, the evolution of specific
interactions among European taxa might be rearranged at
each glacial cycle, with emerging co-evolutionary processes
being abruptly initiated or halted. To date, the few studies
investigating phylogeographic patterns in interacting species
have been focused on temperate organisms (Hayward &
Stone, 2006; Bruyndonckx et al., 2009; Espındola & Alvarez,
2011) and underlying processes have rarely been addressed. It
is thus timely to investigate this question in cold-adapted
organisms.
Here we focus on an antagonistic interaction involving an
Alpine leaf beetle, Oreina gloriosa (Fabricius) (Coleoptera:
Chrysomelidae), and its sole host plant, masterwort, Peuceda-
num ostruthium (L.) W. D. Koch (Apiaceae), using genetic data
and random walk models. The plant is trophically and
reproductively independent from the insect and is protected
against generalist herbivores by coumarins (Hadacek et al.,
1994), a chemical defence strategy that the specialist O. gloriosa
is able to circumvent. Hence two competing hypotheses are
proposed. On the one hand, the evolutionary histories of the
two interacting species might be incongruent, with coloniza-
tion of the landscape by the host plant occurring indepen-
dently of the spread of its dependent species (i.e. the insect
switches frequently among host plant lineages). This hypoth-
esis also includes escape situations between plant and insect
lineages, for instance when the former colonizes regions not
yet accessible to the latter. On the other hand, congruent
evolutionary histories could be anticipated if the dependent
organism is strongly constrained in its migration pathways.
Here, the two species disperse in parallel, with the insect
following the routes of the plant, resulting in congruent
phylogeographic scenarios within the range of the beetle:
although differences in the species’ life-history traits (e.g.
population sizes, generation times) might blur these simple
predictions (Alvarez et al., 2010), the results will inform us as
to the capacity of this interaction to be maintained in the face
of climatic oscillations.
Our aim was to test these hypotheses by first comparing
the spatial genetic structures of O. gloriosa and its host plant
P. ostruthium using amplified fragment length polymorphism
(AFLP) genome fingerprinting across the entire geographic
distribution of the beetle (i.e. the Alps). After evaluating the
respective spatial genetic structures of the two species we
assessed their level of congruence by using Procrustes analysis,
a statistical procedure newly introduced in phylogeography
(Larmuseau et al., 2010). This statistical tool, derived from
the shape theory family (Kendall, 1989), has been widely
applied in morphometrics (Klingenberg & McIntyre, 1998)
and ecology (Jackson, 1995). It allows the comparison of
several datasets describing the same set of points (here, the
sites where plants and insects were collected). As it addresses
both global and local congruence patterns among these
points, it is a suitable tool for comparing the phylogeography
of organisms with overlapping ranges. This tool has been
shown to be potentially more powerful and flexible than
Mantel tests (Peres-Neto & Jackson, 2001). This approach was
complemented by a molecular phylogeny based on sequencing
of three mitochondrial regions in O. gloriosa, dated using
average substitution rates in insect mitochondrial DNA
(mtDNA), in order to determine the time frame of divergence
in the co-evolutionary histories of the two species. Finally,
we investigated the role of life-history traits, such as
dispersal capacity, on the congruence of phylogeographic
http
://do
c.re
ro.c
h

patterns, by implementing a lattice-based random-walk
demographic model.
MATERIALS AND METHODS
Biological material and sampling
The host plant, P. ostruthium, is a widespread subalpine to
alpine, perennial herbaceous plant occurring in most European
mountains, including the Massif Central, the Pyrenees, Cor-
sica, the northern Apennines and the Alps (Aeschimann et al.,
2004). The beetle species, O. gloriosa, is found in isolated
populations, with a distribution restricted to the Alps (Kip-
penberg, 1994). Like most Oreina species it possesses warning
coloration and chemical defence; it is one of the few species
that are highly specialized on a single host plant (Dobler et al.,
1996), although it has not spread throughout the entire
distribution of its host.
Between 2004 and 2008, O. gloriosa specimens were collected
from 22 populations (one to three beetles per site) covering the
whole Alpine distribution and following the grid established
for the IntraBioDiv mapping of the Alpine and Carpathian
flora (see Appendix S1 in Supporting Information; see also
further details in Gugerli et al., 2008). Specimens were
preserved in pure ethanol and stored at )20 �C. Only males
were included in genetic analyses in order to allow accurate
species identification based on genitalia (Kippenberg, 1994).
Sampling was completed with two outgroup specimens
selected from the most closely related beetle species, Oreina
speciosa (Hsiao & Pasteels, 1999). Total genomic DNA was
extracted from four legs of each Oreina specimen using a
DNeasy Blood & Tissue Kit (Qiagen, Hilden, Germany) (see
Borer et al., 2010, for more details).
For the host plant P. ostruthium, phylogeographic patterns
were retrieved from data provided by the IntraBioDiv consor-
tium (Gugerli et al., 2008; Alvarez et al., 2009).
The AFLP dataset
AFLP analyses were performed following Vos et al. (1995).
For the beetle, three primer pairs were used (EcoRI-ACA/
MseI-AGC, EcoRI-ACA/MseI-ACG and EcoRI-ACA/MseI-
AAC) and reactions were conducted using 96-well plates in
which samples were randomly distributed. Fifteen individuals
were amplified twice in order to determine the overall
reproducibility rate. Peak Scanner 1.0 (Applied Biosystems,
Foster City, CA, USA) was used to detect and measure the
size of AFLP bands along electropherograms (Applied
Biosystems; using default peak detection parameters with
the addition of a light peak smoothing). The scoring (i.e.
recording presence/absence of AFLP bands for each speci-
men) was performed using RawGeno 2.0, an automated
scoring R package (Arrigo et al., 2009). The analysis was set
as follows: scoring range, 100–300 bp; minimum intensity, 50
relative fluorescence units (rfu); maximum bin width, 1 bp;
and removal of closely sized bins (5%). Finally, results from
the three primer pairs were pooled into binary matrices
before being further processed.
Bayesian clustering of AFLPs
The spatial genetic structure of the beetle was investigated
using model-based Bayesian clustering of AFLPs, as imple-
mented in structure 2.2 (Falush et al., 2007). Specimens
were assigned into a number of genetic groups defined by the
user (hereafter K), defined in such a way as to maximize the
within-group Hardy–Weinberg equilibrium. We used the
‘admixture’ model (i.e. default settings) and set the Markov
chain Monte Carlo (MCMC) with 100,000 generations for
burn-in and 400,000 generations for data acquisition. The
number of groups was screened for values ranging between one
and nine (five replicates per K-value). The selection of the
most likely K-value was achieved following Evanno et al.
(2005) and only the run obtaining the highest likelihood in the
optimal K-value was taken into account. Handling of struc-
ture results was achieved using SIMIL, an R script collection
(Alvarez et al., 2008). Specimens were assigned to a given
structure group when their assignment probability exceeded
0.5 (i.e. the majority-rule criterion).
For the spatial genetic structure of the plant, we used
structure results published in Alvarez et al. (2009). The
analysis used the no-admixture model and uncorrelated allele
frequencies. The MCMC chain was set with 200,000 burn-in
generations followed by 1,000,000 generations of data
acquisition.
Results for the plant and the insect were displayed on
geographical maps using ArcGIS 9.1 (ESRI, Redlands, CA,
USA), with populations being displayed as pie-charts showing
the number of individuals assigned to each structure group.
Finally, the global congruence between the phylogeographic
patterns of beetles and plants was assessed by applying Mantel
tests between distance matrices (Jaccard index, 100,000
permutations; Legendre & Lapointe, 2004) computed from
AFLP datasets of both species. Fine-scale congruence patterns
were investigated using a Procrustes rotation analysis (Kendall,
1989; as implemented in the ade-4 R package; Thioulouse
et al., 1996). The Procrustes rotation is primarily a shape
analysis for comparing two distinct datasets (here the struc-
ture assignment probabilities for the plant and the beetle,
averaged at the population level) describing the same objects
(here the sites where specimens were collected). The analysis
works as follows: (1) the beetle and plant datasets are reduced
to two-dimensional spaces, using principal components anal-
ysis and retaining the two most significant eigenaxes, (2) new
coordinates are computed for both datasets in such a way as to
optimize their global matching, by adjusting translational,
rotational and scaling components, and (3) because these
adjustments apply globally, one can measure by computing
Euclidean similarities between the adjusted datasets how
congruence is distributed spatially (i.e. at the level of each
plant and beetle population). To cross-check the results with
a non-model based approach, the complete Procrustes
http
://do
c.re
ro.c
h
procedure was repeated using the population differentiation
statistic (i.e. GST values computed from the AFLP datasets,
based on the Shannon diversity index) as a starting dataset,
instead of structure-based probability assignments. Both
approaches provided congruent patterns (correlation = 0.51,
P-value = 0.02; see Appendix S2) and only results obtained
with structure were mapped using ArcGIS 9.1.
Sequencing and alignment
Three mtDNA regions were amplified in beetles using
universal insect primers: partial 16S ribosomal RNA (hereafter
16S) (modLR-J-12887 with LR-N-13398; Simon et al., 1994);
cytochrome c oxidase subunit I (COI) (C1-J-1751 with C1-N-
2191; Simon et al., 1994); and cytochrome c oxidase subunit II
(COII) (modTL2-J-3037 with modC2-N-3661; Mardulyn
et al., 1997). Polymerase chain reaction amplifications were
performed using a standard protocol (see Borer et al., 2010).
Sequencing was carried out by Macrogen Inc. (Seoul, South
Korea) with both forward and reverse primers using an ABI
3730XL DNA Analyzer automated sequencer (Applied Biosys-
tems, Foster City, CA, USA). Sequences (HQ 646406–HQ
646551) were manually corrected using the software Chro-
masPro 1.34 (Technelysium Ltd, Helensvale, Qld, Australia).
The protein-coding nucleotide sequences of COI and COII
were checked for reading frame errors and termination codons
in mega4 (Tamura et al., 2007). Alignments were carried out
using ClustalW (Thompson et al., 1994) within the software
BioEdit 7.0.5.3 (Hall, 1999), followed by minor manual
correction.
Phylogenetic analyses and divergence time estimation
A partitioned Bayesian analysis was performed using beast
1.4.7 (Drummond & Rambaut, 2007) with the three mtDNA
regions represented as separate partitions (with specific rates of
substitution; see below). Best-fit models – HKY for 16S and
HKY + G for COI and COII, respectively – were estimated for
each partition using MrModeltest 2.3 (Nylander, 2004).
Three independent runs of 30 · 106 generations were per-
formed, sampling one tree every 1000 generations. For each
parameter, convergence of the independent runs was con-
firmed by the examination of their respective distributions in
Tracer 1.4 (Rambaut & Drummond, 2007). After removing a
burn-in period of 10 · 106 generations in each run, 95%
divergence time interval confidences were plotted on a
majority rule consensus tree (reconstructed using paup*
4.0b10; Swofford, 2003) using TreeAnnotator (Drummond
& Rambaut, 2007). The topology was checked using the
parsimony ratchet approach following Buerki et al. (2009).
Node support was determined by computing Bremer support
values as implemented in TreeRot 3 (Sorenson & Franzosa,
2007) and using paup* 4.0b10 with maxtrees = 1000 and
nreps = 10. Fossil records are not available to calibrate
estimates of Oreina divergence time, so our analysis relied on
gene-specific mtDNA substitution rates from diverse arthro-
pod taxa (recently reviewed in Borer et al., 2010). Average
pairwise divergence substitution rates were 0.61, 1.73 and
1.38% per million years for 16S, COI and COII, respectively.
Based on these values, a relaxed clock with log-normal branch
length distribution was performed following Borer et al.
(2010).
Random-walk modelling
We simulated plant and beetle populations in order to model
the evolution through time of phylogeographic patterns that
could be expected in this unbalanced interaction (i.e. the insect
alone is dependent on the plant) under a simple random
dispersal model. Simulations were performed under the R
environment (script available on request from the authors) on
a 25 cell · 25 cell grid, with each grid cell potentially shelter-
ing a population of 20 plants and 20 insects. Simulations were
initiated with an empty grid, with landscape colonization
starting from two refugium cells located at opposite edges of
the grid. Plants and insects shared the same refugia (starting
positions located at xrefugium1 = 0, yrefugium1 = 13 and xrefugium2
= 25, yrefugium2 = 13). Plants could spread to and survive in
any grid cell. In contrast, insects could establish only where
plants were already present.
Each generation of the simulation process included: (1) a
population growth phase, (2) a dispersal phase, and (3) an
extinction phase. The population growth phase increased the
number of individuals in each cell by 50% (i.e. one offspring
was added to the population for each pair of individuals
present in the current generation). The dispersal phase relied
on: (1) the number of dispersal events per cell, determined
using a binomial distribution (with migration probability M
being 5 or 10% for each individual in the cell; see below), (2)
the number of migrants per dispersal event, following a
Poisson distribution (with k = 2), and (3) the distance
reachable by each migrant individual (Poisson distribution,
kd = 1 or 2 cell units; see below). The direction of migration
was determined randomly. The distributions were set empir-
ically to produce either a slow or a rapid dispersal speed
(M = 5% and kd = 1 for slow dispersal; M = 10% and kd = 2
for rapid dispersal). Finally, the extinction phase removed
individuals from each cell, using a binomial distribution (with
a 5% probability of death for each individual).
Four scenarios were tested by combining the respective
dispersal speeds of plants and insects: ‘slow plant and slow
insect’, ‘slow plant and rapid insect’, ‘rapid plant and slow
insect’ and ‘rapid plant and rapid insect’. For each scenario, the
set-up timing was defined as the point at which 90% of all cells
were colonized by both the plant and the insect. The scenarios
differed in their set-up timing, as 124 ± 5 generations were
needed for the scenario ‘slow plant and slow insect’, 114 ± 6
for ‘slow plant and rapid insect’, 107 ± 6 for ‘rapid plant and
slow insect’ and 64 ± 2 for ‘rapid plant and rapid insect’.
Phylogeographic data were collected at the 25th and 100th
generations after the set-up timing (i.e. hereafter gen = 25 and
gen = 100, respectively).
http
://do
c.re
ro.c
h
All simulations were replicated 50 times to produce averaged
measures and the Procrustes rotation approach described
above was applied to assess congruence between plant and
insect phylogeographic patterns. Finally, results were displayed
as population growth curves and maps.
RESULTS
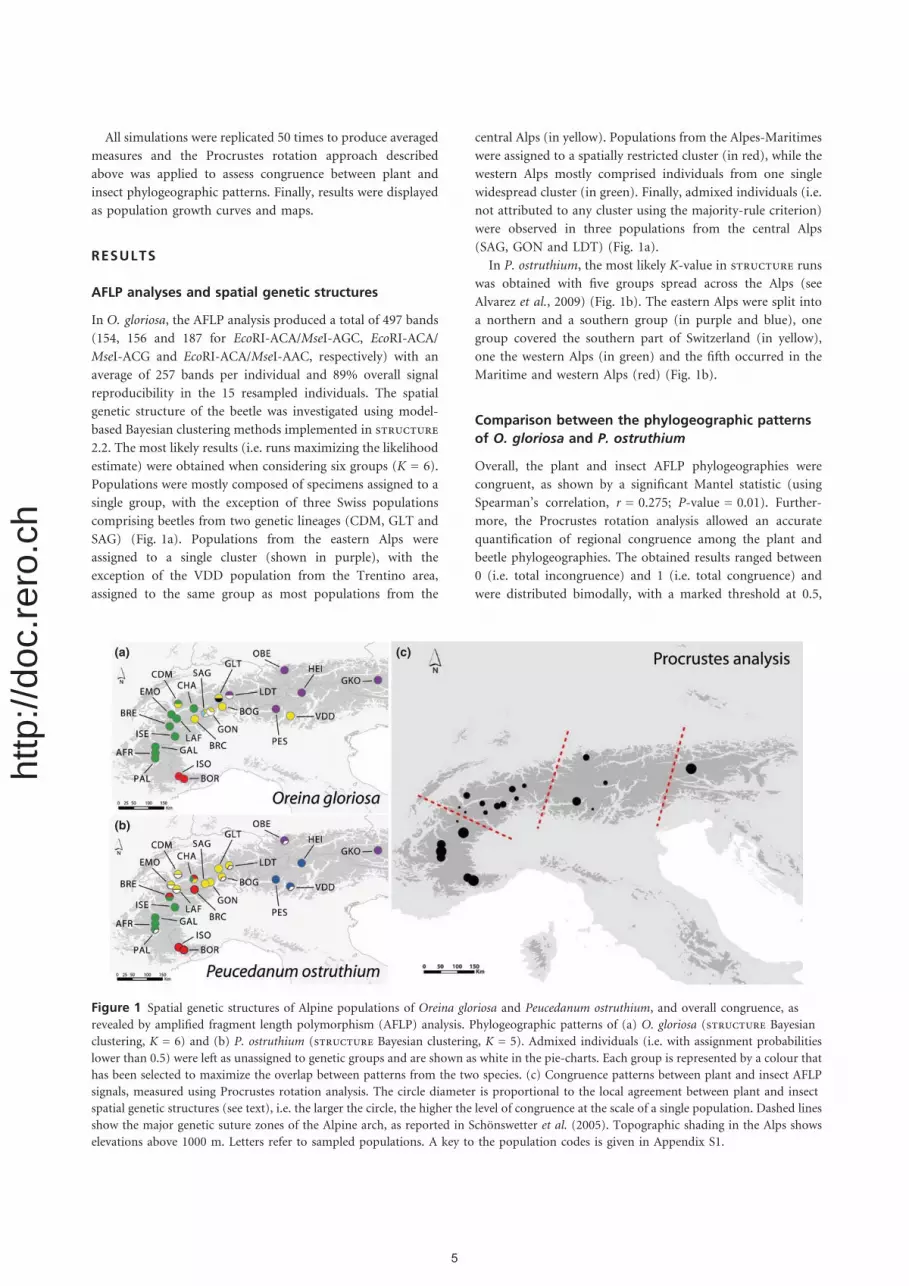
AFLP analyses and spatial genetic structures
In O. gloriosa, the AFLP analysis produced a total of 497 bands
(154, 156 and 187 for EcoRI-ACA/MseI-AGC, EcoRI-ACA/
MseI-ACG and EcoRI-ACA/MseI-AAC, respectively) with an
average of 257 bands per individual and 89% overall signal
reproducibility in the 15 resampled individuals. The spatial
genetic structure of the beetle was investigated using model-
based Bayesian clustering methods implemented in structure
2.2. The most likely results (i.e. runs maximizing the likelihood
estimate) were obtained when considering six groups (K = 6).
Populations were mostly composed of specimens assigned to a
single group, with the exception of three Swiss populations
comprising beetles from two genetic lineages (CDM, GLT and
SAG) (Fig. 1a). Populations from the eastern Alps were
assigned to a single cluster (shown in purple), with the
exception of the VDD population from the Trentino area,
assigned to the same group as most populations from the
central Alps (in yellow). Populations from the Alpes-Maritimes
were assigned to a spatially restricted cluster (in red), while the
western Alps mostly comprised individuals from one single
widespread cluster (in green). Finally, admixed individuals (i.e.
not attributed to any cluster using the majority-rule criterion)
were observed in three populations from the central Alps
(SAG, GON and LDT) (Fig. 1a).
In P. ostruthium, the most likely K-value in structure runs
was obtained with five groups spread across the Alps (see
Alvarez et al., 2009) (Fig. 1b). The eastern Alps were split into
a northern and a southern group (in purple and blue), one
group covered the southern part of Switzerland (in yellow),
one the western Alps (in green) and the fifth occurred in the
Maritime and western Alps (red) (Fig. 1b).
Comparison between the phylogeographic patterns
of O. gloriosa and P. ostruthium
Overall, the plant and insect AFLP phylogeographies were
congruent, as shown by a significant Mantel statistic (using
Spearman’s correlation, r = 0.275; P-value = 0.01). Further-
more, the Procrustes rotation analysis allowed an accurate
quantification of regional congruence among the plant and
beetle phylogeographies. The obtained results ranged between
0 (i.e. total incongruence) and 1 (i.e. total congruence) and
were distributed bimodally, with a marked threshold at 0.5,
(a) (c)
(b)
Figure 1 Spatial genetic structures of Alpine populations of Oreina gloriosa and Peucedanum ostruthium, and overall congruence, as
revealed by amplified fragment length polymorphism (AFLP) analysis. Phylogeographic patterns of (a) O. gloriosa (structure Bayesian
clustering, K = 6) and (b) P. ostruthium (structure Bayesian clustering, K = 5). Admixed individuals (i.e. with assignment probabilities
lower than 0.5) were left as unassigned to genetic groups and are shown as white in the pie-charts. Each group is represented by a colour that
has been selected to maximize the overlap between patterns from the two species. (c) Congruence patterns between plant and insect AFLP
signals, measured using Procrustes rotation analysis. The circle diameter is proportional to the local agreement between plant and insect
spatial genetic structures (see text), i.e. the larger the circle, the higher the level of congruence at the scale of a single population. Dashed lines
show the major genetic suture zones of the Alpine arch, as reported in Schonswetter et al. (2005). Topographic shading in the Alps shows
elevations above 1000 m. Letters refer to sampled populations. A key to the population codes is given in Appendix S1.
http
://do
c.re
ro.c
h

above which populations were considered as congruent for the
plant and the insect (Fig. 1c). Several discrepancies between
plant and beetle phylogeographies were revealed at the regional
scale (Fig. 1c), with Procrustes values < 0.5, in areas corres-
ponding to biogeographic suture zones and within-species
genetic break zones (Schonswetter et al., 2005; Thiel-Egenter
et al., 2011).
Phylogenetic reconstruction and divergence time
estimates
Total alignment length of the concatenated mtDNA dataset
was 1626 bp (with 529, 462 and 635 bp for 16S, COI and COII,
respectively). Among 50 variable characters in the combined
dataset, excluding the outgroup, 29 were potentially parsimony
informative (representing 3.1% of the total). Phylogenetic
reconstructions were performed using partitioned Bayesian
and parsimony ratchet analyses. Both approaches supported
the monophyly of O. gloriosa (Fig. 2; Appendix S3a). Within
the ingroup, the two phylogenetic analyses recovered three
well-supported clades with Bayesian posterior probabili-
ties > 0.9 and Bremer supports > 2 in the parsimony ratchet
analysis (Fig. 2a, clades I to III). Five specimens (995_BRC,
359_ISE, 406_BOR, 1132_GAL and 1133_GAL) were embed-
ded in a polytomy closely related to clades II and III. Because
the parsimony ratchet and Bayesian-based phylogenetic
hypotheses were highly congruent only the latter will be
discussed further (it has the benefit of also providing an
estimate of the timing of divergence between lineages).
Divergence time analysis estimated the origin of the three
main clades as occurring before the Last Glacial Maximum
(Fig. 2a), with a 95% confidence interval spanning the last
Figure 2 (a) Majority-rule consensus tree of the alpine leaf beetle Oreina gloriosa mitochondrial DNA (mtDNA) dataset with two outgroup
specimens of the closely related beetle species Oreina speciosa. The topology is computed from the Markov chain Monte Carlo stationary
distribution of the partitioned coalescent Bayesian divergence time analysis, with median values and 95% confidence intervals for nodal ages.
Values at the nodes are Bayesian posterior probabilities. The three main clades are indicated with vertical bars in black, grey and white. (b)
Spatial distribution of the 22 beetle populations showing their clustering in the three main clades defined in (a). Topographic shading in the
Alps shows elevations above 1000 m. Letters refer to sampled populations; see Appendix S1 for a key to the population codes. Population
BOR, which does not include any individual in one of the three resolved clades, is marked with a dotted circle.
http
://do
c.re
ro.c
h

0.5 million years (Myr). Clade I included specimens from the
eastern and central Alps and diverged c. 0.5 million years ago
(Ma), followed quickly by the radiation of clades II and III (i.e.
within 0.3 Myr, estimated as crown age for the corresponding
polytomy), containing specimens from the central Alps and
from the western and south-western Alps, respectively
(Fig. 2b).
The mtDNA and AFLP phylogenetic patterns were highly
congruent (see Appendix S3b): mtDNA clade I matched the
purple structure group at 77%, clade II matched the yellow
group at 83% and clade III matched the green group at 85%.
Other structure groups comprising fewer specimens also
matched with a given mtDNA clade: the light blue group with
clade I, the black group with clade II and the red group with
clade III.
Random-walk models
Simulations of dispersal in the plant and the beetle were
performed to provide insights into the evolution of phylo-
geographic patterns under a simple random dispersal model.
The simulations considered a lattice-based landscape where
each grid cell potentially sheltered a plant and an insect
population. Each population relied on a demographic model
including a growth phase, a dispersal phase and an extinction
phase. The simulations were initiated with an empty grid (i.e. a
proxy of post-glacial deglaciated areas), with landscape colo-
nization starting from two refugium cells located at opposite
edges of the grid. Plants could spread and survive in any grid
cell. In contrast, insects could establish only where plants were
already present. Finally, four scenarios combining either slow
or rapid dispersal abilities for the plant and the insect (Fig. 3)
were considered. All simulations followed a typical scheme,
starting with colonization of the landscape associated with
clear-cut phylogeographic patterns (e.g. Fig. 3a; shown 25
generations after 90% of the grid was colonized, i.e. gen = 25)
followed by a homogenization phase with phylogeographic
patterns vanishing through time (e.g. Fig. 3a; results after 100
generations, i.e. gen = 100). In three out of four scenarios
(Fig. 3a,b,d) Procrustes rotation analyses revealed that phy-
logeographic patterns of plants and beetles were globally
congruent in the initial period after complete colonization of
the landscape (i.e. at gen = 25). The three scenarios also
yielded suture zones in the middle of the grid, where lineages
expanding from different refugia met. These suture zones were
associated with low phylogeographic congruence between
plants and insects (as highlighted by black horizontal arrows
in Fig. 3a–d). Measurements made later during the homoge-
nization phase (i.e. gen = 100) showed suture zones that were
less clear and a decrease in phylogeographic congruence. The
fastest loss of congruence was observed in the third scenario
(Fig. 3c), when plants dispersed so rapidly that they were
largely homogenized before insects had colonized the complete
landscape. In contrast, the slowest loss of congruence was
observed in the first scenario (Fig. 3a), in which both plants
and insects colonized the landscape slowly.
DISCUSSION
Shared large-scale spatial genetic structures in
the beetle and its host plant
Our study focused on unravelling the evolutionary processes
taking place in a plant–insect interaction in which the plant
disperses freely while the insect is constrained by its depen-
dence on the host. Two outcomes were possible, considering
either congruent or incongruent phylogeographic patterns
between the plant and the insect. Our results clearly supported
the former hypothesis, as global and significant overlap in the
spatial genetic structures of both organisms was outlined by
AFLPs (Fig. 1) and gene sequencing of mtDNA (Fig. 2;
Appendix S3a, b). Phylogeographic structures, in contrast to
diversity or adaptive patterns, can usually be satisfactorily
detected using a limited number of specimens per population
(e.g. Thiel-Egenter et al., 2011). Thus, our inferences are
robust to the available sampling effort.
Divergence time estimates from mtDNA showed that the
differentiation of beetle lineages originated before the Last
Glacial Maximum (c. 18,000 years ago; COHMAP, 1998),
during the middle of the Quaternary. The high congruence
between mtDNA clades and AFLP clusters suggests that the
former provides a reliable proxy for estimating divergence time
among lineages. Assuming that the most recent common
ancestor of all beetle lineages was monophagous (the most
parsimonious expectation), our results suggest that the inter-
action between O. gloriosa and P. ostruthium has probably
spanned several glacial cycles. Our results might reflect the
specialized feeding behaviour of the beetle, which could have
constrained its dispersal, at least during the early phases of
landscape recolonization. This hypothesis is consistent with
classical studies showing a narrower geographic range for
herbivorous insects compared with that of their host plants
(Strong, 1979), a trend that is even stronger in monophagous
species (Quinn et al., 1998). Nevertheless, differences in
dispersal abilities between the two species [i.e. the beetle
shows few adaptations to dispersal (Kalberer et al., 2005) in
contrast to the plant, which is wind-dispersed (Landolt et al.,
2010)] should have decreased their global phylogeographic
congruence, as theoretically expected (e.g. Nieberding &
Olivieri, 2007; Alvarez et al., 2010). Other processes, such as
ongoing post-glacial recolonization, might thus be at work
here. As shown by our application of a random-walk model, a
pattern of phylogeographic congruence could be compatible
with differences in dispersal abilities shortly after the recolon-
ization process was completed (Fig. 3 and see below).
Discrepancies in phylogeographies at a regional scale
The high level of congruence recognized at a large spatial (and
evolutionary) scale in the genetic structures of the plant and
the beetle was not always maintained at a regional scale
(Fig. 1). This was notably the case in the western and central
Alps, with discrepancies corresponding to previously reported
http
://do
c.re
ro.c
h

phylogeographic suture zones (Fig. 1c; Schonswetter et al.,
2005; Thiel-Egenter et al., 2011). For instance, the northern
limits between the green, red and yellow clusters were not the
same for plants and beetles, and the central Swiss Alps were
dominated by the yellow group in both species but showed two
additional spatially restricted lineages in the beetle (blue and
black lineages; Fig 1a). In contrast to recent studies on host–
parasite comparative phylogeography, in which the history of a
parasite is considered as a proxy for that of the host (e.g.
Nieberding & Olivieri, 2007), the partial disconnection found
here at a regional scale shows that the dependent and
independent organisms could disperse using different path-
ways. It is therefore possible that different Alpine plant lineages
escaped from the beetles during the Quaternary, which is
consistent with the fact that P. ostruthium is present in other
European mountain ranges that are not inhabited by the beetle
(e.g. the Pyrenees, the Apennines and Corsica). Alternatively,
stochastic processes could have resulted in regional discrep-
ancies, as shown by our random-walk models (see below).
Processes beyond the observed spatial patterns
Using simulations, we showed that a random-walk recoloniza-
tion of the landscape could produce phylogeographic patterns
similar to those observed here (Fig. 3). Indeed, three scenarios
result in large-scale phylogeographic congruence between the
plant and the insect associated with regional discrepancies
distributed along suture zones, where lineages originating from
distinct refuges met: first, in recently colonized landscapes (i.e.
when little time was given for homogenization after recolon-
ization following the release of suitable habitats) with a ‘rapid
plant and rapid insect’ scenario; second, also in recently
Figure 3 Results from the random-walk models simulating dispersal in a plant and its monophagous insect (see text for more details). The
recolonization of an empty landscape (a 25 cell · 25 cell grid) was simulated for two lineages of plants (in red and blue, respectively) and
insects (in green and orange, respectively). Landscape recolonization started from ‘refugial’ cells at the left and right edges of the grid, with
individuals dispersing over about 200 generations (dispersal parameters were obtained from random distributions; see text). Plants could
establish in any grid cell while insects were restricted to cells where plants were already present. The number of plants and insects occupying the
grid was measured during the course of the colonization process (left panel: population growth curves with one colour per lineage). The spatial
distribution of plant and insect lineages (corresponding to phylogeographic patterns) were recorded at 25 and 100 generations after plants and
insects had colonized 90% of the grid (centre and right panels, at gen = 25 and gen = 100, respectively). The respective phylogeographic
patterns of plants and insects (25 cell · 25 cell grids of populations represented as tiny pie-charts, with colours corresponding to lineages) and
their congruence quantified by the Procrustes analysis (i.e. circles are proportional to the plant–insect congruence; arrows correspond to
suture zones) were displayed in lattices. Four scenarios were investigated by setting the respective dispersal speeds of plant and insects: (a) slow
plants and slow insects, (b) slow plants and rapid insects, (c) rapid plants and slow insects, and (d) rapid plants and rapid insects.
http
://do
c.re
ro.c
h
colonized landscapes, with a ‘slow plant and rapid insect’
scenario; third, with a ‘slow plant and slow insect’ scenario
irrespective of the timeframe. However, biological characteris-
tics indicate that the plant disperses well (Landolt et al., 2010),
whereas the beetle is a poorer disperser (Kalberer et al., 2005).
Low dispersal abilities of the latter were confirmed based on
genetic data in other Oreina species (Margraf et al., 2007;
Triponez et al., 2011). As a consequence, we considered the
‘rapid plant and slow insect’ scenario, taken very shortly after
recolonizationwas achieved (e.g. gen= 2; data not shown), as the
most realistic to explain our empirical results. Such a scenario
would also fit well with the sequential evolution theory proposed
by Jermy (1984), in which the insect progressively adapts to
phenotypic changes in the plant, the latter not being influenced
by the insect’s evolutionary history.
Inferences in a changing climate
While the two species showed parallels in dispersal pathways at
a large spatial scale, their respective fates under changing
environmental conditions might differ, as suggested by the
incongruent patterns in spatial genetic structures seen at
regional scales. Because the dependent beetle species must
spread independently from its host, this means that their
relationship – and therefore the survival of the dependent
species – is vulnerable: when dispersing into new areas, beetles
are dependent on suitable microclimatic conditions, but also
on a supplementary, unpredictable factor, i.e. finding a habitat
harbouring the host. Stochastic parameters thus strongly
reduce the rate of successful dispersal in the beetle, which
would require a longer time period to disperse effectively in the
pursuit of its ecological niche during climate shifts, such as the
one we are currently experiencing. This conclusion strongly
contrasts with the example of bruchid beetles: these species-
specific phytophagous insects are specialized on angiosperm
seeds and tend to disperse within the seed of their host
(Alvarez et al., 2005, 2006, 2007), therefore increasing the
chance of success of dispersal and establishment of new
populations on their specific host plant. Because the dispersal
of O. gloriosa does not closely follow the dispersal routes of its
host plant at a regional scale, the interaction between these two
organisms is potentially threatened during climatic oscillations
that put pressure on alpine habitats. To what extent past
abrupt Quaternary climate change events (Hewitt, 2000;
Mayewski et al., 2004) have been associated with local
extinctions, owing to co-evolutionary constraints, remains an
open question.
ACKNOWLEDGEMENTS
We are grateful to the members of the IntraBioDiv Consor-
tium (see Appendix S1 in Thiel-Egenter et al., 2011) for
collecting and performing AFLP on the plant samples used in
this study. The authors thank Felix Gugerli (Swiss Federal
Research Institute WSL, Birmensdorf, Switzerland), Conrad
Labandeira (Smithsonian Institution, Washington, DC, USA),
two anonymous referees, and the editor, Melodie McGeoch,
for useful comments on the manuscript. Matthias Borer thanks
Makiala Kisanga for an introduction to the AFLP laboratory
methods, and Ana Pinto, Franz Borer, Christoph Germann and
Yann Triponez for help in collecting beetles. This research is
part of the POMAPII project (Phylogeography of Mutualistic
versus Antagonistic Plant–Insect Interactions), granted to
Nadir Alvarez by the Swiss National Science Foundation
(SNSF; grant 3100A0-116778). Matthias Borer was funded by a
doctoral assistantship from the University of Neuchatel. Nadir
Alvarez and Nils Arrigo were funded by the SNSF (Ambizione
fellowship PZ00P3_126624 and prospective researcher fellow-
ship PBNEP-132747, respectively). Financial support to Sven
Buerki was provided by Marie-Curie Intra-European Fellow-
ship (CRADLE; no. 253866).
REFERENCES
Aeschimann, D., Lauber, K., Moser, D.M. & Theurillat, J.-P.
(2004) Flora Alpina. Haupt, Bern.
Alvarez, N., McKey, D., Hossaert-McKey, M., Born, C., Mer-
cier, L. & Benrey, B. (2005) Ancient and recent evolutionary
history of the bruchid beetle, Acanthoscelides obtectus Say, a
cosmopolitan pest of beans. Molecular Ecology, 14, 1015–
1024.
Alvarez, N., Romero Napoles, J., Anton, K.-W., Benrey, B. &
Hossaert-McKey, M. (2006) Phylogenetic relationships in
the Neotropical bruchid genus Acanthoscelides (Bruchinae,
Bruchidae, Coleoptera). Journal of Zoological Systematics and
Evolutionary Research, 44, 63–74.
Alvarez, N., Hossaert-McKey, M., Restoux, G., Delgado-Sali-
nas, A. & Benrey, B. (2007) Anthropogenic effects on pop-
ulation genetics of phytophagous insects associated with
domesticated plants. Evolution, 61, 2986–2996.
Alvarez, N., Arrigo, N. & IntraBioDiv Consortium (2008) SI-
MIL: an R (CRAN) scripts collection for computing genetic
structure similarities based on structure 2 outputs.
Molecular Ecology Resources, 8, 757–762.
Alvarez, N., Thiel-Egenter, C., Tribsch, A. et al. (2009) History
or ecology? Substrate type as a major driver of spatial genetic
structure in Alpine plants. Ecology Letters, 12, 632–640.
Alvarez, N., Kjellberg, F., McKey, D. & Hossaert-McKey, M.
(2010) Phylogeography and historical biogeography of
obligate specific mutualisms. The geography of host–parasite
interactions (ed. by S. Morand and B. Krasnov), pp. 31–39.
Oxford University Press, Oxford.
Arrigo, N., Tuszynski, J.W., Ehrich, D., Gerdes, T. & Alvarez,
N. (2009) Evaluating the impact of scoring parameters on
the structure of intra-specific genetic variation using Raw-
Geno, an R package for automating AFLP scoring. BMC
Bioinformatics, 10, 33.
Bennett, K.D. (1990) Milankovitch cycles and their effects on
species in ecological and evolutionary time. Paleobiology, 16,
11–21.
Borer, M., Alvarez, N., Buerki, S., Margraf, N., Rahier, M. &
Naisbit, R.E. (2010) The phylogeography of an alpine leaf
http
://do
c.re
ro.c
h

beetle: divergence within Oreina elongata spans the Qua-
ternary. Molecular Phylogenetics and Evolution, 57, 703–709.
Bruyndonckx, N., Dubey, S., Ruedi, M. & Christe, P. (2009)
Molecular cophylogenetic relationships between European
bats and their ectoparasitic mites (Acari, Spinturnicidae).
Molecular Phylogenetics and Evolution, 51, 227–237.
Buerki, S., Forest, F., Acevedo-Rodrıguez, P., Callmander,
M.W., Nylander, J.A.A., Harrington, M., Sanmartın, I.,
Kupfer, P. & Alvarez, N. (2009) Plastid and nuclear DNA
markers reveal intricate relationships at subfamilial and
tribal levels in the soapberry family (Sapindaceae).Molecular
Phylogenetics and Evolution, 51, 238–258.
COHMAP (1988) Climatic changes of the last 18,000 years:
observations and model simulations. Science, 241, 1043–
1052.
Coope, G.R. (1990) The invasion of northern Europe during
the Quaternary by Mediterranean species of Coleoptera.
Biological invasions in Europe and the Mediterranean Basin
(ed. by F. Di Castri, A.J. Hansen and M. Debussche), pp.
203–215. Kluwer, Dordrecht.
Dobler, S., Mardulyn, P., Pasteels, J.M. & Rowell-Rahier, M.
(1996) Host-plant switches and the evolution of chemical
defense and life history in the leaf beetle genus Oreina.
Evolution, 50, 2373–2386.
Drummond, A.J. & Rambaut, A. (2007) BEAST: Bayesian
evolutionary analysis by sampling trees. BMC Evolutionary
Biology, 7, 214–221.
Emerson, B.C. & Hewitt, G. (2005) Phylogeography. Current
Biology, 15, R367–R371.
Espındola, A. & Alvarez, N. (2011) Comparative phylogeo-
graphy in a specific and obligate pollination antagonism.
PLoS ONE, 6, e28662.
Evanno, G., Regnaut, S. & Goudet, J. (2005) Detecting the
number of clusters of individuals using the software
structure: a simulation study. Molecular Ecology, 14,
2611–2620.
Falush, D., Stephens, M. & Pritchard, J.K. (2007) Inference of
population structure using multilocus genotype data:
dominant markers and null alleles. Molecular Ecology Notes,
7, 574–578.
Gugerli, F., Englisch, T., Niklfeld, H., Tribsch, A., Mirek, Z.,
Ronikier, M., Zimmermann, N.E., Holderegger, R., Taberlet,
P. & IntraBioDiv Consortium (2008) Relationships among
levels of biodiversity and the relevance of intraspecific
diversity in conservation – a project synopsis. Perspectives in
Plant Ecology, Evolution and Systematics, 10, 259–281.
Hadacek, F., Muller, C., Werner, A., Greger, H. & Proksch, P.
(1994) Analysis, isolation and insecticidal activity of linear
furanocoumarins and other coumarin derivatives from
Peucedanum (Apiaceae: Apioideae). Journal of Chemical
Ecology, 20, 2035–2054.
Hall, T.A. (1999) BioEdit: a user-friendly biological sequence
alignment editor and analysis program for Windows 95/98/
NT. Nucleic Acids Symposium Series, 41, 95–98.
Hayward, A. & Stone, G.N. (2006) Comparative phylogeog-
raphy across two trophic levels: the oak gall wasp Andricus
kollari and its chalcid parasitoid Megastigmus stigmatizans.
Molecular Ecology, 15, 479–489.
Hewitt, G.M. (1996) Some genetic consequences of ice ages,
and their role in divergence and speciation. Biological Jour-
nal of the Linnean Society, 48, 247–276.
Hewitt, G.M. (2000) The genetic legacy of the Quaternary ice
ages. Science, 405, 907–913.
Hsiao, T.H. & Pasteels, J.M. (1999) Evolution of host-plant
affiliation and chemical defense in Chrysolina–Oreina leaf
beetles as revealed by mtDNA phylogenies. Advances in
Chrysomelidae biology, Vol. 1 (ed. by M.L. Cox), pp. 321–
342. Backhuys Publishers, Leiden.
Jablonski, D. (2008) Biotic interactions and macroevolution:
extensions and mismatches across scales and levels. Evolu-
tion, 62, 715–739.
Jablonski, D. & Sepkoski, J.J. (1996) Paleobiology, community
ecology, and scales of ecological pattern. Ecology, 77, 1367–
1378.
Jackson, D.A. (1995) PROTEST: a Procrustean randomization
test of community environment concordance. Ecoscience, 2,
297–303.
Jackson, S.T. & Overpeck, J.T. (2000) Responses of plant
populations and communities to environmental changes of
the late Quaternary. Paleobiology, 26, 194–220.
Jermy, T. (1984) Evolution of insect/host plant relationships.
The American Naturalist, 124, 609–630.
Kalberer, N.M., Turlings, T.C.J. & Rahier, M. (2005) An
alternative hibernation strategy involving sun-exposed
‘hotspots’, dispersal by flight, and host plant finding by
olfaction in an alpine leaf beetle. Entomologia Experimentalis
et Applicata, 114, 189–196.
Kendall, D.G. (1989) A survey of the statistical theory of shape.
Statistical Science, 4, 87–99.
Kippenberg, H. (1994) Familie Chrysomelidae. Die Kafer
Mitteleuropas, Vol. 3 (ed. by G.A. Lohse and W. Lucht), pp.
65–83. Goecke and Evers, Krefeld.
Klingenberg, C.P. & McIntyre, G.S. (1998) Geometric mor-
phometrics of developmental instability: analysing patterns
of fluctuating asymmetry with Procrustes methods. Evolu-
tion, 52, 1353–1375.
Landolt, E., Baumler, B., Erhardt, A., Hegg, O., Klotzli, F.,
Lammler, W., Nobis, M., Rudmann-Maurer, K., Schwe-
ingruber, F., Theurillat, J.-P., Urmi, E., Vust, M. &
Wohlgemuth, T. (2010) Flora Indicativa. Okologische Zei-
gerwerte und biologische Kennzeichen zur Flora der Schweiz
und der Alpen. Haupt, Bern.
Larmuseau, M., Raeymaekers, J., Hellemans, B., Van Houdt, J.
& Volckaert, F. (2010) Mito-nuclear discordance in the
degree of population differentiation in a marine goby.
Heredity, 105, 532–542.
Legendre, P. & Lapointe, F.J. (2004) Assessing the congruence
among distance matrices: single malt Scotch whiskies
revisited. Australian and New Zealand Journal of Statistics,
46, 615–629.
Mardulyn, P., Milinkovitch, M.C. & Pasteels, J.M. (1997)
Phylogenetic analyses of DNA and allozyme data suggest
http
://do
c.re
ro.c
h

that Gonioctena leaf beetles (Coleoptera; Chrysomelidae)
experienced convergent evolution in their history of host-
plant family shifts. Systematic Biology, 46, 722–747.
Margraf, N., Verdon, A., Rahier, M. & Naisbit, R.E. (2007)
Glacial survival and local adaptation in an alpine leaf beetle.
Molecular Ecology, 16, 2333–2343.
Mayewski, P.A., Rohling, E.E., Stager, J.C., Karlen, W., Maasch,
K.A., Meeker, L.D., Meyerson, E.A., Gasse, F., van Kreveld,
S., Holmgren, K., Lee-Thorp, J., Rosqvist, G., Rack, F.,
Staubwasser, M., Schneider, R.R. & Steig, E.J. (2004) Holo-
cene climate variability. Quaternary Research, 62, 243–255.
Mouritsen, K.N. & Poulin, R. (2002) Parasitism, climate
oscillations and the structure of natural communities. Oikos,
97, 462–468.
Nieberding, C. & Olivieri, I. (2007) Parasites: proxies for host
history and ecology? Trends in Ecology and Evolution, 22,
156–65.
Nylander, J.A.A. (2004) MrModeltest v2. Program distributed
by the author. Evolutionary Biology Centre, Uppsala Uni-
versity, Uppsala. Available at: http://www.abc.se/~nylander/
mrmodeltest2/mrmodeltest2.html.
Peres-Neto, P.R. & Jackson, D.A. (2001) How well do multi-
variate data sets match? The robustness and flexibility of a
Procrustean superimposition approach over the Mantel test.
Oecologia, 129, 169–178.
Quinn, R.M., Gaston, K.J. & Roy, D.B. (1998) Coincidence in
the distribution of butterflies and their food plants. Ecog-
raphy, 21, 279–288.
Rambaut, A. & Drummond, A.J. (2007) Tracer v1.5. Program
distributed by the authors. Institute of Evolutionary Biology,
University of Edinburgh, Edinburgh. Available at: http://
tree.bio.ed.ac.uk/software/tracer.
Rasmann, S., Alvarez, N. & Pellissier, L. (in press) The altitu-
dinal niche breadth hypothesis in plant–insect interaction.
Plant–insect interactions (ed. by C. Voelckel and G. Jander).
Annual Plant Reviews Series. Wiley-Blackwell Publishing,
Oxford.
Schmitt, T. (2007) Molecular biogeography of Europe: Qua-
ternary cycles and postglacial trends. Frontiers in Zoology, 4,
11.
Schonswetter, P., Stehlik, I.,Holderegger, R.&Tribsch,A. (2005)
Molecular evidence for glacial refugia of mountain plants
in the European Alps.Molecular Ecology, 14, 3547–3555.
Simon, C., Frati, F., Beckenbach, A., Crespi, B., Liu, H. &
Flook, P. (1994) Evolution, weighting, and phylogenetic
utility of mitochondrial gene-sequences and a compilation
of conserved polymerase chain reaction primers. Annals of
the Entomological Society of America, 87, 651–701.
Sorenson, M.D. & Franzosa, E.A. (2007) TreeRot. v3. Program
distributed by the authors. Department of Biology, Boston
University, Boston, MA. Available at: http://people.bu.edu/
msoren/TreeRot.html.
Stewart, J.R., Lister, A.M., Barnes, I. & Dalen, L. (2010) Refugia
revisited: individualistic responses of species in space and
time. Proceedings of the Royal Society B: Biological Sciences,
277, 661–671.
Strong, D. (1979) Biogeographic dynamics of insect-host plant
communities. Annual Review of Entomology, 24, 89–119.
Swofford, D.L. (2003) PAUP*. Phylogenetic analysis using
parsimony (and other methods), version 4.0b10. Sinauer
Associates, Sunderland, MA.
Taberlet, P., Fumagalli, L., Wust-Saucy, A.-G. & Cosson, J.F.
(1998) Comparative phylogeography and postglacial colo-
nization routes in Europe. Molecular Ecology, 7, 453–464.
Tamura, K., Dudley, J., Nei, M. & Kumar, S. (2007) MEGA4:
molecular evolutionary genetics analysis (MEGA) software
version 4.0. Molecular Biology and Evolution, 24, 1596–
1599.
Thiel-Egenter, C., Gugerli, F., Alvarez, N. et al. (2009) Effects
of life history traits on the genetic diversity of high-moun-
tain plants: a multi-species study across the Alps and the
Carpathians. Global Ecology and Biogeography, 18, 78–87.
Thiel-Egenter, C., Alvarez, N., Holderegger, R. et al. (2011)
Break zones in the distributions of alleles and species in
alpine plants. Journal of Biogeography, 38, 772–782.
Thioulouse, J., Chessel, D., Doledec, S. & Olivier, J.M. (1996)
ADE-4: a multivariate analysis and graphical display soft-
ware. Statistics and Computing, 7, 75–83.
Thompson, J.D., Higgins, D.G. & Gibson, T.J. (1994) CLUS-
TAL W: improving the sensitivity of progressive multiple
sequence alignment through sequence weighting, position-
specific gap penalties and weight matrix choice. Nucleic
Acids Research, 22, 4673–4680.
Triponez, Y., Buerki, S., Borer, M., Naisbit, R.E., Rahier, M. &
Alvarez, N. (2011) Discordances between phylogenetic and
morphological patterns in alpine leaf beetles attest to an
intricate biogeographic history of lineages in postglacial
Europe. Molecular Ecology, 20, 2442–2463.
Vos, P., Hogers, R., Bleeker, M., Reijans, M., Vandelee, T.,
Hornes, M., Frijters, A., Pot, J., Peleman, J., Kuiper, M. &
Zabeau, M. (1995) AFLP: a new technique for DNA fin-
gerprinting. Nucleic Acids Research, 23, 4407–4414.
Willis, K.J. & van Andel, T.H. (2004) Trees or no trees? The
environments of central and eastern Europe during the Last
Glaciation. Quaternary Science Reviews, 23, 2369–2387.
SUPPORTING INFORMATION
Additional Supporting Information may be found in the
online version of this article:
Appendix S1 Sampled populations of Oreina gloriosa and
Peucedanum ostruthium with their geographical coordinates
and the number of analysed individuals.
Appendix S2 Supplementary experimental procedures: cross-
check of the Procrustes results with a non-model based
approach.
Appendix S3 Supplementary results: (a) strict consensus tree
of the maximum parsimony analysis for the Oreina gloriosa
sequence dataset; (b) contingency table comparing the group-
ing of O. gloriosa individuals using AFLP and mitochondrial
DNA data.
http
://do
c.re
ro.c
h
Top Related
Copyright © 2022 FDOKUMEN

