


Bahasa
Halaman
Hukum


ORIGINAL PAPER
Characterization of Oxidative Stability of Fish Oil- and Plant
Oil-Enriched Skimmed Milk
Linda C. Saga • Vera Kristinova • Bente Kirkhus •
Charlotte Jacobsen • Josefine Skaret •
Kristian Hovde Liland • Elling-Olav Rukke
Received: 28 March 2012 / Revised: 12 September 2012 / Accepted: 17 September 2012� AOCS 2012
Abstract The objective of this research was to determine
the oxidative stability of fish oil blended with crude plant
oils rich in naturally occurring antioxidants, camelina oil
and oat oil, respectively, in bulk and after supplementation
of 1 wt% of oil blends to skimmed milk emulsions. Ability
of crude oat oil and camelina oil to protect fish oil in bulk
and as fish oil-enriched skimmed milk emulsions was
evaluated. Results of oxidative stability of bulk oils and
blends assessed by the Schaal oven weight gain test and by
the rancimat method showed significant increase in oxi-
dative stability when oat oil was added to fish oil in only 5
and 10 %, whereas no protective effect of camelina oil was
observed when evaluated by these methods. Moreover, fish
oil blended with oat oil conferred the lowest PV and lower
amounts of volatile compounds during the storage period
of 14 days at 4 �C. Surprisingly, skimmed milk supple-
mented with fish-oat oil blend gave the highest scores for
off-flavors in the sensory evaluation, demonstrating that
several methods, including sensory analysis, should be
combined to illustrate the complete picture of lipid oxi-
dation in emulsions.
Keywords Antioxidants � Emulsion � Fish oil �
Oxidation � PUFA � Plant oils
Introduction
Marine n-3 polyunsaturated fatty acids (PUFA) have
received increased attention during the last decade due to
potential health benefits in human nutrition [1, 2]. Fish oil
is the main dietary source of the long-chain (LC) n-3
PUFA, especially eicosapentaenoic acid (EPA C20:5) and
docosahexaenoic acid (DHA C22:6). However, intake of
marine foods is below the recommended level in many
countries [3]. Enrichment of commonly consumed foods
with LC n-3 PUFA is a way of increasing consumption of
these fatty acids in the diet.
Oil-in-water (O/W) emulsions are the basis of many
frequently consumed food products, such as mayonnaise and
salad dressings. A great deal of research has been focused on
oil-in-water emulsions, among other because of its inter-
esting properties as medium for the enrichment of oil with
beneficial fatty acid content. Due to the high degree of un-
saturation of the frequently added LC n-3 PUFA EPA and
DHA, triglycerides rich in these fatty acids are prone to
oxidation. Lipid oxidation can adversely affect the nutri-
tional value, shelf-life and sensory quality of foods. Oxi-
dative deterioration of lipids results in the formation of
primary oxidation products, lipid hydroperoxides, which are
L. C. Saga (&) � K. H. Liland � E.-O. RukkeDepartment of Chemistry, Biotechnology and Food Science,Norwegian University of Life Sciences, PO Box 5003,1432 Aas, Norwaye-mail: [email protected]
V. KristinovaDepartment of Biotechnology, Norwegian University of Scienceand Technology, 7491 Trondheim, Norway
V. KristinovaSINTEF Fisheries and Aquaculture Limited,PO Box 4762, Sluppen, 7465 Trondheim, Norway
B. Kirkhus � J. SkaretNofima AS, Norwegian Institute of Food, Fisheries andAquaculture Research, Osloveien 1, 1430 Aas, Norway
C. JacobsenDivision of Industrial Food Research, National Food Institute,Technical University of Denmark, Building 221, Søltofts Plads,2800 Kongens Lyngby, Denmark
123
J Am Oil Chem Soc
DOI 10.1007/s11746-012-2148-1
tasteless and odorless. When these primary oxidation
products are decomposed they form mixtures of volatile and
non-volatile secondary oxidation products [4]. In order to
get a complete picture of the oxidation process, the degree of
oxidation should be measured by more than one method,
includingmethods detecting both the primary and secondary
oxidation products [4].
In complex systems such as lipid containing emulsions,
a series of factors can affect the initiation and propagation
of oxidation [5, 6]. Processing conditions and physical and
chemical properties of the added ingredients are among
these factors [7]. Such ingredients may include marine oils,
antioxidants, water, emulsifiers, proteins and so forth. It has
been suggested that special emphasis should be on the use
of natural emulsifying and stabilizing compositions with
regards to food emulsion technologies [8].
Plant oils contain naturally occurring antioxidant com-
pounds, where the most abundant ones are tocopherols [9].
Camelina sativa also known as false flax is an oilseed crop
with high levels (30–40 %) of the essential a-linolenic acid
(C18:3 n-3), making it vulnerable to oxidation. However,
camelina oil has been found to be very resistant to oxidation
and rancidity partly due to a high content of c-tocopherol [10].
Oat oil is another plant oil with interesting properties. Among
which are its wide range of compounds with antioxidative
qualities, including naturally occurring tocopherols and to-
cotrienols [11]. Blending plant oils withmore unsaturated fish
oils has been claimed to exert a protective effect of fish oil in
bulk [12]. Eidhin and O’Beirne 2010 [13] showed that odor
scores of spreads produced with blends of fish oil and came-
lina oil improved compared to spreads producedwith only fish
oil. In addition, such blends would provide high levels of the
nutritionally important n-3 fatty acids ALA, EPA and DHA.
Industrial claims that oat bran oil blended with PUFA con-
taining oil, such as fish oil, can exert a protective effect when
added to cowmilk have been made (patent no Norge 325446,
‘‘Lipid composition and use hereof’’). In addition to the con-
tent of naturally occurring emulsifiers in the form of protein
material, cow’s milk is a widely consumed oil-in-water
emulsion, thus an interesting medium for enrichment of fish
oil rich in LC n-3 PUFA. The objective of this study was to
investigate the oxidative stability of fish oil blended with
crude plant oils high in PUFA and natural antioxidants,
camelina and oat oil, respectively, before and after addition to
an oil–water emulsion in the form of skimmed milk.
Materials and Methods
Materials
Refined food grade fish oil (blend of cod liver oil and
salmon oil) (FO) with added antioxidants (total amount less
than 2 % w/w stated by the supplier) was provided by
Borregaard Industries Ltd., division Denomega Pure
Health, Norway. Crude cold pressed camelina oil (CO) was
provided by Bioforsk Øst (Apelsvoll, Norway). After har-
vest, seeds were stored in a cold-storage chamber at 5 �C.
Crude oil was obtained by using a pilot press for small
samples (BT Bio Presse Type 50, BT biopresser aps,
Dybvad, Denmark).
Oil fractions were frozen at -40 �C immediately after
pressing. Crude food grade Oat Oil (OO), extracted with
ethanol was obtained from CreaNutrition (Swedish Oat
Fiber AB, Sweden). Skimmed milk powder was obtained
from TINE BA (Oslo, Norway) with a fat content of
\1.0 %.
Characterization of Oils
Initial peroxide value of the three oils was measured by the
AOCS Official method Cd8b-90 [14]. The fatty acid
composition of FO was provided by the manufacturer,
whereas the fatty acid compositions of CO and OO were
provided by Nofima (Aas, Norway). The contents of fatty
acids were measured as fatty acid methyl esters [15] using
gas chromatography (GC) [16] with flame ionization
detection (FID). Peaks were identified by means of external
standards. The concentration of the individual fatty acids
was expressed in % of total fatty acids. The tocopherol and
tocotrienol (only OO) profile of the oils was analyzed by
Eurofins Scientific (Moss, Norway), an accredited labora-
tory, and Nofima, by using normal phase high-performance
liquid chromatography (HPLC) based on a method
described by Panfili et al. [17].
Determination of Oxidative Stability of Oils
Blends of FO with CO or OO, as well as pure oils, were
tested for their oxidative stability by measuring the oil
stability index (OSI) according to AOCS official method
Cd 12b–92 [18]. The binary blend ratios were 90:10 and
95:5 for both FO:CO and FO:OO. Each binary ratio was
prepared as a well-mixed batch; the minor oil component
(i.e., plant oil) was weighed first, and the remaining was
filled up with fish oil to obtain the desired ratio. Samples
(5.00 ± 0.04 g) were placed in glass tubes, sealed with a
two-hole rubber stopper equipped with aeration and efflu-
ent tubes, and installed in the oxidative stability instrument
(Omnion Inc., Rockland, MA, USA). The probe measuring
the conductivity signal was connected to a computer which
processed the data and generated OSI curves and OSI times
automatically. All the samples were run at 70.0 ± 0.1 �C,
air pressure was set at 4.0–4.25 psi. A relatively low
temperature of 70 �C compared to the temperature of
110 �C described in the AOCS official method was chosen
J Am Oil Chem Soc
123
due to the high susceptibility of FO to oxidation. The air
pressure was reduced from the one prescribed in the AOCS
official method (5.5 psi), due to extensive foaming of OO
under the flow of oxygen, to prevent contamination of the
conductivity measurement tube containing deionized water
and probe by the oily foam. The determinations were
carried out in six replicates.
The same blends as for the OSI test were used for the
Schaal oven weight gain test. Oil samples (5.00 ± 0.01 g)
were weighed into open glass petri-dishes (inner diameter
7.0 cm, height 1.2 cm) and placed in a laboratory drying
oven (TS 8136, Termaks AS, Bergen, Norway) at
70 ± 1 �C in the dark with no air circulation. The dishes
were taken out of the oven for weighing every 8 h during
the first 21 days and then twice or once a day, cooled to
ambient temperature, reweighed and returned to the oven.
The time required to reach a 0.5 % weight gain was cal-
culated and taken as an index of stability. All of the sample
batches were analyzed in triplicate.
Preparation of Emulsions
Skimmed milk powder (100 g/l) was mixed with water
(20 �C) using an Ultra Turrax Super Dispax SD 45/2 (IKA-
Werke GmbH and Co. KG, Staufen, Germany). The
resulting milk (3 L) was pasteurized by heating to 72 �C
within 3 min, holding for 15 s and then cooled to room
temperature. Three different batches of emulsions were
then prepared as described in Table 1; FO:CO and FO:OO
were mixed together in ratio 90:10 and the oil blend
(1 wt%) were then added to the skimmed milk. For pure
FO, 1 wt% was added to the skimmed milk.
The samples were subsequently homogenized (18 MPa)
in a two-valve Rannie homogenizer (Model LAB 4580/71,
Copenhagen, Denmark) under cooling conditions (7–9 �C).
The pH of the emulsions was 6.7. The three separate bat-
ches of samples were stored in closed Pyrex bottles (50 mL
for PV and HS-GC/MS analysis, 1 L for sensory analysis)
and subjected to storage at 4 �C in the dark, and following
analysis. Samples for PV and volatile analysis were taken
at day 0, 5, 8 and 14, immediately flushed with nitrogen
(quantity 99.9, AGA AS, Oslo, Norway), and stored at
-25 �C. Samples were thawed just before analysis.
Sensory evaluation of the emulsions was carried out after 0,
5 and 8 days of storage.
Analysis of Primary Oxidation Products
Lipids were extracted from the emulsions by chloro-
form:methanol (1:1 w/w) [19], using a reduced amount of
solvent [20]. Extracts were evaporated to dryness under N2.
PV were measured directly in the oil extracted from the
milk emulsion by colorimetric ferric-thiocyanate method
[21]. Each of the three sample batches were analyzed in
duplicate.
Analysis of Volatile Secondary Oxidation Products
Volatiles were trapped in Tenax tubes (Perkin Elmer,
Norwalk, CN, USA) by purging 4 g of the milk emulsions
with N2 (150 ml/min) for 30 min at 45 �C. 4-methyl-1-
pentanol in rapeseed oil was used as internal standard. An
automatic thermal desorber (ATD-400, Perkin Elmer,
Norwalk, CN) was used to desorb (200 �C) the volatiles,
and subsequently they were cryofocused on a Tenax GR
cold trap. Separation of the volatile compounds was
achieved by gas chromatography (HP 5890 IIA, Hewlett
Packard, Palo Alto, CA, USA) as described by Timm-
Heinrich et. al. (2003) [22]. The volatiles were analyzed by
mass spectrometry (HP 5972 mass-selective detector) and
identified by MS library searches (Wiley138 K, John
Wiley and Sons, Hewlett–Packard) and by authentic
external standards. The individual compounds were quan-
tified through calibration curves. The formation of nine
volatiles 1-penten-3-one, 1-penten-3-ol, (E)-2-pentenal,
2-penten-1-ol, hexanal, (E)-2-hexenal, 2,4-heptadienal,
(E,E)-2,4-heptadienal and (E,Z)-2,6-nonadienal, responsi-
ble for off-flavors [23, 24], was followed for 14 days of
storage at 4 �C. All of the three sample batches were
analyzed in triplicate.
Sensory Evaluation
To describe the objective perception of the various emul-
sions, a trained panel performed a quality descriptive
analysis ISO 6564:19865(E) and ISO 13299:2003(E) of the
samples. The panel consisted of 12 subjects employed
exclusively to work as sensory assessors at Nofima (As,
Norway). Each of the 12 members take part in the sensory
analyses conducted at Nofima 12 h per week and has
between 3 and 25 years of experience using descriptive
analysis on various kinds of food and beverages including
milk. The panelists have been selected and trained
according to recommendations in ISO 8586-1:1993(E).
Table 1 Experimental design over the addition of oils for preparationof enriched emulsions
Sample name Addition of oil to milk (wt%)
FO CO OO
FO 1.0 – –
FO ? CO 0.9 0.1 –
FO ? OO 0.9 – 0.1
FO fish oil, FO ? CO fish oil and camelina oil mixture, FO ? OO
Fish oil and oat oil mixture
J Am Oil Chem Soc
123
Prior to the assessments, the panel went through a
training session to select relevant sensory attributes. The
session lasted for 1 h and included some of the actual
samples from the project. The assessors developed a list of
attributes for the milk samples and agreed on a consensus
list of attributes for the profiling and on the definition of
each attribute. Two samples were assessed in a training
session for the purpose to agree on the variation in attribute
intensity and this session lasted for another hour. The
descriptors used for odor and flavor assessment were fishy,
metallic, stearin/paraffin and paint. The coded samples
(50 ml) were served in blind trials at 0, 5 and 8 days of
storage and randomized according to sample, assessor and
replicate. The panelists evaluated the samples in duplicate,
during two sessions. Emulsions were evaluated on a con-
tinuous intensity scale ranging from 1 to 9, where 9 is the
maximum intensity. The sensory laboratory has been
designed according to guidelines in ISO 8589:1988(E) with
separate booths. Data were collected using Eye Question,
v. 3.8.6 (Logic 8, Nederland).
Statistical Analysis
Data were evaluated by one-way analysis of variance and
Tukey’s test using Minitab Statistical software (Addison-
Wesley, Reading, MS, USA). Differences were considered
to be significant at p\ 0.05. Sensory descriptions was
plotted in R version 2.14.1, which is a free software
environment maintained by the R Development Core Team
(http://www.r-project.org/).
Results and Discussion
Properties of Oils
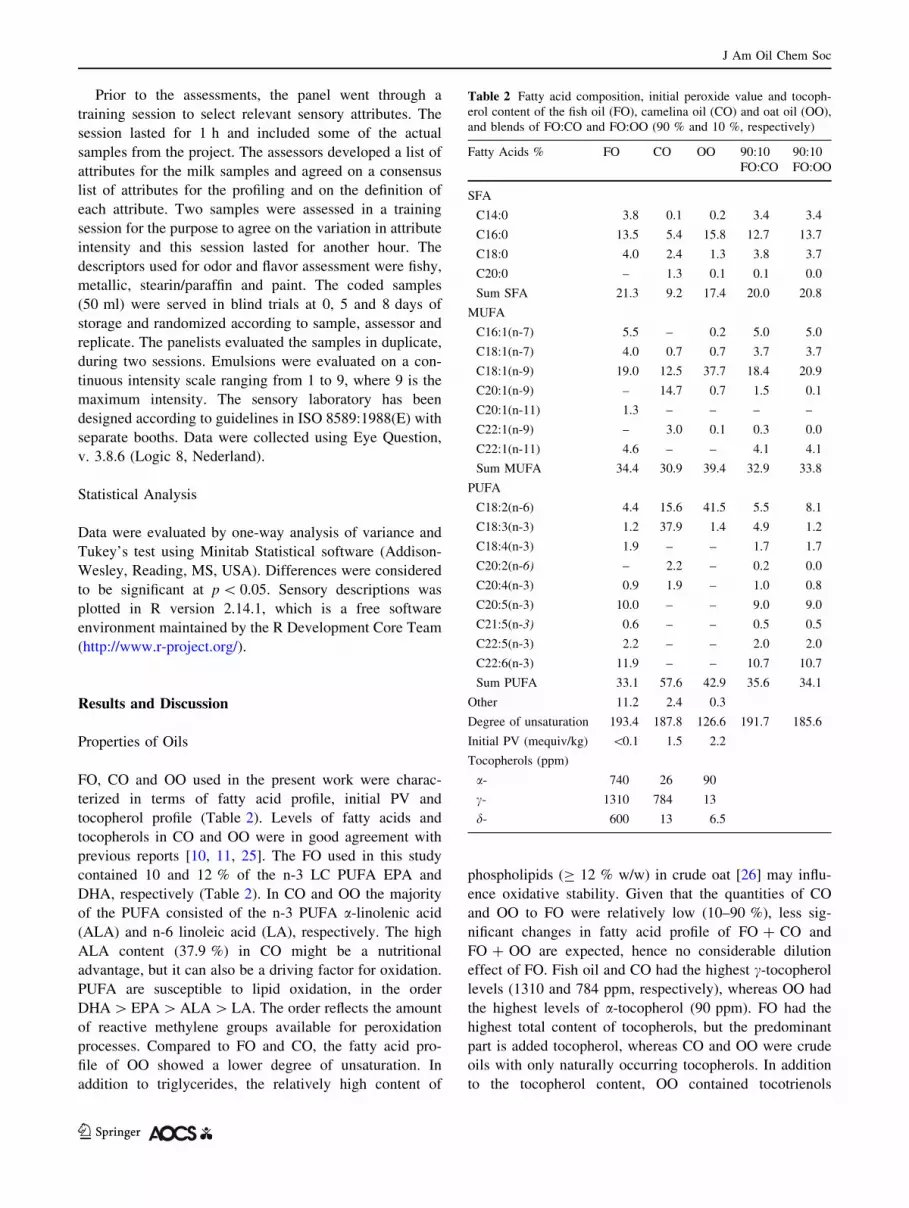
FO, CO and OO used in the present work were charac-
terized in terms of fatty acid profile, initial PV and
tocopherol profile (Table 2). Levels of fatty acids and
tocopherols in CO and OO were in good agreement with
previous reports [10, 11, 25]. The FO used in this study
contained 10 and 12 % of the n-3 LC PUFA EPA and
DHA, respectively (Table 2). In CO and OO the majority
of the PUFA consisted of the n-3 PUFA a-linolenic acid
(ALA) and n-6 linoleic acid (LA), respectively. The high
ALA content (37.9 %) in CO might be a nutritional
advantage, but it can also be a driving factor for oxidation.
PUFA are susceptible to lipid oxidation, in the order
DHA[EPA[ALA[LA. The order reflects the amount
of reactive methylene groups available for peroxidation
processes. Compared to FO and CO, the fatty acid pro-
file of OO showed a lower degree of unsaturation. In
addition to triglycerides, the relatively high content of
phospholipids (C 12 % w/w) in crude oat [26] may influ-
ence oxidative stability. Given that the quantities of CO
and OO to FO were relatively low (10–90 %), less sig-
nificant changes in fatty acid profile of FO ? CO and
FO ? OO are expected, hence no considerable dilution
effect of FO. Fish oil and CO had the highest c-tocopherol
levels (1310 and 784 ppm, respectively), whereas OO had
the highest levels of a-tocopherol (90 ppm). FO had the
highest total content of tocopherols, but the predominant
part is added tocopherol, whereas CO and OO were crude
oils with only naturally occurring tocopherols. In addition
to the tocopherol content, OO contained tocotrienols
Table 2 Fatty acid composition, initial peroxide value and tocoph-erol content of the fish oil (FO), camelina oil (CO) and oat oil (OO),and blends of FO:CO and FO:OO (90 % and 10 %, respectively)
Fatty Acids % FO CO OO 90:10FO:CO
90:10FO:OO
SFA
C14:0 3.8 0.1 0.2 3.4 3.4
C16:0 13.5 5.4 15.8 12.7 13.7
C18:0 4.0 2.4 1.3 3.8 3.7
C20:0 – 1.3 0.1 0.1 0.0
Sum SFA 21.3 9.2 17.4 20.0 20.8
MUFA
C16:1(n-7) 5.5 – 0.2 5.0 5.0
C18:1(n-7) 4.0 0.7 0.7 3.7 3.7
C18:1(n-9) 19.0 12.5 37.7 18.4 20.9
C20:1(n-9) – 14.7 0.7 1.5 0.1
C20:1(n-11) 1.3 – – – –
C22:1(n-9) – 3.0 0.1 0.3 0.0
C22:1(n-11) 4.6 – – 4.1 4.1
Sum MUFA 34.4 30.9 39.4 32.9 33.8
PUFA
C18:2(n-6) 4.4 15.6 41.5 5.5 8.1
C18:3(n-3) 1.2 37.9 1.4 4.9 1.2
C18:4(n-3) 1.9 – – 1.7 1.7
C20:2(n-6) – 2.2 – 0.2 0.0
C20:4(n-3) 0.9 1.9 – 1.0 0.8
C20:5(n-3) 10.0 – – 9.0 9.0
C21:5(n-3) 0.6 – – 0.5 0.5
C22:5(n-3) 2.2 – – 2.0 2.0
C22:6(n-3) 11.9 – – 10.7 10.7
Sum PUFA 33.1 57.6 42.9 35.6 34.1
Other 11.2 2.4 0.3
Degree of unsaturation 193.4 187.8 126.6 191.7 185.6
Initial PV (mequiv/kg) \0.1 1.5 2.2
Tocopherols (ppm)
a- 740 26 90
c- 1310 784 13
d- 600 13 6.5
J Am Oil Chem Soc
123

(193 ppm a-tocotrienol and 11 ppm b-tocotrienol). The
oils may also contain other antioxidants not analyzed in
this study. In particular, phenolic compounds in CO and
OO may contribute to protection against oxidation [10].
Tocopherols and tocotrienols act by donating their phenolic
hydrogens to lipid free radicals, and have donating power
in the order a[b[ c[ d [27]. Relative antioxidant
activity of tocopherols depends on factors such as the
concentration, lipid composition, physical state (bulk or
emulsion) and temperature.
All the oils had low initial peroxide values. Peroxides,
primary oxidation products in CO were higher by only
0.7 mequiv/kg than in OO, indicating that the two oils had
similar levels of oxidation. The initial PV in the FO was
very low (\0.1 mequiv/kg). In fish oil enriched emulsion, a
low initial peroxide value was shown to facilitate the
control of oxidative deterioration [24]. The three pure oils
showed no significant increase (p[ 0.05) in the peroxide
value during storage at 4 �C for 21 days (data not shown).
Results of Stability Tests of Selected Oil Blends
The oxidative stability of oils and their blends was evalu-
ated based on the measurement of the induction period
(OSI) and the Schaal oven test at 70 �C (Table 3). The
stability tests gave consistent results, indicating that addi-
tion of OO to the blends gave the best protection against
oxidation (Table 3). Blends of FO ? OO containing 5 and
10 % OO were roughly two-times as oxidative stable as
blends of FO ? CO with the same proportions of CO.
Increasing the proportions of OO in the FO ? OO blend
increased the stability significantly, while increasing the
proportions of CO in the FO ? CO blends had only minor
effects on the oxidative stability. The fatty acid composi-
tion and unsaturation indices of the oils used in this study
suggest that FO would be the least stable, followed by CO,
and then OO. Despite the high ALA content (*40 %) in
CO, the induction period for CO was double and signifi-
cantly different to that observed for FO as seen in Table 3,
which can be explained by differences in presence of minor
compounds such as phenolic compounds and tocopherols
as well as fatty acid profile [13].
The present results indicate that OO is very resistant to
oxidation. However, the OSI test conditions did not allow
determination of OSI values for pure OO. This was due to
extensive foaming of the oil in the glass tubes under the air
flow which inevitably contaminated the measurement
probe. The value is therefore denoted as Nd (not deter-
mined). Content of polar lipids and free fatty acids may
have caused the foaming [28]. Pure OO showed no increase
in weight after more than 50 days in the oven at 70 �C, so
the weight observation was terminated. Addition of only
5 % OO gave increased protection, indicating that the
presence of tocopherols, tocotrienols, phenolics and other
compounds in OO probably contributed to the dramatically
prolonged induction period, given that no dilution effect
can be expected.
Naturally, FO with its high unsaturation conferred the
lowest OSI time (*57 h) and also reached 0.5 % weight
gain at the earliest time point. The measured induction
periods of FO using the two methods were relatively high
compared with rancimat measurements of anchovy, hake
liver and sardine oils under the same temperature condi-
tions [29]. The relatively high stability of FO can be
attributed to the high total tocopherol content of 2660 ppm,
and the presence of ascorbyl palmitate and other antioxi-
dants (not shown), which may behave synergistically in
reinforcing the antioxidant activity of tocopherols.
Oxidative Stability of Enriched Emulsions
Oil-in-water emulsions, enriched with LC n-3 PUFA, were
prepared with 1 wt% FO, and 90:10 FO:CO and FO:OO
blends (Table 1). Stability tests indicated that a ratio of 95:5
was sufficient to increase oxidative stability in blends with
OO in bulk, whereas ratios higher than 90:10were needed for
blends with CO. However, preliminary experiments showed
that inclusion of higher levels of the plant oils (more than
10 %) resulted in a more characteristic taste and smell and
also poorer physical emulsion stability was observed, hence
a 90:10 ratio of fish oil to plant oil was chosen for oxidative
stability tests in bulk and in the skimmed milk emulsions.
Skimmed milk was chosen in this study due to its low fat
content (\0.1 %) which causes less interference with the
measurements and also due to the presence of naturally
occurring emulsifier’s form of protein material.
Table 3 Oxidative Stability Index (OSI) and weight gain values ofoils and binary mixtures of oils
% of addedoil
OSI values (h)at 70 �C
0.5 % weight increase(h) at 70 �C
FO
100 56.9 ± 2.2 51.1 ± 0.4
FO ± CO
0 ? 100 139.5 ± 2.5x 123.6 ± 2.5x
90 ? 10 58.1 ± 2.5y 51.8 ± 1.8y
95 ? 5 54.1 ± 3.3y 53.1 ± 0.1y
FO ± OO
0 ? 100 Nd Nd
90 ? 10 159.4 ± 1.7x 162.6 ± 1.1x
95 ? 5 113.3 ± 2.3y 117.9 ± 0.9y
The values are expressed in hours ± standard deviation (n = 6 forOSI and n = 3 for the weight gain method)x–y indicates significant differences (p\ 0.05) within oil types in thecolumn. Nd not determined
J Am Oil Chem Soc
123

Formation of Primary Oxidation Products
Peroxide values are shown in Table 4. Peroxide values of
the oil extracted from the emulsions at day 0 were higher
than the initial PV of the oils, probably due to the fact that
values obtained from the ferric thiocyanate method are
generally higher than values obtained with the iodometric
method [4]. In addition, it may also be presumed that the
oxidation process was initiated as early as during the pro-
cessing of the emulsions. Since heat is known to increase
the oxidation rate of lipids, the temperature should in
general be kept as low as possible during processing and
storage [4]. With this in mind, the emulsions in this study
were homogenized at a low temperature to avoid the effect
of temperature on the oxidation rate. Nevertheless, the
emulsions reached high peroxide values during storage.
The FO emulsion increased more than 40-fold in peroxide
value after 5 days of storage. During further storage, the
PV in FO enriched emulsion increased significantly. In
contrast, the FO ? OO emulsion showed no significant
difference in PV during the 14-day storage. The protective
effect of fish oil by addition of 10 % crude oat oil may be
ascribed to its content of tocopherols and tocotrienols and
other minor compounds with antioxidant effects [11].
It has been suggested that low initial PV (\0.1 mequiv/
kg) is more critical for oxidation rates than PUFA or
content of tocopherol in oils [24, 30]. In this study FO
oxidized very rapidly when emulsified into skimmed milk
despite a low initial PV. A significant increase in peroxide
value was also shown in the FO ? CO emulsion, with an
initial value of 5.8 to 42.7 mequiv/kg after 5 days of
storage. This indicates that addition of crude CO to FO did
not have a protective effect against oxidation in the
emulsion when considering the primary oxidation products,
which was also observed in bulk. A decrease in PV was
shown in FO ? CO from day 5 to 8, and from day 8 to 14,
which could indicate decomposition of hydroperoxides to
secondary oxidation products. When relating the PV with
results from the induction time measurements (Table 3),
the same trend was observed concerning the oxidation rate
of the oils and blends, which was found in the order;
FO[ FO ? CO[ FO ? OO. Previous researchers have
reported that milk emulsion prepared with liquid skim milk
with less than 0.01 % and also with 1 % milk fat content,
enriched with 1.5 wt% fish oil and 0.5 wt% blend of fish
oil and rapeseed oil, respectively, resulted in relatively low
peroxide values during storage at 2 �C for 14 days [24, 30].
The fish-rapeseed oil blend resulted in PV\ 1 mequiv/kq,
while skimmed milk enriched with cod liver oil (without
antioxidants) gave peroxide values up to 5.3 mequiv/kq.
Milk is a complex medium with several factors that can
either inhibit or promote oxidation of the added oils. The
present results indicated that interactions between the milk
medium and the added PUFA seemed to promote oxidation
rather than inhibit it. As opposed to bulk oils where oxi-
dation mainly takes place at the interface of oil and air,
oxidation of oil-in-water emulsions is likely to occur at the
interface between the oil and water phase, which results in
differences in factors that affect the lipid oxidation process.
Protein material intrinsic in cow‘s milk functioned as
emulsifiers at the interface of the oil droplets in the present
study, thus no external emulsifier was added. Due to the pH
value (6.7) of the milk emulsions, the surface charge of the
emulsion droplets is expected to be negative and may
therefore have potentially attracted positively charged trace
metals which are highly pro-oxidative, thereby enhancing
lipid oxidation in the studied emulsions, especially FO and
FO ? CO which gave the highest peroxide values [6]. The
emulsions were exposed to oxygen for a short period of
time during the homogenization process, which is also a
factor for the initiation of oxidation. The high levels of n-3
LC-PUFA in FO and the high ALA levels in the CO are
another factor that can accelerate oxidation, due to their
polarity and orientation towards the interface [31], which
may be a reason for PV values[40 mequiv/kg after only
5 days of storage. The significant increase in oxidation in
the emulsions after just 5 days of storage at 4 �C is in
contrast to the stability in bulk oils which further confirms
Table 4 Peroxide value of enriched skimmed milk emulsions during 14 days storage at 4 �C
Peroxide value (mequiv O2/kg oil)
Sample Days of storage
0 5 8 14
FO 1.4 ± 0.7a,x 47.0 ± 0.4b,x 62.4 ± 1.0c,x 90.6 ± 1.5d,x
FO ? CO 5.8 ± 3.1a,x 42.6 ± 0.5b,x 32.3 ± 3.6c,y 17.0 ± 1.0d,y
FO ? OO 7.1 ± 1.2a,x 5.8 ± 0.0a,y 10.6 ± 0.2a,z 9.0 ± 0.7a,z
PV expressed as mequiv O2/kg ± standard deviation (n = 2)a-d in the row indicate significant difference (p\ 0.05) between days of storage within samplex–z in the columns indicate significant difference (p\ 0.05) between samples within days
J Am Oil Chem Soc
123

that oxidative stability of PUFA is highly dependent on the
food matrix, lipid composition and form [5].
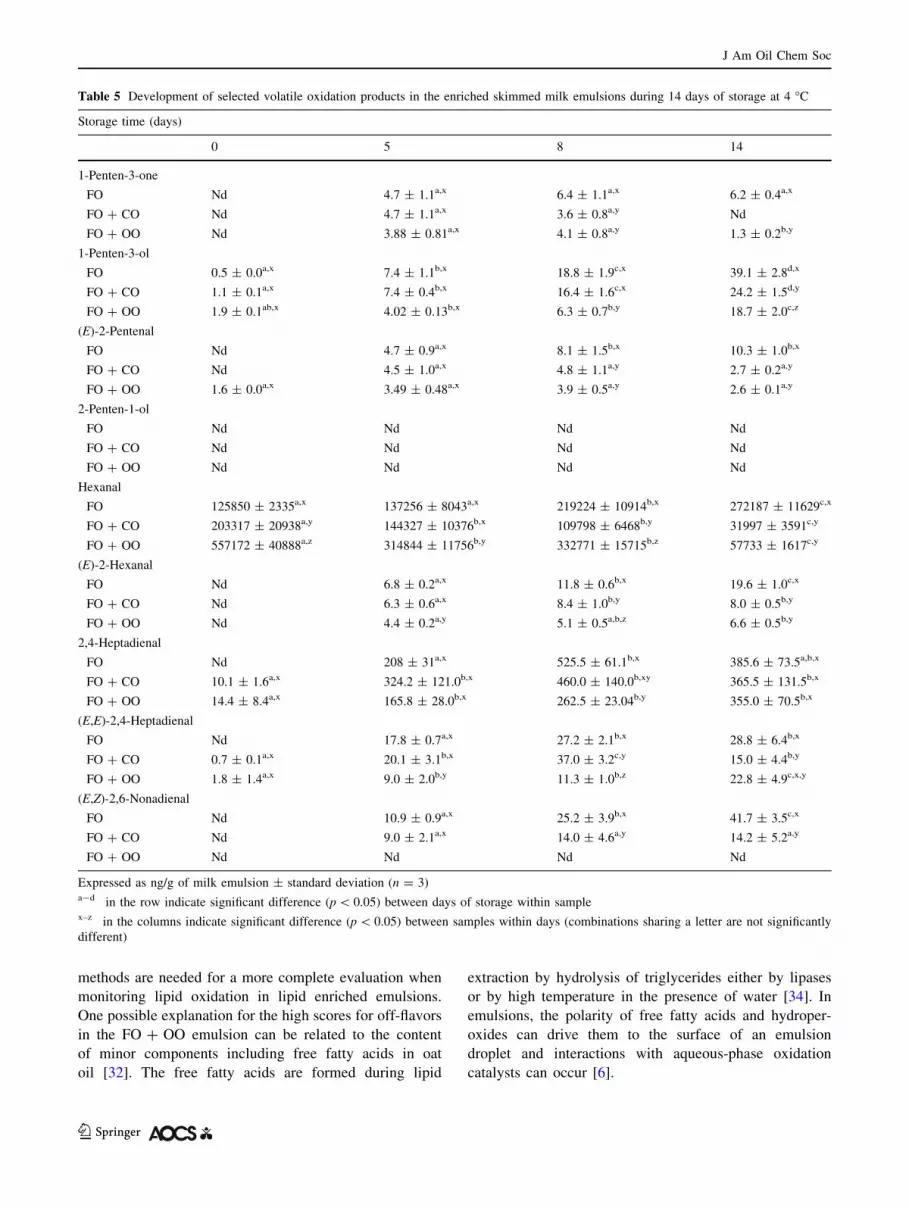
Formation of Secondary Volatile Compounds
Nine volatile secondary oxidation products derived from
the degradation of n-3 and n-6 fatty acids [23, 24] were
selected as markers of oxidation during storage of the
emulsions, including 1-penten-3-one, 1-penten-3-ol, (E)-2-
pentenal, 2-penten-1-ol, hexanal, (E)-2-hexenal, 2,4-hept-
adienal, (E,E)-2,4-heptadienal and (E,Z)-2,6-nonadienal.
Except for 2-penten-1-ol and hexanal, the formation of
the selected secondary volatile compounds increased even
during the first storage days (Table 5). 2-penten-1-ol was
below the detection limit in all the emulsions during the
storage period. Hexanal was already present in high values
in the emulsions from day 0. Significantly higher initial
values were found in the emulsions containing the crude
plant oils, OO (about 56 9 104 ng/g) and CO (about
20 9 104 ng/g) compared with the FO emulsion (about
12 9 104 ng/g). Hexanal is a common degradation product
from the autoxidation of linoleic acid hydroperoxides, and
has a very low threshold value for flavor and odor [4]. In
oat and in camelina oil, hexanal is one of the most abun-
dant volatile compounds [32, 33]. Both the OO and CO
contain high levels of linoleic acid, 41.5 and 15.6 %,
respectively (Table 2). During the storage period, degra-
dation of hexanal was detected in OO and CO emulsions,
while hexanal increased in the FO emulsion (Table 5). This
was somewhat surprising, but could indicate that hexanal
participated in other reactions in the OO and CO emulsions
to a higher extent than in the FO emulsion.
In previous studies on the oxidative stability of fish oil-
enriched milk [24, 30], the development of typical volatile
secondary oxidation products were below 12 ng/g emul-
sions after 11 days of storage at 2 �C, even without the
addition of antioxidants. In our study only 1-penten-3-one
and 2-pentenal were below this value for the FO enriched
milk at day 14. Peroxide values showed a significant and
high increase in the FO and FO ? CO emulsion from
day 0 to 5 (Table 4). As a result of the increase in hydro-
peroxides, a corresponding formation of secondary volatile
compounds especially in FO and FO ? CO was seen in
this storage period, indicating a high decomposition of
peroxides (Table 5). The number of reactive methylene
groups is higher, and the activation energy for abstracting
proton from a methylene group in conjugation in FO and
FO ? CO is lower than for FO ? OO with a lower degree
of unsaturation in the fatty acid profile. At 8 and 14 days of
storage, the FO ? OO emulsion showed significantly
lower values of 1-penten-3-ol, 2,4-heptadienal and (E,E)-
2,4-heptadienal than in the FO and FO ? CO emulsions
(Table 5). (E,Z)-2,6-nonadienal was not detected in the
FO ? OO emulsion during the storage period, whereas a
significant increase from 10.8 to 41.7 ng/g, during 5 to
14 days storage was found for (E,Z)-2,6-nonadienal in the
FO emulsion. Development of the vinyl ketone 1-penten-3-
one was higher in FO emulsion at day 8 and 14 compared
to FO ? CO and FO ? OO emulsions. 1-penten-3-one, the
diunsaturated aldehyde (E,E)-2,4-heptadienal and (E,Z)-
2,6-nonadienal are compounds derived from degradation of
n-3 PUFA, and have been characterized as very potent
odorants, contributing to unpleasant rancid and fishy off-
flavors in fish oil enriched milk and mayonnaise [23, 24].
In general the FO emulsion developed higher levels of
1-penten-3-one, 1-penten-3-ol, (E)-2-pentenal, (E)-2-hex-
enal, 2,4-heptadienal, and (E,Z)-2,6-nonadienal during the
storage period, closely followed by the FO ? CO emul-
sion. A degradation of 1-penten-3-one, (E)-2-pentenal,
2,4-heptadienal and (E,E)-2,4-heptadienal was shown after
5 days of storage for the FO ? CO emulsion, which indi-
cate further oxidation or reactions with proteins to tertiary
products. Overall the evaluation of volatile compounds
showed the lowest values for the FO ? OO emulsion for
all compounds except for hexanal, followed by the
FO ? CO emulsion, as also observed when PV of the same
emulsions were measured.
Sensory Evaluation of Enriched Emulsions
The average sensory scores for the off-odors and off-fla-
vors in milk emulsions stored for 8 days in the dark at 4 �C
are shown in Fig. 1. Only small changes were detected in
stearin/paraffin odors and flavors during the storage period,
with FO ? OO at day 8 having the highest score on 2.0 for
odor and 2.3 for flavor (not shown).
Fish and paint odor and flavor resulted in the overall
highest values and increased from day 0 to 8, in particular
for the FO and FO ? OO emulsions. A significant increase
in fishy and paint off flavors from day 0 to 5 were shown
for FO, whereas the FO ? OO emulsion increased signif-
icantly from day 0 to 8. The highest scores were found for
FO ? OO emulsion at day 8. Paint odor and flavor showed
significantly higher intensity in the FO ? OO emulsion at
day 8 (odor score 6.8 and flavor score 7.0), compared with
the FO and FO ? CO emulsions (odor score 4.5 and 1.7,
respectively, flavor score 4.8 and 2.2). These results con-
tradicts with results from the analysis of secondary volatile
compounds, where the FO ? OO emulsion showed better
oxidative stability compared with FO and FO ? CO
emulsions. Volatile compounds resulting in particular fish
and paint odor and flavor in the FO ? OO emulsion
compared with FO and FO ? CO were not found
(Table 5). Whether this can be explained by compounds
not measured by HS GC/MS is unknown. This clearly
demonstrates that both sensory analysis and instrumental
J Am Oil Chem Soc
123
methods are needed for a more complete evaluation when
monitoring lipid oxidation in lipid enriched emulsions.
One possible explanation for the high scores for off-flavors
in the FO ? OO emulsion can be related to the content
of minor components including free fatty acids in oat
oil [32]. The free fatty acids are formed during lipid
extraction by hydrolysis of triglycerides either by lipases
or by high temperature in the presence of water [34]. In
emulsions, the polarity of free fatty acids and hydroper-
oxides can drive them to the surface of an emulsion
droplet and interactions with aqueous-phase oxidation
catalysts can occur [6].
Table 5 Development of selected volatile oxidation products in the enriched skimmed milk emulsions during 14 days of storage at 4 �C
Storage time (days)
0 5 8 14
1-Penten-3-one
FO Nd 4.7 ± 1.1a,x 6.4 ± 1.1a,x 6.2 ± 0.4a,x
FO ? CO Nd 4.7 ± 1.1a,x 3.6 ± 0.8a,y Nd
FO ? OO Nd 3.88 ± 0.81a,x 4.1 ± 0.8a,y 1.3 ± 0.2b,y
1-Penten-3-ol
FO 0.5 ± 0.0a,x 7.4 ± 1.1b,x 18.8 ± 1.9c,x 39.1 ± 2.8d,x
FO ? CO 1.1 ± 0.1a,x 7.4 ± 0.4b,x 16.4 ± 1.6c,x 24.2 ± 1.5d,y
FO ? OO 1.9 ± 0.1ab,x 4.02 ± 0.13b,x 6.3 ± 0.7b,y 18.7 ± 2.0c,z
(E)-2-Pentenal
FO Nd 4.7 ± 0.9a,x 8.1 ± 1.5b,x 10.3 ± 1.0b,x
FO ? CO Nd 4.5 ± 1.0a,x 4.8 ± 1.1a,y 2.7 ± 0.2a,y
FO ? OO 1.6 ± 0.0a,x 3.49 ± 0.48a,x 3.9 ± 0.5a,y 2.6 ± 0.1a,y
2-Penten-1-ol
FO Nd Nd Nd Nd
FO ? CO Nd Nd Nd Nd
FO ? OO Nd Nd Nd Nd
Hexanal
FO 125850 ± 2335a,x 137256 ± 8043a,x 219224 ± 10914b,x 272187 ± 11629c,x
FO ? CO 203317 ± 20938a,y 144327 ± 10376b,x 109798 ± 6468b,y 31997 ± 3591c,y
FO ? OO 557172 ± 40888a,z 314844 ± 11756b,y 332771 ± 15715b,z 57733 ± 1617c,y
(E)-2-Hexanal
FO Nd 6.8 ± 0.2a,x 11.8 ± 0.6b,x 19.6 ± 1.0c,x
FO ? CO Nd 6.3 ± 0.6a,x 8.4 ± 1.0b,y 8.0 ± 0.5b,y
FO ? OO Nd 4.4 ± 0.2a,y 5.1 ± 0.5a,b,z 6.6 ± 0.5b,y
2,4-Heptadienal
FO Nd 208 ± 31a,x 525.5 ± 61.1b,x 385.6 ± 73.5a,b,x
FO ? CO 10.1 ± 1.6a,x 324.2 ± 121.0b,x 460.0 ± 140.0b,xy 365.5 ± 131.5b,x
FO ? OO 14.4 ± 8.4a,x 165.8 ± 28.0b,x 262.5 ± 23.04b,y 355.0 ± 70.5b,x
(E,E)-2,4-Heptadienal
FO Nd 17.8 ± 0.7a,x 27.2 ± 2.1b,x 28.8 ± 6.4b,x
FO ? CO 0.7 ± 0.1a,x 20.1 ± 3.1b,x 37.0 ± 3.2c,y 15.0 ± 4.4b,y
FO ? OO 1.8 ± 1.4a,x 9.0 ± 2.0b,y 11.3 ± 1.0b,z 22.8 ± 4.9c,x,y
(E,Z)-2,6-Nonadienal
FO Nd 10.9 ± 0.9a,x 25.2 ± 3.9b,x 41.7 ± 3.5c,x
FO ? CO Nd 9.0 ± 2.1a,x 14.0 ± 4.6a,y 14.2 ± 5.2a,y
FO ? OO Nd Nd Nd Nd
Expressed as ng/g of milk emulsion ± standard deviation (n = 3)a-d in the row indicate significant difference (p\ 0.05) between days of storage within samplex–z in the columns indicate significant difference (p\ 0.05) between samples within days (combinations sharing a letter are not significantlydifferent)
J Am Oil Chem Soc
123

The intensity of fish and paint off-flavors in the
FO ? CO emulsions had a low intensity in the range
1.1–2.2 during the entire storage period and showed no
significantly increase in any of the off-flavors, in contrast to
FO and FO ? OO emulsions which gave higher sensory
scores and also increased significantly during storage.
Crude oils may have a strong characteristic product-related
flavor, thus, crude CO had a very distinct odor and flavor
even when mixed with FO and added to milk, which may
have caused a masking effect of the off-flavors related to
lipid oxidation in the FO ? CO emulsion, resulting in low
sensory scores for these attributes.
This finding is in accordancewith a recent study by Eidhin
and O’Beirne (2010) [13] showing that camelina oil had a
masking effect on fish odors when blended with fish oil.
Conclusion
This study demonstrated that inclusion of only 5 and 10 %
crude oat oil significantly increased the oxidative stability
of fish oil in bulk, demonstrating interesting antioxidative
properties. The oxidative stability of a skimmed milk
emulsion enriched with a blend of 90 % fish oil and 10 %
oat oil also revealed the lowest peroxide values and volatile
compounds during storage at 4 �C for 14 days storage.
However, sensory analysis of the same emulsion gave the
highest scores for undesirable off-flavors, indicating that
several methods, including sensory analysis, should be
combined to illustrate the complete picture of lipid oxi-
dation in emulsions.
Acknowledgments The authors thank Denomega A/S, Bioforsk andSwedish oat fiber AB for providing the oils used in this study.
References
1. Simopoulos AP (1999) Essential fatty acids in health and chronicdisease. Am J Clin Nutr 70:560–569
2. Ruxton CHS, Reed SC, Simpson MJA, Millington KJ (2007) Thehealth benefits of omega-3 polyunsaturated fatty acids: a reviewof the evidence. J Nutr Diet 20:275–285
3. Trautwein EA (2001) n-3 Fatty acids—physiological and tech-nical aspects for their use in food. Eur J Lipid Sci Technol103:45–55
4. Frankel EN (2005) Lipid oxidation, 2nd edn. The oily press,England
5. Coupland JN, McClements DJ (1996) Lipid oxidation in foodemulsions. Trends Food Sci Technol 7:83–91
6. Mei L, McClements DJ, Decker EA (1999) Lipid oxidation inemulsions as affected by charge status of antioxidants andemulsion droplets. J Agric Food Chem 47:2267–2273
7. Nielsen NS, Klein A, Jacobsen C (2009) Effect of ingredients onoxidative stability of fish oil-enriched drinking yoghurt. Eur JLipid Sci Technol 111:337–345
8. Nicovska K (2010) Oxidative stability and rheological propertiesof oil-in-water emulsions with walnut oil. Adv J Food SciTechnol 2:172–177
9. Dauqan EMA, Abdullah A, Sani AH (2011) Natural antioxidants,lipid profile, lipid peroxidation, antioxidant enzymes of differentvegetable oils. Adv J Food Sci Technol 3:308–316
10. Abramovic H, Butinar B, Nikolic V (2007) Changes occurring inphenolic content, tocopherol composition and oxidative stabilityof camelina sativa oil during storage. Food Chem 104:903–909
11. Peterson DM (2001) Oat antioxidants. J Cer Sci 33:115–12912. Padely FB, Freeman, IP, Polman, RG, vanLookern GJ (1989)
European patent 304 11513. Eidhin D, O’Beirne D (2010) Oxidative stability and accept-
ability of camelina oil blended with selected fish oils. Eur J LipidSci Technol 112:878–886
14. American Oil Chemists’ Society (AOCS) (2009) Official meth-ods and recommended practices of the American oil chemists’society. Method Cd 8b–90. AOCS Press, Champaign
15. American Oil Chemists’ Society (AOCS) (1997) Official meth-ods and recommended practices of the American oil chemists’society. Method Ch 1–91. AOCS Press, Champaign
16. American Oil Chemists’ Society (AOCS) (1992) Official meth-ods and recommended practices of the American oil chemists’society. Method Ce 1b–89. AOCS Press, Champaign
17. Panfili G, Fratianni A, Irano M (2003) Normal phase high-per-formance liquid chromatography method for the determination oftocopherols and tocotrienols in cereals. J Agric Food Chem51:3940–3944
18. American Oil Chemists’ Society (AOCS) (1993) Official meth-ods and recommended practices of the American oil chemists’society. Method Cd 12b–92. AOCS Press, Champaign
0 5 8
FOFO+COFO+OO
Metal odorIn
ten
sity [
1-9
]
24
68
a a a
b
ab b
a
b
0 5 8
Metal flavor
24
68
a a a
ba
b b
a
b
Fishy odor
Inte
nsity [
1-9
]
24
68
a a
b
a
b
b
a
c
0 5 8 0 5 8
Fishy flavor
24
68
a a a
b
a
b
b
a
c
Paint odor
Days
Inte
nsity [
1-9
]
24
68
a aa
b
a
b
b
a
c
0 5 8 0 5 8
Paint flavor
24
68
a a a
b
a
b
b
a
c
Days
a
Fig. 1 Average intensity [1–9] of sensory descriptions in skimmedmilk enriched with fish oil (FO), binary blend of fish oil and camelinaoil (FO ? CO) and binary blend of fish oil and oat oil (FO ? OO)during 8 days of storage at 4 �C. Error bars indicate standarddeviations. Letters a–c indicate significant difference between days ofstorage for each emulsion type
J Am Oil Chem Soc
123

19. Bligh EG, Dyer WJ (1959) A rapid method of total lipidextraction and purification. Can J Biochem Physiol 37:911–991
20. Iverson SJ, Lang SLC, Cooper MH (2001) Comparison of theBligh and Dyer and Folch methods for total lipid determination ina broad range of marine tissue. Lipids 36:1283–1287
21. International Dairy Federation (1991) International IDF Stan-dards, IDF-Square Vergote 41, Brussels, Belgium. section 74A
22. Timm-Heinrich M, Xu XB, Nielsen NS, Jacobsen C (2003)Oxidative stability of milk drinks containing structured lipidsproduced from sunflower oil and caprylic acid. Eur J Lipid SciTechnol 2003(105):459–470
23. Hartvigsen K (2000) Dynamic headspace gas chromatography/mass spectrometry characterization of volatiles produced in fishoil enriched mayonnaise during storage. J Agric Food Chem48:4858–4867
24. Let MB, Jacobsen C, Frankel EN, Meyer AS (2003) Oxidativeflavour deterioration of fish oil enriched milk. Eur J Lipid SciTechnol 105:518–528
25. Brindzova L, Certik M, Rapta P, Zalibera M, Mikulajova A,Takacsova M (2008) Antioxidant activity, beta-glucan and lipidcontents of oat varieties. Czech J Food Sci 26:163–173
26. Forssell P, Kervinen R, Alkio M, Poutanan K (1992) Comparisonof methods for separating polar lipids from oat oil. Fett WissTechnol 94:355–358
27. Kamal-Eldin A, Appelqvist L (1996) The chemistry and antioxidantproperties of tocopherols and tocotrienols. Lipids 31:671–701
28. Kaukonen O, Zock PL, Mensik RP (2011) Foaming of differentlyprocessed oats: role of nonpolar lipids and tryptophanin proteins.Cer Chem 88:239–244
29. Mendez E, Sanhueza J, Speisky H, Valenzuela A (1996) Vali-dation of the rancimat test for the assessment of the relativestability of fish oils. J Am Oil Chem Soc 73:1033–1037
30. Let MB, Jacobsen C, Meyer AS (2004) Effects of fish oil type,lipid antioxidants and presence of rapeseed oil on oxidative fla-vour stability of fish oil enriched milk. Eur J Lipid Sci Technol106:170–182
31. Jacobsen C, Let MB, Nielsen NS, Meyer AS (2008) Antioxidantstrategies for preventing oxidative flavour deterioration of foodsenriched with n-3 polyunsaturated lipids: a comparative evalua-tion. Trends Food Sci Technol 19:76–93
32. Heinio RL, Lehtinen P, Oksman-Caldentey KM, Poutanen K(2002) Differences between sensory profiles and development ofrancidity during ling term storage of native and processed oat.Cereal Chem 79:367–375
33. Saga LC, Rukke EO, Liland KH, Kirkhus B, Egelandsdal B,Karlsen J, Volden J (2011) Oxidative stability of polyunsaturatededible oils mixed with microcrystalline cellulose. J Am Oil ChemSoc 88:1883–1895
34. Waraho T, Cardiena V, Rodrigues-Estrada MT, McClements DJ,Decker EA (2009) Prooxidant mechanisms of free fatty acids instripped soybean oil-in-water emulsions. J Agric Food Chem57:7112–7117
J Am Oil Chem Soc
123
Top Related
Copyright © 2022 FDOKUMEN

