


Bahasa
Halaman
Hukum


CHAPTER 8
ANALYSIS AND INTERPRETATION OF RESULTS
8.1 INTRODUCTION
One of the aims of this thesis is to evaluate the nature and scope of TQM
implementation, based on a framework, as an internal organisational arrangement for
personnel at SA Air Force bases (see chapter 1). Arising from this, a further aim is to
probe the attitude of personnel towards the nature and scope of the TQM dimensions
identified in the literature review at eight specific air force bases (see chapter 3, figure
3.1). To achieve these aims, structured questionnaires were used to gather the
required data at these bases.
After having provided a discussion in the previous chapter of the development of the
research tools used in the empirical part of this study, the results of the processed data
are analysed and interpreted in this chapter. Questionnaire one (see Appendix B)
deals with the biographical particulars of the respondents, while questionnaire two (see
Appendix C) consists of 210 items related to the 14 dimensions of the TQM framework
(see chapter 3, table 3.3 and figure 3.1). The items are closely analysed with the
emphasis mainly on average scores that came to the fore for each section and per
item. The focus is further on prioritising items and identifying deficiencies in the
different dimensions. In order to present the information in an orderly and systematic
fashion and to enhance readability, appendices, tables and graphs are used.
8.2 ANALYSIS AND INTERPRETATION OF RESULTS
The purpose of questionnaire one was to obtain the particulars of the respondents of
the test sample. When a questionnaire is used as method of data collection, it is
important to pay attention to the biographical details of the respondents who complete
the forms. The reason being that biographical details, such as management levels and
number of years of service, must be taken into consideration when analysing and
interpreting data. Therefore, the results that emerged from the empirical study

conducted with the aid of questionnaire two (see Appendix C) should not be viewed
separately from the biographical details.
8.2.1 Questionnaire one: Biographical details (see Appendix B)
Various biographical particulars concerning the respondents were obtained from the
survey (see questionnaire one of the survey in Appendix B) in order to place answers to
questions in the remainder of the survey in perspective. Tables 8.1 to 8.8 provide
information in this regard. The study involved 543 (15%) members from eight air force
bases’ accessible population in a random survey.
8.2.1.1 Management levels
The levels of the positions of respondents, as discussed in chapter 1, paragraph
1.11.2.6, are represented in table 8.1. On studying the table it becomes clear that the
majority of the respondents (56,32%) are employed as operational workers at the air
force bases. Of the respondents, 36,25% stated that they serve at middle management
level, while 7,43% stated that they serve at top management level. Altogether 43,68%
of the respondents occupies top and middle management posts at air force bases.
These statistics confirm that personnel at all management levels at air force bases
participate in the TQM dimensions. This fact made it possible to ensure that further
related responses would be obtained.
Table 8.1: Management level
Management
level
Frequency Percentage Cumulative
frequency
Cumulative
percentage
Top
management40 7.43 40 7.43
Middle
management195 36.25 235 43.68
Workers 303 56.32 538 100.00

8.2.1.2 Qualifications
The educational levels of the respondents are shown in table 8.2. From table 8.2, the
vast majority of respondents (87,34%) possess a qualification of at least grade 12.
Most of the respondents (51,21%) have a grade 12 qualification, whereas 31,66% of
the respondents are in possession of a three-year diploma (in various fields of study)
and 12,66% are in possession of a grade 10 or grade 11 qualification. It should be
noted that 4,47% of respondents are in possession of a qualification equivalent to at
least a bachelor’s degree.
The respondents are generally well qualified at tertiary level, which implies that they
were able to participate meaningfully in the study. It should be noted that air force base
personnel members employed in a spectrum ranging from the most lowly qualified to
the most highly qualified participate in various dimensions of TQM. This implies that,
especially with regard to the training methodology, special methods have to be used in
order to make the training of all employees at air force bases acceptable and
meaningful. The training methods used at air force bases in the area of TQM have not
been investigated, but the process followed by air force bases to provide employees
with training in general is discussed in chapter 6.
Table 8.2: Qualifications
Qualification Frequency Percentage Cumulative
frequency
Cumulative
percentage
Grade 10 - 11 68 12.66 68 12.66
Grade 12 275 51.21 343 63.87
3 year diploma 170 31.66 513 95.53
Degree 24 4.47 537 100.00
8.2.1.3 Rank
Table 8.3 shows the rank group distribution of all the respondents. The largest single
concentration of respondents holds posts in the rank group of sergeant (20,44%). This
group is followed by the flight sergeants, who constitute 19,52% of the total, warrant
officers class 1 and 2 (who constitute 19,89% of the total), and lance corporals and

corporals (who constitute 11,97% of the total). The single largest concentration of
respondents (39,96%) consists of senior non-commissioned officers (sergeants and
flight sergeants). The remainder of the respondents is PSAPs (Public Service Act
Personnel, in this case, civilians working in the SANDF) who constitute 4,79% of the
total, junior non-commissioned officers (ie, the rank group lance corporal to corporal)
who constitute 11,97%, warrant officers (19,89%) and officers (ie, normally the rank
group second lieutenant to colonel) who constitute 22,83%.
Table 8.3: Rank
Rank Frequency Percentage Cumulative
frequency
Cumulative
percentage
PSAP 26 4.79 26 4.79
Airmen (Amn) 3 0.55 29 5.34
Lance Corporal (L Cpl) 10 1.84 39 7.18
Corporal (Cpl) 55 10.13 94 17.31
Sergeant (Sgt) 111 20.44 205 37.75
Flight sergeant (F Sgt) 106 19.52 311 57.27
Warrant Officer Class 2 (WO2) 61 11.23 372 68.51
Warrant Officer Class 1 (WO1) 47 8.66 419 77.16
Second Lieutenant (2 Lt) 1 0.18 420 77.35
Lieutenant (Lt) 24 4.42 444 81.77
Captain (Capt) 31 5.71 475 87.48
Major (Maj) 34 6.26 509 93.74
Lieutenant Colonel (Lt Col) 24 4.42 533 98.16
Colonel (Col) 10 1.84 543 100.00
8.2.1.4 Air force bases
Table 8.4 indicates the various air force bases where respondents are employed. It
shows that the respondents are evenly distributed over the various air force bases.

Table 8.4: Air force bases
Air force base Frequency PercentCumulativeFrequency
CumulativePercentage
Bloemspruit 68 12.57 68 12.57
Durban 48 8.87 116 21.44
Hoedspruit 89 16.45 205 37.89
Langebaanweg 64 11.83 269 49.72
Louis Trichardt 41 7.58 310 57.30
Overberg 64 11.83 374 69.13
Waterkloof 107 19.78 481 88.91
Ysterplaat 60 11.09 541 100.00
The various air force bases are discussed in paragraph 6.3.3. It is important to note
that the largest concentration of respondents (19,78%) is employed at AFB Waterkloof,
the largest air force base in the SA Air Force.
8.2.1.5 Functional groupings (or divisions)
Table 8.5 gives the functional groupings in which the various respondents at air force
bases are employed. Table 8.5 shows that the respondents are evenly distributed over
the various organisational levels.
Table 8.5: Functional groupings (or divisions)
Functional group Frequency PercentCumulativeFrequency
CumulativePercentage
Intelligence 34 6.27 34 6.27
Operations 72 13.28 106 19.56
Supply Support 87 16.05 193 35.61
Technical 246 45.39 439 81.00
Engineering 5 0.92 444 81.92
Security 46 8.49 490 90.41
Fire Brigade 17 3.14 507 93.54
Human Resources 35 6.46 542 100.00

The various functional groupings are discussed in paragraph 6.3.3. It is important to
note that the functional groupings of technical and engineering are employed in the
same area of operation as the functional group, aircraft maintenance (see chapter 6,
paragraph 6.3.3). It is important to note that the functional groupings of supply support
and fire brigade are employed in the same area of operation as the functional group,
base support (see chapter 6, paragraph 6.3.3).
The largest concentration of respondents (46,31%) state that they are employed at
aircraft maintenance (technical and engineering divisions). Supply support follows with
a figure of 16,05%. Only 0,92% of respondents is employed at the engineering section.
The reason for this is that there is only one engineering post per air force base.
8.2.1.6 Number of years of service in the SA Air Force
Table 8.6 shows the distribution of the number of years of service in the SA Air Force of
all the respondents. The aim of the question was to draw attention to the ‘categories of
years of service’ of the respondents in the SA Air Force. As far as this is concerned,
the largest single concentration of respondents (59,93%) occurred in the interval ‘more
than 10 years of service’, which constitutes more than half the respondents. Another
single concentration of respondents (26,35%) falls into the interval ‘six to ten years of
service’. The last group of respondents (10,76%) falls into the interval ‘two to five
years’ service’. These statistics confirm that a relatively large proportion of air force
base employees (86,28%) have been employed in the SA Air Force for more than six
years and that the respondents generally have many years of service and experience.
Only 2,97% of the respondents has less than two years’ service in the SA Air Force.
Table 8.6: Number of years of service in the SA Air Force
Years of service in SAAir Force Frequency Percentage
Cumulativefrequency
Cumulativepercentage
< 2 years 16 2.97 16 2.97
2-5 years 58 10.76 74 13.73
6-10 years 142 26.35 216 40.07
> 10 years 323 59.93 539 100.00

8.2.1.7 Number of years of service at air force bases
Table 8.7 shows the distribution of all the respondents’ years of service at air force
bases. The largest concentration (32,16%) of respondents falls in the interval ‘two to
five years of service’, 26,77% of the respondents falls in the interval ‘more than 10
years’ and 21,93% falls in the interval ‘six to ten years’ service at air force bases’.
These statistics confirm that a relatively large proportion of air force base employees
(80,86%) has been employed at air force bases for more than two years and, therefore,
can be regarded as experienced in the activities of their own functional groupings (or
divisions). Only 19,14% of respondents has been stationed at air force bases for less
than two years of service.
As TQM is applicable to the entire air force base, it follows logically that personnel with
two or more years’ service at air force bases will generally have been more involved in
the TQM programme than personnel with fewer years of service, since it may generally
be assumed that personnel with fewer years’ service at air force bases are less trained
and may therefore be regarded as relatively inexperienced in the TQM process.
The above statistics confirm that a relatively large proportion of air force base
employees (80,86%) has indeed been employed at air force bases for a long time and,
therefore, may be regarded as experienced in the activities of their different functional
groupings (or divisions). Owing to this, all the items in the questionnaire could be
meaningfully employed for the research project.
Table 8.7: Number of years of service at air force bases
Years of service at airforce bases Frequency Percentage
Cumulativefrequency
Cumulativepercentage
< 2 years 103 19.14 103 19.14
2-5 years 173 32.16 276 51.30
6-10 years. 118 21.93 394 73.23
> 10 years 144 26.77 538 100.00
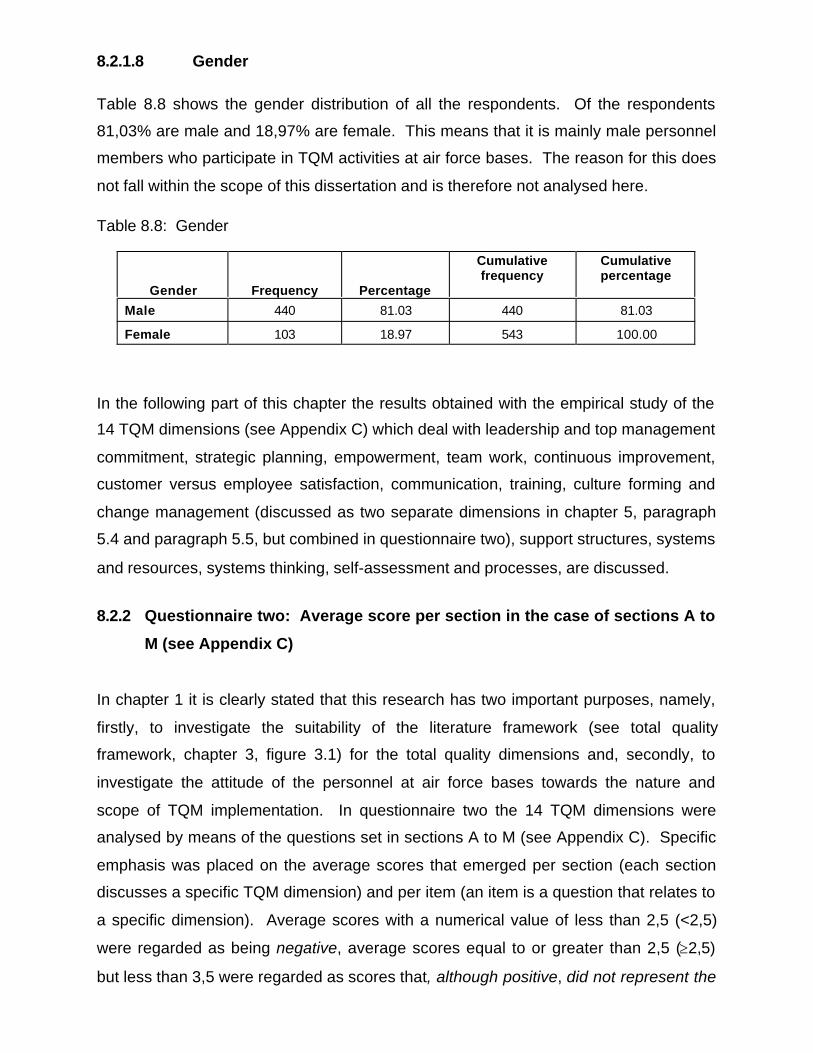
8.2.1.8 Gender
Table 8.8 shows the gender distribution of all the respondents. Of the respondents
81,03% are male and 18,97% are female. This means that it is mainly male personnel
members who participate in TQM activities at air force bases. The reason for this does
not fall within the scope of this dissertation and is therefore not analysed here.
Table 8.8: Gender
Gender Frequency Percentage
Cumulativefrequency
Cumulativepercentage
Male 440 81.03 440 81.03
Female 103 18.97 543 100.00
In the following part of this chapter the results obtained with the empirical study of the
14 TQM dimensions (see Appendix C) which deal with leadership and top management
commitment, strategic planning, empowerment, team work, continuous improvement,
customer versus employee satisfaction, communication, training, culture forming and
change management (discussed as two separate dimensions in chapter 5, paragraph
5.4 and paragraph 5.5, but combined in questionnaire two), support structures, systems
and resources, systems thinking, self-assessment and processes, are discussed.
8.2.2 Questionnaire two: Average score per section in the case of sections A to
M (see Appendix C)
In chapter 1 it is clearly stated that this research has two important purposes, namely,
firstly, to investigate the suitability of the literature framework (see total quality
framework, chapter 3, figure 3.1) for the total quality dimensions and, secondly, to
investigate the attitude of the personnel at air force bases towards the nature and
scope of TQM implementation. In questionnaire two the 14 TQM dimensions were
analysed by means of the questions set in sections A to M (see Appendix C). Specific
emphasis was placed on the average scores that emerged per section (each section
discusses a specific TQM dimension) and per item (an item is a question that relates to
a specific dimension). Average scores with a numerical value of less than 2,5 (<2,5)
were regarded as being negative, average scores equal to or greater than 2,5 (≥2,5)
but less than 3,5 were regarded as scores that, although positive, did not represent the

ideal situation, whereas an average score equal to or greater than 3,5 (≥3,5) was
regarded as very positive, and the ideal situation.
As far as the analysis of the average scores per section in the case of sections A to M
is concerned, the methodology used is based on the dissertation of Smit (1991: 107),
entitled ““Die evaluering of the arbeidsverhoudingefunksie van eerstevlaktoesighouers
ten einde ‘n ingrypingstrategie te ontwikkel”. As far as the average scores referred to in
this chapter are concerned, it needs to be mentioned from the outset that, all average
scores in sections A to M should have values equal to or greater than 2,5 (≥2,5), as a
score equal to or greater than 2,5 (≥2.5) is an indication that a specific requirement is
met (a score equal to or greater than 2,5 in the case of a specific item/dimension
indicates that the item/dimension meets the theoretical and practical requirements of
the dimension in question, as discussed in chapter 4 and 5, and is regarded as
positive). Average scores with a numerical value equal to or greater than 3,5 (≥3,5) are
regarded as the ideal situation being achieved and a very positive attitude amongst
respondents.
A score of less than 2,5 (<2,5) is regarded as an indication that a specific requirement
is not met (a score of less than 2,5 in the case of a specific item indicates that the item
does not meet the theoretical and practical requirements of the dimension in question,
as discussed in chapter 4 and 5 and, therefore, is regarded as being negative which is
an unacceptable situation). Average scores with a numerical value of less than 2,5
(<2,5) are regarded as a negative attitude amongst respondents (see table 8.9).
An average score of at least 2,5 is thus regarded as the minimum numerical value a
specific item/dimension should have for it to meet the theoretical and practical
requirements of the dimension in question as discussed in chapter 4 and 5 and,
therefore, is regarded as being positive. Although an average score equal to or higher
than 2,5 (≥2,5) is regarded as been complying with the theoretical and practical
requirements mentioned, an average score equal to or higher than 2,5 (≥2,5) but lower
than 3,5, cannot be considered as representing the ideal situation as it indicates
specific deficiencies that require attention.

Table 8.9: Interpretation of scores
Average scores Interpretation
A score equals to or higher than the
level of 3,5 (≥ 3,5).
Ideal situation from respondents, and
regarded as a very positive attitude from
respondents (meet the theoretical and
practical requirements of the dimension
in question).
A score equals to or higher than 2,5 (≥
2.5) but lower than 3,5 (<3.5).
(All these scores are indicated in the
colour grey in the tables)
Not ideal situation from respondents as
deficiencies exist, although regarded as
a positive attitude from respondents
(meet the theoretical and practical
requirements of the dimension in
question).
Scores of less than 2,5 (<2,5). Unacceptable situation from
respondents as serious deficiencies
exist and regarded as negative attitude
from respondents (does not meet the
theoretical and practical requirements of
the dimension in question).
Any average score equal to or higher than 2,5 (≥2,5) are regarded as a positive attitude
amongst respondents, which will support the hypothesis formulised in chapter 1,
namely “The attitude of personnel of the South African Air Force Bases towards the
primary and supporting dimensions of the framework for the implementation of TQM is
positive”. Any average score lower than 2,5 is regarded as a negative attitude
amongst respondents. Any average score lower than 2,5 undoubtedly indicates a
serious problem that requires special attention (Smit 1991:107). No average scores
<2,5 were, however, obtained in this study. See table 8.9 for a summary of the
interpretation of scores.
According to the scores in figure 8.1 (a), figure 8.1 (b) and table 8.10, only three (see
table 8.10, the average scores of these three are all equal to or higher than the level of
3,5) of the six primary TQM dimensions, namely leadership and top management

commitment, strategic planning and empowerment, meet the set requirements ideally
(see table 8.9), while the attitudes of the respondents can be regarded as being very
positive.
Figure 8.1 (a): Average scores per section in sections A to F (primary dimensions) of
questionnaire two
2
2.5
3
3.5
4
4.5
5
A B C D E F
Dimensions
Ave
rag
e sc
ore
s
Top management Middle management Workers
Figure 8.1 (b): Average scores per section in sections A to F (primary dimensions) of
questionnaire two
2
2.5
3
3.5
4
4.5
5
A B C D E F
Dimensions
Ave
rag
e sc
ore
s

Table 8.10: Average scores per section (sections A to F - primary dimensions)
awarded by top management, middle management and workers
Dimensions Top
management
Middle
management
Workers Average Hierarchy
A. Commitment of
leadership and top
management to TQM 3.51 3.71 3.75 3.66 1
B. Strategic planning 3.31 3.56 3.72 3.53 3
C. Empowerment3.57 3.62 3.66 3.62
2
D. Teamwork 3.21 3.34 3.40 3.32 6
F. Continuous
improvement 3.25 3.42 3.63 3.43
4
E. Customer/employee
satisfaction3.26 3.39 3.58 3.41
5
The three primary dimensions, teamwork, continuous improvement and customer and
employee satisfaction (see table 8.10), were awarded average scores equal to or
higher than 2,5 but lower than 3,5. This cannot be interpreted as the ideal situation
from respondents although regarded as a positive attitude from respondents, as it
indicates it does meet the theoretical and practical requirements of the dimension in
question with certain deficiencies. The deficiencies will be analysed in this chapter.
The workers awarded the highest scores to all six primary TQM dimensions (namely
leadership and top management commitment, strategic planning, empowerment,
teamwork, continuous improvement, customer and employee satisfaction).
The histogram in figure 8.1 (a), figure 8.1 (b) and table 8.10 highlights an important
trend that will be discussed further on in this chapter, namely that there are important
differences between the views of top management, middle management and workers
as far as the nature and scope of the implementation of the six primary TQM
dimensions at air force bases are concerned. The workers and middle management
generally have favourable views about this, whereas top management holds moderate
views. The average scores in table 8.10 indicate that there are no negative views
(<2,5) regarding the six primary TQM dimensions.

Table 8.10 shows that, as far as section A (leadership and top management
commitment) is concerned, all three categories of respondents are very positive. Table
8.10 shows that, as far as leadership and top management commitment to TQM is
concerned, in section A – an average score of 3,66 was awarded by all three categories
of respondents – both middle management, with an average score of 3,71, and the
workers, with an average score of 3,75, have a more definite positive view than top
management with an average score of 3,51. This shows that top management does
not really have as positive a view in this regard as middle management and the
workers. Table 8.10 shows that (1) middle management (3,71) and the workers (3,75)
awarded the highest score to the dimension of leadership and top management
commitment, (2) as far as this section is concerned, middle management and the
workers also awarded the highest score for all six primary dimensions to leadership and
top management commitment and (3) the average score (3,66) awarded by the three
categories of respondents is the highest in section A. The averages score of 3,66 for
this dimension indicates that the requirements for leadership and top management as a
dimension are being met.
Table 8.10 shows that, as far as section B (strategic planning) is concerned, all three
categories of respondents are less positive towards the dimension of strategic planning
than towards leadership and top management commitment. Table 8.10 shows that, as
far as strategic planning for TQM is concerned in section B – an average score of 3,53
was awarded by the three categories of respondents – both middle management, with
an average score of 3,56, and the workers, with an average score of 3,31, have a more
definite positive view than top management with an average score of 3,51, which is just
above the ideal situation. This shows that top management does not really have as
definite a positive view in this regard as middle management and the workers. The
averages score of 3,53 for this dimension indicates that the requirements for strategic
planning as a dimension are being met. Table 8.10 shows that (1) the workers (3,72)
awarded the second highest score to the dimension of strategic planning and (2) the
average score (3,53) awarded by the three categories of respondents is the third
highest in section B.
As far as section C (empowerment) is concerned, all three categories of respondents
are more positive towards the dimension of empowerment than they are towards

strategic planning. From table 8.10 top management’s average score of 3,57, middle
management’s average score of 3,62 and the workers’ average score of 3,66 indicate
that, in general, the requirements for empowerment as a dimension are met. It is
encouraging to observe that all three categories of respondents differ little from one
another as far as the requirements for empowerment at air force bases are concerned.
It is clear why the coefficient of reliability as described in chapter 7, paragraph 7.4.1, is
regarded as being exceptionally high, considering the results of the section. Table 8.10
shows that (1) middle management (3,62) awarded the second highest score to the
dimension of empowerment, (2) the workers (3,66) awarded the third highest score to
the dimension ‘empowerment’, and (3) the average score (3,62) awarded by the three
categories of respondents is the second highest in section C.
The respondents of all three categories are less positive towards section D (the
dimension of teamwork) than in the case of the other five primary dimensions (table
8.10). The average score awarded by the three categories of respondents in the
section is 3,32, which is the lowest score for the six primary dimensions (sections A to
F). On closer examination of table 8.10, it is interesting to note that, as far as this
section is concerned, the respondents of all three categories awarded the lowest score
to teamwork compared to the other five primary dimensions, namely top management’s
average score of 3,21, middle management’s average score of 3,34 and the workers’
average score of 3,40 which indicate that, on the whole, the requirements for teamwork
as a dimension are being met, although it is not the ideal situation.
The picture that emerges in the case of section E (continuous improvement) is not as
positive. The average score awarded by the three categories of respondents in this
section is 3,43, which is the third lowest score for any of the six primary dimensions
(table 8.10). Top management awards an average score of 3,25, middle management
an average score of 3,42 and the workers an average score of 3,63. What is
interesting, however, is that it is the workers who awarded the fourth highest score
(3,63) to the dimension of continuous improvement. Figure 8.1 (a) indicates clearly that
the workers have a more definite positive view in this regard than top and middle
management. On the whole, the requirements for continuous improvement as a
dimension are being met, although not the ideal situation.
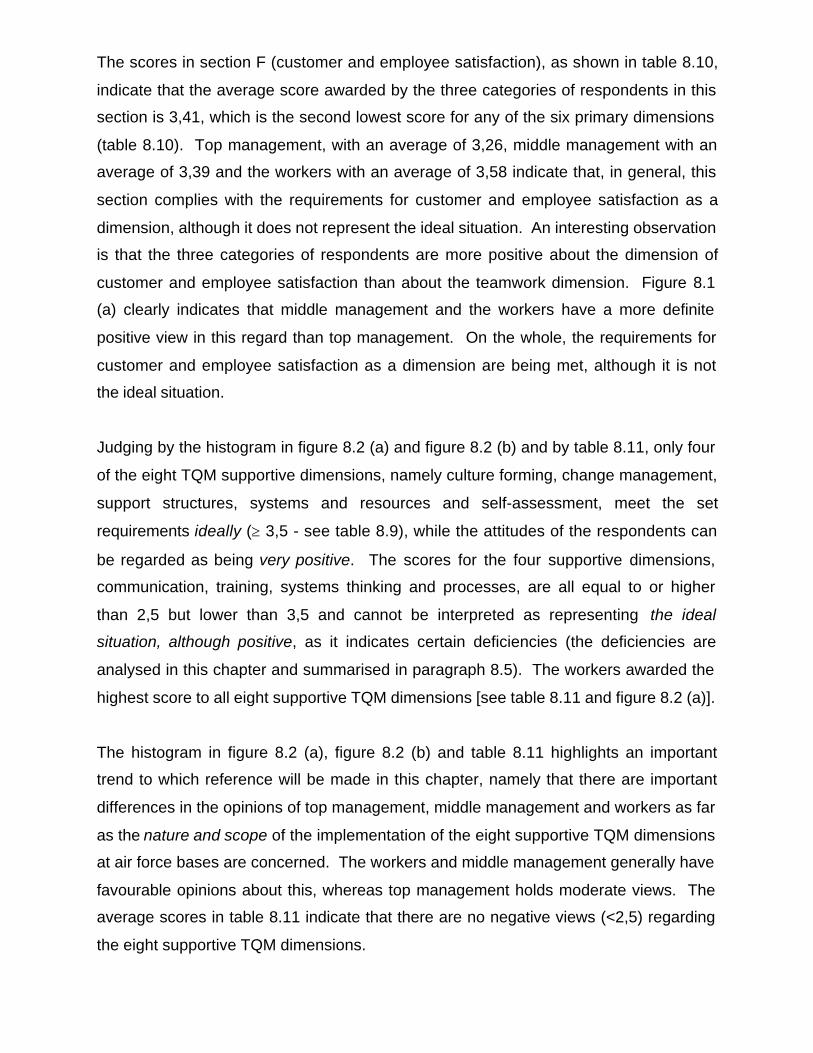
The scores in section F (customer and employee satisfaction), as shown in table 8.10,
indicate that the average score awarded by the three categories of respondents in this
section is 3,41, which is the second lowest score for any of the six primary dimensions
(table 8.10). Top management, with an average of 3,26, middle management with an
average of 3,39 and the workers with an average of 3,58 indicate that, in general, this
section complies with the requirements for customer and employee satisfaction as a
dimension, although it does not represent the ideal situation. An interesting observation
is that the three categories of respondents are more positive about the dimension of
customer and employee satisfaction than about the teamwork dimension. Figure 8.1
(a) clearly indicates that middle management and the workers have a more definite
positive view in this regard than top management. On the whole, the requirements for
customer and employee satisfaction as a dimension are being met, although it is not
the ideal situation.
Judging by the histogram in figure 8.2 (a) and figure 8.2 (b) and by table 8.11, only four
of the eight TQM supportive dimensions, namely culture forming, change management,
support structures, systems and resources and self-assessment, meet the set
requirements ideally (≥ 3,5 - see table 8.9), while the attitudes of the respondents can
be regarded as being very positive. The scores for the four supportive dimensions,
communication, training, systems thinking and processes, are all equal to or higher
than 2,5 but lower than 3,5 and cannot be interpreted as representing the ideal
situation, although positive, as it indicates certain deficiencies (the deficiencies are
analysed in this chapter and summarised in paragraph 8.5). The workers awarded the
highest score to all eight supportive TQM dimensions [see table 8.11 and figure 8.2 (a)].
The histogram in figure 8.2 (a), figure 8.2 (b) and table 8.11 highlights an important
trend to which reference will be made in this chapter, namely that there are important
differences in the opinions of top management, middle management and workers as far
as the nature and scope of the implementation of the eight supportive TQM dimensions
at air force bases are concerned. The workers and middle management generally have
favourable opinions about this, whereas top management holds moderate views. The
average scores in table 8.11 indicate that there are no negative views (<2,5) regarding
the eight supportive TQM dimensions.

Figure 8.2 (a): Average scores per section in sections G to M (supportive dimensions)
of questionnaire two
2
2.5
3
3.5
4
4.5
5
G H I J K L M
Dimensions
Av
era
ge
sc
ore
s
Top management Middle management Workers
Figure 8.2 (b): Average scores per section in sections G to M (supportive dimensions)
of questionnaire two
2
2.5
3
3.5
4
4.5
5
G H I J K L M
Dimensions
Ave
rag
e sc
ore
s
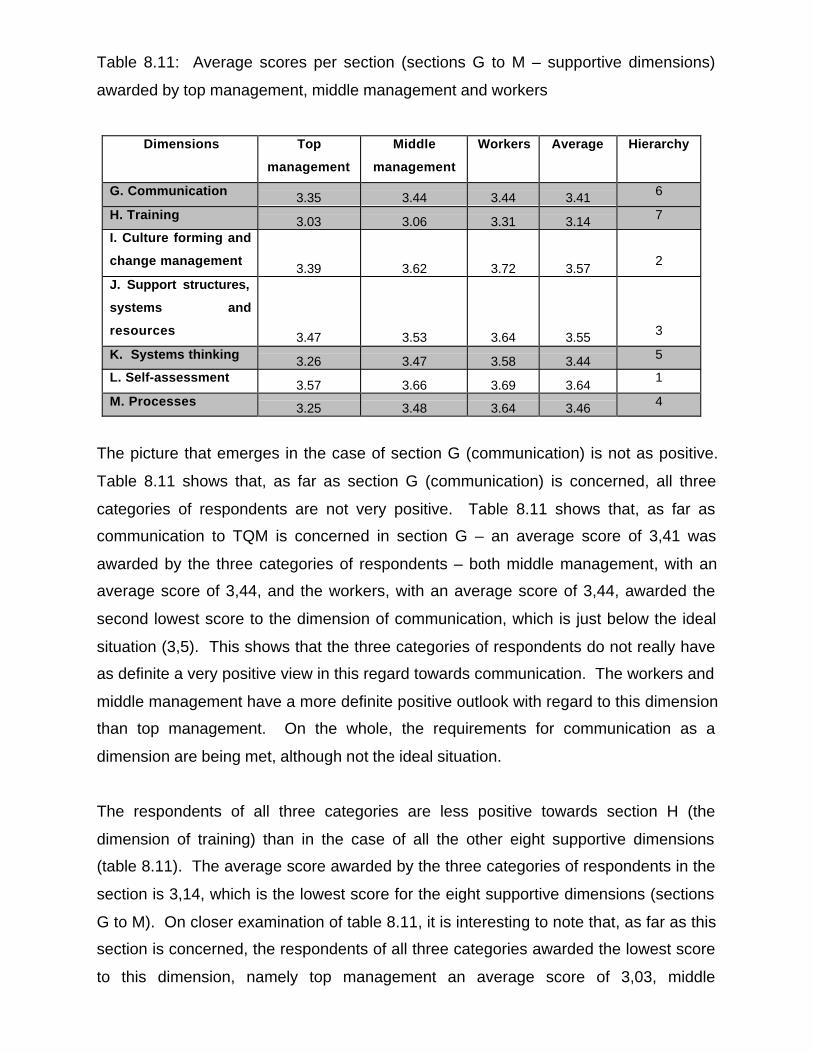
Table 8.11: Average scores per section (sections G to M – supportive dimensions)
awarded by top management, middle management and workers
Dimensions Top
management
Middle
management
Workers Average Hierarchy
G. Communication 3.35 3.44 3.44 3.41 6
H. Training 3.03 3.06 3.31 3.14 7
I. Culture forming and
change management3.39 3.62 3.72 3.57
2
J. Support structures,
systems and
resources 3.47 3.53 3.64 3.55 3
K. Systems thinking 3.26 3.47 3.58 3.44 5
L. Self-assessment3.57 3.66 3.69 3.64
1
M. Processes 3.25 3.48 3.64 3.46 4
The picture that emerges in the case of section G (communication) is not as positive.
Table 8.11 shows that, as far as section G (communication) is concerned, all three
categories of respondents are not very positive. Table 8.11 shows that, as far as
communication to TQM is concerned in section G – an average score of 3,41 was
awarded by the three categories of respondents – both middle management, with an
average score of 3,44, and the workers, with an average score of 3,44, awarded the
second lowest score to the dimension of communication, which is just below the ideal
situation (3,5). This shows that the three categories of respondents do not really have
as definite a very positive view in this regard towards communication. The workers and
middle management have a more definite positive outlook with regard to this dimension
than top management. On the whole, the requirements for communication as a
dimension are being met, although not the ideal situation.
The respondents of all three categories are less positive towards section H (the
dimension of training) than in the case of all the other eight supportive dimensions
(table 8.11). The average score awarded by the three categories of respondents in the
section is 3,14, which is the lowest score for the eight supportive dimensions (sections
G to M). On closer examination of table 8.11, it is interesting to note that, as far as this
section is concerned, the respondents of all three categories awarded the lowest score
to this dimension, namely top management an average score of 3,03, middle

management an average score of 3,06 and the workers an average score of 3,31,
which indicate that, on the whole, the requirements for training as a dimension are
being met, although not the ideal situation.
As far as section I (culture forming and change management – the two dimensions
covered in section I) is concerned, all three categories of respondents are more positive
towards the dimensions of culture forming and change management than they are
towards communication. From table 8.11 top management’s average score of 3,39,
middle management’s average score of 3,62 and the workers’ average score of 3,72
indicate that, in general, the requirements for culture forming and change management
(3,57) as dimensions are met. However, it is once again interesting to note that it is the
workers (3,72) who awarded the highest score to the dimensions of culture forming and
change management. A second interesting observation is that, out of the eight
supportive dimensions, the workers awarded the highest score to culture forming and
change management. A third interesting observation is that, out of the eight supportive
dimensions, middle management (3,62) awarded the second highest score to culture
forming and change management. A fourth interesting observation is that the average
score of 3,57 awarded by the three categories of respondents in this section is the
second highest of all the sections (after self-assessment, which has an average score
of 3,64). The averages indicate that, on the whole, the theoretical and practical
requirements for culture forming and change management as dimensions are met.
Figure 8.2(a) indicates clearly that middle management and the workers have a more
definite positive view in this regard than top management.
Table 8.11 shows that, as far as section J (support structures, systems and resources)
is concerned, the respondents (except top management) are less positive towards the
dimension of support structures, systems and resources than they are towards culture
forming and change management. The fact that all three categories of respondents
awarded an average score of 3,55 indicates that the requirements for support
structures, systems and resources as a dimension are being met. From the information
in table 8.11, it shows that (1) top management (3,47) awarded the second highest
score to the dimension of support structures, systems and resources, (2) the workers
(3,64) awarded the third highest score to the dimension of support structures, systems
and resources, and (3) the average score of 3,55 awarded by the three categories of
respondents is the third highest in section J, than in all the other sections. The average
3,55 indicates that, on the whole, the theoretical and practical requirements for support
structures, systems and resources as a dimension are being met.
The scores in section K (systems thinking), as shown in table 8.11, indicate that the
average score awarded by the three categories of respondents in this section is 3,44,
which is the third lowest score for any of the eight supportive dimensions (table 8.11).
Top management, with an average of 3,26, middle management with an average of
3,47 and the workers with an average of 3,58 indicate that, in general, this section
meets the requirements set for systems thinking as a dimension, although it does not
represent the ideal situation. The deficiencies of systems thinking are analysed in
paragraph 8.3.11 and summarised in paragraph 8.5.12. An interesting observation is
that the three categories of respondents are more positive about the dimension of
systems thinking than about the communication and training dimensions. Figure 8.2 (a)
clearly indicates that middle management and the workers have a more definite positive
view in this regard than top management.
Table 8.11 shows that, as far as section L (self-assessment) is concerned, all three
categories of respondents are very positive. Table 8.11 shows that, as far as self-
assessment is concerned in section L – an average score of 3,64 was awarded by the
three categories of respondents – both middle management, with an average score of
3,66, and the workers, with an average score of 3,69, have a more definite positive
view than top management with an average score of 3,57, which is just above the ideal
situation. This shows that top management does not really have as definite a positive
view in this regard as middle management and the workers. From the information in
table 8.11 it shows that (1) top management (3,57) and middle management (3,66)
awarded the highest score to the dimension of self-assessment, (2) the workers (3,69)
awarded the second highest score to the dimension of self-assessment, and (3) as far
as this section is concerned, top management and middle management also awarded
the highest score for all eight supportive dimensions to self-assessment and (4) the
average score (3,64) awarded by the three categories of respondents is higher in
section L than in any other section. It is encouraging to observe that the three
categories of respondents differ little from one another as far as meeting the
requirements set for self-assessment at air force bases are concerned. The averages

indicate that, on the whole, the theoretical and practical requirements for self-
assessment as a dimension are being met.
The picture that emerges in the case of section M (processes) is that the average score
awarded by the three categories of respondents in this section is 3,46, which is the
fourth lowest score for any of the eight supportive dimensions (table 8.11), which
indicate that, on the whole, the requirements for processes as a dimension do not
represent the ideal situation although positive, and has certain deficiencies. The
deficiencies of the dimension processes are analysed in paragraph 8.3.13 and
summarised in paragraph 8.5.14. The workers have a more definite positive outlook
with regard to this dimension than top management and middle management. Top
management awarded an average score of 3,25, middle management an average
score of 3,48 and the workers an average score of 3,64. However, it is interesting to
note that it is the workers who awarded the third highest score (3,64) to the dimension
of processes. Figure 8.1 (a) clearly indicates that the workers have a more definite
positive view in this regard than top and middle management.
From the above analysis of the average scores per section from section A to M and
with reference to table 8.12, it is clear that the lowest average scores per section were
recorded in respect of the supportive dimension ‘training’, with an average score of
3,14, and the primary dimension ‘teamwork’, with an average score of 3,32, while the
dimensions leadership and top management commitment (3,66), self-assessment
(3,64), empowerment (3,62), culture forming and change management (3,57), support
structures, systems and resources (3,55) and strategic planning (3,53) elicited relatively
high average scores (all equal to or greater than 3.5) from the respondents, which
represents the ideal situation and can be regarded as indicating a very positive attitude
amongst respondents.
An encouraging trend to note with reference to table 8.12 is that seven of the 14
dimensions, namely leadership and top management commitment (3,66), self-
assessment (3,64), empowerment (3,62), culture forming and change management
(3,57 – both dimensions covered in section I), support structures, systems and
resources (3,55) and strategic planning (3,53) were awarded average scores equal to
or higher than the level of 3,5 (≥3,5), that are regarded as being very positive (see table

8.9). Another encouraging trend is that the scores of the remaining seven of the 14
dimensions, namely processes (3,46), systems thinking (3,44), continuous
improvement (3,43), communication (3,41), customer and employee satisfaction (3,41),
teamwork (3,32) and training (3,14), are equal to or higher than 2,5 (≥2.5) but lower
than 3,5 (<3.5) which indicate that, on the whole, the requirements for these seven
dimensions are also positive and comply with the theoretical and practical requirements
of each dimension, although do not represent the ideal situation. These seven
dimensions have certain deficiencies. These deficiencies will be analysed individually
in this chapter. The average scores in table 8.12 indicate that there are no negative
views (<2,5) regarding the 14 TQM dimensions.
Table 8.12: Average scores per dimension (section) coupled to hierarchy
Dimensions Average Hierarchy
A. Leadership and top management commitment 3.66 1
B. Strategic planning 3.53 6
C. Empowerment 3.62 3
D. Teamwork 3.32 11
F. Continuous improvement 3.43 9
E. Customer/employee satisfaction 3.41 10
G. Communication 3.41 10
H. Training 3.14 12
I. Culture forming and change management 3.57 4
J. Support structures, systems and resources 3.55 5
K. Systems thinking 3.44 8
L. Self-assessment 3.64 2
M. Processes 3.46 7
A disturbing trend is the occurrence of gaps between the average scores of especially
top management, on the one hand, and the workers, on the other hand. The trend is
less visible between top management and middle management. The differences
between the average scores of top management and those of the workers cannot
simply be dismissed, as they were not expected. In fact, the opposite was to be
expected. It can possibly be argued that middle management is more positive than top
management in the way it experiences the total quality dimensions, and that there is a
strong relationship between workers and the total quality dimensions as a result of them
being influenced by middle management. No specific inferences can, however, be
made before the precise factors that gave rise to the vast difference in the scores of top
management and those of the workers have been identified. This point, amongst
others, will be the subject of the next discussion.
8.3 ITEM ANALYSIS FROM SECTIONS A TO M (SEE APPENDIX C)
In this section the results of the analysis of individual items in each section in
questionnaire two (Appendix C, sections A to M) are examined. As indicated earlier,
the methodology of the dissertation of Smit (1991:111) entitled “Die evaluering of the
arbeidsverhoudingefunksie van eerstevlaktoesighouers ten einde ‘n ingrypingstrategie
te ontwikkel” is used for this purpose. All the results are given in figures 8.3 to 8.15 and
tables 8.13 to 8.29. The focus of the discussion will be on those items for which the
average scores awarded both jointly and individually by top management, middle
management and the workers in response to questionnaire two, sections A to M, are
equal to or higher than 2,5 but lower than 3,5 which cannot be interpreted as
representing the ideal situation, although positive, as certain deficiencies have been
identified. Average scores lower than 3,5 will therefore be considered to be
representative of a situation that has certain deficiencies and that, for purposes of TQM,
does not represent a totally acceptable situation, although positive, and therefore
requires attention (see table 8.9). The focus will therefore be on the cut-off point below
3,5, in other words, on those items for which the average scores awarded by all three
categories of respondents (top management, middle management and the workers)
jointly indicate that the practical and theoretical requirements with respect to the
dimension of TQM are not ideally being met or the averages of any of the three groups
of respondents indicate individually that the theoretical and practical criteria are not
ideally being met. This approach does not imply that positive trends such as those
emerging from the processed data are simply being disregarded.
On the contrary, from the data in figures 8.3 (a) to 8.15 (a), it emerges clearly that no
average scores are below 2,5 (unacceptable situation) and that 67 (43,2%) of the 155
items in section A to M (questionnaire two, sections A to M) exceed the cut-off point of
3,5 which is very positive, 88 (56,7%) of the 155 items in section A to M exceed 2,5
which does not represent the ideal situation, although positive. An interesting

observation is that of the 88 items below 3,5, 84 items exceed the average score of
3,00 and only four items are below the average score of 3,00 and above 2,5. On the
whole there is, therefore, considerable cause for optimism. However, if TQM is to be
improved, it is essential to concentrate on problem areas in order ultimately to be in a
position to make suggestions with a view to their elimination. This topic is discussed in
chapter 9.
8.3.1 Section A: Leadership and top management commitment
In this section the effect of leadership and top management commitment to TQM at air
force bases is discussed. It has already been pointed out that leadership and top
management commitment to total quality plays an important role in the philosophy of
TQM. The result is that this section of the questionnaire represents an important facet
of TQM, the results of which hold interesting implications. This section includes 11
items (items A1 to A11) of the dimension ‘leadership and top management commitment
to TQM’ as well as the results obtained in respect of these items.
Even at first glance, figure 8.3 (a) and table 8.13 point to an important conclusion in
respect of this section. Top management, with an average score of 3,51, awarded the
lowest score to this section. In contrast to this, the workers awarded the highest score
(3,75) followed by middle management who awarded 3,71. The overall average score
of 3,66 awarded by the three categories of respondents (top management, middle
management and the workers) to the section as a whole is also higher than the
required score of 3,5 (table 8.10). This is also the highest score in all 13 sections (A to
M, see table 8.12), although the average score awarded by top management (3,51) is
just above 3,5. On the whole leadership and top management commitment to TQM is
rated very positive.
The results, in the form of average scores, in respect of these items are represented in
figure 8.3 (a), figure 8.3 (b) and in table 8.13. Figure 8.3 (a) and the data in table 8.13
indicate that only four out of 11 items in this section yielded an average score of less
than 3,5. These items (see table 8.13, indicated with the colour grey) were A1 (3,25),
A2 (3,37), A3 (3,43) and A9 (3,42).

Figure 8.3 (a): Average scores per item in respect of the dimension leadership and top
management commitment to TQM
2
2.5
3
3.5
4
4.5
5
A1 A2 A3 A4 A5 A6 A7 A8 A9 A10 A11
Items per section
Ave
rag
e sc
ore
s
Figure 8.3 (b): Average scores awarded by top management, middle management and
workers per item in respect of the dimension leadership and top management
commitment
Leadership and top management commitment
2
2.5
3
3.5
4
4.5
5
A1 A2 A3 A4 A5 A6 A7 A8 A9 A10 A11
Items per section
Ave
rag
e sc
ore
s
Top management Middle management Workers
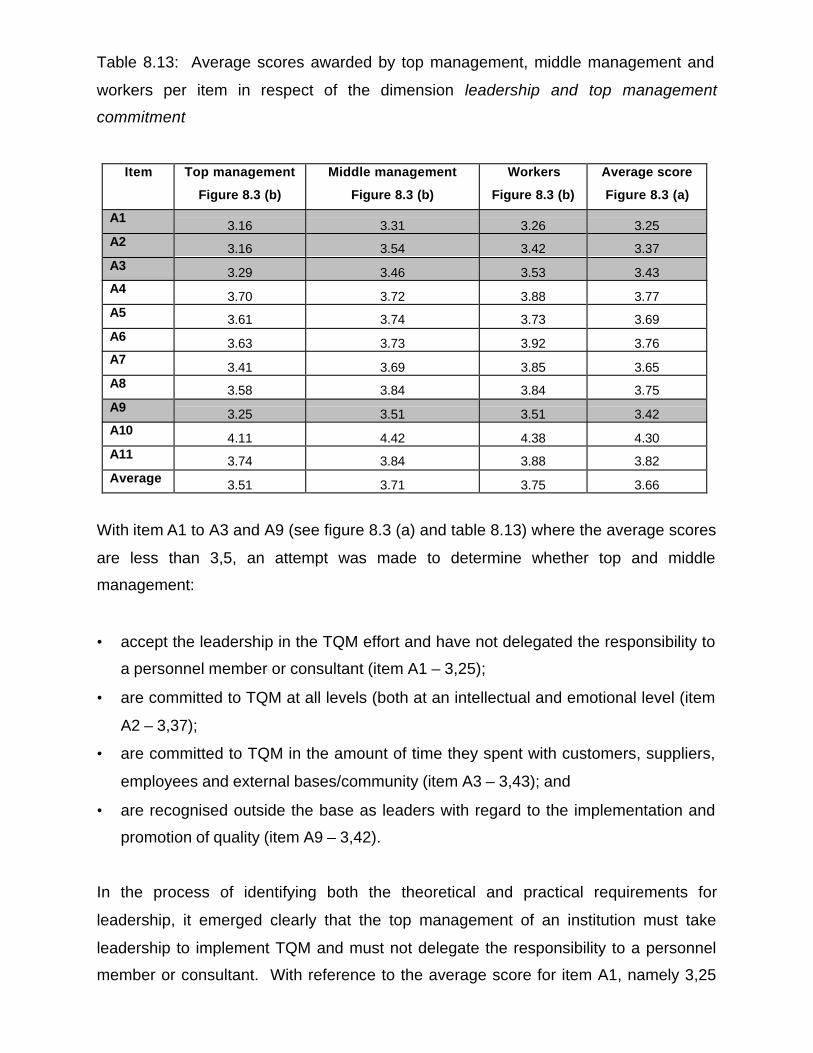
Table 8.13: Average scores awarded by top management, middle management and
workers per item in respect of the dimension leadership and top management
commitment
Item Top management
Figure 8.3 (b)
Middle management
Figure 8.3 (b)
Workers
Figure 8.3 (b)
Average score
Figure 8.3 (a)
A13.16 3.31 3.26 3.25
A2 3.16 3.54 3.42 3.37A3 3.29 3.46 3.53 3.43A4
3.70 3.72 3.88 3.77A5 3.61 3.74 3.73 3.69A6 3.63 3.73 3.92 3.76A7
3.41 3.69 3.85 3.65A8 3.58 3.84 3.84 3.75A9 3.25 3.51 3.51 3.42A10
4.11 4.42 4.38 4.30A11 3.74 3.84 3.88 3.82Average 3.51 3.71 3.75 3.66
With item A1 to A3 and A9 (see figure 8.3 (a) and table 8.13) where the average scores
are less than 3,5, an attempt was made to determine whether top and middle
management:
• accept the leadership in the TQM effort and have not delegated the responsibility to
a personnel member or consultant (item A1 – 3,25);
• are committed to TQM at all levels (both at an intellectual and emotional level (item
A2 – 3,37);
• are committed to TQM in the amount of time they spent with customers, suppliers,
employees and external bases/community (item A3 – 3,43); and
• are recognised outside the base as leaders with regard to the implementation and
promotion of quality (item A9 – 3,42).
In the process of identifying both the theoretical and practical requirements for
leadership, it emerged clearly that the top management of an institution must take
leadership to implement TQM and must not delegate the responsibility to a personnel
member or consultant. With reference to the average score for item A1, namely 3,25

(see figure 8.3 (b) and table 8.13), it indicates that the three categories of respondents
are of the opinion that top and middle management do not take the lead often enough
at air force bases in connection with the TQM effort and that responsibility for this,
which actually resides with them, is delegated to a subordinate or consultant.
Leadership by example from the top down is a prerequisite for TQM. Every manager in
the institution should be a TQM leader; they should serve as role models and be
recognised as leaders outside the institution. Leadership should establish unity of
purpose and direction of the institution for desired outcomes, which form “the driver” at
different types of institutions to implement TQM. Without leadership an institution will
not make consistent progress in a chosen direction. Top management’s direct role as
the visible force behind the TQM effort should be to have the knowledge and skills to
direct the TQM effort and they should become personally involved in total quality
activities. Top management commitment should be present in the form of policies,
organisational structure, investment and individual responsibility and authority. Top
management commitment provides the institution with the physical and institutional
realities of the institution. From an idealistic point of view, there should be no doubt that
top management must take the leadership to implement TQM. Top management’s
average score of items A1 (3,16), A2 (3,16) and A3 (3,29) show that they are not of the
opinion that they have indeed taken the leadership in the TQM effort. The inference
may be made that top management does not fulfil the basic managerial responsibility of
leading its section. A possible explanation for this may be found in figure 8.3 (a), item
A2, which has an average score of 3,37 (table 8.13, item A2) and in which top
management declares (3,16) that it is not sufficiently committed to TQM at all levels
(both at an intellectual and emotional level).
When the scores of the three categories of respondents in figure 8.3 (b) are individually
analysed, it is noticeable that middle management and the workers consistently put
forward more positive and unanimous views, in respect of all items, of top
management’s leadership and commitment to TQM. With reference to figure 8.3 (b), it
is interesting to note that with the exception of six items (A4 to A6, A8 and A10 to A11),
top management maintained relatively constant views in this particular section about its
own leadership and commitment to TQM, which is positive but does not reflect the ideal
situation. This phenomenon should be noted as it contradicts the theory related to this
specific dimension (see chapter 4, paragraph 4.2). The five items under discussion are
A1 – A3, A7 and A9, where the average scores of top management are less than 3,5.
Top management will have to pay attention to this fact as they themselves are not
convinced that they meet the ideal requirements in this regard.
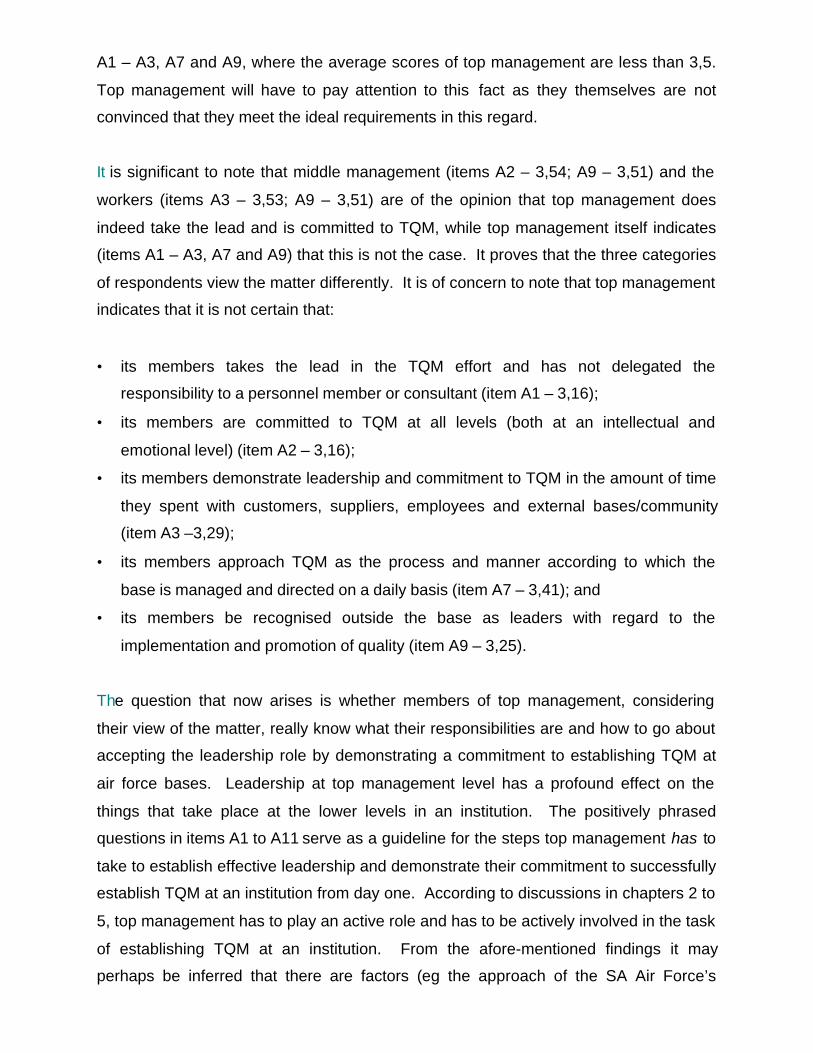
It is significant to note that middle management (items A2 – 3,54; A9 – 3,51) and the
workers (items A3 – 3,53; A9 – 3,51) are of the opinion that top management does
indeed take the lead and is committed to TQM, while top management itself indicates
(items A1 – A3, A7 and A9) that this is not the case. It proves that the three categories
of respondents view the matter differently. It is of concern to note that top management
indicates that it is not certain that:
• its members takes the lead in the TQM effort and has not delegated the
responsibility to a personnel member or consultant (item A1 – 3,16);
• its members are committed to TQM at all levels (both at an intellectual and
emotional level) (item A2 – 3,16);
• its members demonstrate leadership and commitment to TQM in the amount of time
they spent with customers, suppliers, employees and external bases/community
(item A3 –3,29);
• its members approach TQM as the process and manner according to which the
base is managed and directed on a daily basis (item A7 – 3,41); and
• its members be recognised outside the base as leaders with regard to the
implementation and promotion of quality (item A9 – 3,25).
The question that now arises is whether members of top management, considering
their view of the matter, really know what their responsibilities are and how to go about
accepting the leadership role by demonstrating a commitment to establishing TQM at
air force bases. Leadership at top management level has a profound effect on the
things that take place at the lower levels in an institution. The positively phrased
questions in items A1 to A11 serve as a guideline for the steps top management has to
take to establish effective leadership and demonstrate their commitment to successfully
establish TQM at an institution from day one. According to discussions in chapters 2 to
5, top management has to play an active role and has to be actively involved in the task
of establishing TQM at an institution. From the afore-mentioned findings it may
perhaps be inferred that there are factors (eg the approach of the SA Air Force’s

corporate headquarters to TQM) in the work situation that cause top management to
maintain these views. Top management may also experience particular circumstances
that may have a negative effect on its members’ attitude to their work and even their
attitude towards TQM.
Although items A1 to A11 were directly linked to the three categories of respondents, it
must be borne in mind that there are external factors beyond the control of air force
bases (eg the strategy and policy of the SA Air Force’s corporate headquarters) that
could cause members of top management to be dissatisfied with their work. It is
important to determine which factors (together with their frequency of occurrence and
intensity) cause top management to become negative towards their work – this matter
should be researched in more detail in a separate study.
Apart from top management’s unfavourable views in respect of items A1 – A3, A7 and
A9, it is encouraging to note that seven of the 11 items have an average score of 3,5 or
higher (see table 8.13). It is also encouraging to note that, of the 11 items with an
average score of more than 3,5, one item (A10 – 4,30) has an average score higher
than 4. The results of items A4 – A8, A10 and A11 are encouraging, as, according to
these results, all respondents agree that:
• top management clearly defines the base’s quality goals (item A4);
• top management promotes a quality culture within the base (item A5);
• top/middle management is personally involved through participation in occupational
health and safety, safety inspections, audits, accident reports, safety meetings and
personal discussions in order to form a direct and independent opinion of the TQM
philosophy to project the need for continuous improvement to other personnel
members (item A6);
• TQM is the process and manner according to which the base is managed and
directed on a daily basis (item A7);
• top/middle management encourages employees to accept ownership of problems or
opportunities in their place of work and to act pro-actively with regard to the
implementation of improvements (item A8);
• the implementation of TQM is the responsibility of both management and
employees; and

• top management establishes goals and systems to enhance customer satisfaction
(item 11).
In the case of item A10, with an average score of 4,30, all three categories of
respondents indicated that the implementation of TQM was the responsibility of both
management and the workers. This score indicates that the respondents realise that all
personnel members employed at an institution should be involved in the implementation
of TQM. However, the average scores of answers to the questions in this section
brought forward important deficiencies in respect of top management. Top
management’s unfavourable views in some respects indicate certain deficiencies in
their leadership and commitment to TQM, and compel them to take steps that will
contribute towards improving their leadership role. Not only should more emphasis be
placed on the necessity of formal training in the area of top management’s
responsibility, but the educational institutions of the SA Air Force who have the
necessary knowledge of the function and role of leadership in the philosophy of TQM
should put a greater effort into this matter. Practical guidance in respect of the
application possibilities of leadership should be provided to members of top
management by means of courses, seminars and training programmes in order to
provide them with the necessary skills to successfully apply their leadership role for
total quality control. The scores that emerged in respect of top management are
grounds for concern. As this is a basic and critical element of the task of top
management, it should receive urgent attention. On the whole the theoretical and
practical requirements for leadership and top management commitment as a dimension
are met.
8.3.2 Section B: Strategic planning
In this section the effect of air force bases’ strategic planning in respect of TQM is
discussed. As such, this section of the questionnaire represents an important facet of
the TQM approach, the results of which could have interesting implications. The
reason for this is that strategic planning should be fully integrated within the TQM
philosophy. This integration implies that strategic planning has to be institutionalised in
the TQM approach of an air force base and that it should form one integrated process.

At first glance, one draws an important conclusion from figure 8.4 (b) and table 8.14
about this section. Top management gave the lowest average score of 3,31, middle
management gave an average score of 3,56 and the workers gave an average score of
3,72, which is the highest score in this section. The average score achieved by middle
management and the workers is above 3,5, with an overall average of 3,52 for strategic
planning, which is the third highest score of the six primary dimensions (table 8.10) and
the sixth highest score (table 8.12) of all 13 sections (A to M). Therefore, on the whole
strategic planning received a very positive rating.
Figure 8.4 (a): Average scores per item with respect to the dimension strategic
planning
2
2.5
3
3.5
4
4.5
5
B1 B2 B3 B4 B5 B6 B7 B8 B9 B10 B11 B12 B13
Items per section
Ave
rag
e sc
ore
s
Figure 8.4 (b): Average scores awarded by top management, middle management and
workers to each item of the dimension strategic planning
Strategic planning
22.5
33.5
44.5
5
B1 B2 B3 B4 B5 B6 B7 B8 B9 B10 B11 B12 B13
Items per section
Av
era
ge
sc
ore
s
Top management Middle management Workers

Table 8.14: Average scores awarded by top management, middle management and
workers to each item of the dimension strategic planning
Item TopmanagementFigure 8.4 (b)
MiddlemanagementFigure 8.4 (b)
WorkersFigure 8.4 (b)
Average scoreFigure 8.4 (a)
B1 3.46 3.76 3.88 3.70B2 3.5 3.75 3.94 3.73B3 3.69 3.77 3.84 3.77B4 3.55 3.74 3.75 3.68B5 3.39 3.68 3.80 3.62B6 3.33 3.61 3.61 3.52B7 3.2 3.52 3.69 3.50B8 3 3.38 3.63 3.34B9 3.23 3.36 3.51 3.37B10 3.54 3.71 3.90 3.72B11 3.06 3.35 3.64 3.35B12 2.86 3.26 3.51 3.21B13 3.19 3.39 3.63 3.40Average 3.31 3.56 3.72 3.53
All questions in section B were set positively. This section contains 13 items (items B1
to B13) of the dimension ‘strategic planning’ as well as the results of these items. The
results in the form of average scores for these items are represented in figures 8.4 (a)
and 8.4 (b) and table 8.14.
When the results of the three categories of respondents are analysed individually in
figures 8.4 (a) and 8.4 (b) and table 8.14, it becomes clear that middle management
and the workers have a more positive and unified view of strategic planning in respect
of TQM. It is both remarkable and disturbing to note that top management displays
relatively consistent less positive views than middle management and the workers.
This view of top management is also clearly indicated in figure 8.1. It is striking that the
workers’ average scores in respect of the different items are all above the cut-off point
of 3,5. However, this is not the case with top and middle management. This
phenomenon should be noted as it is in sharp contrast with the theory of the set
dimension (see chapter 3, paragraph 3.2.5). Only four items (B2 - B4 and B10) in
respect of top management are equal or higher than 3,5 and therefore represents the
ideal situation, which is encouraging , as, according to these results, top management is
of the opinion that:

• top and middle management have developed a clear and effective strategy,
supported by a clear vision, mission and values to mobilise TQM at the various
bases (item B2 – 3,5);
• TQM is fully integrated into the bases’ strategy (vision, mission, values and
ideologies) and work processes (item B3 – 3,69);
• the mission statement has incorporated innovative strategies in order to focus on a
philosophy of total quality improvement (item B4 – 3,55); and
• the bases’ objectives are linked to customer satisfaction and world-class quality
standards (item B10 – 3,54).
Five items (B8, B9 and B11 – B13) achieved a score lower than 3,5 and therefore do
not represent the ideal situation. In the case of item B8 (with an average score of 3,34)
and item B13 (with an average score of 3,40), an attempt was made to determine
whether TQM had been implemented in all supporting functions, that are finances,
human resources, information and base support, work areas and management
principles. If these items (B8 and B13) are linked to items A1, A2, A4 – A7 [see figure
8.3 (b) of section A (leadership and top management commitment to TQM)], it becomes
clear why respondents, according to the scores in respect of B8 and B13, are of the
opinion that top management does not meet the requirements set for leadership, and,
secondly, why top management indicates in item B11 that workers do not really
understand the interface between their tasks and air force bases’ strategic plans and
objectives. According to items B8, B9, B11 - B13, the reason for this is that top
management once more indicates that its members do not properly meet the
requirements set for leadership, as in the case of section A.
With item B9 (see figure 8.4 (a) and table 8.13) an attempt was made to determine
whether top and middle management do proper planning to make provision for possible
deviations from planned objectives. In the process of identifying both the theoretical
and practical requirements for leadership, it emerged clearly that the top management
of an institution must be very thorough when planning, organising and exercising
leadership and control, in order to avoid deviations from its planned objectives. Top
management must lead the institution to achieve its objectives and is responsible for
keeping the institution in equilibrium with its environment by accommodating
environmental changes. Thorough planning, which, amongst others, implies the

formulation and maintenance of the broad objectives that will keep an institution
focussed on its fundamental objective, is top management’s responsibility. From an
idealistic point of view, there should be no doubt that top management must do
thorough planning to be able to pursue planned objectives. Top management’s
average score of 3,23 for item B9 shows that it is not of the opinion that it does indeed
do thorough planning to make provision for possible deviations from objectives. The
inference may be made that top management does not really fulfil the basic managerial
responsibility of planning for its section. A possible explanation for this may be found in
figure 8.3 (b), item A2, which has an average score of 3,37 (table 8.13, item A2), in
which top management declares that it is not sufficiently committed to TQM at all levels
(both the intellectual and the emotional level).
The average score of 3,35 awarded by respondents to item B11 (see figure 8.4 (b) and
table 8.14) indicates that respondents is of the opinion that the workers do not
understand the interface between their tasks and air force bases’ strategic plans and
objectives properly. If item B11 is linked to items A1, A2, A3 and A7 [see figure 8.3 (b)
of section A (commitment of leadership and top management to TQM)], it becomes
clear why, firstly, top management does not really meet the requirements set for
leadership, and, secondly, why respondents indicate in item B11 that workers do not
really understand the interface between their tasks and air force bases’ strategic plans
and objectives. The reason for this, according to item B11, is that top management
(3,06) and middle management (3,35) once more indicate that their members do not
properly comply with the requirements set for leadership, as in the case of section A.
The reason for this is dual, namely that top management has a relatively unfavourable
view of its own leadership and commitment to TQM and, secondly, that its members do
not continually accept responsibility for teaching workers what the interface between
their tasks and air force bases’ strategic plans and objectives is. In chapter 4,
paragraph 4.3, it is clearly stated that strategic planning is a key area of focus for top
management that provides a means of enabling all personnel within an institution to
focus on performing integrated day-to-day tasks. It is top management’s responsibility
to provide its employees, through strategic planning, with a sense of direction so that
they can understand what the interface should be between their tasks and air force
bases’ planning and strategic objectives.

The result obtained in respect of item B12 is cause for concern as top management,
with an average score of 2,86, and middle management, with an average score of 3,26,
indicate that air force bases’ suppliers, customers and workers are not all involved in
quality improvement programmes. With an average score of 3,51, air force base
workers indicate that they are involved in quality improvement programmes, while top
and middle management indicate that this is not really the case. The inference that can
be made is that there are factors present in the work situation, which have caused the
workers to have this positive view. In the case of top and middle management it may
be that no distinction was made between suppliers, customers and the workers. Top
and middle management probably only have a problem with one of the three
categories.
Upon further analysis of the results in figures 8.4 (a) and 8.4 (b) and table 8.14 it is
encouraging to note that eight items (B1 – B7 and B10) have an average weighted
score equal to or higher than 3,5. The scores awarded to item B1 (with an average
score of 3,70) indicate that TQM forms the basis of the bases’ strategy with the focus
on customer service and continuous improvement. The scores awarded to items B2
(with an average score of 3,73), B3 (with an average score of 3,77) and B4 (with an
average score of 3,68) indicate that top and middle management at air force bases do
indeed take the lead in the strategic planning effort. The reaction respondents
displayed to item B2 is an indication that top management and middle management
have developed a clear and effective strategy, supported by a clear vision, mission and
values to implement TQM at the various bases. Respondents’ reaction to item B3 can
also be accepted as an indication that TQM is fully integrated into the bases’ strategy
(vision, mission, values and ideologies) and work processes. This implies that
members at air force bases are already generally quite well informed about the
strategic advantage offered by the philosophy of TQM. It is encouraging to note that in
the case of item B4, respondents indicated (with an average score of 3,68) that the
mission statements of the various bases have incorporated innovative strategies in
order to focus on the philosophy of TQM. The result of this is that respondents realise
the value of fully integrating TQM into strategy.
The fact that (1) in respect of item B5 (average score of 3,62), respondents indicate that
a hierarchy of committees has been established that is responsible for the

implementation of TQM, and (2) in respect of item B6 (average score of 3,52),
respondents indicate that there is a clear relationship between air force bases’ long-
term objectives and the TQM strategy, and (3) in respect of item B7 (average score of
3,50), respondents indicate that bases have developed a detailed long-term plan to
implement TQM, indicates that total quality forms the core of air force bases’ strategy,
with the focus on service delivery and long-term success. It is also encouraging to note
that, in the case of item B10, the respondents indicate (with an average score of 3,72)
that air force bases’ objectives are linked to world-class quality standards. The above
statement confirms that strategic planning is applied to the full advantage of air force
bases.
It is encouraging to note that a significant number of respondents consistently indicated
that thorough strategic planning is done. On the whole the theoretical and practical
requirements for strategic planning as a dimension are met.
8.3.3 Section C: Empowerment
In this section the effect of empowerment at air force bases is discussed. As such, this
section of the questionnaire represents, just like sections A and B, an important facet of
the TQM approach – the results of which contain important implications. The reason for
this statement is that (as already discussed in chapter 4, paragraph 4.4) empowerment
is a difficult dimension of TQM, as it is the end result of various aspects applied in an
institution, such as the leadership of top management, strategic planning,
communication, teamwork and culture change/forming.
At first glance, one draws an important conclusion from figure 8.5 (b) and table 8.15
about section C. Top management achieved the lowest average score of 3,57, while
middle management achieved an average score of 3,62 and the workers an average
score of 3,66, which is the highest score in this section. The average score achieved
by the three categories of respondents is above 3,5 with an overall average of 3,62 for
empowerment, which is the second highest score of the six primary dimensions (table
8.10) and the third highest score (table 8.12) of all 13 sections (A to M). Therefore, on
the whole empowerment has been awarded a very positive rating.

Figure 8.5 (a): Average scores per item with respect to the dimension empowerment
2
2.5
3
3.5
4
4.5
5
C1 C2 C3 C4 C5 C6 C7 C8 C9 C10 C11 C12 C13 C14 C15 C16
Items per section
Ave
rag
e sc
ore
s
Figure 8.5 (b): Average scores awarded by top management, middle management and
workers to each item of the dimension empowerment
Empowerment
2
2.5
3
3.5
4
4.5
5
C1 C2 C3 C4 C5 C6 C7 C8 C9 C10 C11 C12 C13 C14 C15 C16
Items per section
Ave
rag
e sc
ore
s
Top management Middle management Workers
With reference to table 8.10 with an average score of 3,57, top management, in
comparison to their responses in other sections, has awarded the highest score to this
section. Middle management with an average score of 3,62, has in comparison to their
scores in the other sections, awarded the second highest score to section C, while the
workers with an average score of 3,66, in comparison to their scores in the other
sections, have awarded it the third highest score. The average scores for this section
for all three categories of respondents are also above the required score of 3,5 [(see
figure 8.1 (a)], with a general average of 3,62 for empowerment. An interesting

observation made from figure 8.1 (a), is that top management, middle management and
the workers are relatively in harmony as far as their views of empowerment are
concerned.
Table 8.15: Average scores awarded by top management, middle management and
workers to each item of the dimension empowerment
Item TopmanagementFigure 8.5 (b)
Middle managementFigure 8.5 (b)
WorkersFigure 8.5 (b)
Average scoreFigure 8.5 (a)
C1 2.66 2.73 2.91 2.77C2 3.71 3.67 4.04 3.81C3 3.29 3.39 3.44 3.37C4 3.82 4 4.11 3.98C5 3.87 3.77 3.70 3.78C6 3.68 3.63 3.54 3.62C7 3.64 3.54 3.55 3.58C8 3.26 3.49 3.45 3.40C9 3.85 3.83 3.93 3.87C10 3.82 3.51 3.30 3.54C11 3.49 3.61 3.48 3.52C12 3.33 3.61 3.57 3.51C13 4.42 4.39 4.55 4.46C14 3.35 3.46 3.62 3.50C15 3.35 3.41 3.53 3.43C16 3.63 3.84 3.92 3.79Average 3.57 3.62 3.66 3.62
This section includes 16 items (items C1 to C 16) of the dimension ‘empowerment’, as
well as the results of the mentioned items. The results as average scores in respect of
these items are depicted in figure 8.5 (a), figure 8.5 (b) and table 8.15. Figure 8.5 (a)
and the data in table 8.15 indicate that only four out of 16 items in this section rendered
an average score for the three categories of respondents of lower than 3,5. The items
are C1 (average score of 2,77), C3 (average score of 3,37), C8 (average score of 3,40)
and C15 (average score of 3,43).
The purpose of item C1 was to determine whether all employees at air force bases
understand the TQM philosophy. According to the discussion in chapter 2 (paragraph
2.3.3), the principles of TQM form the basis for the TQM philosophy and it is important
that employees understand these principles. In figure 8.5 (b) and table 8.15 it is clearly
indicated that all three categories of respondents are noticeably in harmony as far as
this specific item is concerned. With average scores of 2,66 (top management), 2,73
(middle management) and 2,91 (workers) not one of the three categories of
respondents indicates that employees really understand the TQM philosophy. This fact
brings alarming data to the fore. With reference to table 8.12, it is clear that the
problem lies with training (see paragraph 8.3.8), as training was awarded the lowest
score of all 14 dimensions.
Item C1 rendered the lowest average score of all items in the 13 sections. The
question that now arises is whether (1) workers, in light of their poor knowledge of the
TQM philosophy, really know what their responsibilities in respect of this management
approach are, and (2) really know how to go about to understand the TQM philosophy.
The result of item C1 lets the question arise as to whether under these circumstances
there can be any talk of effective empowerment. Interestingly enough, training plays an
important role in respect of item C1 where it was indicated that the workers do not really
understand the TQM philosophy and it also serves as a possible explanation as to why
the respondents doubt item C1. With the average score achieved in respect of C1 not
being ideal, even though positive, it is clear that bases do not have a proper training
programme for TQM for all workers. The responses are in no way encouraging, as all
three categories of respondents are convinced that employees at bases do not
understand the TQM philosophy properly. It is clear that the TQM approach can be
seriously hampered should it be true that no proper training programme for TQM exists
at air force bases. Without such a training programme it should be accepted that the
TQM approach cannot be applied successfully. Item C8 with an average score of 3,40
also indicates that TQM is not actively promoted at all management levels at bases.
Just as in the case of item C1, the problem encountered in respect of item C8 can be
described as a lack of training as well as a lack of leadership and top management
commitment (see section A, items A1 to A11).
The purpose of item C3 was to determine whether all employees at air force bases are
being empowered (that is being given ownership and responsibility for processes) to
reach their full potential. In chapter 4 (paragraph 4.4) it was stated that empowerment
is one of the most important dimensions in the TQM philosophy and that employees
have to understand the principles of empowerment. In figure 8.5 (b) and table 8.15 it is
clearly indicated that all three categories of respondents are remarkably in harmony as

far as this specific item is concerned. With average scores of 3,29 (top management),
3,39 (middle management) and 3,44 (workers) not one of the three categories of
respondents indicated that employees are really empowered to reach their full potential.
This fact brings distressing data to the fore. Employees should be empowered as they
are at the centre of any TQM approach, involved in the planning, managing and
improving of processes and serving customers. Employees have to be involved from
day one to transform to the TQM philosophy and employees should be empowered to
encourage innovation and creativity at all levels of the workforce.
The average score achieved in respect of item C15 (see figure 8.5 (b) and table 8.15)
indicates that top management, with an average score of 3,35, and middle
management, with an average score of 3,41, are not convinced that they delegate
decision making authority to lower levels. Top management even admits that they do
not delegate decision-making authority to lower levels. Workforce empowerment is vital
to the creation of a TQM process. Workers want to be a part of their air force base and
help with the improvement thereof. Empowerment supports the TQM process as
employees at all levels have the responsibility for and authority to make decisions that
affect them and their work teams. Institutions cannot effectively move decision making
to the level where most of the work is done unless those doing the work have access to
the necessary data and are skilled at making fact-based decisions. Top management
should educate middle management, lower management and employees in decision-
making processes by using, for example, group decision making, brainstorming, self-
directed teams and cross functional teams to ensure rational decisions. Empowerment
is a crucial part of cultural change that brings the decision making process down to the
point where problems are most visible. In order to be empowered to make decisions
regarding their work, employees, regardless of organisational level, must understand
and know information relevant to the performance of their organisations. However, item
C12 (with an average of 3,51) indicates the opposite to the opinion of top management
and middle management, where it is indicated that suggestions from quality circles,
task groups and/or individuals at air force bases are welcomed and, if feasible, even
implemented – thereby indicating that middle management and workers are involved in
the decision-making process.

It is also encouraging to note that top management, with the exception of four items (C1
– 2,66, C3 – 3,29, C8 – 3,26 and C15 –3,35), relatively consistently have positive views
about empowerment (which was not the case with the two previous dimensions which
related to the leadership and top management commitment and strategic planning to
TQM). The positive approach displayed by the three categories of respondents in
respect of this section implies that air force bases’ members feel that they receive
enough empowerment to be in charge of their own destiny, by being directed as to what
to do, being given the resources with which to do the task and then being allowed to get
on and do it.
On further analysis of the results in figure 8.5 (a) and (b) and table 8.15 it is
encouraging to note that 12 of the 16 items have an average weighted score of 3,5 and
higher. From the 12 items >3,5 it is also encouraging to note that one item has
achieved an average of more than four. In item C13 with an average of 4,46 (see table
8.15) it is especially remarkable that all three categories of respondents have indicated
that they feel fully responsible for the work that they do and that they believe that their
work is important for the success of the air force base.
It is further encouraging to note that respondents clearly indicate in item C2 with an
average score of 3,81, that the acceptance of the principles of TQM at air force bases
depends on leadership, knowledge, experience and adaptability of top management.
The respondents therefore clearly indicate that they understand the important principle,
as discussed in chapter 2, paragraph 2.3.3, namely “Top management is involved and
gives direction from the highest level of the institution by being clearly visible in all
internal and external quality aspects and by clearly demonstrating their commitment to
quality improvement. TQM can only be implemented meaningfully if it is supported and
accepted by top management.”
The response of respondents to item C4, with an average score of 3,98 (see table
8.15), can also be regarded as being encouraging as it indicates that the personnel at
air force bases are encouraged to deliver products/services of a high quality. Item C5
with an average score of 3,78 emphasises that the respondents feel that the mentioned
principle is adhered to in that management at air force bases offers support in the
achievement of individual objectives. To further strengthen the results of item C5, the

respondents confirm in item C6, with an average score of 3,62, that recognition and
encouragement are given to personnel at air force bases for all contributions rendered
in respect of quality improvement. The respondents indicate in item C11, with an
average score of 3,52, that the mentioned recognition and support are further
strengthened in that the suggestions they provide, whether by means of quality circles,
task groups and/or individual, are welcomed and that the suggestions are implemented,
if at all possible. The respondents indicate in item C12, with an average score of 3,51,
that strong feelings of trust exist between them and management.
The response of respondents to item C9, with an average score of 3,87 (see table
8.15), is also an indication of the fact that the personnel at air force bases realise that
employees have to be empowered in order to be more creative and innovative as far as
their work is concerned. Personnel should be empowered by allowing them to accept
ownership and responsibility for their work activities. The necessity and value of
empowering employees at an institution are emphasised in this way. The fact that
respondents with an average score of 4,46 (see table 8.15) in respect of item C13,
indicating that they feel fully responsible for the work that they do and believe that their
work is important for the success of the air force base, is an indication of the fact that
the employees of air force bases are generally already well empowered. To strengthen
the mentioned results, (1) item C7, with an average score of 3,58, indicates that
respondents feel that their direct seniors give recognition for inputs provided, and (2)
item C10, with an average score of 3,54, indicate that respondents feel that they are
recognised during the decision-making process.
Item C16, with an average score of 3,79, further indicates that the requirements for
empowerment are met in that (1) the respondents clearly indicate that their jobs have
been designed to provide them with the knowledge, skills, resources and support to
achieve quality goals and (2) that their equipment is sufficient to perform their task
effectively as clearly indicated in item C14 with an average score of 3,50.
It is encouraging to note that a significant number of respondents continuously indicate
that the dimension of empowerment has been applied thoroughly. As a whole the
theoretical and practical requirements for empowerment as a dimension are met with

the exception of deficiencies in respect of training as far as a training programme to
better understand the TQM philosophy is concerned.
8.3.4 Section D: Teamwork
In this section the effect of the teamwork at air force bases with regard to TQM is
discussed. As previously noted, the average score of all three categories of
respondents has rendered the lowest average score (3,32) of all six primary dimensions
(see table 8.10) and the second lowest average score of the 13 sections (A to M, see
table 8.12). The reasons for this will be discussed in greater detail in this section with
the focus on the scores of the individual items. Top management, with an average
score of 3,21, has in comparison to their responses in the other sections of A to F,
awarded the lowest score to this particular section. Middle management, with an
average score of 3,34, has in comparison to their responses in the other sections from
A to F, awarded the lowest score to this section, while the workers, with an average
score of 3,40, in comparison to their responses in the other sections from A to F, have
awarded the lowest score. Generally speaking, although teamwork does comply with
the requirements set by TQM, respondents did not rate it very positively.
This section includes 13 items (items D1 to D13) of the dimension ‘teamwork’ as well as
the results of the aforementioned items. The results as average scores in respect of
these items are depicted in figure 8.6 (a), figure 8.6 (b) and table 8.16. From figure 8.6
(a) and the information in table 8.16, it shows that 10 of the 13 items in this section
rendered an average score in respect of the three categories together of lower than 3,5.
The items are D2 (3,39), D3 (3,32), D4 (3,33), D5 (3,34), D6 (3,05), D7 (3,28), D8
(3,41), D9 (3,20), D11 (3,21) and D13 (2,99), which do not represent the ideal situation
as will subsequently be discussed.
With item D2 (with an average score of 3,39) and item D3 (with an average score of
3,32) an attempt was made to determine whether (1) task groups are formed at bases
to manage matters relating to quality and value-adding aspects, and (2) if tasks groups
at the bases are continuously involved in determining measures for internal/external
customer satisfaction. It is clear that for all three categories of respondents for both
items D2 and D3 (see table 8.16) task groups are not formed at bases and are not

continuously involved in determining measures for internal/external customer
satisfaction. If air force bases want task groups to function successfully, it is essential
that they invest in the self-development, education, training and development of each
individual in the task team. In order to function successfully, new roles must be
defined, training be provided on how to function effectively within a work team,
boundaries for responsibilities be set and personal needs be taken into consideration.
Employees will systematically begin to understand the meaning of objectives to improve
quality at the air force base and they will become more involved in setting objectives.
Figure 8.6 (a): Average scores per item in respect of the dimension teamwork
2
2.5
3
3.5
4
4.5
5
D1 D2 D3 D4 D5 D6 D7 D8 D9 D10 D11 D12 D13
Items per section
Ave
rag
e sc
ore
s
Figure 8.6 (b): Average scores awarded by top management, middle management and
workers to each item of the dimension teamwork
Teamwork
2
2.5
3
3.5
4
4.5
5
D1 D2 D3 D4 D5 D6 D7 D8 D9 D10 D11 D12 D13
Items per section
Ave
rag
e sc
ore
s
Top management Middle management Workers

Table 8.16: Average scores awarded by top management, middle management and
workers to each item of the dimension teamwork
Item TopmanagementFigure 8.6 (b)
MiddlemanagementFigure 8.6 (b)
WorkersFigure 8.6 (b)
Average scoreFigure 8.6 (a)
D1 3.542 3.68 3.39 3.54D2 3.38 3.39 3.39 3.39D3 3.19 3.31 3.46 3.32D4 3.10 3.36 3.54 3.33D5 3.19 3.33 3.49 3.34D6 2.70 3.17 3.28 3.05D7 3.24 3.29 3.30 3.28D8 3.39 3.38 3.45 3.40D9 3.03 3.2 3.38 3.20D10 3.49 3.60 3.54 3.54D11 3 3.21 3.43 3.21D12 3.5 3.50 3.53 3.51D13 3.03 2.96 3 2.99Average 3.21 3.34 3.40 3.32
In item D4 with an average score of 3,33, top management, with an average score of
3,10, and middle management, with an average score of 3,36, indicate that air force
bases are not working together as a team with their suppliers, customers and
employees in order to improve quality standards. Workers (3,54) do not really consider
it to be a problem. The expectation was that especially top management would have
indicated that they place greater emphasis on teamwork with suppliers, customers and
employees. From an ideal point of view, there should be no doubt that top
management should play an important role to improve teamwork with suppliers,
customers and employees to improve quality standards.
In item D5, with an average score of 3,34, all three categories of respondents indicate
that recognition and encouragement for contributions from the personnel of air force
bases in respect of quality improvement do not focus on teamwork, which supports item
D6 to a certain extent. The expectation was that top management especially would
have indicated that they place greater emphasis on team recognition rather than on
individual recognition. The inference that can be made is that the focus is on
teamwork, but that more attention should be paid to recognition in team context.
However, these deficiencies are not unbridgeable and can be eliminated easily. Should
this be done, team recognition by top management should be treated on its merits.
With item D6 an attempt was made to determine whether top management is more in

favour of team recognition than individual recognition. Astonishingly, figure 8.6 (b) and
table 8.16 clearly indicate that all three categories of respondents are unanimous as far
as this item is concerned, with an average score of 3,05. However, an average score
for top management of 2,70, for middle management of 3,17 and for the workers of
3,28 raise the fact that both top/middle management and the workers are of the opinion
that top management is not in favour of team recognition which does not represent the
ideal situation as far as TQM is concerned.
The results of item D7 (average score of 3,28) indicate that teamwork at air force bases
is of such a nature that the performance of teams at air force bases will not improve
without the assistance of higher authority. This is proof of the fact that the views of all
three categories of respondents are basically the same. Item D8, with an average
score of 3,40, clearly indicates that top management (3,39), middle management (3,38)
and the workers (3,45) are of the opinion that the performance of teams and their
recommendations are not easily accepted. If this item is compared to item C11, with an
average score of 3,52, item C11 indicates surprisingly and contradictory to item D8 that
all three categories of respondents agree that suggestions from quality circles, task
groups and/or individuals at air force bases are welcomed and implemented, if at all
practical. Even though it is difficult to determine whether recommendations are freely
accepted and implemented, the assumption can possibly be made – based on the
responses to item C11 – that recommendations and suggestions are accepted.
Item D9, with an average score of 3,20, further indicates that the requirements of
teamwork at air force bases require urgent attention, as (1) the respondents clearly
indicate that interdepartmental relationships at air force bases are of such a nature that
they do not really support quality improvement, (2) that
departments/sections/subsections at air force bases are not really actively involved in
TQM projects as indicated in item D11 with an average score of 3,21, and (3) that no
real team spirit prevails amongst all ranks at air force bases as indicated in item D13
with an average score of 2,99.
On further analysis of the results indicated in figures 8.6 (a) and (b), it is of concern that
only three of the 13 items rendered an average score of 3,5 and higher. It is a relieve
to note the results of the three items D1, D10 and D12, shows that:

• an atmosphere of cohesion exists at the various sections of air force bases
according to item D1;
• according to item D10, employees in sections at the air force bases work closely
together as a team in order to coordinate work and improve quality (although top
management (3,49) is not so sure that sections do in fact work closely together);
and
• according to item D12 workers believe that apart from their specific job, they
participate in other activities through teams to help achieve quality goals at bases.
The preceding discussion should clearly indicate that the items in this section are
closely related and that a low score in just one of the items in this section can raise
questions as to the performance of teamwork at air force bases. The scores achieved
by top management in this regard (see table 8.16: D2 – 3,37, D3 – 3,19, D4 – 3,10, D5
– 3,19, D6 – 2,70, D7 - 3,24, D8 - 3,39, D9 – 3,03, D10 – 3,49; D11 – 3,00 D13 - 3,03)
compel top management to review their view of teamwork. Teams and teamwork can
be a very powerful management strategy to improve competitive advantage and,
together with people empowerment, form the basis of managing the resources or
assets of an institution properly. On the whole the theoretical and practical
requirements for teamwork as a dimension are met.
8.3.5 Section E: Continuous improvement
In this section the effect of continuous improvement at air force bases in respect of
TQM is discussed. As already noted, the average score of the three categories of
respondents for this section, as indicated in table 8.17, rendered the third lowest
average score (3,43) of the six primary dimensions in sections A to F. The reasons for
this will be determined in greater detail in this section when the scores of the individual
items are analysed. Table 8.10 indicates that top management (3,25), in comparison to
their responses in sections A to F, has awarded the second lowest score to this section.
Middle management (3,42), in comparison to their scores in sections A to F, has
awarded the third lowest score, while the workers (3,63) in comparison to their scores
in sections A to F, have awarded the third lowest score. Only the workers’ average
scores for the section are above the required score of 3,5 (see table 8.17) with a
general average of 3,63 for continuous improvement. Generally speaking, continuous

improvement does meet the theoretical and practical requirements, although it does not
represent the ideal situation.
This section includes 13 items (items E1 to E13) of the dimension ‘continuous
improvement’ as well as the results of these items. The results as average scores in
respect of these items are depicted in figure 8.7 (a), figure 8.7 (b) and table 8.17. From
figure 8.7 (a) and the information in table 8.17 it shows that 5 of the 13 items in this
section have rendered an average score for all three categories of respondents of lower
than 3,5. The items are numbers E6 with an average of 3,36, E7 with an average of
3,40, E9 with an average of 3,46, E11 with an average of 3,05 and E12 with an average
of 3,21.
When the results of the three categories of respondents are analysed individually in
figures 8.7 (a) and 8.7 (b) and table 8.17, it is noticeable that middle management and
the workers continuously have more positive and unanimous views of continuous
improvement in respect of TQM. It is significant and disconcerting to note that top
management has rather consistently less positive views than middle management and
the workers. This point of view of top management is also clearly indicated in figure
8.1. Surprisingly the workers’ average scores in respect of the different items are all
above the cut-off point of 3,5 except for two items, namely E11 and E12. This is,
however, not the case with top and middle management. This phenomenon should be
noted, as it is contradictory to the dimension’s theory (see chapter 4, paragraph 4.6).
Another fact that is alarming and of concern, is that all 13 items (E1 – E13) in respect of
top management fall below the required 3,5 and therefore does not represent the ideal
situation.
On further analysis of figure 8.7 (a) and (b) and table 8.17, the aforementioned rating is
confirmed in that all three categories of respondents in item E9, with an average score
of 3,46, indicate that all TQM improvement projects implemented at air force bases do
not really render good results. With item E4, with an average score of 3,50, an attempt
was made to determine whether the improvements made at air force bases with regard
to service rendering are quantified and measured.
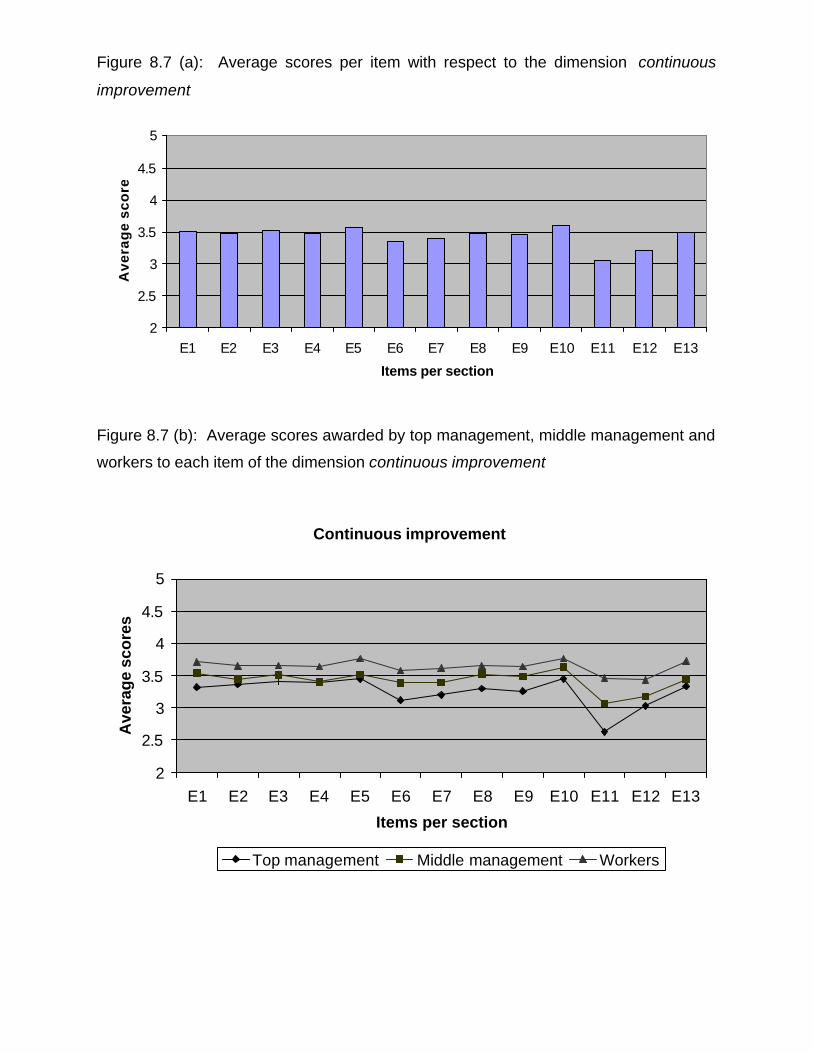
Figure 8.7 (a): Average scores per item with respect to the dimension continuous
improvement
2
2.5
3
3.5
4
4.5
5
E1 E2 E3 E4 E5 E6 E7 E8 E9 E10 E11 E12 E13
Items per section
Av
era
ge
sc
ore
s
Figure 8.7 (b): Average scores awarded by top management, middle management and
workers to each item of the dimension continuous improvement
Continuous improvement
2
2.5
3
3.5
4
4.5
5
E1 E2 E3 E4 E5 E6 E7 E8 E9 E10 E11 E12 E13
Items per section
Ave
rag
e sc
ore
s
Top management Middle management Workers
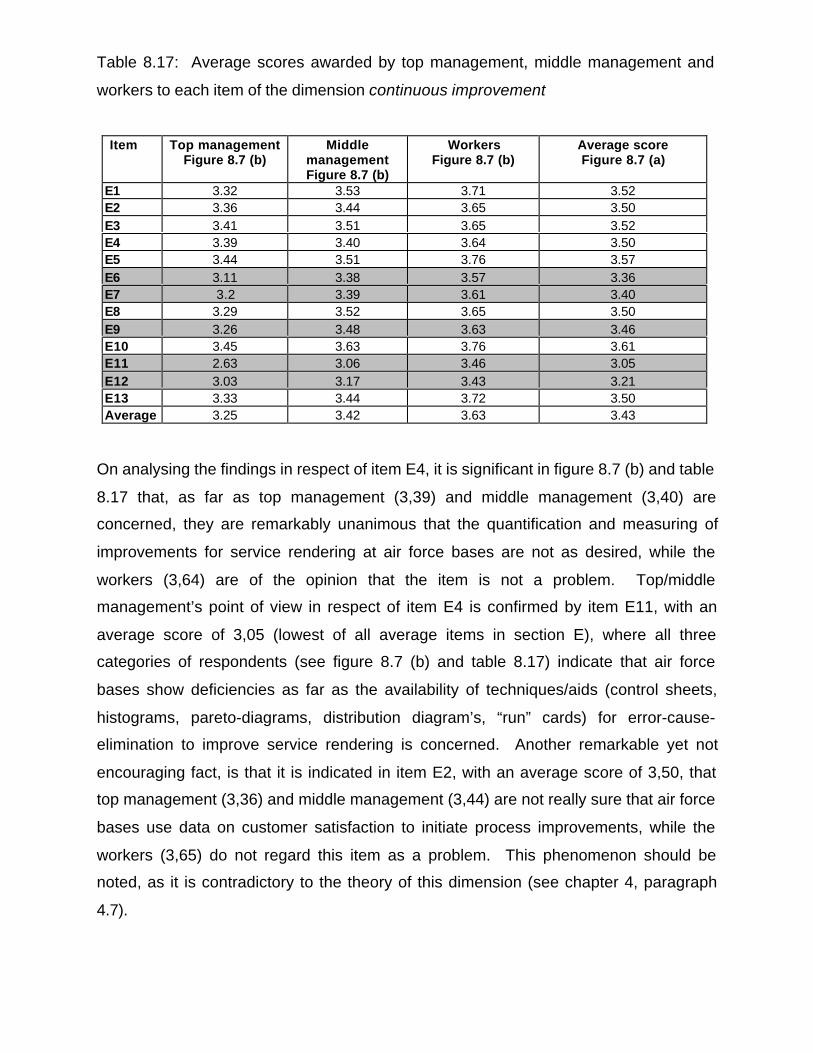
Table 8.17: Average scores awarded by top management, middle management and
workers to each item of the dimension continuous improvement
Item Top managementFigure 8.7 (b)
MiddlemanagementFigure 8.7 (b)
WorkersFigure 8.7 (b)
Average scoreFigure 8.7 (a)
E1 3.32 3.53 3.71 3.52E2 3.36 3.44 3.65 3.50E3 3.41 3.51 3.65 3.52E4 3.39 3.40 3.64 3.50E5 3.44 3.51 3.76 3.57E6 3.11 3.38 3.57 3.36E7 3.2 3.39 3.61 3.40E8 3.29 3.52 3.65 3.50E9 3.26 3.48 3.63 3.46E10 3.45 3.63 3.76 3.61E11 2.63 3.06 3.46 3.05E12 3.03 3.17 3.43 3.21E13 3.33 3.44 3.72 3.50Average 3.25 3.42 3.63 3.43
On analysing the findings in respect of item E4, it is significant in figure 8.7 (b) and table
8.17 that, as far as top management (3,39) and middle management (3,40) are
concerned, they are remarkably unanimous that the quantification and measuring of
improvements for service rendering at air force bases are not as desired, while the
workers (3,64) are of the opinion that the item is not a problem. Top/middle
management’s point of view in respect of item E4 is confirmed by item E11, with an
average score of 3,05 (lowest of all average items in section E), where all three
categories of respondents (see figure 8.7 (b) and table 8.17) indicate that air force
bases show deficiencies as far as the availability of techniques/aids (control sheets,
histograms, pareto-diagrams, distribution diagram’s, “run” cards) for error-cause-
elimination to improve service rendering is concerned. Another remarkable yet not
encouraging fact, is that it is indicated in item E2, with an average score of 3,50, that
top management (3,36) and middle management (3,44) are not really sure that air force
bases use data on customer satisfaction to initiate process improvements, while the
workers (3,65) do not regard this item as a problem. This phenomenon should be
noted, as it is contradictory to the theory of this dimension (see chapter 4, paragraph
4.7).

The average score of 3,21 awarded by the three category respondents to item E12 (see
table 8.17) indicates that respondents are of the opinion that workers do not really
recognise and understand TQM improvement efforts and that they cannot react on their
own in order to continuously improve their work performance. Item E12 correlates with
the average score of 3,35 awarded by respondents to item B11 (see figure 8.4 (b) and
table 8.14) which indicates that respondents are of the opinion that the workers do not
really understand the interface between their tasks and air force bases’ strategic plans
and objectives.
With reference to the unfavourable responses in items E11 and E12 and the positive
responses in items E1 to E5, the inference can possibly be made that, although air
force bases use the feedback provided by customers to improve work at air force bases
and although the workers understand the TQM improvement attempts, air force bases
show deficiencies in respect of the availability of techniques, aids, rating matrices and
processes to achieve continuous improvement in service rendering. In chapter 4,
paragraph 4.6.4.1, it is clear that techniques should be used to quantify how successful
previous activities were. It is important that data be provided and analysed to indicate
primary problem areas. A typical advantage is that in this way information, for example,
that is required to compile a realistic budget and to assist management in preparing
cost analysis for new products and services can be provided. Quality evaluations also
serve as an important aid for management to identify areas where there is a need for
continuous improvement. Various data gathering and analysis techniques exist, such
as for example benchmarking (paragraph 4.6.3), that employees can use to gather and
analyse data in order to ensure continuous improvement of quality performance. What
is further remarkable, yet not encouraging, is that in item E6, with an average score of
3,36, top management (3,11) and middle management (3,38) are not sure that active
programmes exist at the various bases to obtain comparative benchmarking in respect
of all applicable functions and services from the best SA Air Force bases, while the
workers (3,57) feel that the item is not a problem. This phenomenon should be noted
as it is contradictory to the theory of the dimension (see chapter 4, paragraph 4.6.3).
What is also noticeable yet not encouraging, is that it is clear from item E7, with an
average score of 3,40, that top management (3,20) and middle management (3,39) are
not sure that air force bases use benchmarking to determine performance standards at
strategic level with due consideration for priorities such as customer satisfaction and

employee motivation, while the workers (3,61) are of the opinion that this item does not
present a problem. Air force bases must apply benchmarking management as a
continuous process of measurement and evaluation/comparison of the institution’s
products, services and processes to those of their strongest competitors or those who
are regarded as leaders in their specific fields.
On further analysis of the results in figure 8.7 (a) and (b) and table 8.17, it is
encouraging, however to note that eight of the 13 items have an average score of 3,5
and higher. What is encouraging from this, is the fact that air force bases, despite the
views of respondents on items E6 and E7 as indicated in the previous paragraph, in
general indeed, attempt to ensure continuous improvement by applying benchmarking.
It is encouraging that the eight items E1 – E5, E8, E10 and E13, each has an average
score of 3,5 and higher which is indicative of the fact that attempts are made to apply
benchmarking meaningfully to ensure continuous improvement. The results of items
E1 – E5, E8, E10 and E13 indicate that:
• feedback received from customers is used continuously to improve the work that
they do (item E1);
• data on customer satisfaction is used to initiate process improvement (item E2);
• change initiatives are driven by customer needs and expectations (item E3);
• improvements made in respect of service rendering are quantified and measured
(item E4);
• the bases provide strategically for a continuous process of comparison/evaluation
(benchmarking) of systems/services and processes compared to those of the best
bases in the SA Air Force (item E5);
• the bases follow a TQM approach that evaluates and/or audits the performance of
processes and systems (item E8);
• the bases formal commitment to quality refers to striving for world-class results and
continuous improvements in processes and systems (item E10); and
• the bases perform performance measurements to measure excellence (item E13).
Generally speaking, continuous improvement has been rated positively in this section
and that it meets the requirements set by the theory and practice (see chapter 4,
paragraph 4.6), with due consideration of less favourable responses in respect of items

E6, E7, E9, E11 and E12. The average scores on the questions set in this section also
brought to light important deficiencies in respect of top management and middle
management’s views on continuous improvement, in that all top management’s item
averages (E1 – E13) and eight of the 13 items of middle management’s item averages
are rated at less than 3,5, which do not reflect an ideal situation. In light of the
importance of continuous improvement, the scores of top management and middle
management reflected in this area, compel top management to pay serious attention to
the dimension involved.
8.3.6 Section F: Customer and employee satisfaction
In this section the effect of air force bases’ customer and employee satisfaction with
respect to TQM is discussed. As such, this section of the questionnaire represents an
important facet of the TQM approach, the results of which could have interesting
implications. The reason for this is that the TQM approach should focus on customer
and employee satisfaction as figure 3.1 in chapter 3 indicates. Customer and employee
satisfaction is the driving force behind all total quality improvement efforts. Chapter 4,
paragraph 4.7 clearly indicates that customers and employees play the primary role to
successfully implement TQM within an institution.
At first glance, one draws an important conclusion from figure 8.8 (b) and table 8.18
about this section. Top management achieved the lowest average score of 3,26,
middle management achieved an average score of 3,40 and the workers an average
score of 3,58, which is the highest score in this section. The average score allotted by
the workers is above the 3,5 with an overall average of 3,41 for customer and employee
satisfaction, which is the second lowest score out of the six primary dimensions (table
8.10) and the third lowest score (table 8.12) of all 13 sections (A to M). On the whole
customer and employee satisfaction has been rated positively in this section, although it
does not represent the ideal situation.
The reader will notice that all the questions in section F were formulated in a positive
vein. This section contains 13 items (items F1 to F13) of the dimension ‘customer and
employee satisfaction’ as well as the results of these items. The results in the form of
average scores for these items are represented in figures 8.8 (a) and 8.8 (b) and table

8.18. When the results of the three categories of respondents are analysed individually
in figures 8.8 (a) and 8.8 (b) and table 8.18, it is noted that the workers continuously
indicate more positive and unanimous views of customer and employee satisfaction in
respect of TQM. It is remarkable and of concern that top management and middle
management display relative consistently less positive points of view than the workers.
This point of view of top management is also clearly indicated in figure 8.1. It is
remarkable that the workers’ total average score (3,58) in respect of the different items
are above 3,5.
Figure 8.8 (a): Average scores per item with respect to the dimension customer and
employee satisfaction
2
2.5
3
3.5
4
4.5
5
F1 F2 F3 F4 F5 F6 F7 F8 F9 F10 F11 F12 F13
Items per section
Ave
rag
e sc
ore
s
Figure 8.8 (b): Average scores awarded by top management, middle management and
workers to each item of the dimension customer and employee satisfaction
Customer/employee satisfaction
2
2.5
3
3.5
4
4.5
F1 F2 F3 F4 F5 F6 F7 F8 F9 F10 F11 F12 F13
Items per section
Av
era
ge
sc
ore
s
Top management Middle management Workers
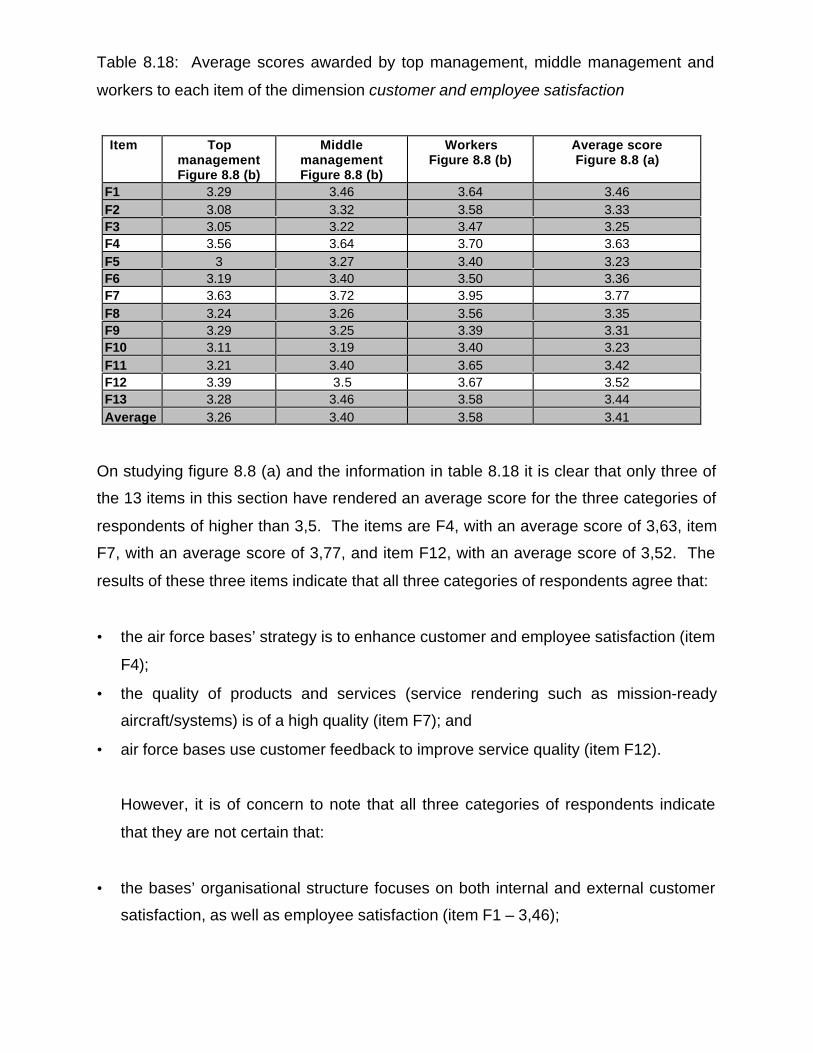
Table 8.18: Average scores awarded by top management, middle management and
workers to each item of the dimension customer and employee satisfaction
Item TopmanagementFigure 8.8 (b)
MiddlemanagementFigure 8.8 (b)
WorkersFigure 8.8 (b)
Average scoreFigure 8.8 (a)
F1 3.29 3.46 3.64 3.46F2 3.08 3.32 3.58 3.33F3 3.05 3.22 3.47 3.25F4 3.56 3.64 3.70 3.63F5 3 3.27 3.40 3.23F6 3.19 3.40 3.50 3.36F7 3.63 3.72 3.95 3.77F8 3.24 3.26 3.56 3.35F9 3.29 3.25 3.39 3.31F10 3.11 3.19 3.40 3.23F11 3.21 3.40 3.65 3.42F12 3.39 3.5 3.67 3.52F13 3.28 3.46 3.58 3.44Average 3.26 3.40 3.58 3.41
On studying figure 8.8 (a) and the information in table 8.18 it is clear that only three of
the 13 items in this section have rendered an average score for the three categories of
respondents of higher than 3,5. The items are F4, with an average score of 3,63, item
F7, with an average score of 3,77, and item F12, with an average score of 3,52. The
results of these three items indicate that all three categories of respondents agree that:
• the air force bases’ strategy is to enhance customer and employee satisfaction (item
F4);
• the quality of products and services (service rendering such as mission-ready
aircraft/systems) is of a high quality (item F7); and
• air force bases use customer feedback to improve service quality (item F12).
However, it is of concern to note that all three categories of respondents indicate
that they are not certain that:
• the bases’ organisational structure focuses on both internal and external customer
satisfaction, as well as employee satisfaction (item F1 – 3,46);

• the bases have a generic model for all departments/sections/ subsections according
to which customer service is rendered to meet the expectations of the customer
(item F2 – 3,33);
• well-defined customer service (internal and external) standards were designed to
deal with complaints to solve deviations (item F3 – 3,25);
• aids and techniques exist according to which customer satisfaction and customer
needs are evaluated (item F5 – 3,23);
• as focus, the bases have a service strategy according to which efforts are directed
to render a customer-orientated service (item 6 – 3,36);
• all employees at the base play an important role in the success of TQM and
performance in the long term (item F8 – 3,35);
• the bases’ strategic planning and the guidance that they receive, empower them to
improve teamwork, continuous improvement, communication and culture and
change management to make them satisfied and motivated employees (item F9 –
3,31);
• employee/customer satisfaction at the bases is high (item 1O – 3,23);
• the bases have high service standards to manage service rendering and to give
employees a clear picture of that which is expected of them (item F11 – 3,42); and
• the bases use methods to determine and monitor internal and external customers’
perceived view of quality and value (item F13 – 3,44).
Customer satisfaction and focus is extremely important in TQM. The customer is the
final arbiter of product and service quality. Customer needs and requirements and how
to deliver value should be fully understood. If it weren’t for customers, there would be
no need for most institutions. Customer service and customer relations are both
important aspects of the quality equation. Customer focus provides for constant
awareness of customer needs and success at meeting those needs. Without customer
focus an institution will not know whose needs it is trying to satisfy or what those needs
are. An institution’s leaders should do more than talk about quality. Through specific
actions, such as defining quality objectives, contracting customers regularly, routinely
sharing customer information with employees and emphasising customer satisfaction in
goals and performance reviews, senior leaders must promote a constant and consistent
customer focus.

To achieve employee satisfaction, total participation by employees to implement TQM
ensures that the full genius and capability of the employees as resources are utilised.
From the start top management should create an atmosphere that enables empowered
employees to become involve and encourage innovation to ensure employee
satisfaction. Top management should also empower employees to encourage
innovation and creativity at all levels of the workforce. This should provide the
harmonious workings of the internal parts of the institution to ensure employee
satisfaction. Without total participation of employees, an institution will depend on the
genius of a few and never gain the synergy that comes from the total contribution of
each employee and process in the institution.
Generally speaking, customer and employee satisfaction was rated positively in this
section and customer and employee satisfaction meet the set requirements of the
theory and practice with due consideration of less favourable responses in respect of
ten of the 13 items.
8.3.7 Section G: Communication
In this section the effect of the air force bases’ communication in respect of TQM is
discussed. As already discussed in chapter 5 (paragraph 5.2), communication is one
of the most dominant activities that prevail in the work environment. The success of
establishing TQM at an institution depends largely on how successful communication
has occurred. Although the communication process appears to be quite simple,
misunderstandings often occur owing to the way in which the message was formulated
by the communicator and the interpretation thereof by the receiver. This section
includes 13 items (items G1 to G13) of the dimension communication in respect of
TQM, as well as the results of these items
On first review of figure 8.9 (a) and (b) and table 8.19 an important inference can be
made in respect of this section. Top management (with an average score of 3,35) has
awarded the lowest score to this section, while middle management (3,44) and the
workers (3,44) have awarded higher average scores. All three categories of
respondents’ average scores for the section are below the required score of 3,5, with a
general average of 3,41, which represents the sixth highest (see table 8.11) score of all

seven sections from G to M (supportive dimensions) and in general tenth (see table
8.12) of the 13 sections A to M. Generally speaking, communication in respect of TQM
has been rated positively in this section, although it does not represent the ideal
situation.
Figure 8.9 (a): Average scores per item with respect to the dimension communication
2
2.5
3
3.5
4
4.5
5
G1 G2 G3 G4 G5 G6 G7 G8 G9 G10 G11 G12 G13
Items per section
Ave
rag
e sc
ore
s
Figure 8.9 (b): Average scores awarded by top management, middle management and
workers to each item of the dimension communication
Communication
2
2.5
3
3.5
4
4.5
5
G1 G2 G3 G4 G5 G6 G7 G8 G9 G10 G11 G12 G13
Items per section
Ave
rag
e sc
ore
s
Top management Middle management Workers

Table 8.19: Average scores awarded by top management, middle management and
workers to each item of the dimension communication
Item TopmanagementFigure 8.9 (b)
MiddlemanagementFigure 8.9 (b)
WorkersFigure 8.9 (b)
Average scoreFigure 8.9 (a)
G1 3.5 3.59 3.60 3.56G2 3.21 3.33 3.38 3.31G3 3.63 3.53 3.40 3.52G4 3.08 3.22 3.32 3.21G5 3.51 3.56 3.66 3.58G6 3.29 3.39 3.32 3.34G7 3.35 3.77 3.60 3.57G8 2.87 3.22 3.23 3.11G9 3.63 3.58 3.71 3.64G10 3.68 3.69 3.66 3.68G11 3.29 3.34 3.33 3.32G12 3.42 3.43 3.38 3.41G13 3.06 3.05 3.19 3.10Average 3.35 3.44 3.44 3.41
The results as average scores in respect of these items are depicted in figure 8.9 (a),
figure 8.9 (b) and table 8.19. From figure 8.9 (a) and the information in table 8.19,
seven of the 13 items in this section have rendered an average score for the three
categories of respondents of below 3,5. The items are G2 with an average score of
3,31, G4 with an average score of 3,21, G6 with an average score of 3,34, G8 with an
average score of 3,11, G11 with an average score of 3,32, G12 with an average score
of 3,41 and G13 with an average score of 3,10.
When the results of the three categories of respondents are analysed individually in
figure 8.9 (b) and table 8.19, it is noted that middle management and the workers, with
the exception of items G3, G9 – G10, G12 and G13, have more positive and
unanimous points of view of communication in respect of TQM than top management.
With reference to figure 8.9 (b), it is clear and disconcerting that top management
displays relatively consistently less positive points of view than middle management
and the workers. This point of view of top management is also clearly indicated in
figure 8.1. This phenomenon should be noted, as it is contradictory to the theory of this
dimension (see chapter 5, paragraph 5.2). Seven items (G2, G4, G6 – G7, G11 – G13)
in respect of top management are equal to or higher than 2,5 but less than 3,5 and
therefore does not represent the ideal situation.

However, the results of six items (G1, G3, G5, G7, G9 - G10) are encouraging, as with
scores above the level of 3,5 all three categories of respondents agree that air force
bases have made various attempts through communication that have contributed to the
establishment of the TQM philosophy at air force bases, namely:
• Communication at the base is a strategy that is directed at conveying important
information to target groups in order to positively influence their attitudes and
conduct (item G1 with an average score of 3,56).
• Top/middle management communicate new opportunities, systems and/or services
on a regular basis (item G3 with an average score of 3,52).
• Internal communication down to the lowest level help employees to perform their
work better (item G5 with an average score of 3,58).
• Effective communication exists between section heads and workers (item G7 with
an average score of 3,57).
• Good communication (formal/informal) at the base helps personnel to achieve their
organisational aims and objectives (item G9 with an average score of 3,64).
• During meetings question/answer sessions are provided to solve problems (item
G10 with an average score of 3,68).
Based on the information contained in figure 8.9 (b) and table 8.19 regarding the seven
items G2, G4, G6, G8, G11 - G13, with average scores equal to or higher than 2,5 but
lower than 3,5, it does not represent the ideal situation as it does not meet the
requirements set for communication. It is meaningful that all three categories of
respondents, top management (3,29), middle management (3,39) and the workers
(3,32), are not sure in item G6 that effective communication exists between top
management and section heads. This is proof that the views of the three categories of
respondents are the same. It is expected that the respondents, specifically middle
management and the workers, would have indicated if no communication problem
existed between top management and section heads, should this had been the case.
In item G8 all three categories of respondents with an average score of 3,11 (top
management: 2,87, middle management: 3,22 and the workers: 3,23) indicate that
communication does not flow smoothly horizontally, vertically or diagonally between
departments, sections and processes at air force bases. What is especially of concern
is the fact that all three categories of respondents indicate that they are not sure that:

• communication at the bases is characterised by mutual trust and integrity (item G2 –
3,31);
• the bases apply appropriate communication aids (videos, articles, seminars) to
convey the TQM philosophy (item G4 – 3,21);
• the bases have a newsletter that is used to communicate quality-related aspects
that are important to employees, such as training needs, new management systems
and results that were achieved (item G11 – 3,32);
• the bases’ employees receive all information required to successfully complete their
work (item G12 – 3,41); and
• base personnel write articles and deliver speeches to members at the base on the
quality and improvement of the base’s systems/processes (item G13 – 3,10).
Top management’s average scores for items G2 (3,21), G4 (3,08), G6 (3,23), G7
(3,35), G11 (3,29), G12 (3,42) and G13 (3,06), do not reflect the ideal situation and
indicate that top management is of the opinion that they themselves do not receive all
information from, for example, air force headquarters. Communication at top
management level has a large influence on that which occurs at lower levels between
departments, sections and processes at an institution. Items G1 to G13 set as positive
questions serve as a guideline of what should be done to ensure effective
communication in order to establish TQM successfully at an institution. In chapters 4
and 5 it was stated that top management should play an active role through
communication when implementing TQM at an institution. Apart from top
management’s unfavourable views in items G2 (3,21), G4 (3,08), G6 (3,23), G7 (3,35),
G11 (3,29), G12 (3,42) and G13 (3,06), it is encouraging, however, to note that six of
the 13 items have an average score of 3,5 and higher. Generally speaking, the
requirements set for communication as a dimension are met (see section 3.2.5). Item
G9 confirms this score with an average score of 3,64 where all three categories of
respondents indicate that communication has in an exceptional manner contributed in
assisting air force bases (formally/informally) to achieve their institutional objectives.
The average scores obtained for the questions set in this section indicate important
deficiencies in respect of communication between top management, middle
management and the workers (items G2, G4, G6, G8, G11 - G13), yet there are a few
encouraging points (middle management and the workers’ responses) that can
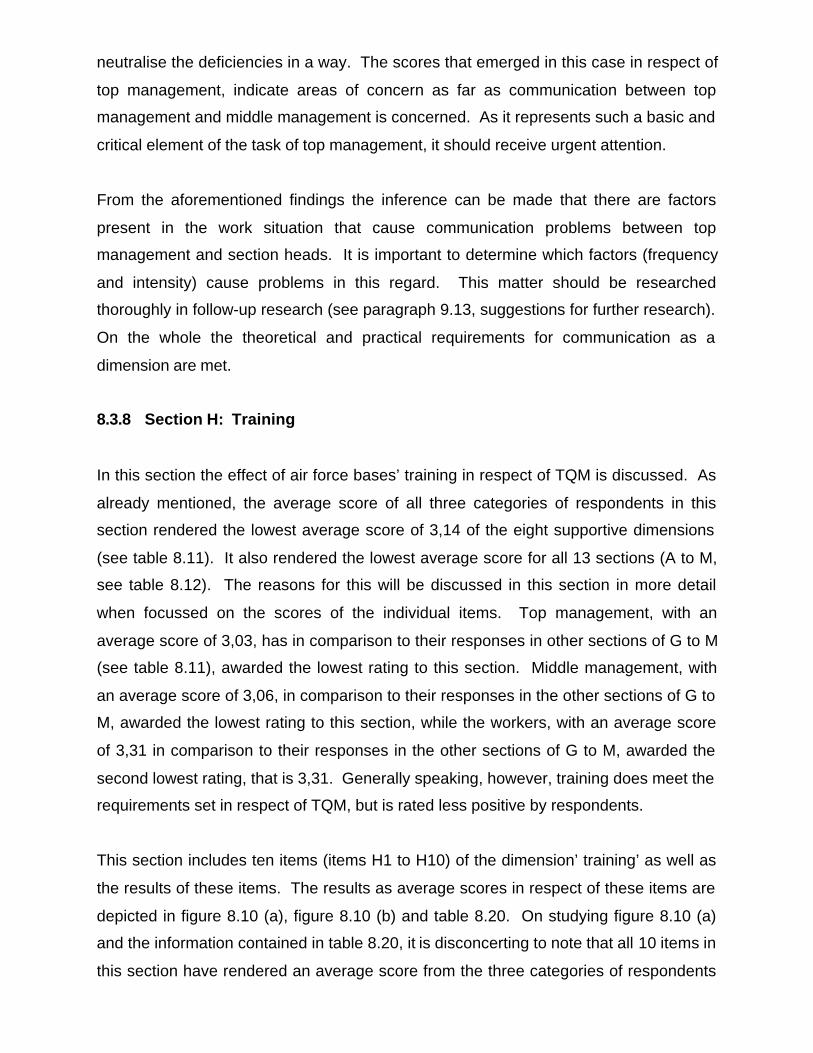
neutralise the deficiencies in a way. The scores that emerged in this case in respect of
top management, indicate areas of concern as far as communication between top
management and middle management is concerned. As it represents such a basic and
critical element of the task of top management, it should receive urgent attention.
From the aforementioned findings the inference can be made that there are factors
present in the work situation that cause communication problems between top
management and section heads. It is important to determine which factors (frequency
and intensity) cause problems in this regard. This matter should be researched
thoroughly in follow-up research (see paragraph 9.13, suggestions for further research).
On the whole the theoretical and practical requirements for communication as a
dimension are met.
8.3.8 Section H: Training
In this section the effect of air force bases’ training in respect of TQM is discussed. As
already mentioned, the average score of all three categories of respondents in this
section rendered the lowest average score of 3,14 of the eight supportive dimensions
(see table 8.11). It also rendered the lowest average score for all 13 sections (A to M,
see table 8.12). The reasons for this will be discussed in this section in more detail
when focussed on the scores of the individual items. Top management, with an
average score of 3,03, has in comparison to their responses in other sections of G to M
(see table 8.11), awarded the lowest rating to this section. Middle management, with
an average score of 3,06, in comparison to their responses in the other sections of G to
M, awarded the lowest rating to this section, while the workers, with an average score
of 3,31 in comparison to their responses in the other sections of G to M, awarded the
second lowest rating, that is 3,31. Generally speaking, however, training does meet the
requirements set in respect of TQM, but is rated less positive by respondents.
This section includes ten items (items H1 to H10) of the dimension’ training’ as well as
the results of these items. The results as average scores in respect of these items are
depicted in figure 8.10 (a), figure 8.10 (b) and table 8.20. On studying figure 8.10 (a)
and the information contained in table 8.20, it is disconcerting to note that all 10 items in
this section have rendered an average score from the three categories of respondents

of lower than 3,5, which does not represent the ideal situation, although positive, as will
subsequently be discussed in more detail. The three categories of respondents are
therefore unanimous in respect of their views on training.
Figure 8.10 (a): Average scores per item with respect to the dimension training
2
2.5
3
3.5
4
4.5
5
H1 H2 H3 H4 H5 H6 H7 H8 H9 H10
Items per section
Ave
rag
e sc
ore
s
Figure 8.10 (b): Average scores awarded by top management, middle management
and workers to each item of the dimension training
Training
2
2.5
3
3.5
4
4.5
5
H1 H2 H3 H4 H5 H6 H7 H8 H9 H10
Items per section
Ave
rag
e sc
ore
s
Top management Middle management Workers

Table 8.20: Average scores awarded by top management, middle management and
workers per item in respect of the dimension training
Item TopmanagementFigure 8.10 (b)
Middle managementFigure 8.10 (b)
WorkersFigure 8.10 (b)
Average scoreFigure 8.10 (a)
H1 3.24 3.33 3.48 3.35H2 2.92 2.82 3.06 2.93H3 2.97 2.94 3.27 3.06H4 2.92 3.02 3.30 3.08H5 2.86 2.83 3.13 2.94H6 3.19 3.07 3.37 3.21H7 2.78 2.99 3.28 3.02H8 3.19 3.31 3.55 3.35H9 3.22 3.29 3.52 3.34H10 3.03 3.04 3.17 3.08Average 3.03 3.06 3.31 3.14
The average score of 3,08 (table 8.20) for item H4 indicates that the three categories of
respondents are not sure that air force bases do indeed have a long-term training
programme for TQM for all employees. However, on studying figure 8.10 (b) and table
8.20 it emerges that the workers themselves (average score of 3,30) indicate that they
are sure about the existence of a long-term training programme for TQM which is not
unanimous with the views of top management and middle management. The
responses are therefore not encouraging . However, it can be accepted that the three
categories of respondents would surely have indicated that air force bases do indeed
have a long-term training programme had it been the case.
It is possible that the three categories of respondents are of the opinion that no training
programme is available in the SA Air Force from which they as employees can benefit.
Whatever the case, the fact remains that there is a deficiency as far as the availability
of a long-term training programme is concerned. What is worrying is the fact that the
three categories of respondents indicate that they are not sure that:
• members at the base receive good formal (Air Force College) and informal training
(on-the-job training) in the philosophy of TQM (item H1 – 3,35);
• members at the bases receive continuous training in respect of TQM principles,
based on the prescriptions provided by gurus (knowledgeable people) such as
Crosby, Deming, Juran and Feiganbaum (item H2 – 2,93);
• the bases have designed a TQM training strategy as well as a structure for the
execution thereof (item H3 – 3,06);
• regular joint training sessions are held for the workers, suppliers and customers of
the bases in order to improve customer service as a team (item H5 – 2,94);
• the bases have established a liaison mechanism between training coordinators and
workers to supplement and support training needs (item H6 –3,21);
• the workers of the bases receive training in techniques for the obtainment and
analysing of information such as process management, process reasoning and
benchmarking in order to achieve continuous improvement (item H7 – 3,01);
• the training objectives of the bases correspond with the main objectives of the bases
(item H8 – 3,35);
• the results of training at bases are evaluated continuously (item H9 – 3,34); and
• availability of resources for employee training is sufficient (item H10 – 3,08).
Interestingly, training plays an important role in respect of item C1 where the workers
indicate that they do not really understand the TQM philosophy. A lack of training in
TQM philosophy could serve as an explanation why the respondents doubt item C1. It
is clear that the TQM attempt can be hampered seriously if there is any truth in the view
that a real long-term training programme for TQM does not exist at air force bases, as
indicated by item H4. Without such a training programme it should be accepted that the
TQM attempt couldn’t be successful. If item H4 (see figure 8.10 (b) and table 8.20) is
related to item H1, it is noted that the three categories of respondents (average score of
3,35) indicate that they are unsure as to whether the personnel at air force bases do
indeed receive proper training in respect of TQM (both formally and informally). The
results of items H1 to H10 with a general average score of 3,14 let the question arises
as to whether there could under these circumstances be any question of effective
training at air force bases. What is important is the need for better attempts to be made
in respect of formal training in respect of the TQM philosophy. Air force bases should
establish a visible and executable training programme that makes TQM a real part of
continuous in-post training.
The expectation was that top management especially would indicate that they place a
greater emphasis on training to implement TQM successfully. The inference can
possibly be made that the focus is on training, but that it is not managed seriously.

However, these deficiencies in all ten items of H1 to H10 are by no means unsolvable
and can easily be eliminated. What is important, however, is that training at air force
bases should receive the attention it deserves. It is important that items H1 to H10 that
are set in a positive manner be used to manage training ideally at air force bases.
The preceding discussion should clearly indicate that the items in this section are
closely related to one another and that a low rating in respect of even one item in the
section can let questions arise as to the achievements of training at air force bases.
The average scores that emerge in this case in respect of all items (see table 8.20)
compel air force bases to reconsider their views on training. Training can be a very
powerful management strategy to improve competitive advantage and, together with
people empowerment in section C, forms the basis of managing the resources or
assets of an institution properly. On the whole the theoretical and practical
requirements for training as a dimension are met.
8.3.9 Section I: Culture forming and change management
In this section the effect of two dimensions, that is culture forming and change
management at air force bases in respect of TQM, is discussed. If an institution adopts
a new strategy or philosophy, such as TQM, it is desirable that the change over to such
a new strategy or philosophy form an integral part of the institution’s culture, as it
changes the basic framework of the institution, including strategy, structure, people,
processes and core values. The management of people to achieve total quality within
an institution ultimately has to do with creating a specific climate or, more specifically,
culture. If the culture is positive, it enables the implementation of new management
strategies or philosophies, as well as the smooth functioning of the institution.
With reference to table 8.11, top management awarded an average score of 3,39, the
third highest rating, middle management (3,62) awarded the second highest average
score to this section and the workers (3,72) awarded the highest rating in comparison to
their responses in the other seven sections (G to M, see table 8.11). The three
categories of respondents’ average scores for the section are also above the required
rating of 3,5 (see figure 6.1) with an overall average of 3,57, which is the second
highest of all seven sections G to M as far as the supportive dimensions are concerned.

Generally speaking, culture forming and change management received the fourth
highest rating (see table 8.12) of all the dimensions (sections A to M) and has been
rated as very positive.
It should be noted that all questions in this section have been set positively. This
section includes ten items (items I1 to I10) of the dimension ‘culture forming and
change management’, as well as the results of these items. The results as average
scores in respect of these items are depicted in figure 8.11 (a), figure 8.11 (b) and table
8.21. If table 8.21 is analysed, it is noticeable that the average scores per item for the
workers and middle management are more positive than those of top management.
Therefore, top management has less favourable views of culture forming and change
management in respect of TQM than middle management and the workers.
Items I1 – I6 deal with culture and items I7 – I10 with change. On studying figure 8.11
(a) and the information in table 8.21, it becomes clear that four of the ten items in this
section rendered an average score for the three categories of respondents together of
lower than 3,5, namely items I4 (3,35), I8 (3,25), I9 (3,26) and I10 (3,42), which does
not represent the ideal situation. Only 1 item dealing with culture has an average score
lower than 3,5, namely I4, while three of the four items dealing with change rendered an
average lower than 3,5. Items I1 – I6 dealing with culture will subsequently be
discussed in more detail.
Figure 8.11 (a): Average scores per item with respect to the dimension culture forming
and change management
2
2.5
3
3.5
4
4.5
I1 I2 I3 I4 I5 I6 I7 I8 I9 I10
Items per section
Ave
rag
e sc
ore
s

Figure 8.11 (b): Average scores awarded by top management, middle management
and workers to each item of the dimension culture forming and change management
Culture forming and change management
2
2.5
3
3.5
4
4.5
5
I1 I2 I3 I4 I5 I6 I7 I8 I9 I10
Items per section
Ave
rag
e sc
ore
s
Top management Middle management Workers
Table 8.21: Average scores awarded by top management, middle management and
workers per item in respect of the dimension culture forming and change management
Item Top management
Figure 8.11 (b)
Middle management
Figure 8.11 (b)
Workers
Figure 8.11 (b)
Average score
Figure 8.11 (a)
I1 3.39 3.68 3.83 3.63I2 3.34 3.62 3.69 3.55I3 3.37 3.60 3.81 3.59I4 3.05 3.47 3.53 3.35I5 3.84 3.84 3.86 3.85I6 3.47 3.61 3.73 3.60I7 4.13 4.29 4.30 4.24I8 3.03 3.28 3.45 3.25I9 3.09 3.26 3.42 3.26I10 3.15 3.52 3.59 3.42Average 3.39 3.62 3.72 3.57
With item I3 (with an average score of 3,59) an attempt was made to determine
whether the conduct of air force bases’ employees is in accordance with that which they
declare orally (slogans) such as the vision and mission statements in respect of TQM
and therefore forms part of the institution’s culture. In determining the theoretical and
practical requirements, it emerged that managers and workers’ outputs should be in
accordance with that which they declare orally (it should therefore not be talk only).
However, from figure 8.11 (b) it is clear that top management (with an average score of
3,37) are not so sure. The results in table 8.21 indicate that the conduct of middle
management (with an average score of 3,60) and the workers (with an average score of
3,81) is in accordance with that which they say or plan (deeds) to do. The question that
now arises is whether top management (1) refrains from committing themselves to that
which they preach by not doing it and (2) really knows what their responsibility should
be and how to go about to apply that which they declare they plan to do. The results of
item G8 in section G (see figure 8.9 (b) and table 8.19) offer a possible explanation for
the aforementioned state of affairs where top management, middle management and
the workers indicate that communication occurs with deficiencies (horizontally, vertically
and diagonally). Together with item I3, items l1, I2, I5 and I6 are encouraging as far as
culture forming at air force bases is concerned, as it shows according to figure 8.11 (b)
and table 8.21 that:
• quality forms part of air force bases’ culture (I1 with an average score of 3,63);
• air force bases’ culture enhances productivity (I2 with an average score of 3,54);
• top management at air force bases have defined a mission, vision and goals that
enhance a culture of quality (I5 with an average score of 3,85); and
• air force bases have a culture of continuous improvement (I6 with an average score
of 3,60).
With item I4 (with an average score of 3,35) an attempt was made to determine
whether air force bases’ culture is “preventative-orientated” rather than “reactive
corrective-orientated”. However, from figure 8.11 (b) it is clear that neither top
management (with an average score of 3,05), nor middle management is sure about
this. The results in table 8.21 indicate that the workers (with an average score of 3,53)
believe that their culture is “preventative-orientated” rather than “reactive corrective-
orientated”. The question that can now be raised is whether top management and
middle management (1) refrain from committing themselves to “preventative-orientated”
rather than to “reactive corrective-orientated” and (2) really know what their
responsibility should be in respect of culture forming.
Items I7 – I10 that deal with change will subsequently be discussed in more detail.
From table 8.21 it is clear that the three categories of respondents, with an average

score of 4,24 for item I7, agree that employees at air force bases regard change as a
challenge. In determining the theoretical and practical requirements (see chapter 5,
paragraph 5.5), it emerged that managers and workers have to change in order to
make a success of TQM.
With item I8 an attempt was made to determine whether the employees of air force
bases fully understand the need to change from the status quo to a TQM philosophy
that forms part of the institution’s attempts in the management of change. However, on
studying figure 8.11 (b) and table 8.21 it becomes clear and is disconcerting to find that
the three categories of respondents with an average of 3,25 agree that they are not
sure about this. In determining the theoretical and practical requirements for change
management (see chapter 5, paragraph 5.4) it clearly emerges that employees have to
understand the reasons and need why an institution wants to change to another
management philosophy.
With item I9 an attempt was made to determine whether the employees, who are the
most affected by the change over to the TQM philosophy, understand what are
expected of them to support the changes. However, on studying figure 8.11 (b) and
table 8.21 it is both clear and disconcerting to note that the three categories of
respondents with an average score of 3,26 agree that they are not sure. The results of
item I10 (see figure 8.11 (b) and table 8.21) offer a possible explanation for the
mentioned state of affairs where top management (with an average score of 3,15)
indicates that plans to change over completely to the TQM philosophy are not based on
realistic expectations of the air force bases’ ability to change (with an average score of
3,42).
The aforementioned item I7, that contradicts items I8 – I10, is a ray of light that can
neutralise the deficiencies in items I8 – I10. The items that deal with change (I7 –I10)
are however closely linked and a low rating in even one item in this section can have an
influence on how change is experienced. Apart from the less favourable responses in
items I4 and I8 – I10, it is encouraging to note that six of the ten items have an average
score of 3,5 and higher. Generally speaking, the requirements set for culture forming
and change management as a dimension are met. However, the views of top

management in this section that do not represent the ideal situation are a matter that
should receive attention.
8.3.10 Section J: Support structures, systems and resources
In this section the effect of support structures, systems and resources at air force bases
is discussed. As such this section of the questionnaire represents just like the previous
sections A to I, an important facet of the TQM approach – of which the results have
important implications. The reason for the aforementioned is that (as already discussed
in chapter 5, paragraph 5.6) support structures, systems and resources are a difficult
dimension of TQM, as it supports the end result of various aspects in an institution,
such as the leadership of top management, strategic planning, empowerment,
teamwork, continuous improvement, customer satisfaction, employee satisfaction,
communication, training, and culture forming and change management.
At first glance, one draws an important conclusion from figure 8.12 (b) and table 8.22
about section J. Top management awarded the lowest average score of 3,47, middle
management awarded an average score of 3,53 and the workers an average score of
3,64, which is the highest score in this section. The average score awarded by the
three categories of respondents is above 3,5 with an overall average of 3,55 for support
structures, systems and resources, which is the third highest score out of the eight
supportive dimensions (section G to M, table 8.11) and the fifth highest score (table
8.12) of all 13 sections (A to M). On the whole support structures, systems and
resources have been rated as very positive (total average for this section – 3,54).
This section includes 14 items (items J1 to J14) of the dimension ‘support structures,
systems and resources’, as well as the results of these items. The results as average
scores in respect of these items are depicted in figure 8.12 (a), figure 8.12 (b) and table
8.22. Figure 8.12 (a) and the data contained in table 8.22 indicate that only four of the
14 items in this section have rendered an average score for the three categories of
respondents of lower than 3,5. These items are J4 (average score of 3,34), J5
(average score of 3,19), J6 (average score of 3,19) and J8 (average score of 3,30).

Figure 8.12 (a): Average scores per item with respect to the dimension support
structures, systems and resources
2
2.5
3
3.5
4
4.5
5
J1 J2 J3 J4 J5 J6 J7 J8 J9 J10 J11 J12 J13 J14
Items per section
Ave
rag
e sc
ore
s
Figure 8.12 (b): Average scores awarded by top management, middle management
and workers to each item of the dimension support structures, systems and resources
Support structures, systems and resources
2
2.5
3
3.5
4
4.5
5
J1 J2 J3 J4 J5 J6 J7 J8 J9 J10 J11 J12 J13 J14
Items per section
Ave
rag
e sc
ore
s
Top management Middle management Workers

Table 8.22: Average scores awarded by top management, middle management and
workers per item in respect of the dimension support structures, systems and resources
Item Top management
Figure 8.22 (b)
Middle management
Figure 8.22 (b)
Workers
Figure 8.22 (b)
Average score
Figure 8.22 (a)
J1 3.5 3.51 3.59 3.53J2 3.29 3.56 3.57 3.50J3 3.54 3.49 3.58 3.53J4 3.29 3.32 3.4 3.34J5 3.03 3.38 3.52 3.31J6 3.03 3.15 3.40 3.19J7 3.46 3.48 3.54 3.50J8 3.22 3.28 3.40 3.30J9 3.5 3.56 3.71 3.59J10 4.05 3.94 4.09 4.03J11 3.72 3.80 3.89 3.80J12 3.78 3.68 3.77 3.74J13 3.47 3.54 3.61 3.54J14 3.68 3.72 3.89 3.77Average 3,47 3,53 3,64 3,55
With item J4 (average score of 3,34) an attempt was made to determine whether top
management provides workers with the time, resources and support to enhance quality
improvement efforts. With item J6 (average score of 3,19) an attempt was made to
determine whether top and middle management demonstrates commitment to TQM by
the amount of resources that they provide for the quality effort such as manpower,
budget and information technology. In chapter 5 (paragraph 5.6.2) it is stated that to
successfully implement TQM, institutions need resources to enhance quality
improvement efforts. Top management of institutions must demonstrate commitment to
TQM by the amount of resources that they provide for the TQM effort (such as
manpower, budget and information technology). Resource allocation forms the trigger
that enables the execution of an institution’s strategy and is therefore closely related to
strategic planning and implementation mechanisms such as programmes, projects and
schedules.
Interestingly enough, J8 (average score of 3,30) and the two items, J4 and J6, play an
important role if it is true that the three categories of respondents have indicated rather
unanimously that finances, adequate manpower, information technology and
documentation systems (see chapter 5, paragraph 5.6.2) are not really used optimally
at air force bases in support of the employees’ daily work and serve as a possible
explanation why the respondents doubt item J8. With J4, J6 and J8’s average scores

not being ideal, although positive, it is clear that air force bases do not receive
adequate and proper support from top management to implement TQM. The
responses in J4, J6 and J8 are by no means encouraging as all three categories of
respondents are convinced that they need more support from top management. It is
clear that the TQM effort can be seriously hampered if it is indeed true that top
management does not optimise their support of the TQM effort. Without the support of
top management it should be accepted that the TQM effort cannot be implemented
successfully.
In figure 8.12 (b) and table 8.22, it is clearly indicated in item J5 (average score of 3,31)
that the functional structure of air force bases does not inhibit process improvement.
Top management (3,03) and middle management (3,38) are rather unanimous as far as
this specific item is concerned, while the workers (3,52) do not believe this to be the
case. Chapter 5, paragraph 5.6.1 indicates that the structure of institutions should be
reconcilable with the dynamics and processes that workers and management use to
render effective and efficient services. The structure should allow for liaison and
information distribution so that workers are able to address problems and gain
information for possible solutions. Management should create a climate that is
supportive of nature and that encourages mutual support. The question that now arises
is whether (1) top management really knows what their responsibilities in respect of
support structures, systems and resources are, and (2) really knows how to go about to
establish support structures, systems and resources.
Items J1 – J3, J7, J12 and J13 contradict item J5, but it is encouraging to note that the
respondents clearly indicate that:
• the bases’ organisational structure is formed in such a manner that a sound
relationship exists between activities, so that workers can work together and act in a
coordinated fashion under authority and leadership to achieve a common goal (item
J1 – 3,53);
• top/middle management has created an organisational structure at the base that
promotes creative thinking in order to generate innovative decisions/solutions (item
J2 – 3,5);
• the structure at bases is conducive to cooperation (item J3 –3,53);

• the organisational structure at bases sets a good framework for strategy
implementation (item J7 – 3,5);
• the structure of bases includes functions, roles, responsibilities, hierarchies,
boundries, flexibility and innovation (item J12 – 3,74); and
• a supporting infrastructure has been created at bases (item J13 – 3,54).
On further analysis of the results in figure 8.12 (a) and (b) and table 8.22 it is
encouraging to note that ten of the 14 items have rendered an average score of 3,5 and
higher. Of the ten items ≥ 3,5 it is also encouraging to note that one item rendered an
average of 4,00 and higher. In item J10 with an average of 4,03 (see table 8.22) it is
especially noticeable that all three categories of respondents indicate that they feel
support quality systems such as Safety, Health, Environment, Risk and Quality
(SHERQ) are fully in place at air force bases.
What is encouraging to note is that the respondents clearly indicate in item J9, with an
average score of 3,59, that support quality systems such as the ISO9000/14000 are in
place. The respondents clearly emphasise that they understand the important
principles of ISO 9000:2000, as discussed in chapter 2, paragraph 2.5. The response
of respondents in respect of item J11, with an average of 3,80 (see table 8.22), is also
encouraging as it is an indication that the personnel at air force bases believe that the
safety dimensions are integrated into quality management systems. To strengthen the
aforementioned results, respondents indicated in item J14, with an average score of
3,77, that they feel that they understand the role and responsibilities of the SAEF and
SHERQ departments. The positive approach the three categories of respondents have
in respect of this section implies that air force bases’ members feel that they receive
enough support structures, systems and resources to be in charge of their own destiny,
firstly by being directed as to what to do, being given the resources with which to do the
task and then being allowed to get on and do it.
It is encouraging to note that a significant number of respondents continuously indicate
that the dimension of support structures, systems and resources is executed
thoroughly. Generally speaking, the theoretical and practical requirements set for
support structures, systems and resources as a dimension are met with the exception
of deficiencies in respect of top management support.

8.3.11 Section K: Systems thinking
In this section the effect of air force bases systems thinking with respect to TQM is
discussed. As such, this section of the questionnaire represents an important facet of
the TQM approach, the results of which could have interesting implications. The
reason for this is that the TQM approach should be managed based on systems
thinking as figure 3.1 indicates. Systems thinking are a type of driving force behind all
total quality improvement efforts. Chapter 5, paragraph 5.7 clearly indicates that
systems thinking play a supportive role when implementing TQM successfully at an
institution.
At first glance, one draws an important conclusion from figure 8.13 (b) and table 8.23
about this section. Top management awarded the lowest average score of 3,26, middle
management awarded an average score of 3,47 and the workers an average score of
3,58, which is the highest score in this section. The average score awarded by the
workers is above the 3,5 and the overall average score is 3,44, which is the third lowest
score out of the eight supportive dimensions (section G to M, table 8.11) and the eight
highest score (table 8.12) of all 13 sections (A to M). On the whole systems thinking
has been rated positive, although it does not represent the ideal situation.
Figure 8.13 (a): Average scores per item with respect to the dimension systems
thinking
2
2.5
3
3.5
4
4.5
5
K1 K2 K3 K4 K5 K6 K7 K8
Items per section
Ave
rag
e sc
ore
s

Figure 8.13 (b): Average scores awarded by top management, middle management
and workers to each item of the dimension systems thinking
Systems thinking
2
2.5
3
3.5
4
4.5
5
K1 K2 K3 K4 K5 K6 K7 K8
Items per section
Ave
rag
e sc
ore
s
Top management Middle management Workers
Table 8.23: Average scores awarded by top management, middle management and
workers per item in respect of the dimension systems thinking
Item Top management
Figure 8.13 (b)
Middle management
Figure 8.13 (b)
Workers
Figure 8.13 (b)
Average score
Figure 8.13 (a)
K1 3.29 3.5 3.73 3.51K2 2.97 3.25 3.57 3.27K3 3.05 3.36 3.61 3.34K4 3.43 3.39 3.33 3.38K5 3.39 3.49 3.47 3.45K6 3.47 3.54 3.56 3.52K7 3.21 3.56 3.67 3.48K8 3.28 3.65 3.65 3.53Average 3,26 3,47 3,58 3,44
This section contains eight items (items K1 to K8) of the dimension ‘systems thinking’
as well as the results of these items. The results in the form of average scores for
these items are represented in figures 8.13 (a) and 8.13 (b) and table 8.23. When the
results of the three categories of respondents are analysed individually in figures 8.13
(a) and 8.13 (b) and table 8.23, it is noted that the workers continuously indicate more
positive and unanimous views of systems thinking in respect of TQM. It is noticeable
and disconcerting to note that top management and middle management display
relative consistently less positive views than the workers. This view of top management

also clearly emerges in figure 8.1. It is striking that the workers’ total average score
(3,58) in respect of the different items are above the cut-off point of 3,5. This is,
however, not the case with top and middle management. This phenomenon should be
noted, as it is contradictory to the set theory of the dimension (see chapter 5, paragraph
5.7). There is no item from K1 to K8 in respect of top management that equals or is
higher than 3,5, which is disconcerting and does not represent the ideal situation.
On studying figure 8.13 (b) and the information contained in table 8.23 it is clear that
item K1, with an average score of 3,51, indicates that air force bases are managed as a
system for the successful implementation of TQM and continuous improvement so that
high quality inputs will result in high quality outputs. What is worrying in item K2
(average score of 3,27), is the fact that top management (2,97) and middle
management (3,25) indicate that they are uncertain whether each department at air
force bases works together as a team in order to achieve the base’s strategic
objectives. This item K2 correlates with the average score of 3,32 awarded by
respondents to the dimension ‘teamwork’ (see table 8.16) which indicates that the three
categories of respondents are not sure that departments within air force bases work
together as teams. Swift, Ross & Omachonu (1998:158) clearly state that institutions
form an entity, composed of interdependent components that are integrated with one
other for the achievement of strategic objectives and that they should work together as
one team. Another worrying aspect in item K3 (average score of 3,34) is that top
management (3,05) and middle management (3,36) also indicate that air force bases
do not really work together with their suppliers and customers as one system. Air force
bases should work closely with their suppliers and customers to facilitate and ensure
constant feedback, analysis and control throughout the air force base. Through the
systems thinking approach the deviations should be analysed and the knowledge
should be developed to decide when and where a compensating change must be
made.
On further study of table 8.23, it is confirmed that all three categories of respondents in
item K4 with an average score of 3,38 indicate that workers at air force bases don’t
understand how an intervention in one part of the base can causes havoc in another
place or at a later stage. All three categories of respondents in item K5, with an
average score of 3,45, confirm that members at air force bases see events as individual
incidents rather than the net result of many interactions and interdependent forces.
Another worrying aspect is that all three categories of respondents in item K6 (average
score of 3,52) agree that members at air force bases see the symptoms but not the
deep causes of problems, while item K7 (average score of 3,48) indicates that
members at air force bases blame individuals for problems even when those individuals
have little or no ability to control the events around them. Items K4 – K8 clearly indicate
that workers are not completely sure that air force bases should be managed according
to the systems thinking approach for seeing interrelationships rather than separate
things, for seeing air force bases as a set of interrelated and interdependent parts that
are arranged in a way that produces a unified whole. Something that happening in one
part of a system affects what happens throughout the system. Any air force base
should be managed in accordance with the characteristics of the systems approach if it
is to be successful (Taiwo 2001:968-969). Generally speaking, the systems thinking
approach has been rated positive with the exception of a few deficiencies. On the
whole the theoretical and practical requirements for systems thinking as a dimension
are met.
8.3.12 Section L: Self-assessment
In this section the effect of air force bases’ self-assessment in respect of TQM is
discussed. As such, this section of the questionnaire represents an important facet of
the TQM approach of which the results have important implications. The reason for the
aforementioned is that to successfully implement TQM activities at an institution,
executives have to use self-assessment as a supporting tool to implement TQM.
Even at first glance, figure 8.14 (a) and table 8.24 point to an important conclusion in
respect of this section. On average top management (3,57) awarded the lowest score
to this section. In contrast, the workers awarded the highest score (3,69), followed by
the middle managers, who awarded 3,66. The overall average score of 3,64 awarded
by the three categories of respondents (top management, middle management and the
workers) to the section as a whole is also higher than the required score of 3,5. This is
also the highest score in all seven sections (G to M, see table 8.11) of the supportive
dimensions as well as the second highest score of all 13 sections (A to M, see table
8.12). It is also noteworthy that top management has relatively consistent positive

views of self-assessment (which is not the case for the previous dimensions, except for
leadership and top management commitment to TQM). On the whole self-assessment
to TQM was rated very positive.
Figure 8.14 (a): Average scores per item with respect to the dimension self-
assessment
2
2.5
3
3.5
4
4.5
L1 L2 L3 L4 L5 L6 L7 L8 L9 L10
Items per section
Ave
rag
e sc
ore
s
Figure 8.14 (b): Average scores awarded by top management, middle management
and workers to each item of the dimension self-assessment
Self-assessment
2
2.5
3
3.5
4
4.5
L1 L2 L3 L4 L5 L6 L7 L8 L9 L10
Items per section
Ave
rag
e sc
ore
s
Top management Middle management Workers

Table 8.24: Average scores awarded by top management, middle management and
workers per item in respect of the dimension self-assessment
Item Top management
Figure 8.24 (b)
Middle management
Figure 8.24 (b)
Workers
Figure 8.24 (b)
Average score
Figure 8.24 (a)
L1 4.11 4.26 4.15 4.17L2 3.65 3.86 3.96 3.82L3 3.35 3.29 3.29 3.31L4 3.09 3.42 3.34 3.28L5 3.57 3.66 3.69 3.64L6 3.61 3.67 3.71 3.67L7 3.44 3.42 3.57 3.50L8 3.71 3.72 3.69 3.71L9 3.70 3.70 3.84 3.75L10 3.51 3.65 3.65 3.60Average 3.57 3.66 3.69 3.64
This section includes ten items (items L1 to L10) of the dimension ‘self-assessment’ as
well as the results of these items. The results as average scores in respect of these
items are depicted in figure 8.14 (a), figure 8.14 (b) and table 8.24. On studying figure
8.14 (a) and the data contained in table 8.24, it is clear that only two items out of ten
have rendered an average score lower than 3,5, these are items L3 (with an average
score of 3,31) and item L4 (with an average score of 3,28). The positive approach
displayed by the three categories of respondents in respect of this section, implies that
air force bases see self-assessment as a comprehensive, systematic and regular
review of the air force bases’ activities and results referenced against a model of
performance excellence.
It should be noted that all questions in section L were set positively. When the results
of item L3 (with an average score of 3,31) and L4 (with an average score of 3,28) in
figure 8.14 (b) and table 8.24 are analysed, it is noticeable that all three categories of
respondents’ (top management, middle management and the workers) average scores
for the two items are below the cut-off point of 3,5. The views of the three categories of
respondents in respect of the two items L3 and L4, are that:
• air force bases concentrate more on the enablers of the SAEF rather than on the
results (item L3 – 3,31); and
• air force bases concentrate more on the results of the SAEF rather than on the
enablers (item L4 – 3,28).

The result of item L3 and L4 is confusing as certain respondents of air force bases feel
that the focus is more on the enablers while others feel that the focus is on results. The
scores awarded by the three categories of respondents for items L3 (3,31) and L4
(3,28) are important as the inference can be made that the three categories of
respondents do not really know where the focus is, that is on the enablers or the
results. The fact is that air force bases do know that the focus should be on both the
enablers and results in order to make a success of self-assessment. Factors can be
present in the work situation where certain bases concentrate more on enablers and
others more on results, depending on which phase the air force base is in with the
implementation of the SAEF model. Proper planning should precede successful
implementation of self-assessment. Self-assessment should also be implemented
sensibly, systematically and not hastily. Only once the enabler phase has been
implemented systematically, can the focus be on results in order to determine trends,
results and areas that can be improved. On implementing self-assessment it is logical
that the result phase should be managed less intensely than the enabler phase. Once
the enabler phase has been implemented fully, the result phase will be managed more
intensely in order to obtain good visibility of how effective air force bases are in their
attempts to establish TQM. The better the implementation of the enabler phase, the
better the result phase will be managed. However, many air force bases spent more
time on the enabler phase to form the basis for the implementation of TQM and only
once this has been achieved is the result phase managed more intensely. For most
institutions the question is not whether self-assessment practices will be implemented,
but rather how the self-assessment process will be integrated into institutional activities.
The right culture, one that incorporates the correct enablers to achieve the results, is
the primary enabler of a successful assessment programme. Therefore, air force bases
must view the self-assessment process as a means to continually improve air force
base results.
On further analysis of the results in figure 8.14 (a), 8.14 (b) and table 8.24, it is
encouraging to note that eight items (L1, L2, L5 – L10) have an average score of 3,5
and higher. In item L1, with an average score of 4,17, all three categories of
respondents indicate that air force bases’ self-assessment approach is based on an
internationally recognised standard, known as the South African Excellence Foundation
(SAEF). This indicates that these respondents know the SAEF model applied by the
SA Air Force for self-assessment to support the implementation of TQM. Linking to
item L1, item L2 with an average score of 3,82 indicates that air force bases conducted
self-assessments/audits, by applying criteria such as the ISO 9000/ISO14000 and
SAEF. The response of respondents in respect of item L5 (average score of 3,64) is
also an indication that personnel members of air force bases realise that the success of
the implementation of the SAEF model at air force bases is based on top
management’s commitment to the process of self-assessment. This item relates
directly to section A’s positively set questions emphasising the requirements of
leadership and top management commitment to implement TQM.
With an average score of 3,66 in respect of item L6, the respondents clearly indicate
that the outcomes of the self-assessment are related to the business planning process.
The necessity of the value of a correct strategic plan, of which self-assessment forms
part, is emphasised in this manner. To place the aforementioned results of L6 properly
in perspective, (1) the respondents feel in item L7, with an average score of 3,50 (see
table 8.24), that the people who conduct the self-assessment have received the
relevant training, (2) the respondents in item L8, with an average score of 3,71, feel that
members are aware of the use of the SAEF model as a measurement tool, and (3) the
respondents in item L9, with an average score of 3,75, feel that the SAEF model as a
self-assessment tool is incorporated into the business planning processes of air force
bases. This implies that members of air force bases are generally already rather well
informed on the advantages of self-assessment. It is encouraging to note that the
respondents clearly indicate in item L10 (an average score of 3,60) that the SAEF
model does not regard the self-assessment process as an ‘add on’ to workers’ existing
workload but as part of their existing workload. The result is that the respondents
realise the value thereof to fully integrate self-assessment into the TQM philosophy.
The aforementioned confirms that self-assessment can be applied eminently to the
advantage of air force bases. It is encouraging to note that a significant number of
respondents have continuously indicated that self-assessment is conducted properly.
Generally speaking, the theoretical and practical requirements for self-assessment as
dimension are met.
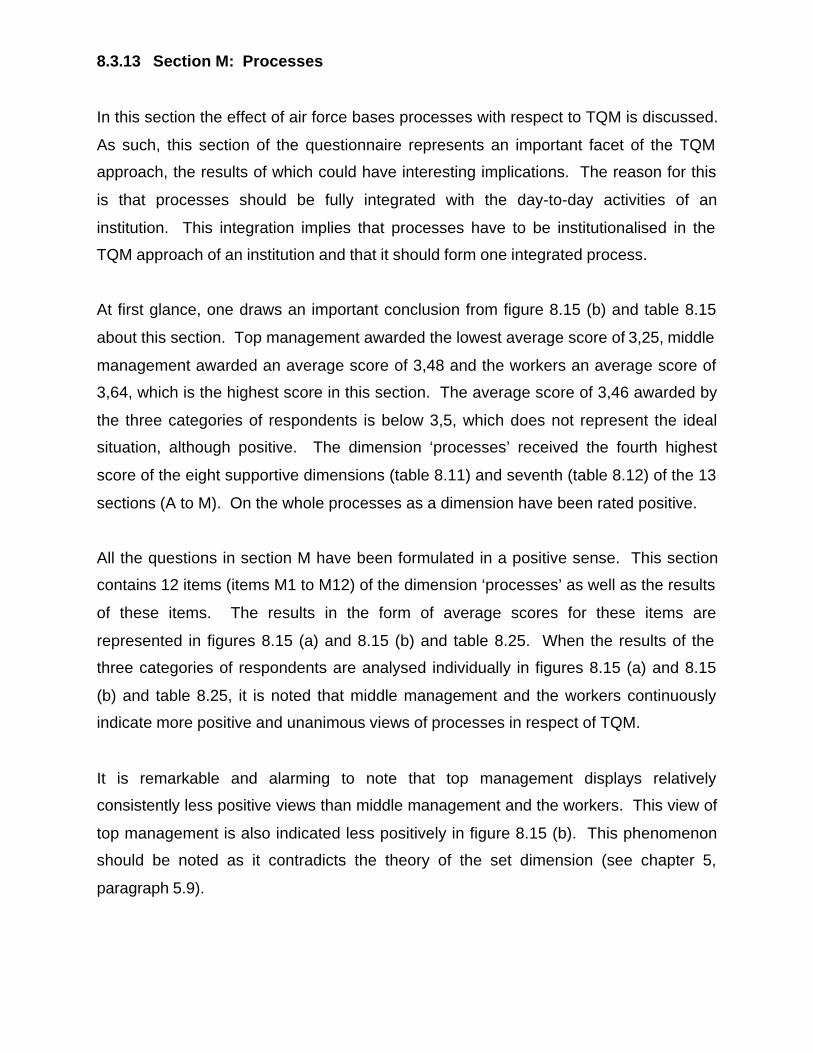
8.3.13 Section M: Processes
In this section the effect of air force bases processes with respect to TQM is discussed.
As such, this section of the questionnaire represents an important facet of the TQM
approach, the results of which could have interesting implications. The reason for this
is that processes should be fully integrated with the day-to-day activities of an
institution. This integration implies that processes have to be institutionalised in the
TQM approach of an institution and that it should form one integrated process.
At first glance, one draws an important conclusion from figure 8.15 (b) and table 8.15
about this section. Top management awarded the lowest average score of 3,25, middle
management awarded an average score of 3,48 and the workers an average score of
3,64, which is the highest score in this section. The average score of 3,46 awarded by
the three categories of respondents is below 3,5, which does not represent the ideal
situation, although positive. The dimension ‘processes’ received the fourth highest
score of the eight supportive dimensions (table 8.11) and seventh (table 8.12) of the 13
sections (A to M). On the whole processes as a dimension have been rated positive.
All the questions in section M have been formulated in a positive sense. This section
contains 12 items (items M1 to M12) of the dimension ‘processes’ as well as the results
of these items. The results in the form of average scores for these items are
represented in figures 8.15 (a) and 8.15 (b) and table 8.25. When the results of the
three categories of respondents are analysed individually in figures 8.15 (a) and 8.15
(b) and table 8.25, it is noted that middle management and the workers continuously
indicate more positive and unanimous views of processes in respect of TQM.
It is remarkable and alarming to note that top management displays relatively
consistently less positive views than middle management and the workers. This view of
top management is also indicated less positively in figure 8.15 (b). This phenomenon
should be noted as it contradicts the theory of the set dimension (see chapter 5,
paragraph 5.9).
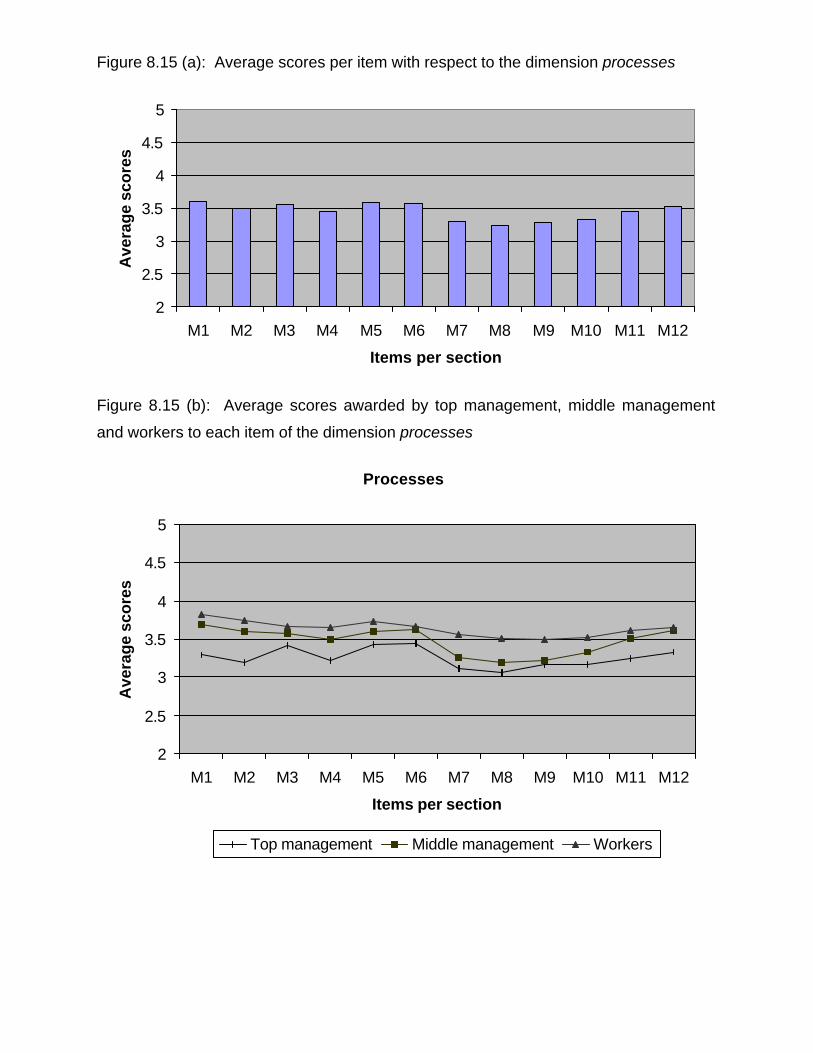
Figure 8.15 (a): Average scores per item with respect to the dimension processes
2
2.5
3
3.5
4
4.5
5
M1 M2 M3 M4 M5 M6 M7 M8 M9 M10 M11 M12
Items per section
Ave
rag
e sc
ore
s
Figure 8.15 (b): Average scores awarded by top management, middle management
and workers to each item of the dimension processes
Processes
2
2.5
3
3.5
4
4.5
5
M1 M2 M3 M4 M5 M6 M7 M8 M9 M10 M11 M12
Items per section
Ave
rag
e sc
ore
s
Top management Middle management Workers

Table 8.25: Average scores awarded by top management, middle management and
workers per item in respect of the dimension processes to TQM
Item Top management
Figure 8.15 (b)
Middle management
Figure 8.15 (b)
Workers
Figure 8.15 (b)
Average score
Figure 8.15 (a)
M1 3.29 3.70 3.83 3.61M2 3.18 3.60 3.75 3.51M3 3.42 3.57 3.67 3.56M4 3.21 3.51 3.66 3.50M5 3.43 3.61 3.73 3.59M6 3.45 3.63 3.67 3.58M7 3.11 3.25 3.57 3.31M8 3.06 3.18 3.51 3.25M9 3.16 3.21 3.5 3.29M10 3.16 3.33 3.53 3.34M11 3.24 3.51 3.62 3.50M12 3.33 3.61 3.66 3.54Average 3,25 3,48 3,64 3,46
Four items (M7 – M10) have a score of less than 3,5 and therefore do not represent the
ideal situation as will subsequently be discussed. With item M7 (with an average score
of 3,31) an attempt was made to determine whether all workers view the air force bases
as a series of linked processes. The aim of an air force base should be to let all its
processes function in harmony in order to establish improved customer and employee
satisfaction. Air force bases should have a network of processes and these processes
should be managed continuously. It is important to view air force bases as a series of
linked processes, as the air force base cannot render any products or services without
the necessary interaction of core processes (the air force bases’ right of existence for
providing a specific product or service), supporting processes (those activities that
ensure that the core process works effectively), and assurance processes (these
processes should ensure that the institution achieves its operational needs) (see
chapter 5, paragraph 5.9).
With item M8 (with an average score of 3,25) an attempt was made to determine
whether process terms such as input, output, process and process owners, are used in
conversations at air force bases. The cornerstone of continuous improvement (section
E) is process management and therefore workers must use and understand process
terms as a sequence of steps at air force bases, which adds value by providing
required outputs from a variety of inputs. Workers should view processes as the
activities that change inputs to outputs and which enhance value to base end results in
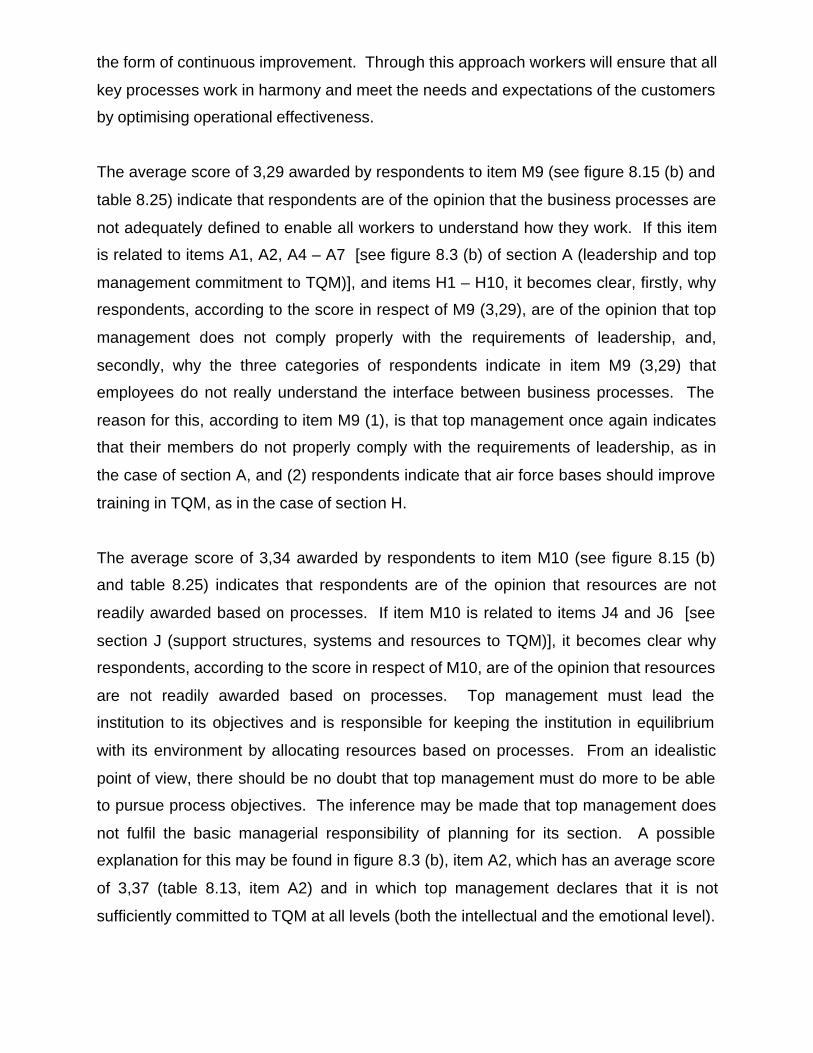
the form of continuous improvement. Through this approach workers will ensure that all
key processes work in harmony and meet the needs and expectations of the customers
by optimising operational effectiveness.
The average score of 3,29 awarded by respondents to item M9 (see figure 8.15 (b) and
table 8.25) indicate that respondents are of the opinion that the business processes are
not adequately defined to enable all workers to understand how they work. If this item
is related to items A1, A2, A4 – A7 [see figure 8.3 (b) of section A (leadership and top
management commitment to TQM)], and items H1 – H10, it becomes clear, firstly, why
respondents, according to the score in respect of M9 (3,29), are of the opinion that top
management does not comply properly with the requirements of leadership, and,
secondly, why the three categories of respondents indicate in item M9 (3,29) that
employees do not really understand the interface between business processes. The
reason for this, according to item M9 (1), is that top management once again indicates
that their members do not properly comply with the requirements of leadership, as in
the case of section A, and (2) respondents indicate that air force bases should improve
training in TQM, as in the case of section H.
The average score of 3,34 awarded by respondents to item M10 (see figure 8.15 (b)
and table 8.25) indicates that respondents are of the opinion that resources are not
readily awarded based on processes. If item M10 is related to items J4 and J6 [see
section J (support structures, systems and resources to TQM)], it becomes clear why
respondents, according to the score in respect of M10, are of the opinion that resources
are not readily awarded based on processes. Top management must lead the
institution to its objectives and is responsible for keeping the institution in equilibrium
with its environment by allocating resources based on processes. From an idealistic
point of view, there should be no doubt that top management must do more to be able
to pursue process objectives. The inference may be made that top management does
not fulfil the basic managerial responsibility of planning for its section. A possible
explanation for this may be found in figure 8.3 (b), item A2, which has an average score
of 3,37 (table 8.13, item A2) and in which top management declares that it is not
sufficiently committed to TQM at all levels (both the intellectual and the emotional level).

Upon further analysis of the results in figures 8.15 (a) and 8.15 (b) and table 8.25 it is
encouraging to note that eight items (M1 – M6, M11 – M12) have an average score
equal to or higher than 3,5. The responses of respondents to item M1 (with an average
score of 3,61) are an indication that processes have been designed at air force bases
to meet quality standards, such as the ISO 9000:2000 (see chapter 2, paragraph 2.6).
With reference to item M2 – M6, and M11 – M12 (with all average scores above 3,5), it
can be stated that the three categories of respondents feel that:
• air force bases continuously assess the quality of all their processes (item M2 –
3,51), which correlates with the average scores of section L;
• air force bases determine critical processes and select adequate control points (item
M3 – 3,56);
• air force bases apply appropriate statistical methods to control processes (item M4 –
3,5), which correlates with the requirement set in section E, item E11;
• air force bases use assessment results and benchmarking to enhance knowledge
about processes (item M5 – 3,59), which correlates with the requirement of section
E, items E6 and E7, and section L, item L6;
• air force bases continuously determine what are the critical processes that need
urgent attention and select adequate control points (item M6 – 3,58);
• air force bases measure process performance outcomes (item M11 – 3,5); and
• air force bases measure process performance based on defined standards (item
M12 – 3,54).
The above items confirm that processes are utilised par excellence to air force bases
advantage. It is encouraging to note that a significant number of respondents
consistently indicate that thorough process is done. On the whole the theoretical and
practical requirements for processes as a dimension are met.
8.4 ITEM PRIORITISING OF SECTION N TO Q (SEE APPENDIX C)
In questionnaire two, sections N to Q, the attitude of personnel towards TQM was
further analysed and the emphasis was on the motivation for the implementation of
TQM, the advantages after implementation, as well as the acceptance of TQM by
personnel. Respondents had to prioritise items according to importance.

In section N respondents were asked to prioritise eight questions in order to indicate,
according to their opinion, what reason or motivation is the most important for the
implementation of TQM. The results in respect of the order of preference, as indicated
by the respondents, are shown in table 8.26. The orders of preference scores of 1 to 8
in table 8.26 have been ordered chronologically.
Table 8.26: The most important reasons or motivation for the implementation of TQM
at air force bases as indicated by the respondents
Order ofpreference
The most important reasons or motivation for the implementation ofTQM at air force bases
1 N1: To enhance customer and employee satisfaction.2 N6: To improve service quality at our base.3 N4: To improve organisational objectives and performance at our base.4 N5: To prevent operational risks.
5 N8: To better market our base in the SA Air Force/SANDF, as well asinternationally.
6 N7: To enhance the image of our base in the SA Air Force.7 N2: TQM implementation is a perfect beginning for our base.8 N3: It was a corporate decision.
On studying the table the most important reason or motivation for the implementation of
TQM is to enhance customer and employee satisfaction (N1: listed first). From table
8.26 the result of N1 correlates with section F’s items F1 and F4, which clearly indicate
that:
• the bases’ organisational structure focuses on both internal and external customer
satisfaction, as well as employee satisfaction (item F1 with an average score of
3,47); and
• the bases’ strategy is to enhance customer and employee satisfaction (item F4 with
an average score of 3,63 which is the second highest rating in section F).
According to the respondents, the second most important reason or motivation for the
implementation of TQM at air force bases is to improve the service quality of air force
bases (N6: listed second). The result of N6 correlates with section F’s items F2, F6, F7
and F11, which clearly indicates that:

• the bases have a generic model for all departments/sections/subsections according
to which customer service is rendered to meet the expectations of the customer
(F2=3,33);
• as focus, the bases have a service strategy according to which efforts are directed
to render a customer-orientated service (F6=3,36);
• the quality of products and services (service rendering such as mission-ready
aircraft/systems) is of a high quality (F7=3,77); and
• the bases have high service standards to manage service rendering and to give
workers a clear picture of that which is expected of them (F11=3,42).
On studying the preceding paragraphs on the analysis of table 8.26, the inference can
be made that there is a close link between the order of preference of the items in table
8.26 and the principles of TQM, as discussed in chapter 2, paragraph 2.3.3.
Section O consists of three sections. In the first part of section O respondents were
asked to prioritise nine questions in order to indicate which elements in their opinion
have a positive effect on the implementation of TQM at air force bases. The results in
respect of the order of preference are shown in table 8.27 (a).
Table 8.27 (a): Elements that positively contribute (Op) the most towards the effective
implementation of TQM at bases
Order ofpreference
Elements that can positively contribute (Op) the most towards theeffective implementation of Total Quality Management at your base
1 Op2: Strong leadership and commitment to Total Quality Management.2 Op1: Better communication between management and workers.3 Op7: Improvement of employee satisfaction.4 Op5: Employee commitment/motivation to Total Quality Management.5 Op3: Improvement of customer satisfaction.6 Op8: Improvement of teamwork at our base.7 Op4: Visibility of well-structured systems and procedures.8 Op9: Establishment of a new culture of quality.9 Op6: Improvement of the strategic right of existence of our base.
According to table 8.27 (a) the element that has the most positive effect on the
implementation of TQM at air force bases, resides in item Op2, namely strong
leadership and commitment to TQM. The result of item Op2 correlates with the high
results of section A’s items A4 – A6, A8 and A11. It clearly indicates that respondents

realise the significance of leadership and top management’s commitment to implement
TQM, as well as the value that leadership and top management commitment holds for
TQM.
Item Op1 has been listed second which indicates that, according to the respondents, it
is essential to establish better communication between management and the workers.
It is important to note that the result of Op1 correlates with the positive results of section
G’s items G1, G3, G5, G7 and G9 - G10. The third element in order of preference as
indicated by respondents is item Op7 which indicates that improvement of employee
satisfaction to TQM is necessary.
In the second part of section O respondents were asked to prioritise eight questions in
order to indicate which elements in their opinion have a negative effect on the
implementation of TQM at air force bases. The results in respect of the order of
preference, as indicated by respondents, are shown in table 8.27 (b).
Table 8.27 (b): Elements that can hamper or prevent the effective (negative effect –
On) implementation of TQM at air force bases
Order ofpreference
Elements that can hamper or prevent the effective (negative effect –On) implementation of Total Quality Management at air force bases.
1 On3: Lack of top management leadership and/commitment.2 On2: Poor communication.
3 On1: Workers’ limited experience of the Total Quality Managementphilosophy.
4 On7: To little contributions by top and middle management.5 On8: Low worker commitment to Total Quality Management.6 On4: Absence of well-structured systems and procedures.7 On5: Little contact with other SAAF bases with regard to benchmarking.8 On6: To much participation and work of external consultants.
According to table 8.27 (b) the element that has the most negative effect on the
implementation of TQM at air force bases, resides in item On3, which indicates that
lack of top management leadership and commitment to TQM can negatively influence
the TQM effort as a whole. In chapter 3, paragraph 3.4 and figure 3.1 it is clearly
emphasised that leadership and top management’s commitment to TQM forms the
cornerstone that keeps the entire TQM philosophy together and supports it in order to
ensure success. The positive and observable support of top management to the TQM

programme is one of the most important dimensions for the establishment of a
successful programme.
According to the respondents, the second element in order of preference that has the
most negative effect on the implementation of TQM at air force bases, resides in item
On2, that is poor communication. It should be noted that the respondents indicated in
item Op1 [see table 8.27 (a)] that the second most positive effect in implementing TQM
at air force bases resides in obtaining better communication between management and
the workers. Items Op1 and On2 have both been awarded the second order of
preference [see table 8.27 (a) and 8.27 (b)]. Op1 indicates that communication has a
positive effect on the implementation of TQM, and On2 indicates that poor
communication has a negative effect on the implementation of TQM. Section G’s item
G8 with an average score awarded by all three categories of respondents as 3,11
relates to the respondents’ indication of item On2, where it clearly emerged that
communication at air force bases does not flow without obstacles horizontally, vertically
and diagonally between departments, sections and subsections.
According to the respondents the third element in order of preference that has the most
negative effect on the implementation of TQM at air force bases, resides in item On1,
that is employees’ limited experience of the TQM philosophy at air force bases. The
result of item On1 correlates with section C’s item C1 (with an average score of all
three categories of respondents of 2,77) and item H4 (with an average score of all three
categories of respondents of 3,08). This clearly indicates that respondents are not sure
that all employees understand the TQM philosophy, possibly as a result of the fact that
they are not sure whether air force bases have a long-term programme for TQM for all
employees. With this deficiency indicated by respondents in On1 (as well as in section
C’s item C1 and section H’s item H4), it can basically be accepted that a deficiency
exists at air force bases as far as the important matter of training is concerned. It is
therefore essential that air force bases make arrangements that will contribute to the
availability of the required training in the TQM philosophy. Not only should the
necessity of formal training in the TQM philosophy at air force bases be emphasised,
but greater attempts should also be made by the SA Air Force’s Directorate Education,
Training and Development to broaden TQM training in the SA Air Force (in conjunction
with other institutions that have the required expertise in the management of the TQM

philosophy). The reason is that the accessible population at air force bases, who were
involved at random in this study as a sample group, is probably representative of the
SA Air Force population and that the results could possibly be generalised universally.
By means of courses, seminars or training programmes practical orientation on the
implementation possibilities of TQM can be provided to employees of air force bases to
prepare them for the successful implementation of TQM at air force bases.
In the third part of section O, respondents were asked to prioritise nine questions in
order to indicate, according to their opinion, what quality factor air force bases find the
most difficult to deal with. The results in respect of the order of preference as indicated
by the respondents, are shown in table 8.27 (c).
On studying table 8.27 (c) the most difficult quality factor to deal with is the motivation
of employees (Omd7). The result of item Omd2 (dealing with interdepartmental
relations and cooperation) was listed second, linking it directly to item Omd7 (listed
first), while the result of item Omd9 (dealing with employee satisfaction) was listed third.
Table 8.27 (c): The quality factor which is the most difficult (Omd) to deal with at air
force bases
Order ofpreference
Om: The quality factor that is the most difficult (Omd) to deal with atair force bases
1 Omd7: Motivation of workers.2 Omd2: Interdepartmental relationships and cooperation.3 Omd9: Employee satisfaction.4 Omd3: Sound communication.5 Omd1: Customer satisfaction.
6 Omd5: The commitment of top/middle management to Total QualityManagement.
7 Omd4: Customer service for both external and internal customers.8 Omd6: Quality of services.9 Omd8: Quality image of our base.
It is also interesting to note that the result of item Omd7 (listed first) correlates with
section F’s item F10 with an average score from all three categories of respondents of
3,23, which indicates that respondents are not sure that all employees are motivated
and satisfied. The quality factor indicated by the respondents in Omd2 (listed second)
supported by section D’s item D9, indicates that air force bases’ interdepartmental

relationships are of such a nature that they do not continually support quality
improvement. What is of further interest is that the result of item Omd9 (listed third)
correlates with section F’s item F10 with an average score awarded by all three
categories of respondents of 3,23, indicating that respondents are not sure that all
employees are motivated and satisfied.
Section P is divided into two sections. In the first part of section P respondents were
asked to list six questions in order of preference to indicate what, according to their
opinion, is the most important internal change that personnel at air force bases
associate with the TQM philosophy. The results in respect of the order of preference,
as indicated by the respondents, are shown in table 8.28 (a). From table 8.28 (a) the
most important internal change that respondents at air force bases associate with the
TQM philosophy, resides in item Pi3, that is that more effective communication could be
established. The respondents have already indicated in table 8.27 (a), with item Op1
(dealing with elements that have a positive effect on total quality improvement) that
better communication should be established between management and the workers.
The correlation confirms that communication at air force bases has to be improved.
According to the respondents, the second most important element of the internal
changes at air force bases that can be associated with the TQM philosophy, resides in
item Pi1, namely that a better system for training and development could be
established. Respondents have already indicated in table 8.27 (b), with item On1
(dealing with elements that have a negative effect on the implementation of TQM at air
force bases) that employees' limited experience of the TQM philosophy can influence
the implementation thereof in a negative way. The correlation between item On1 [see
table 8.27 (b)] and Pi1 confirms that training plays an important internal role to improve
the limited experience of employees in respect of the TQM philosophy. The SA Air
Force and air force bases should establish a training programme to actively address the
matter.
According to the respondents, the third most important element of the internal changes
at air force bases that can be associated with the TQM philosophy, resides in item Pi4,
namely that a greater commitment to TQM could be displayed at air force bases. The
respondents have already indicated, as shown in table 8.27 (a), with item 0p2 (dealing

with elements that have a positive effect on the implementation of TQM at air force
bases) and in table 8.27 (b), with item On3 (dealing with elements that have a negative
effect on TQM implementation at air force bases), that strong leadership and
commitment to TQM are important for the implementation of TQM. The correlation
between item Op2, On3 and Pi4 confirms that respondents realise the importance of
leaders to take the lead in showing commitment in this regard.
Table 8.28 (a): Most important advantages in respect of internal changes (Pi) at bases
as associated with the Total Quality Management philosophy
Order ofpreference
Pi: most important internal changes
1 Pi3: More effective communication.2 Pi1: A better system for training and development.
3 Pi4: More commitment to Total Quality Management is displayed withregard to all work.
4 Pi5: Effective development of systems and procedures.5 Pi6: Decrease in operating costs.6 Pi2: Less supervision.
In the second part of section P respondents were asked to prioritise four questions in
order to indicate what, in their opinion, is the most important external change
associated at air force bases with the TQM philosophy. The results in respect of the
order of preference, as indicated by the respondents, are shown in table 8.28 (b).
Table 8.28 (b): Most important advantages in respect of external changes (Pe) at
bases as associated with the Total Quality Management philosophy
Order ofpreference
Pe: most important advantages concerning external changes
1 Pe2: Better service rendering to customers.2 Pe1: Better relationships of trust with current and potential customers.
3 Pe3: Getting recognition as a professional quality driven base (to be aservice base).
4 Pe4: Better interaction with all interest groups.
On studying table 8.28 (b), the most important external change associated at air force
bases with the TQM philosophy, resides in item Pe2, namely that there could be better
service rendering to customers. The respondents have already indicated, as shown in
table 8.26, with item N6 (dealing with the most important reason or motivation for the
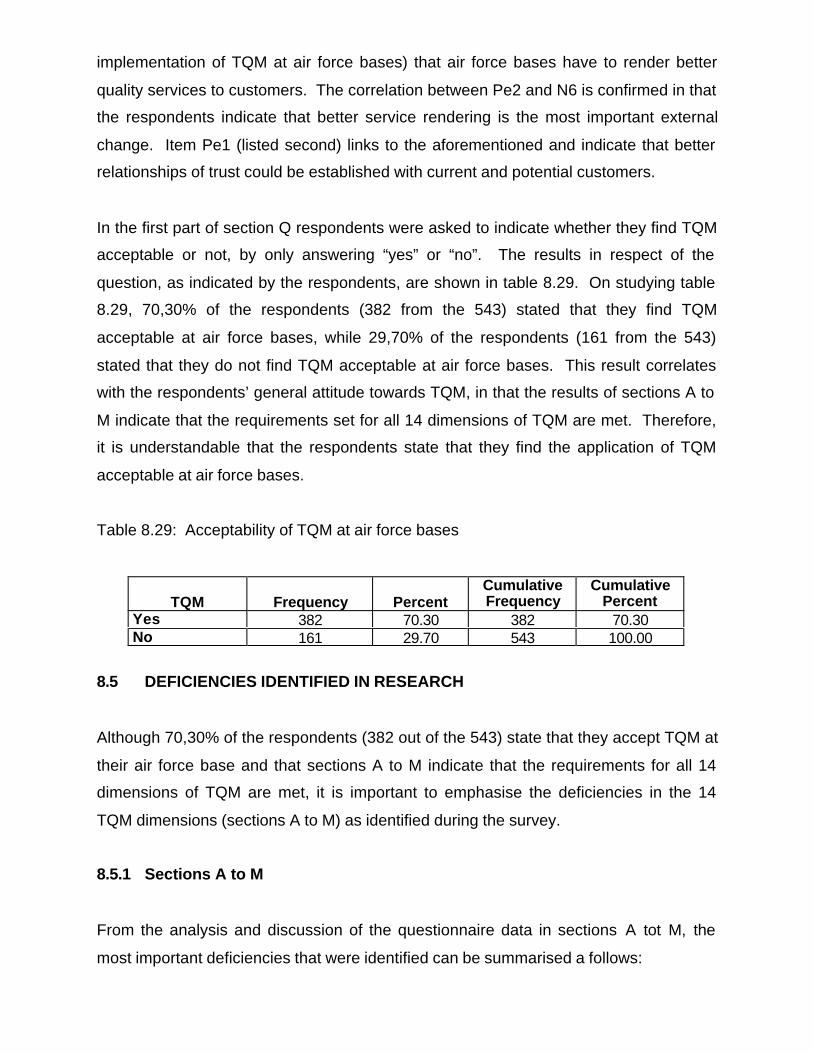
implementation of TQM at air force bases) that air force bases have to render better
quality services to customers. The correlation between Pe2 and N6 is confirmed in that
the respondents indicate that better service rendering is the most important external
change. Item Pe1 (listed second) links to the aforementioned and indicate that better
relationships of trust could be established with current and potential customers.
In the first part of section Q respondents were asked to indicate whether they find TQM
acceptable or not, by only answering “yes” or “no”. The results in respect of the
question, as indicated by the respondents, are shown in table 8.29. On studying table
8.29, 70,30% of the respondents (382 from the 543) stated that they find TQM
acceptable at air force bases, while 29,70% of the respondents (161 from the 543)
stated that they do not find TQM acceptable at air force bases. This result correlates
with the respondents’ general attitude towards TQM, in that the results of sections A to
M indicate that the requirements set for all 14 dimensions of TQM are met. Therefore,
it is understandable that the respondents state that they find the application of TQM
acceptable at air force bases.
Table 8.29: Acceptability of TQM at air force bases
TQM Frequency PercentCumulativeFrequency
CumulativePercent
Yes 382 70.30 382 70.30No 161 29.70 543 100.00
8.5 DEFICIENCIES IDENTIFIED IN RESEARCH
Although 70,30% of the respondents (382 out of the 543) state that they accept TQM at
their air force base and that sections A to M indicate that the requirements for all 14
dimensions of TQM are met, it is important to emphasise the deficiencies in the 14
TQM dimensions (sections A to M) as identified during the survey.
8.5.1 Sections A to M
From the analysis and discussion of the questionnaire data in sections A tot M, the
most important deficiencies that were identified can be summarised a follows:

• There are important differences between the views of top management, middle
management and the workers on the effectiveness with which the 14 TQM
dimensions are performed at air force bases. Top management’s (see table 8.1)
views are more or less consistently less positive than that of middle management
and the workers.
• In sections A to M of the questionnaire deficiencies at air force bases in respect of
TQM were found in each section. The order of the sections from the lowest average
score to the highest average score, giving an indication of the sections where the
most deficiencies occur, is: section H (training), section D (teamwork), followed by
section G (communication), section E (customer/employee satisfaction), F
(continuous improvement), section K (systems thinking), section M (processes),
section B (strategic planning), section J (support structures, systems and
resources), section I (culture forming and change management), section C
(empowerment), section L (self-assessment), and section A (leadership and top
management’s commitment to TQM). Specific voids and deficiencies identified in
each section will subsequently be discussed.
8.5.2 Section A: Leadership and top management’s commitment
The following specific deficiencies in respect of section A (leadership and top
management’s commitment to TQM) were identified:
• All three categories of respondents indicated that they were unsure as to whether
top management provides sufficient guidance and really accepts responsibility to
properly establish TQM at air force bases.
• There are strong indications that top management themselves believe that they are
not fully committed to the TQM philosophy (both at an intellectual and emotional
level). The role that has to be played by top management to indicate their
commitment to the TQM philosophy is not strong enough. Top management
themselves are not sure that they are truly committed to a culture of TQM in the
amount of time they spent with customers, suppliers, employees and external
bases/community. A further deficiency of top management is the fact that they do
not show their full commitment by providing the right number of resources for the
quality effort.
• Top management is of the opinion that outside air force bases, they are not
recognised as leaders with regard to the implementation of improvements.
8.5.3 Section B: Strategic planning
In respect of section B (strategic planning) the following specific deficiencies were
identified:
• Top management does not do proper planning to make provision for possible
deviations from planned objectives.
• Top management is of the opinion that workers do not really understand the
interface between their tasks and air force bases’ strategic plans and objectives.
• Confirmation was obtained that air force bases’ suppliers, customers and
employees are not all involved in the quality improvement programmes of air force
bases.
8.5.4 Section C: Empowerment
In respect of section C (empowerment) the following specific deficiencies were
identified:
• Confirmation was obtained that air force base personnel have not been empowered
to reach their full potential.
• Certain workers are uncertain as to whether they really understand the TQM
philosophy.
• Uncertainty exists as to whether top management delegates decision making to
lower levels.
8.5.5 Section D: Teamwork
In respect of section D (teamwork) the following specific deficiencies were identified:
• There are strong indications that top management is more in favour of individual
rather than team recognition.
• According to the respondents, task groups at air force bases are not continuously
involved in the determination of measures for measuring internal and external
customer satisfaction.
• Respondents are of the opinion that air force bases’ performance within team
context cannot improve without the support of higher authority.
• Respondents are not sure that each department/section/subsection at air force
bases are actively involved in TQM projects.
8.5.6 Section E: Continuous improvement
In respect of section E (continuous improvement) the following specific deficiencies
were identified:
• Respondents are unsure as to whether an active programme to obtain comparative
benchmarking data in respect of all applicable functions and services from the best
SA Air Force bases does indeed exist.
• Quantification and measurement of improvements for service rendering at air force
bases are not of an acceptable standard. Air force bases also indicate deficiencies
in respect of the availability of techniques/aids for error-cause-elimination.
8.5.7 Section F: Customer and employee satisfaction
In respect of section F (customer and employee satisfaction) the following specific
deficiencies were identified:

• Confirmation was obtained that the degree of employee satisfaction at air force
bases is not of an acceptable standard. The inference was made that even though
air force bases do much to establish employee satisfaction, there are other factors
that can contribute to the fact that employees’ level of job satisfaction is not of an
acceptable standard.
• Respondents are unsure as to whether air force bases have developed well defined
customer service standards to deal with the complaints of customers (internal and
external) in order to eliminate deviations. According to the respondents they are
unsure as to whether air force bases do indeed have a generic model for all
departments/sections/subsections according to which customer service is rendered
to satisfy the expectations of the customers.
• There are strong indications that there are no aids and techniques to rate customer
satisfaction and customer needs. There are further indications that uncertainty
exists as to the establishment of design teams with customers at air force bases for
the aforementioned rating purposes.
8.5.8 Section G: Communication
In respect of section G (communication) the following specific deficiencies were
identified:
• There are strong indications that communication does not flow unhindered
horizontally, vertically and diagonally between departments, sections, subsections
and processes.
• Respondents are unsure whether effective communication occur between top
management and sections. Respondents are also unsure whether the workers of
air force bases do indeed receive all the information that they require in order to
perform their work properly.
8.5.9 Section H: Training
In respect of section H (training) the following specific deficiencies were identified:
• Respondents are unsure as to whether air force base employees do indeed receive
proper training (formal and informal) in respect of TQM.
• There are strong indications that air force bases do not have long-term training
programmes for all employees in respect of TQM.
8.5.10 Section I: Culture forming and change management
In respect of section I (culture forming and change management) the following specific
deficiencies were identified:
• Employees of air force bases are unsure as to whether the air force bases’ culture is
“preventative-orientated” rather than “reactive corrective-orientated”.
• There are indications that respondents do not fully understand the reasons and
need to change over from the status quo to a TQM philosophy. Respondents are
unsure as to whether employees who are affected the most by the change over to
the TQM philosophy, really understand what is expected of them in order to support
the change over.
8.5.11 Section J: Support structures, systems and resources
In respect of section J (support structure, systems and resources) the following specific
deficiencies were identified:
• There are strong indications that top management does not show sufficient
commitment to the TQM effort by providing the right and sufficient number of
resources to enhance total quality efforts.
• There are uncertainty as to whether top management provides the right support
structure, systems and resources to support the workers in the execution of their
daily tasks.
8.5.12 Section K: Systems thinking
In respect of section K (systems thinking) the following specific deficiency was
identified:
• Confirmation was obtained that employees don’t understand that air force bases
should be managed according to the systems thinking approach based on many
interactions and interdependent forces.
8.5.13 Section L: Self-assessment
In respect of section L (self-assessment) the following specific deficiency was identified:
• There are indications that respondents are not sure as to whether they should
concentrate more on the enabler phase than on the result phase when
implementing the SAEF model.
8.5.14 Section M: Processes
In respect of section M (processes) the following specific deficiencies were identified:
• There are strong indications that not all employees sufficiently understand the basic
principle of processes to be able to do their work properly.
• Employees are not sure that sufficient resources are provided based on processes.
8.6 SUMMARY
In this chapter the results of the questionnaire that were obtained from the 543
respondents were discussed in detail. Statistic analyses, based on the information
obtained from questionnaire one, were provided on specific biographical variables of
the participating respondents. Questionnaire two (dealing with the attitude of the
personnel towards the nature and scope of the 14 TQM dimensions of the framework
and the acceptance of TQM implementation as an internal organisational arrangement
for personnel at air force bases) was processed statistically to make inferences that can
contribute to the enhancement of TQM at air force bases. In the concluding chapter,
the inferences made above are discussed and are related to the suggested quality
framework in chapter 3. More specific and representative recommendations and
conclusions are made that can contribute to the elimination of the deficiencies in TQM
at air force bases in order to equip them better for the implementation of TQM.
Top Related
Copyright © 2022 FDOKUMEN

