


Bahasa
Halaman
Hukum

Citation: Casian, T.; Nagy, B.; Kovács,
B.; Galata, D.L.; Hirsch, E.; Farkas, A.
Challenges and Opportunities of
Implementing Data Fusion in Process
Analytical Technology—A Review.
Molecules 2022, 27, 4846. https://
doi.org/10.3390/molecules27154846
Academic Editor: Irene Panderi
Received: 30 June 2022
Accepted: 22 July 2022
Published: 28 July 2022
Publisher’s Note: MDPI stays neutral
with regard to jurisdictional claims in
published maps and institutional affil-
iations.
Copyright: © 2022 by the authors.
Licensee MDPI, Basel, Switzerland.
This article is an open access article
distributed under the terms and
conditions of the Creative Commons
Attribution (CC BY) license (https://
creativecommons.org/licenses/by/
4.0/).
molecules
Review
Challenges and Opportunities of Implementing Data Fusion inProcess Analytical Technology—A ReviewTibor Casian 1, Brigitta Nagy 2,*, Béla Kovács 3 , Dorián László Galata 2, Edit Hirsch 2 and Attila Farkas 2
1 Department of Pharmaceutical Technology and Biopharmacy, “Iuliu Hatieganu” University of Medicine andPharmacy, 400012 Cluj-Napoca, Romania; [email protected]
2 Department of Organic Chemistry and Technology, Budapest University of Technology and Economics,H-1111 Budapest, Hungary; [email protected] (D.L.G.); [email protected] (E.H.);[email protected] (A.F.)
3 Department of Biochemistry and Environmental Chemistry, George Emil Palade University of Medicine,Pharmacy, Science, and Technology of Târgu Mures, , 540139 Târgu Mures, , Romania; [email protected]
* Correspondence: [email protected]; Tel.: +36-1-463-1111/5918
Abstract: The release of the FDA’s guidance on Process Analytical Technology has motivated andsupported the pharmaceutical industry to deliver consistent quality medicine by acquiring a deeperunderstanding of the product performance and process interplay. The technical opportunities to reachthis high-level control have considerably evolved since 2004 due to the development of advancedanalytical sensors and chemometric tools. However, their transfer to the highly regulated pharmaceu-tical sector has been limited. To this respect, data fusion strategies have been extensively applied indifferent sectors, such as food or chemical, to provide a more robust performance of the analyticalplatforms. This survey evaluates the challenges and opportunities of implementing data fusionwithin the PAT concept by identifying transfer opportunities from other sectors. Special attention isgiven to the data types available from pharmaceutical manufacturing and their compatibility withdata fusion strategies. Furthermore, the integration into Pharma 4.0 is discussed.
Keywords: data fusion; process analytical technology; chemometrics; process control
1. Introduction
The pharmaceutical industry has witnessed substantial changes from a regulatoryperspective in the past few decades, aiming to ensure the quality of the pharmaceuticalproduct by a thorough understanding of both the product particularities and the manu-facturing thereof [1]. The adoption of the ICH Q8-10 guidelines and the elaboration of theconcept of design of experiments by pioneering researchers in this field represented notablemilestones in the quality management of pharmaceutical products [2–4]. Concurrently tothese, the appearance of the Food and Drug Administration’s (FDA) guidance on ProcessAnalytical Technology (PAT) in 2004 forecasted an important paradigm shift of the majorregulatory bodies according to which quality cannot be tested in products; it should bebuilt-in or should be by design [5].
The driving force of many pharmaceutical companies to introduce PAT in their man-ufacturing environment is referring to the reduced batch failures and reprocessing, pro-duction process optimization, and faster release testing with the opportunity to enablereal-time release testing through feedback and feedforward control loops [6]. The immedi-ate financial benefit/impact of a PAT-based control strategy translates into an increase inproduction yield and a reduction in manufacturing costs. The increased amount of dataobtained from monitoring can further guide the optimization and continuous improvementof the system, generating additional monetary value [7]. This ability to monitor a processin real-time and obtain an improved understanding of product-process interplay requiresappropriate tools (PAT instruments) that can track the right product attributes [6].
Molecules 2022, 27, 4846. https://doi.org/10.3390/molecules27154846 https://www.mdpi.com/journal/molecules
Molecules 2022, 27, 4846 2 of 41
Process monitoring can be performed with various instruments, from built-in uni-variate sensors to more complex sensors that can be interfaced with the process stream.Both options could be very efficient if sufficient data is used to design these process controltools to support their use. Thus, the reliability of a PAT procedure for the manufacturingrequirements and the selected control strategy is conditioned by its design, performancequalification, and ongoing performance verification within proper lifecycle management [8].
The major challenges associated with the adoption of PAT in the pharmaceuticalindustry refer to the integration of the probe, the sampling interface, data collection,modeling, linking to a control system, the calibration of the method, and finally, thevalidation of the integral system. Frequently, these high throughput instruments producelarge datasets recorded over multiple variables, requiring specialized data analysis methods.In this respect, the European Directorate for the Quality of Medicines and Healthcare issuedthe “Chemometric methods applied to analytical data” monograph in 2016 to encourageusing these analysis methods as an integral part of PAT applications [8].
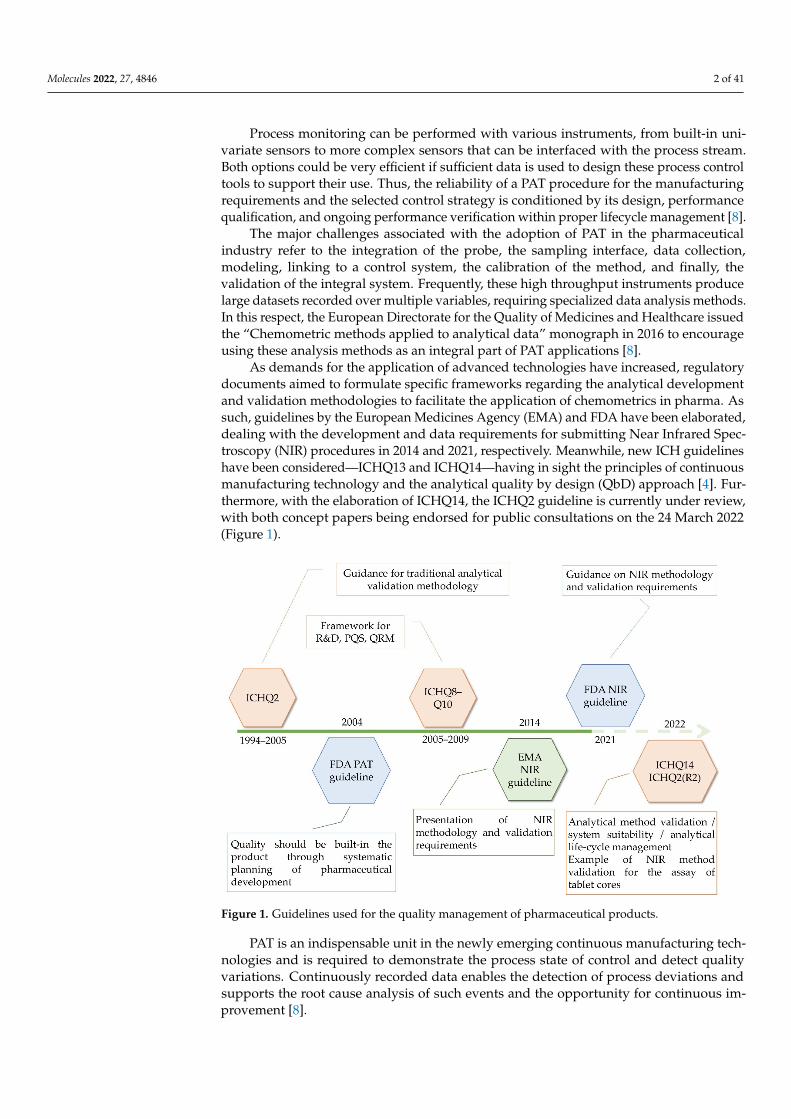
As demands for the application of advanced technologies have increased, regulatorydocuments aimed to formulate specific frameworks regarding the analytical developmentand validation methodologies to facilitate the application of chemometrics in pharma. Assuch, guidelines by the European Medicines Agency (EMA) and FDA have been elaborated,dealing with the development and data requirements for submitting Near Infrared Spec-troscopy (NIR) procedures in 2014 and 2021, respectively. Meanwhile, new ICH guidelineshave been considered—ICHQ13 and ICHQ14—having in sight the principles of continuousmanufacturing technology and the analytical quality by design (QbD) approach [4]. Fur-thermore, with the elaboration of ICHQ14, the ICHQ2 guideline is currently under review,with both concept papers being endorsed for public consultations on the 24 March 2022(Figure 1).
Molecules 2022, 27, x FOR PEER REVIEW 2 of 46
process in real-time and obtain an improved understanding of product-process interplay requires appropriate tools (PAT instruments) that can track the right product attributes [6].
Process monitoring can be performed with various instruments, from built-in uni-variate sensors to more complex sensors that can be interfaced with the process stream. Both options could be very efficient if sufficient data is used to design these process con-trol tools to support their use. Thus, the reliability of a PAT procedure for the manufac-turing requirements and the selected control strategy is conditioned by its design, perfor-mance qualification, and ongoing performance verification within proper lifecycle man-agement [8].
The major challenges associated with the adoption of PAT in the pharmaceutical in-dustry refer to the integration of the probe, the sampling interface, data collection, mod-eling, linking to a control system, the calibration of the method, and finally, the validation of the integral system. Frequently, these high throughput instruments produce large da-tasets recorded over multiple variables, requiring specialized data analysis methods. In this respect, the European Directorate for the Quality of Medicines and Healthcare issued the “Chemometric methods applied to analytical data” monograph in 2016 to encourage using these analysis methods as an integral part of PAT applications [8].
As demands for the application of advanced technologies have increased, regulatory documents aimed to formulate specific frameworks regarding the analytical development and validation methodologies to facilitate the application of chemometrics in pharma. As such, guidelines by the European Medicines Agency (EMA) and FDA have been elabo-rated, dealing with the development and data requirements for submitting Near Infrared Spectroscopy (NIR) procedures in 2014 and 2021, respectively. Meanwhile, new ICH guidelines have been considered—ICHQ13 and ICHQ14—having in sight the principles of continuous manufacturing technology and the analytical quality by design (QbD) ap-proach [4]. Furthermore, with the elaboration of ICHQ14, the ICHQ2 guideline is cur-rently under review, with both concept papers being endorsed for public consultations on the 24th of March, 2022 (Figure 1).
Figure 1. Guidelines used for the quality management of pharmaceutical products.
Figure 1. Guidelines used for the quality management of pharmaceutical products.
PAT is an indispensable unit in the newly emerging continuous manufacturing tech-nologies and is required to demonstrate the process state of control and detect qualityvariations. Continuously recorded data enables the detection of process deviations andsupports the root cause analysis of such events and the opportunity for continuous im-provement [8].
Molecules 2022, 27, 4846 3 of 41
Drug products present a complex quality profile built around multiple critical qualityattributes (CQAs) influenced by controlled (formulation and process) and uncontrolledfactors. A multivariate approach to product/process understanding is critical due to thecomplex interactions between these input factors affecting product quality. Moreover, thesefactors are likely to have different influence patterns between several quality attributes.To efficiently describe and understand these influences, a Design of Experiments-baseddevelopment with response surface methodology is recommended [3,4].
If the recorded data accounts for multiple factors influencing that particular response,predicting complex quality attributes from PAT data can be managed appropriately fromonly one data source. Under these circumstances, the variation of any influential factor willbe captured/perceived in the process analytical data and contribute to the method’s robustpredictive performance. Thus, to obtain a robust monitoring performance, it is essential toidentify the PAT tool sensible to these factors or to fuse multiple process analytical data.
The readily available advanced analytical platforms provide large amounts of di-verse data associated with manufacturing processes that can be used for monitoring andpredictive purposes. The challenge, in this case, refers to the integration of data fromdifferent sources to maximize the advantages of complementary information. The under-lying idea/notion in performing data fusion (DF) is that the result of the fused datasetwill be more informative than the individual datasets. Thus, this procedure will provide amore enhanced overview of the studied system with a more in-depth understanding anddata-driven decision-making [9–11].
Implementing the DF concept in PAT represents the next step in the evolution ofprocess monitoring technology that could provide a more comprehensive understandingof the system and the opportunity to predict complex quality attributes of drug products.Probably, due to the more strictly regulated field of the pharmaceutical industry, the use ofthis concept in drug manufacturing has been limited to some extent.
Several review papers are available on DF, focusing on the chemometric/data pro-cessing or the application side of data integration. Azcarate et al. published a reviewon DF, focusing on the structure of data originating from different sources along withDF strategies [12]. Mishra et al. reviewed the application of multi-block analysis meth-ods for multi-source data integration, highlighting the advantages, disadvantages, andparticularities of different techniques [13]. On the same subject, Campos et al. reviewedthe pre-processing methods for multiblock applications [14]. Moreover, a relevant reviewon the application of pre-processing strategies and pre-processing fusion approaches isavailable from Mishra et al. [15].
On the application side of DF, food applications predominate. Zhou et al. reviewedthe application of DF technology in food quality authentication applications, providingan effective comparison with non-fusion approaches [16]. Borras et al. provided a generaloverview of DF strategies implemented for food and beverage characterization [17]. Twoother reviews are available on the application of artificial senses in food quality assess-ment [18,19].
This review evaluates the challenges and opportunities of implementing DF in thepharmaceutical industry, namely PAT, considering applications from other sectors. Themanuscript is organized into five sections. The first part focuses on the pharmaceuticaldomain’s data types, considering small molecule processing and biotechnology. The secondpart presents the concept behind DF, data processing, and modeling strategies. The thirdsection reviews the use of DF in classification, regression, and process control applications,focusing on the interplay between input data structure, DF strategy, and performanceimprovement. Moreover, attention is given to the handling of spectroscopic data. Thefourth part discusses the validation of these models, detailing the methodology used toevaluate the performance of these models in the surveyed literature and the expectationsfrom a regulatory point of view. The last part presents the integration into Pharma 4.0 andsome future perspectives.
Molecules 2022, 27, 4846 4 of 41
The overall purpose of this work is to provide a systematic summary of all the keyelements that must be considered during the use of DF within PAT applications and tosupport its implementation in real-life situations.
2. Data Types in the Pharmaceutical Industry2.1. Off-Line Acquired Material Information
The utility of data acquired during routine in-process control (IPC) measurementscan be extended if used as input in models that predict the behavior of processes wherethese manufactured materials are used. These measurements can characterize the com-position of the samples (most commonly active pharmaceutical ingredient—API content,moisture/residual solvent content, and the concentration of contaminants). Another rele-vant type of information comes from the granulometric characterization of powders. Thisincludes the particle size distribution (PSD) (typically measured with laser diffraction orsieve analysis), the shape of particles (characterized by static or dynamic image analysis),the density of the powder (bulk, tapped, or true density), and the flowability (flowing time,angle of repose, Carr index, Hausner ratio). Tablet cores can be evaluated by measuringtheir mass, diameter, height, crushing strength, disintegration time, and friability. Further-more, all techniques mentioned in the next part can also be applied as off-line tools for IPCmeasurements [20,21].
2.2. Real-Time Measured Data
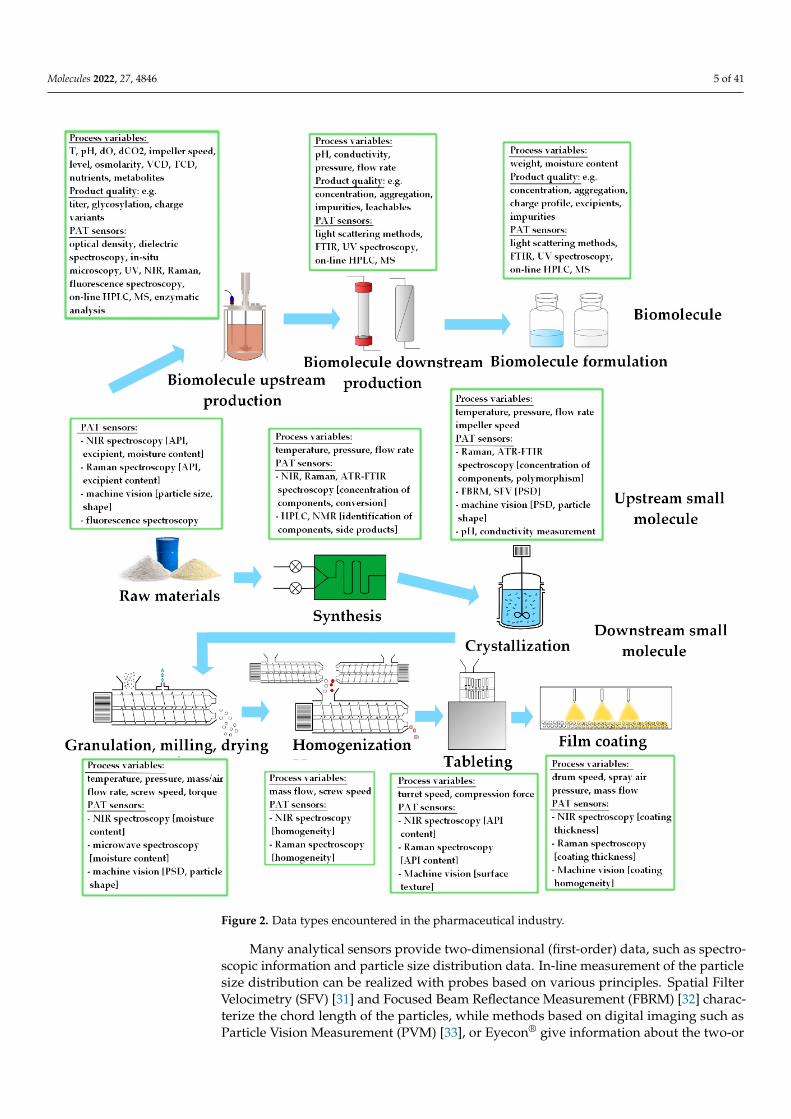
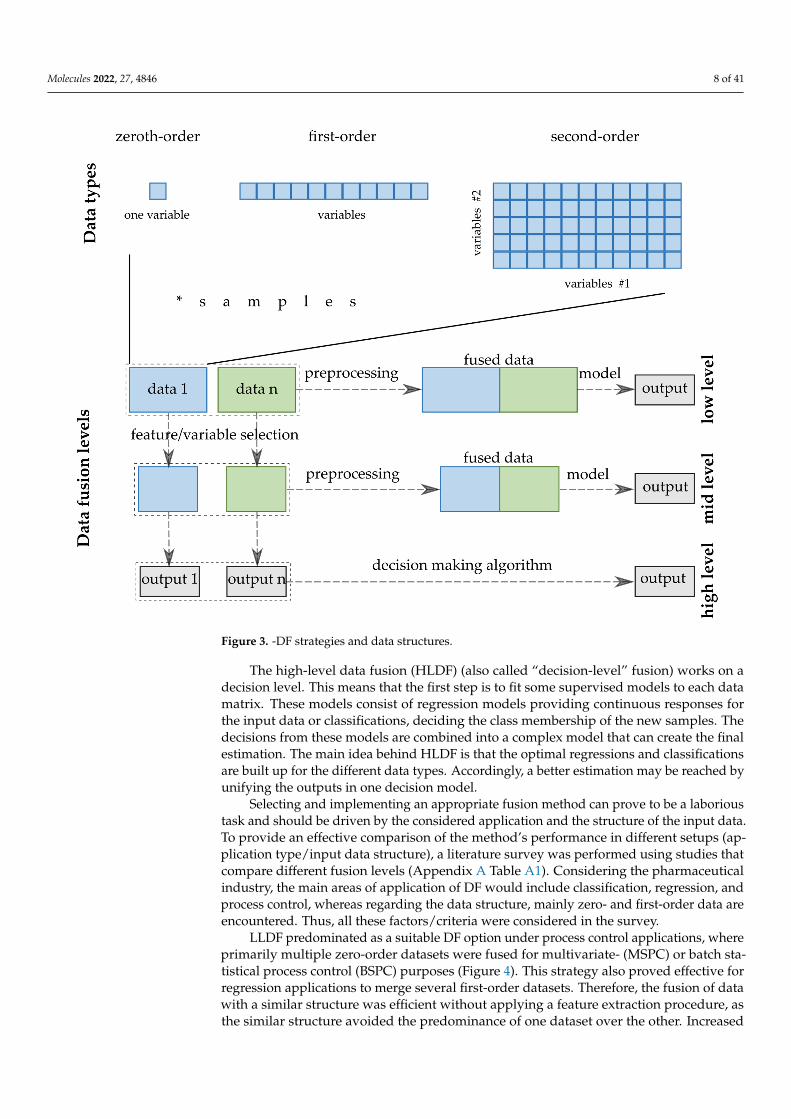
Nowadays, a great variety of real-time sensors is available in pharmaceutical manufac-turing (Figure 2) [22–24]. The dimensionality of the yielded data varies significantly fromsimple numbers to large three-dimensional matrices. In this respect, we can differentiatebetween zero-, first- and second-order structures. Zeroth-order data contains one responseper sample, first-order data describes sample properties using multiple variables (a vector),whereas second-order data includes a matrix for each sample [12].
One-dimensional (zeroth-order) data is acquired when measuring some of the funda-mental physical properties of the system. Temperature is a classic example; it is a criticalparameter in many processes, including chemical reactions, granulation, and film coating.Its real-time measurement can be accomplished with various instruments. Thermocouplesare a widespread solution, as they can be installed in multiple places inside an appli-ance [25]. The measurement of pressure is essential in many instances, as apart frominfluencing the quality of the product, its monitoring is a fundamental part of preventingaccidents. The amount of applied force is a crucial parameter of compaction processes.Thus, it should be registered during dry granulation and tableting. The accurate real-timemeasurement of weight with scales is vital in continuous manufacturing, where the massflow of the components is determined by the feeding rate of the feeders [26]. Moreover,real-time weight measurement is also used in batch processes to keep track of the amountof dosed material during wet granulation or film coating.
Monitoring the applied torque during high-shear or continuous twin-screw wet gran-ulation can be used to characterize the state of the process, as the fill level of the apparatusand the granular properties of the processed material can influence this parameter [27,28].The rotational speed of impellers in chemical or crystallization reactors and granulationappliances and the speed of the drum in film coating can also be registered [29]. The volumeflow and moisture content of air can also be critical parameters in the case of fluidized bedgranulation, drying, or film coating. The pH and conductivity value of the medium can bemeasured with in-line electrode probes during chemical reactions of crystallization [30].
Molecules 2022, 27, 4846 5 of 41Molecules 2022, 27, x FOR PEER REVIEW 5 of 46
Figure 2. Data types encountered in the pharmaceutical industry.
Monitoring the applied torque during high-shear or continuous twin-screw wet granulation can be used to characterize the state of the process, as the fill level of the ap-paratus and the granular properties of the processed material can influence this parameter [27,28]. The rotational speed of impellers in chemical or crystallization reactors and gran-ulation appliances and the speed of the drum in film coating can also be registered [29]. The volume flow and moisture content of air can also be critical parameters in the case of
Figure 2. Data types encountered in the pharmaceutical industry.
Many analytical sensors provide two-dimensional (first-order) data, such as spectro-scopic information and particle size distribution data. In-line measurement of the particlesize distribution can be realized with probes based on various principles. Spatial FilterVelocimetry (SFV) [31] and Focused Beam Reflectance Measurement (FBRM) [32] charac-terize the chord length of the particles, while methods based on digital imaging such asParticle Vision Measurement (PVM) [33], or Eyecon® give information about the two-or
Molecules 2022, 27, 4846 6 of 41
three-dimensional shape of the particles [34]. The data obtained from these sensors usuallyconsists of the volume fraction of particles of different sizes.
Due to the dynamic evolution of spectroscopic techniques, most forms of spectroscopycan now be performed in-line or on-line with commercially available instruments. Theirsignal consists of the absorbance or intensity measured at multiple wavelengths. Typi-cally, this information needs to be processed using multivariate data analysis techniquesbefore being used as input in a DF process model. Near-infrared (NIR) [35] and Ramanspectroscopy [36] can be applied in almost all types of pharmaceutical processes, as theycan be used to predict the composition and various physical properties of intermediate andend products. Microwave sensors have been proposed as an alternative for quantifyingthe composition of pharmaceutical products [37]. The concentration of some APIs can bemonitored using the light-induced fluorescence method [38]. Attenuated total reflectanceFourier transform infrared (ATR-FTIR) spectroscopy can also be used in situ in liquidphase systems, having widespread applications in monitoring crystallization [39]. In thisfield, attenuated total reflection ultraviolet/visible (ATR-UV/Vis) spectroscopy can alsobe utilized to measure the concentration of components [40]. Terahertz spectroscopy hasalso become an option for characterizing solid-state pharmaceutical products [41]. With anappropriate sampling system, even nuclear magnetic resonance (NMR) spectroscopy andhigh-performance liquid chromatography (HPLC) measurements can be performed on-line,providing an unparalleled ability to understand and control chemical syntheses [42]. Fur-thermore, even the sound emitted by an apparatus can be used to gain information aboutits state. Acoustic emission measurements are designed for this purpose [43]. In summary,the great flexibility of spectroscopy makes these techniques excellent PAT sensors.
The most complex form of information comes from imaging appliances. The recordedsignal enables the characterization of sample features’ spatial distribution. Digital imagesare the simplest example of such techniques; machine vision is a sensor that can be appliedin-line during practically all pharmaceutical processes [34]. It is a highly flexible tool thatcan characterize samples’ size, shape, texture, and color. Optical coherence tomography isan imaging technique with promising abilities in the real-time monitoring of film coating,as the obtained images enable an accurate measurement of coating thickness [44]. Terahertzpulsed imaging can also be applied for this purpose [45]. Hyperspectral imaging records aspectrum at each pixel of the image, enabling the prediction of the samples’ composition ineach pixel. Raman [46], UV, and NIR spectroscopy can all be used to obtain hyperspectralimages, UV [47] and NIR imaging [48] already exist in applicable real-time forms.
2.3. Biopharmaceutical Aspects
The manufacturing of most biopharmaceuticals (except DNA/RNA and peptides)includes production using bioreactor cell cultivation, chromatographic purifications, filtra-tion steps, and formulation either in a liquid or solid form. Several methods are used tomonitor CQAs of raw materials and critical process parameters (CPPs) as real-time dataduring these processes.
The cell culture media’s quality is of utmost importance to maintain process robust-ness. It usually contains various substances (>50) in a relatively low concentration. Thus,to characterize media quality, NMR, HPLC-MS/MS, and spectroscopic methods, suchas fluorescence- (2D, 3D), infrared- (NIR, MIR, FT-IR), or Raman spectroscopy are used,resulting in complex multi-dimensional data [49–54]. In addition, the advantages of mul-tivariate data analysis and DF methods can be utilized to gain accurate information onmedia quality [55].
Real-time measurements of basic physicochemical parameters (such as temperature,pH, conductivity, dissolved O2 and CO2, impeller speed, pressure, flow rate, weight, andmoisture content) resulting in one-dimensional data are conventionally carried out duringbiopharmaceutical production [56,57]. However, gaining information on the cells andmonitoring nutrient and metabolite concentrations during bioreactor cell cultivation is alsonecessary [58]. Optical density sensors measure the transmitted light absorbance, which
Molecules 2022, 27, 4846 7 of 41
correlates to total cell density. However, it gives no information on viability. Dielectricspectroscopy can be used to determine viable cell density, where the capacitance of thecell suspension is measured in an alternating frequency electric field, generating multi-dimensional data [59]. If the morphology of the cells is an essential factor, in situ microscopyaided with image analysis can be implemented in the bioreactor [60].
Spectroscopic methods (UV-, NIR-, Raman- and Fluorescence spectroscopy) haveapplications for monitoring several cell culture parameters, such as nutrient and metaboliteconcentrations, total and viable cell density, product concentration, and product qual-ity [61,62]. Raman spectroscopy is gaining importance in biopharmaceutical manufacturingas a multi-attribute multi-dimensional sensor due to its specificity and compatibility withaqueous solutions [63]. During the purification of the biomolecules, monitoring of productconcentration and impurities is possible with spectroscopic methods [64]. Besides theconventionally used UV absorbance at 280 nm as one-dimensional data or as a multi-wavelength method, variable pathlength UV spectroscopy allows the accurate detection ofanalytes in a high concentration range [65]. Furthermore, several analytical techniques areused to detect aggregates in a wide size range, from which only a few can be integratedas an in-line PAT tool (e.g., light scattering methods) [66,67]. When there is no availablein-line analytical tool for monitoring a CQA/CPP, an automated, sterile sampling systemcan be integrated into the process. This is the case for several CQAs where the integrationof an online sampling and sample preparation system coupled with HPLC or HPLC-MScan be applied [68].
3. Data Fusion3.1. Classification and Comparison of Fusion Methods
Several aspects exist that are used to classify the fusion methods/strategies in theterminology. Joint Directors of Laboratories (JDL) Data Fusion Group worked out a modelthat deals with the categorization of the information and DF. Castanedo systematizedthe classification of the DF techniques and strategies [69]. The divisions can be createdby several criteria; however, the widespread classification used to accept in analyticalchemistry follows the abstraction level of the input data [70]. The three levels are namedafter the complexity of the processing of the inputs from the data sources. Thus, low-,medium- and high-level DFs are distinguished (Figure 3).
Low-level data fusion (LLDF) is considered the simplest method to achieve a com-bination of inputs. In this case, the data is rearranged into a new data matrix, where thevariables coming from different sources are placed one after the other. The columns, i.e., thevariables of the combined data matrix, will be the sum of the previously separated data sets.Usually, the concatenated data are then pretreated before creating the final classificationor regression models. However, specific elementary operations can be conducted beforeputting them together [17].
Medium-(mid-)level data fusion (MLDF) (also called “feature-level” fusion) is basedon a preliminary feature extraction that continues to maintain the relevant variables, elim-inating the not sufficiently diverse, non-informative variables from the datasets. Thereare many developed algorithms to select these features or make the data reduction beforemerging them into one matrix that will be used in a chemometric method [71]. In detail,these variable selection methods are discussed with the other preprocessing methods inSection 3.2.
Molecules 2022, 27, 4846 8 of 41
Molecules 2022, 27, x FOR PEER REVIEW 8 of 46
many developed algorithms to select these features or make the data reduction before merging them into one matrix that will be used in a chemometric method [71]. In detail, these variable selection methods are discussed with the other preprocessing methods in Section 3.2.
Figure 3. -DF strategies and data structures.
The high-level data fusion (HLDF) (also called “decision-level” fusion) works on a decision level. This means that the first step is to fit some supervised models to each data matrix. These models consist of regression models providing continuous responses for the input data or classifications, deciding the class membership of the new samples. The de-cisions from these models are combined into a complex model that can create the final estimation. The main idea behind HLDF is that the optimal regressions and classifications are built up for the different data types. Accordingly, a better estimation may be reached by unifying the outputs in one decision model.
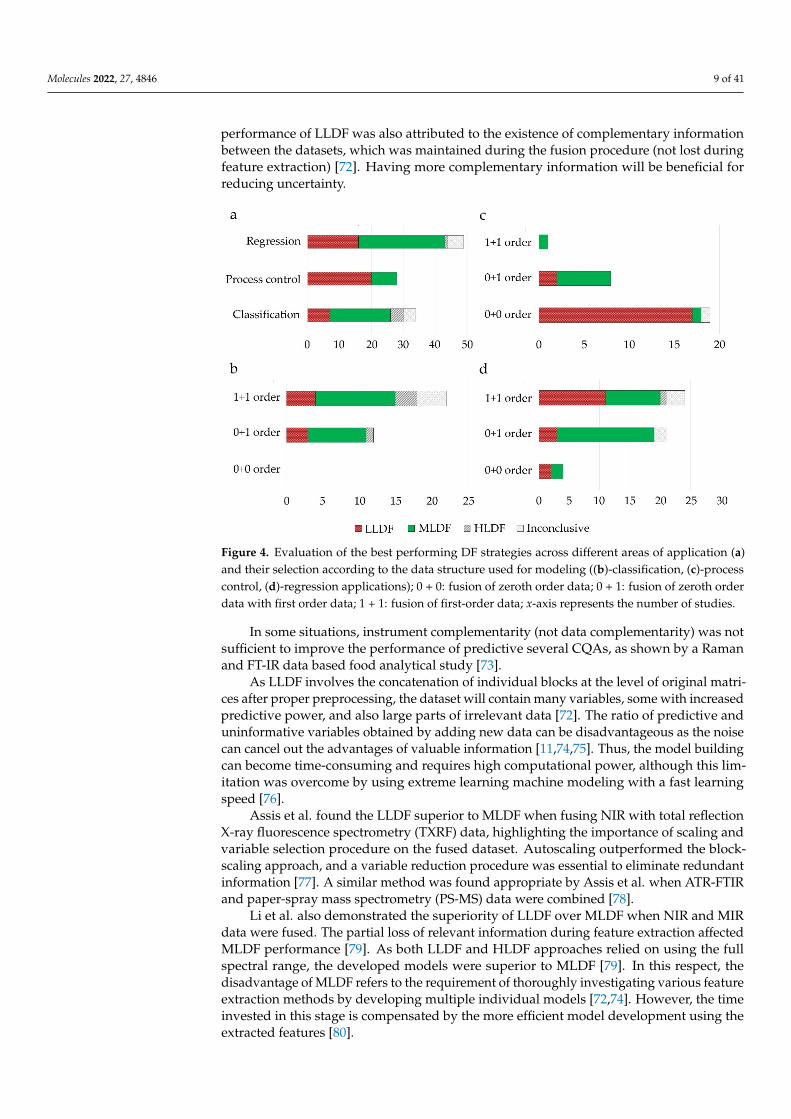
Selecting and implementing an appropriate fusion method can prove to be a labori-ous task and should be driven by the considered application and the structure of the input data. To provide an effective comparison of the method’s performance in different setups (application type/input data structure), a literature survey was performed using studies that compare different fusion levels (Appendix A Table A1). Considering the pharmaceu-tical industry, the main areas of application of DF would include classification, regression, and process control, whereas regarding the data structure, mainly zero- and first-order data are encountered. Thus, all these factors/criteria were considered in the survey.
LLDF predominated as a suitable DF option under process control applications, where primarily multiple zero-order datasets were fused for multivariate- (MSPC) or
Figure 3. -DF strategies and data structures.
The high-level data fusion (HLDF) (also called “decision-level” fusion) works on adecision level. This means that the first step is to fit some supervised models to each datamatrix. These models consist of regression models providing continuous responses forthe input data or classifications, deciding the class membership of the new samples. Thedecisions from these models are combined into a complex model that can create the finalestimation. The main idea behind HLDF is that the optimal regressions and classificationsare built up for the different data types. Accordingly, a better estimation may be reached byunifying the outputs in one decision model.
Selecting and implementing an appropriate fusion method can prove to be a laborioustask and should be driven by the considered application and the structure of the input data.To provide an effective comparison of the method’s performance in different setups (ap-plication type/input data structure), a literature survey was performed using studies thatcompare different fusion levels (Appendix A Table A1). Considering the pharmaceuticalindustry, the main areas of application of DF would include classification, regression, andprocess control, whereas regarding the data structure, mainly zero- and first-order data areencountered. Thus, all these factors/criteria were considered in the survey.
LLDF predominated as a suitable DF option under process control applications, whereprimarily multiple zero-order datasets were fused for multivariate- (MSPC) or batch sta-tistical process control (BSPC) purposes (Figure 4). This strategy also proved effective forregression applications to merge several first-order datasets. Therefore, the fusion of datawith a similar structure was efficient without applying a feature extraction procedure, asthe similar structure avoided the predominance of one dataset over the other. Increased
Molecules 2022, 27, 4846 9 of 41
performance of LLDF was also attributed to the existence of complementary informationbetween the datasets, which was maintained during the fusion procedure (not lost duringfeature extraction) [72]. Having more complementary information will be beneficial forreducing uncertainty.
Molecules 2022, 27, x FOR PEER REVIEW 9 of 46
batch statistical process control (BSPC) purposes (Figure 4). This strategy also proved ef-fective for regression applications to merge several first-order datasets. Therefore, the fu-sion of data with a similar structure was efficient without applying a feature extraction procedure, as the similar structure avoided the predominance of one dataset over the other. Increased performance of LLDF was also attributed to the existence of complemen-tary information between the datasets, which was maintained during the fusion proce-dure (not lost during feature extraction) [72]. Having more complementary information will be beneficial for reducing uncertainty.
Figure 4. Evaluation of the best performing DF strategies across different areas of application (a) and their selection according to the data structure used for modeling ((b)-classification, (c)-process control, (d)-regression applications); 0 + 0: fusion of zeroth order data; 0 + 1: fusion of zeroth order data with first order data; 1 + 1: fusion of first-order data; X-axis represents the number of studies.
In some situations, instrument complementarity (not data complementarity) was not sufficient to improve the performance of predictive several CQAs, as shown by a Raman and FT-IR data based food analytical study [73].
As LLDF involves the concatenation of individual blocks at the level of original ma-trices after proper preprocessing, the dataset will contain many variables, some with in-creased predictive power, and also large parts of irrelevant data [72]. The ratio of predic-tive and uninformative variables obtained by adding new data can be disadvantageous as the noise can cancel out the advantages of valuable information [11,74,75]. Thus, the model building can become time-consuming and requires high computational power, alt-hough this limitation was overcome by using extreme learning machine modeling with a fast learning speed [76].
Assis et al. found the LLDF superior to MLDF when fusing NIR with total reflection X-ray fluorescence spectrometry (TXRF) data, highlighting the importance of scaling and variable selection procedure on the fused dataset. Autoscaling outperformed the block-scaling approach, and a variable reduction procedure was essential to eliminate redun-dant information [77]. A similar method was found appropriate by Assis et al. when ATR-FTIR and paper-spray mass spectrometry (PS-MS) data were combined [78].
Li et al. also demonstrated the superiority of LLDF over MLDF when NIR and MIR data were fused. The partial loss of relevant information during feature extraction affected MLDF performance [79]. As both LLDF and HLDF approaches relied on using the full
Figure 4. Evaluation of the best performing DF strategies across different areas of application (a)and their selection according to the data structure used for modeling ((b)-classification, (c)-processcontrol, (d)-regression applications); 0 + 0: fusion of zeroth order data; 0 + 1: fusion of zeroth orderdata with first order data; 1 + 1: fusion of first-order data; x-axis represents the number of studies.
In some situations, instrument complementarity (not data complementarity) was notsufficient to improve the performance of predictive several CQAs, as shown by a Ramanand FT-IR data based food analytical study [73].
As LLDF involves the concatenation of individual blocks at the level of original matri-ces after proper preprocessing, the dataset will contain many variables, some with increasedpredictive power, and also large parts of irrelevant data [72]. The ratio of predictive anduninformative variables obtained by adding new data can be disadvantageous as the noisecan cancel out the advantages of valuable information [11,74,75]. Thus, the model buildingcan become time-consuming and requires high computational power, although this lim-itation was overcome by using extreme learning machine modeling with a fast learningspeed [76].
Assis et al. found the LLDF superior to MLDF when fusing NIR with total reflectionX-ray fluorescence spectrometry (TXRF) data, highlighting the importance of scaling andvariable selection procedure on the fused dataset. Autoscaling outperformed the block-scaling approach, and a variable reduction procedure was essential to eliminate redundantinformation [77]. A similar method was found appropriate by Assis et al. when ATR-FTIRand paper-spray mass spectrometry (PS-MS) data were combined [78].
Li et al. also demonstrated the superiority of LLDF over MLDF when NIR and MIRdata were fused. The partial loss of relevant information during feature extraction affectedMLDF performance [79]. As both LLDF and HLDF approaches relied on using the fullspectral range, the developed models were superior to MLDF [79]. In this respect, thedisadvantage of MLDF refers to the requirement of thoroughly investigating various featureextraction methods by developing multiple individual models [72,74]. However, the timeinvested in this stage is compensated by the more efficient model development using theextracted features [80].
Molecules 2022, 27, 4846 10 of 41
MLDF was preferred when first-order data was combined with a zero-order or anotherfirst-order dataset (Figure 4). MLDF outperformed other fusion strategies when the featureextraction methods successfully excluded the uncorrelated variables.
If the extraction of features does not lead to the loss of predictive information, theMLDF strategy can offer a more accurate model and improved stability [81]. Therefore,the desired outcome of feature extraction is to maximize the amount of predictive variablecontent and minimize data size [82].
MLDF can offer a more balanced representation of variability captured in each dataset,especially when the number of variables is considerably large. The increased stability androbustness of MLDF over LLDF were also described in other studies [75,83,84]. The highlevel of redundant information found in LLDF data, negatively affected the synergisticeffect of the fusion for different datasets [75,82,85].
A huge amount of information is involved when handling spectroscopic data. Thus,feature extraction is frequently implemented. Perfect classification of sample origin wasachieved by separately extracting features from three different spectroscopic analysistechniques (NIR, fluorescence spectroscopy, and laser-induced breakdown spectroscopy(LIBS)) [86]. A similar discrimination model with successful identification was demon-strated for tablets using LIBS and IR spectra and MDLF [87].
Among the three areas of application, HLDF was selected as the best performingmainly in the case of classification applications when fusing first-order datasets (Figure 3).The utility of HLDF was also highlighted under similar input conditions in the case ofregression applications (Figure 4).
Li et al. demonstrated that the synergistic effect of fusing data (FT-MIR; NIR) wasachieved only when the valuable part of the data was used. LLDF was poorly performingdue to the increased content of useless data, whereas the best classification strategy reliedon HLDF [82]. The application dependency for selecting the fusion strategy has beenrecognized in other studies [72]. Another NIR and MIR-based application demonstrated thesuperior performance of HLDF, as the LLDF led to the loss of complementary informationin the large dataset. At the same time, the MLDF approach gave mixed results dependingon the evaluated response [11]. The use of the entire dataset over extracted features wasthe reason for HLDF superiority in another study [79].
In a previous study, LLDF caused no progression in classification, as presumably theanalytical methods and sensors had dissimilar efficiency and provided noisy and redundantdata [88]. Therefore, each output of the models had to be considered with different weightsto make the final decision.
The advantages of HLDF are linked to its user-friendliness [11], and the possibility toeasily update models with new data sources increases the versatility [89].
3.2. Data Processing
Regardless of the specific goal of the DF, the data measured by the analytical tools andsensors must be processed by various methods before building up chemometric models.
Firstly, the data sets might have different sizes, scales, and magnitudes. This canbe handled by normalization and standardization to rescale the values into a range orto zero mean and unit variance. Autoscaling could be an appropriate solution for thefusion of univariate sensors with multivariate data, which frequently occurs in chemical orpharmaceutical processes [90–93]. The min-max normalization is suitable for MS [94] andsome vibrational spectroscopic data [86,95]. It is typical to use normalization methods orelemental peak ratios for LIBS data to minimize the variability of replicates [96].
In the absence of differences in the measurement scale, additional preprocessingmethods (scaling methods) will not be necessary, as the chance of dominating behaviorwill be reduced. This situation was encountered when mid-wave infrared (MWIR) andlow-wave infrared (LWIR) data recorded by the same device were fused [72].
Secondly, the data, especially the spectral data, is usually influenced by the externalinterferences and measuring conditions causing different backgrounds, noise, and offset.
Molecules 2022, 27, 4846 11 of 41
Many well-known methods exist to increase the robustness of the datasets and, later,the models. Savitzky–Golay smoothing (SGS) is a commonly used method for noisereduction in spectra [79,85,97]. Several methods are proposed to tackle additive and/ormultiplicative effects in spectral data. Background correction (BC) [98], MultiplicativeScatter Correction (MSC) [99], and Standard Normal Variate (SNV) [82,100] Unit area andvector normalization [98] are possible transformation methods to compensate for theseeffects. First or second derivatives are beneficial for enhancing the slight changes, thus,separating peaks of overlapping bands [40,75,101].
Thirdly, a dimensionality reduction step is essential to extract relevant features inMLDF [91,102,103]. Another justification for this step is to reduce the computational timeduring model development, i.e., for neural networks [104,105].
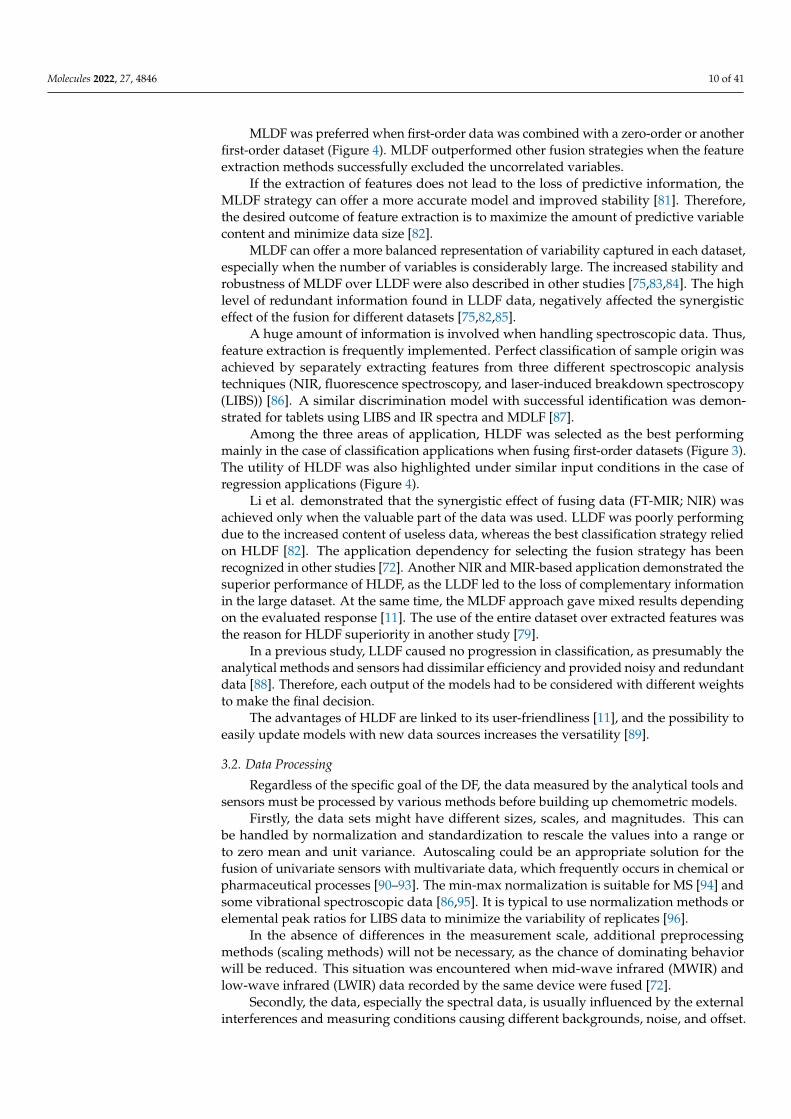
The applied feature extraction strategies identified in the literature survey can bedivided into feature selection procedures relying on algorithms for selecting a sub-intervalof the original dataset or on dimensionality reduction procedures, such as projectionmethods [76]. Moreover, their combined use has been demonstrated to have positiveresults in some situations [75,78,85]. The feature extraction methods applied in the literaturesurvey for first-order data are presented in Figure 5.
Molecules 2022, 27, x FOR PEER REVIEW 11 of 46
In the absence of differences in the measurement scale, additional preprocessing methods (scaling methods) will not be necessary, as the chance of dominating behavior will be reduced. This situation was encountered when mid-wave infrared (MWIR) and low-wave infrared (LWIR) data recorded by the same device were fused [72].
Secondly, the data, especially the spectral data, is usually influenced by the external interferences and measuring conditions causing different backgrounds, noise, and offset. Many well-known methods exist to increase the robustness of the datasets and, later, the models. Savitzky–Golay smoothing (SGS) is a commonly used method for noise reduction in spectra [79,85,97]. Several methods are proposed to tackle additive and/or multiplica-tive effects in spectral data. Background correction (BC) [98], Multiplicative Scatter Cor-rection (MSC) [99], and Standard Normal Variate (SNV) [82,100] Unit area and vector nor-malization [98] are possible transformation methods to compensate for these effects. First or second derivatives are beneficial for enhancing the slight changes, thus, separating peaks of overlapping bands [40,75,101].
Thirdly, a dimensionality reduction step is essential to extract relevant features in MLDF [91,102,103]. Another justification for this step is to reduce the computational time during model development, i.e., for neural networks [104,105].
The applied feature extraction strategies identified in the literature survey can be di-vided into feature selection procedures relying on algorithms for selecting a sub-interval of the original dataset or on dimensionality reduction procedures, such as projection methods [76]. Moreover, their combined use has been demonstrated to have positive re-sults in some situations [75,78,85]. The feature extraction methods applied in the literature survey for first-order data are presented in Figure 5.
Figure 5. (Other—1 entry/method: 2D-image based estimator; correlation-based feature selection-CFS; forward selection; IRIV; multivariate curve resolution-alternating least squares (MCR-ALS); PARAFAC; Random frog (RF); Spectral signatures and leaf venation feature extraction; spectral window selection (SWS); T2, Q—derived from NIR-based MSPC; UV; variable selection based on the normalized differences between reference and sample spectral data; Variables Combination Population Analysis and Iterative Retained Information Variable Algorithm—VCPA-IRIV).
The measured data, particularly the spectral data, often include irrelevant variables that should be separated from the initial variables. Variable selection algorithms eliminate noisy spectral regions and redundant information to increase predictive accuracy [75]. In this respect, several methods derived from partial least squares (PLS) have been used. The synergy interval PLS (SI-PLS) algorithm was applied to select optimal subintervals and exclude unwanted sources of variation before a feature extraction step [75,85]. De Oliviera et al. reduced the variable numbers from LIBS and NIR spectra below 1% by recursive PLS (rPLS) and used them for DF purposes [106].
Uninformative and noise affected variables have been excluded using interval-PLS (i-PLS) [107,108]. As i-PLS continuously selects the variables, it should not be applied when the original data are not continuous (i.e., MS spectra) [78]. The use of variable im-portance in the projection (VIP) and i-PLS has also been reported [100].
Figure 5. (Other—1 entry/method: 2D-image based estimator; correlation-based feature selection-CFS; forward selection; IRIV; multivariate curve resolution-alternating least squares (MCR-ALS);PARAFAC; Random frog (RF); Spectral signatures and leaf venation feature extraction; spectralwindow selection (SWS); T2, Q—derived from NIR-based MSPC; UV; variable selection based onthe normalized differences between reference and sample spectral data; Variables CombinationPopulation Analysis and Iterative Retained Information Variable Algorithm—VCPA-IRIV).
The measured data, particularly the spectral data, often include irrelevant variablesthat should be separated from the initial variables. Variable selection algorithms eliminatenoisy spectral regions and redundant information to increase predictive accuracy [75]. Inthis respect, several methods derived from partial least squares (PLS) have been used. Thesynergy interval PLS (SI-PLS) algorithm was applied to select optimal subintervals andexclude unwanted sources of variation before a feature extraction step [75,85]. De Olivieraet al. reduced the variable numbers from LIBS and NIR spectra below 1% by recursive PLS(rPLS) and used them for DF purposes [106].
Uninformative and noise affected variables have been excluded using interval-PLS(i-PLS) [107,108]. As i-PLS continuously selects the variables, it should not be applied whenthe original data are not continuous (i.e., MS spectra) [78]. The use of variable importancein the projection (VIP) and i-PLS has also been reported [100].
The VIP-based variable ranking has shown efficacy in filtering unimportant variablesand reducing variable space [84,108,109]. Generally, a VIP > 1 is considered relevant,although this limit has no statistical meaning [84,99,110]. In this respect, Rivera-Perez et al.identified discriminant variables through VIP and an additional statistical significancecriterium (p < 0.05) from ANOVA or t-tests [111].
The use of genetic algorithm (GA), iteratively retained informative variables (IRIV),competitive adaptive reweighted sampling (CARS), successive projections algorithm (SPA),
Molecules 2022, 27, 4846 12 of 41
recursive feature extraction (RFE), univariate filter (UF), and ordered predictors selection(OPS) has also been reported [78,86,94,108,110,112,113]. GAs have been used in spec-troscopic applications for optimal wavelength selection, multicollinearity, and noise re-duction [108]. The algorithm selects an initial set of spectral variables, which is furtheroptimized by testing multiple combinations of different features. The comparison betweenGA and UF [113], respectively, and GA and OPS variable selection methods has beeninvestigated for DF applications [78].
The fine-tuning of variables can be dealt with individually for each data set at thestatistical significance level, through Pearson correlation analysis [114]. Another optionthat enables the extraction of features from spectroscopic data is wavelet transformation.During this procedure, the original signal is decomposed considering different waveletscales, resulting in a series of coefficients [115]. Wavelet compression was used for thefusion of spectral data from different sources [107], while other studies fused differentscale-based wavelet coefficients generated from the same input data [115].
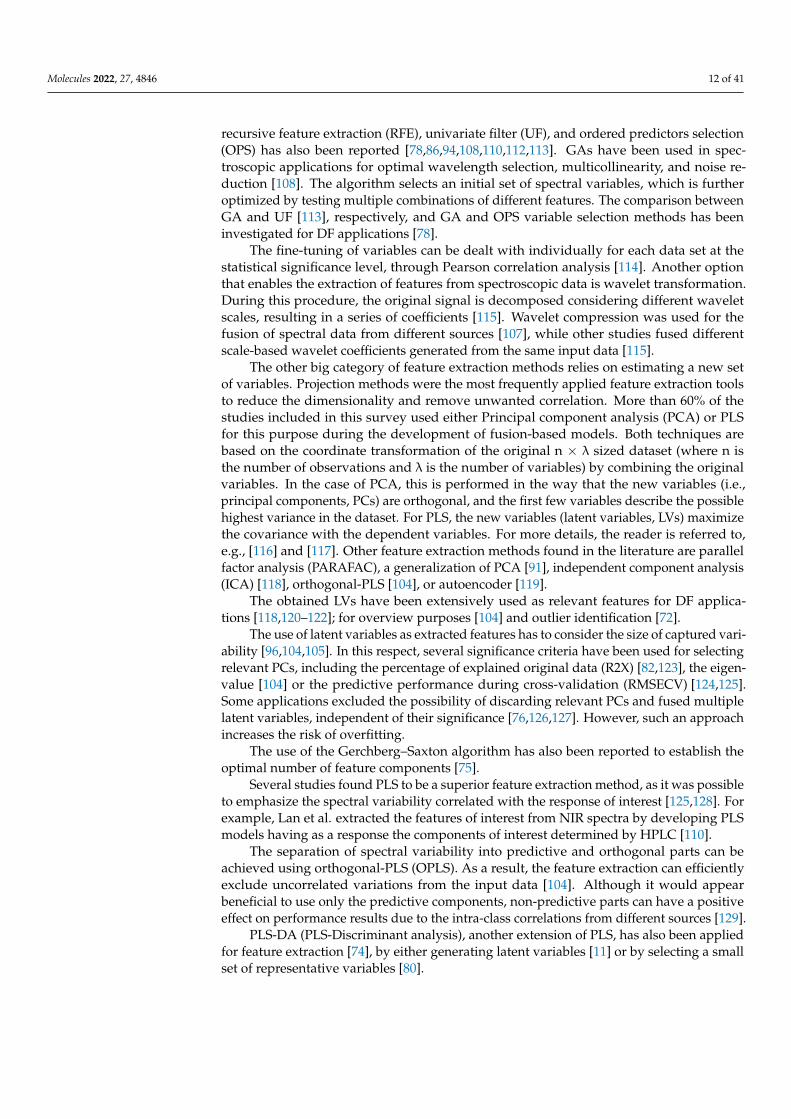
The other big category of feature extraction methods relies on estimating a new setof variables. Projection methods were the most frequently applied feature extraction toolsto reduce the dimensionality and remove unwanted correlation. More than 60% of thestudies included in this survey used either Principal component analysis (PCA) or PLSfor this purpose during the development of fusion-based models. Both techniques arebased on the coordinate transformation of the original n × λ sized dataset (where n isthe number of observations and λ is the number of variables) by combining the originalvariables. In the case of PCA, this is performed in the way that the new variables (i.e.,principal components, PCs) are orthogonal, and the first few variables describe the possiblehighest variance in the dataset. For PLS, the new variables (latent variables, LVs) maximizethe covariance with the dependent variables. For more details, the reader is referred to,e.g., [116] and [117]. Other feature extraction methods found in the literature are parallelfactor analysis (PARAFAC), a generalization of PCA [91], independent component analysis(ICA) [118], orthogonal-PLS [104], or autoencoder [119].
The obtained LVs have been extensively used as relevant features for DF applica-tions [118,120–122]; for overview purposes [104] and outlier identification [72].
The use of latent variables as extracted features has to consider the size of captured vari-ability [96,104,105]. In this respect, several significance criteria have been used for selectingrelevant PCs, including the percentage of explained original data (R2X) [82,123], the eigen-value [104] or the predictive performance during cross-validation (RMSECV) [124,125].Some applications excluded the possibility of discarding relevant PCs and fused multiplelatent variables, independent of their significance [76,126,127]. However, such an approachincreases the risk of overfitting.
The use of the Gerchberg–Saxton algorithm has also been reported to establish theoptimal number of feature components [75].
Several studies found PLS to be a superior feature extraction method, as it was possibleto emphasize the spectral variability correlated with the response of interest [125,128]. Forexample, Lan et al. extracted the features of interest from NIR spectra by developing PLSmodels having as a response the components of interest determined by HPLC [110].
The separation of spectral variability into predictive and orthogonal parts can beachieved using orthogonal-PLS (OPLS). As a result, the feature extraction can efficientlyexclude uncorrelated variations from the input data [104]. Although it would appearbeneficial to use only the predictive components, non-predictive parts can have a positiveeffect on performance results due to the intra-class correlations from different sources [129].
PLS-DA (PLS-Discriminant analysis), another extension of PLS, has also been appliedfor feature extraction [74], by either generating latent variables [11] or by selecting a smallset of representative variables [80].
Molecules 2022, 27, 4846 13 of 41
3.3. Modeling Methods
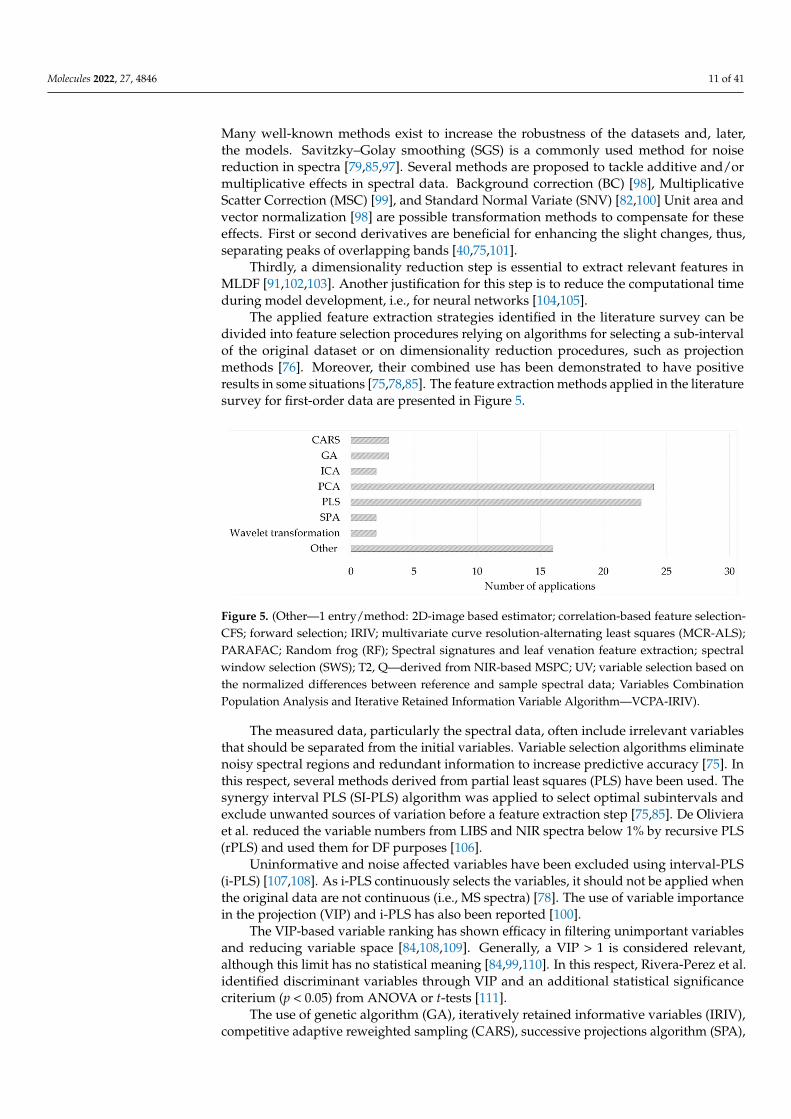
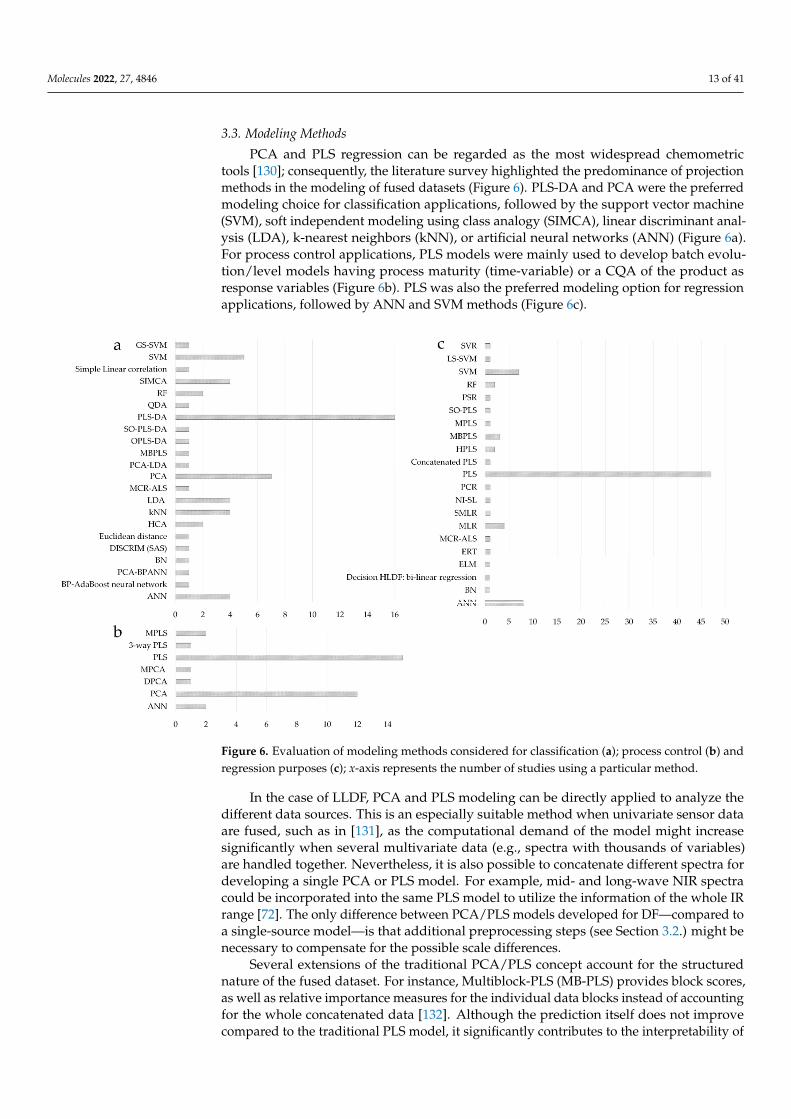
PCA and PLS regression can be regarded as the most widespread chemometrictools [130]; consequently, the literature survey highlighted the predominance of projectionmethods in the modeling of fused datasets (Figure 6). PLS-DA and PCA were the preferredmodeling choice for classification applications, followed by the support vector machine(SVM), soft independent modeling using class analogy (SIMCA), linear discriminant anal-ysis (LDA), k-nearest neighbors (kNN), or artificial neural networks (ANN) (Figure 6a).For process control applications, PLS models were mainly used to develop batch evolu-tion/level models having process maturity (time-variable) or a CQA of the product asresponse variables (Figure 6b). PLS was also the preferred modeling option for regressionapplications, followed by ANN and SVM methods (Figure 6c).
Molecules 2022, 27, x FOR PEER REVIEW 13 of 46
exclude uncorrelated variations from the input data [104]. Although it would appear ben-eficial to use only the predictive components, non-predictive parts can have a positive effect on performance results due to the intra-class correlations from different sources [129].
PLS-DA (PLS-Discriminant analysis), another extension of PLS, has also been applied for feature extraction [74], by either generating latent variables [11] or by selecting a small set of representative variables [80].
3.3. Modeling Methods PCA and PLS regression can be regarded as the most widespread chemometric tools
[130]; consequently, the literature survey highlighted the predominance of projection methods in the modeling of fused datasets (Figure 6). PLS-DA and PCA were the pre-ferred modeling choice for classification applications, followed by the support vector ma-chine (SVM), soft independent modeling using class analogy (SIMCA), linear discrimi-nant analysis (LDA), k-nearest neighbors (kNN), or artificial neural networks (ANN) (Fig-ure 6a). For process control applications, PLS models were mainly used to develop batch evolution/level models having process maturity (time-variable) or a CQA of the product as response variables (Figure 6b). PLS was also the preferred modeling option for regres-sion applications, followed by ANN and SVM methods (Figure 6c).
Figure 6. Evaluation of modeling methods considered for classification (a); process control (b) and regression purposes (c); X-axis represents the number of studies using a particular method.
In the case of LLDF, PCA and PLS modeling can be directly applied to analyze the different data sources. This is an especially suitable method when univariate sensor data are fused, such as in [131], as the computational demand of the model might increase sig-nificantly when several multivariate data (e.g., spectra with thousands of variables) are handled together. Nevertheless, it is also possible to concatenate different spectra for de-veloping a single PCA or PLS model. For example, mid- and long-wave NIR spectra could be incorporated into the same PLS model to utilize the information of the whole IR range
Figure 6. Evaluation of modeling methods considered for classification (a); process control (b) andregression purposes (c); x-axis represents the number of studies using a particular method.
In the case of LLDF, PCA and PLS modeling can be directly applied to analyze thedifferent data sources. This is an especially suitable method when univariate sensor dataare fused, such as in [131], as the computational demand of the model might increasesignificantly when several multivariate data (e.g., spectra with thousands of variables)are handled together. Nevertheless, it is also possible to concatenate different spectra fordeveloping a single PCA or PLS model. For example, mid- and long-wave NIR spectracould be incorporated into the same PLS model to utilize the information of the whole IRrange [72]. The only difference between PCA/PLS models developed for DF—compared toa single-source model—is that additional preprocessing steps (see Section 3.2.) might benecessary to compensate for the possible scale differences.
Several extensions of the traditional PCA/PLS concept account for the structurednature of the fused dataset. For instance, Multiblock-PLS (MB-PLS) provides block scores,as well as relative importance measures for the individual data blocks instead of accountingfor the whole concatenated data [132]. Although the prediction itself does not improvecompared to the traditional PLS model, it significantly contributes to the interpretability of
Molecules 2022, 27, 4846 14 of 41
the model. For example, the block weights and scores have helped identify the most criticalvariables in an API fermentation [133]. In other studies, MB-PLS and the “block importancein prediction (BIP)” index were used to determine which PAT sensors (IR, Raman, laser-induced fluorescence-LIF spectroscopy, FBRM, and red green blue-RGB color imaging),process parameters, and raw material attributes are necessary to be included in the DFmodels [134,135]. Malechaux et al. demonstrated that a multiblock modeling approachwas superior to hierarchical PLS-DA, as the simple concatenation of NIR and MIR data pre-sented a small fraction of predictive variables compared to the complete dataset [11]. Othermultiblock modeling methodologies are also promising, such as the response-orientedsequential alternation (ROSA), which facilitates handling many blocks [136]. It was alsopossible to include interactions in the model [137]. However, to the best of the authors’knowledge, these approaches have not been utilized for real-life PAT problems.
For MLDF, it was demonstrated that both feature extraction and modeling steps signifi-cantly impact the model performance and, therefore, need to be optimized carefully [11,104].For PAT data, a typical combination of methods is the application of individual PCA modelsfor feature extraction and using the concatenated PC scores in a PLS regression model [72].Besides PC scores, process/material parameters can also be conveniently incorporatedinto the PLS model, improving the model compared to the LLDF of the analytical sensordata [103]. Similarly, MSPC models can also be employed [10,103].
Another approach is the utilization of sequential methods in which the order ofdata blocks will be important for modeling. Most feature extraction procedures use anindependent approach, meaning that each data source is processed individually, and theblocks are exchangeable. Foschi et al. used Sequential and Orthogonalized-Partial LeastSquares-Discriminant Analysis (SO-PLS-DA) algorithm to classify samples through NIRand MIR data [138]. The algorithm builds a PLS model from the first data block and aimsto improve the model’s performance using orthogonal (unique) information from the nextdata block. This sequential approach removes redundant information between datasetsand extracts information to give an optimal model complexity [138].
After the features are derived from the raw data, ANNs can also serve as the DF model,which performed superior to PLS regression in multiple studies [104,105,139]. It was alsopossible to develop a cascade neural network using PCA scores to predict the quantitativeprocess variables (i.e., component concentrations) of fermentation and then to evaluate theprocess state, e.g., determine the harvest time [140]. Compared to PLS, ANN and SVMhave the advantage of being more suitable in the presence of non-linearity [85,104,141].
HLDF deduces a unique outcome from the results of multiple models, which arebuilt with individual data sources. Consequently, the method requires decision supportsystems, which incorporate numerous versatile methods, e.g., sensitivity, uncertainty, andrisk analysis [142]. Moreover, in the QbD concept, the design space is defined as the multi-dimensional combination and interaction of critical material and process parameters that aredemonstrated to assure quality. That is, it could be regarded as an HLDF model when thecritical input parameters are monitored with individual PAT tools and chemometric models.Design spaces could be defined by several methods, such as response surface fitting, linearand non-linear regression, first-principles modeling, or machine learning [143–145].
Independently of the fusion level, deep learning is another emerging modeling methodfor PAT data but has been neglected [62]. The structure of the deep neural networks enablesthe fusing of raw data (low-level), extracting features (mid-level), and making decisions(high-level) adaptively in a single model [146]. Several deep learning solutions can befound in the literature for DF in different industrial processes but not yet for pharmaceuticalprocesses. For example, convolutional neural networks (CNN) could be used for faultdiagnosis [147,148] or soft sensing in the production of polypropylene [149]. It has also beendemonstrated that support vector machines, logistic regression, and CNNs could be usedto fuse laser-induced breakdown spectroscopy (LIBS), visible/NIR hyperspectral imaging,and mid-IR spectroscopy data at different levels [119]. Therefore, their applications inpharmaceutical tasks could be further studied in the future.
Molecules 2022, 27, 4846 15 of 41
4. Integrating DF into PAT
Considering the multivariate nature of pharmaceutical manufacturing, the implemen-tation of DF in PAT is expected to be highly beneficial. The manufacturing of a productwith a predefined quality profile is known to be dependent on the interplay between rawmaterial attributes, formulation variables, and process parameters. Although the productdevelopment strategy strives to reach robustness, the uncontrolled variation and complexinteraction between input factors can introduce variability in the performance of the drugproduct. Therefore, to mathematically describe and accurately predict the quality of a batch,the fingerprint of that particular run can be the best predictor. The fingerprint of a batchcan be considered as a collection of data that comprises all the variables starting from theattributes of raw materials down to the timely evolution of process variables or CQAs.Such complex datasets, presenting diversely structured data from different sources, can befully exploited only by implementing DF strategies.
Some good examples of complex quality attributes can be the tableting performanceof granules and the dissolution profile of an API from prolonged-release tablets. To accu-rately predict the tableting performance of granules, it is important to have input data thatcan detect variations in granule particle size, particle size distribution, moisture content,crystallinity, and lubricant distribution. It is less likely that one PAT instrument will takeaccount of all these factors, but combining machine vision (particle size; particle size distri-bution), NIR (moisture content; lubricant distribution), and Raman methods (crystallinityvariation) stands as a promising solution. Similarly, for the accurate prediction of dissolu-tion profiles, it is essential to keep track of API particle size variations, content, and particlesize of the release controlling polymer, tablet crushing strength, lubricant distribution, andother factors depending on the particularities of the product [91,102,105,135,145].
The currently available pharmaceutical DF based applications are limited, suggestingits slow integration into this field. DF has been successfully applied for classificationpurposes, here including excipient qualification studies based on physical characteristics(XRPD and particle size distribution data) [150], the identification of counterfeit prod-ucts [96,120], and the detection of product quality deviations [104].
The majority of process control applications dealt with the development of statisti-cal process control methods (MSPC, BSPC) relying on continuously recorded univariatevariables. Studies have been published on classical granulation [139,151], continuousgranulation processes [90,92,93]; continuous tableting lines [131,152], and biotech pro-cesses [153–155]. On the other hand, studies that combine uni- and multivariate data arescarce. Bostijn et al. used MLDF to combine Raman spectroscopic data with univariatevariables to monitor the manufacturing of an ointment type product and to reach an en-hanced process control [156]. Probably, the challenges, with respect to the integration ofmulti- and univariate data into process control models, have limited the combined useof spectroscopic and classical process variables for the real-time monitoring of processevolution. Such an approach requires a specialized IT infrastructure for data collection,processing, and modeling. Thus, these elements have to be considered an integral part of amodern manufacturing line.
In the case of regression applications, the used modeling approaches reach a higherlevel of complexity when referring to the selected input variables. These studies usuallypredict CQAs of final/intermediate products or CPP setpoints for subsequent processingsteps using a diverse range of input data. The first category of applications used the processfingerprint, represented by the timely evolution of univariate variables, to predict thedesired responses [139,157,158]. The second category of applications used as predictorsvariables that do not evolve over time. To this respect, process conditions, raw materialattributes, and multivariate data (spectroscopy) have been fused to predict granule qual-ity [159], content uniformity [104,134], powder flowability [134], coating thickness [135],and the dissolution of the API [91,102,105,135,145].
The following parts of this section will focus on the key considerations regarding thedevelopment and validation of DF models, respectively, on their role within Pharma 4.0.
Molecules 2022, 27, 4846 16 of 41
4.1. Model Development
The majority of the studies included in the literature survey have demonstratedthe advantage of increased model performance by implementing DF, with less than 2%demonstrating similar results to individual models. As in most cases, adjustments madein the variable selection, feature extraction, type of the model, and DF strategy have ledto considerable improvements in predictive performance; all these operations have to bethoroughly investigated during implementation.
A primary condition for reaching optimal model performance is to have relevantinput variables. Thus, the decision to implement a DF strategy should start in the initialphases of the product’s lifecycle. Based on the results of risk assessment, the data collectionstrategy can be defined, deciding what data and which sensors are to be implemented onthe manufacturing line. Moreover, an IT infrastructure has to be integrated into the processcontrol strategy to efficiently handle incoming data from different sources/process steps.During product development, several data sources and PAT tools can be screened andranked based on their usefulness in the model.
Before fusing data from multiple sources, it is essential to evaluate the contributionof each dataset to the model and its complementarity. Including this step into the modeldevelopment routine can provide an estimation for the size of predictive data and uncorre-lated variables, which can further justify the use of variable selection or feature extractionprocedures. Ultimately, it can guide the correct choice of the best fusion strategy. Theperformance of fusion strategies with respect to the structure of input data and modelobjective was thoroughly described in Section 3.1.
Around 50% of the surveyed applications resumed the complementarity assessmentto the comparison of various models built on individual data and fused datasets, heretesting multiple strategies in a trial and error approach (Appendix A, Table A1). Stud-ies that worked with univariate sensors did not evaluate this aspect, while others pre-sented only one modeling approach. Approximately 20% of studies dedicate attentionto the effective comparison of individual datasets. In this respect, methods such as sta-tistical total correlation [160], correlation maps [128], pairwise correlation analysis [110],Pearson correlation analysis [114], confusion matrices [161], exploratory data analysis(EDA) [103], PCA [107,118,138], VIP [11], Hoteling’s T2 [104], MB-PLS—block importanceevaluation [134,135,162], and OPLS [104] have been used.
As highlighted under Section 4, spectroscopic data represents a key input data sourcewhen considering pharmaceutical applications. The high throughput, non-destructive, andmultivariate nature of these PAT tools are just some advantages that make them indispens-able for reaching a more in-depth process control and product knowledge. Spectroscopicdata, recorded over a few hundred wavelengths, is frequently used in the pharmaceuti-cal field to predict CQAs and monitor production processes [163–170]. Fusing spectraldata with other input variables will most likely require an MLDF approach, thus theidentification of a suitable data processing and feature extraction procedure is key. Tothis respect, the application of PLS in DF has been extended towards developing modelsable to predict some key characteristics. In this manner, a large number of variables fromspectroscopic data have been used to extract features such as moisture content, viscosity,acidic number [10], API concentrations in semisolid products [156], or the API and releaserate controlling polymer content from prolonged-release tablets [145]. In subsequent steps,this meaningful process information (in the form of CQAs or performance parameters) hasbeen used to detect deviations from normal process evolution or to predict batch quality. DeOliviera et al. highlighted the improved interpretability of such models compared to latentvariables [10]. Other relevant outputs for spectroscopic data can be represented by concen-tration profiles estimated through MCR and Hoteling T2/Q residual-based indicators fromMSPC models [10].
The model development step should be performed simultaneously/in parallel withthe optimization of the data processing and complementarity testing, as these steps are
Molecules 2022, 27, 4846 17 of 41
highly interrelated. Further details on data processing and modeling opportunities weredescribed in Sections 3.2 and 3.3.
4.2. Model Validation
Implementing DF strategies for PAT purposes within the strict and highly regulatedpharmaceutical environment will require extensive validation and robustness testing. Ap-proximately 77% of the surveyed articles used an external dataset to test the developedmodels’ performance, while the remaining fraction relied on cross-validation procedures(Appendix A, Table A1). Testing the predictive ability of the models on external datasets iscritical for performance evaluation purposes. Additionally, eight studies also evaluatedthe robustness of predictions by including controlled disturbances/interfering factors notconsidered in the calibration set (Appendix A Table A1). Out of the surveyed articles, twostudies particularly stand out regarding the validation procedure. First, Assis et al. evalu-ated the trueness, precision, linearity, and the working range of a NIR- and TXRF-basedmethod used to assess the composition of roasted and ground coffee [77]. Second, Casianet al. used an accuracy profile approach to validate a four instrument DF platform used topredict the API content of electrospun nanofibers [104].
Although several DF applications are present in the literature, to the best of the authors’knowledge, no studies have addressed the question of model validation and maintenancefrom the regulatory point of view, where different challenges arise depending on thefusion level. Nevertheless, the revised general chapter ‘Chemometric methods applied toanalytical data’ (5.21) of the European Pharmacopoeia (Ph. Eur.), effective as of 1 April 2023,will include a new subsection dealing with DF [171]. This is expected to further promotethe application of DF in the pharmaceutical industry.
The validation of an LLDF model is the most straightforward, as a single chemometricmodel is developed and validated. This is directly addressed, e.g., by the NIR guidance ofthe FDA or EMA [172,173]. Both guidelines consider NIR spectroscopy a suitable methodfor qualitative (identification/qualification) and quantitative analysis.
The papers integrate the terminologies and principles defined in ICHQ8-Q10. Itis generally considered that NIR applications should use in the development strategythe principles of QbD based on risk assessment, conducted as per the ICHQ9 guideline,and both apparatus and material and manufacturing process-related variables should beconsidered. For risk control and mitigation throughout product lifecycle management, aDoE approach might be considered, and a risk assessment summary should be submittedto the regulatory authorities.
The validation requirements differ whether the NIR spectroscopic method is intendedfor qualitative or quantitative purposes. This could be transposed for fusion applicationsas well. Both guidelines have the minimum requirement of specificity and robustness forqualitative analysis.
The iterative nature of NIR method development should be kept-in-sight throughoutproduct lifecycle management as new, other sources of variability can appear in futureprediction sets. This implies a periodical re-evaluation of the method to confirm its suitabil-ity for the intended purpose and to be able to discriminate the out-of-specification (OOS)results. In the case of OOS results, a root cause investigation is necessary. If the outcomereveals that the OOS result is related to human or instrument error and the product com-plies using the reference method, the batch can be released. Until the update of the NIRmethod, its use should be suspended. From a regulatory perspective, minor modificationsor those that are made within the scope of the elaborated NIR procedure should generallybe handled by the pharmaceutical quality system of the Applicant under the principlesof the current Good Manufacturing Practice (cGMP). Moderate, major, or modificationsoutside the scope of the elaborated NIR procedure implies the application of variation. Asimilar approach should be implemented for fusion-based analytical platforms.
These guidelines also emphasize that the selected variable range should be justified.For the LLDF model, this also means that the need for the DF should be confirmed, e.g.,
Molecules 2022, 27, 4846 18 of 41
by comparing the performance of the data fused model to the models using a single PATtool. Furthermore, the robustness testing and change control of the LLDF model might alsoimpose a challenge, as the change or malfunction of a single PAT tool impacts the entiremodel. The utilization of sensitivity analysis or an MB-PLS model with block varianceindices can assist these studies. It is also essential to establish a data quality managementmethod for each PAT measurement (e.g., acceptance limits of similarity indices), as wellas contingency plans for the potential failure of each PAT tool. This might be the usageof a chemometric model with the functioning analytical tool(s) if the analytical toolscomplement each other sufficiently.
A possible approach for validating an MLDF model might include the validationof multiple sub-models, i.e., the feature extraction models (e.g., PCA models), as wellas the DF model. Consequently, if the acceptable ranges of inputs for the DF model aredetermined, the robustness of the individual models could be individually studied, and thechange control procedure might be simplified, as in this case, it impacts only one sub-model.It is also worth noting that special attention must be paid during validation to justify theneed for DF (similar to the low-level fusion) and the appropriate selection of features (e.g.,number of PCs) to avoid the over-/under- fitting of the models.
As for the HLDF model, the validation and model maintenance of the individualmodels providing the input for the DF model is not affected by the DF. Hence the existingregulatory guidelines (e.g., the NIR guidance of FDA/EMA) could be directly followed.As mentioned in Section 3.3, the HLDF model could be regarded as a design space. There-fore, its construction, validation, and maintenance could be conducted following the ICHguidelines dealing with the QbD concept [174]. For example, the risk assessment steps,determining the acceptable ranges of the input parameters (CPPs and CQAs), and the edgeof failure of the design space might be an integral part of the model validation.
4.3. DF and Pharma 4.0
The fourth industrial revolution in the pharmaceutical domain, known as Pharma 4.0,is set to streamline drug manufacturing through real-time optimization/control systemsand fast decision making [175]. Pharma 4.0 will yield integrated, self-organizing, andautonomous manufacturing facilities, bringing the potential of more in-depth product-and process-related knowledge [176]. The smart factory will provide an improved controlopportunity due to the greater connectivity and transparency by integrating digital solu-tions. The manual processes of classic manufacturing will be replaced by self-regulatingautomatic systems, improving the consistency in the quality of delivered products [177].Reaching this level of technology requires the adoption of advanced data analytics andautomation systems [175].
Data science was described as a core component of several Pharma 4.0 ideas. Althoughmost data science tools are already available, they are not fully exploited, as they are appliedto individual unit operations or subparts of the product lifecycle. The more powerful useof these tools for the materialization of autonomous systems stands in the development ofinterconnections between sensors and equipment from all unit operations [178]. The DFtechniques combined with AI or machine learning can support the decision-making basedon key performance indicators in industrial chemical plants [179]. Platforms are available,in which in silico development and optimization are performed by data-driven models anddigital twins for pharmaceutical systems [180].
By working with different data sources and types, the data analysis procedure willbe of key importance, especially since it will fuel the adaptive process control loops [176].Thus, fusion-based data integration is needed to enable real-time monitoring and re-sponsiveness within a well-controlled manufacturing environment. The collected datawill gain digital maturity, as it is processed into actionable wisdom that can supportdecision-making [176,177].
Molecules 2022, 27, 4846 19 of 41
The importance of data management solutions for data collection, organization, andintegration is also acknowledged. Advanced computing infrastructure is needed to provideproduct or process-related information rapidly [175].
5. Future Perspectives and Final Remarks
The value of DF in the pharmaceutical industry was demonstrated in this work throughthe review of the existing literature in this field. The readily available large amounts ofdata coming from manufacturing processes are still not fully exploited to reach the statusof a smart facility, as described in Pharma 4.0. In this respect, multiple obstacles need tobe overcome.
Initial risk analysis during product development has to be extended to identify themost relevant data sources that can be used to gain a deeper level of knowledge and controlfor the developed product. Once the opportunity of implementing DF has been confirmed,the screening of instruments/sensors will be important to identify complementarity be-tween different types of data. The use of complementary data sources will directly impactthe performance of predictions and the efficiency of the implemented monitoring strategy.
On the technical side, efficient data management solutions have to be integrated intothe manufacturing line to enable the real-time data processing needed for fast decision-making. Although the data processing and modeling tools are readily available, theimproved connectivity between different unit operations still has to be resolved.
The slow integration of DF methods can be also explained, considering the strictregulatory environment of the pharmaceutical industry. On the other side, the alreadyavailable and newly coming regulatory guidelines will strongly support pharmaceuticalcompanies in this respect. Moreover, another major driving force is the fourth industrialrevolution, Pharma 4.0, where DF occupies a key position for an efficient implementation.
Author Contributions: Conceptualization, T.C., B.N. and A.F.; writing—original draft preparation,T.C., B.N., B.K., D.L.G., E.H. and A.F.; writing—review and editing, T.C., B.N. and A.F.; supervision,A.F.; project administration, T.C.; funding acquisition, T.C. and B.N. All authors have read and agreedto the published version of the manuscript.
Funding: This work was supported by a grant of the Ministry of Research, Innovation and Digitiza-tion, CNCS—UEFISCDI, project number PN-III-P1-1.1-PD-2021-0420, within PNCDI III. This workwas supported by the ÚNKP-21-4 New National Excellence Program of the Ministry for Innova-tion and Technology from the source of the National Research, Development and Innovation Fund.Project no. 2019-1.3.1-KK-2019-00004 has been implemented with the support provided from theNational Research, Development and Innovation Fund of Hungary, financed under the 2019-1.3.1-KKfunding scheme.
Conflicts of Interest: The authors declare no conflict of interest. The funders had no role in the designof the study; in the collection, analyses, or interpretation of data; in the writing of the manuscript, orin the decision to publish the results.
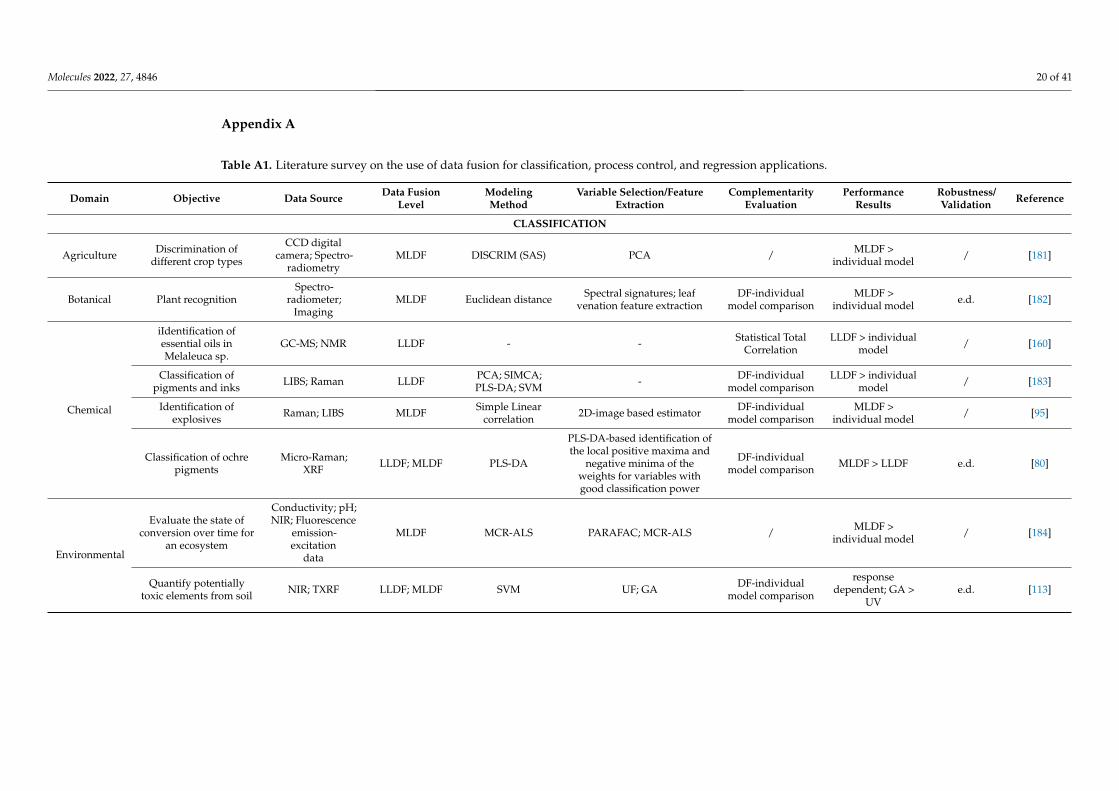
Molecules 2022, 27, 4846 20 of 41
Appendix A
Table A1. Literature survey on the use of data fusion for classification, process control, and regression applications.
Domain Objective Data Source Data FusionLevel
ModelingMethod
Variable Selection/FeatureExtraction
ComplementarityEvaluation
PerformanceResults
Robustness/Validation Reference
CLASSIFICATION
Agriculture Discrimination ofdifferent crop types
CCD digitalcamera; Spectro-
radiometryMLDF DISCRIM (SAS) PCA / MLDF >
individual model / [181]
Botanical Plant recognitionSpectro-
radiometer;Imaging
MLDF Euclidean distance Spectral signatures; leafvenation feature extraction
DF-individualmodel comparison
MLDF >individual model e.d. [182]
Chemical
iIdentification ofessential oils inMelaleuca sp.
GC-MS; NMR LLDF - - Statistical TotalCorrelation
LLDF > individualmodel / [160]
Classification ofpigments and inks LIBS; Raman LLDF PCA; SIMCA;
PLS-DA; SVM - DF-individualmodel comparison
LLDF > individualmodel / [183]
Identification ofexplosives Raman; LIBS MLDF Simple Linear
correlation 2D-image based estimator DF-individualmodel comparison
MLDF >individual model / [95]
Classification of ochrepigments
Micro-Raman;XRF LLDF; MLDF PLS-DA
PLS-DA-based identification ofthe local positive maxima and
negative minima of theweights for variables withgood classification power
DF-individualmodel comparison MLDF > LLDF e.d. [80]
Environmental
Evaluate the state ofconversion over time for
an ecosystem
Conductivity; pH;NIR; Fluorescence
emission-excitation
data
MLDF MCR-ALS PARAFAC; MCR-ALS / MLDF >individual model / [184]
Quantify potentiallytoxic elements from soil NIR; TXRF LLDF; MLDF SVM UF; GA DF-individual
model comparison
responsedependent; GA >
UVe.d. [113]
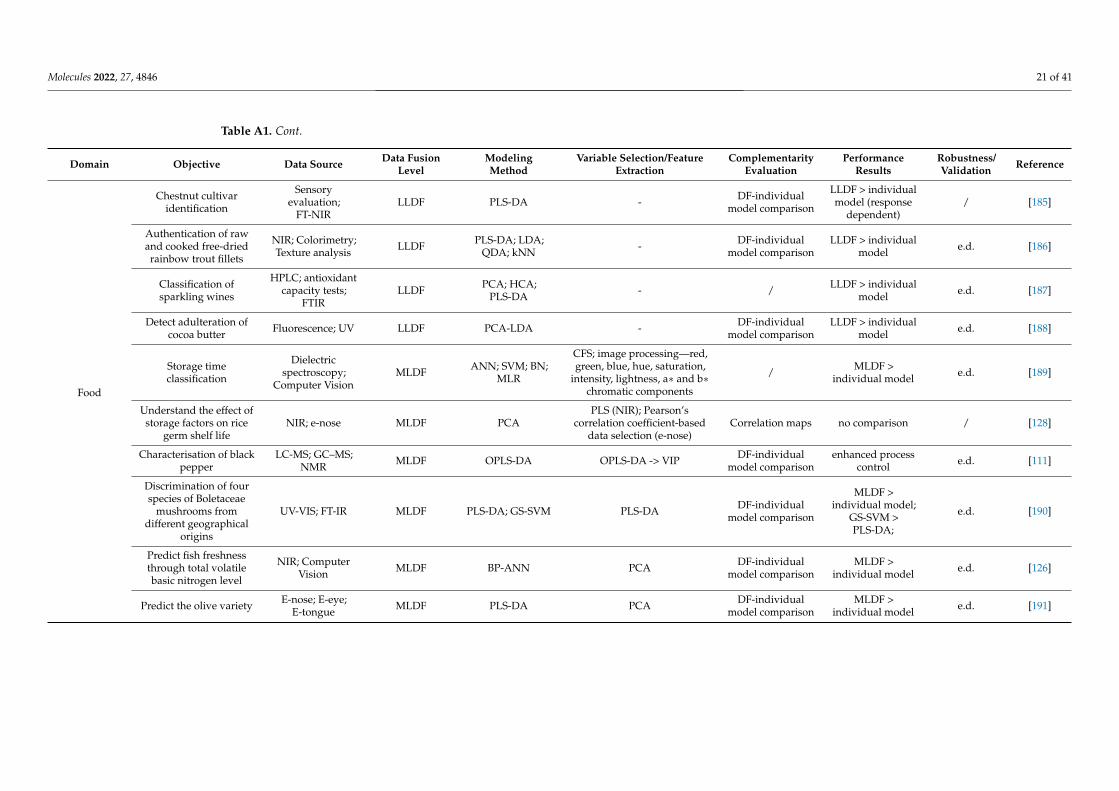
Molecules 2022, 27, 4846 21 of 41
Table A1. Cont.
Domain Objective Data Source Data FusionLevel
ModelingMethod
Variable Selection/FeatureExtraction
ComplementarityEvaluation
PerformanceResults
Robustness/Validation Reference
Food
Chestnut cultivaridentification
Sensoryevaluation;
FT-NIRLLDF PLS-DA - DF-individual
model comparison
LLDF > individualmodel (response
dependent)/ [185]
Authentication of rawand cooked free-driedrainbow trout fillets
NIR; Colorimetry;Texture analysis LLDF PLS-DA; LDA;
QDA; kNN - DF-individualmodel comparison
LLDF > individualmodel e.d. [186]
Classification ofsparkling wines
HPLC; antioxidantcapacity tests;
FTIRLLDF PCA; HCA;
PLS-DA - / LLDF > individualmodel e.d. [187]
Detect adulteration ofcocoa butter Fluorescence; UV LLDF PCA-LDA - DF-individual
model comparisonLLDF > individual
model e.d. [188]
Storage timeclassification
Dielectricspectroscopy;
Computer VisionMLDF ANN; SVM; BN;
MLR
CFS; image processing—red,green, blue, hue, saturation,
intensity, lightness, a∗ and b∗chromatic components
/ MLDF >individual model e.d. [189]
Understand the effect ofstorage factors on rice
germ shelf lifeNIR; e-nose MLDF PCA
PLS (NIR); Pearson’scorrelation coefficient-based
data selection (e-nose)Correlation maps no comparison / [128]
Characterisation of blackpepper
LC-MS; GC–MS;NMR MLDF OPLS-DA OPLS-DA -> VIP DF-individual
model comparisonenhanced process
control e.d. [111]
Discrimination of fourspecies of Boletaceae
mushrooms fromdifferent geographical
origins
UV-VIS; FT-IR MLDF PLS-DA; GS-SVM PLS-DA DF-individualmodel comparison
MLDF >individual model;
GS-SVM >PLS-DA;
e.d. [190]
Predict fish freshnessthrough total volatilebasic nitrogen level
NIR; ComputerVision MLDF BP-ANN PCA DF-individual
model comparisonMLDF >
individual model e.d. [126]
Predict the olive variety E-nose; E-eye;E-tongue MLDF PLS-DA PCA DF-individual
model comparisonMLDF >
individual model e.d. [191]
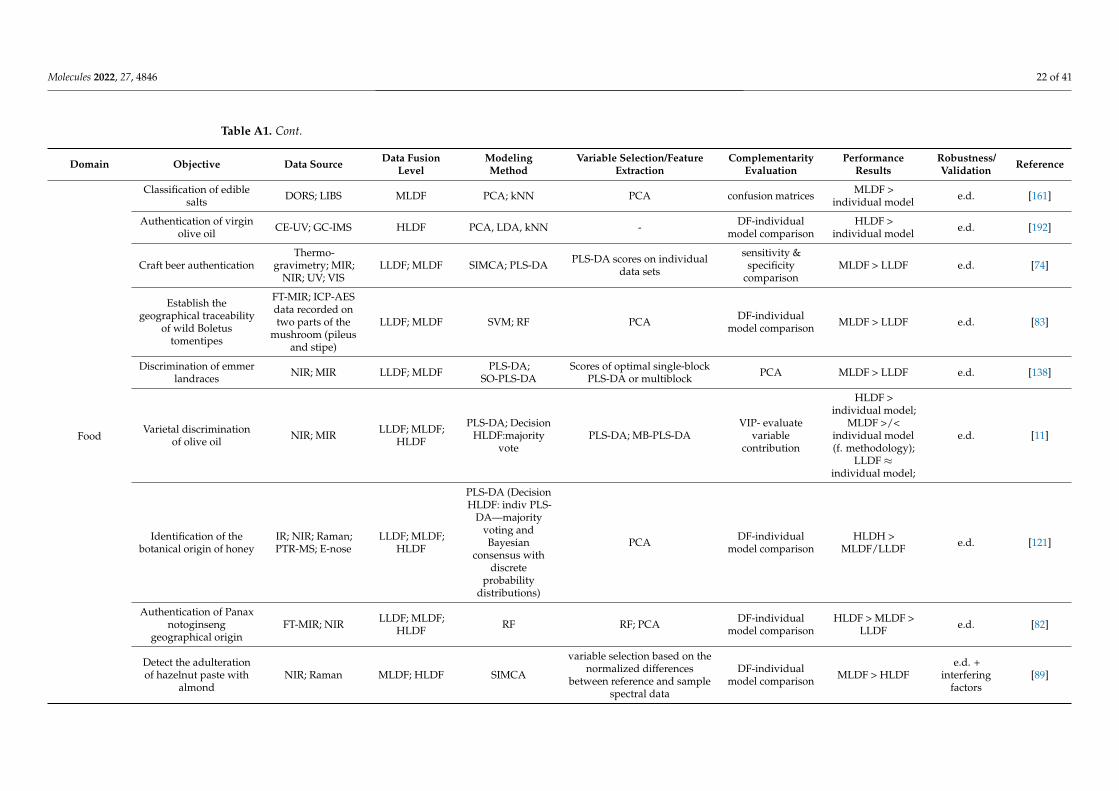
Molecules 2022, 27, 4846 22 of 41
Table A1. Cont.
Domain Objective Data Source Data FusionLevel
ModelingMethod
Variable Selection/FeatureExtraction
ComplementarityEvaluation
PerformanceResults
Robustness/Validation Reference
Food
Classification of ediblesalts DORS; LIBS MLDF PCA; kNN PCA confusion matrices MLDF >
individual model e.d. [161]
Authentication of virginolive oil CE-UV; GC-IMS HLDF PCA, LDA, kNN - DF-individual
model comparisonHLDF >
individual model e.d. [192]
Craft beer authenticationThermo-
gravimetry; MIR;NIR; UV; VIS
LLDF; MLDF SIMCA; PLS-DA PLS-DA scores on individualdata sets
sensitivity &specificity
comparisonMLDF > LLDF e.d. [74]
Establish thegeographical traceability
of wild Boletustomentipes
FT-MIR; ICP-AESdata recorded ontwo parts of the
mushroom (pileusand stipe)
LLDF; MLDF SVM; RF PCA DF-individualmodel comparison MLDF > LLDF e.d. [83]
Discrimination of emmerlandraces NIR; MIR LLDF; MLDF PLS-DA;
SO-PLS-DAScores of optimal single-block
PLS-DA or multiblock PCA MLDF > LLDF e.d. [138]
Varietal discriminationof olive oil NIR; MIR LLDF; MLDF;
HLDF
PLS-DA; DecisionHLDF:majority
votePLS-DA; MB-PLS-DA
VIP- evaluatevariable
contribution
HLDF >individual model;
MLDF >/<individual model(f. methodology);
LLDF ≈individual model;
e.d. [11]
Identification of thebotanical origin of honey
IR; NIR; Raman;PTR-MS; E-nose
LLDF; MLDF;HLDF
PLS-DA (DecisionHLDF: indiv PLS-
DA—majorityvoting andBayesian
consensus withdiscrete
probabilitydistributions)
PCA DF-individualmodel comparison
HLDH >MLDF/LLDF e.d. [121]
Authentication of Panaxnotoginseng
geographical originFT-MIR; NIR LLDF; MLDF;
HLDF RF RF; PCA DF-individualmodel comparison
HLDF > MLDF >LLDF e.d. [82]
Detect the adulterationof hazelnut paste with
almondNIR; Raman MLDF; HLDF SIMCA
variable selection based on thenormalized differences
between reference and samplespectral data
DF-individualmodel comparison MLDF > HLDF
e.d. +interfering
factors[89]
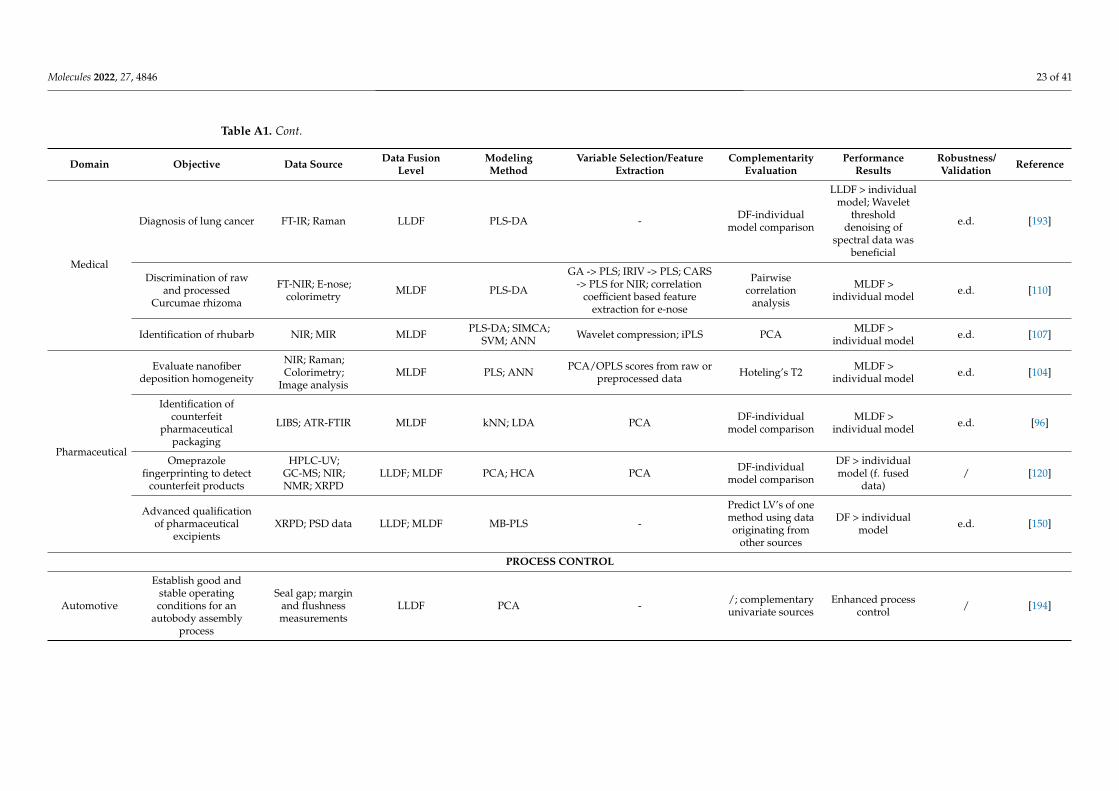
Molecules 2022, 27, 4846 23 of 41
Table A1. Cont.
Domain Objective Data Source Data FusionLevel
ModelingMethod
Variable Selection/FeatureExtraction
ComplementarityEvaluation
PerformanceResults
Robustness/Validation Reference
Medical
Diagnosis of lung cancer FT-IR; Raman LLDF PLS-DA - DF-individualmodel comparison
LLDF > individualmodel; Wavelet
thresholddenoising of
spectral data wasbeneficial
e.d. [193]
Discrimination of rawand processed
Curcumae rhizoma
FT-NIR; E-nose;colorimetry MLDF PLS-DA
GA -> PLS; IRIV -> PLS; CARS-> PLS for NIR; correlation
coefficient based featureextraction for e-nose
Pairwisecorrelation
analysis
MLDF >individual model e.d. [110]
Identification of rhubarb NIR; MIR MLDF PLS-DA; SIMCA;SVM; ANN Wavelet compression; iPLS PCA MLDF >
individual model e.d. [107]
Pharmaceutical
Evaluate nanofiberdeposition homogeneity
NIR; Raman;Colorimetry;
Image analysisMLDF PLS; ANN PCA/OPLS scores from raw or
preprocessed data Hoteling’s T2 MLDF >individual model e.d. [104]
Identification ofcounterfeit
pharmaceuticalpackaging
LIBS; ATR-FTIR MLDF kNN; LDA PCA DF-individualmodel comparison
MLDF >individual model e.d. [96]
Omeprazolefingerprinting to detect
counterfeit products
HPLC-UV;GC-MS; NIR;NMR; XRPD
LLDF; MLDF PCA; HCA PCA DF-individualmodel comparison
DF > individualmodel (f. fused
data)/ [120]
Advanced qualificationof pharmaceutical
excipientsXRPD; PSD data LLDF; MLDF MB-PLS -
Predict LV’s of onemethod using dataoriginating from
other sources
DF > individualmodel e.d. [150]
PROCESS CONTROL
Automotive
Establish good andstable operatingconditions for an
autobody assemblyprocess
Seal gap; marginand flushnessmeasurements
LLDF PCA - /; complementaryunivariate sources
Enhanced processcontrol / [194]
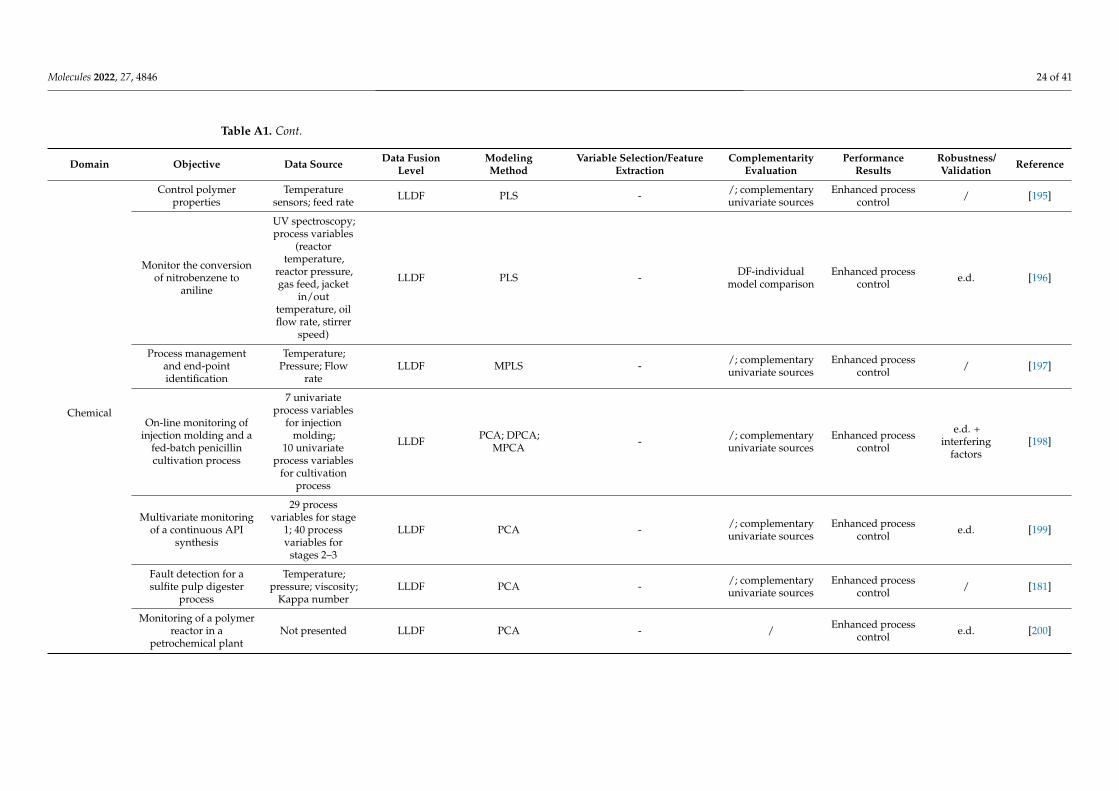
Molecules 2022, 27, 4846 24 of 41
Table A1. Cont.
Domain Objective Data Source Data FusionLevel
ModelingMethod
Variable Selection/FeatureExtraction
ComplementarityEvaluation
PerformanceResults
Robustness/Validation Reference
Chemical
Control polymerproperties
Temperaturesensors; feed rate LLDF PLS - /; complementary
univariate sourcesEnhanced process
control / [195]
Monitor the conversionof nitrobenzene to
aniline
UV spectroscopy;process variables
(reactortemperature,
reactor pressure,gas feed, jacket
in/outtemperature, oilflow rate, stirrer
speed)
LLDF PLS - DF-individualmodel comparison
Enhanced processcontrol e.d. [196]
Process managementand end-pointidentification
Temperature;Pressure; Flow
rateLLDF MPLS - /; complementary
univariate sourcesEnhanced process
control / [197]
On-line monitoring ofinjection molding and a
fed-batch penicillincultivation process
7 univariateprocess variables
for injectionmolding;
10 univariateprocess variables
for cultivationprocess
LLDF PCA; DPCA;MPCA - /; complementary
univariate sourcesEnhanced process
control
e.d. +interfering
factors[198]
Multivariate monitoringof a continuous API
synthesis
29 processvariables for stage
1; 40 processvariables for
stages 2–3
LLDF PCA - /; complementaryunivariate sources
Enhanced processcontrol e.d. [199]
Fault detection for asulfite pulp digester
process
Temperature;pressure; viscosity;
Kappa numberLLDF PCA - /; complementary
univariate sourcesEnhanced process
control / [181]
Monitoring of a polymerreactor in a
petrochemical plantNot presented LLDF PCA - / Enhanced process
control e.d. [200]
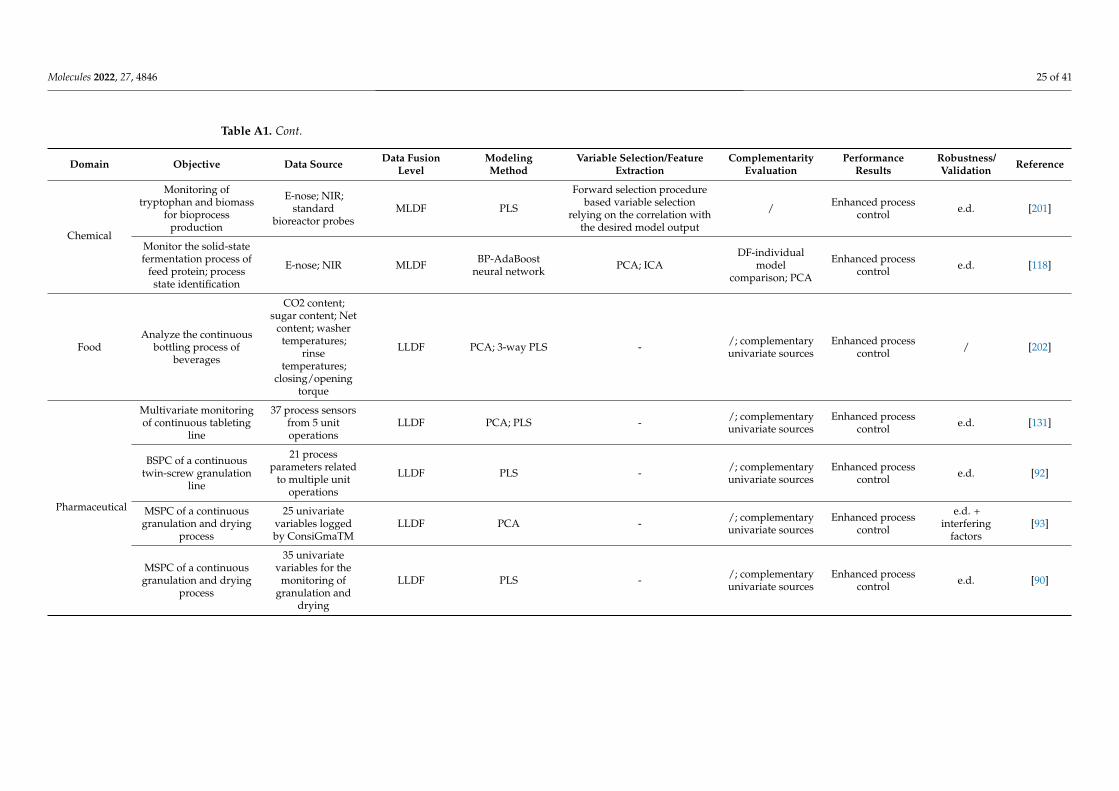
Molecules 2022, 27, 4846 25 of 41
Table A1. Cont.
Domain Objective Data Source Data FusionLevel
ModelingMethod
Variable Selection/FeatureExtraction
ComplementarityEvaluation
PerformanceResults
Robustness/Validation Reference
Chemical
Monitoring oftryptophan and biomass
for bioprocessproduction
E-nose; NIR;standard
bioreactor probesMLDF PLS
Forward selection procedurebased variable selection
relying on the correlation withthe desired model output
/ Enhanced processcontrol e.d. [201]
Monitor the solid-statefermentation process of
feed protein; processstate identification
E-nose; NIR MLDF BP-AdaBoostneural network PCA; ICA
DF-individualmodel
comparison; PCA
Enhanced processcontrol e.d. [118]
FoodAnalyze the continuous
bottling process ofbeverages
CO2 content;sugar content; Net
content; washertemperatures;
rinsetemperatures;
closing/openingtorque
LLDF PCA; 3-way PLS - /; complementaryunivariate sources
Enhanced processcontrol / [202]
Pharmaceutical
Multivariate monitoringof continuous tableting
line
37 process sensorsfrom 5 unitoperations
LLDF PCA; PLS - /; complementaryunivariate sources
Enhanced processcontrol e.d. [131]
BSPC of a continuoustwin-screw granulation
line
21 processparameters related
to multiple unitoperations
LLDF PLS - /; complementaryunivariate sources
Enhanced processcontrol e.d. [92]
MSPC of a continuousgranulation and drying
process
25 univariatevariables loggedby ConsiGmaTM
LLDF PCA - /; complementaryunivariate sources
Enhanced processcontrol
e.d. +interfering
factors[93]
MSPC of a continuousgranulation and drying
process
35 univariatevariables for the
monitoring ofgranulation and
drying
LLDF PLS - /; complementaryunivariate sources
Enhanced processcontrol e.d. [90]
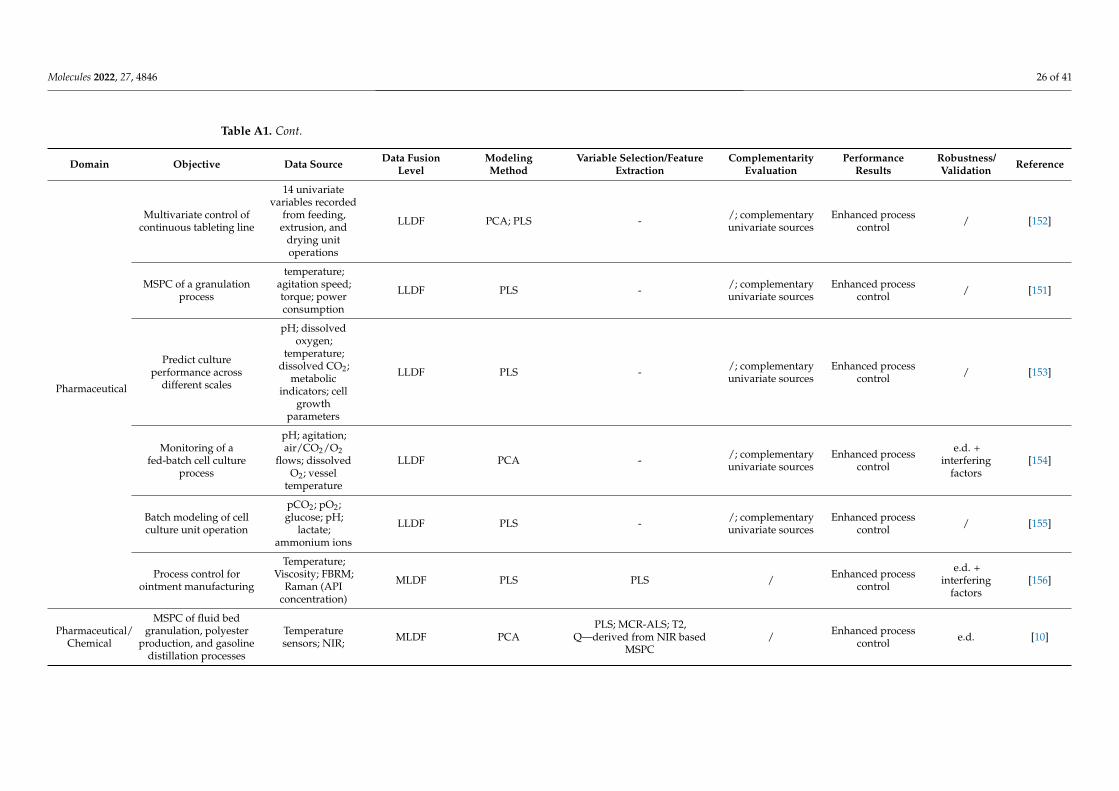
Molecules 2022, 27, 4846 26 of 41
Table A1. Cont.
Domain Objective Data Source Data FusionLevel
ModelingMethod
Variable Selection/FeatureExtraction
ComplementarityEvaluation
PerformanceResults
Robustness/Validation Reference
Pharmaceutical
Multivariate control ofcontinuous tableting line
14 univariatevariables recorded
from feeding,extrusion, and
drying unitoperations
LLDF PCA; PLS - /; complementaryunivariate sources
Enhanced processcontrol / [152]
MSPC of a granulationprocess
temperature;agitation speed;torque; powerconsumption
LLDF PLS - /; complementaryunivariate sources
Enhanced processcontrol / [151]
Predict cultureperformance across
different scales
pH; dissolvedoxygen;
temperature;dissolved CO2;
metabolicindicators; cell
growthparameters
LLDF PLS - /; complementaryunivariate sources
Enhanced processcontrol / [153]
Monitoring of afed-batch cell culture
process
pH; agitation;air/CO2/O2
flows; dissolvedO2; vessel
temperature
LLDF PCA - /; complementaryunivariate sources
Enhanced processcontrol
e.d. +interfering
factors[154]
Batch modeling of cellculture unit operation
pCO2; pO2;glucose; pH;
lactate;ammonium ions
LLDF PLS - /; complementaryunivariate sources
Enhanced processcontrol / [155]
Process control forointment manufacturing
Temperature;Viscosity; FBRM;
Raman (APIconcentration)
MLDF PLS PLS / Enhanced processcontrol
e.d. +interfering
factors[156]
Pharmaceutical/Chemical
MSPC of fluid bedgranulation, polyester
production, and gasolinedistillation processes
Temperaturesensors; NIR; MLDF PCA
PLS; MCR-ALS; T2,Q—derived from NIR based
MSPC/ Enhanced process
control e.d. [10]
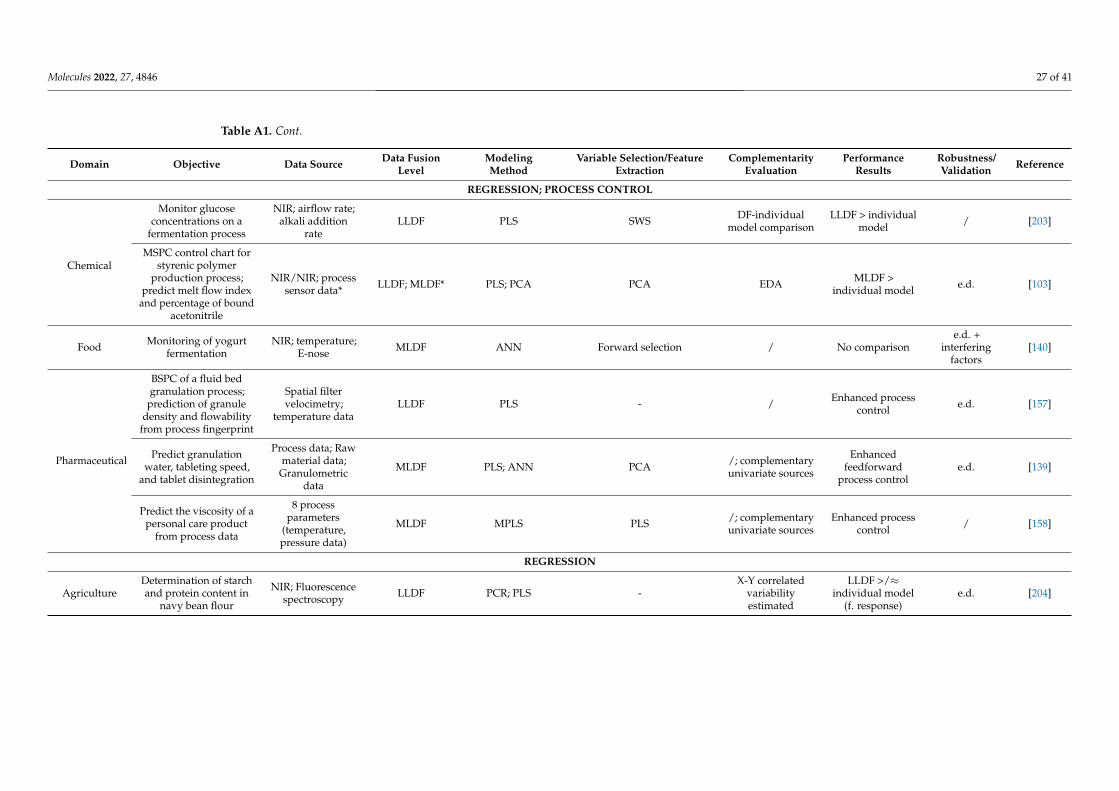
Molecules 2022, 27, 4846 27 of 41
Table A1. Cont.
Domain Objective Data Source Data FusionLevel
ModelingMethod
Variable Selection/FeatureExtraction
ComplementarityEvaluation
PerformanceResults
Robustness/Validation Reference
REGRESSION; PROCESS CONTROL
Chemical
Monitor glucoseconcentrations on a
fermentation process
NIR; airflow rate;alkali addition
rateLLDF PLS SWS DF-individual
model comparisonLLDF > individual
model / [203]
MSPC control chart forstyrenic polymer
production process;predict melt flow index
and percentage of boundacetonitrile
NIR/NIR; processsensor data* LLDF; MLDF* PLS; PCA PCA EDA MLDF >
individual model e.d. [103]
Food Monitoring of yogurtfermentation
NIR; temperature;E-nose MLDF ANN Forward selection / No comparison
e.d. +interfering
factors[140]
Pharmaceutical
BSPC of a fluid bedgranulation process;
prediction of granuledensity and flowability
from process fingerprint
Spatial filtervelocimetry;
temperature dataLLDF PLS - / Enhanced process
control e.d. [157]
Predict granulationwater, tableting speed,
and tablet disintegration
Process data; Rawmaterial data;
Granulometricdata
MLDF PLS; ANN PCA /; complementaryunivariate sources
Enhancedfeedforward
process controle.d. [139]
Predict the viscosity of apersonal care product
from process data
8 processparameters
(temperature,pressure data)
MLDF MPLS PLS /; complementaryunivariate sources
Enhanced processcontrol / [158]
REGRESSION
AgricultureDetermination of starchand protein content in
navy bean flour
NIR; Fluorescencespectroscopy LLDF PCR; PLS -
X-Y correlatedvariabilityestimated
LLDF >/≈individual model
(f. response)e.d. [204]
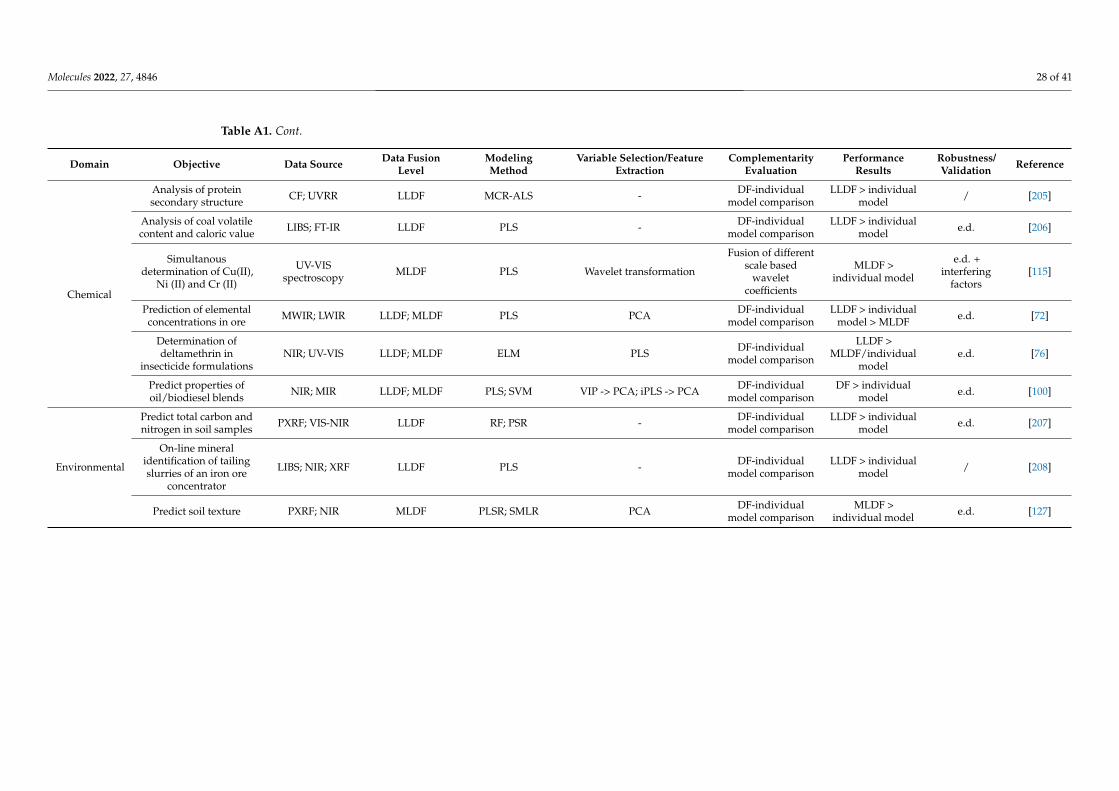
Molecules 2022, 27, 4846 28 of 41
Table A1. Cont.
Domain Objective Data Source Data FusionLevel
ModelingMethod
Variable Selection/FeatureExtraction
ComplementarityEvaluation
PerformanceResults
Robustness/Validation Reference
Chemical
Analysis of proteinsecondary structure CF; UVRR LLDF MCR-ALS - DF-individual
model comparisonLLDF > individual
model / [205]
Analysis of coal volatilecontent and caloric value LIBS; FT-IR LLDF PLS - DF-individual
model comparisonLLDF > individual
model e.d. [206]
Simultanousdetermination of Cu(II),
Ni (II) and Cr (II)
UV-VISspectroscopy MLDF PLS Wavelet transformation
Fusion of differentscale based
waveletcoefficients
MLDF >individual model
e.d. +interfering
factors[115]
Prediction of elementalconcentrations in ore MWIR; LWIR LLDF; MLDF PLS PCA DF-individual
model comparisonLLDF > individual
model > MLDF e.d. [72]
Determination ofdeltamethrin in
insecticide formulationsNIR; UV-VIS LLDF; MLDF ELM PLS DF-individual
model comparison
LLDF >MLDF/individual
modele.d. [76]
Predict properties ofoil/biodiesel blends NIR; MIR LLDF; MLDF PLS; SVM VIP -> PCA; iPLS -> PCA DF-individual
model comparisonDF > individual
model e.d. [100]
Environmental
Predict total carbon andnitrogen in soil samples PXRF; VIS-NIR LLDF RF; PSR - DF-individual
model comparisonLLDF > individual
model e.d. [207]
On-line mineralidentification of tailingslurries of an iron ore
concentrator
LIBS; NIR; XRF LLDF PLS - DF-individualmodel comparison
LLDF > individualmodel / [208]
Predict soil texture PXRF; NIR MLDF PLSR; SMLR PCA DF-individualmodel comparison
MLDF >individual model e.d. [127]
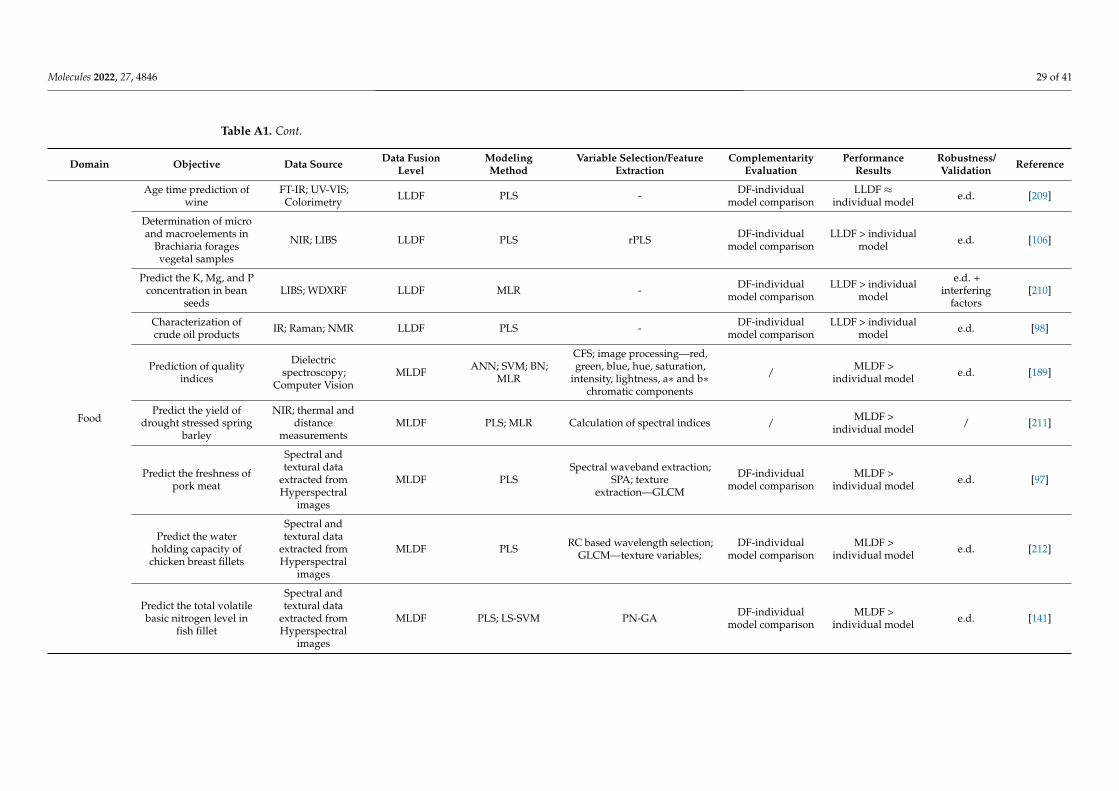
Molecules 2022, 27, 4846 29 of 41
Table A1. Cont.
Domain Objective Data Source Data FusionLevel
ModelingMethod
Variable Selection/FeatureExtraction
ComplementarityEvaluation
PerformanceResults
Robustness/Validation Reference
Food
Age time prediction ofwine
FT-IR; UV-VIS;Colorimetry LLDF PLS - DF-individual
model comparisonLLDF ≈
individual model e.d. [209]
Determination of microand macroelements in
Brachiaria foragesvegetal samples
NIR; LIBS LLDF PLS rPLS DF-individualmodel comparison
LLDF > individualmodel e.d. [106]
Predict the K, Mg, and Pconcentration in bean
seedsLIBS; WDXRF LLDF MLR - DF-individual
model comparisonLLDF > individual
model
e.d. +interfering
factors[210]
Characterization ofcrude oil products IR; Raman; NMR LLDF PLS - DF-individual
model comparisonLLDF > individual
model e.d. [98]
Prediction of qualityindices
Dielectricspectroscopy;
Computer VisionMLDF ANN; SVM; BN;
MLR
CFS; image processing—red,green, blue, hue, saturation,
intensity, lightness, a∗ and b∗chromatic components
/ MLDF >individual model e.d. [189]
Predict the yield ofdrought stressed spring
barley
NIR; thermal anddistance
measurementsMLDF PLS; MLR Calculation of spectral indices / MLDF >
individual model / [211]
Predict the freshness ofpork meat
Spectral andtextural data
extracted fromHyperspectral
images
MLDF PLSSpectral waveband extraction;
SPA; textureextraction—GLCM
DF-individualmodel comparison
MLDF >individual model e.d. [97]
Predict the waterholding capacity ofchicken breast fillets
Spectral andtextural data
extracted fromHyperspectral
images
MLDF PLS RC based wavelength selection;GLCM—texture variables;
DF-individualmodel comparison
MLDF >individual model e.d. [212]
Predict the total volatilebasic nitrogen level in
fish fillet
Spectral andtextural data
extracted fromHyperspectral
images
MLDF PLS; LS-SVM PN-GA DF-individualmodel comparison
MLDF >individual model e.d. [141]
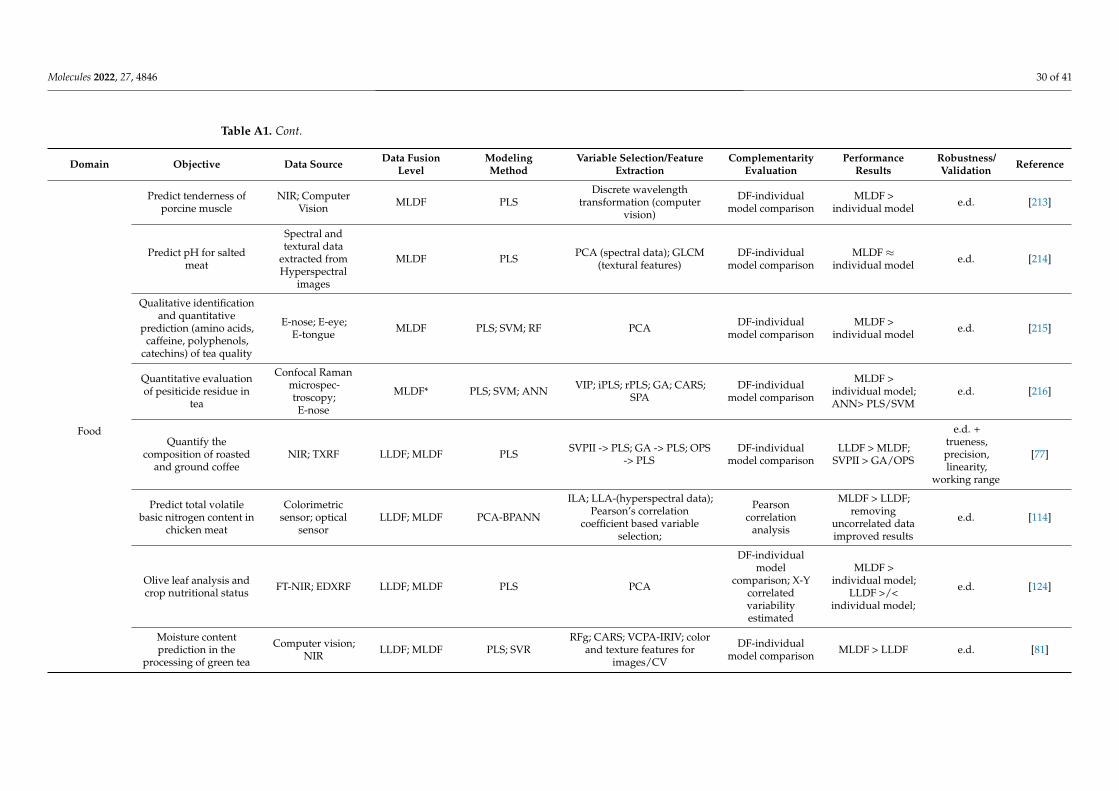
Molecules 2022, 27, 4846 30 of 41
Table A1. Cont.
Domain Objective Data Source Data FusionLevel
ModelingMethod
Variable Selection/FeatureExtraction
ComplementarityEvaluation
PerformanceResults
Robustness/Validation Reference
Food
Predict tenderness ofporcine muscle
NIR; ComputerVision MLDF PLS
Discrete wavelengthtransformation (computer
vision)
DF-individualmodel comparison
MLDF >individual model e.d. [213]
Predict pH for saltedmeat
Spectral andtextural data
extracted fromHyperspectral
images
MLDF PLS PCA (spectral data); GLCM(textural features)
DF-individualmodel comparison
MLDF ≈individual model e.d. [214]
Qualitative identificationand quantitative
prediction (amino acids,caffeine, polyphenols,
catechins) of tea quality
E-nose; E-eye;E-tongue MLDF PLS; SVM; RF PCA DF-individual
model comparisonMLDF >
individual model e.d. [215]
Quantitative evaluationof pesiticide residue in
tea
Confocal Ramanmicrospec-troscopy;E-nose
MLDF* PLS; SVM; ANN VIP; iPLS; rPLS; GA; CARS;SPA
DF-individualmodel comparison
MLDF >individual model;ANN> PLS/SVM
e.d. [216]
Quantify thecomposition of roasted
and ground coffeeNIR; TXRF LLDF; MLDF PLS SVPII -> PLS; GA -> PLS; OPS
-> PLSDF-individual
model comparisonLLDF > MLDF;
SVPII > GA/OPS
e.d. +trueness,precision,linearity,
working range
[77]
Predict total volatilebasic nitrogen content in
chicken meat
Colorimetricsensor; optical
sensorLLDF; MLDF PCA-BPANN
ILA; LLA-(hyperspectral data);Pearson’s correlation
coefficient based variableselection;
Pearsoncorrelation
analysis
MLDF > LLDF;removing
uncorrelated dataimproved results
e.d. [114]
Olive leaf analysis andcrop nutritional status FT-NIR; EDXRF LLDF; MLDF PLS PCA
DF-individualmodel
comparison; X-Ycorrelatedvariabilityestimated
MLDF >individual model;
LLDF >/<individual model;
e.d. [124]
Moisture contentprediction in the
processing of green tea
Computer vision;NIR LLDF; MLDF PLS; SVR
RFg; CARS; VCPA-IRIV; colorand texture features for
images/CV
DF-individualmodel comparison MLDF > LLDF e.d. [81]
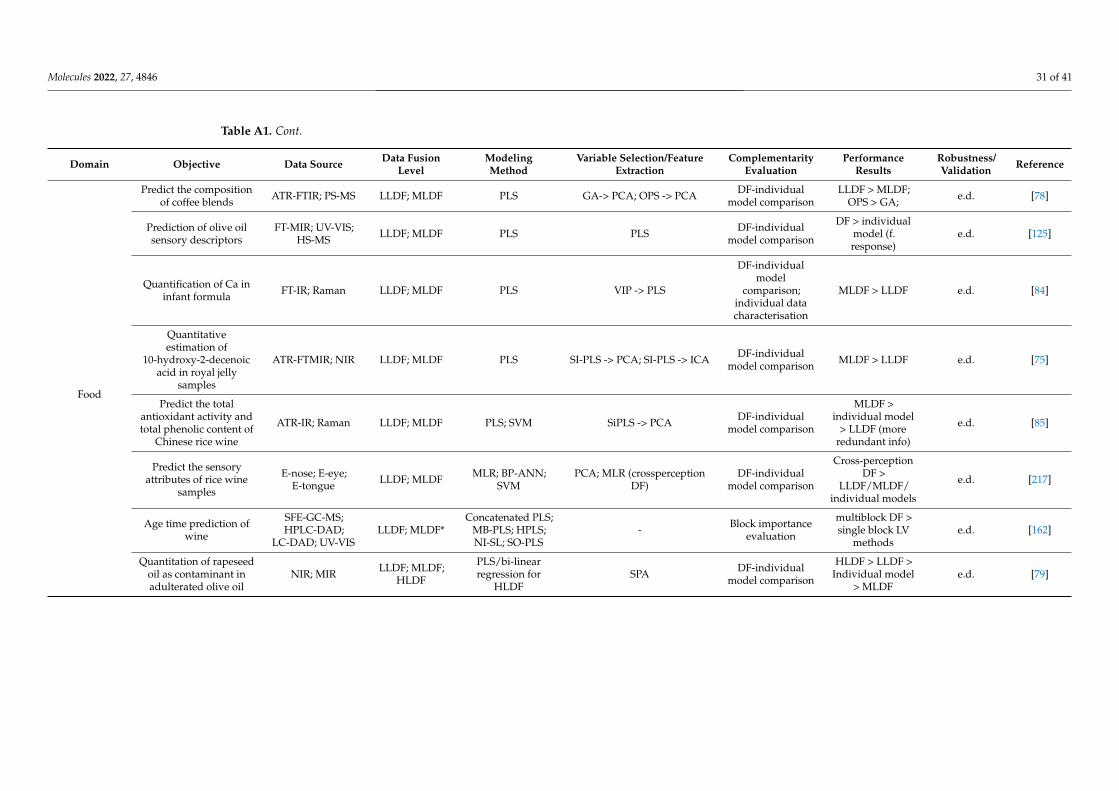
Molecules 2022, 27, 4846 31 of 41
Table A1. Cont.
Domain Objective Data Source Data FusionLevel
ModelingMethod
Variable Selection/FeatureExtraction
ComplementarityEvaluation
PerformanceResults
Robustness/Validation Reference
Food
Predict the compositionof coffee blends ATR-FTIR; PS-MS LLDF; MLDF PLS GA-> PCA; OPS -> PCA DF-individual
model comparisonLLDF > MLDF;
OPS > GA; e.d. [78]
Prediction of olive oilsensory descriptors
FT-MIR; UV-VIS;HS-MS LLDF; MLDF PLS PLS DF-individual
model comparison
DF > individualmodel (f.response)
e.d. [125]
Quantification of Ca ininfant formula FT-IR; Raman LLDF; MLDF PLS VIP -> PLS
DF-individualmodel
comparison;individual datacharacterisation
MLDF > LLDF e.d. [84]
Quantitativeestimation of
10-hydroxy-2-decenoicacid in royal jelly
samples
ATR-FTMIR; NIR LLDF; MLDF PLS SI-PLS -> PCA; SI-PLS -> ICA DF-individualmodel comparison MLDF > LLDF e.d. [75]
Predict the totalantioxidant activity andtotal phenolic content of
Chinese rice wine
ATR-IR; Raman LLDF; MLDF PLS; SVM SiPLS -> PCA DF-individualmodel comparison
MLDF >individual model
> LLDF (moreredundant info)
e.d. [85]
Predict the sensoryattributes of rice wine
samples
E-nose; E-eye;E-tongue LLDF; MLDF MLR; BP-ANN;
SVMPCA; MLR (crossperception
DF)DF-individual
model comparison
Cross-perceptionDF >
LLDF/MLDF/individual models
e.d. [217]
Age time prediction ofwine
SFE-GC-MS;HPLC-DAD;
LC-DAD; UV-VISLLDF; MLDF*
Concatenated PLS;MB-PLS; HPLS;NI-SL; SO-PLS
- Block importanceevaluation
multiblock DF >single block LV
methodse.d. [162]
Quantitation of rapeseedoil as contaminant inadulterated olive oil
NIR; MIR LLDF; MLDF;HLDF
PLS/bi-linearregression for
HLDFSPA DF-individual
model comparison
HLDF > LLDF >Individual model
> MLDFe.d. [79]
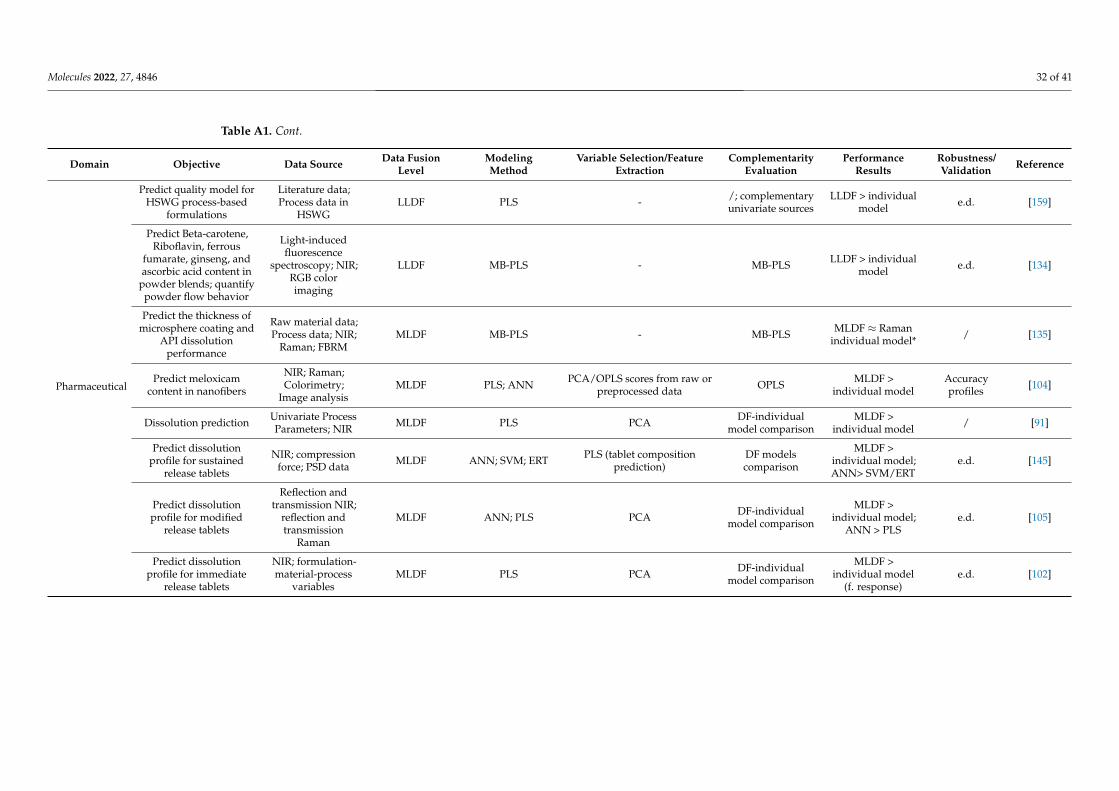
Molecules 2022, 27, 4846 32 of 41
Table A1. Cont.
Domain Objective Data Source Data FusionLevel
ModelingMethod
Variable Selection/FeatureExtraction
ComplementarityEvaluation
PerformanceResults
Robustness/Validation Reference
Pharmaceutical
Predict quality model forHSWG process-based
formulations
Literature data;Process data in
HSWGLLDF PLS - /; complementary
univariate sourcesLLDF > individual
model e.d. [159]
Predict Beta-carotene,Riboflavin, ferrous
fumarate, ginseng, andascorbic acid content in
powder blends; quantifypowder flow behavior
Light-inducedfluorescence
spectroscopy; NIR;RGB colorimaging
LLDF MB-PLS - MB-PLS LLDF > individualmodel e.d. [134]
Predict the thickness ofmicrosphere coating and
API dissolutionperformance
Raw material data;Process data; NIR;
Raman; FBRMMLDF MB-PLS - MB-PLS MLDF ≈ Raman
individual model* / [135]
Predict meloxicamcontent in nanofibers
NIR; Raman;Colorimetry;
Image analysisMLDF PLS; ANN PCA/OPLS scores from raw or
preprocessed data OPLS MLDF >individual model
Accuracyprofiles [104]
Dissolution prediction Univariate ProcessParameters; NIR MLDF PLS PCA DF-individual
model comparisonMLDF >
individual model / [91]
Predict dissolutionprofile for sustained
release tablets
NIR; compressionforce; PSD data MLDF ANN; SVM; ERT PLS (tablet composition
prediction)DF modelscomparison
MLDF >individual model;ANN> SVM/ERT
e.d. [145]
Predict dissolutionprofile for modified
release tablets
Reflection andtransmission NIR;
reflection andtransmission
Raman
MLDF ANN; PLS PCA DF-individualmodel comparison
MLDF >individual model;
ANN > PLSe.d. [105]
Predict dissolutionprofile for immediate
release tablets
NIR; formulation-material-process
variablesMLDF PLS PCA DF-individual
model comparison
MLDF >individual model
(f. response)e.d. [102]
Molecules 2022, 27, 4846 33 of 41
References1. Panzitta, M.; Calamassi, N.; Sabatini, C.; Grassi, M.; Spagnoli, C.; Vizzini, V.; Ricchiuto, E.; Venturini, A.; Brogi, A.; Brassier Font,
J.; et al. Spectrophotometry and pharmaceutical PAT/RTRT: Practical challenges and regulatory landscape from development toproduct lifecycle. Int. J. Pharm. 2021, 601, 120551. [CrossRef] [PubMed]
2. The Application of Quality by Design to Analytical Methods. Available online: https://www.pharmtech.com/view/application-quality-design-analytical-methods (accessed on 1 May 2022).
3. The International Conference on Harmonisation of Technical Requirements for Registration of Pharmaceuticals for Human UseQuality Guidelines. Available online: https://www.ich.org/page/quality-guidelines (accessed on 1 May 2022).
4. Kovács, B.; Péterfi, O.; Kovács-Deák, B.; Székely-Szentmiklósi, I.; Fülöp, I.; Bába, L.-I.; Boda, F. Quality-by-design in pharmaceuti-cal development: From current perspectives to practical applications. Acta Pharm. 2021, 71, 497–526. [CrossRef]
5. US FDA. Guidance for Industry Guidance for Industry PAT—A Framework for Innovative Pharmaceutical; US FDA: Rockville, MD,USA, 2004.
6. Sever, N.E.; Warman, M.; Mackey, S.; Dziki, W.; Jiang, M. Process Analytical Technology in Solid Dosage Development andManufacturing. In Developing Solid Oral Dosage Forms; Elsevier: Amsterdam, The Netherlands, 2009; pp. 827–841.
7. Bakeev, K.A. (Ed.) Process Analytical Technology, 1st ed.; Blackwell Publishing: Hoboken, NJ, USA, 2005; ISBN 978-1405121033.8. Ferreira, A.P.; Menezes, J.C.; Tobyn, M. (Eds.) Multivariate Analysis in the Pharmaceutical Industry; Academic Press: Cambridge,
MA, USA, 2018; ISBN 978-0-12-811065-2.9. Cocchi, M. (Ed.) Data Fusion Methodology and Applications, 1st ed.; Elsevier: Amsterdam, The Netherlands, 2019;
ISBN 9780444639844.10. de Oliveira, R.R.; Avila, C.; Bourne, R.; Muller, F.; de Juan, A. Data fusion strategies to combine sensor and multivariate model
outputs for multivariate statistical process control. Anal. Bioanal. Chem. 2020, 412, 2151–2163. [CrossRef] [PubMed]11. Maléchaux, A.; Le Dréau, Y.; Artaud, J.; Dupuy, N. Control chart and data fusion for varietal origin discrimination: Application to
olive oil. Talanta 2020, 217, 121115. [CrossRef] [PubMed]12. Azcarate, S.M.; Ríos-Reina, R.; Amigo, J.M.; Goicoechea, H.C. Data handling in data fusion: Methodologies and applications.
TrAC Trends Anal. Chem. 2021, 143, 116355. [CrossRef]13. Mishra, P.; Roger, J.-M.; Jouan-Rimbaud-Bouveresse, D.; Biancolillo, A.; Marini, F.; Nordon, A.; Rutledge, D.N. Recent trends
in multi-block data analysis in chemometrics for multi-source data integration. TrAC Trends Anal. Chem. 2021, 137, 116206.[CrossRef]
14. Campos, M.P.; Reis, M.S. Data preprocessing for multiblock modelling—A systematization with new methods. Chemom. Intell.Lab. Syst. 2020, 199, 103959. [CrossRef]
15. Mishra, P.; Biancolillo, A.; Roger, J.M.; Marini, F.; Rutledge, D.N. New data preprocessing trends based on ensemble of multiplepreprocessing techniques. TrAC Trends Anal. Chem. 2020, 132, 116045. [CrossRef]
16. Zhou, L.; Zhang, C.; Qiu, Z.; He, Y. Information fusion of emerging non-destructive analytical techniques for food qualityauthentication: A survey. TrAC Trends Anal. Chem. 2020, 127, 115901. [CrossRef]
17. Borràs, E.; Ferré, J.; Boqué, R.; Mestres, M.; Aceña, L.; Busto, O. Data fusion methodologies for food and beverage authenticationand quality assessment—A review. Anal. Chim. Acta 2015, 891, 1–14. [CrossRef] [PubMed]
18. Di Rosa, A.R.; Leone, F.; Cheli, F.; Chiofalo, V. Fusion of electronic nose, electronic tongue and computer vision for animal sourcefood authentication and quality assessment—A review. J. Food Eng. 2017, 210, 62–75. [CrossRef]
19. Kiani, S.; Minaei, S.; Ghasemi-Varnamkhasti, M. Fusion of artificial senses as a robust approach to food quality assessment. J. FoodEng. 2016, 171, 230–239. [CrossRef]
20. Hakemeyer, C.; Strauss, U.; Werz, S.; Jose, G.E.; Folque, F.; Menezes, J.C. At-line NIR spectroscopy as effective PAT monitoringtechnique in Mab cultivations during process development and manufacturing. Talanta 2012, 90, 12–21. [CrossRef] [PubMed]
21. De Beer, T.; Burggraeve, A.; Fonteyne, M.; Saerens, L.; Remon, J.P.; Vervaet, C. Near infrared and Raman spectroscopy for thein-process monitoring of pharmaceutical production processes. Int. J. Pharm. 2011, 417, 32–47. [CrossRef]
22. Laske, S.; Paudel, A.; Scheibelhofer, O.; Sacher, S.; Hoermann, T.; Khinast, J.; Kelly, A.; Rantannen, J.; Korhonen, O.; Stauffer,F.; et al. A Review of PAT Strategies in Secondary Solid Oral Dosage Manufacturing of Small Molecules. J. Pharm. Sci. 2017,106, 667–712. [CrossRef] [PubMed]
23. Simon, L.L.; Pataki, H.; Marosi, G.; Meemken, F.; Hungerbühler, K.; Baiker, A.; Tummala, S.; Glennon, B.; Kuentz, M.; Steele, G.;et al. Assessment of Recent Process Analytical Technology (PAT) Trends: A Multiauthor Review. Org. Process Res. Dev. 2015,19, 3–62. [CrossRef]
24. Rathore, A.S.; Bhambure, R.; Ghare, V. Process analytical technology (PAT) for biopharmaceutical products. Anal. Bioanal. Chem.2010, 398, 137–154. [CrossRef] [PubMed]
25. Korteby, Y.; Mahdi, Y.; Daoud, K.; Regdon, G. A novel insight into fluid bed melt granulation: Temperature mapping for thedetermination of granule formation with the in-situ and spray-on techniques. Eur. J. Pharm. Sci. 2019, 127, 351–362. [CrossRef]
26. Madarász, L.; Köte, Á.; Gyürkés, M.; Farkas, A.; Hambalkó, B.; Pataki, H.; Fülöp, G.; Marosi, G.; Lengyel, L.; Casian, T.; et al.Videometric mass flow control: A new method for real-time measurement and feedback control of powder micro-feeding basedon image analysis. Int. J. Pharm. 2020, 580, 119223. [CrossRef]
27. Hansuld, E.M.; Briens, L. A review of monitoring methods for pharmaceutical wet granulation. Int. J. Pharm. 2014, 472, 192–201.[CrossRef] [PubMed]
Molecules 2022, 27, 4846 34 of 41
28. Ooi, S.M.; Sarkar, S.; van Varenbergh, G.; Schoeters, K.; Heng, P.W.S. Continuous processing and the applications of online toolsin pharmaceutical product manufacture: Developments and examples. Ther. Deliv. 2013, 4, 463–470. [CrossRef]
29. Brock, D.; Axel Zeitler, J.; Funke, A.; Knop, K.; Kleinebudde, P. Evaluation of critical process parameters for inter-tablet coatinguniformity of active-coated GITS using Terahertz Pulsed Imaging. Eur. J. Pharm. Biopharm. 2014, 88, 434–442. [CrossRef]
30. Lindenberg, P.; Arana, L.R.; Mahnke, L.K.; Rönfeldt, P.; Heidenreich, N.; Doungmo, G.; Guignot, N.; Bean, R.; Chapman, H.N.;Dierksmeyer, D.; et al. New insights into the crystallization of polymorphic materials: From real-time serial crystallography toluminescence analysis. React. Chem. Eng. 2019, 4, 1757–1767. [CrossRef]
31. Silva, A.F.T.; Burggraeve, A.; Denon, Q.; Van der Meeren, P.; Sandler, N.; Van Den Kerkhof, T.; Hellings, M.; Vervaet, C.; Remon,J.P.; Lopes, J.A.; et al. Particle sizing measurements in pharmaceutical applications: Comparison of in-process methods versusoff-line methods. Eur. J. Pharm. Biopharm. 2013, 85, 1006–1018. [CrossRef]
32. Szilágyi, B.; Nagy, Z.K. Aspect Ratio Distribution and Chord Length Distribution Driven Modeling of Crystallization of Two-Dimensional Crystals for Real-Time Model-Based Applications. Cryst. Growth Des. 2018, 18, 5311–5321. [CrossRef]
33. Abioye, A.O.; Chi, G.T.; Simone, E.; Nagy, Z. Real-time monitoring of the mechanism of ibuprofen-cationic dextran crystanuleformation using crystallization process informatics system (CryPRINS). Int. J. Pharm. 2016, 509, 264–278. [CrossRef]
34. Galata, D.L.; Mészáros, L.A.; Kállai-Szabó, N.; Szabó, E.; Pataki, H.; Marosi, G.; Nagy, Z.K. Applications of machine vision inpharmaceutical technology: A review. Eur. J. Pharm. Sci. 2021, 159, 105717. [CrossRef]
35. Crocombe, R.A.; Leary, P.E.; Kammrath, B.W. (Eds.) Portable Spectroscopy and Spectrometry, Volume 1, Technologies and Instrumenta-tion, 1st ed.; Wiley: Hoboken, NJ, USA, 2021; ISBN 978-1-119-63636-6.
36. Nagy, B.; Farkas, A.; Borbás, E.; Vass, P.; Nagy, Z.K.; Marosi, G. Raman Spectroscopy for Process Analytical Technologies ofPharmaceutical Secondary Manufacturing. AAPS PharmSciTech 2019, 20, 1. [CrossRef] [PubMed]
37. Gupta, A.; Austin, J.; Davis, S.; Harris, M.; Reklaitis, G. A Novel Microwave Sensor for Real-Time Online Monitoring of RollCompacts of Pharmaceutical Powders Online—A Comparative Case Study with NIR. J. Pharm. Sci. 2015, 104, 1787–1794.[CrossRef]
38. Gosselin, R.; Durão, P.; Abatzoglou, N.; Guay, J.-M. Monitoring the concentration of flowing pharmaceutical powders in atableting feed frame. Pharm. Dev. Technol. 2017, 22, 699–705. [CrossRef]
39. Zhang, F.; Liu, T.; Wang, X.Z.; Liu, J.; Jiang, X. Comparative study on ATR-FTIR calibration models for monitoring solutionconcentration in cooling crystallization. J. Cryst. Growth 2017, 459, 50–55. [CrossRef]
40. Simone, E.; Saleemi, A.N.; Nagy, Z.K. In Situ Monitoring of Polymorphic Transformations Using a Composite Sensor Array ofRaman, NIR, and ATR-UV/vis Spectroscopy, FBRM, and PVM for an Intelligent Decision Support System. Org. Process Res. Dev.2015, 19, 167–177. [CrossRef]
41. Bawuah, P.; Zeitler, J.A. Advances in terahertz time-domain spectroscopy of pharmaceutical solids: A review. TrAC Trends Anal.Chem. 2021, 139, 116272. [CrossRef]
42. Foley, D.A.; Wang, J.; Maranzano, B.; Zell, M.T.; Marquez, B.L.; Xiang, Y.; Reid, G.L. Online NMR and HPLC as a ReactionMonitoring Platform for Pharmaceutical Process Development. Anal. Chem. 2013, 85, 8928–8932. [CrossRef] [PubMed]
43. Carter, A.; Briens, L. Inline acoustic monitoring to determine fluidized bed performance during pharmaceutical coating. Int. J.Pharm. 2018, 549, 293–298. [CrossRef] [PubMed]
44. Sacher, S.; Wahl, P.; Weißensteiner, M.; Wolfgang, M.; Pokhilchuk, Y.; Looser, B.; Thies, J.; Raffa, A.; Khinast, J.G. Shedding light oncoatings: Real-time monitoring of coating quality at industrial scale. Int. J. Pharm. 2019, 566, 57–66. [CrossRef] [PubMed]
45. Alves-Lima, D.; Song, J.; Li, X.; Portieri, A.; Shen, Y.; Zeitler, J.A.; Lin, H. Review of Terahertz Pulsed Imaging for PharmaceuticalFilm Coating Analysis. Sensors 2020, 20, 1441. [CrossRef] [PubMed]
46. Gordon, K.C.; McGoverin, C.M. Raman mapping of pharmaceuticals. Int. J. Pharm. 2011, 417, 151–162. [CrossRef] [PubMed]47. Al Ktash, M.; Stefanakis, M.; Boldrini, B.; Ostertag, E.; Brecht, M. Characterization of Pharmaceutical Tablets Using UV
Hyperspectral Imaging as a Rapid In-Line Analysis Tool. Sensors 2021, 21, 4436. [CrossRef] [PubMed]48. Mirschel, G.; Daikos, O.; Scherzer, T.; Steckert, C. Near-infrared chemical imaging used for in-line analysis of functional finishes
on textiles. Talanta 2018, 188, 91–98. [CrossRef]49. Rathore, A.S.; Kumar, D.; Kateja, N. Role of raw materials in biopharmaceutical manufacturing: Risk analysis and fingerprinting.
Curr. Opin. Biotechnol. 2018, 53, 99–105. [CrossRef]50. Floris, P.; McGillicuddy, N.; Morrissey, B.; Albrecht, S.; Kaisermayer, C.; Hawe, D.; Riordan, L.; Lindeberg, A.; Forestell, S.; Bones,
J. A LC–MS/MS platform for the identification of productivity markers in industrial mammalian cell culture media. ProcessBiochem. 2019, 86, 136–143. [CrossRef]
51. Hakemeyer, C.; Strauss, U.; Werz, S.; Folque, F.; Menezes, J.C. Near-infrared and two-dimensional fluorescence spectroscopymonitoring of monoclonal antibody fermentation media quality: Aged media decreases cell growth. Biotechnol. J. 2013, 8, 835–846.[CrossRef]
52. Ryder, A.G. Cell culture media analysis using rapid spectroscopic methods. Curr. Opin. Chem. Eng. 2018, 22, 11–17. [CrossRef]53. Mayrhofer, P.; Reinhart, D.; Castan, A.; Kunert, R. Monitoring of heat- and light exposure of cell culture media by RAMAN
spectroscopy: Towards an analytical tool for cell culture media quality control. Biochem. Eng. J. 2021, 166, 107845. [CrossRef]54. Li, B.; Ryan, P.W.; Ray, B.H.; Leister, K.J.; Sirimuthu, N.M.S.; Ryder, A.G. Rapid characterization and quality control of complex
cell culture media solutions using raman spectroscopy and chemometrics. Biotechnol. Bioeng. 2010, 107, 290–301. [CrossRef]
Molecules 2022, 27, 4846 35 of 41
55. Lee, H.W.; Christie, A.; Xu, J.; Yoon, S. Data fusion-based assessment of raw materials in mammalian cell culture. Biotechnol.Bioeng. 2012, 109, 2819–2828. [CrossRef] [PubMed]
56. Biechele, P.; Busse, C.; Solle, D.; Scheper, T.; Reardon, K. Sensor systems for bioprocess monitoring. Eng. Life Sci. 2015, 15, 469–488.[CrossRef]
57. Roch, P.; Mandenius, C.-F. On-line monitoring of downstream bioprocesses. Curr. Opin. Chem. Eng. 2016, 14, 112–120. [CrossRef]58. Zhao, L.; Fu, H.-Y.; Zhou, W.; Hu, W.-S. Advances in process monitoring tools for cell culture bioprocesses. Eng. Life Sci. 2015, 15,
459–468. [CrossRef]59. Zitzmann, J.; Weidner, T.; Eichner, G.; Salzig, D.; Czermak, P. Dielectric Spectroscopy and Optical Density Measurement for the
Online Monitoring and Control of Recombinant Protein Production in Stably Transformed Drosophila melanogaster S2 Cells.Sensors 2018, 18, 900. [CrossRef]
60. Lüder, C.; Lindner, P.; Bulnes-Abundis, D.; Lu, S.M.; Lücking, T.; Solle, D.; Scheper, T. In situ microscopy and MIR-spectroscopyas non-invasive optical sensors for cell cultivation process monitoring. Pharm. Bioprocess. 2014, 2, 157–166. [CrossRef]
61. Abu-Absi, N.R.; Martel, R.P.; Lanza, A.M.; Clements, S.J.; Borys, M.C.; Li, Z.J. Application of spectroscopic methods for monitoringof bioprocesses and the implications for the manufacture of biologics. Pharm. Bioprocess. 2014, 2, 267–284. [CrossRef]
62. Rolinger, L.; Rüdt, M.; Hubbuch, J. A critical review of recent trends, and a future perspective of optical spectroscopy as PAT inbiopharmaceutical downstream processing. Anal. Bioanal. Chem. 2020, 412, 2047–2064. [CrossRef] [PubMed]
63. Esmonde-White, K.A.; Cuellar, M.; Lewis, I.R. The role of Raman spectroscopy in biopharmaceuticals from development tomanufacturing. Anal. Bioanal. Chem. 2022, 414, 969–991. [CrossRef] [PubMed]
64. Wasalathanthri, D.P.; Rehmann, M.S.; Song, Y.; Gu, Y.; Mi, L.; Shao, C.; Chemmalil, L.; Lee, J.; Ghose, S.; Borys, M.C.; et al.Technology outlook for real-time quality attribute and process parameter monitoring in biopharmaceutical development—Areview. Biotechnol. Bioeng. 2020, 117, 3182–3198. [CrossRef] [PubMed]
65. Brestrich, N.; Rüdt, M.; Büchler, D.; Hubbuch, J. Selective protein quantification for preparative chromatography using variablepathlength UV/Vis spectroscopy and partial least squares regression. Chem. Eng. Sci. 2018, 176, 157–164. [CrossRef]
66. Maruthamuthu, M.K.; Rudge, S.R.; Ardekani, A.M.; Ladisch, M.R.; Verma, M.S. Process Analytical Technologies and DataAnalytics for the Manufacture of Monoclonal Antibodies. Trends Biotechnol. 2020, 38, 1169–1186. [CrossRef]
67. São Pedro, M.N.; Klijn, M.E.; Eppink, M.H.; Ottens, M. Process analytical technique (PAT) miniaturization for monoclonalantibody aggregate detection in continuous downstream processing. J. Chem. Technol. Biotechnol. 2021. [CrossRef]
68. Liu, Y.; Zhang, C.; Chen, J.; Fernandez, J.; Vellala, P.; Kulkarni, T.A.; Aguilar, I.; Ritz, D.; Lan, K.; Patel, P.; et al. A FullyIntegrated Online Platform For Real Time Monitoring Of Multiple Product Quality Attributes In Biopharmaceutical Processes ForMonoclonal Antibody Therapeutics. J. Pharm. Sci. 2022, 111, 358–367. [CrossRef] [PubMed]
69. Castanedo, F. A Review of Data Fusion Techniques. Sci. World J. 2013, 2013, 704504. [CrossRef] [PubMed]70. Smolinska, A.; Engel, J.; Szymanska, E.; Buydens, L.; Blanchet, L. General Framing of Low-, Mid-, and High-Level Data Fusion
with Examples in the Life Sciences. In Data Handling in Science and Technology; Elsevier: Amsterdam, The Netherlands, 2019;pp. 51–79.
71. Silvestri, M.; Elia, A.; Bertelli, D.; Salvatore, E.; Durante, C.; Li Vigni, M.; Marchetti, A.; Cocchi, M. A mid level data fusionstrategy for the Varietal Classification of Lambrusco PDO wines. Chemom. Intell. Lab. Syst. 2014, 137, 181–189. [CrossRef]
72. Desta, F.; Buxton, M.; Jansen, J. Data Fusion for the Prediction of Elemental Concentrations in Polymetallic Sulphide Ore UsingMid-Wave Infrared and Long-Wave Infrared Reflectance Data. Minerals 2020, 10, 235. [CrossRef]
73. Tahir, H.E.; Xiaobo, Z.; Zhihua, L.; Jiyong, S.; Zhai, X.; Wang, S.; Mariod, A.A. Rapid prediction of phenolic compounds andantioxidant activity of Sudanese honey using Raman and Fourier transform infrared (FT-IR) spectroscopy. Food Chem. 2017, 226,202–211. [CrossRef]
74. Biancolillo, A.; Bucci, R.; Magrì, A.L.; Magrì, A.D.; Marini, F. Data-fusion for multiplatform characterization of an italian craftbeer aimed at its authentication. Anal. Chim. Acta 2014, 820, 23–31. [CrossRef]
75. Yang, X.; Li, Y.; Wang, L.; Li, L.; Guo, L.; Yang, M.; Huang, F.; Zhao, H. Determination of 10-HDA in royal jelly by ATR-FTMIRand NIR spectral combining with data fusion strategy. Optik 2020, 203, 164052. [CrossRef]
76. Li, Q.; Huang, Y.; Zhang, J.; Min, S. A fast determination of insecticide deltamethrin by spectral data fusion of UV–vis and NIRbased on extreme learning machine. Spectrochim. Acta Part A Mol. Biomol. Spectrosc. 2021, 247, 119119. [CrossRef]
77. Assis, C.; Gama, E.M.; Nascentes, C.C.; de Oliveira, L.S.; Anzanello, M.J.; Sena, M.M. A data fusion model merging informationfrom near infrared spectroscopy and X-ray fluorescence. Searching for atomic-molecular correlations to predict and characterizethe composition of coffee blends. Food Chem. 2020, 325, 126953. [CrossRef] [PubMed]
78. Assis, C.; Pereira, H.V.; Amador, V.S.; Augusti, R.; de Oliveira, L.S.; Sena, M.M. Combining mid infrared spectroscopy andpaper spray mass spectrometry in a data fusion model to predict the composition of coffee blends. Food Chem. 2019, 281, 71–77.[CrossRef] [PubMed]
79. Li, Y.; Xiong, Y.; Min, S. Data fusion strategy in quantitative analysis of spectroscopy relevant to olive oil adulteration. Vib.Spectrosc. 2019, 101, 20–27. [CrossRef]
80. Ramos, P.M.; Ruisánchez, I.; Andrikopoulos, K.S. Micro-Raman and X-ray fluorescence spectroscopy data fusion for theclassification of ochre pigments. Talanta 2008, 75, 926–936. [CrossRef] [PubMed]
Molecules 2022, 27, 4846 36 of 41
81. Liu, Z.; Zhang, R.; Yang, C.; Hu, B.; Luo, X.; Li, Y.; Dong, C. Research on moisture content detection method during green teaprocessing based on machine vision and near-infrared spectroscopy technology. Spectrochim. Acta Part A Mol. Biomol. Spectrosc.2022, 271, 120921. [CrossRef] [PubMed]
82. Li, Y.; Zhang, J.-Y.; Wang, Y.-Z. FT-MIR and NIR spectral data fusion: A synergetic strategy for the geographical traceability ofPanax notoginseng. Anal. Bioanal. Chem. 2018, 410, 91–103. [CrossRef] [PubMed]
83. Li, Y.; Wang, Y. Synergistic strategy for the geographical traceability of wild Boletus tomentipes by means of data fusion analysis.Microchem. J. 2018, 140, 38–46. [CrossRef]
84. Zhao, M.; Markiewicz-Keszycka, M.; Beattie, R.J.; Casado-Gavalda, M.P.; Cama-Moncunill, X.; O’Donnell, C.P.; Cullen, P.J.;Sullivan, C. Quantification of calcium in infant formula using laser-induced breakdown spectroscopy (LIBS), Fourier transformmid-infrared (FT-IR) and Raman spectroscopy combined with chemometrics including data fusion. Food Chem. 2020, 320, 126639.[CrossRef]
85. Wu, Z.; Xu, E.; Long, J.; Pan, X.; Xu, X.; Jin, Z.; Jiao, A. Comparison between ATR-IR, Raman, concatenated ATR-IR and Ramanspectroscopy for the determination of total antioxidant capacity and total phenolic content of Chinese rice wine. Food Chem. 2016,194, 671–679. [CrossRef] [PubMed]
86. Zhang, H.; Liu, Z.; Zhang, J.; Zhang, L.; Wang, S.; Wang, L.; Chen, J.; Zou, C.; Hu, J. Identification of Edible Gelatin Origins byData Fusion of NIRS, Fluorescence Spectroscopy, and LIBS. Food Anal. Methods 2021, 14, 525–536. [CrossRef]
87. Liang, J.; Li, M.; Du, Y.; Yan, C.; Zhang, Y.; Zhang, T.; Zheng, X.; Li, H. Data fusion of laser induced breakdown spectroscopy(LIBS) and infrared spectroscopy (IR) coupled with random forest (RF) for the classification and discrimination of compoundsalvia miltiorrhiza. Chemom. Intell. Lab. Syst. 2020, 207, 104179. [CrossRef]
88. Roussel, S.; Bellon-Maurel, V.; Roger, J.-M.; Grenier, P. Authenticating white grape must variety with classification models basedon aroma sensors, FT-IR and UV spectrometry. J. Food Eng. 2003, 60, 407–419. [CrossRef]
89. Márquez, C.; López, M.I.; Ruisánchez, I.; Callao, M.P. FT-Raman and NIR spectroscopy data fusion strategy for multivariatequalitative analysis of food fraud. Talanta 2016, 161, 80–86. [CrossRef]
90. Silva, A.F.; Vercruysse, J.; Vervaet, C.; Remon, J.P.; Lopes, J.A.; De Beer, T.; Sarraguça, M.C. Process monitoring and evaluation of acontinuous pharmaceutical twin-screw granulation and drying process using multivariate data analysis. Eur. J. Pharm. Biopharm.2018, 128, 36–47. [CrossRef]
91. Ibrahim, A.; Kothari, B.H.; Fahmy, R.; Hoag, S.W. Prediction of Dissolution of Sustained Release Coated Ciprofloxacin Beads UsingNear-infrared Spectroscopy and Process Parameters: A Data Fusion Approach. AAPS PharmSciTech 2019, 20, 222. [CrossRef]
92. Stauffer, F.; Boulanger, E.; Pilcer, G. Sampling and diversion strategy for twin-screw granulation lines using batch statisticalprocess monitoring. Eur. J. Pharm. Sci. 2022, 171, 106126. [CrossRef]
93. Silva, A.F.; Sarraguça, M.C.; Fonteyne, M.; Vercruysse, J.; De Leersnyder, F.; Vanhoorne, V.; Bostijn, N.; Verstraeten, M.; Vervaet,C.; Remon, J.P.; et al. Multivariate statistical process control of a continuous pharmaceutical twin-screw granulation and fluid beddrying process. Int. J. Pharm. 2017, 528, 242–252. [CrossRef] [PubMed]
94. Liu, L.; Li, W.; Zuo, Z.; Wang, Y. Multisource information fusion strategies of mass spectrometry and Fourier transform infraredspectroscopy data for authenticating the age and parts of Vietnamese ginseng. J. Chemom. 2021, 35. [CrossRef]
95. Moros, J.; Laserna, J.J. New Raman–Laser-Induced Breakdown Spectroscopy Identity of Explosives Using Parametric Data Fusionon an Integrated Sensing Platform. Anal. Chem. 2011, 83, 6275–6285. [CrossRef]
96. Haase, E.; Arroyo, L.; Trejos, T. Classification of printing inks in pharmaceutucal packages by Laser-Induced BreakdownSpectroscopy and Attenuated Total Reflectance-Fourier Transform Infrared Spectroscopy. Spectrochim. Acta Part B At. Spectrosc.2020, 172, 105963. [CrossRef]
97. Cheng, W.; Sun, D.-W.; Pu, H.; Liu, Y. Integration of spectral and textural data for enhancing hyperspectral prediction of K valuein pork meat. LWT-Food Sci. Technol. 2016, 72, 322–329. [CrossRef]
98. Dearing, T.I.; Thompson, W.J.; Rechsteiner, C.E.; Marquardt, B.J. Characterization of Crude Oil Products Using Data Fusion ofProcess Raman, Infrared, and Nuclear Magnetic Resonance (NMR) Spectra. Appl. Spectrosc. 2011, 65, 181–186. [CrossRef]
99. Sun, F.; Chen, Y.; Wang, K.-Y.; Wang, S.-M.; Liang, S.-W. Identification of Genuine and Adulterated Pinellia ternata by Mid-Infrared(MIR) and Near-Infrared (NIR) Spectroscopy with Partial Least Squares—Discriminant Analysis (PLS-DA). Anal. Lett. 2020, 53,937–959. [CrossRef]
100. Luna, A.S.; Lima, I.C.A.; Henriques, C.A.; de Araujo, L.R.R.; Fortunato da Rocha, W.; da Silva, J.V. Prediction of fatty methylesters and physical properties of soybean oil/biodiesel blends from near and mid-infrared spectra using the data fusion strategy.Anal. Methods 2017, 9, 4808–4818. [CrossRef]
101. Sun, F.; Zhong, Y.; Meng, J.; Wang, S.; Liang, S. Establishment of an integrated data fusion method between the colorimeter andnear-infrared spectroscopy to discriminate the stir-baked Gardenia jasminoides Ellis. Spectrosc. Lett. 2018, 51, 547–553. [CrossRef]
102. Zhao, Y.; Li, W.; Shi, Z.; Drennen, J.K.; Anderson, C.A. Prediction of Dissolution Profiles From Process Parameters, Formulation,and Spectroscopic Measurements. J. Pharm. Sci. 2019, 108, 2119–2127. [CrossRef] [PubMed]
103. Strani, L.; Mantovani, E.; Bonacini, F.; Marini, F.; Cocchi, M. Fusing NIR and Process Sensors Data for Polymer ProductionMonitoring. Front. Chem. 2021, 9, 748723. [CrossRef] [PubMed]
104. Casian, T.; Farkas, A.; Ilyés, K.; Démuth, B.; Borbás, E.; Madarász, L.; Rapi, Z.; Farkas, B.; Balogh, A.; Domokos, A.; et al. Datafusion strategies for performance improvement of a Process Analytical Technology platform consisting of four instruments:An electrospinning case study. Int. J. Pharm. 2019, 567, 118473. [CrossRef]
Molecules 2022, 27, 4846 37 of 41
105. Nagy, B.; Petra, D.; Galata, D.L.; Démuth, B.; Borbás, E.; Marosi, G.; Nagy, Z.K.; Farkas, A. Application of artificial neural networksfor Process Analytical Technology-based dissolution testing. Int. J. Pharm. 2019, 567, 118464. [CrossRef]
106. de Oliveira, D.M.; Fontes, L.M.; Pasquini, C. Comparing laser induced breakdown spectroscopy, near infrared spectroscopy, andtheir integration for simultaneous multi-elemental determination of micro- and macronutrients in vegetable samples. Anal. Chim.Acta 2019, 1062, 28–36. [CrossRef] [PubMed]
107. Sun, W.; Zhang, X.; Zhang, Z.; Zhu, R. Data fusion of near-infrared and mid-infrared spectra for identification of rhubarb.Spectrochim. Acta Part A Mol. Biomol. Spectrosc. 2017, 171, 72–79. [CrossRef] [PubMed]
108. Yu, H.-D.; Yun, Y.-H.; Zhang, W.; Chen, H.; Liu, D.; Zhong, Q.; Chen, W.; Chen, W. Three-step hybrid strategy towards efficientlyselecting variables in multivariate calibration of near-infrared spectra. Spectrochim. Acta Part A Mol. Biomol. Spectrosc. 2020,224, 117376. [CrossRef] [PubMed]
109. Farrés, M.; Platikanov, S.; Tsakovski, S.; Tauler, R. Comparison of the variable importance in projection (VIP) and of the selectivityratio (SR) methods for variable selection and interpretation. J. Chemom. 2015, 29, 528–536. [CrossRef]
110. Lan, Z.; Zhang, Y.; Sun, Y.; Ji, D.; Wang, S.; Lu, T.; Cao, H.; Meng, J. A mid-level data fusion approach for evaluating the internaland external changes determined by FT-NIR, electronic nose and colorimeter in Curcumae Rhizoma processing. J. Pharm. Biomed.Anal. 2020, 188, 113387. [CrossRef] [PubMed]
111. Rivera-Pérez, A.; Romero-González, R.; Garrido Frenich, A. Application of an innovative metabolomics approach to discriminategeographical origin and processing of black pepper by untargeted UHPLC-Q-Orbitrap-HRMS analysis and mid-level data fusion.Food Res. Int. 2021, 150, 110722. [CrossRef]
112. Huang, L.; Meng, L.; Zhu, N.; Wu, D. A primary study on forecasting the days before decay of peach fruit using near-infraredspectroscopy and electronic nose techniques. Postharvest Biol. Technol. 2017, 133, 104–112. [CrossRef]
113. Gholizadeh, A.; Coblinski, J.A.; Saberioon, M.; Ben-Dor, E.; Drábek, O.; Demattê, J.A.M.; Boruvka, L.; Nemecek, K.; Chabrillat, S.;Dajcl, J. vis–NIR and XRF Data Fusion and Feature Selection to Estimate Potentially Toxic Elements in Soil. Sensors 2021, 21, 2386.[CrossRef]
114. Khulal, U.; Zhao, J.; Hu, W.; Chen, Q. Intelligent evaluation of total volatile basic nitrogen (TVB-N) content in chicken meat by animproved multiple level data fusion model. Sens. Actuators B Chem. 2017, 238, 337–345. [CrossRef]
115. Gao, L.; Ren, S. Multivariate calibration of spectrophotometric data using a partial least squares with data fusion. Spectrochim.Acta Part A Mol. Biomol. Spectrosc. 2010, 76, 363–368. [CrossRef] [PubMed]
116. Wold, S.; Esbensen, K.; Geladi, P. Principal component analysis. Chemom. Intell. Lab. Syst. 1987, 2, 37–52. [CrossRef]117. Wold, S.; Sjöström, M.; Eriksson, L. PLS-regression: A basic tool of chemometrics. Chemom. Intell. Lab. Syst. 2001, 58, 109–130.
[CrossRef]118. Jiang, H.; Chen, Q. Development of Electronic Nose and Near Infrared Spectroscopy Analysis Techniques to Monitor the Critical
Time in SSF Process of Feed Protein. Sensors 2014, 14, 19441–19456. [CrossRef]119. Feng, L.; Wu, B.; Zhu, S.; Wang, J.; Su, Z.; Liu, F.; He, Y.; Zhang, C. Investigation on Data Fusion of Multisource Spectral Data for
Rice Leaf Diseases Identification Using Machine Learning Methods. Front. Plant Sci. 2020, 11. [CrossRef] [PubMed]120. Rebiere, H.; Grange, Y.; Deconinck, E.; Courselle, P.; Acevska, J.; Brezovska, K.; Maurin, J.; Rundlöf, T.; Portela, M.J.; Olsen, L.S.;
et al. European fingerprint study on omeprazole drug substances using a multi analytical approach and chemometrics as a toolfor the discrimination of manufacturing sources. J. Pharm. Biomed. Anal. 2022, 208, 114444. [CrossRef] [PubMed]
121. Ballabio, D.; Robotti, E.; Grisoni, F.; Quasso, F.; Bobba, M.; Vercelli, S.; Gosetti, F.; Calabrese, G.; Sangiorgi, E.; Orlandi, M.; et al.Chemical profiling and multivariate data fusion methods for the identification of the botanical origin of honey. Food Chem. 2018,266, 79–89. [CrossRef] [PubMed]
122. Zhang, H.; Lan, Y.; Suh, C.P.-C.; Westbrook, J.; Clint Hoffmann, W.; Yang, C.; Huang, Y. Fusion of remotely sensed data fromairborne and ground-based sensors to enhance detection of cotton plants. Comput. Electron. Agric. 2013, 93, 55–59. [CrossRef]
123. Casian, T.; Bogdan, C.; Tarta, D.; Moldovan, M.; Tomuta, I.; Iurian, S. Assessment of oral formulation-dependent characteristics oforodispersible tablets using texture profiles and multivariate data analysis. J. Pharm. Biomed. Anal. 2018, 152. [CrossRef]
124. Comino, F.; Ayora-Cañada, M.J.; Aranda, V.; Díaz, A.; Domínguez-Vidal, A. Near-infrared spectroscopy and X-ray fluorescencedata fusion for olive leaf analysis and crop nutritional status determination. Talanta 2018, 188, 676–684. [CrossRef] [PubMed]
125. Borràs, E.; Ferré, J.; Boqué, R.; Mestres, M.; Aceña, L.; Calvo, A.; Busto, O. Prediction of olive oil sensory descriptors usinginstrumental data fusion and partial least squares (PLS) regression. Talanta 2016, 155, 116–123. [CrossRef]
126. Huang, X.; Xu, H.; Wu, L.; Dai, H.; Yao, L.; Han, F. A data fusion detection method for fish freshness based on computer visionand near-infrared spectroscopy. Anal. Methods 2016, 8, 2929–2935. [CrossRef]
127. Wang, S.; Li, W.; Li, J.; Liu, X. Prediction of Soil Texture Using FT-NIR Spectroscopy and PXRF Spectrometry with Data Fusion.Soil Sci. 2013, 178, 626–638. [CrossRef]
128. Malegori, C.; Buratti, S.; Benedetti, S.; Oliveri, P.; Ratti, S.; Cappa, C.; Lucisano, M. A modified mid-level data fusion approachon electronic nose and FT-NIR data for evaluating the effect of different storage conditions on rice germ shelf life. Talanta 2020,206, 120208. [CrossRef] [PubMed]
129. Geurts, B.P.; Engel, J.; Rafii, B.; Blanchet, L.; Suppers, A.; Szymanska, E.; Jansen, J.J.; Buydens, L.M.C. Improving high-dimensionaldata fusion by exploiting the multivariate advantage. Chemom. Intell. Lab. Syst. 2016, 156, 231–240. [CrossRef]
130. Pomerantsev, A.L.; Rodionova, O.Y. Process analytical technology: A critical view of the chemometricians. J. Chemom. 2012, 26,299–310. [CrossRef]
Molecules 2022, 27, 4846 38 of 41
131. Zomer, S.; Zhang, J.; Talwar, S.; Chattoraj, S.; Hewitt, C. Multivariate monitoring for the industrialisation of a continuous wetgranulation tableting process. Int. J. Pharm. 2018, 547, 506–519. [CrossRef]
132. Westerhuis, J.A.; Kourti, T.; MacGregor, J.F. Analysis of multiblock and hierarchical PCA and PLS models. J. Chemom. 1998, 12,301–321. [CrossRef]
133. Lopes, J.A.; Menezes, J.C.; Westerhuis, J.A.; Smilde, A.K. Multiblock PLS analysis of an industrial pharmaceutical process.Biotechnol. Bioeng. 2002, 80, 419–427. [CrossRef] [PubMed]
134. Durão, P.; Fauteux-Lefebvre, C.; Guay, J.-M.; Abatzoglou, N.; Gosselin, R. Using multiple Process Analytical Technology probes tomonitor multivitamin blends in a tableting feed frame. Talanta 2017, 164, 7–15. [CrossRef] [PubMed]
135. Santos Silva, B.; Colbert, M.-J.; Santangelo, M.; Bartlett, J.A.; Lapointe-Garant, P.-P.; Simard, J.-S.; Gosselin, R. Monitoringmicrosphere coating processes using PAT tools in a bench scale fluid bed. Eur. J. Pharm. Sci. 2019, 135, 12–21. [CrossRef]
136. Liland, K.H.; Naes, T.; Indahl, U.G. ROSA-a fast extension of partial least squares regression for multiblock data analysis.J. Chemom. 2016, 30, 651–662. [CrossRef]
137. Naes, T.; Måge, I.; Segtnan, V.H. Incorporating interactions in multi-block sequential and orthogonalised partial least squaresregression. J. Chemom. 2011, 25, 601–609. [CrossRef]
138. Foschi, M.; Biancolillo, A.; Vellozzi, S.; Marini, F.; D’Archivio, A.A.; Boqué, R. Spectroscopic fingerprinting and chemometrics forthe discrimination of Italian Emmer landraces. Chemom. Intell. Lab. Syst. 2021, 215, 104348. [CrossRef]
139. Mathe, R.; Casian, T.; Tomută, I. Multivariate feed forward process control and optimization of an industrial, granulation basedtablet manufacturing line using historical data. Int. J. Pharm. 2020, 591, 119988. [CrossRef]
140. Cimander, C.; Carlsson, M.; Mandenius, C.-F. Sensor fusion for on-line monitoring of yoghurt fermentation. J. Biotechnol. 2002, 99,237–248. [CrossRef]
141. Cheng, J.-H.; Sun, D.-W.; Wei, Q. Enhancing Visible and Near-Infrared Hyperspectral Imaging Prediction of TVB-N Level for FishFillet Freshness Evaluation by Filtering Optimal Variables. Food Anal. Methods 2017, 10, 1888–1898. [CrossRef]
142. Zhao, C.; Jain, A.; Hailemariam, L.; Suresh, P.; Akkisetty, P.; Joglekar, G.; Venkatasubramanian, V.; Reklaitis, G.V.; Morris, K.; Basu,P. Toward intelligent decision support for pharmaceutical product development. J. Pharm. Innov. 2006, 1, 23–35. [CrossRef]
143. Debevec, V.; Srcic, S.; Horvat, M. Scientific, statistical, practical, and regulatory considerations in design space development. DrugDev. Ind. Pharm. 2018, 44, 349–364. [CrossRef] [PubMed]
144. von Stosch, M.; Schenkendorf, R.; Geldhof, G.; Varsakelis, C.; Mariti, M.; Dessoy, S.; Vandercammen, A.; Pysik, A.; Sanders,M. Working within the Design Space: Do Our Static Process Characterization Methods Suffice? Pharmaceutics 2020, 12, 562.[CrossRef]
145. Galata, D.L.; Könyves, Z.; Nagy, B.; Novák, M.; Mészáros, L.A.; Szabó, E.; Farkas, A.; Marosi, G.; Nagy, Z.K. Real-time releasetesting of dissolution based on surrogate models developed by machine learning algorithms using NIR spectra, compressionforce and particle size distribution as input data. Int. J. Pharm. 2021, 597, 120338. [CrossRef] [PubMed]
146. Jing, L.; Wang, T.; Zhao, M.; Wang, P. An Adaptive Multi-Sensor Data Fusion Method Based on Deep Convolutional NeuralNetworks for Fault Diagnosis of Planetary Gearbox. Sensors 2017, 17, 414. [CrossRef] [PubMed]
147. Gong, W.; Chen, H.; Zhang, Z.; Zhang, M.; Wang, R.; Guan, C.; Wang, Q. A Novel Deep Learning Method for Intelligent FaultDiagnosis of Rotating Machinery Based on Improved CNN-SVM and Multichannel Data Fusion. Sensors 2019, 19, 1693. [CrossRef]
148. Li, S.; Wang, H.; Song, L.; Wang, P.; Cui, L.; Lin, T. An adaptive data fusion strategy for fault diagnosis based on the convolutionalneural network. Measurement 2020, 165, 108122. [CrossRef]
149. Wu, H.; Han, Y.; Jin, J.; Geng, Z. Novel Deep Learning Based on Data Fusion Integrating Correlation Analysis for Soft SensorModeling. Ind. Eng. Chem. Res. 2021, 60, 10001–10010. [CrossRef]
150. Hertrampf, A.; Müller, H.; Menezes, J.C.; Herdling, T. Advanced qualification of pharmaceutical excipient suppliers by multipleanalytics and multivariate analysis combined. Int. J. Pharm. 2015, 495, 447–458. [CrossRef]
151. Machin, M.; Liesum, L.; Peinado, A. Implementation of modelling approaches in the QbD framework: Examples from theNovartis experience. In European Pharmaceutical Review; Russel Publishing: Westerham, UK, 2011; pp. 39–42.
152. Roggo, Y.; Pauli, V.; Jelsch, M.; Pellegatti, L.; Elbaz, F.; Ensslin, S.; Kleinebudde, P.; Krumme, M. Continuous manufacturingprocess monitoring of pharmaceutical solid dosage form: A case study. J. Pharm. Biomed. Anal. 2020, 179, 112971. [CrossRef][PubMed]
153. Kirdar, A.O.; Green, K.D.; Rathore, A.S. Application of Multivariate Data Analysis for Identification and Successful Resolution ofa Root Cause for a Bioprocessing Application. Biotechnol. Prog. 2008, 24, 720–726. [CrossRef] [PubMed]
154. Gunther, J.C.; Conner, J.S.; Seborg, D.E. Fault Detection and Diagnosis in an Industrial Fed-Batch Cell Culture Process. Biotechnol.Prog. 2007, 23, 851–857. [CrossRef]
155. Kirdar, A.O.; Conner, J.S.; Baclaski, J.; Rathore, A.S. Application of Multivariate Analysis toward Biotech Processes: Case Study ofa Cell-Culture Unit Operation. Biotechnol. Prog. 2007, 23, 61–67. [CrossRef]
156. Bostijn, N.; Dhondt, W.; Vervaet, C.; De Beer, T. PAT-based batch statistical process control of a manufacturing process for apharmaceutical ointment. Eur. J. Pharm. Sci. 2019, 136, 104946. [CrossRef]
157. Burggraeve, A.; Van Den Kerkhof, T.; Hellings, M.; Remon, J.P.; Vervaet, C.; De Beer, T. Batch statistical process control of a fluidbed granulation process using in-line spatial filter velocimetry and product temperature measurements. Eur. J. Pharm. Sci. 2011,42, 584–592. [CrossRef]
Molecules 2022, 27, 4846 39 of 41
158. Hicks, A.; Johnston, M.; Mowbray, M.; Barton, M.; Lane, A.; Mendoza, C.; Martin, P.; Zhang, D. A two-step multivariate statisticallearning approach for batch process soft sensing. Digit. Chem. Eng. 2021, 1, 100003. [CrossRef]
159. Wang, Z.; Cao, J.; Li, W.; Wang, Y.; Luo, G.; Qiao, Y.; Zhang, Y.; Xu, B. Using a material database and data fusion method toaccelerate the process model development of high shear wet granulation. Sci. Rep. 2021, 11, 16514. [CrossRef]
160. Borges, R.M.; Resende, J.V.M.; Pinto, A.P.; Garrido, B.C. Exploring correlations between MS and NMR for compound identificationusing essential oils: A pilot study. Phytochem. Anal. 2022, 33, 533–542. [CrossRef]
161. Park, J.; Kumar, S.; Han, S.-H.; Nam, S.-H.; Lee, Y. Combination of diffuse optical reflectance spectroscopy and laser-inducedbreakdown spectroscopy for accurate classification of edible salts. Spectrochim. Acta Part B At. Spectrosc. 2021, 179, 106088.[CrossRef]
162. Campos, M.P.; Sousa, R.; Pereira, A.C.; Reis, M.S. Advanced predictive methods for wine age prediction: Part II—A comparisonstudy of multiblock regression approaches. Talanta 2017, 171, 132–142. [CrossRef] [PubMed]
163. Casian, T.; Reznek, A.; Vonica-Gligor, A.L.; Van Renterghem, J.; De Beer, T.; Tomut,ă, I. Development, validation and comparisonof near infrared and Raman spectroscopic methods for fast characterization of tablets with amlodipine and valsartan. Talanta2017, 167, 333–343. [CrossRef] [PubMed]
164. Gavan, A.; Iurian, S.; Casian, T.; Porfire, A.; Porav, S.; Voina, I.; Oprea, A.; Tomuta, I. Fluidised bed granulation of two APIs: QbDapproach and development of a NIR in-line monitoring method. Asian J. Pharm. Sci. 2020, 15, 506–517. [CrossRef] [PubMed]
165. Vonica-Gligor, A.L.; Casian, T.; Reznek, A.; Tomut,ă, I.; Gligor, F. Simultaneous quantification of atorvastatin and amlodipine inpowder blends for tableting by nir spectroscopy and chemometry. Farmacia 2015, 6, 381–387.
166. Casian, T.; Iurian, S.; Gavan, A.; Revnic, C.; Porav, S.; Porfire, A.; Vlase, L.; Tomut,ă, I. Near Infra-Red spectroscopy for contentuniformity of powder blends—Focus on calibration set development, orthogonality transfer and robustness testing. Talanta 2018,188, 404–416. [CrossRef]
167. Tomuta, I.; Porfire, A.; Casian, T.; Gavan, A. Multivariate Calibration for the Development of Vibrational Spectroscopic Methods.In Calibration and Validation of Analytical Methods—A Sampling of Current Approaches; Stauffer, M.T., Ed.; InTech Open: London, UK,2018; pp. 35–60.
168. Domokos, A.; Pusztai, É.; Madarász, L.; Nagy, B.; Gyürkés, M.; Farkas, A.; Fülöp, G.; Casian, T.; Szilágyi, B.; Nagy, Z.K.Combination of PAT and mechanistic modeling tools in a fully continuous powder to granule line: Rapid and deep processunderstanding. Powder Technol. 2021, 388, 70–81. [CrossRef]
169. Gavan, A.; Sylvester, B.; Casian, T.; Tomuta, I. In-Line Fluid Bed Granulation Monitoring By NIR Spectroscopy. MethodDevelopment and Validation. Farmacia 2019, 67, 248–257. [CrossRef]
170. Casian, T.; Gavan, A.; Iurian, S.; Porfire, A.; Toma, V.; Stiufiuc, R.; Tomuta, I. Testing the Limits of a Portable NIR Spectrometer:Content Uniformity of Complex Powder Mixtures Followed by Calibration Transfer for In-Line Blend Monitoring. Molecules 2021,26, 1129. [CrossRef]
171. 5.21.Chemometric Methods Applied to Analytical Data. Available online: https://www.edqm.eu/en/-/revised-general-chapter-5.21-chemometric-methods-applied-to-analytical-data-published-for-public-comment-in-pharmeuropa%0A (accessedon 1 May 2022).
172. EMA. Guideline on the Use of Near Infrared Spectroscopy by the Pharmaceutical Industry and the Data Requirements for New Submissionsand Variations; EMA: Singapore, 2014.
173. US FDA. Development and Submission of Near Infrared Analytical Procedures. Guidance for Industry; US FDA: Rockville, MD,USA, 2021.
174. International Conference on Harmonisation (ICH) of Technical Requirements for Registration of Pharmaceuticals for Human Use,ICH Harmonised Tripartite Guideline: Q8(R2) Pharmaceutical Development. 2009. Available online: https://www.ema.europa.eu/en/ich-q8-r2-pharmaceutical-development (accessed on 1 May 2022).
175. Romero-Torres, S. The Future of Pharmaceutical Manufacturing: Your Roadmap to Pharma 4.0. Available online: https://www.thermofisher.com/blog/connectedlab/the-future-of-pharmaceutical-manufacturing-your-roadmap-to-pharma-4-0/ (accessedon 1 May 2022).
176. Arden, N.S.; Fisher, A.C.; Tyner, K.; Yu, L.X.; Lee, S.L.; Kopcha, M. Industry 4.0 for pharmaceutical manufacturing: Preparing forthe smart factories of the future. Int. J. Pharm. 2021, 602, 120554. [CrossRef] [PubMed]
177. Reinhardt, I.C.; Oliveira, D.J.C.; Ring, D.D.T. Current Perspectives on the Development of Industry 4.0 in the PharmaceuticalSector. J. Ind. Inf. Integr. 2020, 18, 100131. [CrossRef]
178. Steinwandter, V.; Borchert, D.; Herwig, C. Data science tools and applications on the way to Pharma 4.0. Drug Discov. Today 2019,24, 1795–1805. [CrossRef] [PubMed]
179. Chiang, L.H.; Braun, B.; Wang, Z.; Castillo, I. Towards artificial intelligence at scale in the chemical industry. AIChE J. 2022,68, e17644. [CrossRef]
180. Ntamo, D.; Lopez-Montero, E.; Mack, J.; Omar, C.; Highett, M.I.; Moss, D.; Mitchell, N.; Soulatintork, P.; Moghadam, P.Z.; Zandi,M. Industry 4.0 in Action: Digitalisation of a Continuous Process Manufacturing for Formulated Products. Digit. Chem. Eng.2022, 3, 100025. [CrossRef]
181. Miletic, I.; Quinn, S.; Dudzic, M.; Vaculik, V.; Champagne, M. An industrial perspective on implementing on-line applications ofmultivariate statistics. J. Process Control 2004, 14, 821–836. [CrossRef]
Molecules 2022, 27, 4846 40 of 41
182. Salve, P.; Yannawar, P.; Sardesai, M. Multimodal plant recognition through hybrid feature fusion technique using imaging andnon-imaging hyper-spectral data. J. King Saud Univ.-Comput. Inf. Sci. 2022, 34, 1361–1369. [CrossRef]
183. Hoehse, M.; Paul, A.; Gornushkin, I.; Panne, U. Multivariate classification of pigments and inks using combined Ramanspectroscopy and LIBS. Anal. Bioanal. Chem. 2012, 402, 1443–1450. [CrossRef] [PubMed]
184. Martínez Bilesio, A.R.; Batistelli, M.; García-Reiriz, A.G. Fusing data of different orders for environmental monitoring. Anal. Chim.Acta 2019, 1085, 48–60. [CrossRef]
185. Corona, P.; Frangipane, M.T.; Moscetti, R.; Lo Feudo, G.; Castellotti, T.; Massantini, R. Chestnut Cultivar Identification throughthe Data Fusion of Sensory Quality and FT-NIR Spectral Data. Foods 2021, 10, 2575. [CrossRef]
186. Dalle Zotte, A.; Ottavian, M.; Concollato, A.; Serva, L.; Martelli, R.; Parisi, G. Authentication of raw and cooked freeze-driedrainbow trout (Oncorhynchus mykiss) by means of near infrared spectroscopy and data fusion. Food Res. Int. 2014, 60, 180–188.[CrossRef]
187. Izquierdo-Llopart, A.; Saurina, J. Multi-Sensor Characterization of Sparkling Wines Based on Data Fusion. Chemosensors 2021,9, 200. [CrossRef]
188. Dankowska, A. Data fusion of fluorescence and UV spectroscopies improves the detection of cocoa butter adulteration. Eur. J.Lipid Sci. Technol. 2017, 119, 1600268. [CrossRef]
189. Sanaeifar, A.; Jafari, A.; Golmakani, M.-T. Fusion of dielectric spectroscopy and computer vision for quality characterization ofolive oil during storage. Comput. Electron. Agric. 2018, 145, 142–152. [CrossRef]
190. Yao, S.; Li, T.; Liu, H.; Li, J.; Wang, Y. Traceability of Boletaceae mushrooms using data fusion of UV-visible and FTIR combinedwith chemometrics methods. J. Sci. Food Agric. 2018, 98, 2215–2222. [CrossRef] [PubMed]
191. Apetrei, C.; Apetrei, I.M.; Villanueva, S.; de Saja, J.A.; Gutierrez-Rosales, F.; Rodriguez-Mendez, M.L. Combination of an e-nose,an e-tongue and an e-eye for the characterisation of olive oils with different degree of bitterness. Anal. Chim. Acta 2010, 663, 91–97.[CrossRef]
192. Jurado-Campos, N.; Arroyo-Manzanares, N.; Viñas, P.; Arce, L. Quality authentication of virgin olive oils using orthogonaltechniques and chemometrics based on individual and high-level data fusion information. Talanta 2020, 219, 121260. [CrossRef][PubMed]
193. Yang, X.; Wu, Z.; Ou, Q.; Qian, K.; Jiang, L.; Yang, W.; Shi, Y.; Liu, G. Diagnosis of Lung Cancer by FTIR Spectroscopy CombinedWith Raman Spectroscopy Based on Data Fusion and Wavelet Transform. Front. Chem. 2022, 10. [CrossRef] [PubMed]
194. Ferrer, A. Multivariate Statistical Process Control Based on Principal Component Analysis (MSPC-PCA): Some Reflections and aCase Study in an Autobody Assembly Process. Qual. Eng. 2007, 19, 311–325. [CrossRef]
195. Skagerberg, B.; MacGregor, J.F.; Kiparissides, C. Multivariate data analysis applied to low-density polyethylene reactors. Chemom.Intell. Lab. Syst. 1992, 14, 341–356. [CrossRef]
196. Gabrielsson, J.; Jonsson, H.; Trygg, J.; Airiau, C.; Schmidt, B.; Escott, R. Combining process and spectroscopic data to improvebatch modeling. AIChE J. 2006, 52, 3164–3172. [CrossRef]
197. Marjanovic, O.; Lennox, B.; Sandoz, D.; Smith, K.; Crofts, M. Real-time monitoring of an industrial batch process. Comput. Chem.Eng. 2006, 30, 1476–1481. [CrossRef]
198. Doan, X.-T.; Srinivasan, R. Online monitoring of multi-phase batch processes using phase-based multivariate statistical processcontrol. Comput. Chem. Eng. 2008, 32, 230–243. [CrossRef]
199. Dumarey, M.; Hermanto, M.; Airiau, C.; Shapland, P.; Robinson, H.; Hamilton, P.; Berry, M. Advances in Continuous ActivePharmaceutical Ingredient (API) Manufacturing: Real-time Monitoring Using Multivariate Tools. J. Pharm. Innov. 2019, 14,359–372. [CrossRef]
200. Kiran, K.L.; Selvaraj, S.; Lee, J.; Hua, C. Application of fault monitoring and diagnostic techniques and their challenges inpetrochemical industries. IFAC Proc. Vol. 2012, 45, 702–707. [CrossRef]
201. Cimander, C.; Mandenius, C.-F. Online monitoring of a bioprocess based on a multi-analyser system and multivariate statisticalprocess modelling. J. Chem. Technol. Biotechnol. 2002, 77, 1157–1168. [CrossRef]
202. Saavedra, J.; Córdova, A. Multivariate process control by transition scheme in soft- drink process using 3-Way PLS approach.Procedia Food Sci. 2011, 1, 1181–1187. [CrossRef]
203. Yu, S.; Montague, G.; Martin, E. Data Fusion for Enhanced Fermentation Process Tracking. IFAC Proc. Vol. 2010, 43, 37–42.[CrossRef]
204. Vitelli, M.; Mehrtash, H.; Assatory, A.; Tabtabaei, S.; Legge, R.L.; Rajabzadeh, A.R. Rapid and non-destructive determination ofprotein and starch content in agricultural powders using near-infrared and fluorescence spectroscopy, and data fusion. PowderTechnol. 2021, 381, 620–631. [CrossRef]
205. Oshokoya, O.O.; JiJi, R.D. Fusing Spectral Data To Improve Protein Secondary Structure Analysis: Data Fusion. In 40 Years ofChemometrics—From Bruce Kowalski to the Future; American Chemical Society: Washington, DC, USA, 2015; pp. 299–310.
206. Qin, H.; Lu, Z.; Yao, S.; Li, Z.; Lu, J. Combining laser-induced breakdown spectroscopy and Fourier-transform infraredspectroscopy for the analysis of coal properties. J. Anal. At. Spectrom. 2019, 34, 347–355. [CrossRef]
207. Wang, D.; Chakraborty, S.; Weindorf, D.C.; Li, B.; Sharma, A.; Paul, S.; Ali, M.N. Synthesized use of VisNIR DRS and PXRF forsoil characterization: Total carbon and total nitrogen. Geoderma 2015, 243–244, 157–167. [CrossRef]
208. Khajehzadeh, N.; Haavisto, O.; Koresaar, L. On-stream mineral identification of tailing slurries of an iron ore concentrator usingdata fusion of LIBS, reflectance spectroscopy and XRF measurement techniques. Miner. Eng. 2017, 113, 83–94. [CrossRef]
Molecules 2022, 27, 4846 41 of 41
209. Ferreiro-González, M.; Ruiz-Rodríguez, A.; Barbero, G.F.; Ayuso, J.; Álvarez, J.A.; Palma, M.; Barroso, C.G. FT-IR, Vis spectroscopy,color and multivariate analysis for the control of ageing processes in distinctive Spanish wines. Food Chem. 2019, 277, 6–11.[CrossRef] [PubMed]
210. Gamela, R.R.; Costa, V.C.; Sperança, M.A.; Pereira-Filho, E.R. Laser-induced breakdown spectroscopy (LIBS) and wavelengthdispersive X-ray fluorescence (WDXRF) data fusion to predict the concentration of K, Mg and P in bean seed samples. Food Res.Int. 2020, 132, 109037. [CrossRef] [PubMed]
211. Rischbeck, P.; Elsayed, S.; Mistele, B.; Barmeier, G.; Heil, K.; Schmidhalter, U. Data fusion of spectral, thermal and canopy heightparameters for improved yield prediction of drought stressed spring barley. Eur. J. Agron. 2016, 78, 44–59. [CrossRef]
212. Yang, Y.; Wang, W.; Zhuang, H.; Yoon, S.-C.; Jiang, H. Fusion of Spectra and Texture Data of Hyperspectral Imaging for thePrediction of the Water-Holding Capacity of Fresh Chicken Breast Filets. Appl. Sci. 2018, 8, 640. [CrossRef]
213. Barbin, D.F.; Valous, N.A.; Sun, D.-W. Tenderness prediction in porcine longissimus dorsi muscles using instrumental mea-surements along with NIR hyperspectral and computer vision imagery. Innov. Food Sci. Emerg. Technol. 2013, 20, 335–342.[CrossRef]
214. Liu, D.; Pu, H.; Sun, D.-W.; Wang, L.; Zeng, X.-A. Combination of spectra and texture data of hyperspectral imaging for predictionof pH in salted meat. Food Chem. 2014, 160, 330–337. [CrossRef]
215. Xu, M.; Wang, J.; Zhu, L. The qualitative and quantitative assessment of tea quality based on E-nose, E-tongue and E-eyecombined with chemometrics. Food Chem. 2019, 289, 482–489. [CrossRef]
216. Sanaeifar, A.; Li, X.; He, Y.; Huang, Z.; Zhan, Z. A data fusion approach on confocal Raman microspectroscopy and electronicnose for quantitative evaluation of pesticide residue in tea. Biosyst. Eng. 2021, 210, 206–222. [CrossRef]
217. Ouyang, Q.; Zhao, J.; Chen, Q. Instrumental intelligent test of food sensory quality as mimic of human panel test combiningmultiple cross-perception sensors and data fusion. Anal. Chim. Acta 2014, 841, 68–76. [CrossRef]
Top Related
Copyright © 2022 FDOKUMEN

