


Bahasa
Halaman
Hukum

Biogeosciences, 6, 1181–1198, 2009www.biogeosciences.net/6/1181/2009/© Author(s) 2009. This work is distributed underthe Creative Commons Attribution 3.0 License.
Biogeosciences
CEFLES2: the remote sensing component to quantifyphotosynthetic efficiency from the leaf to the region by measuringsun-induced fluorescence in the oxygen absorption bands
U. Rascher1, G. Agati2, L. Alonso3, G. Cecchi2, S. Champagne4, R. Colombo5, A. Damm6, F. Daumard4,E. de Miguel7, G. Fernandez3, B. Franch8, J. Franke9, C. Gerbig10, B. Gioli11, J. A. Gomez7, Y. Goulas4, L. Guanter12,O. Gutierrez-de-la-Camara7, K. Hamdi1, P. Hostert6, M. Jimenez7, M. Kosvancova13, D. Lognoli2, M. Meroni 5,F. Miglietta 11, A. Moersch1, J. Moreno3, I. Moya4, B. Neininger14, A. Okujeni6, A. Ounis4, L. Palombi2, V. Raimondi2,A. Schickling15, J. A. Sobrino8, M. Stellmes16, G. Toci2, P. Toscano11, T. Udelhoven17, S. van der Linden6, andA. Zaldei11
1Institute of Chemistry and Dynamics of the Geosphere, ICG-3: Phytosphere, Forschungszentrum Julich, Leo-Brandt-Str.,52425 Julich, Germany2IFAC-CNR, Istituto di Fisica Applicata “Nello Carrara”, Consiglio Nazionale delle Ricerche, via Madonna del Piano10,50019, Sesto F. no, Firenze, Italy3Department of Earth Physics and Thermodynamics, University of Valencia, Dr Moliner, 50, 46100 Burjassot,Valencia, Spain4Laboratoire de Meteorologie Dynamique, CNRS, Ecole Polytechnique, 91128 Palaiseau, France5Remote Sensing of Environmental Dynamics Lab., DISAT, University of Milan-Bicocca, Piazza della Scienza 1,20126 Milano, Italy6Geomatics Lab, Humboldt-Universitat zu Berlin, Unter den Linden 6, 10099 Berlin, Germany7Remote Sensing Laboratory. Instituto Nacional de Tecnica Aeroespacial. Carr. de Ajalvir, km 4, 28850 Torrejon de Ardoz,Madrid, Spain8Global Change Unit, Imaging Processing Laboratory, University of Valencia, Pol. “La Coma”, s/n, 46980 Paterna,Valencia, Spain9Center for Remote Sensing of Land Surfaces (ZFL), University of Bonn, Walter-Flex-Strasse 3, 53113 Bonn, Germany10Max Planck Institute for Biogeochemistry, Hans Knoell Str. 10, 07745 Jena, Germany1111IBIMET-CNR, Instituto di Biometeorologia, Consiglia Nazionale delle Ricerche, Via G. Caproni 8, 50145 Firenze, Italy12Helmholtz Centre Potsdam, GFZ German Research Centre for Geosciences, Department 1 – Geodesy and Remote Sensing,Telegrafenberg, 14473 Potsdam, Germany13Laboratory of Plants Ecological Physiology, Division of Ecosystem Processes, Institute of Systems Biology and Ecology,Pocıcı 3b, 60300 Brno, Czech Republic14Metair AG, Flugpaltzm, 8915 Hausen am Albis, Switzerland15Institute for Geophysics and Meteorology, University of Cologne, Kerpener Str. 13, 50937 Cologne, Germany16Remote Sensing Department, University of Trier, 54286 Trier, Germany17CRP-Gabriel Lippmann, Departement “Environnement et Agro-biotechnologies”, Geomatic Platform, 41, rue du Brill,4422 Belvaux, Luxembourg
Received: 23 December 2008 – Published in Biogeosciences Discuss.: 24 February 2009Revised: 16 June 2009 – Accepted: 21 June 2009 – Published: 17 July 2009
Published by Copernicus Publications on behalf of the European Geosciences Union.
1182 U. Rascher et al.: CEFLES2: remote sensing component to quantify photosynthetic efficiency
Abstract. The CEFLES2 campaign during the Carbo Eu-rope Regional Experiment Strategy was designed to providesimultaneous airborne measurements of solar induced fluo-rescence and CO2 fluxes. It was combined with extensiveground-based quantification of leaf- and canopy-level pro-cesses in support of ESA’s Candidate Earth Explorer Mis-sion of the “Fluorescence Explorer” (FLEX). The aim of thiscampaign was to test if fluorescence signal detected from anairborne platform can be used to improve estimates of plantmediated exchange on the mesoscale. Canopy fluorescencewas quantified from four airborne platforms using a com-bination of novel sensors: (i) the prototype airborne sen-sor AirFLEX quantified fluorescence in the oxygen A andB bands, (ii) a hyperspectral spectrometer (ASD) measuredreflectance along transects during 12 day courses, (iii) spa-tially high resolution georeferenced hyperspectral data cubescontaining the whole optical spectrum and the thermal re-gion were gathered with an AHS sensor, and (iv) the firstemployment of the high performance imaging spectrometerHYPER delivered spatially explicit and multi-temporal tran-sects across the whole region. During three measurementperiods in April, June and September 2007 structural, func-tional and radiometric characteristics of more than 20 dif-ferent vegetation types in the Les Landes region, SouthwestFrance, were extensively characterized on the ground. Thecampaign concept focussed especially on quantifying plantmediated exchange processes (photosynthetic electron trans-port, CO2 uptake, evapotranspiration) and fluorescence emis-sion. The comparison between passive sun-induced fluores-cence and active laser-induced fluorescence was performedon a corn canopy in the daily cycle and under desiccationstress. Both techniques show good agreement in detectingstress induced fluorescence change at the 760 nm band. Onthe large scale, airborne and ground-level measurements offluorescence were compared on several vegetation types sup-porting the scaling of this novel remote sensing signal. Themulti-scale design of the four airborne radiometric measure-ments along with extensive ground activities fosters a nestedapproach to quantify photosynthetic efficiency and gross pri-mary productivity (GPP) from passive fluorescence.
1 Introduction
Photosynthesis harvests light from a variable stream of solarphotons and converts this energy to carbohydrates that fuelall plant processes and ultimately life on Earth. The effi-ciency of photosynthetic electron transport and carbon fixa-tion is highly regulated, depending on plant species and en-vironmental constraints (Rascher and Nedbal, 2006; Schurret al., 2006). Quantum efficiency of photosystem II (PSII)
Correspondence to:U. Rascher([email protected])
depends primarily on light intensity and varies between 0.83for leaves of dark adapted higher plants and close to zero athigh light intensities (Rascher et al., 2000). Plants have de-veloped a variety of photochemical and non-photochemicalregulation mechanisms that are either constitutively active orare activated on demand to optimise the distribution of en-ergy for photosynthesis and to avoid damage because of over-energetisation of metabolism (Schulze and Caldwell, 1995for a comprehensive summary). Thus, plant photosynthesisis dynamically regulated adapting to environmental condi-tions and being affected by the ecological plasticity of eachspecies (Turner et al., 2003b; Schurr et al., 2006).
Remote sensing offers the unique possibility to derive spa-tially explicit information on vegetation status at local, re-gional or landscape scale (Goetz and Prince, 1999; Hilker etal., 2008). Reflectance signals alone, however, cannot quan-tify photosynthetic activity and dynamics of vegetation accu-rately. Great benefits would be expected from remote sensingtechniques that quantify the actual status of photosyntheticcarbon fixation. Monteith’s (1972, 1977) mechanistic LightUse Efficiency (LUE) concept relates the photosynthetic ca-pacity to LUE, describing the potential to convert absorbedradiation into biomass. Accordingly, gross primary produc-tivity (GPP) can be described as a function of the fraction ofabsorbed photosynthetic active radiation (fAPAR) and LUE(Turner et al., 2003a; Hilker et al., 2008). LUE is highly vari-able and depends on the phenological status, structure andspecies composition (Field et al., 1995; Goetz and Prince,1999). Due to its dynamic variations, the insufficient param-eterization of LUE is identified as a major source of uncer-tainties in modeling GPP (Hilker et al., 2008; Running et al.,2000).
Chlorophyll fluorescence analyses are among the mostpowerful techniques to non-destructively quantify photosyn-thetic efficiency and non-photochemical energy dissipationin photosynthetically active organisms under laboratory con-ditions. In the field chlorophyll fluorescence emission isfrequently considered to be employed as a complementary,high-capacity signal on vegetation dynamics (Papageorgiouand Govindjee, 2004). Sun-induced fluorescence can be ob-tained from remote sensing platforms. Several studies haveshown that it is correlated with photosynthetic efficiency andthus may serve as a proxy to quantify photosynthetic effi-ciency (Flexas et al., 2000, 2002).
The chlorophyll fluorescence is emitted by a leaf in thered and far-red spectral region under natural sunlight, how-ever fluorescence is only a minor fraction of the total re-flected light. This makes it particularly difficult to quanti-tatively extract the fluorescence signal from remote sensingdata. However, at certain wavelengths, the solar irradiance isabsorbed in the solar or earth atmosphere (so-called Fraun-hofer lines); thus, there is no or greatly reduced incomingradiation at the Earth’s surface in these wavelengths (Plas-cyk, 1975). Solar irradiance exhibits three main absorptionbands in the red and near infrared wavelength region: the Hα
Biogeosciences, 6, 1181–1198, 2009 www.biogeosciences.net/6/1181/2009/
U. Rascher et al.: CEFLES2: remote sensing component to quantify photosynthetic efficiency 1183
Table 1. Overview about the different methodological approaches during the three CEFLES2 campaigns in Southern France. In the first linethe relevant chapters are given that describe the methods and results; the reference to the Figures indicates the measurement period duringwhich data for the corresponding Figure were acquired, “x” indicates measurements that are not presented in this publication.
Leaf-level fluorescence Active, laser Passive sun-induced Daycourses Simultaneous overpassesCampaign windows (focus and gas-exchange -induced canopy canopy fluorescence on the of AirFLEX flights of AirFLEX, HYPER andon the vegetation type) measurements (3.1; 4.1) fluorescence (3.2.1; 4.2.3) ground (3.2.2; 4.2.1; 4.2.2) (3.3.1; 4.3.1) Dimona (3.3; 4.3.2)
April(Winter wheat and pine) Fig. 1, Fig. 2a, Fig. 4 (winter wheat) Fig. 2b Fig. 2e, Fig. 5, Fig. 6 Fig. 11 XJune(Several agricultural crops) Fig. 4 Fig. 6 Fig. 12September(corn and other other crops, pine) Fig. 2h, Fig. 4 (corn) Fig. 2c, d, Figs. 7, 8, 9 Fig. 2f, g, Fig. 6, Fig. 9 Fig 10
line at 656.3 nm is due to hydrogen absorption in the solaratmosphere, whereas two bands at 687 (O2-B) and 760 nm(O2-A) are due to absorption by molecular oxygen in the ter-restrial atmosphere. The O2-A and O2-B bands especiallyoverlap with the chlorophyll fluorescence emission spectrumand, due to their widths, have the potential to be investi-gated from air- and space-borne platforms. Thus, they can beused for monitoring chlorophyll fluorescence emission underdaylight excitation by the method of the Fraunhofer lines in-filling (Plascyck, 1975).
Several studies are currently under way to evaluate theaccuracy with which sun-induced fluorescence can be usedto quantify photosynthetic efficiency. With this paper wereport the concept and first results from the CEFLES2campaign that took place in the context of the CarboEurope Regional Experiment between April and Septem-ber 2007 in Southern France (seehttp://www.esa.int/esaLP/SEMQACHYX3F index 0.html). This campaign combinedstate-of-the-art remote sensing with extensive field-basedmeasurements to quantify the actual status of photosyntheticefficiency from the level of single leaves to a regional scale.The overarching goal was to better constrain and reduce un-certainties in modelling mesoscale carbon fluxes using fluo-rescence as a direct input parameter.
2 Quantifying sun-induced fluorescence using theFraunhofer Line Discrimination
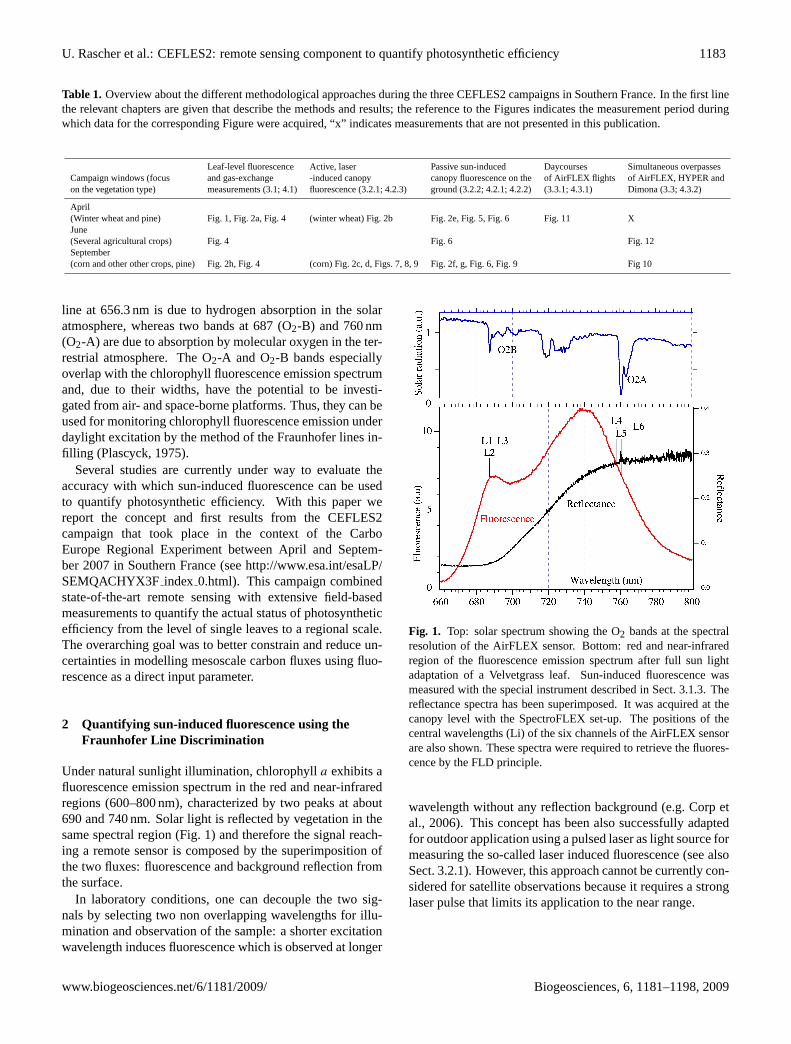
Under natural sunlight illumination, chlorophylla exhibits afluorescence emission spectrum in the red and near-infraredregions (600–800 nm), characterized by two peaks at about690 and 740 nm. Solar light is reflected by vegetation in thesame spectral region (Fig. 1) and therefore the signal reach-ing a remote sensor is composed by the superimposition ofthe two fluxes: fluorescence and background reflection fromthe surface.
In laboratory conditions, one can decouple the two sig-nals by selecting two non overlapping wavelengths for illu-mination and observation of the sample: a shorter excitationwavelength induces fluorescence which is observed at longer
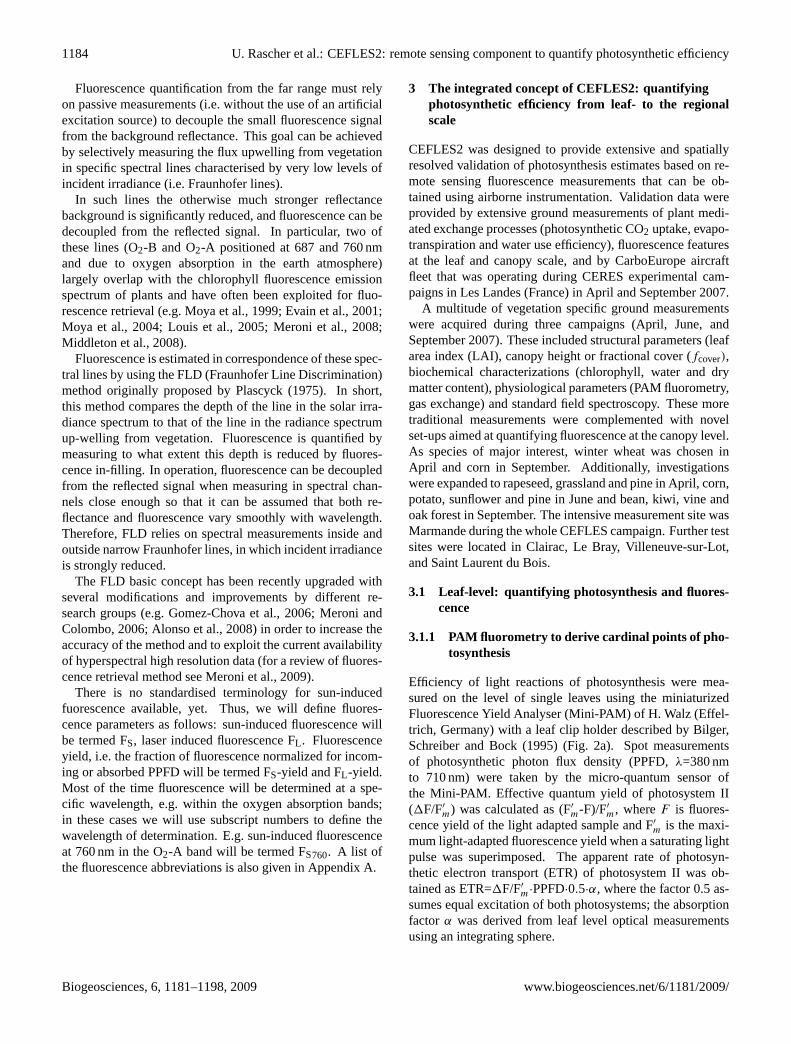
Fig. 1. Top: solar spectrum showing the O2 bands at the spectralresolution of the AirFLEX sensor. Bottom: red and near-infraredregion of the fluorescence emission spectrum after full sun lightadaptation of a Velvetgrass leaf. Sun-induced fluorescence wasmeasured with the special instrument described in Sect. 3.1.3. Thereflectance spectra has been superimposed. It was acquired at thecanopy level with the SpectroFLEX set-up. The positions of thecentral wavelengths (Li) of the six channels of the AirFLEX sensorare also shown. These spectra were required to retrieve the fluores-cence by the FLD principle.
wavelength without any reflection background (e.g. Corp etal., 2006). This concept has been also successfully adaptedfor outdoor application using a pulsed laser as light source formeasuring the so-called laser induced fluorescence (see alsoSect. 3.2.1). However, this approach cannot be currently con-sidered for satellite observations because it requires a stronglaser pulse that limits its application to the near range.
www.biogeosciences.net/6/1181/2009/ Biogeosciences, 6, 1181–1198, 2009
1184 U. Rascher et al.: CEFLES2: remote sensing component to quantify photosynthetic efficiency
Fluorescence quantification from the far range must relyon passive measurements (i.e. without the use of an artificialexcitation source) to decouple the small fluorescence signalfrom the background reflectance. This goal can be achievedby selectively measuring the flux upwelling from vegetationin specific spectral lines characterised by very low levels ofincident irradiance (i.e. Fraunhofer lines).
In such lines the otherwise much stronger reflectancebackground is significantly reduced, and fluorescence can bedecoupled from the reflected signal. In particular, two ofthese lines (O2-B and O2-A positioned at 687 and 760 nmand due to oxygen absorption in the earth atmosphere)largely overlap with the chlorophyll fluorescence emissionspectrum of plants and have often been exploited for fluo-rescence retrieval (e.g. Moya et al., 1999; Evain et al., 2001;Moya et al., 2004; Louis et al., 2005; Meroni et al., 2008;Middleton et al., 2008).
Fluorescence is estimated in correspondence of these spec-tral lines by using the FLD (Fraunhofer Line Discrimination)method originally proposed by Plascyck (1975). In short,this method compares the depth of the line in the solar irra-diance spectrum to that of the line in the radiance spectrumup-welling from vegetation. Fluorescence is quantified bymeasuring to what extent this depth is reduced by fluores-cence in-filling. In operation, fluorescence can be decoupledfrom the reflected signal when measuring in spectral chan-nels close enough so that it can be assumed that both re-flectance and fluorescence vary smoothly with wavelength.Therefore, FLD relies on spectral measurements inside andoutside narrow Fraunhofer lines, in which incident irradianceis strongly reduced.
The FLD basic concept has been recently upgraded withseveral modifications and improvements by different re-search groups (e.g. Gomez-Chova et al., 2006; Meroni andColombo, 2006; Alonso et al., 2008) in order to increase theaccuracy of the method and to exploit the current availabilityof hyperspectral high resolution data (for a review of fluores-cence retrieval method see Meroni et al., 2009).
There is no standardised terminology for sun-inducedfuorescence available, yet. Thus, we will define fluores-cence parameters as follows: sun-induced fluorescence willbe termed FS, laser induced fluorescence FL . Fluorescenceyield, i.e. the fraction of fluorescence normalized for incom-ing or absorbed PPFD will be termed FS-yield and FL-yield.Most of the time fluorescence will be determined at a spe-cific wavelength, e.g. within the oxygen absorption bands;in these cases we will use subscript numbers to define thewavelength of determination. E.g. sun-induced fluorescenceat 760 nm in the O2-A band will be termed FS760. A list ofthe fluorescence abbreviations is also given in Appendix A.
3 The integrated concept of CEFLES2: quantifyingphotosynthetic efficiency from leaf- to the regionalscale
CEFLES2 was designed to provide extensive and spatiallyresolved validation of photosynthesis estimates based on re-mote sensing fluorescence measurements that can be ob-tained using airborne instrumentation. Validation data wereprovided by extensive ground measurements of plant medi-ated exchange processes (photosynthetic CO2 uptake, evapo-transpiration and water use efficiency), fluorescence featuresat the leaf and canopy scale, and by CarboEurope aircraftfleet that was operating during CERES experimental cam-paigns in Les Landes (France) in April and September 2007.
A multitude of vegetation specific ground measurementswere acquired during three campaigns (April, June, andSeptember 2007). These included structural parameters (leafarea index (LAI), canopy height or fractional cover (fcover),biochemical characterizations (chlorophyll, water and drymatter content), physiological parameters (PAM fluorometry,gas exchange) and standard field spectroscopy. These moretraditional measurements were complemented with novelset-ups aimed at quantifying fluorescence at the canopy level.As species of major interest, winter wheat was chosen inApril and corn in September. Additionally, investigationswere expanded to rapeseed, grassland and pine in April, corn,potato, sunflower and pine in June and bean, kiwi, vine andoak forest in September. The intensive measurement site wasMarmande during the whole CEFLES campaign. Further testsites were located in Clairac, Le Bray, Villeneuve-sur-Lot,and Saint Laurent du Bois.
3.1 Leaf-level: quantifying photosynthesis and fluores-cence
3.1.1 PAM fluorometry to derive cardinal points of pho-tosynthesis
Efficiency of light reactions of photosynthesis were mea-sured on the level of single leaves using the miniaturizedFluorescence Yield Analyser (Mini-PAM) of H. Walz (Effel-trich, Germany) with a leaf clip holder described by Bilger,Schreiber and Bock (1995) (Fig. 2a). Spot measurementsof photosynthetic photon flux density (PPFD,λ=380 nmto 710 nm) were taken by the micro-quantum sensor ofthe Mini-PAM. Effective quantum yield of photosystem II(1F/F′
m) was calculated as (F′m-F)/F′m, whereF is fluores-
cence yield of the light adapted sample and F′m is the maxi-
mum light-adapted fluorescence yield when a saturating lightpulse was superimposed. The apparent rate of photosyn-thetic electron transport (ETR) of photosystem II was ob-tained as ETR=1F/F′
m·PPFD·0.5·α, where the factor 0.5 as-sumes equal excitation of both photosystems; the absorptionfactor α was derived from leaf level optical measurementsusing an integrating sphere.
Biogeosciences, 6, 1181–1198, 2009 www.biogeosciences.net/6/1181/2009/
U. Rascher et al.: CEFLES2: remote sensing component to quantify photosynthetic efficiency 1185
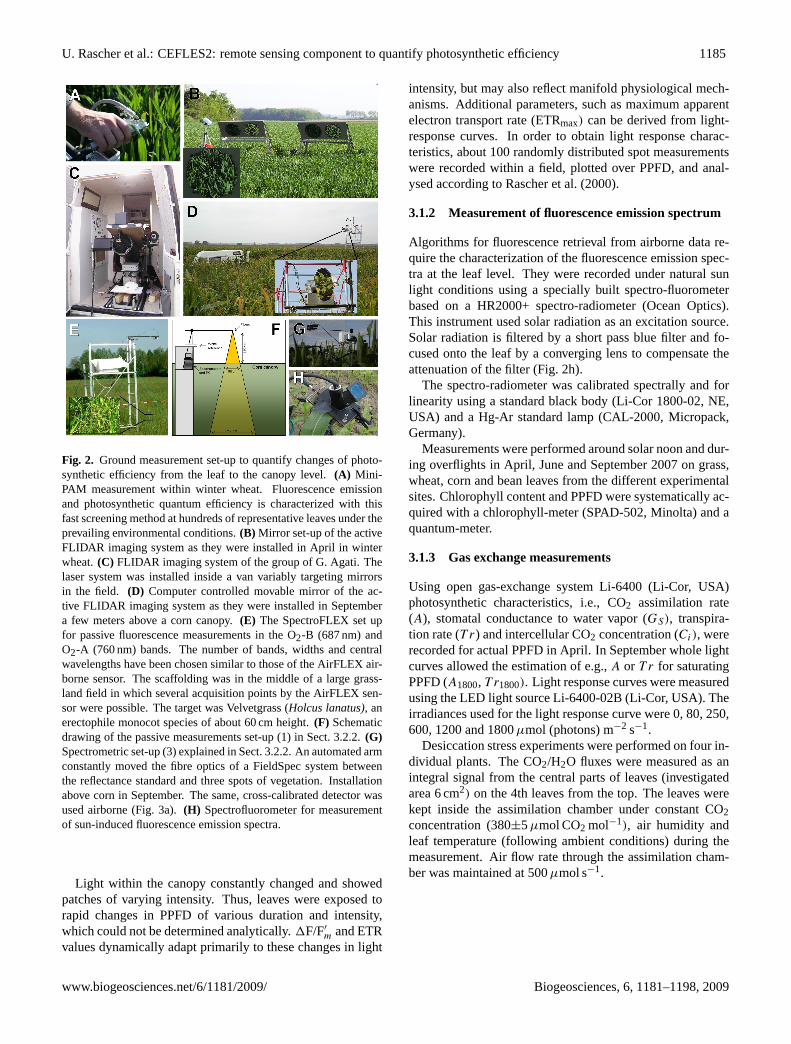
Fig. 2. Ground measurement set-up to quantify changes of photo-synthetic efficiency from the leaf to the canopy level.(A) Mini-PAM measurement within winter wheat. Fluorescence emissionand photosynthetic quantum efficiency is characterized with thisfast screening method at hundreds of representative leaves under theprevailing environmental conditions.(B) Mirror set-up of the activeFLIDAR imaging system as they were installed in April in winterwheat.(C) FLIDAR imaging system of the group of G. Agati. Thelaser system was installed inside a van variably targeting mirrorsin the field. (D) Computer controlled movable mirror of the ac-tive FLIDAR imaging system as they were installed in Septembera few meters above a corn canopy.(E) The SpectroFLEX set upfor passive fluorescence measurements in the O2-B (687 nm) andO2-A (760 nm) bands. The number of bands, widths and centralwavelengths have been chosen similar to those of the AirFLEX air-borne sensor. The scaffolding was in the middle of a large grass-land field in which several acquisition points by the AirFLEX sen-sor were possible. The target was Velvetgrass (Holcus lanatus), anerectophile monocot species of about 60 cm height.(F) Schematicdrawing of the passive measurements set-up (1) in Sect. 3.2.2.(G)Spectrometric set-up (3) explained in Sect. 3.2.2. An automated armconstantly moved the fibre optics of a FieldSpec system betweenthe reflectance standard and three spots of vegetation. Installationabove corn in September. The same, cross-calibrated detector wasused airborne (Fig. 3a).(H) Spectrofluorometer for measurementof sun-induced fluorescence emission spectra.
Light within the canopy constantly changed and showedpatches of varying intensity. Thus, leaves were exposed torapid changes in PPFD of various duration and intensity,which could not be determined analytically.1F/F′
m and ETRvalues dynamically adapt primarily to these changes in light
intensity, but may also reflect manifold physiological mech-anisms. Additional parameters, such as maximum apparentelectron transport rate (ETRmax) can be derived from light-response curves. In order to obtain light response charac-teristics, about 100 randomly distributed spot measurementswere recorded within a field, plotted over PPFD, and anal-ysed according to Rascher et al. (2000).
3.1.2 Measurement of fluorescence emission spectrum
Algorithms for fluorescence retrieval from airborne data re-quire the characterization of the fluorescence emission spec-tra at the leaf level. They were recorded under natural sunlight conditions using a specially built spectro-fluorometerbased on a HR2000+ spectro-radiometer (Ocean Optics).This instrument used solar radiation as an excitation source.Solar radiation is filtered by a short pass blue filter and fo-cused onto the leaf by a converging lens to compensate theattenuation of the filter (Fig. 2h).
The spectro-radiometer was calibrated spectrally and forlinearity using a standard black body (Li-Cor 1800-02, NE,USA) and a Hg-Ar standard lamp (CAL-2000, Micropack,Germany).
Measurements were performed around solar noon and dur-ing overflights in April, June and September 2007 on grass,wheat, corn and bean leaves from the different experimentalsites. Chlorophyll content and PPFD were systematically ac-quired with a chlorophyll-meter (SPAD-502, Minolta) and aquantum-meter.
3.1.3 Gas exchange measurements
Using open gas-exchange system Li-6400 (Li-Cor, USA)photosynthetic characteristics, i.e., CO2 assimilation rate(A), stomatal conductance to water vapor (GS), transpira-tion rate (T r) and intercellular CO2 concentration (Ci), wererecorded for actual PPFD in April. In September whole lightcurves allowed the estimation of e.g.,A or T r for saturatingPPFD (A1800, T r1800). Light response curves were measuredusing the LED light source Li-6400-02B (Li-Cor, USA). Theirradiances used for the light response curve were 0, 80, 250,600, 1200 and 1800µmol (photons) m−2 s−1.
Desiccation stress experiments were performed on four in-dividual plants. The CO2/H2O fluxes were measured as anintegral signal from the central parts of leaves (investigatedarea 6 cm2) on the 4th leaves from the top. The leaves werekept inside the assimilation chamber under constant CO2concentration (380±5µmol CO2 mol−1), air humidity andleaf temperature (following ambient conditions) during themeasurement. Air flow rate through the assimilation cham-ber was maintained at 500µmol s−1.
www.biogeosciences.net/6/1181/2009/ Biogeosciences, 6, 1181–1198, 2009
1186 U. Rascher et al.: CEFLES2: remote sensing component to quantify photosynthetic efficiency
3.2 Canopy-level
3.2.1 Active laser induced fluorescence
Active fluorescence spectra of vegetation were recorded byusing a hyperspectral Fluorescence LIDAR (FLIDAR) imag-ing system that was used in the field for the first time, thusthe technical details are briefly described here (Fig. 2c). TheFLIDAR consists mainly of a Q-switched Nd:YAG laser,a 1 m focal length Newtonian telescope and a 300 mm fo-cal length spectrometer coupled to an intensified, gated512×512 pixels CCD detector. Imaging was carried outby scanning the target with a computer-controlled motor-ized mirror. The FLIDAR prototype includes also a lowpower DPSS (Diode-Pumped Solid State) laser (emitting inthe green) for geometrical referencing on the target.
The pulsed Nd YAG laser excitation source was operate at355 nm (triple frequency) or at 532 nm (double frequency),with pulse width of 5 ns, pulse energy of 8 mJ and 20 mJ forthe UV and green excitation, respectively, and maximum rep-etition rate of 10 Hz. The laser beam divergence is 0.5 mradwith a starting beam diameter of 7 mm. Three folding highenergy dielectric mirrors provide the excitation laser beam tobe coaxial to the telescope. The telescope is a 25 cm diameterf/4 Newtonian reflector. The far field of view is 1 mrad thatcorresponds to about 2 cm diameter circle spot at a distanceof 20 m.
The spectral dispersion system is the flat field SpectraPro-2300i by Acton Research. This spectrometer has acrossed Czerny Turner layout, 300 mm focal length, f/4.The spectrometer is equipped with three dispersion grat-ings having 150, 600, and 2400 grooves mm−1. Thegratings provide a nominal dispersion of 21.2, 5.1 and0.9 nm mm−1, respectively. The detector is a gateable512×512 pixel CCD (model PI MAX:512, Princeton Instru-ments/Acton) equipped with an intensifier (Unigen III Gen-eration). The pointing and scan system for the hyperspectralimaging is obtained by a movable folding mirror placed be-tween the telescope and the target. This mirror is mountedin a controllable motorized fork permitting the rotation ontwo orthogonal axes. The primary axis is fixed and coaxialwith the telescope and crosses the geometrical centre of thefolding mirror surface. The secondary axis direction is set bythe rotation of the first one, coplanar with mirror surface andcrossing its geometrical centre. The used stepping motorsgive rotation accuracy better than 0.5 mrad.
Two different field set-ups of the FLIDAR were used totake measurements on vegetation: the first one, adopted dur-ing the April campaign, relied on the use of 4 mirrors posi-tioned at 45◦ at about 1 m above the canopy (Fig. 2b). Wheatfluorescence was excited at 355 nm and detected in the 570–830 nm and 348–610 nm spectral windows. The 4 canopyzones (560 cm2 each) were covered by scanning the motor-ized mirror, placed near the optical sensor that was mountedinside a van. A 10×10 sampling grid (∼100 points per
zone) was adopted and a spectrum was obtained by averaging30 spectra per point.
The second one, adopted during the September CEFLES2campaign, used a scanning mirror positioned on the top ofa 6-m high scaffolding tower (Fig. 2d). This configuration,with the mobile mirror at about 2.7 m above the canopy, per-mitted to cover 1 m2 area of the corn field within small anglesfrom nadir. A reference fluorescent plastic target (Walz, Ef-feltrich, Germany, about 10×10 cm2 of size) was positionedon the top-left corner of the scanned area; its fluorescencesignal was acquired once per each area scan, and used to nor-malize the fluorescence spectra of the scanned area. The vanwith the laser was located at about 10 m from the scaffoldingtower.
In both set-ups, the canopy average temperature was con-tinuously measured and logged by means of a Minolta LandCyclops optical pyrometer mounted either in proximity of thefour 45◦ mirrors (Fig. 2b) or on top of the scaffolding tower(Fig. 2d).
3.2.2 Passive sun-induced fluorescence
Sun-induced fluorescence (FS) was estimated in the fieldwith four different set-ups. Three stationary set-ups exploitfield spectrometers to collect the signal above the canopyduring the day and differ for the spectral resolution achieved.While the first one was manually operated, the second andthird system operated autonomously. In addition to the sta-tionary approaches, a mobile set-up was used to quickly mea-sure the distribution of canopy fluorescence and thus coverthe spatial distribution of the FS signal.
(1) The core of the first set-up was composed by twoHR4000 spectrometers (OceanOptics, USA). One spec-trometer covered the visible to near-infrared part of thespectrum (350–1100 nm) with a resolution of 2.8 nm(Full Width at Half Maximum, FWHM) while a secondspectrometer was limited to a narrower spectral range inthe near-infrared (720–800 nm) to provide a very highspectral resolution (0.13 nm FWHM) intended for flu-orescence retrieval at the O2-A band. The canopy wasobserved from nadir by bare fibres (25◦ field of view).The manual rotation of a mast mounted horizontallyon a tripod permitted to observe either the white ref-erence panel or the canopy. The spectrometric set-upwas installed over winter wheat in April and over cornin September to record canopy diurnal cycle of opticalproperties and sun-induced fluorescence (Fig. 2f refersto the set-up used in the September over corn).
Prior to the field campaign both spectrometers were cal-ibrated with known standards wavelength calibrationand radiance calibration. The spectroscopy techniquereferred to as “single beam” (Milton and Rolling, 2006)was applied in the field to evaluate the incident and up-welling fluxes: target measurements are “sandwiched”
Biogeosciences, 6, 1181–1198, 2009 www.biogeosciences.net/6/1181/2009/
U. Rascher et al.: CEFLES2: remote sensing component to quantify photosynthetic efficiency 1187
between two white reference measurements (calibratedpanel, Optopolymer GmbH, Germany) taken a few sec-onds apart. For every acquisition, 15 and 4 scans (forthe two spectrometers, respectively) were averaged andstored as a single file. Additionally, a dark currentmeasurement was collected for every set of acquisi-tions (four consecutive measurements). Spectrometerswere housed in a Peltier thermally insulated box (modelNT-16, Magapor, Zaragoza, Spain) keeping the inter-nal temperature at 25◦C in order to reduce dark currentdrift.
Processing of raw data included correction for CCD de-tector non linearity, correction for dark current drift,wavelength calibration and linear resampling; radiancecalibration, incident radiance computation by linearinterpolation of two white reference panel measure-ments, and computation of vegetation optical indicesand sun-induced fluorescence according to Meroni andColombo (2006).
(2) A second high performance spectro-radiometer set-up (SpectroFLEX) for detecting passive fluorescencesignal has been installed at Villeneuve-sur-Lot (Lat.44.397571◦, Long.: 0.763944◦) during April 2007, inthe middle of a large and homogeneous field of natu-ral grass (Fig. 2e). The objective was to compare pas-sive fluorescence data acquired with the airborne Air-FLEX sensor with similar data acquired on ground onthe same target. The target was composed mainly ofVelvetgrass (Holcus lanatus), an erectophil monocotspecies of about 60 cm height.
SpectroFLEX is based on a narrow band spectrome-ter (HR2000+, Ocean Optics, USA). The instrumentalfunction of 0.2 nm FWHM was established using theatomic lines of a spectral calibration lamp (Cal-2000-Bulb, Micropack, Germany) also used for wavelengthcalibration. Radiometric calibration has been performedwith a black body lamp (Li-Cor 1800-2, Lincoln, NE,USA). A high pass filter (Schott RG590) prevented forstray light. The spectro-radiometer was enclosed in atemperature regulated box at 25±0.5◦C, allowing ther-mal noise reproducibility. A shutter (Inline TTL shut-ter, Micropack, Germany) allows CCD dark current ac-quisition for each integration time. All the electroniccomponents were protected by a waterproof aluminiumbox. Fluorescence fluxes were simultaneously acquiredin both O2-B band (687 nm) and O2-A band (760 nm),using the same channel widths and positions as the Air-FLEX sensor inboard the Seneca airplane.
Measurements at the canopy level required a nadir view-ing configuration. The instrument box was installedin the top of a 2.5 m scaffolding. A 2 m length opti-cal fibre connects the sensor head to the spectrometer.The entrance of the optical fibre is fixed above the tar-
get by a 1 m horizontal arm at 2.4 m above the ground(Fig. 2e). The resulting target diameter is about 1.1 mwhich ensures a good spatial integration of the canopystructure. Local irradiance was measured using a whitefrosted PVC board which intercepts alternately the fieldof view of the sensor. This reference board was peri-odically moved by an electromagnet. Radiances mea-sured with the reference board were used to estimate thephotosynthetic active radiation after calibration againsta quantum meter (SDEC, France). An elementary mea-surement cycle requires the acquisition of two spectraon the target and two spectra on the reference. The ac-quisition frequency is up to 0.4 Hz at maximum illumi-nation.
(3) A FieldSpec Pro high resolution spectroradiometer (An-alytical Spectral Devices, Boulder, USA) was used,which measures reflected radiation within the spec-tral domain of 350–2500 nm with a nominal bandwidthof 1.4 nm (350–1050 nm) and a field-of-view (FOV)of 25◦. A calibrated Spectralon™ panel (25×25 cm)served as white reference to estimate incident irradi-ance.
The instrument’s fibre optic was mounted on a roboticarm of 0.6 m length, approximately 1 m above thecanopy. The movement of the robotic arm allowedto automatically collecting daily cycles of four differ-ent spots with a circular area of about 0.5 m diametereach (Fig. 2g). The acquired dataset consists of spectralrecords from four canopy areas, bracketed by measure-ments of the reference panel. At each position, a trig-ger signal released the recording of 10 single spectra.Each spectrum was internally averaged by the spectrom-eter from 25 individual measurements. Integration timewas automatically optimized during the day in order tomaximize the instrument signal to noise ratio. In Juneand September five diurnal courses were acquired dur-ing the campaign windows. The fluorescence signal wasquantified using the modified FLD method proposed byMaier et al. (2003) in the O2-A band.
(4) Several FieldSpec Pro high resolution spectroradiome-ters were used for a spatially explicit characterization ofthe fluorescence signal over a wide range of agriculturalcrops and surface classes. During the three campaignsin April, June, and September 11 different crops werecharacterized, whereas one representative field per cropwas selected (exceptionally winter wheat with sevenfields and corn with eight fields). Beside these agricul-tural canopies, water and bare soil were measured. Tocover the spatial heterogeneity of each field, four repre-sentative places were selected and three measurementsper place were performed.
At each place in the field, the instrument’s fibre opticwas mounted on a tripod, approximately 1 m above the
www.biogeosciences.net/6/1181/2009/ Biogeosciences, 6, 1181–1198, 2009
1188 U. Rascher et al.: CEFLES2: remote sensing component to quantify photosynthetic efficiency
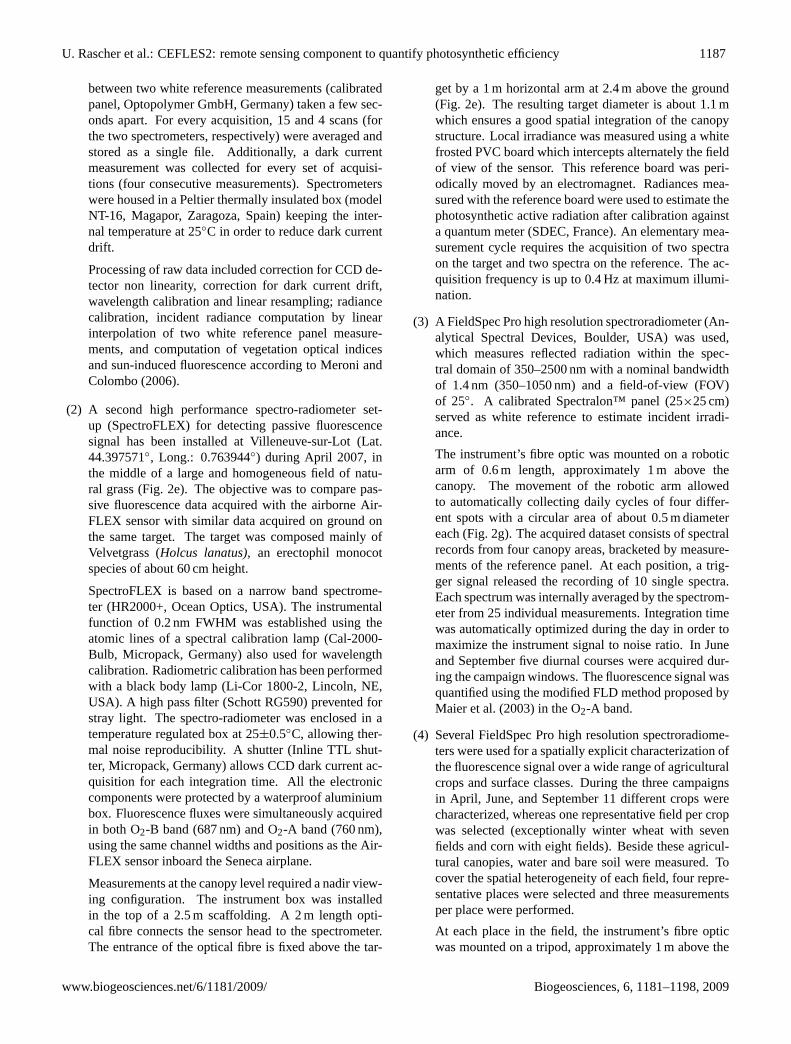
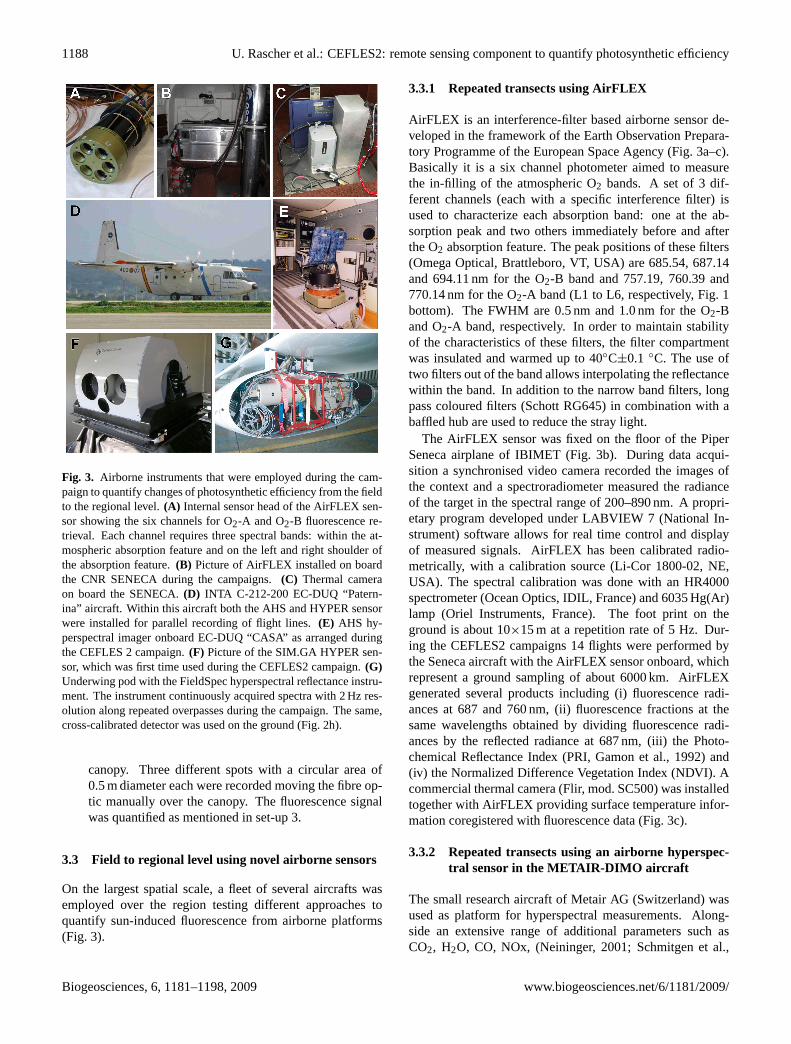
Fig. 3. Airborne instruments that were employed during the cam-paign to quantify changes of photosynthetic efficiency from the fieldto the regional level.(A) Internal sensor head of the AirFLEX sen-sor showing the six channels for O2-A and O2-B fluorescence re-trieval. Each channel requires three spectral bands: within the at-mospheric absorption feature and on the left and right shoulder ofthe absorption feature.(B) Picture of AirFLEX installed on boardthe CNR SENECA during the campaigns.(C) Thermal cameraon board the SENECA.(D) INTA C-212-200 EC-DUQ “Patern-ina” aircraft. Within this aircraft both the AHS and HYPER sensorwere installed for parallel recording of flight lines.(E) AHS hy-perspectral imager onboard EC-DUQ “CASA” as arranged duringthe CEFLES 2 campaign.(F) Picture of the SIM.GA HYPER sen-sor, which was first time used during the CEFLES2 campaign.(G)Underwing pod with the FieldSpec hyperspectral reflectance instru-ment. The instrument continuously acquired spectra with 2 Hz res-olution along repeated overpasses during the campaign. The same,cross-calibrated detector was used on the ground (Fig. 2h).
canopy. Three different spots with a circular area of0.5 m diameter each were recorded moving the fibre op-tic manually over the canopy. The fluorescence signalwas quantified as mentioned in set-up 3.
3.3 Field to regional level using novel airborne sensors
On the largest spatial scale, a fleet of several aircrafts wasemployed over the region testing different approaches toquantify sun-induced fluorescence from airborne platforms(Fig. 3).
3.3.1 Repeated transects using AirFLEX
AirFLEX is an interference-filter based airborne sensor de-veloped in the framework of the Earth Observation Prepara-tory Programme of the European Space Agency (Fig. 3a–c).Basically it is a six channel photometer aimed to measurethe in-filling of the atmospheric O2 bands. A set of 3 dif-ferent channels (each with a specific interference filter) isused to characterize each absorption band: one at the ab-sorption peak and two others immediately before and afterthe O2 absorption feature. The peak positions of these filters(Omega Optical, Brattleboro, VT, USA) are 685.54, 687.14and 694.11 nm for the O2-B band and 757.19, 760.39 and770.14 nm for the O2-A band (L1 to L6, respectively, Fig. 1bottom). The FWHM are 0.5 nm and 1.0 nm for the O2-Band O2-A band, respectively. In order to maintain stabilityof the characteristics of these filters, the filter compartmentwas insulated and warmed up to 40◦C±0.1 ◦C. The use oftwo filters out of the band allows interpolating the reflectancewithin the band. In addition to the narrow band filters, longpass coloured filters (Schott RG645) in combination with abaffled hub are used to reduce the stray light.
The AirFLEX sensor was fixed on the floor of the PiperSeneca airplane of IBIMET (Fig. 3b). During data acqui-sition a synchronised video camera recorded the images ofthe context and a spectroradiometer measured the radianceof the target in the spectral range of 200–890 nm. A propri-etary program developed under LABVIEW 7 (National In-strument) software allows for real time control and displayof measured signals. AirFLEX has been calibrated radio-metrically, with a calibration source (Li-Cor 1800-02, NE,USA). The spectral calibration was done with an HR4000spectrometer (Ocean Optics, IDIL, France) and 6035 Hg(Ar)lamp (Oriel Instruments, France). The foot print on theground is about 10×15 m at a repetition rate of 5 Hz. Dur-ing the CEFLES2 campaigns 14 flights were performed bythe Seneca aircraft with the AirFLEX sensor onboard, whichrepresent a ground sampling of about 6000 km. AirFLEXgenerated several products including (i) fluorescence radi-ances at 687 and 760 nm, (ii) fluorescence fractions at thesame wavelengths obtained by dividing fluorescence radi-ances by the reflected radiance at 687 nm, (iii) the Photo-chemical Reflectance Index (PRI, Gamon et al., 1992) and(iv) the Normalized Difference Vegetation Index (NDVI). Acommercial thermal camera (Flir, mod. SC500) was installedtogether with AirFLEX providing surface temperature infor-mation coregistered with fluorescence data (Fig. 3c).
3.3.2 Repeated transects using an airborne hyperspec-tral sensor in the METAIR-DIMO aircraft
The small research aircraft of Metair AG (Switzerland) wasused as platform for hyperspectral measurements. Along-side an extensive range of additional parameters such asCO2, H2O, CO, NOx, (Neininger, 2001; Schmitgen et al.,
Biogeosciences, 6, 1181–1198, 2009 www.biogeosciences.net/6/1181/2009/
U. Rascher et al.: CEFLES2: remote sensing component to quantify photosynthetic efficiency 1189
2004) were captured simultaneously. The flight track andattitude angles were recorded by a TANS Vector phase sen-sitive GPS system blended with 3-axis accelerometers. Forthe collection of hyperspectral reflectance data, a portablesensor (FieldSpec Pro, ASD Inc., Boulder, CO, USA) wasmounted in the lefthand underwing pod (Fig. 3g). Reflectedlight was captured in nadir orientation with a fibre optic thatwas equipped with a 1◦ foreoptic. Incident light was spec-trally analyzed in the range from 350 to 1050 nm, with aFWHM of 1.4 nm. The instrument was operated in contin-uous mode and spectra were collected with approximately2 Hz. Spectral measurements were recorded using radiancesand exposure time was adjusted to 130 ms for best signal tonoise ratio and to avoid saturation. In order to improve dataquality, three spectra were averaged and saved. The Field-Spec device generates a TTL trigger signal that was used (i)to record the time of each hyperspectral measurement and(ii) to capture a video image (640×480 pixels, 12-bit, greyvalues) using an industrial video camera (Flea, Point GreyResearch, Vancouver, BC, Canada; with a 25 mm lens, Cos-micar/Pentax). Both camera and hyperspectral sensor sharethe same viewing orientation, but differ in their field of view(1◦ for the FieldSpec device and 10.5◦ for the video camera).
Data from the FieldSpec hyperspectral instrument are cur-rently being processed according to the principle of Fraun-hofer Line Discrimination. The same protocol for groundbased and airborne data is used to test for the influence of at-mospheric absorption and to establish a consistent data pro-cessing line from the canopy to the ecosystem level.
3.3.3 Regional mapping with the Airborne Hyperspec-tral Scanner (AHS)
The Airborne Hyperspectral Scanner (AHS) is an 80-bandsairborne imaging radiometer (Fig. 3e), developed and builtby SensyTech Inc., (currently Argon ST, and formerlyDaedalus Ent. Inc.) and operated by the Spanish Institutefor Aerospace Technology (INTA) in different remote sens-ing projects. It has 63 bands in the reflective part of the elec-tromagnetic spectrum, 7 bands in the 3 to 5µm range and10 bands in the 8 to 13µm region.
The AHS was first flown by INTA on September 2003.During 2004 the instrument was validated during a numberof flight campaigns which included extensive ground sur-veys (SPARC-2004 and others), and is operational in INTA’sC-212-200 EC-DUQ “Paternina” aircraft since beginning of2005 (Fig. 3d). AHS has been configured with distinct spec-tral performances depending on the spectral region consid-ered. In the VIS/NIR range, bands are relatively broad (28–30 nm): the coverage is continuous from 0.43 up to 1.0µm.In the SWIR range, there is an isolated band centred at1.6µm with 90 nm width, simulate corresponding band insatellite missions.
Next, there is a set of continuous, fairly narrow bands (18–19 nm) between 1.9 and 2.5µm, which are well suited for
soil/geologic studies. In the MWIR and LWIR regions, spec-tral resolution is about 300 to 500 nm, and the infrared atmo-spheric windows (from 3 to 5µm and from 8 to 13µm) arefully covered. These spectral features allow to state that AHSis best suited for multipurpose studies/campaigns, in which awide range of spectral regions including thermal have to becovered simultaneously.
3.3.4 First regional map of fluorescence derived fromHYPER airborne imager
SIM.GA HYPER is a 512+256-spectral-band push-broomsensor with VNIR and SWIR imaging capability. The instru-ment was provided by Galileo Avionica. The airborne hyper-spectral system covers the 400–2450 nm spectral region andwas operated at 1000 m. The hyperspectral HYPER SIM.GAis composed of two optical heads (Fig. 3f):
(1) VNIR Spectrometer with a spectral range of 400–1000 nm, 512 spectral bands with 1.2 nm spectral sam-pling, 1024 spatial pixels across a swath of 722 m,which corresponds to a pixel resolution of 0.7×0.7 m
(2) SWIR Spectrometer with a spectral range of 1000–2450 nm, 256 spectral bands with 5.8 nm spectral sam-pling, 320 spatial pixels across a swath of 425 m, whichcorresponds to a pixel resolution of 1.33×1.33 m
The optical heads are managed by a common data acquisi-tion and control electronics. The HYPER SIM.GA worksas a push-broom imager. A spatial line is acquired at nadirand the image is made exploiting the aircraft movement.The optical head of HYPER SIM.GA is rigidly coupled toa GPS/INS unit that collects data about platform movements(yaw, roll, pitch, velocity, altitude, lat, long) allowing to geo-rectify the images acquired.
These campaigns were the first employment of this newairborne hyperspectral instrument and we are currently es-tablishing the processing routines for geometrical and radio-metrical processing of the data. With this communicationwe present the first results; automated routines allowing theprocessing of the extensive data sets are currently developed.
4 Selected first results highlighting the dynamics ofvariations in photosynthetic energy conversion
4.1 Leaf-level: quantifying photosynthesis and fluores-cence
4.1.1 Diurnal variations of photosynthetic efficiency
During the September campaign main focus was put on char-acterizing corn in the diurnal course. Leaf-level measure-ments showed a physiological limitation of photosynthesisduring different times of the day. Photosynthetic efficiency
www.biogeosciences.net/6/1181/2009/ Biogeosciences, 6, 1181–1198, 2009
1190 U. Rascher et al.: CEFLES2: remote sensing component to quantify photosynthetic efficiency
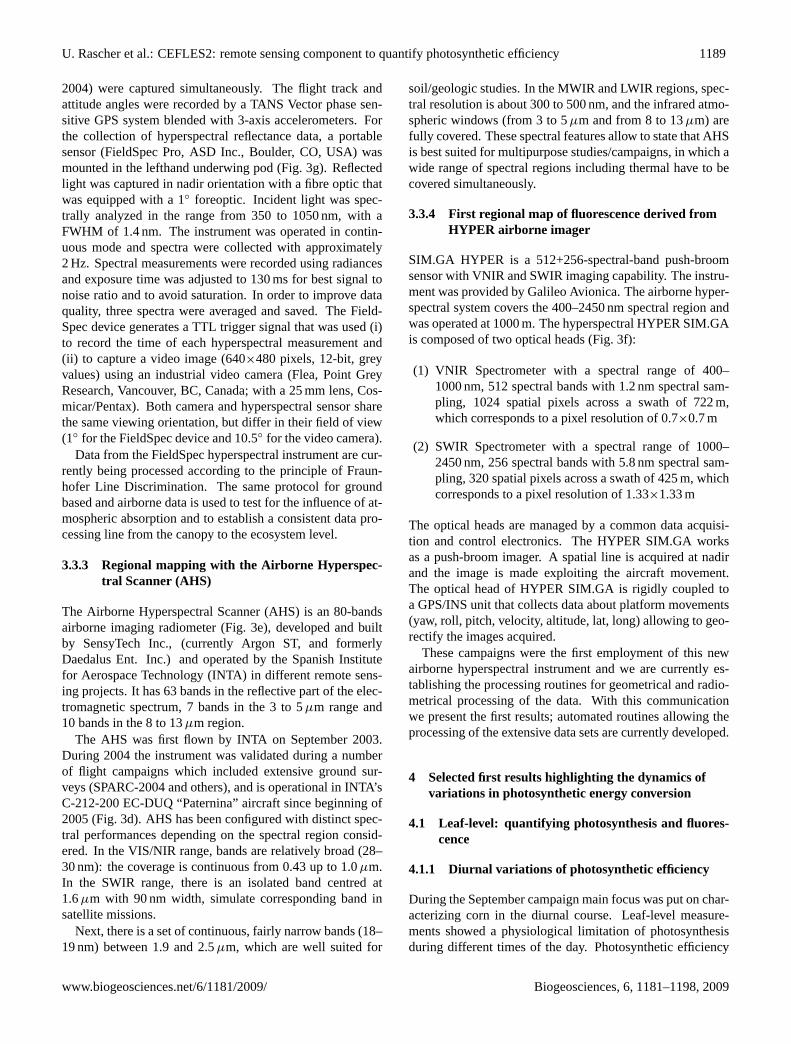
Fig. 4. Variability of sun-induced fluorescence emission spectra af-ter light adaptation (1700µmol photons m−2 s−1). Adaxial sides ofleaves from four species were measured with the special instrumentdescribed in Sect. 3.1.3. Chlorophyll content (µg cm−2): corn 48,bean 42.2, velvetgrass 27.1, wheat 41.9.
was high during morning hours, a clear depression of pho-tosynthetic efficiency was obvious during afternoon, whenconditions were dry and hot, and photosynthetic efficiencyincreased again towards the evening, when conditions againbecame moderate. Diurnal courses of sun-induced fluores-cence yield of corn were derived from spectrometric mea-surements and their potential as proxies for LUE was inves-tigated. GPP was modeled using Monteith‘s LUE-concept(Monteith, 1972, 1977) and GPP and LUE values were com-pared to synoptically acquired eddy covariance data. Thediurnal response of complex physiological regulation of pho-tosynthesis could be tracked from sun-induced fluorescence.Considering structural and physiological effects, this studyshowed that including sun-induced fluorescence improvesmodeling of diurnal courses of GPP. For details see Dammet al. (2009).
4.1.2 Activation of photosynthesis within days
During the April campaign special focus was put on win-ter wheat that was a main crop in the study area. Weatherconditions at the beginning of the campaign were wet andcloudy and photosynthesis of the plants was adapted to thelow light and moderate conditions. Midday 18 April, 2007weather changed and the whole region was abruptly exposedto longer lasting high pressure conditions with concomitantclear skies and warm and dry air.
This poses good conditions for a test case: photosynthesisof the formerly low-light adapted plants had to acclimate tothe high light conditions. This was a specific advantage totest if these dynamic physiological changes were reflected insun-induced fluorescence.
PAM fluorometry was used to analyze changes in pho-tosynthetic activity and condition of photosynthetic appara-tus of winter wheat plants. Among other parameters, ETRof photosystem II and steady-state fluorescence were deter-mined. Plants increased their ETR in the course of acclima-tion to the high light period. The increase was strongest inthe morning. However, acclimation was associated with in-creasing leaf temperatures. At the beginning of the improvedweather conditions, non-photochemical protection was low-est around midday, but increased with the days in high lightconditions. Concomitantly a slight decrease in potentialquantum efficiency of photosynthesis was observed. Thiscould be the sign of photoinhibition or of activation of sus-tained photoprotection mechanisms, due to high light inten-sities over the days. In contrast, steady-state fluorescenceshowed an inverse behaviour. The relation of fluorescencewith non-photochemical protection revealed a clear negativecorrelation, whereas fluorescence and ETR apparently werenot correlated. This suggests that fluorescence indeed is as-sociated with properties describing the physiological statusof photosynthesis and thus, may serve as a remote sensingmeasure to quantify changes of the efficiency of photosyn-thesis that occur on the relevant time scales. A detailed studyof this topic will be published soon.
4.1.3 Characterization of sun-induced fluorescenceemission spectrum at the leaf level
The shape of the fluorescence emission spectrum at the leaflevel depends on many different parameters, such as the ex-citation wavelength, light intensity, pigment concentration orleaf structure. Figure 4 compares sun-induced fluorescenceemission spectra of leaves from different species under thesame conditions of illumination (about 1700µmol m−2 s−1).It can be seen that leaves with the same chlorophyll contentcan show different emission spectra (Fig. 4; e.g. wheat andbean).
4.2 Canopy-level
Ground-based diurnal cycles of sun- and laser-inducedcanopy fluorescence were collected with the aim of charac-terizing the temporal dynamic of fluorescence in addition tothe spatial variation captured by airborne sensors (Sect. 4.3).
4.2.1 Variations of sun-induced canopy fluorescence
Diurnal cycles of canopy sun-induced fluorescence were col-lected during both the April and September campaigns overnatural grassland (Velvetgrass), winter wheat and corn, re-spectively.
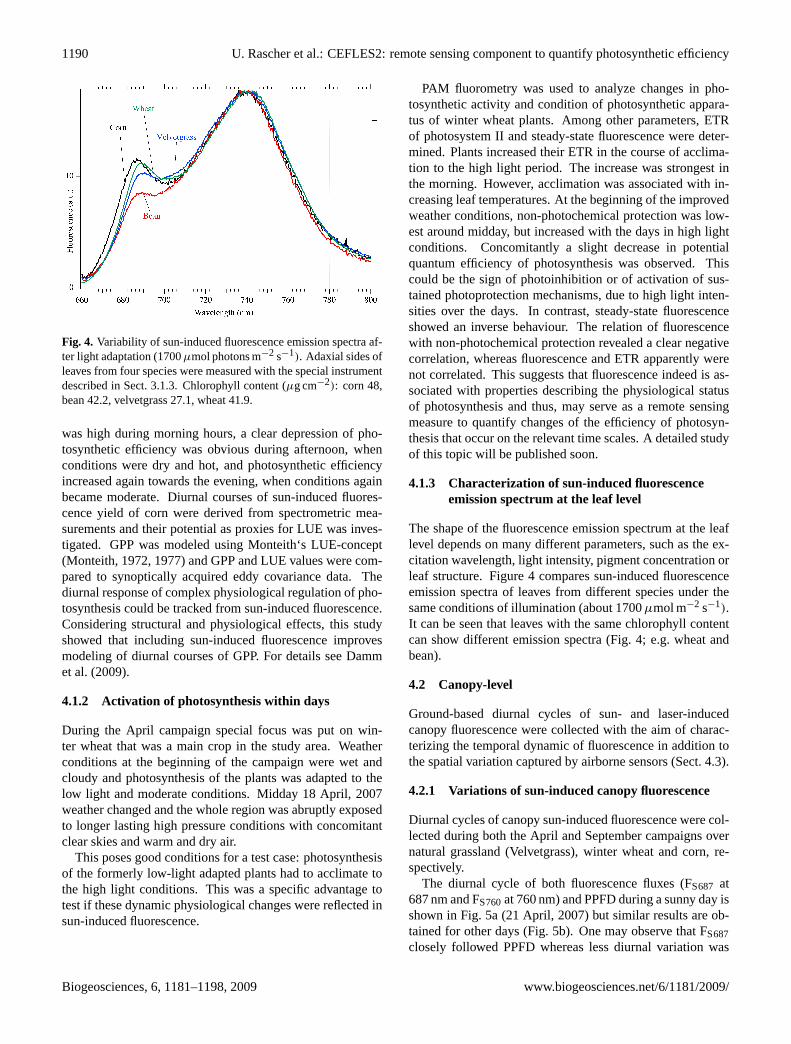
The diurnal cycle of both fluorescence fluxes (FS687 at687 nm and FS760at 760 nm) and PPFD during a sunny day isshown in Fig. 5a (21 April, 2007) but similar results are ob-tained for other days (Fig. 5b). One may observe that FS687closely followed PPFD whereas less diurnal variation was
Biogeosciences, 6, 1181–1198, 2009 www.biogeosciences.net/6/1181/2009/
U. Rascher et al.: CEFLES2: remote sensing component to quantify photosynthetic efficiency 1191
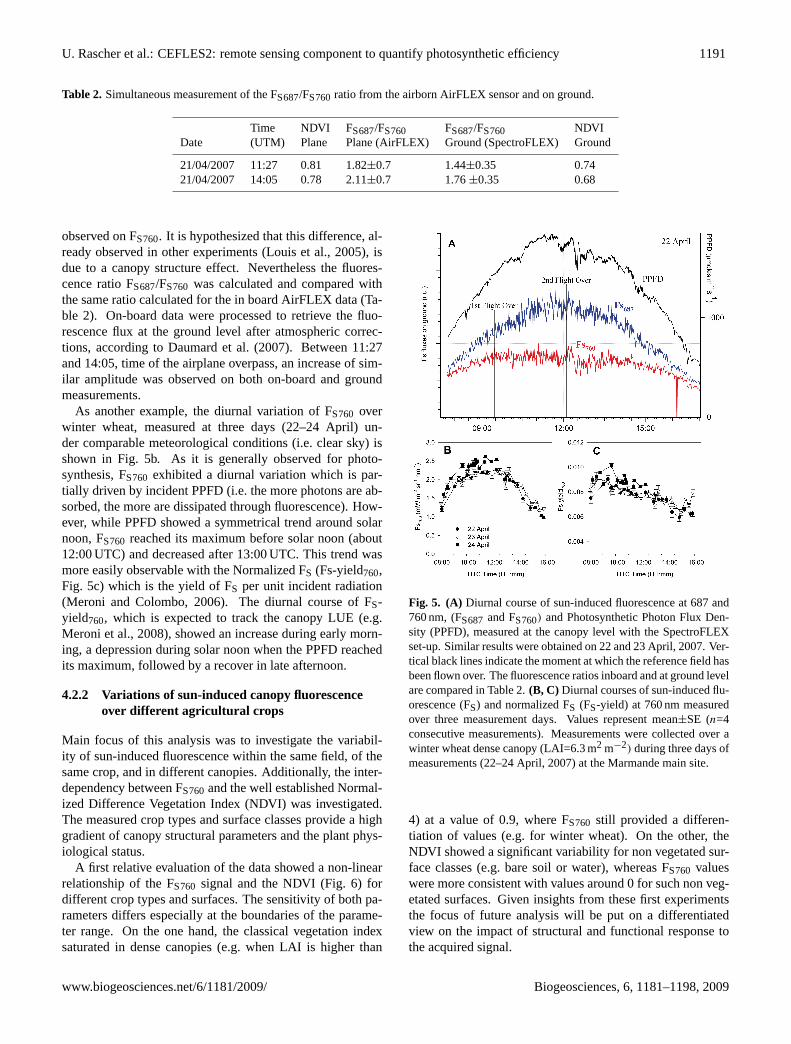
Table 2. Simultaneous measurement of the FS687/FS760ratio from the airborn AirFLEX sensor and on ground.
Time NDVI FS687/FS760 FS687/FS760 NDVIDate (UTM) Plane Plane (AirFLEX) Ground (SpectroFLEX) Ground
21/04/2007 11:27 0.81 1.82±0.7 1.44±0.35 0.7421/04/2007 14:05 0.78 2.11±0.7 1.76±0.35 0.68
observed on FS760. It is hypothesized that this difference, al-ready observed in other experiments (Louis et al., 2005), isdue to a canopy structure effect. Nevertheless the fluores-cence ratio FS687/FS760 was calculated and compared withthe same ratio calculated for the in board AirFLEX data (Ta-ble 2). On-board data were processed to retrieve the fluo-rescence flux at the ground level after atmospheric correc-tions, according to Daumard et al. (2007). Between 11:27and 14:05, time of the airplane overpass, an increase of sim-ilar amplitude was observed on both on-board and groundmeasurements.
As another example, the diurnal variation of FS760 overwinter wheat, measured at three days (22–24 April) un-der comparable meteorological conditions (i.e. clear sky) isshown in Fig. 5b. As it is generally observed for photo-synthesis, FS760 exhibited a diurnal variation which is par-tially driven by incident PPFD (i.e. the more photons are ab-sorbed, the more are dissipated through fluorescence). How-ever, while PPFD showed a symmetrical trend around solarnoon, FS760 reached its maximum before solar noon (about12:00 UTC) and decreased after 13:00 UTC. This trend wasmore easily observable with the Normalized FS (Fs-yield760,Fig. 5c) which is the yield of FS per unit incident radiation(Meroni and Colombo, 2006). The diurnal course of FS-yield760, which is expected to track the canopy LUE (e.g.Meroni et al., 2008), showed an increase during early morn-ing, a depression during solar noon when the PPFD reachedits maximum, followed by a recover in late afternoon.
4.2.2 Variations of sun-induced canopy fluorescenceover different agricultural crops
Main focus of this analysis was to investigate the variabil-ity of sun-induced fluorescence within the same field, of thesame crop, and in different canopies. Additionally, the inter-dependency between FS760and the well established Normal-ized Difference Vegetation Index (NDVI) was investigated.The measured crop types and surface classes provide a highgradient of canopy structural parameters and the plant phys-iological status.
A first relative evaluation of the data showed a non-linearrelationship of the FS760 signal and the NDVI (Fig. 6) fordifferent crop types and surfaces. The sensitivity of both pa-rameters differs especially at the boundaries of the parame-ter range. On the one hand, the classical vegetation indexsaturated in dense canopies (e.g. when LAI is higher than
Fig. 5. (A) Diurnal course of sun-induced fluorescence at 687 and760 nm, (FS687 and FS760) and Photosynthetic Photon Flux Den-sity (PPFD), measured at the canopy level with the SpectroFLEXset-up. Similar results were obtained on 22 and 23 April, 2007. Ver-tical black lines indicate the moment at which the reference field hasbeen flown over. The fluorescence ratios inboard and at ground levelare compared in Table 2.(B, C) Diurnal courses of sun-induced flu-orescence (FS) and normalized FS (FS-yield) at 760 nm measuredover three measurement days. Values represent mean±SE (n=4consecutive measurements). Measurements were collected over awinter wheat dense canopy (LAI=6.3 m2 m−2) during three days ofmeasurements (22–24 April, 2007) at the Marmande main site.
4) at a value of 0.9, where FS760 still provided a differen-tiation of values (e.g. for winter wheat). On the other, theNDVI showed a significant variability for non vegetated sur-face classes (e.g. bare soil or water), whereas FS760 valueswere more consistent with values around 0 for such non veg-etated surfaces. Given insights from these first experimentsthe focus of future analysis will be put on a differentiatedview on the impact of structural and functional response tothe acquired signal.
www.biogeosciences.net/6/1181/2009/ Biogeosciences, 6, 1181–1198, 2009
1192 U. Rascher et al.: CEFLES2: remote sensing component to quantify photosynthetic efficiency
Fig. 6. Sun-induced fluorescence (FS760) and NDVI over different11 agricultural crops and two additional surface classes. For eachcanopy type, average and standard deviation of 12 single measure-ments were calculated (winter wheatn=84, cornn=96).
4.2.3 Active laser induced fluorescence mapping
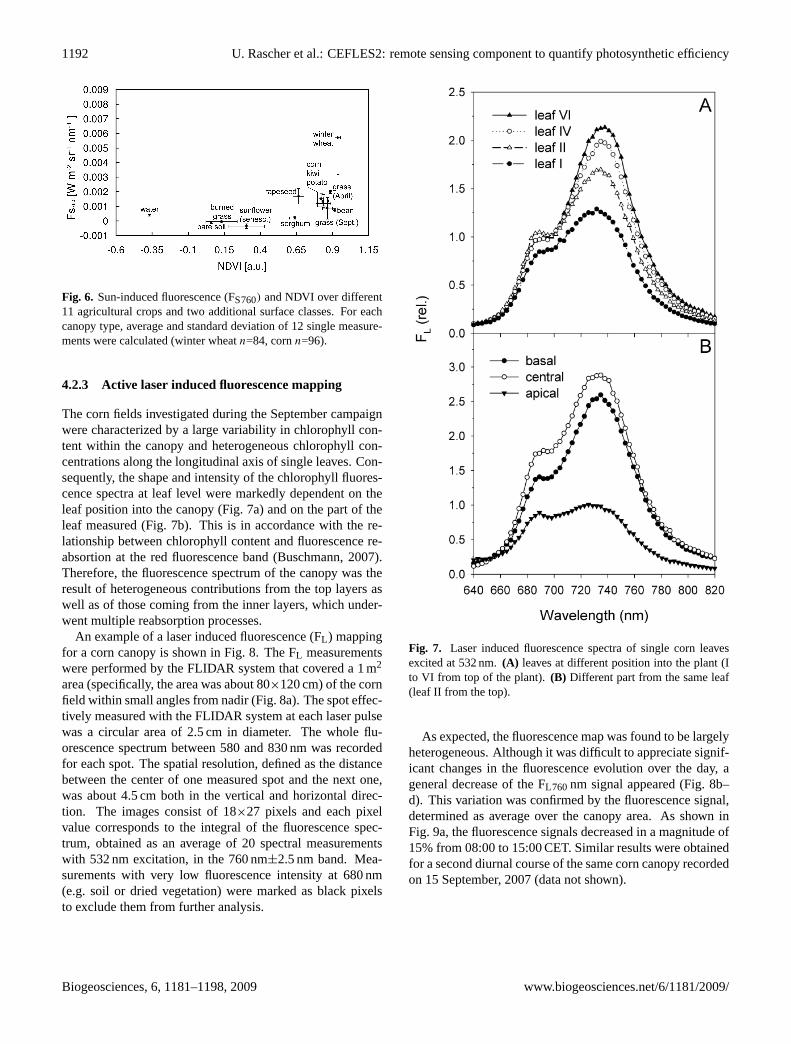
The corn fields investigated during the September campaignwere characterized by a large variability in chlorophyll con-tent within the canopy and heterogeneous chlorophyll con-centrations along the longitudinal axis of single leaves. Con-sequently, the shape and intensity of the chlorophyll fluores-cence spectra at leaf level were markedly dependent on theleaf position into the canopy (Fig. 7a) and on the part of theleaf measured (Fig. 7b). This is in accordance with the re-lationship between chlorophyll content and fluorescence re-absortion at the red fluorescence band (Buschmann, 2007).Therefore, the fluorescence spectrum of the canopy was theresult of heterogeneous contributions from the top layers aswell as of those coming from the inner layers, which under-went multiple reabsorption processes.
An example of a laser induced fluorescence (FL) mappingfor a corn canopy is shown in Fig. 8. The FL measurementswere performed by the FLIDAR system that covered a 1 m2
area (specifically, the area was about 80×120 cm) of the cornfield within small angles from nadir (Fig. 8a). The spot effec-tively measured with the FLIDAR system at each laser pulsewas a circular area of 2.5 cm in diameter. The whole flu-orescence spectrum between 580 and 830 nm was recordedfor each spot. The spatial resolution, defined as the distancebetween the center of one measured spot and the next one,was about 4.5 cm both in the vertical and horizontal direc-tion. The images consist of 18×27 pixels and each pixelvalue corresponds to the integral of the fluorescence spec-trum, obtained as an average of 20 spectral measurementswith 532 nm excitation, in the 760 nm±2.5 nm band. Mea-surements with very low fluorescence intensity at 680 nm(e.g. soil or dried vegetation) were marked as black pixelsto exclude them from further analysis.
Fig. 7. Laser induced fluorescence spectra of single corn leavesexcited at 532 nm.(A) leaves at different position into the plant (Ito VI from top of the plant).(B) Different part from the same leaf(leaf II from the top).
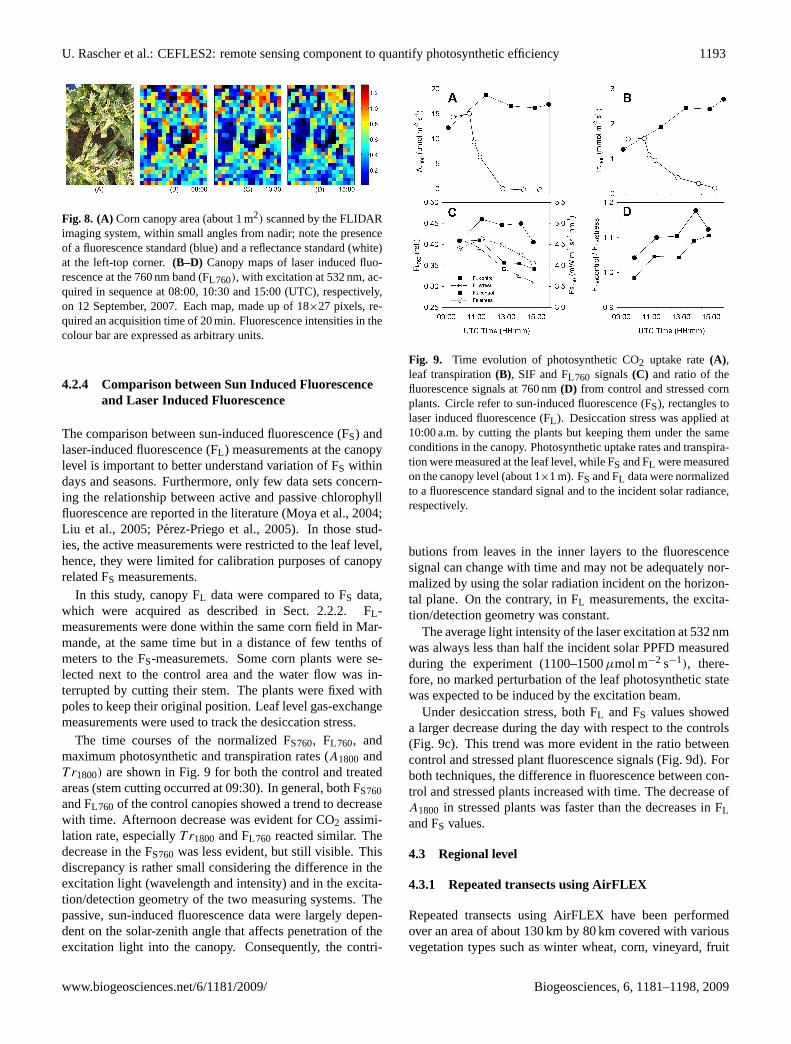
As expected, the fluorescence map was found to be largelyheterogeneous. Although it was difficult to appreciate signif-icant changes in the fluorescence evolution over the day, ageneral decrease of the FL760nm signal appeared (Fig. 8b–d). This variation was confirmed by the fluorescence signal,determined as average over the canopy area. As shown inFig. 9a, the fluorescence signals decreased in a magnitude of15% from 08:00 to 15:00 CET. Similar results were obtainedfor a second diurnal course of the same corn canopy recordedon 15 September, 2007 (data not shown).
Biogeosciences, 6, 1181–1198, 2009 www.biogeosciences.net/6/1181/2009/
U. Rascher et al.: CEFLES2: remote sensing component to quantify photosynthetic efficiency 1193
Fig. 8. (A) Corn canopy area (about 1 m2) scanned by the FLIDARimaging system, within small angles from nadir; note the presenceof a fluorescence standard (blue) and a reflectance standard (white)at the left-top corner.(B–D) Canopy maps of laser induced fluo-rescence at the 760 nm band (FL760), with excitation at 532 nm, ac-quired in sequence at 08:00, 10:30 and 15:00 (UTC), respectively,on 12 September, 2007. Each map, made up of 18×27 pixels, re-quired an acquisition time of 20 min. Fluorescence intensities in thecolour bar are expressed as arbitrary units.
4.2.4 Comparison between Sun Induced Fluorescenceand Laser Induced Fluorescence
The comparison between sun-induced fluorescence (FS) andlaser-induced fluorescence (FL) measurements at the canopylevel is important to better understand variation of FS withindays and seasons. Furthermore, only few data sets concern-ing the relationship between active and passive chlorophyllfluorescence are reported in the literature (Moya et al., 2004;Liu et al., 2005; Perez-Priego et al., 2005). In those stud-ies, the active measurements were restricted to the leaf level,hence, they were limited for calibration purposes of canopyrelated FS measurements.
In this study, canopy FL data were compared to FS data,which were acquired as described in Sect. 2.2.2. FL-measurements were done within the same corn field in Mar-mande, at the same time but in a distance of few tenths ofmeters to the FS-measuremets. Some corn plants were se-lected next to the control area and the water flow was in-terrupted by cutting their stem. The plants were fixed withpoles to keep their original position. Leaf level gas-exchangemeasurements were used to track the desiccation stress.
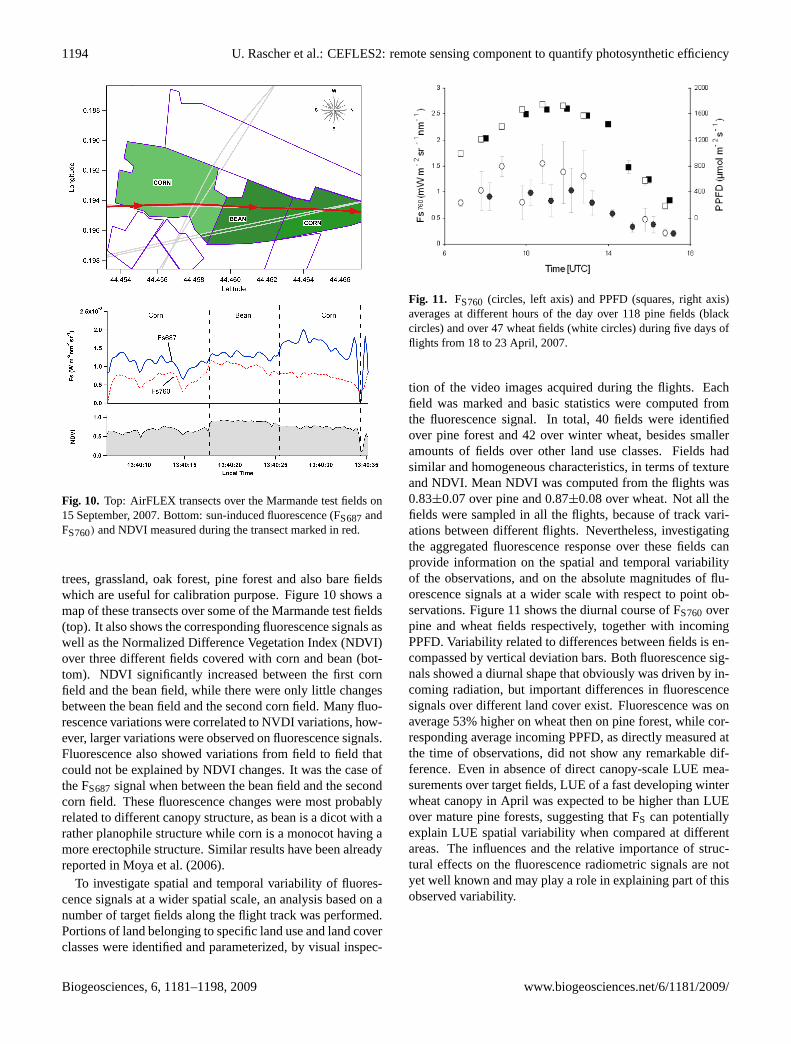
The time courses of the normalized FS760, FL760, andmaximum photosynthetic and transpiration rates (A1800 andT r1800) are shown in Fig. 9 for both the control and treatedareas (stem cutting occurred at 09:30). In general, both FS760and FL760 of the control canopies showed a trend to decreasewith time. Afternoon decrease was evident for CO2 assimi-lation rate, especiallyT r1800 and FL760 reacted similar. Thedecrease in the FS760was less evident, but still visible. Thisdiscrepancy is rather small considering the difference in theexcitation light (wavelength and intensity) and in the excita-tion/detection geometry of the two measuring systems. Thepassive, sun-induced fluorescence data were largely depen-dent on the solar-zenith angle that affects penetration of theexcitation light into the canopy. Consequently, the contri-
Fig. 9. Time evolution of photosynthetic CO2 uptake rate(A),leaf transpiration(B), SIF and FL760 signals(C) and ratio of thefluorescence signals at 760 nm(D) from control and stressed cornplants. Circle refer to sun-induced fluorescence (FS), rectangles tolaser induced fluorescence (FL ). Desiccation stress was applied at10:00 a.m. by cutting the plants but keeping them under the sameconditions in the canopy. Photosynthetic uptake rates and transpira-tion were measured at the leaf level, while FS and FL were measuredon the canopy level (about 1×1 m). FS and FL data were normalizedto a fluorescence standard signal and to the incident solar radiance,respectively.
butions from leaves in the inner layers to the fluorescencesignal can change with time and may not be adequately nor-malized by using the solar radiation incident on the horizon-tal plane. On the contrary, in FL measurements, the excita-tion/detection geometry was constant.
The average light intensity of the laser excitation at 532 nmwas always less than half the incident solar PPFD measuredduring the experiment (1100–1500µmol m−2 s−1), there-fore, no marked perturbation of the leaf photosynthetic statewas expected to be induced by the excitation beam.
Under desiccation stress, both FL and FS values showeda larger decrease during the day with respect to the controls(Fig. 9c). This trend was more evident in the ratio betweencontrol and stressed plant fluorescence signals (Fig. 9d). Forboth techniques, the difference in fluorescence between con-trol and stressed plants increased with time. The decrease ofA1800 in stressed plants was faster than the decreases in FLand FS values.
4.3 Regional level
4.3.1 Repeated transects using AirFLEX
Repeated transects using AirFLEX have been performedover an area of about 130 km by 80 km covered with variousvegetation types such as winter wheat, corn, vineyard, fruit
www.biogeosciences.net/6/1181/2009/ Biogeosciences, 6, 1181–1198, 2009
1194 U. Rascher et al.: CEFLES2: remote sensing component to quantify photosynthetic efficiency
Fig. 10. Top: AirFLEX transects over the Marmande test fields on15 September, 2007. Bottom: sun-induced fluorescence (FS687andFS760) and NDVI measured during the transect marked in red.
trees, grassland, oak forest, pine forest and also bare fieldswhich are useful for calibration purpose. Figure 10 shows amap of these transects over some of the Marmande test fields(top). It also shows the corresponding fluorescence signals aswell as the Normalized Difference Vegetation Index (NDVI)over three different fields covered with corn and bean (bot-tom). NDVI significantly increased between the first cornfield and the bean field, while there were only little changesbetween the bean field and the second corn field. Many fluo-rescence variations were correlated to NVDI variations, how-ever, larger variations were observed on fluorescence signals.Fluorescence also showed variations from field to field thatcould not be explained by NDVI changes. It was the case ofthe FS687signal when between the bean field and the secondcorn field. These fluorescence changes were most probablyrelated to different canopy structure, as bean is a dicot with arather planophile structure while corn is a monocot having amore erectophile structure. Similar results have been alreadyreported in Moya et al. (2006).
To investigate spatial and temporal variability of fluores-cence signals at a wider spatial scale, an analysis based on anumber of target fields along the flight track was performed.Portions of land belonging to specific land use and land coverclasses were identified and parameterized, by visual inspec-
Fig. 11. FS760 (circles, left axis) and PPFD (squares, right axis)averages at different hours of the day over 118 pine fields (blackcircles) and over 47 wheat fields (white circles) during five days offlights from 18 to 23 April, 2007.
tion of the video images acquired during the flights. Eachfield was marked and basic statistics were computed fromthe fluorescence signal. In total, 40 fields were identifiedover pine forest and 42 over winter wheat, besides smalleramounts of fields over other land use classes. Fields hadsimilar and homogeneous characteristics, in terms of textureand NDVI. Mean NDVI was computed from the flights was0.83±0.07 over pine and 0.87±0.08 over wheat. Not all thefields were sampled in all the flights, because of track vari-ations between different flights. Nevertheless, investigatingthe aggregated fluorescence response over these fields canprovide information on the spatial and temporal variabilityof the observations, and on the absolute magnitudes of flu-orescence signals at a wider scale with respect to point ob-servations. Figure 11 shows the diurnal course of FS760overpine and wheat fields respectively, together with incomingPPFD. Variability related to differences between fields is en-compassed by vertical deviation bars. Both fluorescence sig-nals showed a diurnal shape that obviously was driven by in-coming radiation, but important differences in fluorescencesignals over different land cover exist. Fluorescence was onaverage 53% higher on wheat then on pine forest, while cor-responding average incoming PPFD, as directly measured atthe time of observations, did not show any remarkable dif-ference. Even in absence of direct canopy-scale LUE mea-surements over target fields, LUE of a fast developing winterwheat canopy in April was expected to be higher than LUEover mature pine forests, suggesting that FS can potentiallyexplain LUE spatial variability when compared at differentareas. The influences and the relative importance of struc-tural effects on the fluorescence radiometric signals are notyet well known and may play a role in explaining part of thisobserved variability.
Biogeosciences, 6, 1181–1198, 2009 www.biogeosciences.net/6/1181/2009/
U. Rascher et al.: CEFLES2: remote sensing component to quantify photosynthetic efficiency 1195
4.3.2 First regional map of fluorescence derived fromHYPER airborne imager
The spatial analysis of the fluorescence signal by means ofimaging spectroscopy data is complex. The signal recordedby airborne line scanners with a relatively large field-of-viewvaries strongly across the track, i.e. perpendicular to the flightdirection, due to a variety of disturbing effects (e.g. Kennedyet al., 1997; Schiefer et al., 2006). With regard to the deriva-tion of the fluorescence signal the following effects have tobe considered. (1) Data from push-broom sensors like HY-PER are influenced by shifts in the position and width ofspectral bands. This view-angle dependency is known as“smile effect”. (2) The influence of atmospheric scatteringon the spectral signal varies with path length between sensorand Earth surface and increases towards larger view-angles.This effect is largest at short wavelengths in the VIS but alsoaffects the NIR region where fluorescence is derived. (3)Anisotropic surface reflectance that are a function of the frac-tions of sunlit and shaded surfaces are driven by the directionof incoming solar irradiance and position of the sensor (Pintyet al., 2002). All these effects require special attention whenthe raw data is transferred into surface reflectance and a nor-malization of such effects has to be included into radiometriccalibration and atmospheric correction. Moreover, knowl-edge on the directionality of the fluorescence signal as emit-ted by canopies is still very limited and possible influencescannot be estimated at the moment.
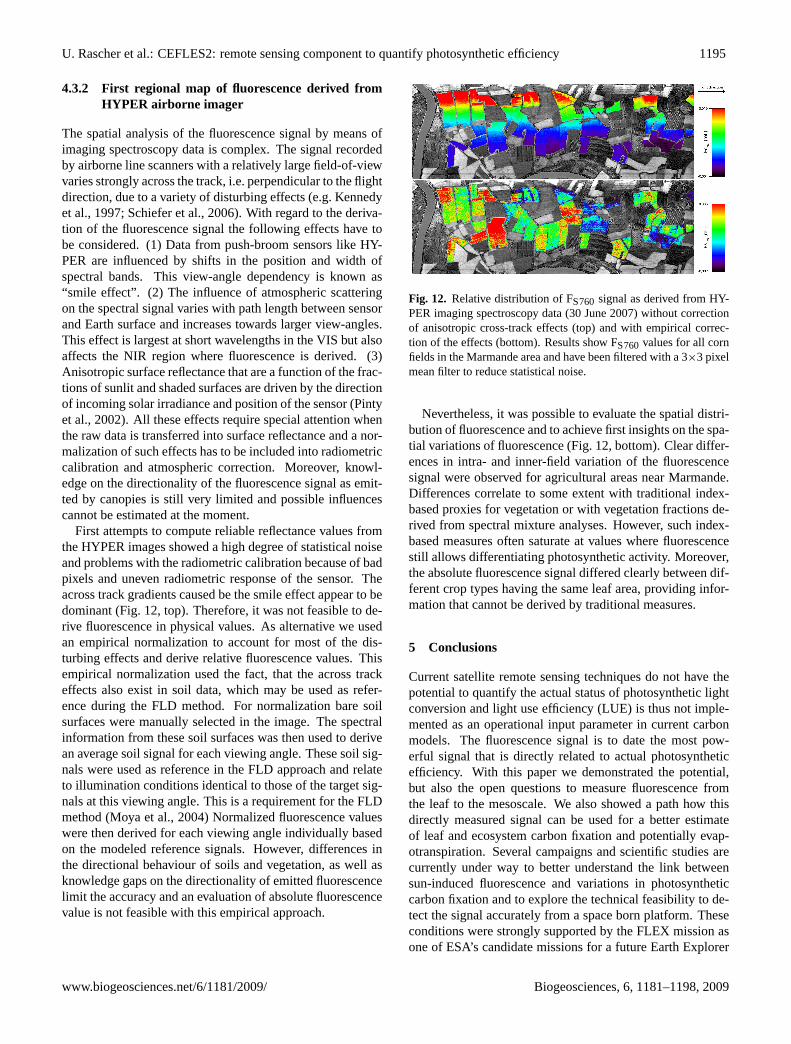
First attempts to compute reliable reflectance values fromthe HYPER images showed a high degree of statistical noiseand problems with the radiometric calibration because of badpixels and uneven radiometric response of the sensor. Theacross track gradients caused be the smile effect appear to bedominant (Fig. 12, top). Therefore, it was not feasible to de-rive fluorescence in physical values. As alternative we usedan empirical normalization to account for most of the dis-turbing effects and derive relative fluorescence values. Thisempirical normalization used the fact, that the across trackeffects also exist in soil data, which may be used as refer-ence during the FLD method. For normalization bare soilsurfaces were manually selected in the image. The spectralinformation from these soil surfaces was then used to derivean average soil signal for each viewing angle. These soil sig-nals were used as reference in the FLD approach and relateto illumination conditions identical to those of the target sig-nals at this viewing angle. This is a requirement for the FLDmethod (Moya et al., 2004) Normalized fluorescence valueswere then derived for each viewing angle individually basedon the modeled reference signals. However, differences inthe directional behaviour of soils and vegetation, as well asknowledge gaps on the directionality of emitted fluorescencelimit the accuracy and an evaluation of absolute fluorescencevalue is not feasible with this empirical approach.
Fig. 12. Relative distribution of FS760signal as derived from HY-PER imaging spectroscopy data (30 June 2007) without correctionof anisotropic cross-track effects (top) and with empirical correc-tion of the effects (bottom). Results show FS760values for all cornfields in the Marmande area and have been filtered with a 3×3 pixelmean filter to reduce statistical noise.
Nevertheless, it was possible to evaluate the spatial distri-bution of fluorescence and to achieve first insights on the spa-tial variations of fluorescence (Fig. 12, bottom). Clear differ-ences in intra- and inner-field variation of the fluorescencesignal were observed for agricultural areas near Marmande.Differences correlate to some extent with traditional index-based proxies for vegetation or with vegetation fractions de-rived from spectral mixture analyses. However, such index-based measures often saturate at values where fluorescencestill allows differentiating photosynthetic activity. Moreover,the absolute fluorescence signal differed clearly between dif-ferent crop types having the same leaf area, providing infor-mation that cannot be derived by traditional measures.
5 Conclusions
Current satellite remote sensing techniques do not have thepotential to quantify the actual status of photosynthetic lightconversion and light use efficiency (LUE) is thus not imple-mented as an operational input parameter in current carbonmodels. The fluorescence signal is to date the most pow-erful signal that is directly related to actual photosyntheticefficiency. With this paper we demonstrated the potential,but also the open questions to measure fluorescence fromthe leaf to the mesoscale. We also showed a path how thisdirectly measured signal can be used for a better estimateof leaf and ecosystem carbon fixation and potentially evap-otranspiration. Several campaigns and scientific studies arecurrently under way to better understand the link betweensun-induced fluorescence and variations in photosyntheticcarbon fixation and to explore the technical feasibility to de-tect the signal accurately from a space born platform. Theseconditions were strongly supported by the FLEX mission asone of ESA’s candidate missions for a future Earth Explorer
www.biogeosciences.net/6/1181/2009/ Biogeosciences, 6, 1181–1198, 2009
1196 U. Rascher et al.: CEFLES2: remote sensing component to quantify photosynthetic efficiency
(Rascher, 2007). Fluorescence definitely shows potential as adirect measure of actual photosynthesis, nevertheless, we donot underestimate the challenges especially that of scaling upleaf-level methods to the canopy level. The plant canopy is acomplex three-dimensional structure that changes due to en-vironmental factors and structural adaptations of the plants.
Appendix A
Abbreviations:
New terminology for fluorescence
FL laser-induced fluorescence (rel.)FL687 laser-induced fluorescence at 687 nm (rel.)FL760 laser-induced fluorescence at 760 nm (rel.)FL687/ FL760 ratio between laser-induced fluorescence at
687 nm and 760 nmFS sun-induced fluorescence (rel.)FS687 sun-induced fluorescence at 687 nm
(W m−2 sr−1 nm−1)
FS760 sun-induced fluorescence at 760 nm(W m−2 sr−1 nm−1)
FS687/FS760 ratio between the peaks of sun-inducedfluorescence at 687 nm and 760 nm
FS-yield sun-induced fluorescence yieldFS-yield687 sun-induced fluorescence yield at 687 nmFS-yield760 sun-induced fluorescence yield at 760 nm
Other abbreviations
A photosynthetic CO2 uptake rate(µmol CO2 m−2 s−1)
A1800 photosynthetic CO2 uptake rate at saturating (i.e.1800µmol m−2 s−1) PPFD (µmol CO2 m−2 s−1)
ETR photosynthetic electron transport rate(µmol electrons m−2 s−1)
ETRmax maximum photosynthetic electron transport rateat light saturation (µmol electrons m−2 s−1)
fcover fraction of vegetation coverFLD Fraunhofer line discriminationGPP gross primary productionLAI leaf area index (m2 of leaf/m2 of ground)LUE light use efficiencyNPQ non-photochemical quenching (rel.)PPFD photosynthetic photon flux density
(λ=400–700 nm) (µmol photons m−2 s−1)
T r transpiration rate (mmol H2O m−2 s−1)
T r1800 transpiration rate at saturating (i.e. 1800µmol m−2 s−1) PPFD (mmol H2O m−2 s−1)
1F/Fm’ effective quantum efficiency of PS II(1F=Fm’-F) measured at ambient light
Acknowledgements.This work has been made possible by thefunding support of the ESA-projects (1) Technical Assistancefor Airborne/Ground Measurements in support of Sentinel-2mission during CEFLES2 Campaign (ESRIN/Contract No.20801/07/I-LG) (2) Technical Assistance for Airborne/GroundMeasurements in support of FLEX mission proposal duringCEFLES2 Campaign (ESRIN/Contract No. 20802/07/I-LG) (3)FLEX Performance analysis and requirements consolidation study(ESTEC/Contract No. 21264/07/NL/FF). Additional financial andintellectual support was provided by the SFB/TR 32 “Patterns inSoil-Vegetation-Atmosphere Systems: Monitoring, Modelling,and Data Assimilation” – project D2, funded by the DeutscheForschungsgemeinschaft (DFG).
Edited by: H. Dolman
References
Alonso, L., Gomez-Chova, L., Vila-Frances, J., Amoros-Lopez, J.,Guanter, L., Calpe, J., and Moreno, J.: Improved FraunhoferLine Discrimination method for vegetation fluorescence quan-tification., IEEE Geosci. Remote Sens., 5, 620–624, 2008.
Bilger, W., Schreiber, U., and Bock, M.: Determination of thequantum efficiency of photosystem II and of non-photochemicalquenching of chlorophyll fluorescence in the field, Oecologia,102, 425–432, 1995.
Buschmann, C.: Variability and application of the chlorophyll flu-orescence emission ratio red/far-red of leaves, Photosynth. Res.,92, 261–271, 2007.
Corp, L. A., Middleton, E. M., McMurtrey, J. E., Entcheva Camp-bell, P. K., and Butcher, L. M.: Fluorescence sensing techniquesfor vegetation assessment, Appl. Optics, 45, 1023–1033, 2006.
Damm, A., Elbers, J., Erler, A., Gioli, B., Hamdi, K., Hutjes,R., Kosvancova, M., Meroni, M., Miglietta, F., Moersch, A.,Moreno, J., Schickling, A., Sonnenschein, R., Udelhoven, T., vander Linden, S., van der Tol, C., Hostert, P., and Rascher, U.: Re-mote sensing of sun induced fluorescence to improve modellingof diurnal courses of gross primary productivity (GPP), Glob.Change Biol., doi:10.1111/j.1365-2486.2009.01908.x, 2009.
Daumard, F., Goulas, Y., Ounis, A., Pedros, R., and Moya, I.: At-mospheric correction of airborne passive measurements of flu-orescence, in: ISPMSRS07, Davos, Switzerland, 12–14 March2007, P58, online available at:http://www.commission7.isprs.org/ispmsrs07/P58Daumardfluorescence.pdf, 2007.
Evain, S., Camenen, L., and Moya, I.: Three channels detectorfor remote sensing of chlorophyll fluorescence and reflectancefrom vegetation, 8th international symposium: Physical mea-surements and signatures in remote sensing, Aussois, France,395–400, 2001.
Field, C. B., Randerson, J. T., and Malmstrom, C. M.: Global NetPrimary Production – Combining ecology and remote sensing,Remote Sens. Environ., 51, 74–88, 1995.
Flexas, J., Briantais, J.-M., Cerovic, Z. G., Medrano, H., andMoya, I.: Steady-state and maximum chlorophyll fluorescenceresponses to water stress in grapevine leaves: A new remote sens-ing system, Remote Sens. Environ., 73, 283–297, 2000.
Flexas, J., Escalona, J. M., Evain, S., Gulias, J., Moya, I., Osmond,C. B., and Medrano, H.: Steady-state chlorophyll fluorescence(FS) measurements as a tool to follow variations of net CO2 as-
Biogeosciences, 6, 1181–1198, 2009 www.biogeosciences.net/6/1181/2009/
U. Rascher et al.: CEFLES2: remote sensing component to quantify photosynthetic efficiency 1197
similation and stomatal conductance during water-stress in C3plants, Physiol. Plantarum, 114, 231–240, 2002.
Gamon, J. A., J. Penuelas, J., and Field, C. B.: A narrow-wavebandspectral index that tracks diurnal changes in photosynthetic effi-ciency, Remote Sens. Environ., 41, 35–44, 1992.
Goetz, S. J. and Prince, S. D.: Modelling terrestrial carbon ex-change and storage: Evidence and implications of functionalconvergence in light-use efficiency, Adv. Ecol. Res., 28, 57–92,1999.
Gomez-Chova, L., Alonso, L., Amoros-Lopez, J., Vila-Frances, J.,del Valle-Tascon, S., Calpe, J., and Moreno, J.: Solar induced flu-orescence measurements using a field spectroradiometer, EarthObservation For Vegetation Monitoring And Water Management,AIP Conference Proceedings, 274–281, 2006.
Hilker, T., Coops, N. C., Wulder, M. A., Black, A. T., and Guy, R.D.: The use of remote sensing in light use efficiency based mod-els of gross primary production: A review of currant status andfuture requirements, Sci. Total Environ., 404, 411–423, 2008.
Kennedy, R. E., Cohen, W. B., and Takao, G.: Empirical methodsto compensate for a view-angle-dependent brightness gradient inAVIRIS imagery, Remote Sens. Environ., 62, 277–291, 1997.
Liu, L., Zhang, Y., Wang, J., and Zhao, C.: Detecting solar-inducedchlorophyll fluorescence from field radiance spectra based on theFraunhofer Line Principle, IEEE T. Geosci. Remote Sens., 43,827–832, 2005.
Louis, J., Ounis, A., Ducruet, J.-M., Evain, S., Laurila, T., Thum,T., Aurela, M., Wingsle, G., Alonso, L., Pedros, R., and Moya,I.: Remote sensing of sunlight-induced chlorophyll fluorescenceand reflectance of Scots pine in the boreal forest during springrecovery, Remote Sens. Environ., 96, 37–48, 2005.
Maier, S., Gunther, K. P., and Stellmes, M.: Sun-Induced Fluores-cence: A new Tool for Precision Farming, in: Digital Imagingand Spectral Techniques: Applications to Precision Agricultureand Crop Physiology, edited by: VanToai, R., Major, D., McDon-ald, M., Schepers, J., and Tarpley, L., ASA Special Publications,Madison, Wisconsin, USA, 209–222, 2003.
Meroni, M. and Colombo, R.: Leaf level detection of solar inducedchlorophyll fluorescence by means of a subnanometer resolutionspectroradiometer, Remote Sens. Environ., 103, 438–448, 2006.
Meroni, M., Picchi, V., Rossini, M., Cogliati, S., Panigada, C., Nali,C., Lorenzini, G., and Colombo, R.: Leaf level early assessmentof ozone injuries by passive fluorescence and PRI, Int. J. RemoteSens., 29, 5409–5422, 2008.
Meroni, M., Rossini, M., Guanter, L., Alonso, L., Rascher, U.,Colombo, R., and Moreno, J.: Remote sensing of solar inducedchlorophyll fluorescence: review of methods and applications,Remote Sens. Environ., doi:10.1016/j.rse.2009.05.003, in press,2009.
Middleton, E. M., Corp, L. A., and Entcheva Campbell, P. K.: Com-parison of measurements and FluorMOD simulations for solar-induced chlorophyll fluorescence and reflectance of a corn cropunder nitrogen treatments, Int. J. Remote Sens., 29, 5193–5213,2008.
Milton, E. J. and Rolling, E. M.: Estimating the irradiance spec-trum from measurements in a limited number of spectral bands,Remote Sens. Environ., 100, 348–355, 2006.
Monteith, J. L.: Solar-radiation and productivity in tropical ecosys-tems, J. Appl. Ecol., 9, 747–766, 1972.
Monteith, J. L.: Climate and efficiency of crop production in
Britain, Philos. T. Roy. Soc. B, 281, 277–294, 1977.Moya, I., Camenen, L., Latouche, G., Mauxion, C., Evain, S., and
Cerovic, Z. G.: An instrument for the measurement of sunlightexcited plant fluorescence, in: Photosynthesis: Mechanisms andEffects, edited by: Garab, G., Kluwer Academic Publishers, Dor-drecht, The Netherlands, 4265–4270, 1999.
Moya, I., Camenen, L., Evain, S., Goulas, Y., Cerovic, Z. G., La-touche, G., Flexas, J., and Ounis, A.: A new instrument forpassive remote sensing. - 1. Measurements of sunlight-inducedchlorophyll fluorescence, Remote Sens. Environ., 91, 186–197,2004.
Moya, I., Daumard, F., Moise, N., Ounis, A., and Goulas, Y.: Firstairborne multiwavelength passive chlorophyll fluorescence mea-surements over La Mancha (Spain) fields, in: 2nd InternationalSymposium on Recent Advances in Quantitative Remote Sens-ing (RAQRS II), Torent, Spain, 25–29 September 2006, 820–825, online available at:http://www.uv.es/raqrs/index.pdf, 2006.
Neininger, B.: A small aircraft for more than just ozone: Metair’s“Dimona” after ten years of evolving development, Proceedingsof the 11th Symposium on Meteorological Observations and In-strumentation, 81st AMS Annual Meeting, Albuquerque, NM,USA, 14–19 January 2001, 2001.
Papageorgiou, G. C. and Govindjee: Chlorophyll a Fluorescence:A Signature of Photosynthesis, Advances in Photosynthesis andRespiration, 19, Kluwer Academic Publications, Dordrecht, TheNetherlands, 2004.
Perez-Priego, O., Zarco-Tejada, P. J., Miller, J. R., Sepulcre-Canto,G., and Fereres, E.: Detection of Water Stress in Orchard Treeswith a High-Resolution Spectrometer through Chlorophyll Flu-orescence in-filling of the O2-A band, IEEE T. Geosci. RemoteSens., 43, 2759–2769, 2005.
Pinty, B., Widlowski, J.-L., Gobron, N., Verstraete, M. M., andDiner, D. J.: Uniqueness of multiangular measurements — Part I:An indicator of subpixel surface heterogeneity from MISR, IEEET. Geosci. Remote Sens., 40, 1560–1573, 2002.
Plascyk, J. A.: MK II Fraunhofer Line Dicsriminator (FLD-II) forairborne and orbital remote-sensing of solar-stimulated lumines-cence, Opt. Eng., 14, 339–346, 1975.
Rascher, U., Liebig, M., and Luttge, U.: Evaluation of instant light-response curves of chlorophyll-fluorescence parameters obtainedwith a portable chlorophyll fluorometer on site in the field, Plant,Cell Environ., 23, 1397–1405, 2000.
Rascher, U. and Nedbal, L.: Dynamics of plant photosynthesisunder fluctuating natural conditions, Curr. Opin. Plant Biol., 9,671–678, 2006.
Rascher, U.: FLEX – FLuorescence EXplorer: a remote sensing ap-proach to quantify spatio-temporal variations of photosyntheticefficiency from space, Photosynth. Res., 91, 293–294, 2007.
Running, S. W., Thornton, P. E., Nemani, R., and Glassey, J.M.: Global terrestrial gross and net primary productivity fromthe earth observing system, in: Methods in Ecosystem Science,edited by: Sala, O. E., Jackson, R. B., Mooney, H. A., andHowarth, R. W., Springer Verlag, New York, 44–57, 2000.
Schiefer, S., Hostert, P., and Damm, A.: Correcting brightness gra-dients in hyperspectral data from urban areas, Remote Sens. En-viron., 101, 25–37, 2006.
Schmitgen, S., Geiß, H., Ciais, P., Neininger, B., Brunet, Y., Re-ichstein, M., Kley, D., and Volz-Thomas, A.: Carbon dioxideuptake of a forested region in southwest France derived from air-
www.biogeosciences.net/6/1181/2009/ Biogeosciences, 6, 1181–1198, 2009

1198 U. Rascher et al.: CEFLES2: remote sensing component to quantify photosynthetic efficiency
borne CO2 and CO measurements in a quasi-Lagrangian experi-ment, J. Geophys. Res.-Atmos., 109(D14), D14302, D14302.1–D14302.15, 2004.
Schulze, E. D. and Caldwell, M. M.: Ecophysiology of photosyn-thesis, Ecological Studies, Springer, Berlin, Heidelberg, Ger-many, 1994.
Schurr, U., Walter, A., and Rascher, U.: Functional dynamics ofplant growth and photosynthesis – from steady-state to dynamics– from homogeneity to heterogeneity, Plant Cell Environ., 29,340–352, 2006.
Turner, D. P., Ritts, W. D., Cohen, W. B., Gower, S. T., Zhao, M.S., Running, S. W., Wofsy, S. C., Urbanski, S., Dunn, A. L., andMunger, J. W.: Scaling Gross Primary Production (GPP) over bo-real and deciduous forest landscapes in support of MODIS GPPproduct validation, Remote Sens. Environ., 88, 256–270, 2003a.
Turner, D. P., Urbanski, S., Bremer, D., Wofsy, S. C., Meyers, T.,Gower, S. T., and Gregory, M.: A cross-biome comparison ofdaily light use efficiency for gross primary production, Glob.Change Biol., 9, 383–395, 2003b.
Biogeosciences, 6, 1181–1198, 2009 www.biogeosciences.net/6/1181/2009/
Top Related
Copyright © 2022 FDOKUMEN

