


Bahasa
Halaman
Hukum

1
*Dr. Hidayat Ullah Khan
Can Women Involvement in Community-based Development (CBD) Help Improve Targeting the Poor? A Case of Women-Focused and Women-Managed Non-Governmental
Organization (NGO) of North-Western Pakistan
Dr. Hidayat Ullah Khan* and Dr. Takashi Kurosaki+
This paper investigates outreaching poor, i.e. targeting performance of the Community-based Development (CBD) approach involving by a women-focused and women-managed Non-Governmental Organization (NGO) in North-Western Pakistan. The approach is expected to improve targeting performance by reducing mis-targeting, elite capture, and program placement costs. However, the existing literature lacks comprehensive and innovative ways to assess the targeting performance involving women. The paper attempts to garner a better understanding of targeting performance. The study employs rich village- and household-level survey data of an NGO operating in northwestern Pakistan. The NGO is managed mostly by women and its interventions are conducted through female Community Organizations (COs), which is rather unusual for a male-dominated society like Pakistan. To assess the targeting performance, the paper compares villages with and without COs, member and non-member households, in terms of poverty and vulnerability. The study shows the NGO, with proactive involvement of women, has been able to successfully target poorer and environmentally vulnerable villages as well as households.
Keywords: Targeting Performance, Community-based Development (CBD), Household- and Village-level Analysis, Non-Governmental Organization (NGO), Pakistan.
([email protected]) is a faculty member at the Department of Economics, Kohat
University of Science & Technology, Kohat, Pakistan. Prof. Dr. Takashi Kurosaki is professor, the Institute of
Economic Research, Hitotsubashi University, 2-1 Naka, Kunitachi, Tokyo 186-8603, Japan. Phone: +81-42-580-
8363; Fax: +81-42-580-8333; E-mail: [email protected]. The authors are grateful to the discussants and
participants of the 5th South Asian International Conference (SAICON-2013) on “Management, Innovation,
Leadership, Economics and Strategy for their valuable comments.
2
1 Introduction
The approach of community-based development (CBD) is expected to improve targeting and
reduce program costs of poverty reduction policies, besides other positive contributions (Mansuri and
Rao, 2004) 1. Furthermore, the use of local knowledge is expected to bear greater relevance in a situation
where credible monetary data for potential use in targeting activities are not available. According to
Alatas et al. (2012), in developing countries—where the majority of potential target group is employed
in the informal sector—the availability of verifiable income records is always an issue. Therefore, it is
difficult to identify target group by employing conventional targeting techniques such as means tests.
For these reasons, identification through the CBD approach is expected to improve targeting.
However, the absence of institutional support and/or homogeneity within a community may
diminish the usefulness of local information. In the absence of local governance institutions, it is
difficult to ensure accountability in the course of implementing CBD initiatives in decentralized settings.
For instance, according to Conning and Kevane (2002), within-community heterogeneity may result in a
variety of perceptions vis-à-vis poverty, and this may adversely impact targeting performance. The
situation becomes worse when the perceptions of donors (i.e., governments, NGOs, multilateral donors,
and philanthropists) with regard to poverty differ from those of the local community. These conditions
may create an environment conducive to elite capture.
In addition, even when the CBD approach is able to target poorer villages, it may fail in reaching out to the poor households within each village (Mansuri and Rao, 2004), which can be termed as “poor
1 The CBD approach is also expected to contribute to the decentralization of power; the creation of high-quality, low-cost public goods; and empowerment. These, however, are not the focus of this paper.
targeting or mistargeting". For instance, the study of Galasso and Ravallion (2001)—whose motivation
3
closely resembles that of this paper—investigates the targeting performance of the “Food-for-Education
(FFE) Program” in Bangladesh. The targeting mechanism adopted for the program comprises two
stages: selection of the participating communities by the central government and the identification of
eligible households by the communities concerned. By employing both household and community-level
data, Galasso and Ravallion (2001) show that the larger a program is, the lower the levels of land
inequality and remoteness therein are, the lower the number of shocks is, and also the lower private
redistribution of transfers is, the more within-village targeting improves. Furthermore, the
decision-making ability of the community potentially has a strong influence on the program outcomes,
and the results show that the center’s program placement did not take into account village attributes that
may potentially help in reaching out to the poor.
Given these findings within the literature, this paper attempts to garner a better understanding of
targeting performance for the case of Pakistan.2 First, we employ village and household-level data that
contains an array of geographic, socioeconomic, demographic, and vulnerability-related measures, to
analyze targeting performance. The list of variables therein is more comprehensive than any adopted in
the existing literature. Second, some of the parameters—like networking with the local elite and
environmental vulnerability—are used here for the first time, to analyze the targeting performance of
CBD interventions. In assessing the performance of targeting, we define “good” targeting as the success
of an implementing NGO in placing its programs in poor villages (in terms of lower adult literacy, poor
2 There is not much quantitative evidence regarding the CBD approach in Pakistan using a microeconometric approach. Notable exceptions include Khwaja (2004), Kurosaki (2005), Khwaja (2009), and Kurosaki and Khan (2012).
4
access to basics amenities, higher level of susceptibility to the natural disasters, etc.) and reaching out to
the poor households (poorer access to basic civic services and environmental vulnerability). This is
because the aim of the NGO is to improve the livelihood of poor and vulnerable households.
The rest of this paper is organized in the following manner. Section 2 describes the study area
while Section 3 elaborates the data used in the empirical analysis. Section 4 proposes the empirical
strategy, followed by Section 5 that shows quantitative results. Section 6 concludes the chapter.
2 Study Area and the NGO
Pakistan is an underdeveloped country in terms of both economic and human development. As per
the United Nations Development Programme (UNDP, 2013), Pakistan is ranked the 146th of 185
countries on Human Development Index. Moreover, the country has very low mean years of schooling,
i.e. 4.9 years and per-capita gross national income, i.e. USD 2,566 (in purchasing power parity dollars
of 2005). Meanwhile, over 60% of the Pakistan’s population dwells in rural areas. The rural population
of the country has generally poor access to basic amenities and high vulnerable to various shocks.
Given the prevailing high level of rural poverty and poor access to basic amenities, the rule of
government agencies, and/or NGOs in outreaching the rural population in general and those with poor
access to basic amenities and high vulnerability to the shocks is very important.
Given the public sector’s failure to deliver basic public services to the nation—and especially to
the rural poor—NGOs have been actively intervening and providing such services. Several of them
5
have adopted CBD approaches since the 1990s. To analyze the targeting performance of such NGOs and
success or failure to outreach the rural poor, in 2010, we began a study on an NGO called the Pakistani
Hoslamand Khawateen Network (PHKN), which has its headquarters in District Haripur of Khyber
Pakhtunkhwa (KPK).
PHKN intervenes in areas of microfinance, HRD training, micro infrastructure projects, and the
like. In providing these services, PHKN adopts a CBD approach, under which dwellers of a village or
rural community are outreached and organized into community-based organizations. In the case of
PHKN, such organizations are called “Community Organisations” (COs). The formation of a CO paves
the way for future interventions in a village. Owing to socio-cultural norms, PHKN has separate COs
for males and females. On average, the COs have 16–40 members. PHKN is a woman-led and a
women-focused NGO. Its current president is a woman, the entire Board of Directors is women, almost
three-quarters of the COs are managed by women, and most of its activities are focused on women. This
characteristic distinguishes PHKN from other NGOs in the region. Such NGOs are rare in the context of
the male-dominated society of Pakistan (Khan, 2013).
3 Data
During September–December 2010, we implemented a benchmark survey comprising three tiers;
the three tiers are villages, COs, and households. Khan et al. (2011) describe the survey in detail. In this
paper, we employ village- and household- level data.
6
areas of PHKN. We gathered 105 observations of villages, of which 99 are located in District Haripur.
COs of PHKN existed in 40 out of 105, all in District Haripur. We call them CO villages. The rest, 65
villages, are called non-CO villages below.
Table 1 lists variables taken from the village survey and analyzed in this paper. The variables
include village population, the occupation-based distribution of the populations of the villages, the
literacy rate3, connectivity with canal-irrigation system, access to amenities, health and education
institutions, local-governance (dispute settlement forums – DSFs) institutions, and susceptibility to
shocks including damages due to the July-August 2010 floods.
In the household data, three types of households were randomly chosen: (i) those who have been
members of PHKN activities (henceforth referred to as T-Group households), (ii) nonmember
households (henceforth called as C1-Group households) living in CO villages, and (iii) households
living in non-CO villages (henceforth labeled as C2-Group households). The total size of the sample is
583, divided into 249 T-Group households, 234 C1-Group households, and 100 C2-Group households. The sample represents predominantly rural households living in Haripur District that are potential
targets of PHKN.
Table 3 lists variables taken from the household survey and analyzed in this paper. The variables
include demographic characteristics, education, housing conditions, access to amenities, asset holding,
susceptibility to shocks, and social status of the sample households and their networking with the local
elite (native and social status, and relationship with local elite). The statistics suggest household-level
3 Both the occupational distribution of population and the literacy rate figures are consistent with that at the national level.
7
The village survey was designed as a census survey to cover all villages that were (potential) target disparity in
education between male and female members, which is a reflection of male domination in the study area. The housing
conditions and asset holding reveal that a considerably large proportion of the sample households is poor. We consider
housing conditions and land ownership exogenous to PHKN’s outreach, while livestock ownership and access to amenities
as endogenous to PHKN.
4 Empirical Strategy
To assess the targeting performance of the CBD approach, we test the two following hypotheses.
First, we test H1: whether CO villages are systematically poorer and more vulnerable than non-CO
villages. As a statistical test, we employ the null hypothesis: observable characteristics of CO villages
and non-CO villages are the same. Second, we test H2: whether CO members (T-group) are
systematically poorer and more vulnerable than nonmembers (C1-group) in CO villages. As a statistical
test, we employ the null hypothesis: observable characteristics of T-group and C1-group households in
CO villages are the same.
If, in the course of testing H1, we find that CO villages are poorer than non-CO villages, say the
CO villages have lower adult literacy, access to basic amenities, and higher susceptibility to the natural
disasters, etc., we will conclude that the PHKN targets poorer villages. This finding would reflect the
net effect of two mechanisms: that the PHKN endogenously approaches poorer villages, and that poorer
villages select themselves in approaching the PHKN. Similarly, while testing H2, if we find that member
8
access to the amenities and higher vulnerability to natural disasters than the nonmember, etc., we will
infer that the former are poorer than the latter. This would reflect the self-selection of households, as we
analyze H2 only using households in CO villages.
To focus on targeting—rather than on impact—throughout this paper, we will analyze the
predetermined and exogenous factors that reflect the targeting performance of the PHKN.4 We conduct
both bivariate and multivariate regression analyses to obtain robust results. The reason we conduct
regression analyses is that many of variables are correlated so that partial correlation controlling for
other variables may be more meaningful. The multiple regression exactly controls for other variables.
Hypothesis H1 is tested both using village-level characteristics and household-level characteristics.
This is an inter-village targeting analysis. We compare i. villages with COs (“CO villages”) and villages
without COs (“non-CO villages”) and ii. households belonging to CO villages and non-CO villages.
Considering PHKN’s community mobilization process5, we test H1 by altering the definitions of “CO
villages” and “non-CO villages.” As the results are qualitatively similar, we report only the results
based on the default definition in this paper due to the space limit. To implement ii, we compare the
T + C1-group (CO village households) and the C2-group (non-CO village households).
Hypothesis H2 is tested using household-level characteristics. It is a comparison between the T-
group (member households in CO villages) and the C1-group (nonmember households in CO villages).
4 The factors endogenous to PHKN interventions are introduced into the analysis only as robustness checks, particularly in village-level multivariate analysis. 5 See Khan et al, 2011 or subsection 2.2 of Chapter 2 of Khan, 2013 for further details.
9
In other words, this is an intra-village targeting analysis. To cleanly identify the difference, we also add village fixed
effects to the list of explanatory variables in the regression analysis.
5 Empirical Results 5.1 Comparison of CO and Non-CO Villages using Village Characteristics
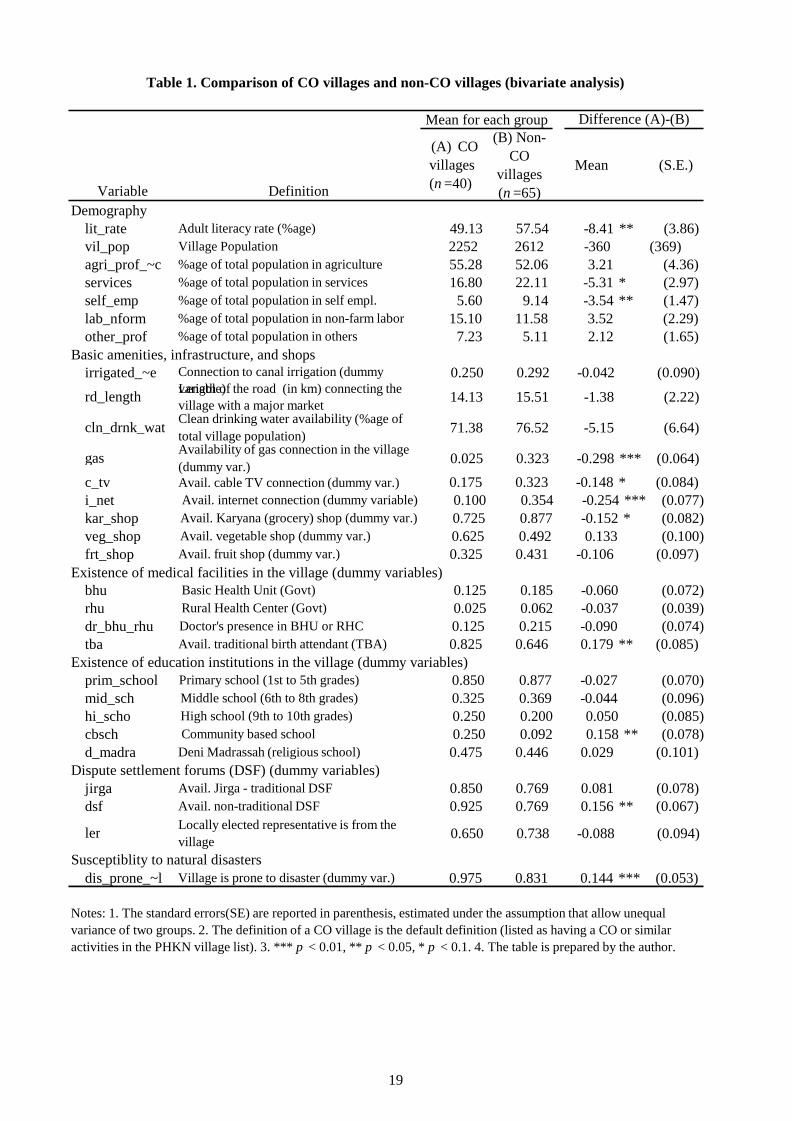
Table 1 shows empirical results comparing CO and non-CO villages using village-level variables
in a bivariate way. It reports statistical tests of equality of means.
In line with their demographic attributes, CO villages are characterized by a literacy rate lower
than that of non-CO villages—by at least 8 percentage points, in fact. Both village types are similar in
terms of their population. Non-CO villages have a higher level of diversification in terms of
occupational structure, which is an indication of their higher standard of living.6 The two sets of
villages are similar in terms of their access to basic amenities like clean drinking water and roads by which to access the market. However, the two sets of villages are noticeably different in terms of
accessibility to natural gas, cable TV, and internet. The results of the analysis show that the non-CO
villages have better access to the aforementioned amenities, which are generally associated with
economically better-off areas. The non-CO villages tend to have more grocery shops called Karyana
shops—although the difference is significant only when there is a control group comprising all non-CO
villages, and hence a better village market place. These factors suggest that CO villages are poorer than
non-CO villages.
6 However, the occupational difference becomes insignificant when villages in Abbotabad and Mansehra are excluded.
10
We find there to be no difference between the two sets of villages vis-à-vis access to formal health
facilities. However, the CO villages have much better access to informal health services, e.g., trained
TBAs.7 The villages are also similar in terms of the availability of formal and informal educational
facilities. The two village types are similar in terms of their access to formal education facilities;
however, the CO villages have better access to informal education facilities—e.g., community-based
schools—than do non-CO villages. The overwhelmingly strong presence of informal institutions and
facilities in the CO villages suggests minimal presence and/or effectiveness of government at grass-root
level in the study area.
DSFs provide a basis for local governance. No difference is found between the CO and non-CO
villages in terms of the presence of a traditional DSF (e.g., jirga)—a characteristic exogenous to PHKN
interventions and is evenly spread across all the villages. However, the number of nontraditional DSFs
in CO villages is significantly larger than that in non-CO villages;8 this reflects the strong presence in
the CO villages of local-governance institutions essential to the effective use of local information, the presence of accountability, and hence better targeting performance (Mansuri and Rao, 2004).
Last but not the least is the incidence of damage owing to the 2010 floods. The damages were
higher among CO than non-CO villages; this suggests that CO villages tend to be more vulnerable to
natural disasters.
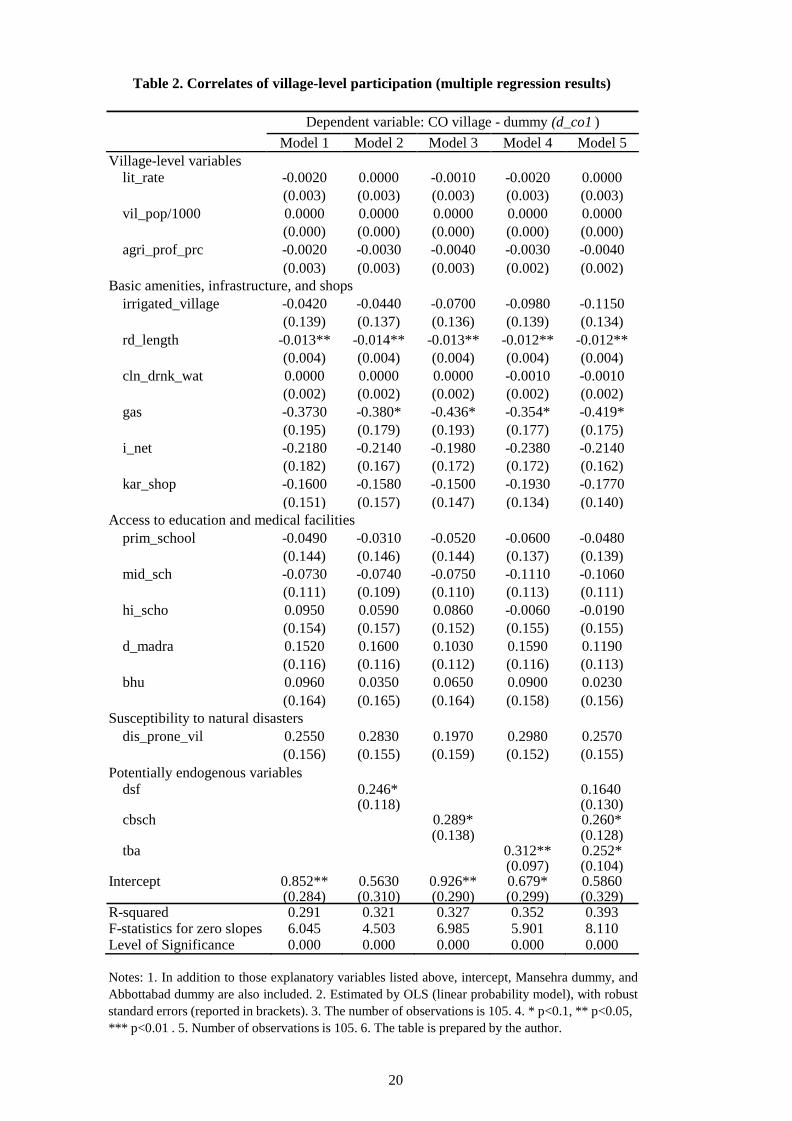
Table 2 shows results of regressing the dummy for CO villages on variables analyzed in Table 1.
7 This is endogenous to PHKN interventions. As mentioned previously, in this paper, endogenous factors are not employed for impact-assessment purposes; they are used only for identification purposes and as robustness checks. 8 This illustrates PHKN’s facilitation in bringing about a local-governance system that is more inclusive than traditional institutions. Analysis in this vein is left to future research.
As the multivariate analysis is meant to be used solely for descriptive purposes, we employ simple
11
linear probability models in the analysis. 9 Owing to the small sample size and inherent
multicollinearity issues, we opt for a reduced-form regression model.10 In Model 1, we employ as
explanatory variables only those time-invariant variables that are clearly determined prior to PHKN
interventions, with the objective of analyzing only the targeting result. We include some potentially
endogenous variables in Models 2–5, but only as robustness checks. The aforementioned endogenous
variables are nontraditional DSFs (dsf), availability of CBS (cbsch), and availability of TBAs (tba).
The results of the multivariate analysis agree with those of the bivariate analysis, with varying
levels of statistical significance. The results support, in a robust manner, early findings regarding the
CO villages. Once we control for other factors, the literacy rate is no longer associated with the
presence of a CO in a village. The pattern of pro-poor targeting persists, as suggested by the coefficients
of the variables that represent access to natural gas, internet access, and grocery shops, and
susceptibility to disasters.11 These results provide slightly weaker evidence than that suggested through
the bivariate analysis.
Strikingly, the variable representing the length of the road connecting a village with a major
market (rd_length) becomes significant in multivariate regressions. The coefficient of the variable is
statistically significant and bears a negative sign. This suggests that CO villages are more likely to be at
shorter distances from a major market than non-CO villages, when controlling for other factors. In other
9 The Probit results are qualitatively the same as the results reported in this paper. 10 A number of variables have a potential association with some other variables, or do not show variation in the bivariate comparison; they are not included as explanatory variables in multivariate analysis. 11 The results are statistically significant in several, but not all, specifications.
words, this is a reflection of a cost-minimization strategy on the part of PHKN—especially in the wake
12
of rising transportation costs.
When we add the potentially endogenous variables (dsf, cbsch, and tba) to Models 2–5, positive
and significant correlations are derived; this accords with the results of the bivariate analysis. Moreover,
the inclusion of the potentially endogenous variables does not qualitatively alter coefficients on the
more predetermined variables.12
To summarize the village-level analysis using village characteristics, we found that a village that is closer to a major market, lacks amenities, and is prone to natural disasters is more likely to be targeted
by PHKN and hence form a CO. This suggests that the overall targeting by PHKN is pro-poor. The
results of both bivariate and multivariate analysis support this.
5.2 Comparison of CO and Non-CO Villages using Household Characteristics
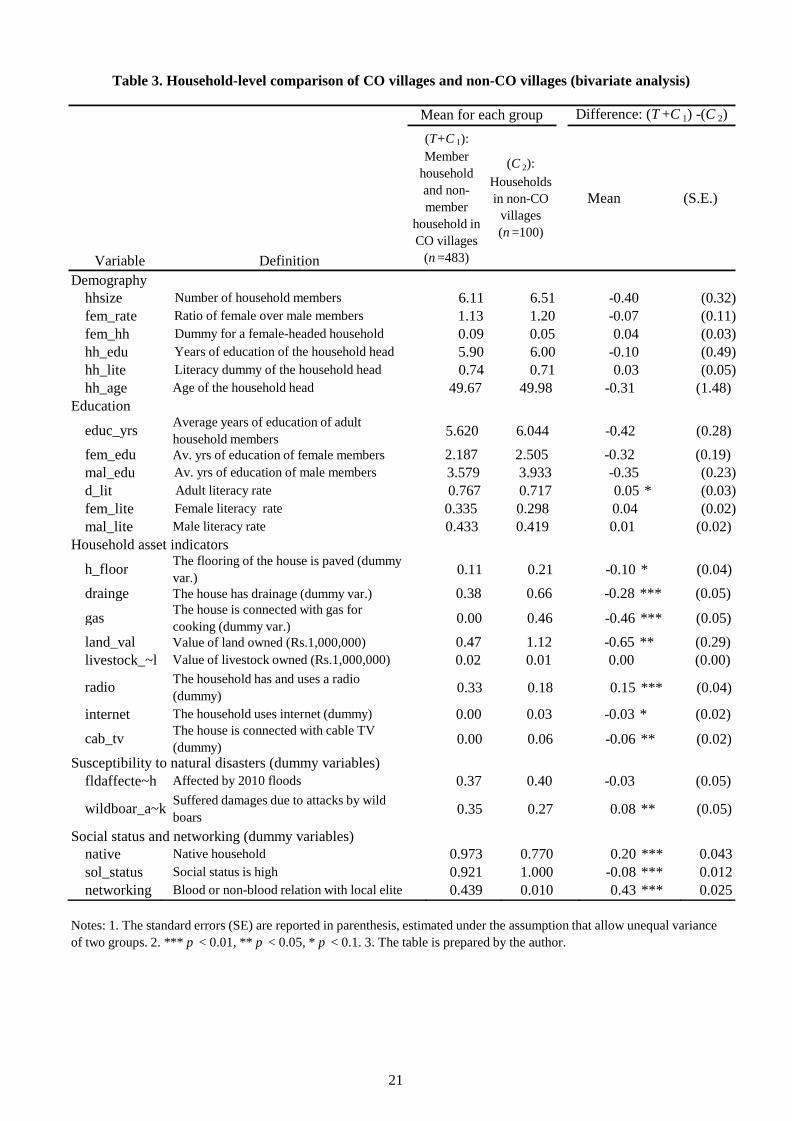
Table 3 shows empirical results comparing households in CO villages and households in non-CO
villages using household-level variables in a bivariate way. In other words, we compare the T + C1
group and the C2 group to test H1.
The two sets of households are similar in terms of demographic and educational attributes. However, we find a sharp contrast regarding household assets; seven of the eight differences are
statistically significant, albeit at various significance levels. The T + C1 group households are poorer
than those in the C2 group in terms of housing conditions (i.e., house flooring and access to drainage),
12 See Khan (2013), Chapter 5 and 6 for a quantitative analysis of the causal impact of PHKN’s interventions.
quality of landholdings (i.e., value of land), and access to amenities (i.e., gas, radio, internet, and cable
13
TV). The use of radio is higher among the T + C1 group households than those in the C2 group. In the
age of television and the internet, radio use is a reflection of poverty. Therefore, the bivariate analysis
shows that the T + C1 group households are poorer than C2 group households. Moreover, the T + C1
group households are highly vulnerable to shocks (e.g., wild boar attacks), compared to the C2 group;
this result reflects village-level PHKN placement and supports our earlier claim of pro-poor targeting
by the PHKN, that is, the PHKN can successfully outreach environmentally vulnerable segments of
society. A larger number of the T + C1 group households are native, compared to the C2 group
households; however, among the former, there is a lower proportion of households with higher social
status. Both of the aforementioned characteristics suggest that CO villages are homogenous and the
least socially empowered, which once again reaffirms the PHKN’s claim that it targets the marginalized
segments of Pakistani society. We find there to be an interesting difference between the T + C1 group
and the C2 group households, based on their networking with the local elite. The T + C1 group has better
networking with the local elite than the C2 group households; this is consistent with our earlier
predictions of the possibility of elite capture (vis-à-vis the social mobilization process of PHKN).13
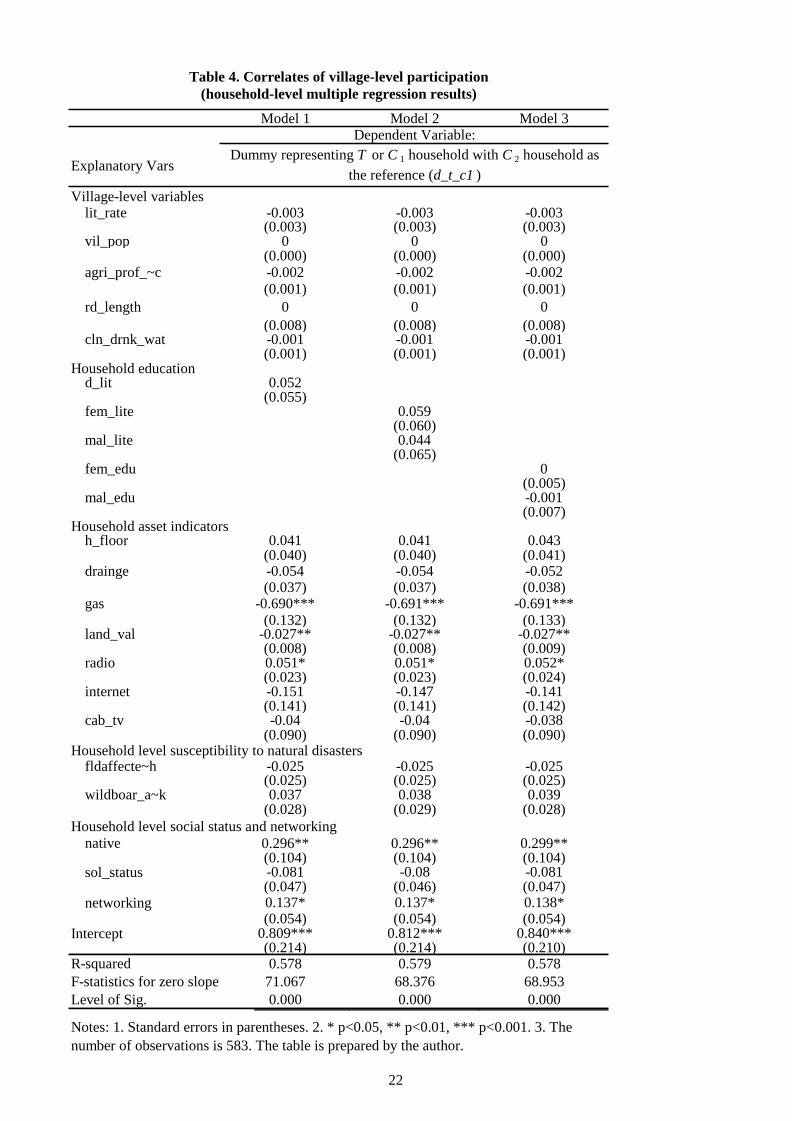
Table 4 shows multiple regression results to predict the probability of households belonging to the
T + C1 group households against the C2 group households. The coefficients on most of the explanatory
variables bear signs as per expectations.
We find a difference between the two groups that is almost similar to the one seen in the bivariate
13 See Chapter 2 of Khan, 2013 for further details.
14
analysis. A significantly small proportion of the T + C1 group households are using natural gas for
cooking (at the 1-percent significance level), while a significantly larger proportion of the same exhibit
radio ownership and usage (at the 1-percent significance level), compared to the C2 group households.
The C2 group households have better land holdings, in terms of land value, than the T + C1 group
households. On the other hand, the T + C1 group households have more strong networking with the
local elite (at the 1-percent significance level) than the C2 group households.
To summarize the findings of village-level analysis using household characteristics, we found that
villages whose households have poor access to basics amenities (e.g. natural gas), low quality
landholdings (in terms of land value), and strong networking with local elite are more likely to be
targeted by PHKN and subsequently have a CO.
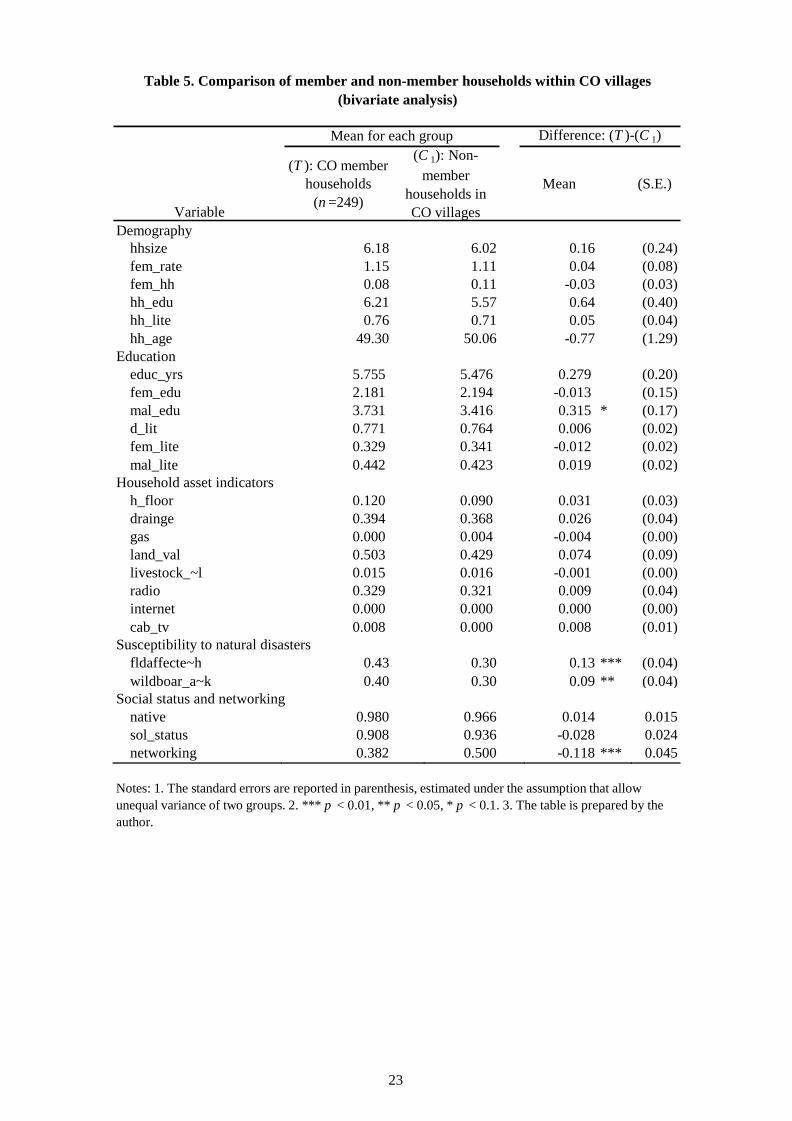
5.3 Intra-Village Analysis (Comparison of Treated and Control Households)
To further understanding the targeting performance of PHKN, we compare the T group and the C1
group within CO villages. The bivariate comparison results are reported in Table 5. The two groups are
similar in their demographics, asset holdings, and income indicators. The two groups of households also
have similar educational attributes, save for average years of schooling among male members of the
households. The T group households have slightly better male education than the C1 group households,
at the 10-percent significance level. In other words, the households in the CO villages that have
relatively higher male education are more likely to become members of a CO, which is common in
15
practice. On the other hand, the T group households are more vulnerable to natural disasters and shocks
(i.e., both floods and WBAs), compared to those in the C1 group; We interpret this as an outcome of
self-selection, that is, the households prone to natural disasters, even within the same village, are more
likely to join a CO. As far as the social characteristics of the two groups of households are
concerned—like social status and networking—the two groups are similar. Hence, CO villages are
homogeneous in terms of the social status of their inhabitants, but heterogeneous in terms of networking
with the local elite.
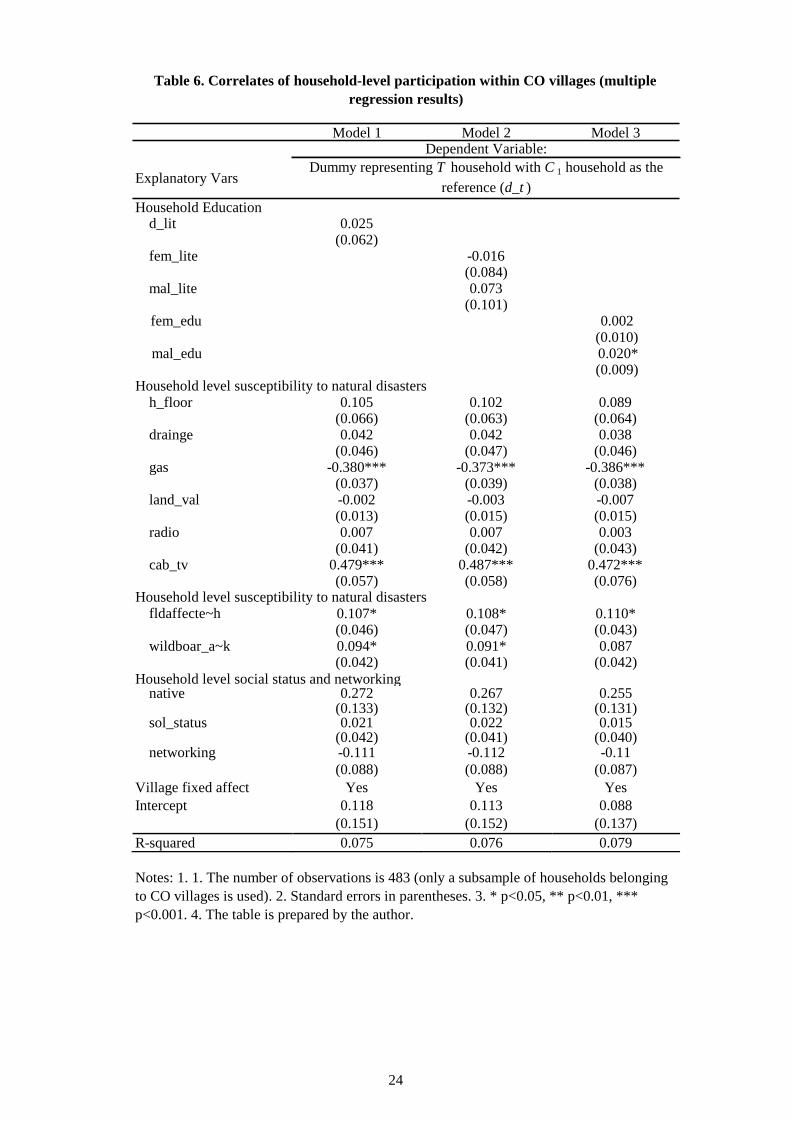
Table 6 shows multiple regression results to predict the probability of households participating in a
CO within a village with COs. We regress a dummy that represents the T group households on a set of
household-level variables from Table 5, as well as all village dummies as explanatory variables, for a
subsample of CO villages. The results confirm that the two groups are similar regarding education but
households with highly educated males are slightly more likely to join a CO. The test results also
indicate that a significantly smaller proportion of the T group households use natural gas for cooking (at
the 1-percent significance level), while a significantly higher proportion of the same are susceptible to
natural disasters and shocks (at the 5-percent significance level) than the C1 group households that
poorer and environmentally vulnerable are more likely to be treated. Strikingly, the T group households have better access to cable TV (at the 1-percent significance level) than the C1 group households—a
finding that was insignificant in the bivariate analysis. We interpret this finding as more aware and
socially sensitized are more likely to become CO members owing to their access to so-called
16
independent and vibrant electronic media on cable TV than state run terrestrial TV network. Given
these findings, we can safely accept H2, that is, CO members in CO villages are systematically different
from nonmembers in CO villages, i.e. CO member households are poorer than non-member households.
To summarize the findings of household-level analysis within CO villages, we found that member
households and non-member households are somewhat similar in their characteristics. We were not able
to find a clear pattern of member households poorer than non-member households. Regarding
vulnerability to natural disasters, we found that more vulnerable households were more likely to join a
CO.
6 Conclusion
In this paper, we investigated the targeting performance of the CBD approach using detailed
primary data collected from PHKN, a woman-led and women-focused NGO in rural Pakistan.
Employing village (census data of entire project area of the NGO) and household (sample data) level
survey data, we implemented statistical tests to assess the targeting performance.
We found that villages whose households are poorer in terms of access to amenities are more likely
to have a CO of the NGO. Villages where level of literacy among its households is high and networking
with the local elite is strong are more likely to form a CO. On the other hand intra-village targeting
analysis shows that member households are also systematically different from nonmember households
in CO villages, in terms of access to basic amenities; additionally, the latter are more vulnerable to
natural disasters than the former. Hence, the PHKN has been able to reach out to environmentally
17
vulnerable households. Within CO villages, households with literate males and households with better
networking are also more likely to be a member.
To conclude, PHKN has been able to target not only poorer villages but also more vulnerable
households. The results suggest that the CBD approach through a woman-led and women-focused NGO
is able to improve targeting performance of a poverty reduction policy. On the other hand, the higher
likelihood of more socially endowed households joining PHKN may raise concerns vis-à-vis potential
elite capture, which is non-existent (details analyses are carried out in Chapter 4 of Khan, 2013). With
the current village-level dataset, we were not able to separately identify the endogenous placement
effect and the self-selection effect. In future research, we intend to overcome this shortcoming of data
by having further rounds of surveys and through collection of recall data. We have already collected
two rounds of follow-up surveys in 2011 and 2012 and are planning to implement the fourth one in late
2013.
18
References: Alatas, V., Banerjee, A., Hanna, R., Olken, B. A. and Tobias, J. (2012). Targeting the Poor: Evidence
from a Field Experiment in Indonesia. American Economic Review 102(4), 1206–1240. Conning, J. and Kevane, M. (2002). Community-based Targeting Mechanisms for Social Safety Nets: a
Critical Review. World Development 30(3), 375–394. Galasso, E. and Ravallion, M. (2005). Decentralized Targeting of an Antipoverty Program. Journal of
Public Economics 89, 705-727. Khan, H. U. (2013). Economic Analysis of Community-based Development Interventions in Rural
Pakistan, unpublished Ph.D. dissertation, Graduate School of Economics, Hitotsubashi University, March 2013.
Khan, H.U., Kurosaki, T., Miura, K. (2011). The Effectiveness of Community-Based Development in
Poverty Reduction: A Descriptive Analysis of a Women-Managed NGO in Rural Pakistan. Center for Economic Institutions (CEI) Discussion Paper No. 2011-4 Hitotsubashi University, Tokyo,
186-8603 JAPAN http://cei.ier.hit-u.ac.jp/English/index.html Khwaja, A.I. (2004) Is Increasing Community Participation Always a Good Thing? Journal of the
European Economic Association. 2(2-3), 427-36. Khawaja, A.I. (2009) Can Good Projects Succeed in Bad Communities? Journal of Public Economics
93(7-8), 899-916. Kurosaki, T. (2005). Determinants of Collective Action under Devolution Initiatives: The Case of
Citizen Community Boards in Pakistan. Pakistan Development Review 44(3), 253-270. Kurosaki, T. and Khan, H. U. (2012). Vulnerability of Microfinance to Strategic Default and Covariate
Shocks: Evidence from Pakistan. The Developing Economies 50(2), 81-115. Mansuri, G. and Rao, V. (2004). Community-based and -driven Development: a Critical Review. World
Bank Research Observer 19(1), 1–39. UNDP (2013), The Rise of the South: Human Progress in a Diverse World: In Human Development
Report 2013. New York: UNDP.
19
gas
ler
cln_drnk_wat
Table 1. Comparison of CO villages and non-CO villages (bivariate analysis)
Mean for each group Difference (A)-(B)
Variable Demography
Definition
(A) CO villages (n =40)
(B) Non- CO
villages (n =65)
Mean (S.E.)
lit_rate Adult literacy rate (%age) 49.13 57.54 -8.41 ** (3.86) vil_pop Village Population 2252 2612 -360 (369) agri_prof_~c %age of total population in agriculture 55.28 52.06 3.21 (4.36) services %age of total population in services 16.80 22.11 -5.31 * (2.97) self_emp %age of total population in self empl. 5.60 9.14 -3.54 ** (1.47) lab_nform %age of total population in non-farm labor 15.10 11.58 3.52 (2.29) other_prof %age of total population in others 7.23 5.11 2.12 (1.65)
Basic amenities, infrastructure, and shops irrigated_~e Connection to canal irrigation (dummy 0.250 0.292 -0.042 (0.090)
rd_length vLaernigabthleo)f the road (in km) connecting the village with a major market 14.13 15.51 -1.38 (2.22) Clean drinking water availability (%age of total village population) 71.38 76.52 -5.15 (6.64) Availability of gas connection in the village (dummy var.) 0.025 0.323 -0.298 *** (0.064)
c_tv Avail. cable TV connection (dummy var.) 0.175 0.323 -0.148 * (0.084) i_net Avail. internet connection (dummy variable) 0.100 0.354 -0.254 *** (0.077) kar_shop Avail. Karyana (grocery) shop (dummy var.) 0.725 0.877 -0.152 * (0.082) veg_shop Avail. vegetable shop (dummy var.) 0.625 0.492 0.133 (0.100) frt_shop Avail. fruit shop (dummy var.) 0.325 0.431 -0.106 (0.097)
Existence of medical facilities in the village (dummy variables) bhu Basic Health Unit (Govt) 0.125 0.185 -0.060 (0.072) rhu Rural Health Center (Govt) 0.025 0.062 -0.037 (0.039) dr_bhu_rhu Doctor's presence in BHU or RHC 0.125 0.215 -0.090 (0.074) tba Avail. traditional birth attendant (TBA) 0.825 0.646 0.179 ** (0.085)
Existence of education institutions in the village (dummy variables) prim_school Primary school (1st to 5th grades) 0.850 0.877 -0.027 (0.070) mid_sch Middle school (6th to 8th grades) 0.325 0.369 -0.044 (0.096) hi_scho High school (9th to 10th grades) 0.250 0.200 0.050 (0.085) cbsch Community based school 0.250 0.092 0.158 ** (0.078) d_madra Deni Madrassah (religious school) 0.475 0.446 0.029 (0.101)
Dispute settlement forums (DSF) (dummy variables) jirga Avail. Jirga - traditional DSF 0.850 0.769 0.081 (0.078) dsf Avail. non-traditional DSF 0.925 0.769 0.156 ** (0.067)
Locally elected representative is from the village 0.650 0.738 -0.088 (0.094)
Susceptiblity to natural disasters dis_prone_~l Village is prone to disaster (dummy var.) 0.975 0.831 0.144 *** (0.053)
Notes: 1. The standard errors(SE) are reported in parenthesis, estimated under the assumption that allow unequal variance of two groups. 2. The definition of a CO village is the default definition (listed as having a CO or similar activities in the PHKN village list). 3. *** p < 0.01, ** p < 0.05, * p < 0.1. 4. The table is prepared by the author.
20
Table 2. Correlates of village-level participation (multiple regression results)
Dependent variable: CO village - dummy (d_co1 )
Model 1 Model 2 Model 3 Model 4 Model 5 Village-level variables
lit_rate -0.0020 0.0000 -0.0010 -0.0020 0.0000 (0.003) (0.003) (0.003) (0.003) (0.003)
vil_pop/1000 0.0000 0.0000 0.0000 0.0000 0.0000 (0.000) (0.000) (0.000) (0.000) (0.000)
agri_prof_prc -0.0020 -0.0030 -0.0040 -0.0030 -0.0040 (0.003) (0.003) (0.003) (0.002) (0.002) Basic amenities, infrastructure, and shops
irrigated_village -0.0420 -0.0440 -0.0700 -0.0980 -0.1150 (0.139) (0.137) (0.136) (0.139) (0.134)
rd_length -0.013** -0.014** -0.013** -0.012** -0.012** (0.004) (0.004) (0.004) (0.004) (0.004)
cln_drnk_wat 0.0000 0.0000 0.0000 -0.0010 -0.0010 (0.002) (0.002) (0.002) (0.002) (0.002)
gas -0.3730 -0.380* -0.436* -0.354* -0.419* (0.195) (0.179) (0.193) (0.177) (0.175)
i_net -0.2180 -0.2140 -0.1980 -0.2380 -0.2140 (0.182) (0.167) (0.172) (0.172) (0.162)
kar_shop -0.1600 -0.1580 -0.1500 -0.1930 -0.1770 (0.151) (0.157) (0.147) (0.134) (0.140) Access to education and medical facilities
prim_school -0.0490 -0.0310 -0.0520 -0.0600 -0.0480 (0.144) (0.146) (0.144) (0.137) (0.139)
mid_sch -0.0730 -0.0740 -0.0750 -0.1110 -0.1060 (0.111) (0.109) (0.110) (0.113) (0.111)
hi_scho 0.0950 0.0590 0.0860 -0.0060 -0.0190 (0.154) (0.157) (0.152) (0.155) (0.155)
d_madra 0.1520 0.1600 0.1030 0.1590 0.1190 (0.116) (0.116) (0.112) (0.116) (0.113)
bhu 0.0960 0.0350 0.0650 0.0900 0.0230 (0.164) (0.165) (0.164) (0.158) (0.156) Susceptibility to natural disasters
dis_prone_vil 0.2550 0.2830 0.1970 0.2980 0.2570 (0.156) (0.155) (0.159) (0.152) (0.155) Potentially endogenous variables
dsf 0.246* 0.1640 (0.118) (0.130)
cbsch 0.289* 0.260* (0.138) (0.128)
tba 0.312** 0.252* (0.097) (0.104) Intercept 0.852** 0.5630 0.926** 0.679* 0.5860 (0.284) (0.310) (0.290) (0.299) (0.329) R-squared 0.291 0.321 0.327 0.352 0.393 F-statistics for zero slopes 6.045 4.503 6.985 5.901 8.110 Level of Significance 0.000 0.000 0.000 0.000 0.000
Notes: 1. In addition to those explanatory variables listed above, intercept, Mansehra dummy, and Abbottabad dummy are also included. 2. Estimated by OLS (linear probability model), with robust standard errors (reported in brackets). 3. The number of observations is 105. 4. * p<0.1, ** p<0.05, *** p<0.01 . 5. Number of observations is 105. 6. The table is prepared by the author.
21
gas
radio
cab_tv
h_floor
educ_yrs
wildboar_a~k
Table 3. Household-level comparison of CO villages and non-CO villages (bivariate analysis)
Mean for each group Difference: (T +C 1) -(C 2) (T+C 1):
Variable Demography
Definition
Member household and non- member
household in CO villages
(n =483)
(C 2):
Households in non-CO
villages (n =100)
Mean (S.E.)
hhsize Number of household members 6.11 6.51 -0.40 (0.32) fem_rate Ratio of female over male members 1.13 1.20 -0.07 (0.11) fem_hh Dummy for a female-headed household 0.09 0.05 0.04 (0.03) hh_edu Years of education of the household head 5.90 6.00 -0.10 (0.49) hh_lite Literacy dummy of the household head 0.74 0.71 0.03 (0.05) hh_age Age of the household head 49.67 49.98 -0.31 (1.48)
Education Average years of education of adult household members 5.620 6.044 -0.42 (0.28)
fem_edu Av. yrs of education of female members 2.187 2.505 -0.32 (0.19) mal_edu Av. yrs of education of male members 3.579 3.933 -0.35 (0.23) d_lit Adult literacy rate 0.767 0.717 0.05 * (0.03) fem_lite Female literacy rate 0.335 0.298 0.04 (0.02) mal_lite Male literacy rate 0.433 0.419 0.01 (0.02)
Household asset indicators The flooring of the house is paved (dummy var.) 0.11 0.21 -0.10 * (0.04)
drainge The house has drainage (dummy var.) 0.38 0.66 -0.28 *** (0.05) The house is connected with gas for cooking (dummy var.) 0.00 0.46 -0.46 *** (0.05)
land_val Value of land owned (Rs.1,000,000) 0.47 1.12 -0.65 ** (0.29) livestock_~l Value of livestock owned (Rs.1,000,000) 0.02 0.01 0.00 (0.00)
The household has and uses a radio (dummy) 0.33 0.18 0.15 *** (0.04)
internet The household uses internet (dummy) 0.00 0.03 -0.03 * (0.02) The house is connected with cable TV (dummy) 0.00 0.06 -0.06 ** (0.02)
Susceptibility to natural disasters (dummy variables) fldaffecte~h Affected by 2010 floods 0.37 0.40 -0.03 (0.05)
Suffered damages due to attacks by wild boars 0.35 0.27 0.08 ** (0.05)
Social status and networking (dummy variables) native Native household 0.973 0.770 0.20 *** 0.043 sol_status Social status is high 0.921 1.000 -0.08 *** 0.012 networking Blood or non-blood relation with local elite 0.439 0.010 0.43 *** 0.025
Notes: 1. The standard errors (SE) are reported in parenthesis, estimated under the assumption that allow unequal variance of two groups. 2. *** p < 0.01, ** p < 0.05, * p < 0.1. 3. The table is prepared by the author.
22
lit_rate -0.003 -0.003 -0.003 (0.003) (0.003) (0.003) vil_pop 0 0 0 (0.000) (0.000) (0.000) agri_prof_~c -0.002 -0.002 -0.002 (0.001) (0.001) (0.001) rd_length 0 0 0 (0.008) (0.008) (0.008) cln_drnk_wat -0.001 -0.001 -0.001 (0.001) (0.001) (0.001)
h_floor 0.041 0.041 0.043 (0.040) (0.040) (0.041) drainge -0.054 -0.054 -0.052 (0.037) (0.037) (0.038) gas -0.690*** -0.691*** -0.691*** (0.132) (0.132) (0.133) land_val -0.027** -0.027** -0.027** (0.008) (0.008) (0.009) radio 0.051* 0.051* 0.052* (0.023) (0.023) (0.024) internet -0.151 -0.147 -0.141 (0.141) (0.141) (0.142) cab_tv -0.04 -0.04 -0.038 (0.090) (0.090) (0.090)
0.296** (0.104)
0.296** (0.104)
0.299** (0.104)
-0.081 -0.08 -0.081 (0.047) (0.046) (0.047) 0.137* 0.137* 0.138* (0.054)
0.809*** (0.214)
(0.054) 0.812*** (0.214)
(0.054) 0.840*** (0.210)
0.578 0.579 0.578 71.067 68.376 68.953 0.000 0.000 0.000
Explanatory Vars
Table 4. Correlates of village-level participation (household-level multiple regression results)
Model 1 Model 2 Model 3 Dependent Variable:
Dummy representing T or C 1 household with C 2 household as the reference (d_t_c1 )
Village-level variables
Household education
d_lit 0.052 (0.055)
fem_lite 0.059 (0.060)
mal_lite 0.044 (0.065)
fem_edu 0 (0.005)
mal_edu -0.001 (0.007)
Household asset indicators Household level susceptibility to natural disasters
fldaffecte~h -0.025 -0.025 -0.025 (0.025) (0.025) (0.025) wildboar_a~k 0.037 0.038 0.039 (0.028) (0.029) (0.028)
Household level social status and networking native
sol_status
networking
Intercept
R-squared F-statistics for zero slope Level of Sig.
Notes: 1. Standard errors in parentheses. 2. * p<0.05, ** p<0.01, *** p<0.001. 3. The number of observations is 583. The table is prepared by the author.
23
Table 5. Comparison of member and non-member households within CO villages (bivariate analysis)
Mean for each group Difference: (T )-(C 1)
(C 1): Non-
Variable Demography
(T ): CO member households
(n =249)
member households in CO villages
Mean (S.E.)
hhsize 6.18 6.02 0.16 (0.24) fem_rate 1.15 1.11 0.04 (0.08) fem_hh 0.08 0.11 -0.03 (0.03) hh_edu 6.21 5.57 0.64 (0.40) hh_lite 0.76 0.71 0.05 (0.04) hh_age 49.30 50.06 -0.77 (1.29)
Education educ_yrs 5.755 5.476 0.279 (0.20) fem_edu 2.181 2.194 -0.013 (0.15) mal_edu 3.731 3.416 0.315 * (0.17) d_lit 0.771 0.764 0.006 (0.02) fem_lite 0.329 0.341 -0.012 (0.02) mal_lite 0.442 0.423 0.019 (0.02)
Household asset indicators h_floor 0.120 0.090 0.031 (0.03) drainge 0.394 0.368 0.026 (0.04) gas 0.000 0.004 -0.004 (0.00) land_val 0.503 0.429 0.074 (0.09) livestock_~l 0.015 0.016 -0.001 (0.00) radio 0.329 0.321 0.009 (0.04) internet 0.000 0.000 0.000 (0.00) cab_tv 0.008 0.000 0.008 (0.01)
Susceptibility to natural disasters fldaffecte~h 0.43 0.30 0.13 *** (0.04) wildboar_a~k 0.40 0.30 0.09 ** (0.04)
Social status and networking native 0.980 0.966 0.014 0.015 sol_status 0.908 0.936 -0.028 0.024 networking 0.382 0.500 -0.118 *** 0.045
Notes: 1. The standard errors are reported in parenthesis, estimated under the assumption that allow unequal variance of two groups. 2. *** p < 0.01, ** p < 0.05, * p < 0.1. 3. The table is prepared by the author.
24
Table 6. Correlates of household-level participation within CO villages (multiple regression results)
Explanatory Vars
Household Education
Model 1 Model 2 Model 3 Dependent Variable:
Dummy representing T household with C 1 household as the reference (d_t )
d_lit 0.025 (0.062)
fem_lite -0.016 (0.084)
mal_lite 0.073 (0.101)
fem_edu 0.002 (0.010)
mal_edu 0.020* (0.009)
Household level susceptibility to natural disasters h_floor 0.105 0.102 0.089
(0.066) (0.063) (0.064) drainge 0.042 0.042 0.038
(0.046) (0.047) (0.046) gas -0.380*** -0.373*** -0.386***
(0.037) (0.039) (0.038) land_val -0.002 -0.003 -0.007
(0.013) (0.015) (0.015) radio 0.007 0.007 0.003
(0.041) (0.042) (0.043) cab_tv 0.479*** 0.487*** 0.472***
(0.057) (0.058) (0.076) Household level susceptibility to natural disasters
fldaffecte~h 0.107* (0.046)
0.108* (0.047)
0.110* (0.043)
wildboar_a~k 0.094* 0.091* 0.087 (0.042) (0.041) (0.042) Household level social status and networking
native 0.272 0.267 0.255 (0.133) (0.132) (0.131)
sol_status 0.021 0.022 0.015 (0.042) (0.041) (0.040)
networking -0.111 -0.112 -0.11 (0.088) (0.088) (0.087) Village fixed affect Yes Yes Yes Intercept 0.118 0.113 0.088 (0.151) (0.152) (0.137) R-squared 0.075 0.076 0.079
Notes: 1. 1. The number of observations is 483 (only a subsample of households belonging to CO villages is used). 2. Standard errors in parentheses. 3. * p<0.05, ** p<0.01, *** p<0.001. 4. The table is prepared by the author.
Top Related
Copyright © 2022 FDOKUMEN

