


Bahasa
Halaman
Hukum


Ultrasound in Med. & Biol., Vol. 31, No. 9, pp. 1225–1235, 2005Copyright © 2005 World Federation for Ultrasound in Medicine & Biology
Printed in the USA. All rights reserved0301-5629/05/$–see front matter
doi:10.1016/j.ultrasmedbio.2005.05.002
● Original Contribution
BONE MICROSTRUCTURE AND ELASTIC TISSUE PROPERTIES AREREFLECTED IN QUS AXIAL TRANSMISSION MEASUREMENTS
KAY RAUM,*† INGRID LEGUERNEY,* FLORENT CHANDELIER,* EMMANUEL BOSSY,*MARYLINE TALMANT,* AMENA SAÏED,* FRANÇOISE PEYRIN,‡§ and PASCAL LAUGIER*
*Laboratoire d’Imagerie Paramétrique, CNRS/Université Paris 6, Paris, France; †Q-BAM Group, Department ofOrthopedics, Martin Luther University of Halle-Wittenberg, Halle, Germany; ‡CREATIS, Villeurbanne, France; and
§ESRF, Grenoble, France
(Received 17 December 2004, revised 25 April 2005, in final form 11 May 2005)
Abstract—Accurate clinical interpretation of the sound velocity derived from axial transmission devices requiresa detailed understanding of the propagation phenomena involved and of the bone factors that have an impact onmeasurements. In the low megahertz range, ultrasonic propagation in cortical bone depends on anisotropicelastic tissue properties, porosity and the cortical geometry (e.g., thickness). We investigated 10 human radiussamples from a previous biaxial transmission study using a 50-MHz scanning acoustic microscope (SAM) andsynchrotron radiation microcomputed tomography. The relationships between low-frequency axial transmissionsound speed at 1 and 2 MHz, structural properties (cortical width Ct.Wi, porosity, Haversian canal density andmaterial properties (acoustic impedance, mineral density) on site-matched cross-sections were investigated.Significant linear multivariate regression models (1 MHz: R2 � 0.84, p < 10�4, root-mean-square error (RMSE)� 38 m/s, 2 MHz: R2 � 0.65, p < 10�4, RMSE � 48 m/s) were found for the combination of Ct.Wi with porosityand impedance. A new model was derived that accounts for the nonlinear dispersion relation with Ct.Wi andpredicts axial transmission velocities measured at different ultrasonic frequencies (R2 � 0.69, p < 10�4, RMSE� 52 m/s). (E-mail: [email protected]) © 2005 World Federation for Ultrasound in Medicine &Biology.
Key Words: Acoustic microscopy, Bone, Elastic properties, Microstructure, Synchrotron-CT, Ultrasound.
INTRODUCTION
Although various nonskeletal factors, such as the liability tofall, contribute to fracture risk, the diagnosis of osteoporosisrelies on assessment of skeletal status. This requires wide-spread development of facilities for the assessment of sev-eral alterations in bone intrinsic properties, such as reduc-tion in bone mass and changes in its spatial distribution,increase in porosity and modification of the bone matrixmaterial, itself. The latter refers to the deterioration ofbiomechanical competence of the bone material per se andis reflected in changes in stiffness, strength and toughness(Zioupos and Currey 1998). Clinical bone assessment usingconventional x-ray densitometry is centered on the mea-surement of bone mineral density (BMD), but it does notaddress other skeleton abnormalities. To encompass themultiple aspects of bone fragility, several other noninvasive
Address correspondence to: Dr. Kay Raum, Dept. of Orthope-
dics, Q-BAM Group, Martin Luther University of Halle, Halle 06097Germany. E-mail: [email protected]1225
modalities have been developed. Among them, quantitativeultrasound (QUS) technologies offer several advantages,such as cheapness, portability and absence of ionizing ra-diation. Like x-ray densitometry techniques, QUS has beenadapted to assess different skeletal sites. Clinical devicesbased on transmission measurements of the speed of sound(SOS) and broadband bone ultrasound attenuation (BUA)through the calcaneus are now widely used (Njeh et al.1997) and evidence lends support to their use for the as-sessment of fracture risk (Gluer et al. 2004; Hans et al.1996). More recently, axial transmission techniques havebeen developed to assess cortical bone properties at theperipheral skeleton (e.g., tibia, radius or finger phalanges)(Foldes et al. 1995; Lowet and van der Perre 1996; Bossy etal. 2004a; Moilanen et al. 2003). The question of the impactof bone properties contributing to bone strength in varia-tions of axial transmission SOS is central to the debate (Leeet al. 1997; Sievanen et al. 2001).
The wave equation that governs the propagation of
ultrasonic (elastic) waves in solids relates the propaga-
1226 Ultrasound in Medicine and Biology Volume 31, Number 9, 2005
tion characteristics, such as sound velocity to the density,elasticity and structure of the propagating material. Manyexamples exist in material science where ultrasound(US) has been used to characterize material properties(i.e., stiffness and density) and microstructure (Kundu2003). In the bone densitometry field, many studies haveinvestigated the relationships between axial transmissionSOS and bone mass (Bossy et al. 2004c; Lee et al. 1997;Sievanen et al. 2001), microstructure (Bossy et al. 2004b,2004c) and biomechanical competence. The data indicatethat SOS correlates moderately with BMD and can pre-dict ultimate strength (Lee et al. 1997). In addition, theseparate contributions to sound velocity of cortical thick-ness, intracortical porosity and degree of mineralizationhave been clarified experimentally in human radius spec-imens (Bossy et al. 2004c) and by means of finite dif-ference simulations (Bossy et al. 2002, 2004b). How-ever, none of these studies has looked specifically at theinfluence of intrinsic elastic properties on axial transmis-sion SOS.
Elasticity (or stiffness) is one important character-istic of bone material biomechanical competence. Age-ing has been shown adversely to affect the elastic prop-erties of human cortical bone and the reduction in stiff-ness is accompanied by a reduction also in strength andtoughness (Zioupos and Currey 1998; Zioupos, 2001).All this suggests that SOS measurements in cortical bone,which are deterministically related to the elastic modulusof the material, should provide useful information on anydeterioration in bone mechanical properties. However,the rather low ultrasonic frequencies (in the megahertzrange) that are used for in vivo examination of corticalskeletal sites convey information on both material stiff-ness and structure and their contributions cannot be eas-ily separated. We need to understand better the contri-bution of intrinsic stiffness (i.e., tissue level stiffness) toSOS measurement. This may provide a better insight intothe value of clinical QUS technologies to assess age- ordisease-related bone quality deterioration.
Toward this goal, the tissue-level elastic propertiesmust be measured. High-resolution synchrotron radiation(SR) or X ray-based microcomputed tomography (� CT)techniques provide excellent volumetric information onthe distribution of mineral within the tissue (Lang et al.1998; Laugier et al. 1997), but the problem of relatingtissue mineralization to tissue elasticity has not yet beensolved. Furthermore, this technique is inherently notsensitive to elastic anisotropy. Nanoindentation provideslocal measurements of the elastic properties of bone, butwithout imaging capability (Fan et al. 2002; Hoffler et al.2000; Jamsa et al. 2002; Rho et al. 1999, 2001a, 2001b;Roy et al. 1999, 2001; Swadener et al. 2001). A high-resolution scanning acoustic microscope (SAM) has
been used both for qualitative imaging of the corticalmicrostructure (Katz and Meunier 1993, 1997; Meunieret al. 1988) as well as for quantitative evaluation ofsound velocity (Hasegawa et al. 1994, 1995; Pidaparti etal. 1996; Takano et al. 1996, 1999; Turner et al. 1995) oracoustical impedance (Meunier et al. 1991; Raum et al.2003, 2004; Weiss et al. 1998). These acoustical param-eters directly reflect elastic properties such as stiffness(Meunier et al. 1991; Raum and Brandt 2003) and bulkmodulus (Raum and Brandt 2003). In addition, theacoustic impedance has been shown to be sensitive toelastic anisotropy (Raum et al. 2004). The spatial reso-lution is fixed by the operating frequency and the numer-ical aperture of the transducer. Raum et al. (2004) inves-tigated the influence of these parameters on the estima-tion of acoustic impedance, porosity and Haversian canaldensity (N.Ca/Ar). They concluded that a spatial resolu-tion of approximately 20 �m (obtained at 50 MHz) isrequired for a reliable separation of tissue from theHaversian canals in human cortical bone. Thus, thisresult suggests that this spatial resolution is appropriatefor assessing elastic properties at the tissue level.
In this in vitro study, we have used SR-�CT and50-MHz SAM to examine the relative contributions ofcortical structure, degree of mineralization and acousticimpedance (representing tissue stiffness) on the SOSmeasured with a clinical device on human radius speci-mens. The ability of acoustic microscopy quantitativelyto characterize bone samples is well-established. Never-theless, its ability quantitatively to assess bone elasticproperties at the tissue level assumes an accurate extrac-tion of microstructure. The accuracy of extracting struc-tural parameters using SAM was evaluated by compari-son with site-matched SR-�CT images.
MATERIALS AND METHODS
SamplesA subset of 10 excised human radius samples from
a previous QUS investigation (Bossy et al. 2004c) wasprepared for SAM inspection. The sample populationincluded two women and eight men donors of agesbetween 68 and 90 y (mean � SD: 75.9 � 6.8 y).Cross-sections were cut adjacent to the region, whereQUS measurements have been performed. The sectionswere then fixed with Technovit® 3040 resin (HeraeusKulzer, Hanau, Germany) on special sample holders.After shock freezing the sample and holder in liquidnitrogen, flat tissue surfaces were prepared using an ultramilling machine (Reichert Jung Ultrafräse, Leica GmbH,Bensheim, Germany).
Before synchrotron data acquisition, the anteriorand posterolateral regions were extracted and defatted
for 12 h in dichloromethane (C2H2Cl2) solution. The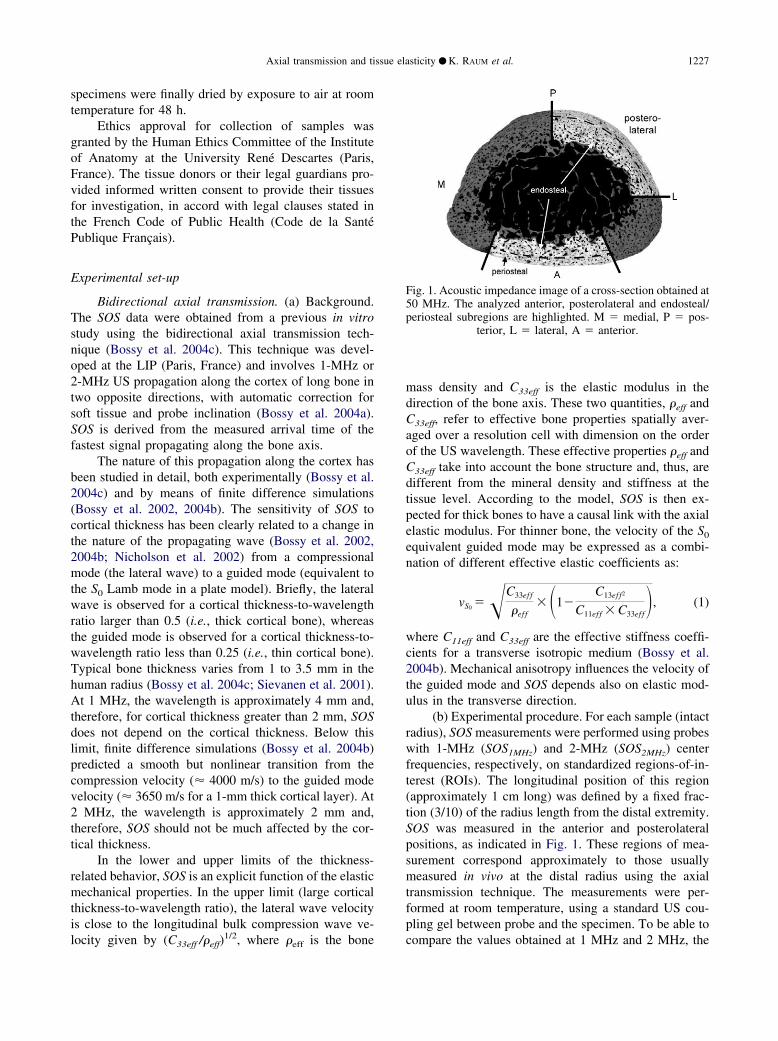
Axial transmission and tissue elasticity ● K. RAUM et al. 1227
specimens were finally dried by exposure to air at roomtemperature for 48 h.
Ethics approval for collection of samples wasgranted by the Human Ethics Committee of the Instituteof Anatomy at the University René Descartes (Paris,France). The tissue donors or their legal guardians pro-vided informed written consent to provide their tissuesfor investigation, in accord with legal clauses stated inthe French Code of Public Health (Code de la SantéPublique Français).
Experimental set-up
Bidirectional axial transmission. (a) Background.The SOS data were obtained from a previous in vitrostudy using the bidirectional axial transmission tech-nique (Bossy et al. 2004c). This technique was devel-oped at the LIP (Paris, France) and involves 1-MHz or2-MHz US propagation along the cortex of long bone intwo opposite directions, with automatic correction forsoft tissue and probe inclination (Bossy et al. 2004a).SOS is derived from the measured arrival time of thefastest signal propagating along the bone axis.
The nature of this propagation along the cortex hasbeen studied in detail, both experimentally (Bossy et al.2004c) and by means of finite difference simulations(Bossy et al. 2002, 2004b). The sensitivity of SOS tocortical thickness has been clearly related to a change inthe nature of the propagating wave (Bossy et al. 2002,2004b; Nicholson et al. 2002) from a compressionalmode (the lateral wave) to a guided mode (equivalent tothe S0 Lamb mode in a plate model). Briefly, the lateralwave is observed for a cortical thickness-to-wavelengthratio larger than 0.5 (i.e., thick cortical bone), whereasthe guided mode is observed for a cortical thickness-to-wavelength ratio less than 0.25 (i.e., thin cortical bone).Typical bone thickness varies from 1 to 3.5 mm in thehuman radius (Bossy et al. 2004c; Sievanen et al. 2001).At 1 MHz, the wavelength is approximately 4 mm and,therefore, for cortical thickness greater than 2 mm, SOSdoes not depend on the cortical thickness. Below thislimit, finite difference simulations (Bossy et al. 2004b)predicted a smooth but nonlinear transition from thecompression velocity (� 4000 m/s) to the guided modevelocity (� 3650 m/s for a 1-mm thick cortical layer). At2 MHz, the wavelength is approximately 2 mm and,therefore, SOS should not be much affected by the cor-tical thickness.
In the lower and upper limits of the thickness-related behavior, SOS is an explicit function of the elasticmechanical properties. In the upper limit (large corticalthickness-to-wavelength ratio), the lateral wave velocityis close to the longitudinal bulk compression wave ve-
locity given by (C33eff /�eff)1/2, where �eff is the bone
mass density and C33eff is the elastic modulus in thedirection of the bone axis. These two quantities, �eff andC33eff, refer to effective bone properties spatially aver-aged over a resolution cell with dimension on the orderof the US wavelength. These effective properties �eff andC33eff take into account the bone structure and, thus, aredifferent from the mineral density and stiffness at thetissue level. According to the model, SOS is then ex-pected for thick bones to have a causal link with the axialelastic modulus. For thinner bone, the velocity of the S0
equivalent guided mode may be expressed as a combi-nation of different effective elastic coefficients as:
vS0 ��C33ef f
�ef f� �1�
C13ef f2
C11ef f � C33ef f�, (1)
where C11eff and C33eff are the effective stiffness coeffi-cients for a transverse isotropic medium (Bossy et al.2004b). Mechanical anisotropy influences the velocity ofthe guided mode and SOS depends also on elastic mod-ulus in the transverse direction.
(b) Experimental procedure. For each sample (intactradius), SOS measurements were performed using probeswith 1-MHz (SOS1MHz) and 2-MHz (SOS2MHz) centerfrequencies, respectively, on standardized regions-of-in-terest (ROIs). The longitudinal position of this region(approximately 1 cm long) was defined by a fixed frac-tion (3/10) of the radius length from the distal extremity.SOS was measured in the anterior and posterolateralpositions, as indicated in Fig. 1. These regions of mea-surement correspond approximately to those usuallymeasured in vivo at the distal radius using the axialtransmission technique. The measurements were per-formed at room temperature, using a standard US cou-pling gel between probe and the specimen. To be able to
Fig. 1. Acoustic impedance image of a cross-section obtained at50 MHz. The analyzed anterior, posterolateral and endosteal/periosteal subregions are highlighted. M � medial, P � pos-
terior, L � lateral, A � anterior.
compare the values obtained at 1 MHz and 2 MHz, the
1228 Ultrasound in Medicine and Biology Volume 31, Number 9, 2005
probes need to be cross-calibrated. Plexiglas and alumi-num were chosen as calibration materials, because oftheir compressional bulk wave velocities being bothlower and higher than the velocity of approximately3500 to 4200 m/s commonly found in human corticalbone. The probes were cross-calibrated on a Plexiglasplate to give the same value of SOS (2770 m/s). Then,measurements at 1 MHz and 2 MHz performed on a thickaluminum block (SOS � 6200 m/s) produced a differ-ence of 1.6%, the SOS at 1 MHz being slightly lowerthan at 2 MHz. The difference results from a near-fieldeffect that has been described in a previous paper (Bossyet al. 2004b). Based on the 1.6% difference found onaluminum and numerical simulations of this near-fieldeffect, a difference of approximately 0.8% betweenSOS1MHz and SOS2MHz on bone (SOS � 4000 m/s) couldbe extrapolated (Bossy et al. 2004b). This factor wasused to compensate for the near-field effect and to cor-rect SOS2MHz values.
Acoustic microscopy. (a) Experimental procedure.A custom SAM developed in the Q-BAM laboratory(Halle, Germany) was used. It consists of a three-axishigh-precision scanning stage, a 200-MHz pulser/re-ceiver (Panametrics 5900PR, Waltham, MA, USA) and a500-MS/s A/D card (Gage CS8500, Gage Applied Tech-nologies, Inc., Lachine, QUE, Canada). All componentsare controlled by custom software (SAMEx, Q-BAM,Halle, Germany). A spherically focused transducer(V605, Valpey Fisher, Hopkinton, MA, USA) with acenter frequency of 49 MHz and a relative bandwidth of84% provided a spatial resolution of approximately 23�m. The samples prepared for SAM measurements werecompletely immersed in a temperature-controlled tankfilled with distilled degassed water at 25°C. Samplesurfaces were placed in the focal plane of the transducerand C-scans were acquired, where for each scannedpoint, the entire pulse echo signal was stored (Fig. 1).The spatial increment between two adjacent scan pointswas set to 20 �m.
(b) Impedance calibration and evaluation. The max-imum spatial resolution is achieved if the sample surfacecoincides with the focal plane of the transducer. For thisconfocal measurement set-up, all parts of the incomingspherical wave front are in phase and plane-wave prop-agation in the direction of the sound field axis can beassumed. For an infinite homogeneous half space, thereflected amplitude is directly proportional to the reflec-tion coefficient (Hirsekorn et al. 1995, 1996) and canbe converted into a value of the acoustic impedanceZ � �cp, where � is the mass density and cp is thecompressional wave velocity (1 rayl � kg m�2 s�1)(Meunier et al. 1991; Raum 2003; Raum et al. 2003;
Shieh et al. 1995; Zimmerman et al. 1994). Homoge-neous reference materials were used for the impedancecalibration and defocus correction, as described else-where (Raum et al. 2004). Briefly, for the C-scan data,the amplitudes of the Hilbert-transformed envelope sig-nal were defocus-corrected using a time-of-flight (TOF)-dependent correction function, converted into reflectioncoefficients R and, finally, into values of the acousticimpedance Z using the relation:
R �Z2 � Z1
Z2 � Z1, (2)
where Z1 and Z2 are the acoustic impedances in thecoupling fluid and in the sample, respectively.
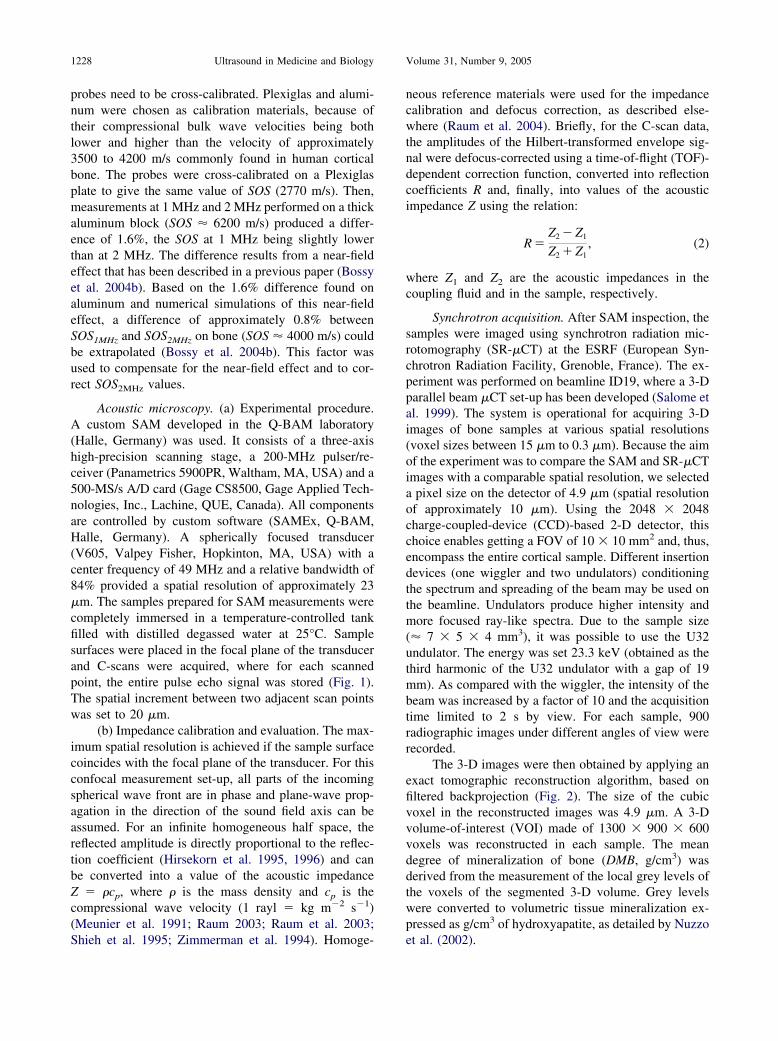
Synchrotron acquisition. After SAM inspection, thesamples were imaged using synchrotron radiation mic-rotomography (SR-�CT) at the ESRF (European Syn-chrotron Radiation Facility, Grenoble, France). The ex-periment was performed on beamline ID19, where a 3-Dparallel beam �CT set-up has been developed (Salome etal. 1999). The system is operational for acquiring 3-Dimages of bone samples at various spatial resolutions(voxel sizes between 15 �m to 0.3 �m). Because the aimof the experiment was to compare the SAM and SR-�CTimages with a comparable spatial resolution, we selecteda pixel size on the detector of 4.9 �m (spatial resolutionof approximately 10 �m). Using the 2048 � 2048charge-coupled-device (CCD)-based 2-D detector, thischoice enables getting a FOV of 10 � 10 mm2 and, thus,encompass the entire cortical sample. Different insertiondevices (one wiggler and two undulators) conditioningthe spectrum and spreading of the beam may be used onthe beamline. Undulators produce higher intensity andmore focused ray-like spectra. Due to the sample size(� 7 � 5 � 4 mm3), it was possible to use the U32undulator. The energy was set 23.3 keV (obtained as thethird harmonic of the U32 undulator with a gap of 19mm). As compared with the wiggler, the intensity of thebeam was increased by a factor of 10 and the acquisitiontime limited to 2 s by view. For each sample, 900radiographic images under different angles of view wererecorded.
The 3-D images were then obtained by applying anexact tomographic reconstruction algorithm, based onfiltered backprojection (Fig. 2). The size of the cubicvoxel in the reconstructed images was 4.9 �m. A 3-Dvolume-of-interest (VOI) made of 1300 � 900 � 600voxels was reconstructed in each sample. The meandegree of mineralization of bone (DMB, g/cm3) wasderived from the measurement of the local grey levels ofthe voxels of the segmented 3-D volume. Grey levelswere converted to volumetric tissue mineralization ex-pressed as g/cm3 of hydroxyapatite, as detailed by Nuzzo
et al. (2002).
Axial transmission and tissue elasticity ● K. RAUM et al. 1229
Image reconstruction and parameter extraction.Several steps were necessary to ensure site-matchedanalysis of the SAM and SR-�CT images. Each 3-Dreconstructed SR-�CT volume was sequentially rotatedaround the x and y axes to ensure that the cross-sectionsurface scanned with the acoustic microscope was par-allel to the x-y plane (Fig. 2). Then, mean DMB andporosity were calculated for subsequent z slices selectedat increasing depths below the bone boundary. It can beseen, in Fig. 3, that, because of the partial volume effect,both parameters gradually increase or decrease at theboundary. The first slice below the surface for which asteady-state was reached, was used for further analysis.Then, tissue was separated from the Haversian canals byusing threshold masks (Raum et al. 2004). Thresholdswere set to the mean of tissue and noise level (DMB:0.6 g/cm3; Z: 5 Mrayl). From these binary images, thestructural parameter Haversian canal density N.Ca/Ar(number of detected canals N.Ca within the selectedcortical bone area Ar, 1/mm2), porosity Po (ratio betweenthe area covered by the Haversian canals to the totalselected bone area, %) and median canal diameterCa.Dm (the equivalent diameter was determined fromthe area of the individual canals, �m) were extracted.
For mineral density and impedance estimation, thebinary masks were eroded using a disk with a radius of twopixels (40 �m) for the SAM and one pixel (4.9 �m) for theSR-�CT images. This procedure ensured exclusion ofboundary pixels for which DMB or Z values are artificiallyreduced by the partial volume effect. For the remainingpixels, the mean, median, SD and standard error weredetermined. All structural and tissue parameters were eval-uated in the anterior (A) and posterolateral (PL) regions, forwhich axial transmission SOS measurements have beenperformed previously. These regions were further dividedinto a fraction close to the periosteum Ps (approximatelyone quarter of the total cortical thickness, ranging between
Fig. 2. 3-D volume reconstruction of a posterolateral sectionimaged by SR-�CT. Each volume data set was sequentiallyrotated around the x and y axis until the upper cross-sectionsurface, which was scanned by SAM before, was parallel to the
x-y plane.
0.2 mm and 0.5 mm), and a remaining fraction bounded by
the endosteum Es (Fig. 1). In addition, the analysis was alsoperformed on the outer 1-mm thick cortical layer, becauseaxial transmission SOS (1 MHz) reflects preferentially thebone properties in the periosteal region of approximately 1mm in depth, as shown by the finite difference simulationresults (Bossy et al. 2004b). All ROIs were selected man-ually. Cortical width (Ct.Wi, mm) was measured separatelyfor the A and PL regions in the SAM images at 10 locationsand averaged for each section.
Data analysisThe normality of the distributions was tested with
the Lilliefors test. The Bland and Altman method (Blandand Altman 1986), linear regression and Pearson corre-lation coefficients were used to compare structural pa-rameters from the SR-�CT and SAM. Linear regressionand Pearson correlation coefficients were used to studythe association between different bone structural or ma-terial properties. Differences of parameter estimationsbetween anterior and posterolateral regions were as-sessed using paired two-sided t-tests. For the parametercomparison between the Es, Ps and 1-mm subregions,two-way ANOVA (with the sample number as the sec-ond predictor variable) or nonparametric Kruskal–Wallistests (in cases of nonnormal distributions), followed bypost hoc multiple comparison Tukey tests were applied.Optimal combination of bone properties for predictingthe low frequency SOS (SOS1MHz and SOS2MHz) wereevaluated using multifactorial linear and nonlinear re-gression. All statistical computations were made usingthe Matlab statistics toolbox (The Mathworks Inc.,Natick, MA, USA).
Fig. 3. Slice selection for the SR-�CT surface cross-sectionreconstruction. Because of partial volume effect, slice at thesurface boundary (air/bone) exhibits decreased mean DMB andincreased Po values. The first slice for which parametersreached steady-state (—-) was used for further analysis. In theexample, selected slice corresponds to a layer approximately 9
�m below the surface.

1230 Ultrasound in Medicine and Biology Volume 31, Number 9, 2005
RESULTS
Structural parameter estimationN.Ca/Ar, Ca.Dm and Po estimations obtained from the
SR-�CT and SAM images were compared by linear regres-sion. For all parameters, the correlation was highly signif-icant (p � 0.0001), with a slope of one. Canal density wasslightly underestimated in the SAM images (N.Ca/ARSAM
� N.Ca/ArSR-�CT �2.05 mm�2, R2 � 0.62, RMSE � 2.31mm�2), but canal diameter and porosity were overestimated(Ca.DmSAM � Ca.DmSR-�CT� 16 �m, R2 � 0.68, RMSE� 6.83 �m; PoSAM � PoSR-�CT � 1.94%, R2 � 0.73,RMSE � 1.82%). The offsets are within or close to the SDsof the regressions and remain independent of the estimatedmean values. However, for further structural analysis, theSR-�CT estimates were used. N.Ca/Ar was not correlatedwith porosity, but appeared to determine the lower bound(Fig. 4). Porosity was correlated with the square of theHaversian canal diameter (R2 � 0.66, p � 0.0001).
Anatomic variationsThe comparison between the parameter estimates
for the Es, Ps and outer 1-mm region is summarized inTable 1. The acoustic impedance was significantly higherin the Es region compared with the Ps region. Thehighest Haversian canal density was observed in the1-mm layer. The porosity varied significantly between alldifferent regions, with the highest values in the Es re-gion, the lowest values in the Ps region and intermediatevalues in the 1-mm layer. The canal diameter decreasedfrom the Es to the Ps region. No differences of the degreeof mineralization were observed between Es and 1-mmregions. The minor increase in the Ps part was notstatistically supported.
Between the anterior and posterolateral regions,
Fig. 4. Relation between Haversian canal density N.Ca/Ar andporosity Po. N.Ca/Ar was not correlated with Po, but deter-
mined the lower bound for the tissue porosity.
there were no significant structural differences, but there
was a modest difference in Z for the Ps and outer 1-mmregions (Table 2).
Univariate regressionCortical width was significantly correlated with the
SOS1MHz (r � 0.56, p � 0.01), but not with SOS2MHz.Further correlations were found between SOS and
Table 1. Estimated structural and tissue properties in theendosteal, periosteal and in the 1-mm outer cortical regions
(mean and SD)
Endosteal Periosteal 1 mm
DMB (g/cm3) 1.13 � 0.03 1.14 � 0.02 1.13 � 0.02Z (Mrayl) 8.2 � 0.5 8.0 � 0.6 8.1 � 0.5
N.Ca/ArSR-�CT (1/mm2) 10.7 � 3.4 11.2 � 4.6 12.4 � 3.7
N.Ca/ArSAM (1/mm2) 9.9 � 3.1 8.0 � 4.1 11.7 � 3.2
PoSR-�CT (%) 6.2 � 2.6 2.3 � 0.9 3.6 � 1.5
PoSAM (%) 8.5 � 3.3 3.0 � 1.7 6.3 � 2.1
Ca.DmSR-�CT (�m) 59 � 10 44 � 10* 48 � 6
Ca.DmSAM (�m) 74 � 10 56 � 16* 65 � 11
Significant differences (two-way ANOVA followed by post hocmultiple comparison Tukey test, p � 0.05) are indicated with connec-tive bars.
* Not normally distributed (Lilliefors test, p � 0.05), Kruskal–Wallis test was used.
Table 2. Estimated structural and tissue properties in theanterior and posterolateral regions (mean and SD)
Anterior Posterolateral
SOS1MHz (m/s) 3933 � 102 3905 � 88SOS2MHz (m/s) 3995 � 86 3984 � 78DMBEs (g/cm3) 1.13 � 0.02 1.14 � 0.02DMBPs (g/cm3) 1.14 � 0.03 1.15 � 0.01DMB1mm (g/cm3) 1.13 � 0.03 1.14 � 0.02ZEs (Mrayl) 8.3 � 0.5 8.2 � 0.5ZPs (Mrayl) 8.2 � 0.6 7.8 � 0.5*Z1mm (Mrayl) 8.2 � 0.5 8.0 � 0.6*N.Ca/ArEs (1/mm2) 10.2 � 3.3 11.2 � 3.7N.Ca/ArPs (1/mm2) 11.7 � 4.6 10.6 � 4.8N.Ca/Ar1mm (1/mm2) 12.1 � 3.9 12.7 � 3.7PoEs (%) 6.4 � 2.7 6.0 � 2.6PoPs (%) 2.5 � 0.7 2.0 � 1.0Po1mm (%) 3.8 � 1.6 3.3 � 1.3Ca.DmEs (�m) 62 � 8 56 � 11Ca.DmPs (�m) 46 � 13† 41 � 5Ca.Dm1mm (�m) 50 � 7 46 � 5Ct.Wi (mm) 1.9 � 0.5 1.9 � 0.6
The subscripts Es, Ps and 1mm indicate that the correspondingparameters have been derived in the endosteal, periosteal and 1-mmthick outer cortical layer, respectively. † Not normally distributed (Lil-
liefors test, p � 0.05). * Significant differences (paired t-test, p �0.05).
ents �i
5; ‡ �
Axial transmission and tissue elasticity ● K. RAUM et al. 1231
N.Ca/Ar in the Es part at both frequencies (1 MHz: r ��0.62, p � 0.004; 2 MHz: r � �0.47, p � 0.04) andwith N.Ca/Ar in the 1-mm region at 1 MHz (r � �0.53,p � 0.02), respectively. Moreover, weak but significantcorrelations were observed between DMB and Po for theEs (r � �0.46, p � 0.04) and Ps (r � �0.59, p � 0.006)regions, but not for the 1-mm sections. The acousticimpedance Z was neither correlated with the degree ofmineralization of bone (p � 0.13) nor with porosity (p �0.22).
Multivariate regressionBecause the number of cases was low (n � 19 after
pooling A and PL sections), the number of input vari-ables had to be restricted for the multivariate linearregression analysis. All parameter combinations withtwo or three input variables were tested for significanceof the standardized individual regression coefficients �.Significant models were only obtained for combinationsof cortical width, either with impedance (R2: 0.40 to0.52, p � 0.005), or with N.Ca/Ar or porosity as a thirdvariable (adjusted R2: 0.54 to 0.84, p � 0.0001). Thedifferent R2 correspond to the evaluated regions andfrequencies, respectively (see Tables 3 and 4). The high-est R2 and lowest RMSE values were obtained withparameters determined in the Ps region, followed by the1-mm region. The parameter sets from the Es regionproduced either the lowest R2 or insignificant models.The R2 for the 2-MHz models were generally lowercompared with the 1-MHz models.
Table 3. Multivariate linear predicti
SOS1MHz RegionIntercept(ms�1)
Ct.Wi, Z Es 2957 0Ct.Wi, Z Ps 2987 0Ct.Wi, Z 1 mm 2848 0Ct.Wi, Z, N.Ca/Ar 1 mm 3049 0Ct.Wi, Z, Po Ps 2858 1
The table shows the model constant, standardized regression coefficiR2 and RMSE of the model (significance level p: * � 0.05; † � 0.00
Table 4. Multivariate linear predicti
SOS2MHz RegionIntercept(ms�1)
Ct.Wi, Z Es 3006 0Ct.Wi, Z Ps 3090 0Ct.Wi, Z 1 mm 2932 0Ct.Wi, Z, N.Ca/Ar Ps 3111 0Ct.Wi, Z, Po Ps 2997 0
The table shows the model constant, standardized correlation coefficients �i
R2 and RMSE of the model (significance level p: * � 0.05; † � 0.005; ‡ �
Although both tissue elasticity (represented by Z)and porosity can be assumed to alter the low-frequencypropagation velocity in a linear or close to linear way(Bossy et al. 2004b; Sakata et al. 2004), the width-dependence is caused by a change of the nature of thefirst arriving signal from a compression mode (velocitycp � 4000 m/s) to the first symmetric Lamb mode S0
(velocity cS0 � 3650 m/s). A plot of SOS as a function ofCt.Wi/� (where � is the wavelength of the compressionalmode) is shown in Fig. 5.
As predicted by finite difference simulations(Bossy et al. 2004b), this dependency is nonlinear. It isintuitive that any linear model for Ct.Wi would predictinfinite SOS estimates, if Ct.Wi is increased far beyondthe evaluated range. The model was, therefore, mod-ified assuming a linear-dependence of the compres-sional wave velocity cp on Z and porosity and anonlinear-dependence on the cortical width. The lattershould decrease the estimated velocity SOS continu-ously from cp for Ct.Wi � � to cS0 for Ct.Wi �� �,e.g.,
SOS � B1G�B2
Ct.Wi
� � · cP(Z, PO) � B0, (3)
where G() is a function that describes the width-depen-dence of SOS. Among other evaluated functions, the bestapproximation of this nonlinear behavior was obtainedusing a hyperbolic tangent function:
dels for the 1-MHz SOS estimation
�2 �3 R2RMSE(ms�1)
0.48* – 0.44† 69.80.54* – 0.50† 65.60.57† – 0.52† 64.50.53* �0.34* 0.61† 58.10.67‡ �0.62‡ 0.84‡ 37.8
(in the order as the parameters appear in the first column), the adjusted0.0001).
dels for the 2-MHz SOS estimation
�2 �3 R2RMSE(m/s)
0.62* – 0.40† 62.50.66† – 0.45† 60.00.71† – 0.48† 57.90.67† �0.33* 0.54† 54.50.77‡ �0.51† 0.65‡ 47.5
on mo
�1
.78†
.78†
.83†
.71†
.10‡
on mo
�1
.66†
.67†
.73†
.71†
.93‡
(in the order as the parameters appear in the first column), the adjusted0.0001).

1232 Ultrasound in Medicine and Biology Volume 31, Number 9, 2005
SOS � tanh�BCt.Wi
Ct.Wi
� �(BZ · Z � BPo · PO � B1) � B0,
(4a)
where BCt.Wi, Bz, BPo and B0 are the regression coeffi-cients. The term:
tanh�BCt.Wi
Ct.Wi
� �B1 (4b)
did not have a significant impact in the regression andwas, therefore, withdrawn. The final model:
SOS � BZ tanh�BCt.Wi
Ct.Wi
� �Z
� BPo tanh�BCt.Wi
Ct.Wi
� �PO � B0 (5)
is not restricted to a single frequency and allowed thepooling of the 1- and 2-MHz data. Two-parameter re-gressions were performed with a fixed coefficient BCt.Wi
and the best predictive variables APs and PoPs. BCt.Wi wasthen varied until the residuals of the model becameindependent of the ratio Ct.Wi/�. The final model was
Fig. 5. SOS1MHz and SOS2MHz as a function of cortical width-to-wavelength ratio (�1MHz � 4 mm, �2MHz � 2 mm). Thedependency obtained by finite difference simulations is super-
imposed (from Bossy et al. 2004b).
Table 5. Nonlinear prediction model, eqn (4), with absocoefficients (n � 38, R2 � 0.69, p � 1e-5, RMSE � 5
parameter were obtaine
B0
(m · s�1) (
Bi 3530 � 49� –Partial corr. –Semipartial corr. –
p – �1highly significant (R2 � 0.69, p � 1e-5, RMSE � 51.8m/s). All observations were within the 95% predictionbounds and the residuals were normally distributed. Theregression coefficients are summarized in Table 5. Anal-ysis of the semipartial correlation coefficients indicatesthat, after controlling for the effects of porosity, 70% ofthe remaining variance is still explained by variations ofZ. For a width larger than the wavelength and meanvalues for impedance and porosity (Zperi � 8 Mrayl,Poperi � 2.26%), the predicted compressional velocity(Ct.Wi �� �) is 4044 � 49 m/s. In this case, the modelpredicts an increase of 79 m/s/Mrayl and a decrease of 52m/s % of porosity. The variation of SOS as a function ofCt.Wi is shown in Fig. 6. At a width-to-wavelength ratioCt.Wi/� � 0.35, the estimated sound velocity decreasedby 5%. Moreover, the slopes of Z and porosity depen-dencies become dependent on Ct.Wi/�.
DISCUSSION
In the present study, we investigated, for the firsttime, the relationship between SOS measured by low-
Fig. 6. Cortical width dependence, ( · · · · ) prediction bounds,of estimated velocities at 1 and 2 MHz for mean impedance (Z
� 8 Mrayl) and porosity (2.26%).
i), standardized (�), partial and semipartial correlation/s, p for the individual parameters in the last row). All
the periosteal region.
BZ
· Mrayl�1)BPo
(m · s%�1) BCt.Wi
� 9 �52 � 12 2.01.01 �0.48 –0.842 �0.596 –0.839 �0.399 –
lute (B1.8 md from
m · s�1
79
0�5 �10�4 –

Axial transmission and tissue elasticity ● K. RAUM et al. 1233
frequency bidirectional axial transmission and micro-structural and elastic cortical bone properties determinedusing high-resolution SR-�CT and SAM, respectively.Impedance images indicate that the resolution of theacoustic imaging system was suitable to resolve themajority of the Haversian canals. Only very small canals(Ca.Dm � 25 �m) and osteocyte lacunae could not beseparated from the bone tissue. The comparison of struc-tural parameter estimates from SAM images with thosefrom regional matched SR-�CT images reveals small butsystematic offsets for all evaluated parameters. Althoughthe failure to detect the smallest canals can be attributedto the physical resolution limit of the 50-MHz trans-ducer, the spatial sampling rate (pixel size: 20 � 20�m2) prohibits a higher accuracy of area measurements.This presumably led to the overestimation of canal di-ameter and porosity. Data acquisition with a smallerspatial increment or improved image processing (e.g.,interpolation before parameter extraction) might help toimprove the accuracy without the necessity of increasingthe ultrasonic frequency. Nevertheless, most of the tissuecould be reliably separated from the Haversian canals,which allowed study of the individual contributions ofstructural and intrinsic elastic tissue properties to thesound velocity measured in bidirectional axial transmis-sion.
The use of bone samples from previous studiesrequired prolonged storage at �20 °C, as well as severalcycles of freezing and thawing. This procedure does notalter the elastic properties of the tissue (Linde and So-rensen 1993; Pelker et al. 1984). The samples wereintentionally defatted after SAM inspection because itcauses a stiffening of the tissue (Linde and Sorensen1993). However, the degree of mineralization of tissue ispresumably not altered by this procedure.
Porosity, degree of mineralization and BMD havebeen determined to be predictive parameters for the SOS(Bossy et al. 2004a, 2004b, 2004c; Lee et al. 1997;Sievanen et al. 2001). For example, significant correla-tions between SOS measured in vivo at 1.25 MHz andvolumetric BMD were reported by Sievanen et al.(2001), both at the tibia (R2 � 0.29, p � 10�3) and at theradius (R2 � 0.34, p � 10�3). In an in vitro study, Bossyet al. (2004c) found that approximately 60% of thevariance of SOS (at 1 MHz) in human radius was ex-plained by BMD or, equivalently, by a combination ofdegree of mineralization of bone and porosity. Moreover,Bossy et al. (2004b, 2004c) have shown that the proper-ties of a thin cortical layer close to the periosteumcontribute more strongly to the axial wave propagationvelocity compared with properties averaged over thecortex. However, the correlation coefficients R2 betweenSOS and BMD obtained for the studies conducted in the
MHz range are between 0.3 and 0.57, suggesting addi-tional influences not being assessed with the appliedmethods.
The predominant contribution of the subperiosteallayer on SOS was confirmed in this study. For almost allmodels, R2 was highest when structural and impedancevalues were chosen from this region. In contradiction tothe previous report (Bossy et al. 2004b), however, degreeof mineralization of bone was not a significant predictorof SOS. The discrepancy between both studies could becaused by several factors. First, the 10-sample subsetmight have been insufficient to reach the significancelevel obtained in the 39-sample population of the previ-ous study (R2 � 0.38, p � 10�4). Second, Bossy et al.(2004b) used a simple threshold to segment SR-�CTimages obtained with a lower spatial resolution (approx-imately 20 �m). It is likely that differences in the spatialresolution and segmentation procedure might have re-sulted in differences in degree of mineralization of boneestimation in both studies. This hypothesis is supportedby the finding (Bossy et al. 2004c) that the correlation ofSOS with volumetric BMD (including pores) is consid-erably higher (R2 � 0.57, p � 10�5) than the correlationwith tissue mineralization degree alone (R2 � 0.38, p �10�4).
Interestingly, the acoustic impedance was found tobe a predominant determinant of SOS. After compensa-tion for the nonlinear dependence of SOS on Ct.Wi andcontrolling for the effects of porosity (semipartial corre-lation), Z explained 70% of the remaining variability ofSOS. Considering that the acoustic impedance is a strongpredictor of bone elasticity (Bumrerraj and Katz 2001;Katz and Meunier 1997; Meunier et al. 1991; Raum2003), it can be inferred from our study that elasticity isalso a strong predictor of low-frequency SOS. Becausetissue elasticity is not only determined by the degree ofmineralization, but also by many other factors (e.g.,collagen cross-links, size and composition of mineralcrystals and anisotropy), Z appears to be a better indica-tor for it than the degree of mineralization of bone.Further studies may wish to gauge changes in tissueelasticity (using acoustic microscopy) and their effect onaxial transmission SOS against well-characterized de-fects in bone material, as can be seen in various bonediseases or in small animal models.
The dependence of SOS on intracortical porosity inthe model (�52 � 12 m · s�1 · %�1; Ct.Wi �� �) isgreater than the value predicted by Bossy et al. (2004c)(�24 � 11 m · s�1 · %�1; Ct.Wi � 2.1 � 0.5 mm). Forthe 1-MHz data and the mean value of Ct.Wi � 1.94 mmreported here, the predicted slope is �39 � 9m · s�1 · %�1. Moreover, it should be noted that theslope obtained from finite difference simulations (Bossyet al. 2004b) was slightly nonlinear, having a steeper
slope for low porosity values (e.g., �28 m · s�1 · %�1
1234 Ultrasound in Medicine and Biology Volume 31, Number 9, 2005
for Po � 0 to 7% vs. �20 m · s�1 · %�1 for Po � 0 to15%). These findings are consistent within the 95%confidence intervals.
The proposed model describes axial transmissionSOS (the velocity of the first arriving signal) in the wholecortical thickness range as a function of its microstruc-tural and elastic tissue properties. Because it is not re-stricted to a single frequency, it can be applied to allcurrently available axial transmission devices. Moreover,the Ct.Wi/� ratio in the model could be used with mul-tifrequency approaches, to assess cortical thickness andeffective elastic tissue properties (combination of tissueelasticity and porosity) separately. We hypothesize thatthese properties are strongly associated with bonestrength.
The small number of specimens, as well as thenarrow age range of the donors, is a limitation of thisstudy. We tried partly to compensate for this limitationby the use of both male and female samples, by theselection of several ROIs for each sample and by poolingthe measurements performed at 1 and 2 MHz. However,the results need to be confirmed on a larger samplepopulation with a wide range of values for each of theestimated parameters.
Although SOS is accurately predicted for the purecompressional propagation mode (Ct.Wi �� �), as wellas for the nonlinear transition zone (Ct.Wi � �/2), themodel becomes independent of elastic and structuralproperties, if the cortical width approaches zero (e.g.,pure guided propagation mode). Incorporating preciseprediction of the guided propagation modes, includingtissue anisotropy, will be subject of future work.
The internationally agreed upon definition of os-teoporosis (Consensus Development Conference1993) acknowledges the notion that, in diseased pa-tients, there is less bone and an alteration in its mi-croarchitecture, but implicitly assumes that the intrin-sic material “quality” of the remaining bone tissue isnormal. This is a simplified view of a more complexsituation, in which different physicochemical or com-positional factors influencing bone quality are alsosubject to modifications during ageing (Zioupos 2001)or during bone metabolic diseases. These factors con-tribute to tissue elasticity and to bone strength, butnone of them can be easily assessed macroscopicallyor in vivo. In contrast, elasticity can be assessed usingUS-based techniques. Low-frequency US is perfectlyappropriate to probe structural elasticity, whereashigh-frequency US has the capability directly to probematerial elasticity at the tissue level. The novelty ofthe experimental results presented here is precisely toidentify the impact of tissue elasticity on macroscop-
ically determined speed of sound.Acknowledgements—The authors are grateful for the financial supportby the DAAD PPP program (#D/0122910), the Deutsche Forschungs-gemeinschaft (grant RA1380/1-1) and the MAE program PAI PRO-COPE (04544UM). One of the authors (K. Raum) acknowledges sup-port from CNRS (Poste Chercheur Associé).
REFERENCES
Bland JM, Altman DG. Statistical methods for assessing agreementbetween two methods of clinical measurement. Lancet 1986;1:307–310.
Bossy E, Talmant M, Defontaine M, Patat F, Laugier P. Bidirectional axialtransmission can improve accuracy and precision of ultrasonic velocitymeasurement in cortical bone: A validation on test materials. IEEETrans Ultrason Ferroelec Freq Control 2004a;51:71–79.
Bossy E, Talmant M, Laugier P. Effect of bone cortical thickness onvelocity measurements using ultrasonic axial transmission: A 2Dsimulation study. J Acoust Soc Am 2002;112:297–307.
Bossy E, Talmant M, Laugier P. Three-dimensional simulations ofultrasonic axial transmission velocity measurement on cortical bonemodels. J Acoust Soc Am 2004b;115:2314–2324.
Bossy E, Talmant M, Peyrin F, et al. An in vitro study of the ultrasonicaxial transmission technique at the radius. 1 MHz velocity mea-surements are sensitive to both mineralization and intracorticalporosity. J Bone Min Res 2004c;19:1548–1556.
Bumrerraj S, Katz JL. Scanning acoustic microscopy study of humancortical and trabecular bone. Ann Biomed Eng 2001;29:1034–1042.
Consensus Development Conference. Am J Med 1993;95:S1–S78.Fan Z, Swadener JG, Rho JY, Roy ME, Pharr GM. Anisotropic properties
of human tibial cortical bone as measured by nanoindentation. J Or-thop Res 2002;20:806–810.
Foldes AJ, Rimon A, Keinan DD, Popovtzer MM. Quantitative ultra-sound of the tibia: A novel approach for assessment of bone status.Bone 1995;17:363–367.
Gluer CC, Eastell R, Reid DM, et al. Association of five quantitativeultrasound devices and bone densitometry with osteoporotic verte-bral fractures in a population-based sample: The OPUS Study.J Bone Miner Res 2004;19:782–793.
Hans D, Dargent-Molina P, Schott AM, et al. Ultrasonographic heelmeasurements to predict hip fracture in elderly women: TheEPIDOS prospective study. Lancet 1996;348:511–514.
Hasegawa K, Turner CH, Burr DB. Contribution of collagen andmineral to the elastic anisotropy of bone. Calcif Tissue Int 1994;55:381–386.
Hasegawa K, Turner CH, Recker RR, Wu E, Burr DB. Elastic prop-erties of osteoporotic bone measured by scanning acoustic micros-copy. Bone 1995;16:85–90.
Hirsekorn S, Pangraz S, Weides G, Arnold W. Measurement of elasticimpedance with high spatial resolution using acoustic microscopy.Appl Phys Lett 1995;67:745–747.
Hirsekorn S, Pangraz S, Weides G, Arnold W. Erratum: Measurementof elastic impedance with high spatial resolution using acousticmicroscopy. Appl Phys Lett 1996;69:2138.
Hoffler CE, Moore KE, Kozloff K, et al. Heterogeneity of bonelamellar-level elastic moduli. Bone 2000;26:603–609.
Jamsa T, Rho JY, Fan Z, et al. Mechanical properties in long bones ofrat osteoporotic mutations. J Biomech 2002;35:161–165.
Katz JL, Meunier A. Scanning acoustic microscope studies of theelastic properties of osteons and osteon lamellae. J Biomech Eng1993;115:543–548.
Katz JL, Meunier A. Scanning acoustic microscopy of human andcanine cortical bone microstructure at high frequencies. Stud HealthTechnol Inform 1997;40:123–137.
Kundu T. Ultrasonic nondestructive evaluation: Engineering and bio-logical material characterization. Boca Raton, FL: CRC Press,2003.
Lang T, Augat P, Majumdar S, Ouyang X, Genant HK. Noninvasive
assessment of bone density and structure using computed tomog-raphy and magnetic resonance. Bone 1998;22:149–153.
Axial transmission and tissue elasticity ● K. RAUM et al. 1235
Laugier P, Droin P, Laval-Jeantet AM, Berger G. In vitro assessment ofthe relationship between acoustic properties and bone mass densityof the calcaneus by comparison of ultrasound parametric imagingand quantitative computed tomography. Bone 1997;20:157–165.
Lee SC, Coan BS, Bouxsein ML. Tibial ultrasound velocity measuredin situ predicts the material properties of tibial cortical bone. Bone1997;21:119–125.
Linde F, Sorensen HC. The effect of different storage methods on themechanical properties of trabecular bone. J Biomech 1993;26:1249–1252.
Lowet G, van der Perre G. Ultrasound velocity measurement in longbones: Measurement method and simulation of ultrasound wavepropagation. J Biomech 1996;29:1255–1262.
Meunier A, Katz JL, Christel P, Sedel L. A reflection scanning acousticmicroscope for bone and bone-biomaterials interface studies. J Or-thop Res 1988;6:770–775.
Meunier A, Riot O, Christel P, Katz JL. Characterization of localanisotropic elastic properties of femoral and tibial diaphysis usingacoustic transmission measurements and acoustic microscopy. In:Middleton TJ, Palotti G, eds. Interfaces in medicine and mechanicsII. London: Elsevier Applied Science, 1991:454–463.
Moilanen P, Nicholson PH, Karkkainen T, et al. Assessment of the tibiausing ultrasonic guided waves in pubertal girls. Osteoporos Int2003;14:1020–1027.
Nicholson PH, Moilanen P, Karkkainen T, Timonen J, Cheng S.Guided ultrasonic waves in long bones: Modelling, experiment andin vivo application. Physiol Meas 2002;23:755–768.
Njeh CF, Boivin CM, Langton CM. The role of ultrasound in theassessment of osteoporosis: A review. Osteoporos Int 1997;7:7–22.
Nuzzo S, Lafage-Proust MH, Martin-Badosa E, Boivin G, Thomas T,Alexandre C, Peyrin F. Synchrotron radiation microtomographyallows the analysis of three-dimensional microarchitecture and de-gree of mineralization of human iliac crest biopsy specimens:Effects of etidronate treatment. J Bone Miner Res 2002;17:1372–1382.
Nuzzo S, Peyrin F, Cloetens P, Baruchel J, Boivin G. Quantification ofthe degree of mineralization of bone in three dimensions usingsynchrotron radiation microtomography. Med Phys 2002;29:2672–2681.
Parfitt AM, Drezner MK, Glorieux FH, Kanis JA, Malluche H, MeunierPJ, Ott SM, Recker RR. Bone histomorphometry: Standardizationof nomenclature, symbols, and units. Report of the ASBMR Histo-morphometry Nomenclature Committee. J Bone Miner Res 1987;2:595–610.
Pelker RR, Friedlaender GE, Markham TC, Panjabi MM, Moen CJ.Effects of freezing and freeze-drying on the biomechanical prop-erties of rat bone. J Orthop Res 1984;1:405–411.
Pidaparti RM, Chandran A, Takano Y, Turner CH. Bone mineral liesmainly outside collagen fibrils: Predictions of a composite modelfor osteonal bone. J Biomech 1996;29:909–916.
Raum K. Ultrasonic characterization of hard tissues. In: Kundu T, ed.Ultrasonic nondestructive evaluation: Engineering and biologicalmaterial characterization. Boca Raton, FL: CRC Press, 2003:761–781.
Raum K, Brandt J. Simultaneous determination of acoustic impedance,longitudinal and lateral wave velocities for the characterization ofthe elastic microstructure of cortical bone. In: Cassereau D,Deschamps M, Laugier P, Zarembowitch A, eds. Proc World Con-
gress of Ultrasound 5. Paris: SFA, 2003b:321–324.Raum K, Jenderka KV, Klemenz A, Brandt J. Multi layer analysis—quantitative scanning acoustic microscopy for tissue characteriza-tion at a microscopic scale. IEEE Trans Ultrason Ferroelec FreqControl 2003;50:507–516.
Raum K, Reisshauer J, Brandt J. Frequency and resolution dependenceof the anisotropic impedance estimation in cortical bone usingtime-resolved scanning acoustic microscopy. J Biomed Mater Res2004;71A:430–438.
Rho JY, Currey JD, Zioupos P, Pharr GM. The anisotropic Young’smodulus of equine secondary osteones and interstitial bone deter-mined by nanoindentation. J Exp Biol 2001a;204:1775–1781.
Rho JY, Mishra SR, Chung K, Bai J, Pharr GM. Relationship betweenultrastructure and the nanoindentation properties of intramuscularherring bones. Ann Biomed Eng 2001b;29:1082–1088.
Rho JY, Zioupos P, Currey JD, Pharr GM. Variations in the individualthick lamellar properties within osteons by nanoindentation. Bone1999;25:295–300.
Roy ME, Nishimoto SK, Rho JY, et al. Correlations between osteo-calcin content, degree of mineralization, and mechanical propertiesof C. carpio rib bone. J Biomed Mater Res 2001;54:547–553.
Roy ME, Rho JY, Tsui TY, Evans ND, Pharr GM. Mechanical andmorphological variation of the human lumbar vertebral cortical andtrabecular bone. J Biomed Mater Res 1999;44:191–197.
Sakata S, Barkmann R, Lochmuller EM, Heller M, Gluer CC. Assess-ing bone status beyond BMD: Evaluation of bone geometry andporosity by quantitative ultrasound of human finger phalanges.J Bone Miner Res 2004;19:924–930.
Salome M, Peyrin F, Cloetens P, et al. A synchrotron radiation mic-rotomography system for the analysis of trabecular bone samples.Med Phys 1999;26:2194–2204.
Shieh SJ, Zimmerman MC, Langrana NA. The application of scanningacoustic microscopy in a bone remodeling study. J Biomech Eng1995;117:286–292.
Sievanen H, Cheng S, Ollikainen S, Uusi-Rasi K. Ultrasound velocityand cortical bone characteristics in vivo. Osteoporos Int 2001;12:399–405.
Swadener JG, Rho JY, Pharr GM. Effects of anisotropy on elasticmoduli measured by nanoindentation in human tibial cortical bone.J Biomed Mater Res 2001;57:108–112.
Takano Y, Turner CH, Burr DB. Mineral anisotropy in mineralizedtissues is similar among species and mineral growth occurs inde-pendently of collagen orientation in rats: Results from acousticvelocity measurements. J Bone Miner Res 1996;11:1292–1301.
Takano Y, Turner CH, Owan I, et al. Elastic anisotropy and collagenorientation of osteonal bone are dependent on the mechanical straindistribution. J Orthop Res 1999;17:59–66.
Turner CH, Chandran A, Pidaparti RM. The anisotropy of osteonalbone and its ultrastructural implications. Bone 1995;17:85–89.
Weiss S, Zimmerman MC, Harten RD, Alberta FG, Meunier A. Theacoustic and structural properties of the human femur. J BiomechEng 1998;120:71–76.
Zimmerman MC, Prabhakar A, Chokshi BV, Budhwani N, Berndt H.The acoustic properties of normal and imbedded bovine bone asmeasured by acoustic microscopy. J Biomed Mater Res 1994;28:931–938.
Zioupos P. Ageing human bone: factors affecting its biomechanicalproperties and the role of collagen. J Biomater Appl 2001;15:187–229.
Zioupos P, Currey JD. Changes in the stiffness, strength, and toughness
of human cortical bone with age. Bone 1998;22:57–66.Top Related
Copyright © 2022 FDOKUMEN

