


Bahasa
Halaman
Hukum


Assessing the impact of a marine
protected area on coastal livelihoods:
A case study from Pantar Island,
Indonesia
Ria Fitriana
Thesis submitted for the degree of Doctor Philosophy
Research Institute for the Environment and Livelihoods
Faculty of Engineering, Health, Science and the Environment
Charles Darwin University
March 2014

i
Abstract
Global concerns about the need to conserve marine ecosystems have resulted in rapid
growth in the establishment of formally protected marine conservation areas. The
ecological benefits of marine protected areas (MPAs) are relatively well recognised,
however, the extent to which MPAs improve the livelihoods of coastal peoples remains
subject to debate. The aim of this research was to assess the potential impacts of the
establishment of an MPA on coastal communities on Pantar Island, located in Nusa
Tenggara Timur Province, in the eastern region of Indonesia. A subsidiary aim was to
make practical recommendations that would minimise the negative impacts of an MPA
and optimise the benefits for local people.
An assessment of Indonesia’s experience in establishing MPAs shows that community
participation in the planning processes was encouraged but not comprehensive. Socio-
economic issues and concerns of communities have also not been adequately considered.
Application of a sustainable livelihood analysis framework demonstrated that marine-
related activities were a major part of the diversified livelihood portfolio of coastal
communities in and around Pantar Island. In addition, a wide range of activities were
undertaken by the coastal villages to survive and cope in vulnerable conditions. Value
chain analyses mapped selected marine products and identified the importance
of seafood for food security of Pantar Island and income, how local communities are part
of international market networks and ways to enhance the participation of local
communities in the market. The research found that an MPA would potentially have
negative short and long term impacts on coastal livelihoods which included changes to
the level of coastal use, displacement of people from fishing areas, loss of access and
rights to resources, and reduction in household income. Opportunities for strengthening
livelihoods were identified. The research demonstrates the need for future MPA
initiatives in Indonesia to improve the balance between conservation goals and
livelihood outcomes.

ii
Declaration
I hereby declare that the work within this thesis, now submitted for the degree of Doctor
of Philosophy of the Charles Darwin University, is the result of my own investigations,
and all references to ideas and work of other researchers have been acknowledged. I
certify that the work embodied in the thesis has not already been accepted for any
other degree, or submitted for any other degree.
Ria Fitriana
Date: 27 March 2014
iii
Acknowledgements
This thesis is a result of a long marathon that has been supported by many people. Some
of you have been with me for the entire path, and some of you have stepped in and out.
All your support helped me accomplished the final line.
First and far most, I am very grateful to my principle supervisor, Dr Natasha Stacey, for
having continuously provided unwavering support in every aspects of my life as a
graduate student, her stimulating questions and suggestions helped sharpening my
understanding to this research topic. I also thank to my co-supervisors Professor
Anthony Cunningham for his intellectual guidance and challenging ideas. I would like to
thank Professor Owen Stanley, co-supervisor, for his critical inputs to this manuscript.
I also wish to acknowledge the people in Pantar Island who kindly participated in
discussions, patiently responded to all of my exploration and willing to share their stories.
Many more provided help in observation and information. I specially thank to Masdian
Dore, Hader and Mama Tina in Kabir, H. Lawang in Baranusa, Papa Irma in Kayang and
Asri pu Papa in Marisa who generously allowed me to stay in their houses.
I would like to save special thank to my colleagues in WWF-Indonesia. Dr Cristina
Eghenter from Community Empowerment Working Group of WWF-Indonesia, for
lively discussions; Pipit for willing to respond my policy enquiry; Zakarias Atapada for
sharing experience in Alor, Ipinx and Taufik for being a resourceful person. In addition,
I would like to thank Johan Arifin from University Padjadjaran who was willing to be
my tutor about statistic. I would also like to thank to Rijani Razab who helped producing
map of Pantar. Thank you to Michelle Franklin who helped polishing the figures. Special
thanks to Helen Whittle for proofreading this thesis.
This research would have never been conducted without financial support from
Australian Leadership Awards Scholarships by the Australian Agency for International

iv
Development (ALA-AusAID). Additional funding to support my fieldwork, attend
international conferences, office and resources was provided by the Research Institute of
the Environment and Livelihoods (formally the School for Environmental Research),
Charles Darwin University.
Finally, to dear friends and family: thank you for all of your moral support.

v
Publication derived from this thesis Fitriana, R and Stacey, N. (2012). The Role of Women in the Fishery Sector of Pantar
Island, Indonesia. Asian Fisheries Science Special Issue. Asian Fisheries Society.
25S:159-175.
Papers presented at international conferences on this research
Fitriana, R. and Stacey, N. (2014). Seaweed Value Chain: Case Study in Pantar Island,
Eastern Indonesia. Presented at the International Institute of Fisheries Economics
& Trade (IIFET) Conference, Brisbane-Australia, 7-11 July 2014
Fitriana, R. and Stacey, N. (2014). A Value Chain Analysis of Fish Product: Case Study
from Pantar Island, Eastern Indonesia. Presented at the International Institute of
Fisheries Economics & Trade (IIFET) Conference, Brisbane-Australia, 7-11 July
2014
Fitriana, R. (2011). A value chain analysis of fish trade in Pantar Island, eastern
Indonesia. MARE Conference.
Fitriana, R. (2011). The role of women in the fishery sector in Pantar Island,
Indonesia. Gender in Aquaculture and Fisheries, 3rd Global Symposium.
Fitriana, R. (2009). Community participation in MPA establishment in Indonesia:
lessons for future initiatives.International Ocean Science, Technology and Policy
Symposium, World Ocean Conference.
Fitriana, R. (2009). Assessing the impact of marine protected area on livleihoods: a case
study of Pantar Islan, NTT Indonesia. Australia Indonesia Governance Research
Partnership, Young Scholars Workshop.

vi
Table of Contents
Abstract .............................................................................................................................. i Acknowledgements ...........................................................................................................iii Abbreviations and acronyms...........................................................................................xiii Chapter 1: Introduction................................................................................................1 1.1 Issues in Marine Protected Areas ..........................................................................3
1.1.1 Key factors in establishing marine protected area………………………..5 1.1.2 Contributions of MPAs to improving coastal livelihoods………………..6 1.1.3 Balancing conservation efforts and livelihoods…………………………10
1.2 Research Aims, Objectives and Questions……………………………………...11 1.3 Contribution of the Research……………………………………………………14 1.4 Structure of Thesis………………………………………………………………15 Chapter 2: Methodology ............................................................................................19 2.1 Overview of Research Design and Approach …………………………………..19 2.2 Sustainable Livelihood Approach as a Framework of Analysis………………...20
2.2.1 Origin and development of sustainable livelihood analysis…………….21 2.2.2 Definitions………………………………………………………………22 2.2.3 Assets …………………………………………………………………..24 2.2.4 Vulnerability context …………………………………………………..29 2.2.5 Transforming structures and processes…………………………………29 2.2.6 Livelihood strategies……………………………………………………29 2.2.7 Livelihood outcomes……………………………………………………30 2.2.8 Strengths of SLA………………………………………………………..33 2.2.9 Gaps in SLA…………………………………………………………….34
2.3 Value Chain Analysis as a Framework of Analysis…………………………….38 2.3.1 Steps in mapping the value chain……………………………………….40
2.4 Research Process and Data Collection Methods………………………………..43 2.4.1 Field research process …………………………………………………..43 2.4.2 Literature review………………………………………………………...48 2.4.3 Methods used to collect the data………………………………………...49 2.4.4 PRA……………………………………………………………………...53 2.4.5 Focus group discussions………………………………………………...55 2.4.6 Semi-structured interviews……….……………………………………..58 2.4.7 Marine product measurement…………………………………………...63 2.4.8 Marine product identification and locations found……………………..64 2.4.9 Household survey……………………………………………………….65 2.4.10 Observations…………………………………………………………….66 2.4.11 Triangulation…………………….………………………………………67 2.4.12 Data analysis…………………….………………………………………68 2.4.13 Research challenges……………………………………………………..70
Chapter 3: Pantar Island Context and Research Sites................................................73 3.1 Location, Climate and Marine Biodiversity of Pantar Island…………………...73
3.1.1 Administrative system and history……………………………………...76

vii
3.1.2 Small islands in Alor Strait……………………………………………...77 3.1.3 Cultural groups and languages of Pantar………………………………..78 3.1.4 Macro-economy of Pantar Island….…………………………………….79
3.2 Description of the Study Sites…………………………………………………..81 3.2.1 Geographical context……………………………………………………81 3.2.2 Administrative system…………………………………………………..83 3.2.3 History of settlements …………………………………………………..84 3.2.4 Demography and ethnicity………………………………………………85 3.2.5 Settlements, infrastructure and services………………………………...87
3.3 Summary………………………………………………………………………...93 Chapter 4: Community Involvement in the Establishment of MPAs in Indonesia....94 4.1 Introduction……………………………………………………………………...94 4.2 Methods…………………………………………………………………………95 4.3 Definition of Terms……………………………………………………………..98 4.4 Lessons Learned from Worldwide MPA Experiences………………………...104 4.5 Case Studies in Indonesia: Wakatobi NP, Bali Barat NP and Riung Nature
Reserve………………………………………………………………………...112 4.5.1 Policy and historical setting of community participation in Indonesia …………………………………………………………………………112 4.5.2 Characteristics of Wakatobi NP, Bali Barat NP and Riung Nature Reserve …………………………………………………………………………114 4.5.3 Results…………………………………………………………………121 4.5.4 Discussion……………………………………………………………...140
4.6 Conclusion……………………………………………………………………..152 Chapter 5: The Livelihoods of Coastal Communities on Pantar Island ..................157 5.1 Methods………………………………………………………………………..157 5.2 Livelihood assets………………………………………………………………159
5.2.1 Human assets…………………………………………………………..159 5.2.2 Natural Assets …………………………………………………………171 5.2.3 Physical Assets………………………………………………………...181 5.2.4 Financial Assets………………………………………………………..190 5.2.5 Social Assets…………………………………………………………...193 5.2.6 Community’s perception of their assets based on the selected marine
products………………………………………………………………..197 5.3 Vulnerability context…………………………………………………………..203 5.4 Transforming Structures and Processes……………………………………….211 5.5 Livelihood strategies…………………………………………………………..212 5.6 Livelihood outcomes…………………………………………………………..218
5.6.1 Cash income……………………………………………………………218 5.6.2 Wellbeing………………………………………………………………225 5.6.3 Food……………………………………………………………………229
5.7 Conclusion……………………………………………………………………..230

viii
Chapter 6: Marine Product Value Chains ................................................................232 6.1 Methods………………………………………………………………………..234 6.2 Value Chains of Marine Products……………………………………………...236
6.2.1 Fish product value chain……………………………………………….236 6.2.2 Seaweed value chain…………………………………………………...256 6.2.3 Sea cucumber value chain……………………………………………..266 6.2.4 Top shell value chain…………………………………………………..272
6.3 Discussion……………………………………………………………………...276 6.3.1 Core processes of the value chain……………………………………...276 6.3.2 Power and relationships between actors……………………………….278 6.3.2 Risks and benefits……………………………………………………...279
6.4 Strengthening community participation in the marine product value chains….281 6.4.1 Constraints to reduce loss and cost of the products……………………282 6.4.2 Upgrading the products………………………………………………...288
6.5 Conclusion……………………………………………………………………..291 Chapter 7: Potential Livelihood Implications and Opportunities from an MPA on Pantar Island…………………………………………………………………………...294 7.1 Pantar MPA within global and national marine conservation context …295
7.1.1 Durban Action Plan……………………………………………………295 7.1.2 Coral Triangle Initiative on Coral Reefs, Fisheries and Food
Security………………………………………………………………...296 7.2 Indonesia’s Recent Legal Framework for Establishing MPAs………………...298 7.3 Alor District Marine Conservation Area………………………………………306
7.3.1 Background to the Pantar Strait MPA…………………………………306 7.3.2 Alor District Marine Conservation Area………………………………309 7.3.3 NGO initiatives in Alor………………………………………………..311 7.3.4 Proposed zoning plan………………………………………………….314
7.4 Potential Changes in Livelihoods and Their Implications…………………….316 7.4.1 Livelihood impacts due to the zoning plan……………………………317 7.5 Approaches for Best Practices for Sustainable Livelihoods and Marine
Conservation in Pantar…………………………………………………………329 7.5.1 Recognition of fishers as the main stakeholder group…………………330 7.5.2 Participation of the main stakeholder groups in decision-making during
the establishment process……………………………………………...332 7.5.3. Prioritising local problems of marine resource sustainability…………334 7.5.4. Integration of local stakeholders, government and market…………….335 7.5.5 Reducing fishing efforts while improving the economic standard of living
of coastal communities………………………………………………...336 7.5.6 Adaptive management system…………………………………………337
7.6 Conclusion……………………………………………………………………..342 Chapter 8: Conclusion……………………………………………………………..344 8.1 Principal Findings……………………………………………………………...346 8.2 Main Contributions…………………………………………………………….357

ix
8.3 Practical Recommendation for MPAs in Indonesia……………………………359 8.3.1 Recommendations for local government………………………………360 8.3.2 Recommendations for national government…………………………...361 8.3.3 Recommendations for conservation practitioners……………………..362
8.4 Further Research……………………………………………………………….362 8.5 Final Comments………………………………………………………………..363 References….. ................................................................................................................364 Appendix A Semi structured interview to address question 1 of research proposal......413 Appendix B Guiding questions on marine product value chains for traders .................417 Appendix C The most frequently caught fish in the four study villages from December 2009 to May 2010 ..........................................................................................................421 Appendix D Descriptive statistic analysis of fish size ...................................................422 Appendix E Length of the most captured fish in cm (SL=standard length) recorded from December 2009 to May 2010 and length at first maturity .............................................459 Appendix F Household survey.......................................................................................463 Appendix G Household incomes ...................................................................................465 Appendix H The price of sea cucumbers that was used by traders................................466 Appendix I The decree of Bupati Alor number 6 of 2009 on the Alor District Marine Conservation Area..........................................................................................................467
List of Figures
Figure 1.1: Map of Indonesia showing the approximate location of Pantar Island .........12 Figure 1.2: Conceptual approach of the thesis .................................................................16 Figure 1.3: Relationship between chapters, research questions and objectives...............16 Figure 2.1: Sustainable livelihoods analysis framework..................................................23 Figure 2.2: The Core processes of a value chain for a marine product............................41 Figure 2.3: Photos of several examples of PRA tools used .............................................54 Figure 2.4: FGD in the villages........................................................................................56 Figure 2.5: Method in measuring fish length ..................................................................63 Figure 2.6: Measuring Tectus niloticus and fish ..............................................................64 Figure 3.1: Map of Pantar Island .....................................................................................74 Figure 3.2: Rainfall rate in Mali Meteorology Station, Kalabahi in Alor Island from 2004 to 2008..............................................................................................................................75 Figure 3.3: Languages in Alor and Pantar .......................................................................78 Figure 3.4: View of the four villages ...............................................................................82 Figure 3.5: Labuhan Bajo hamlet in Kabir village...........................................................88 Figure 3.6: Village of Blangmerang ................................................................................89 Figure 3.7: Village of Kayang..........................................................................................90 Figure 3.8: Village of Marisa on Kangge Island..............................................................91 Figure 3.9: Sole source of freshwater in Baranusa sub-district .......................................92 Figure 4.1: Method of data collection and analysis …………………………………..96 Figure 4.2: Map of Wakatobi National Park..................................................................116 Figure 4.3: Bali Barat National Park..............................................................................119 Figure 4.4: Map of Riung Nature Reserve .....................................................................120

x
Figure 5.1: Human assets …………………………………………………………161 Figure 5.2: Ker, the favoured fishing method by women ..............................................165 Figure 5.3: Women collect shells for household consumption in mangrove habitat in Kangge Island ................................................................................................................166 Figure 5.4: Fishing spots around Pantar Island..............................................................168 Figure 5.5: Location of mangrove, coral reefs and seagrass around Pantar Island.......172 Figure 5.6: Valuable sentigi, Phemphis acidula ............................................................173 Figure 5.7: Coral reefs at Rusa and Kambing Islands....................................................174 Figure 5.8: Measurement of marine product lengths .....................................................176 Figure 5.9: Selection of marine resources caught by the villagers in 2009 ...................180 Figure 5.10: Network of local transport in Pantar Island...............................................182 Figure 5.11: Several uses of boats .................................................................................183 Figure 5.12: Boats and fishing mehods..........................................................................185 Figure 5.13: Fishing-related activities based on household surveys (n=100)................188 Figure 5.14: Market in Baranusa where papalele from Blangmerang sold their fish ....189 Figure 5.15: The community’s perception on their assets regarding with selected marine products ..........................................................................................................................198 Figure 5.17: Annual principal expenditures of the four villages in Pantar Island .........226 Figure 5.18: Important foods for coastal communities ..................................................230 Figure 6.1: The value chain……………………………………………………………234 Figure 6.2: Value chain of halfbeak production in four villages in Pantar ....................238 Figure 6.3: Value chain of round scad from four villages in Pantar ..............................240 Figure 6.4: The value chain of coral trout, parrotfish and red snapper from four villages in Pantar .........................................................................................................................241 Figure 6.5: Value chain of eastern little tuna, skipjack tuna and trevally......................243 Figure 6.6: A papalele from Labuhan Bajo is slicing the fish in order to add value at Kabir market ..................................................................................................................244 Figure 6.7: Selling smoked and fresh fish by the road in Labuhan Bajo Hamlet ..........245 Figure 6.8: Sun-dried and smoked fish ..........................................................................248 Figure 6.9: Locations of markets and route of fish products in and out of Pantar Island........................................................................................................................................249 Figure 6.10: Papalele .....................................................................................................251 Figure 6.11: Barter process – the fish are put on the top of the peanuts and then the barter negotiations start at Weiriang market ............................................................................253 Figure 6.12: Seaweed export data from Indonesia.........................................................257 Figure 6.13: Value chain of seaweed production...........................................................258 Figure 6.14: Average price of seaweed in USD at export level from exporter countries........................................................................................................................................263 Figure 6.15: Price of seaweed in USD/kg at farmer level in Pantar from August 2008 to June 2010 .......................................................................................................................264 Figure 6.16: Value chain of sea cucumbers in Pantar from 2009-2010.........................267 Figure 6.17: Women clean sea cucumbers that were collected in a mangrove area in Lapang Island .................................................................................................................268 Figure 6.19: Sea cucumber (Thelenota ananas) at local traders in Pantar and China ...270 Figure 6.20: Value chain of top shell production from Pantar, 2009-2010 ...................272 Figure 6.21: Price of top shells per kilogram in Makassar and Kabir............................276

xi
Figure 6.22: Seaweed sun-dried on the ground in Marisa Village in 2010....................287 Figure 7.1: Legislation governing establishment of MPAs in Indonesia …………300 Figure 7.2: Map of Alor District Marine Conservation Area.........................................309 Figure 7.3: Map of proposed zoning plan of Alor District Marine Conservation Area.315
List of Tables
Table 2.1: Methods used to collect data on human assets ...............................................50 Table 2.2: Methods used to collect data on natural assets ...............................................50 Table 2.3: Methods used to collect data on physical assets .............................................51 Table 2.4: Methods used to collect data on financial assets ............................................51 Table 2.5: Methods used to collect data on social assets .................................................51 Table 2.6: Data collection methods on transforming structures and process, vulnerability context and livelihood strategies and outcomes...............................................................52 Table 2.7: Number of people and focus group discussions conducted in 4 villages .......57 Table 2.8: People interviewed about MPA experience in Indonesia and date of interview..........................................................................................................................................59 Table 2.9: People interviewed for mapping value chains of marine products .................62 Table 3.1: Production of food crops of Alor and Pantar in 2008.....................................80 Table 3.2: Area, distance to capital city, administrative system, and ethnicity of the four case study sites .................................................................................................................83 Table 3.3: Population of Kabir, Blangmerang, Kayang and Marisa villages ..................86 Table 4.1: Comparison of Arnstein and Pretty models of type of participation …103 Table 4.2: The characteristics of Norway coastal zone, Mabini Reserve and Marovo Lagoon reserve ...............................................................................................................104 Table 4.3: Characteristics of Wakatobi NP, Bali Barat NP and Riung Nature Reserve 115 Table 4.4: Stakeholder rankings.....................................................................................122 Table 4.5: Community’s role in the activities leading to the establishment of MPAs...129 Table 4.6: Social issues considered in MPA planning stages in three MPAs in Indonesia........................................................................................................................................132 Table 4.7: Economic issues considered in MPA planning stages in three MPAs in Indonesia ........................................................................................................................133 Table 5.1: Human assets in the four villages …………………………………………160 Table 5.2: Maritime-related activities segregated by gender in the four villages on Pantar Island..............................................................................................................................163 Table 5.3: Frequency distribution of length of the important fish captured considered by fishers .............................................................................................................................177 Table 5.4: Fishing equipment in the four villages..........................................................184 Table 5.5: Important events in the four villages ............................................................203 Table 5.6: Seasonal calendar for the four villages based on focus group discussions and field verification.............................................................................................................210 Table 5.7: Most common source of cash income in the four villages from main livelihood activities ........................................................................................................220

xii
Table 5.8: Cash income earnings of households in four villages in 2010......................224 Table 6.1: Main species fished and traded in Pantar …………………………………237 Table 6.2: Fish species from Pantar traded locally, regionally and internationally.......247 Table 6.3: Average selling price for fresh fish at village level in Pantar in 2009..........254 Table 6.4: Cost and margin of a trader selling halfbeaks in Kalabahi and Atapupu in 2009................................................................................................................................255 Table 6.5: Price differences for fresh fish species purchased by traders from Kupang/Makassar and village papalele .........................................................................256 Table 6.6: Number of kiosks and village traders ...........................................................259 Table 6.7: List of sea cucumber species collected in Pantar (December 2009 to May 2010) ..............................................................................................................................268 Table 6.8: Price differences of sea cucumber (white teat, H. fuscogilva) at exporter (Makassar) and village trader level in 2010...................................................................271 Table 6.9: Top shells sent to Makassar by a trader in Bana...........................................274 Table 6.10: Constraints expressed by fishers and village traders in four villages .........282 Table 7.1: MPAs handed over by the Ministry of Forestry to the Ministry of Marine Affairs and Fisheries…………………………………………………………………...301 Table 7.2: The process of the establishment of Alor District Marine Conservation Area........................................................................................................................................313 Table 7.3: Regulations governing activities in the Alor District Marine Conservation Area ................................................................................................................................316 Table 7. 4: Fishers from four villages in Pantar who will be impacted by the core zone restrictions ......................................................................................................................318 Table 7.5: Impacts of restricted zone on marine users and activities from four villages in Pantar .............................................................................................................................320 Table 7.6: Potential impacts on livelihoods due to displacement from fishing grounds by assets and outcomes .......................................................................................................321 Table 7.7: Fishery management tools and potential impacts .........................................339

xiii
Abbreviations and acronyms ATC Alkali treated cattonii (seaweed powder) Bappeda Badan Perencanaan Pembangunan Daerah (Planning Agency at District
level) Bapedalda Badan pengendalian dampak lingkungan daerah (Environmental Impact
Control Agency at District level) Bakorsurtanal Badan koordinasi survey dan pemetaan nasional BKSDA Balai Kelestarian Sumber Daya Alam (Natural Resource Conservation
Body) BPS Badan Pusat Statistik (Statistic office) CBD Convention on Biological Diversity CTI-CFF Coral Triangle Initiative on Coral Reefs, Fisheries and Food Security CTSP Coral Triangle Support Partnership CRMB Community Resource Management Board CDU-RIEL Charles Darwin University- the Research Institute of the Environment
and Livelihoods DFID Department for International Department FADs Fish Agregating Devices FAO Food and Agriculture Organisation of United Nations FGD Focus Group Discussions FKMPP Forum Komunikasi Masyarakat Peduli Pesisir (Communication Forum
for Coastal Care) GTZ German Organisation for Technical Cooperation HH Household HP Horsepower IFAD International Fund for Agricultural Development IUCN International Union for Conservation of Nature KKP Kementrian Kelautan dan Perikanan (Ministry of Marine Affairs and
Fisheries) MPA Marine Protected Area MC Moisture Content (for Seaweed) MT Metric Tonne NP National Park NGOs Non Government Organisations NPoA National Plan of Action for CTI-CFF NTT Nusa Tenggara Timur Province PRA Participatory Rural Appraisal PHKA Perlindungan Hutan dan Kelestarian Alam (Forest Protection and Nature
Conservation) PKK Pemberdayaan Kesejahteraan Keluarga (Family Welfare Movement) PLN Perusahaan Listrik Negara (State power)

xiv
PO Purchasing order RC Refined Carrageenan (for seaweed) RPoA Regional Plan of Action for CTI-CFF SD Sekolah Dasar (Primary School) SMP Sekolah Menengah Pertama (Junior High School) SMA Sekolah Menengah Atas (Senior High School) SPAGs Spawning Aggregation Areas SLA Sustainable Livelihood Approach SL Standard Length SRC Semi-refined carrageenan (for seaweed) TAC Total Allowable Catch TKI Tenaga Kerja Indonesia (Immigrant workers) UNDP United Nations Development Programme UNICEF the United Nations Children’s Fund VCA Value Chain Analysis WWF World Wide Fund for Nature

Chapter 1
Introduction
The view of Marisa village on Kangge Island in January 2010

1
Chapter 1: Introduction
Marine ecosystems and resources around the world are deteriorating due to human and
natural causes (MEA 2005; Halpern et al. 2008). Examples are the degradation of coral
reefs (Wilkinson 2004; Burke et al. 2002), the decreasing area of mangrove forest from
18.8 million hectares in 1980 to 15.2 million hectares in 2005 (FAO 2007), and the over-
fishing of commercial fishery stocks (Srinivasan et al. 2012; Swartz et al. 2010). The
Food and Agriculture Organization of the United Nations/FAO (2005) reported that 52%
of the 441 fishing stocks through the world were fully exploited, 17% of these fishing
stocks were over exploited and 7% were depleted. Myers and Worm (2003) reported that
the oceans had lost more than 90% of their large predatory fishes on a global scale. To
combat this, some scholars have suggested that fishing efforts needed to be reduced to
20-50% worldwide (Srinivasan et al. 2012).
Millions of people globally depend on marine resources to make a living (Allison and
Ellis 2001). Fish are an important source of protein in local diets and fishing-related
activities provide jobs and incomes (Allison and Ellis 2001; Pomeroy et al. 2004; FAO
and World Fish Centre 2008; FAO 2009). In particular, small-scale coastal fisheries
provide food security and are a source of cash income and provide other benefits to men
and women (Harrison 2000; Kronen 2002; Williams 2008; Teh et al. 2009; Walker and
Robinson 2009; Crawford et al. 2010; Weeratunge et al. 2010). Fish and marine products
also buffer people’s livelihoods during economic or environmental shocks (Bene et al.
2007; Nam and Bunthang 2011).
Marine resources also hold social and cultural values for people. In many cases, marine
resources are the foundations of people’s everyday lives, cultural identity and material
sustenance (McGoodwin, 1990; Maloney 1994; Johannes and Hviding 2000; Pollnac et
al. 2001; Thornburn 2000; Marschke 2005; Hviding 2006; Onyango 2011). Small-scale

Chapter 1. Introduction _______________________________________________________________________
2
fishing can be a risky occupation but fishers enjoy being independent and working
outdoors (Acheson 1981) and thus are sometimes resistant to changing to other
occupations (Pollnac et al. 2001; Cinner et al. 2009; Slater et al. 2013). The uncertain
conditions in which fishing activities take place influence the behaviour of fishers who
seek to reduce risk through ritual and magic (Acheson 1981) and through social ties
within the community (West and Brockington 2006). In the Pacific, customary
ownership systems for marine resources and their associated customary laws are
important features that protect kin who receive the most benefits and exclude outsiders
(Henley 2008; Hviding 1998; Kinch 2006; Aswani 2005; Cinner and Aswani 2007;
Tungale 2008; Foale and Manele 2004). In addition, maintaining strong social
relationships with middlemen also plays a role in reducing risk (Acheson 1981).
Given the widespread marine resource depletion and the need to maintain the benefits of
marine resources for people, sustaining viable fish stocks and ecosystems is important.
Global concerns about the need to conserve marine ecosystems have resulted in rapid
growth in the establishment of formally protected marine conservation areas. The total
area of protected ocean has risen by over 150% between 2003 until 2010 (Toropova et al.
2010). In 2010, there were approximately 5880 marine protected areas (MPAs), covering
over 4.2 million square kilometers of ocean (Toropova et al. 2010). In Indonesia, the size
of MPAs initiated by the Ministry of Marine Affairs and Fisheries (MMAF) covered 733
hectares in 2003 which had increased to around 15.7 million hectares in 2012 (MMAF,
2012). At the 2010 Convention on Biological Diversity (CBD) meeting in Nagoya,
targets were set and urgent actions were called for to halt the loss of biodiversity in order
to ensure that ecosystems were resilient and continue to provide essential ecosystem
services. The target included the conservation of 10% of global coastal and marine areas
through effectively and equitably managed programs by 2020 (Herkenrath and Harrison
2011). In the next section, I explore some of the current global debate and issues around
MPAs.

Chapter 1. Introduction _______________________________________________________________________
3
1.1 Issues in Marine Protected Areas
MPAs are areas of coastal land and water specifically designated to protect marine
natural resources and ecosystems. An MPA is defined as “any area of intertidal or sub-
tidal terrain, together with its overlying water and associated flora, fauna, historical and
cultural features, which has been reserved by law or other effective means to protect part
or all of the enclosed environment” (Kelleher 1999: xvii).
The primary goal of MPAs, as outlined by the International Union for the Conservation
of Nature (IUCN), is to conserve the biological diversity and productivity (including
ecological life support systems) of the oceans (Kelleher 1999). MPAs can also be used to
protect and rehabilitate damaged habitat, and as one of several fishery management tools.
If successful, MPAs provide sites for the restocking of the fish and shellfish population
and as refuges and breeding sites for marine species stocks (Horwood et al. 1998; Lotze
et al. 2006; Lockwood 2006; Marine Parks Authority of New South Wales 2008). MPAs
can also increase the size and diversity of fish in marine reserves (Halpern 2003;
Pomeroy and Viswanathan 2003; Guidetti and Claudet 2009).
Despite the reported high establishment costs of MPAs (McCrea-Strub et al. 2011),
recent studies identified that only 10-25% of MPAs in South-East Asia were effectively
managed or successful (Burke et al. 2002; White et al. 2005). Another study in 2010
found out that only 10-20% of the 500 MPAs in the Philippines were attaining their
objectives (Fernandez 2010). A recent worldwide study of 66 MPAs in 33 countries
conducted by Hargreaves-Allen et al. (2011) discovered that only 11% of MPAs
achieved their primary aim and only 12% fulfilled reef habitat protection despite this
being the most common aim. Fernandez (2010) reported that fishermen in the
Philippines believed their rights to fish on the fishing zone in MPA area were violated
and long term benefits were not realized while public sectors benefited from MPA
regardless of whether fishers complied or not. These findings indicate that many MPAs
still face significant challenges to achieving their objectives, conserving the marine
resources and strengthening the overall livelihoods of coastal communities.

Chapter 1. Introduction _______________________________________________________________________
4
MPAs are intended to regulate the exploitation of marine resources and manage the
users’ behaviours in relation to marine resource use (Acheson 1981; Hilborn 2007).
However, most of the MPAs worldwide have been established principally based on
marine habitat and biodiversity concerns (White et al. 1994; Kenchington et al. 2003;
Christie 2004; Scholz et al. 2004). Christie (2004) found that while biological success
was achieved in several marine reserves in South-East Asia, marine reserves could cause
social harm such as conflicts and economic and social dislocation for local fishers.
Strictly protected MPAs result in the removal of fishers from existing fishing grounds to
other fishing areas (West et al. 2006; Mascia and Claus 2008; Charles 2010; Sen 2010a;
Stevenson et al. 2013), changes in the level of coastal use (Zegler 2008), and a
separation of the fishers from their natural resource base (West et al. 2006). The
restrictions increase the occurrence of conflicts at the local community level
(Hargreaves-Allen et al. 2011; Momtaz and Gladstone 2008; Wilson et al. 2006). The
zoning and fishing limitations associated with MPAs can cause livelihood shocks within
coastal village communities and result in greater poverty levels (Cattermoul et al. 2008;
Cinner et al. 2009; Bene 2003; Allison and Ellis 2001).
The support of local communities for MPAs has been reported to fluctuate. This is due
to the unclear benefits of the protection for local people, which makes the local people
question who the beneficiaries of MPA establishment should be (White and Vogt 2000;
Buanes et al. 2005; McClanahan et al. 2005; Oracion et al. 2005; Peterson and Stead
2011; Rees et al. 2013a). Jentoft et al. (2011), for example, argued that one reason for
the fluctuating support for MPAs from local communities is the formulation of official
goals that disregard the local stakeholder groups’ interests. Local communities were
considered as the main threat to conservation initiatives (Moeliono 2008). Lack of
understanding local context created resentment and failed of conservation initiatives
(Afiff and Lowe 2008). Allison et al. (2011) rationalised that uncertainty over marine-
related incomes limited people’s ability and motivation to participate in marine resource
governance. Therefore, as suggested by Springer (2009), a deep understanding on how
conservation might impact the socioeconomic aspects is needed to provide a basis for
developing a strategy in responding negative impacts perceived by local people.

Chapter 1. Introduction _______________________________________________________________________
5
1.1.1 Key factors in establishing marine protected areas
A strategy is needed to gain effective management of MPA to achieve better marine
resources and improved livelihoods. An understanding of community conditions is one
of the key success factors in establishing and managing MPAs effectively (Kelleher
1999; Hockings et al. 2000; White and Vogt 2000; Dietz and Adger 2003; Christie 2004;
Pomeroy et al. 2004; McClanahan et al. 2006; Gray and Hatchard 2008; Klein et al.
2008; Pita et al. 2011). The IUCN outlines that the establishment of MPAs must
incorporate biological, social, cultural and economic factors (Bunce et al. 2000). Apart
from gaining more support and higher compliance for the success of an MPA, an
understanding of social and economic characteristics also allows the management bodies
to assess the potential implications of the MPA for the people who directly benefit from
the marine resources and to communicate effectively with the local communities (Afiff
and Lowe 2008; Gara 2010). The social and economic factors include resource use
patterns, stakeholder characteristics, gender issues, stakeholder perceptions,
organisational and resource governance, traditional knowledge, community services and
facilities, market attributes for extractive uses of coral reefs, market attributes for non-
extractive uses of coral reefs, and the non-market and market use values (Bunce et al.
2000; FAO 2011a).
Applying a participatory approach can lead to better inclusion of the social, economic
and cultural aspects that need to be taken into account in the establishment of MPAs. A
participatory approach focuses on local conditions, problems and solutions (Lal et al.
2003; Berghofer et al. 2008; Reed 2008; Jentoft and Chuenpagdee 2009; Ferse et al.
2010). Participation enables the local community to be the main actors of the
development (Chambers 1983; Chambers 1995; DFID 1999; Carney 2002). Community
participation allows conservation efforts to respect locals’ creativity, knowledge and
views. As a result, community participation increases ownership and transparency in the
activities (Dorsner 2004; Rodríguez-Izquierdo et al. 2010). A well designed MPA that
are planned through participatory process and use the best available information offer
important benefits to local communities and empower marginalised groups (FAO 2011a).
A study in 52 protected areas globally by Andrade and Rhodes (2012) found community

Chapter 1. Introduction _______________________________________________________________________
6
participation in decision making process was the only variables that significantly related
to the level of compliance with protected area rules. Nevertheless, Afiff and Lowe
(2008) warned community participation in conservation efforts need to be based on trust
and respect, and share common interests and agendas between conservation agents and
local communities. Without these, conservation initiatives will increase opposition
against it.
Marine resource management involves multiple actors with different levels of interests
and concerns (Agrawal and Gibson 1999; Pollnac and Crawford 2000). Participatory
approaches allow stakeholder groups to join in decision-making processes and to discuss
issues related to marine resource governance. Community participation improved the
rights of community to participate in setting the regulations, raised awareness and
minimised conflicts (Campbell et al. 2013)
De Vivero et al. (2008) pointed out, however, due to the increased number of
stakeholder groups and the complex relationships between locals and the emerging
number of actors who do not always share common interests, implementing true local
participation is neither simple nor easily achieved. Jones et al. (2011) therefore
suggested that clear roles, responsibilities and powers of delegation are needed to
manage the degree of autonomy and influence that local people expect in governing the
marine resources. Rees et al. (2013) also suggested that the participation of communities
in the process of establishment should be an ongoing process and not come to an end at
the preliminary stage, in order to ensure the results are accepted by communities.
1.1.2 Contributions of MPAs to improving coastal livelihoods
The ecological benefits of MPAs are relatively well recognised (Halpern and Warner
2002; Halpern 2003; Edgar 2011; Afonso et al. 2011; Yasue et al. 2011; Vimal et al.
2012). However, the contribution of marine protected areas, especially with restricted
areas, to improving the livelihoods of coastal villagers is still subject to debate (Christie
2004; West et al. 2006; WRI 2005; Folke 2006; White et al. 2008a; Mascia et al. 2010;
Carneiro 2011). Carnerio (2011) found relatively little attention has been devoted in

Chapter 1. Introduction _______________________________________________________________________
7
peer-reviewed literature to the impacts of marine and coastal conservation initiatives on
the well-being of human populations. Mascia et al. (2010) argued why some MPAs lead
to social benefits and others have social cost. Hardy et al. (2013) used simulation to
analyse the fish consumption and cash income of fishers in Solomon Islands case study
can be sustained for the next 40 years through better marine conservation. However,
White et al (2008a) found the economic performance of fishery was gained through
profit received by fishers not fish yield. Mascia et al. (2010) further advised the way an
MPA is managed shape the rights of resource users which affects the social well-being
and stakeholder support for MPA development and management.
The link between livelihoods and marine resources is complex and has multiple
dimensions (Agrawal and Redford 2006; Jentoft and Chuenpagdee, 2009). As discussed
previously, coastal villagers use and benefit from marine resources not only for food, job
opportunities, or as an income source; but they also gain non-material benefits that
enable them to live and identify with the marine environment which provides a sense of
place, identity (Acheson 1981) and a preferred livelihood strategy.
Allison et al. (2011) suggested that improving the livelihoods of coastal villagers who
are dependent on marine resources needs to be based on an understanding of how people
make a living, their level of access to different assets, the constraints people face, and
the options available to them. In this case, the sustainable livelihoods concept (Carney
1998) brings together the critical factors that can affect the vulnerability and strengths of
individual and family strategies. Thus, it is crucial to understand the external factors that
shape the strategies people form in order to survive in vulnerable and uncertain
situations (Adger 1999; Ashley and Carney 1999; Allison and Ellis 2001; Ellis and
Biggs 2001; Marschke and Berkes 2006; Birkmann 2011) and the institutional and
policy factors that shape local livelihood strategies. It is also crucial to understand the
needs of multiple stakeholder groups though application of a ‘gender lens’ in assessing
use, access and importance of marine resources to different members of a society or
group (Weeratunge et al 2013; Mathews et al. 2012; Fitriana and Stacey 2012).

Chapter 1. Introduction _______________________________________________________________________
8
Midgley (2008) suggested that strategies to improve livelihood outcomes within marine
contexts should involve a multi-faceted approach with a variety of activities, including
economic growth, the increase in market value of the products and services produced.
Indeed, Chang (2003) found that countries that have made the most progress in poverty
reduction relied extensively on strategies that effectively combined economic growth
with a range of social development interventions. Without market opportunities,
improving livelihoods by increasing production has little value (Dorward and Kydd
2004; Allison 2011).
It has been shown in some situations that fishery yields can be higher within a restricted
area, however, the economic performance of fisheries depends on economic profit
received by the fishers, not fish yield as a result of protected area (White et al. 2008a).
When fish catches increase as a result of MPA establishment, it can bring the price of
products lower, and the community receives about the same benefit as when fish catches
were previously and the wellbeing of the community remains unchanged (Clark 2002;
Momtaz and Gladstome 2008). As noted by Liese (2003), an increase in income does not
necessarily imply a net increase in wealth. Understanding macro-economic factors
across wider market systems is crucial to improving local livelihoods (Scoones 2009).
Chuenpagdee and Jentoft (2011) illustrated how fishery value chains works can affect
fishers’ vulnerability to poverty. Clarity on how markets operate and identification of
pro-poor interventions along value chains is necessary to improve the assets of local
people (Marshall et al. 2006; Kanjii et al. 2005; Farrington and Mitchell 2006; Mitchell
and Shepherd 2006).
A value chain analysis (VCA) is one way to analyse how the market works and the often
powerful actors present along the chain. The VCA describes the full range of activities to
bring a product to final consumers (Kaplinsky and Morris 2001). The core process and
the activities in the value chain including production, processing, and distribution are
identified (M4P 2008, Hempel 2010). The VCA also analyses the lead actors and the
linkages between actors. One actor is often more powerful than other actors.

Chapter 1. Introduction _______________________________________________________________________
9
Understanding all of these aspects can help in identifying constraints fishers face to
participate and better benefit from their production activities along the chain (Loc et al
2010).
The VCA scopes areas for improving the role of local producers in the market – such as
by increasing return and reducing risks. Interventions identifed can support the rural
poor to improve their livelihoods through upgrading their position in a range of natural
resource-based value chains (Mitchell et al. 2011). Intervention to strengthen the
participation of fishers along the value chain can also be identified to support local
livelihoods and enterprise initiatives in coastal communities (Jacinto 2004).
Another way to improve livelihoods is by introducing several environmentally friendly
livelihood options and job opportunities to communities (Allison 2011) to increase the
incomes of poor households by providing diversified livelihoods (Pollnac et al. 2001;
Sievanen et al. 2005; Crawford 2009). In some instances, diversified livelihood options
can reduce the pressure on marine resource but there is considerable divergence on this
from examples. One example of diversifying livelihood options and moving pressure
from coastal marine resource harvesting is aquaculture - the farming of aquatic plant and
animals. Apart from its often highly technical components and activities (e.g., breeding,
hatchery and interdependence with other industries (inputs)), Aquaculture contributes
significantly to the world food supply and to poor smallholders’ livelihoods (Pullin and
Sumaila 2005; Bavinck and Chuenpadgee 2005). Allison (2011) suggested that
aquaculture demonstrated positive employment and consumption effects for poor
households who adopted small pond aquaculture in Malawi, Bangladesh and the
Philippines. A study conducted by Irz et al. (2007) found that poor rural communities in
the Philippines gained additional income and employment through a series of market
linkages although the poor were not the owners of the aquaculture assets in that case.
However, Ahmed et al. (2008) raised a concern about the need for more equitable access
by disadvantaged groups to aquaculture resources in Bangladesh.

Chapter 1. Introduction _______________________________________________________________________
10
MPAs are often said to bring livelihood opportunities in the form of tourism and
associated industries as non-extractive uses of marine resources (Townsend 2003; de
Groot and Bush, 2010). Tourism through user pay schemes is also a potential source of
funding for marine protected areas (Cesar et al. 2003; Buckley 2004; Conservation
International, 2008; Peters and Hawkins 2009; Wielgus et al. 2010). However,
Scheyvens (2011) questioned whether tourism can bring wider benefits to poor rural
communities. Shen et al. (2008) suggested that tourism businesses based on marine
resources can bring benefits to the poor through the development of pro-poor tourism.
But they caution that the tourism industry needs to provide long-term economic benefits
to local people, protect local natural resources, and institutionally maximise
opportunities for local participation and involvement.
1.1.3 Balancing conservation efforts and livelihoods
As recognised by the IUCN (in Fisher et al. 2005), it is not conservation itself that is the
problem for people whose livelihoods depend on natural resources; rather, conservation
approaches often do not adequately take into account the adverse impacts of
conservation activities on the rural poor. What is needed are ways to avoid conservation
initiatives that cause greater levels of local poverty and shift problems to another places.
Strategies to balance conservation efforts and local people’s livelihoods are therefore
needed. Gelchich et al. (2009) and Carpenter et al. (2006) highlighted the gap to link
marine resources and human wellbeing effect in achieving successful marine
conservation.
McShane et al. (2011) considered win-win solution between conserving marine
resources and improving livelihoods were difficult to achieve. McShane et al. (2011)
further suggested that hard choices involved should be discussed and debated as part of
social process between conservation and development communities that allowed for
compromise and explicit knowledge of risk and cost. Clifton and Majors (2011) warned
a consequence of enforcing the implementation of conservation rules without
recognizing the cultural and social context within the community would create conflict,
to the detriment of both conservation and community.

Chapter 1. Introduction _______________________________________________________________________
11
This is the most challenging aspect of the establishment of MPAs. Balancing the need to
preserve biodiversity and habitats with people’s needs is complex and often difficult
(Lunn and Dearden 2006; Gilliland and Laffoley 2008). The relationship between the
process of the establishment of MPA and integration of socioeconomic and ecological
factors in the process influences the outcome of the establishment (Fox et al. 2012). As
suggested by Afiff and Lowe (2008), human needs and saving nature should be put in
the same frame and weighted equally. Practical strategies that use a trans-disciplinary
approach are needed in reconciling marine biodiversity conservation with the existing
forms of local environmental management (Aswani et al. 2012; Peterson et al. 2010;
Waylen et al. 2010; Jones et al. 2011; Sodhi et al. 2008; Visser 2004). The Rockefeller
Foundation (2013) suggested reframing the problem, from a narrow focus on the marine
ecosystem to a multi-system focus on vulnerable communities that will ensure the
conservation goals and wellbeing of people. This thesis investigates these competing
social, cultural, economic and ecological issues around MPAs and their establishment
and management.
1.2 Research Aims, Objectives and Questions
The aim of this research was to assess the potential impacts of the establishment of MPA
on coastal communities on Pantar Island, located in Nusa Tenggara Timur Province, in
the eastern region of Indonesia (Figure 1.1). The results from the research intend to
make practical recommendations for MPA establishment that would minimise the
negative impacts and optimise the benefits for local people living on Pantar Island.
Figure 1.1 shows a map of Indonesia and indicates the approximate location of Pantar
Island.

Chapter 1. Introduction _______________________________________________________________________
12
Figure 1.1: Map of Indonesia showing the approximate location of Pantar Island
Given this aim, the objectives of this research were fourfold:
1. To assess the past approaches to the establishment of MPAs in Indonesia;
2. To examine the marine-related livelihood dependence of communities on Pantar
Island;
3. To explore the impact of an MPA on community livelihoods on Pantar Island;
and
4. To identify opportunities and best practices for improved livelihood strategies in
coastal communities and mitigate the potential impacts of an MPA on Pantar
Island.
In order to achieve these four objectives, this research explored several research
questions and sub-questions for each objective:
1 To what extent have local communities been involved in the planning process to
establish MPAs in Indonesia?
1.1 What was the degree of participation of local communities in the planning
process?
1.2 To what extent were social and economic issues considered in the MPA
establishment?

Chapter 1. Introduction _______________________________________________________________________
13
2 To what extent do Pantar Island communities’ livelihoods depend on the coastal
and marine natural resources compared to their other resources?
2.1 How do the communities cope with vulnerability?
3 How are communities involved in the barter and commercial marketing of some
key marine resources?
3.1 What is the value chain for key marine products?
3.2 Are there ways to improve the participation of coastal communities in the
value chain?
4 To what extent will local livelihoods be affected if restrictions are placed on
access to marine resources through MPA establishment?
4.1 What is the impact of MPA establishment on livelihoods?
4.2 What is likely to be the best practice for the establishment of an MPA on
Pantar Island in terms of addressing the people’s livelihoods issues and
achieving conservation goals?
Addressing Research Question 1 will help in better understanding the participation of
communities and how social and economic factors have been incorporated into the
marine resource management systems in Indonesia and other places worldwide.
Addressing Research Question 2 will provide a better understanding of coastal
communities’ livelihood dependence on marine resources on Pantar Island. The
sustainable livelihoods analysis (SLA) framework (DFID 1999) is used. In the context of
this study, this approach will examine how fishers use their assets, benefit from the
marine resources and cope with tough conditions (Allison and Ellis 2001; Ellis and
Biggs 2001). Applying a SLA can also help in understanding how an MPA affects
livelihoods and how people cope with shocks including restricted access to resources.
Research Question 3 investigates the value chain of selected products from Pantar Island.
Research Question 3 also addresses objective 2 and objective 4. Addressing Research
Question 4 will identify ‘best practice’ to address the issue of balancing conservation
efforts with coastal communities’ needs and ensuring there will be a sustainable resource
for sustainable livelihoods.

Chapter 1. Introduction _______________________________________________________________________
14
1.3 Contribution of the Research
This research makes four main contributions to better understand the implications of the
establishment of MPAs and impacts on coastal community livelihoods. Firstly, the
results of this research contribute to finding appropriate ways to achieve marine
conservation while guaranteeing access to areas for local people. As discussed
previously, the number of MPAs has increased dramatically and several marine
conservation initiatives are in place in the Indonesian region such as the Coral Triangle
Initiative on Coral Reefs, Fisheries and Food Security (CTI-CFF). However, recent
studies have highlighted the occurrence of conflicts and pointed out that only some
MPAs were achieving their objectives (Burke et al. 2002; Fernandez 2010; Hargreaves-
Allen et al. 2011; White et al. 2005; Wilson et al. 2006). This indicates that there are still
challenges in establishing an MPA, especially in the planning process. This study fills a
gap in the knowledge related to the MPA planning process.
Secondly, increasing world attention has recently been placed on ensuring that
conservation interventions increase the wellbeing of local communities around the
marine protected areas (Secretariat CBD 2009; Dudley et al. 2008; Walpole and Wilder
2008; Secretariat CBD 2009a; Foale et al 2013). Understanding the diversified portfolios
and strategies of coastal community livelihoods and the influence of market on
livelihoods could help in identifying ways to improve coastal community livelihoods in
MPA contexts. This is the gap where MPAs could demonstrate how marine reserves link
to human wellbeing (Gelcich 2009). This research contributes to the discussion on how
to achieve better livelihoods and conservation goals.
Thirdly, since the MPA process in Pantar commenced over the last five years, studies
have been conducted on marine biodiversity. Research has been carried out on cetacea
(Pet-Soede 2002; Kahn 2002) and the ecology of small islands in Alor District (Ninef et
al. 2005), and a rapid ecology survey was undertaken in Alor (WWF Indonesia 2010).
Pet-Soede (2002) investigated how this area experienced extensive fishing pressure from
local communities. WWF-Indonesia carried out a rapid assessment on socioeconomic
and a study of socio economic indicators on the basis of intervention or activities

Chapter 1. Introduction _______________________________________________________________________
15
(Eghenter 2011). However, there have been few detailed assessments of the socio-
ecological relations or socio-economics of livelihoods of people in the region and the
main users of the marine resources. This thesis fills a gap in the research on coastal
community livelihoods for the Alor-Pantar region. Most previous social research in the
Alor-Pantar region has examined languages (e.g., Stokhof 1979) and history and social
relationships (Dietrich 1984; Farram 2004; Gomang 2006; Savage 2007; Rodemeir
2010), and the anthropological features of Alorese society on neighbouring Alor (Du
Bois 1944). It appears that no detailed studies have been conducted on the relationships
between the Pantar coastal community and its resources although this area is located in a
global biodiversity hotspot, Coral Triangle region and attracts world attention (CTI-CFF
2009).
1.4 Structure of Thesis
This thesis is organised in eight chapters, followed by a list of references and appendices.
Chapter 1 (this chapter) introduces the study; Chapter 2 presents the methodology;
Chapter 3 describes the study sites; Chapter 4 explores the involvement of communities
in the planning process of the establishment of MPAs in Indonesia; Chapter 5 discusses
the assets of the coastal community livelihoods on Pantar Island and how local people
cope with difficult conditions and livelihood outcomes; Chapter 6 investigates the
participation of marine products from Pantar Island in the market; Chapter 7 explores the
potential implications and opportunities of an MPA on Pantar Island; Chapter 8 presents
the conclusions. The conceptual approach for the thesis is illustrated in Figure 1.2. The
links between the chapters, research questions and objectives are illustrated in Figure 1.3.

Chapter 1. Introduction _______________________________________________________________________
16
Figure 1.2: Conceptual approach of the thesis
Figure 1.3: Relationship between chapters, research questions and objectives
Chapter 4: Research Question 1
Objective 1: To assess the past approaches around the establishment of MPAs in Indonesia
Objective 2: To examine marine-related livelihood dependence of communities on Pantar Island
Chapter 5: Research Question 2
Chapter 6: Research Question 3
Objective 3: To explore the impact of an MPA on community livelihoods on Pantar Island
Chapter 7: Research Question 4
Objective 4: To identify opportunities and best practices for improved livelihood strategies for coastal communities
Chapter 6: Research Question 3 Chapter 7:
Research Question 4
Livelihoods
The proposed MPA
Value chain of selected marine
products Pantar Island
Previous experiences in
establishing MPAs
Impacts and proposed best
practices

Chapter 1. Introduction _______________________________________________________________________
17
As the introduction chapter, Chapter 1 presented the background, purpose and
justification for the research, along with the research questions, and an outline of the
structure of the thesis. An overview of the link between human and marine resources
was presented. The challenges in establishing MPAs, and the need for better
understanding of coastal community livelihoods were discussed.
Chapter 2 presents an overview of the sustainable livelihood approach and value chain
analysis. The origin, development and main attributes of sustainable livelihood analysis
are discussed. The origin, attributes and benefits of value chain analysis are then
discussed, as well as the strengths and gaps in this approach. This chapter also describes
how data was collected and analysed in the present study in order to address the research
questions. The research challenges and limitations are described.
Chapter 3 presents the background context of Pantar Island in terms of its location,
environment, settlement history, governance system, demography and macro-economy.
The site descriptions provide maps of study sites, ethnicity, history of settlement and
infrastructure and services in the island’s four villages.
Chapter 4 explores Indonesia’s experience in the establishment of MPAs. This chapter
starts with an illustration of lessons learned in three distinct places: a Norwegian coastal
reserve, the Mabini Reserve in the Philippines, and Marovo Lagoon in the Solomon
Islands. The degree of community participation in three MPAs in Indonesia, namely,
Wakatobi National Park, Bali Barat National Park and Riung Nature Reserve, is then
discussed. The roles of the Indonesian Government and NGOs in implementing MPAs in
Indonesia are considered. The lessons learned are then organised into the categories of
stakeholder group recognition, degree of participation, and the level of consideration of
social and economic issues in MPA planning and zoning.
Chapter 5 uses the sustainable livelihood analysis to discuss the dependency of coastal
communities on marine resources. Chapter 5 focuses on the assets related to fishers’
livelihoods on Pantar Island (human, natural, physical, financial and social). This chapter

Chapter 1. Introduction _______________________________________________________________________
18
explores the communities’ perceptions of their assets based on the most common
captured fish. An exploration of livelihood strategies is presented to discuss how local
fishers utilise their assets in coping with vulnerability. The outcomes of the use of
different assets in their livelihood strategies are also discussed.
Chapter 6 uses value chain analysis to describe the route of marine products from Pantar
to end consumers. The local and international market networks of marine products from
Pantar are discussed, and ways of strengthening the role of local fishers from Pantar in
the value chain are explored. The implications of increased marine product
commercialisation for livelihoods are discussed.
Chapter 7 discusses the potential implications of the establishment of an MPA for
livelihoods on Pantar Island. An overview of the international driving factors is
presented, including an analysis of how the Indonesian Government scales down the
international movement into national policy. The existing Alor Conservation Plan is then
described. Thus, the discussion in this chapter considers the potential implications of
MPA establishment for livelihoods in both the short-term and long-term dimensions.
The discussion leads to a summary of the best practices and policy implications from the
Pantar Island case study and an assessment of Indonesia’s experience in establishing
MPAs.
Chapter 8 concludes this thesis. The major research findings are presented and some
reflections on the development of this study are shared. Recommendations for the future
establishment of an MPA on Pantar Island are proposed.

Chapter 2
Methodology
Kayang Village on Pantar Island in September 2008

Chapter 2. Methodology _______________________________________________________________________
19
Chapter 2: Methodology
2.1 Overview of Research Design and Approach
The aim of this research was to assess the potential impacts of the establishment of MPA
on coastal communities on Pantar Island, located in Nusa Tenggara Timur Province, in
the eastern region of Indonesia. This was conducted by exploring the establishment of
marine protected areas, sustainable livelihoods, and the dependence and trade of marine
products among coastal communities on Pantar Island. Pantar Island is located in the
Alor Marine Conservation Area. This research was based on a case study that aimed to
provide a detailed understanding of these issues and make locally applied contributions
(for example, livelihood improvement at the local level) and theoretical contributions to
the literature concerning conservation efforts and the improvement of local community
livelihoods.
The methodology used to address the research objectives was the sustainable livelihood
analysis approach as a framework for data collection and analysis to examine the
livelihoods of communities in the four villages on Pantar Island in combination with
other methods including participatory rural appraisal, focus group discussion, household
survey, key informant interviews, literature review, and observations. The Sustainable
livelihood analysis (SLA) helps researchers to understand how people use their assets
and how they cope with difficult conditions (Allison and Horemans 2006; Ellis and
Biggs 2001). Examinations of the five categories of assets in the livelihood analysis
framework (namely, human, natural, social, physical, and financial assets) were used to
gain a better understanding of the coastal community livelihood strategies (Carney 1998;
Scoones 1998).
In relation to the trade of natural assets (the marine products traded), value chain
analysis was applied to understand how marine products are traded. The purpose of this
analysis was to consider opportunities to improve the communities’ livelihood strategies

Chapter 2. Methodology _______________________________________________________________________
20
and to enhance the communities’ wellbeing. The analysis mapped the production of
selected products from producers to consumers, the market actors, the activities involved
along the chain, and the relationships between the actors.
This chapter begins with an overview of the sustainable livelihood analysis (SLA)
(DFID 1999) as a framework for collecting data and analysis, its origin, components and
a broad description of the five categories of assets as well as the factors that influence
and interact with the assets. This section also discusses the strengths and gaps of SLA
and how I applied the framework in the present research. This chapter then presents an
overview of how the VCA approach was used to map the marine products trade. A
description of the research process and how the data was collected in the field and
analysed is presented based on the assets and attributes of the SLA and VCA as
identified in this chapter. The final section describes the challenges and difficulties in
conducting the research.
2.2 Sustainable Livelihood Approach as a Framework of Analysis
There were several reasons for utilising the SLA framework. First, the SLA framework
shapes the relation between the environment and people clearly as described in the SLA
assets pentagon. With an understanding of this relation, the impact of a marine protected
area on a community can be assessed. Second, SLA explicitly demonstrates the
dimension of sustainability by identifying the different aspects of economic, institutional,
social and environmental sustainability (Chambers and Conway 1992; DFID 1999).
Economic sustainability occurs when a given level of expenditure can be maintained
over time. In the context of the livelihoods of the poor, economic sustainability is
achieved if a baseline level of economic welfare can be achieved and sustained. Social
exclusion is minimised and social equity is maximised which is considered socially
sustainable. Institutional sustainability is achieved when prevailing structures and
processes have the capacity to continue to perform their functions over the long term.
Environmental sustainability occurs when the productivity of life-supporting natural
resources is conserved or enhanced for the use of future generations. This shows that
SLA offers a win-win solution for poverty alleviation and natural resources management

Chapter 2. Methodology _______________________________________________________________________
21
for current and future generations (Carney 2002; Chambers 2005). This framework helps
in analysing the management system of natural resources at the community level and
how it affects the community strategy. In short, SLA helps to understand the life of a
community, the interaction with natural resources, and the factors affecting the decisions
made and the community’s efforts to increase their wellbeing.
2.2.1 Origin and development of sustainable livelihood analysis
Sustainable livelihood analysis has been widely promoted by the Department for
International Development (DFID) in the United Kingdom. This approach emerged from
the development sector which sought to enhance progress in poverty elimination by
framing a way of thinking based on understanding people’s strengths, vulnerability and
diverse strategies (Ashley and Carney 1999; Farrington et al. 1999).
In the late 1970s there was an effort to better understand the multiple activities of poor
people (Chambers in www.eldis.org 2008). It started from the effort to integrate
multidisciplinary teams working in India and Southern Africa in rural development. In
1995, the UN World Social Development Summit agreed to change the term
“employment” to “livelihood” in order to better reflect poor people’s strategies. The
Brundtland Report was the first key document discussing the integration of the
“sustainable livelihood” concept. Since then, DFID integrated the livelihood approach
into a wider development program and outlined SLA into its country programs (Carney
1998).
Since then, SLA has been refined in response to the need for more effective ways of
understanding community livelihoods and poverty reduction. Ellis (2000) highlighted
that the access to assets and activities is influenced by social relations (for example
gender, class, kin, belief systems) and institutions. Similarly, Bebbington (1999) argued
that access to networks and organisations (social capital) is important and varies between
contexts and social groups (including gender, race and age). Cahn (2006) argued that
culture must be considered as one asset. Cahn (2006) pointed out that culture influences
and is influenced by how people access resources, overlap with social assets, and value

Chapter 2. Methodology _______________________________________________________________________
22
their livelihood outcomes. Other international organisations that also adopted SLA
include the FAO, UNDP, Oxfam, CARE (Carney et al. 2002; Hussein 2002; Farrington
et al. 2002), the International Institute for Environment and Development
(Schreckenberg 2010) and the IUCN (Cattermoul et al. 2008). SLA has been modified
depending on the focus of the particular research, the development project mandates, the
scale of the operation and the specifics of the local situation; however, the basic concepts
of this approach have remained constant in its use by development organisations. For the
purpose of the present research I used the SLA framework developed by DFID (1999).
2.2.2 Definitions
Within DFID, the definition of sustainable livelihoods has been adapted from the
following definition by Chambers and Conway (1992:6):
A livelihood comprises the capabilities, assets (including both material and social resources) and activities required for a means of living. A livelihood is sustainable when it can cope with and recover from stresses and shocks and maintain or enhance its capabilities and assets both now and in the future, while not undermining the natural resource base.
This definition expresses the concept that people need the three components of
capabilities, assets and sustainable activities. These components cover not only the
tangible factors but also non-material aspects that enable people to survive or choose a
strategy to live. Sen (1984:316) defined capabilities as “what people can do or be with
their entitlements”. Bebbington (1999:5) defined assets as “not only simply the resources
that people use in building livelihoods: they are assets that give them the capability to be
and to act”. In this sense, assets give meaning to a person’s world; an asset refers not
only to the resources the person has, but also to how the asset gives status, identity and
power.
Sustainable activities describe people’s strategies in dealing with vulnerable conditions
and benefitting from the natural resources. The sustainability focus shows the link
between livelihoods and natural resources.

Chapter 2. Methodology _______________________________________________________________________
23
The SLA framework presents the main factors that affect people’s livelihoods (Figure
2.1), and describes the relations between every aspect. The framework brings together
assets and activities, illustrating the interaction between them, and highlighting the
problems faced by communities when they strive to make a living. The framework does
not work in a linear manner; rather, it emphasises the multiple interactions between the
various factors that affect livelihoods, namely, assets, vulnerability, structure and
process, and strategy.
Figure 2.1: Sustainable livelihoods analysis framework (Source: DFID 1999)
The heart of the framework, as shown in the figure above, is livelihood assets in a
pentagon. These assets are sometimes referred to as capital depending on the context, but
this thesis uses the term “assets”. The asset pentagon includes five main categories of
assets which are human, natural, financial, physical and social capital. The asset
component describes how people own and access a certain level of assets to make a
living. The degree of assets or the shape of the pentagon is affected by the vulnerability
context and the structure and process.
Assets are used in activities to produce outcomes to meet coastal communities’
aspirations and consumption requirements, and to invest in assets for the future. All this
takes place in the context of an uncertain environment, which is called the vulnerability

Chapter 2. Methodology _______________________________________________________________________
24
context (Figure 2.1). The livelihood outcomes can not only be measured in monetary
terms but also in terms of increased wellbeing, reduced vulnerability to external shocks
and trends, improved food security, and ensuring activities are compatible with
maintaining the natural resources.
2.2.3 Assets
The five categories of assessed assets in the SLA pentagon are adaptive to the local
conditions. The attributes of each asset and how they relate to one another are described
as follows.
Human assets
Human assets are extremely important as the SLA framework emphasises people (DFID
1999). Human assets refer to the physical ability to pursue a livelihood strategy (Scoones
1998). This refers not only to the quantity of the physical ability but also the quality of
the ability (such as skills and knowledge) that enables people to take advantage of
economic opportunities (Rakodi 1999).
Several factors affect human capital. First, the household unit is considered as the main
labour force in many rural areas. Demography and population dynamics play a
significant role in one household. Demography comprises the size of the household, and
the age and sex composition. Population dynamics include migration, fertility and
mortality.
Second, human assets are affected by the knowledge and skills related to particular
livelihoods that enable the community to take opportunity of certain income-earning
activities (Rakodi 1999). In relation to coastal areas, this includes knowledge about
marine resources, knowledge of resource use and skills to catch fish using particular gear
(Allison and Ellis 2001). Human assets, as the traditional knowledge of resource use and
skills to catch fish, enable people to take advantage of economic opportunities (Rakodi
1999; Allison and Ellis 2001). The degree of investment in knowledge and skills is

Chapter 2. Methodology _______________________________________________________________________
25
affected by opportunity cost in several livelihood activities. For example, time allocation
to increase capacity in a particular livelihood is worthwhile if it leads to more promising
results (Rakodi 1999; Salagrama 2006). Other investments in human assets are made
through education, although education does not provide a skilled labour force in a short-
term period.
Third, the ability to work relates to health and access to the livelihood activity.
Nutritional status, which is determined by food security, and adequate care and health,
affects health status (Rakodi 1999). According to Rakodi (1999), food security means is
having assured access to adequate food in terms of quality, quantity and safety and
cultural acceptability. Health status influences how people invest in other assets. For
example, when a member of a family is sick, especially the bread-winner, it affects the
family’s expenses and their dependence on natural resources (De Sherbinin et al.
2008).Conversely, they also found that a change in the quality and quantity of natural
resources had important impacts on household demographic structure such as fertility,
mortality and migration.
Natural assets
Natural assets are the natural resource stock or environmental services provided for
livelihoods. This includes water, wind, soil, forest resources, marine resources, as well
as the degree of biodiversity and the rate of change. The most important natural assets of
coastal communities are marine resources, although some communities on Pantar Island
depend on other natural resources such as a land for agricultural activities.
Salagrama (2006) identified three factors that affect the natural assets in coastal
communities, namely, the status of the natural assets on which fishers depend, habitat
destruction, and the open access/common property of natural resources. The present
research examined the status of marine resources, habitats and locations where the
fishers accessed resources in the case study area, Pantar Island. A decline in the fish
catch reflects the status of the natural resources due to habitat destruction and other
causes, and affects the food security and livelihood strategy.

Chapter 2. Methodology _______________________________________________________________________
26
Habitats are particularly important to maintaining the integrity of marine resources (Noss
et al. 1997). There are three key main habitats in marine resources: mangrove forest,
seagrass areas, and coral reefs. Mangrove areas function as spawning, feeding and
nursery grounds for many marine species (Nagelkerken and van der Velde 2004). The
gastropods and crustaceans found in the mangrove ecosystem contribute to the food
chains of marine species. The loss of mangrove species can have devastating economic
and environmental consequences for coastal community livelihoods (Duke et al. 2007;
Polidoro et al. 2010). Seagrass beds are a nursery and feeding ground for commercial
fish and crustaceans (Nagerkerken et al. 2000; McKenzie et al. 2001; Nagelkerken 2002).
According to Moyle and Cech (1996), the most abundant fish in seagrass beds are
carnivores that feed on the abundant invertebrates and small fish associated with the
seagrass, followed by juveniles of many species that feed on planktonivores and several
detritivorous fish. Meanwhile, in coral reefs, the diversity and status of coral cover are
used as indicators to assess a healthy coral reef ecosystem (Burkepile and Hay 2008;
Glynn and Enoch 2011).
Physical assets
Infrastructure and producer goods are considered as physical assets (DFID 1999).
Infrastructure, which is normally public goods, consists of the physical environment that
helps people to meet their basic needs and to be more productive. They include transport,
shelter and buildings, water supply and sanitation, energy and access to information.
Producer goods are the tools and equipment that are used to function more productively.
These are normally privately owned by individuals or groups. In rural areas, the
producer goods can sometimes be borrowed from one family to another interchangeably.
Financial assets
Financial assets are comprised of savings, access to credit, debts and other economic
assets such regular inflows of money from remittance (DFID, 1999). Two factors affect
savings, namely, productivity and liquidity which refers to how readily an asset can be
turned into cash. For example, the physical asset invested can be turned into a safety net

Chapter 2. Methodology _______________________________________________________________________
27
when a person is in financial crisis. In some cases, a regular inflow of money is received
from members of a family who work in other places. Ellis (1998) found that members of
a family who worked in urban areas or other places continued their strong relationship
with their families in rural areas and were considered as their emergency cash earnings.
Livestock is also considered as a store of wealth and a buffer against hard times.
Another important factor in financial capital is the existence of financial institutions and
the access granted by those institutions to credit. Gertler et al. (2009) found that the
presence of financial institution in rural areas in Indonesia helped the rural community to
mobilise their financial resources and cope with vulnerability conditions such as medical
care costs and the loss of income associated with low productivity. Formal financial
institutions include the Indonesian People Bank (BRI), Credit Bank (BPR), cooperatives,
and micro-credit institutions. Informal financial institutions such as money lenders, local
stores, neighbours and local traders provide a quick liquid asset to members of rural
communities in a difficult situation.
Social assets
DFID (1999) states that social assets are developed through:
1 Networks and connectedness, in which the relation is either vertical
(patron/client) or horizontal (between individuals with shared interests). The
network and connectedness increase people’s trust and ability to work together
and expand their access to wider institutions, such as political or civic bodies.
2 Membership of more formalised groups which often entails adherence to
mutually-agreed or commonly accepted rules, norms and sanctions.
3 Relationships of trust, reciprocity and exchanges that facilitate co-operation and
reduce transaction costs.
Woolcock and Narayan (2000) suggested that a simple form of social asset is a person’s
family, friends and associates. This is an asset which enables people to act collectively.
Similarly, Farrington et al. (2002) considered that a social asset is an important asset that
can be called upon in a crisis. Social assets include social networks, how someone is
Chapter 2. Methodology _______________________________________________________________________
28
related to another (Bodin and Crona 2007) and how one is excluded from accessing
natural resources depending on the social, economic, and cultural organisation of the
society in which an individual or family is embedded (Woolcock 1998).
Putnam (1993; 2000) explained that social assets are strongly constructed by bonding
and bridging. Bonding is considered as a connection that brings a group together
whereas bridging is focused more on the connection across organisations or groups. The
bonding and associations construct trust within the community which then builds social
assets (Sabatini 2009). The connections across groups are not only horizontal but also
vertical (Rydin and Holman 2004). Bonding and bridging reflect the social network
which is important during a crisis. Research on village-level institutions in Indonesia
found that collective action was part of the political or economic system at the village
level that played an important role in livelihood strategies during the economic crisis in
1998-1999 (Bebbington et al. 2006).
The social assets overlap and relate to transforming structures and processes in the SLA
framework, especially the institutions and culture (Figure 2.1). The focus on the
relationships and linkages of local institutions and kinships recognises the hindering and
enabling conditions for community members as they pursue livelihood strategies
(Scoones 1998; Bebbington 1999; Ellis 2000). For example, communities usually agree
on rules and norms as part of their membership. Pretty and Ward (2001) stated that
norms, rules and sanctions could trap people within harmful social arrangements. Some
associations might push people to act in a way that suits the collective interest (Ostrom
1990). The access to livelihood opportunities is governed by social relations, institutions
and organisations (de Haan 2005).
For the purpose of the present study, social assets were assessed by examination of the
social networks existing in the village. Village institutions and its networks were
investigated, including membership, bonding and rules in the group or institution.

Chapter 2. Methodology _______________________________________________________________________
29
2.2.4 Vulnerability context
Vulnerability in the external environment can impact on people’s livelihood assets when
people have limited or no control. Moser (1996) defined vulnerability as the insecurity
of individuals, families or communities in the face of a changing environment due to
shocks, long-term trends and seasonal cycles. Vulnerability can result from shocks,
trends and the seasonality of natural disasters (DFID 1999; Sidlea et al. 2004; Adger et
al. 2005; Birkman 2011). Shocks can be caused by earthquakes, tsunamis, drought, or
the death or illness of a family member. Coastal communities have to deal with coastal
hazards such as large storms, typhoons, and flooding damage (Gailard et al. 2009).
Vulnerability is also caused by the political economy of markets and institutions (Adger
1999). An example is seasonal shifts in prices which influence where people allocate
their resources in selecting a livelihood strategy. Allison and Horemans (2006)
suggested that understanding how people succeed and fail in coping with shocks is
important in designing policies and interventions to assist people in their adaptive
strategies.
2.2.5 Transforming structures and processes
The transforming structure and process consist of policy, legislation, institutions, culture
(societal norms and beliefs) and the power relations of people or institutions (DFID
1999). Livelihood assets are enabled or hindered by existing structures in the community
such as government and private sectors and the process that forms the relations such as
laws, policy, culture and institutions. As discussed above in relation to social assets,
rules and local customs are part of the institutional aspects that affect how people access
other resources. The transforming structure, process, and vulnerability context influence
how people mobilise and combine their assets as a strategy to pursue livelihood
outcomes.
2.2.6 Livelihood strategies
The combination of assets and activities that people undertake in order to achieve their
livelihood goals is called their livelihood strategy (DFID 1999). To understand the
community strategy, de Haan and Zoomers (2005) suggested that researchers assess the

Chapter 2. Methodology _______________________________________________________________________
30
community objectives and priorities regarding what the community pursues rather than
what it owns.
The rural community tends to engage in complex, multiple activities of income
generation for its survival strategy (Ellis 2000; Ireland 2004; Campbell et al. 2005(b)).
The diversification of livelihoods helps reduce the vulnerability of rural communities
(Ellis and Allison 2004). Scoones (1998) listed three broad clusters of livelihood
strategies that cover a wide range of options available to poor people in rural areas: 1)
agricultural intensification/extensification, 2) livelihood diversification, and 3) migration.
In addition to diversifying the livelihoods, the communities have several forms of
livelihood strategies that include diversified food, reduced income failure, and reduced
intra-year income variability due to the effects of seasonality or market fluctuations
(Ellis 2000). Communities prepare their livelihood strategies in response to stress and
shocks (Marschke and Berkes 2006; Birkmann 2011).
The degree of diversification depends on three factors. The first factor is the resource
endowment availability. Coastal communities make use all of their assets and
capabilities to live, including land-based or coastal-based activity. The second factor is
the level of risk associated with alternative options as well as the options to confront that
particular risk (Scoones 1998). The third factor is the benefit derived from the chosen
livelihood. People invest and mobilise their assets to support certain activities if they
believe those activities will result in more benefits than costs. Rational choice in an
economic sense leads people to undertake a certain strategy and mobilise their assets
(Cooke 2004). In the case study in the present study, economic benefit was considered as
one aspect of livelihood investment.
2.2.7 Livelihood outcomes
Livelihood outcomes are the achievements or outputs of livelihood strategies (DFID
1999). The outcome is the output of the current configuration of factors within the
livelihood framework (Figure 2.1). Understanding the outcomes helps to know people’s
motivations and priorities, and how they respond to new opportunities. The outcomes

Chapter 2. Methodology _______________________________________________________________________
31
include more income, increased wellbeing, reduced vulnerability, improved food
security and/or more sustainable use of natural resources (DFID 1999). The SLA
framework recognises that people not only pursue an increased cash income but also
how people value non-material benefits to their wellbeing.
For the purpose of the present research, I measured the livelihood outcomes based on: 1)
cash income, 2) the wellbeing of coastal communities, in terms of their expenditure
against their income. I did not consider food (consumption levels or food security
systematically) as this was outside of the scope of the main focus of this research. The
findings in relation to these outcomes are discussed in Chapter 5. Changes in outcomes
were used to measure the potential impacts on livelihoods on Pantar Island due to MPA
establishment (as discussed in Chapter 7).
Income can be in the form of cash or non-cash and regular or irregular. Smeeding and
Weinburg (2001) considered income as something received that can be spent or
consumed immediately. Non-cash income is the in-kind provision of market income.
Cash income is the net returns from activities and overall increases in the amount of
money coming into a household (DFID 2000). This includes money from trading
products and services, and remittances from family members. In the present study, the
analysis of income in livelihood outcomes was limited to cash income and food as non-
cash income.
Before discussing wellbeing as part of the livelihood outcomes in SLA, it is worthwhile
understanding the meaning of wellbeing in contrast to poverty. Wellbeing is a state of
being. Poverty is a state of being without the necessities of daily living (Healey 2006).
Narayan (2000) defined poverty as too little food and long hours of work; emotional
pain stemming from the daily humiliations of dependency and lack of power; and the
moral pain from being forced to make choices – such as whether to use limited funds to
save the life of an ill family member, or to use those same funds to feed their children.

Chapter 2. Methodology _______________________________________________________________________
32
The World Bank (1990) defined people in extreme poverty as people who live on less
than US$ 1/day, measured at purchasing power parity. Poverty is also about other basic
needs, such as access to health care, safe drinking water and sanitation, affordable
education, and basic infrastructure. Sachs (2005) stated that these basic necessities are
important for a life of dignity and health, as well as for economic productivity and as an
investment to end poverty. Narayan (2000) described poor people in physical and
emotional pain because of daily humiliation and lack of power. With reference to
Narayan’s definition, being in poverty is also being in undesired condition.
Wellbeing also reflects a capability in doing and being (Sen 1984). According to Sen
(1984), “doing” implies how people function and it involves choice and freedom.
“Being” implies a state of welfare and happiness, whereas capability means what people
can do or be with the entitlements of all their tangible assets. In this concept, wellbeing
has a subjective meaning which involves perceptions and experiences to measure
happiness (Ryff 1989; Ryan and Edward 2001; Frey and Stutzer 2002; Diener 2005).
Griffin (1988) discussed the notion of wellbeing as the desire for the fulfilment of needs.
In Griffin’s concept, desire is tied to a subject’s perception and experience of the object,
and needs do not even have to be attached to the subject’s experience. Basic needs, for
example, are related to being human or survival.
As wellbeing is subjective, the indicator is relative to environmental circumstances that
are influenced by cultural and cognitive measures of life satisfaction. Diener (2005)
discussed how cultural varieties and societies shape subjectivity. Ryff (1989) argued that
the effect of cognitive life satisfaction in subjective wellbeing is shaped by socio-
demographic and personality factors, such as age, education, and personality traits.
Therefore, the outcome should be specific to the local context.
Therefore, factors attributed to wellbeing were used for the present research were
assessed through an investigation of expenditure and the use of extra money (refer to the
discussion on data collection in Section 2.4.3) against their income.

Chapter 2. Methodology _______________________________________________________________________
33
2.2.8 Strengths of SLA
One of the strengths of SLA is that it starts from a holistic analysis to identifying a
limited number of activities to make a practical difference to the wellbeing of poor
people at the household level. It analyses the daily lives of rural community members,
particularly the livelihoods of the poor, the nature of poverty and its links with different
aspects of people’s livelihoods as well as its complex and changing situation that affects
people’s livelihoods (Clark and Carney 2008).
As SLA is a holistic analysis, it helps to understand how fishers use their assets, benefit
from the marine resources and cope with tough conditions (Allison and Horemans 2006;
Ellis and Biggs 2001). This includes assessing the capability of communities to
implement a strategy that results in positive livelihood outcomes and assessing all the
external factors that might occur in the community. The strong relationship between
assets shapes how well the coastal communities access the natural resources. For
example, access to natural assets is affected by the social network which provides useful
information for natural resource management at the village level (Bodin and Crona
2007). This is supported by De Sherbinin et al. (2008) who found that how a person
mobilises other assets also affects the dynamic use of human and natural resources.
Therefore, SLA is useful to assess livelihoods in the context of MPAs.
Another strength of SLA is that people are the priority concern and the centre of analysis,
rather than the resources they use and the governments that serve them. It starts from the
premise that the poor understand their own property, value self-reliance and hold many
answers to their situation (Chambers 1995). Beaulieu (2002) explained that asset
mapping is somehow mapping the talents and skills of the people, and that the
integration of these assets and resources is very important for poverty development. In
the context of a fishing community, SLA helps in understanding how fishers confront
tough situations, such as monsoons, droughts and hard times (Allison and Ellis 2001;
Ellis and Biggs 2001). Thus, any developmental intervention in a coastal community
should be based on the community’s capabilities and capital (Allison and Ellis 2001).
Chapter 2. Methodology _______________________________________________________________________
34
In relation to MPAs where the introduction of management will likely lead to some
restrictions in the access to marine resources, coastal villagers who directly benefit from
marine resources will experience a shock and face potentially a greater level of poverty
(Cattermoul et al. 2008). SLA can help in understanding how changes will affect their
livelihoods and how people can cope with shocks as a result of restrictions.
2.2.9 Gaps in SLA
Sectoral approach at the implementation stage
Concerns and issues have been raised about the implementation of the SLA framework.
As SLA is anchored in the principles of holistic analysis and participation, it requires
long-term commitment and coordination of several institutions for its implementation.
Some scholars have argued about the practical aspects of this approach (Farrington et al.
1999; Allen and Sattaur 2002), raising, for example, the question of how different
sectors with different budgets and mandates could coordinate the SLA implementation
(Scoones in www.eldis.org Year; Clark and Carney 2008). Multiple sectors and
organisations need to understand the macro picture of the sustainable livelihoods of the
rural communities or there needs to be coordination among the actors. Otherwise, the
implementation of SLA will lose the spirit of the holistic principles.
Field practitioners
SLA is strongly associated with how well field practitioners translate and implement the
framework in the field. DFID recognised a gap between SLA and its practical tools, such
as participatory rural appraisal (PRA) where the critical issue of the implementation is
the ability of the staff to understand and implement the framework (Dearden et al. 2002).
Chambers (1995) warned that the success of SLA depends on the personal attitudes and
skills of the implementing staff. Similarly, Carney (2002) advised that some aspects of
the sustainable livelihoods approach depend on how implementing agencies address
these problems. Toner (2002) recommended that the implementing SLA bodies must
shift from being the owners of a project to being one of the stakeholder groups. This
allows local people to fully participate in analysing their assets, the situation they face,
Chapter 2. Methodology _______________________________________________________________________
35
their problems and the strategies that they employ. This enables the rural communities to
have control and direct their future development.
Markets
In the SLA framework, the market is considered as part of the transforming structure and
process (DFID 1999). The market is considered to be important as it provides incentives
for people, stimulates people to make choices, and enables them to transfer one type of
asset into another. Dorward et al. (2003) argued that markets might be overlooked during
the analyses of structure and process. De Haan (2012) suggested that SLA should not be
limited to a study of local livelihoods but should also consider how local livelihoods are
influenced by the global process. Trade is one example of how the global process shapes
local livelihoods. Dorward (2001) suggested that SLA needs to focus more on markets
and the dynamic changes in livelihoods, the wider economy and institutions as the
market relates to livelihood strategies that involve pathways and transitions from one set
of activities to another. Clark and Carney (2008) highlighted the need to develop the
market side of SLA and closer the link of market to the poor. Looking at the macro-
economy across scales or the wider market system would be useful to strengthen the
livelihoods (Scoones 2009).
At the beginning, the sustainable livelihoods approach was formulated to understand
poverty and identify effective poverty reduction actions. When developmental
intervention tries to jump through the poverty hoops, it needs economic growth (Will
2008). Productivity is not clearly articulated in the SLA framework. Economic growth, it
is believed, is a significant contributor to poverty reduction (DFID 2005) and economic
growth needs markets for goods, services and commodities (Tschumi and Hagan 2008).
The buying and selling process matters to the poor. Markets link the rural people’s
economy with a wider economy (DFID 2005). Local marine products are traded in the
high value commodity international market which can accelerate the local economy
(Bene et al. 2010). More accessible and competitive markets enable poor people to find

Chapter 2. Methodology _______________________________________________________________________
36
their own way out of poverty by providing more real choices and opportunities (Tschumi
and Hagan 2008).
Understanding market commodities, dynamics and participants can allow researchers to
better grasp the broader environmental, the social and economic processes taking place
and how both livelihoods and resource use can be made more sustainable (Ellis 2000). In
order to account for this gap, the present research combined SLA with value chain
analysis in order to gain a better understanding of the wider connections between
markets, livelihoods and marine resources.
Power relations
The sustainable livelihoods approach insufficiently explicates poverty and power
relations including gender issues (Ashley and Carney 1999). Scoones (2009) argued that
power and politics in SLA should move beyond the local level to examine wider
structures. With the knowledge of politics and power, normative commitments will be
more explicit and opportunities to deliberate upon the political choices inherent in
livelihood analyses will potentially emerge, which influences the sustainability of the
livelihood outcomes. Moser et al. (2001) suggested that SLA needs a stronger analysis of
power relations, institutions and sustainable development. The success of the sustainable
livelihood approach truly depends on power sharing. Therefore, stakeholder group and
institutional analyses are required to implement SLA (Ashley and Carney 1999). The
present study did not consider the politics across the scale as it focused specifically on
governance of the livelihoods.
Cultural context in SLA
The sustainable livelihood approach is based on people’s perspectives of their assets
(what they have), their problems and the employed strategies; therefore, it depends on
the local geographic and cultural context. The nature of the livelihood strategy is
different from one place to another place. Culture and tradition is very strong in many
places. Culture is defined as a whole way of life based on the shared meanings and ideas
related to where people belong, how they interpret the world and how they express their

Chapter 2. Methodology _______________________________________________________________________
37
thoughts and feelings in ways which will be understood by each other (Williams 1981).
Cultural meanings are generated not only by individuals but also collectives. Cultural
characteristics of people are shaped by ethnicity, and the classification of persons or
local groups as a member of ethnic groups (Barth 2010). These characteristics show how
the culture shapes the way things are done and why certain things should be done in the
daily life of a family and community. Culture influences how people see their wellbeing,
gives people identity and shapes how people interact with resources.
In the DFID framework (Farrington et al. 1999), culture is considered part of the policy
and institution component. Other research organisation such as CARE considers culture
as part of the shock and stress component (Cahn 2006). Cahn (2006) pointed out how
different organisations (such as the UNDP and Oxfam) did not specifically mention
culture. Cahn (2006) considered culture as an asset equal to natural, human, financial,
physical and social assets. She illustrated how cultural assets (such as heritage, customs,
traditions and values) are interwoven with every aspect of Samoan livelihoods.
Therefore, in her study of Samoa, she included culture as a separate asset that helped the
community in coping with vulnerability and drove the success of micro enterprise in
Samoa.
Tao et al. (2010) also argued that culture is a separate asset class. They identified culture
(beliefs, traditions, identity, language, sacred sites, ceremonies and festivals) as the
guiding context of people in selecting livelihood strategies and linking all of the factors
in the sustainable livelihoods framework. Cattermoul et al. (2008) identified culture as
part of the influencing factors that determine and affect what assets a person has access
to, as well as defining how broader society responds to their personal characteristics.
Davies et al. (2008) consider culture is not an asset or part of one or two assets but
culture is important factor that influences all elements of livelihood sustainability. It
allows people to innovate and adapt to changes in their environment, and norms and
rules that shape the acceptability of livelihood strategies among local people.

Chapter 2. Methodology _______________________________________________________________________
38
In my experience of using SLA for this research, culture sets how people think and act.
Culture influences people’s perspectives about their assets (what they have), their
problems and the strategies they employ. It is very difficult to understand assets and
livelihood strategies without understanding culture and tradition which play an important
role in the way people behave and act. As highlighted by Cunningham (2009), the way
people in Eastern Indonesia explore natural resources is integrated with their culture and
spiritual links. Culture shapes the daily lives of people on Pantar Island. Understanding
culture prior to assessing the assets also helps overcome some criticisms of SLA such as
lack of clarity in understanding how the assets work and are interwoven each other. This
is consistent with other studies where culture has been found to strongly influence how
people access and own their assets as well as how they make decisions about mobilising
their assets (Osseiweijer 2001; Cahn 2006; Daskon 2010). Thus, in the present study, I
did not specifically consider culture as an asset but considered how different cultural
elements influenced livelihood strategies and outcomes.
2.3 Value Chain Analysis as a Framework of Analysis
A value chain analysis (VCA) maps the production, processing, distribution and value of
a product from its production to end consumers (Hempel 2010). A value chain is a tool
to understand how a market operates and what and how value is distributed along the
chain of a certain product. It is a set of value-adding activities through which a product
passes from the initial production or design stage through different phases of production,
and final delivery to the consumer (Kaplinsky and Morris 2001). A value chain is
defined as “the full range of activities which are required to bring a product or service
from conception through the different phases of production (involving a combination of
physical transformation and the input of various producer services), delivery to final
customers, and final disposal after use” (Kaplinsky and Morris 2001:4).
Jacinto and Pomeroy (2011) explain a VCA systematically maps the actors (broadly
defined as the input providers, producers, sellers, processors, retailers and buyers),
distribution of benefits to each actor in the stages of the chain, and it considers micro and
macro aspects of production and exchange activities among actors (M4P 2008). The

Chapter 2. Methodology _______________________________________________________________________
39
interaction is not one directional, but works backward and forward (Hempel 2010).
Hempel also notes that the chain can be affected by the external surrounding
environment such as politics, inflation, the economic situation at consumers’ place such
as economic situation in China for international market and economic macro (Hempel
2010).
Value chain analysis has been widely used by industries and small-scale enterprises
since the work of Michael Porter on competitive advantage (Kaplinsky 2002;
Schreckenberg et al. 2010). According to Porter (1990), the efficiency or effectiveness of
business management is gained by meeting the requirements of the consumers and the
value of the product. Value flows from producers to consumers through several layers of
the supply chain.
Research and Development organisations have used this approach to improve the
participation of rural communities in the value chain of agricultural products such as
fruits, potato, mushroom (Subedi et al. 2007; Vermeulen et al. 2008; Marshall et al.
2006). The FAO considers the value chain in the fishery sector has similar
characteristics with agricultural products; and so this approach has been widely applied
in the fishery sector (Gudmundsson et al. 2006). In industrial fisheries, VCA has been
used to promote the efficiency of fish supply chains and routes to market (KPMG 2004;
Khan 2012; Islam and Habib 2013).
In rural development contexts (and relevant to this PhD research), VCA has been used in
a variety of contexts and countries to improve the participation of fish producers along
the chain. Examples include a pro-poor fish (Tenualosa ilisha) assessment project in
Bangladesh (Ahmed 2007); assessing the value of fish to the poor in the Mekong Delta
(Loc et al. 2010); and assessing the vulnerability of female fishers in Malawi (Kambewa
et al. 2009). Fish value chain analysis has helped in identifying solutions to increase
fishers’ income in communities in Nias Islands, Indonesia (Salagrama and Salka, 2010).
A number of toolkits and methods have been developed to assist with the VCA including
making market for the poor (M4P 2008), a guideline developed by ILO that focuses on

Chapter 2. Methodology _______________________________________________________________________
40
pro poor growth, job creation and decent work (ILO 2012), and specifically with gender
focus (Riisgard et al 2010; Williams et al 2010; Weeratunge et al 2010).
The role of conducting a VCA is to support the rural poor to improve their livelihoods
through upgrading their position in a range of natural resource-based value chains
(Mitchell et al. 2011). Intervention to strengthen the participation of fishers in a wider
regional or global market can be identified through a VCA. This is useful to support
local livelihoods and enterprise initiatives in coastal communities (Jacinto, 2004).The
VCA also helps in identifying the challenges fishers face in securing their livelihoods
within global and regional value chains (Loc et al 2010). The VCA scopes areas for
improving the role of local producers in the market – by increasing return and reducing
risks. The improvements to the participation of rural poor in the value chain can be
made, by increasing the total amount and value of the products that the poor sell and also
by increasing the margin of the poor (M4P 2008).
2.3.1 Steps in mapping the value chain
There are several steps in mapping the value chain of a product. Hempel (2010)
recommends linking all the steps in production, processing, and distribution together,
and then analyzing each step in relation to the preceding steps and the steps that follow.
M4P (2008) suggests several steps in mapping the value chain: 1) mapping the core
process; 2) actors involved in the value chain; 3) specified activities conducted by actors
along the value chain; 4) knowledge and flows of information among actors; 5) the
volume of product, actors and jobs; 6) the geographical flow of a product; 7) the value of
the product at different levels of the chain; 8) the relationship and linkages between
value chain actors; 9) the services that feed into the value chain (such as infrastructure,
regulation) ; and 10) the constraints for better value and potential solutions to get better
benefits.

Chapter 2. Methodology _______________________________________________________________________
41
Drawing from the above discussion, this study has applied the following steps in
mapping the value chains of selected marine products harvested by villagers from the
four communities in Pantar Island:
- Mapping the core process that occurs from inputs to final consumption of end
products in the value chain
- Describing the activities conducted by actors along the value chain
- Identifying leading actors and the relationship between actors
- Price setting by different actors which reflects the value adding that is transferred
along the value chain.
A VCA starts with understanding the core process that occurs from inputs to final
consumption of end products in the value chain (M4P 2008). The value chain is not a
fixed chain; rather, different processes of different products in the value chain occur to
get the products from producers to consumers (M4P 2008). The value chain of marine
products involves complex networks of production and trade (Wilkinson 2006; Hempel
2010), and sometimes involves parallel set of process (M4P 2008). Understanding the
core processes will help in mapping the value chain. The core processes along a value
chain involves input (such as gear etc), production stage where the fish are collected,
collection where fish are collected on the land, intermediary trade, retail marketing and
consumption as illustrated in Figure 2.2.
Figure 2.2: The Core processes of a value chain for a marine product
Source: Springer-Heinze, GTZ 2005 in M4P (2008)

Chapter 2. Methodology _______________________________________________________________________
42
Input such as equipment and raw material are needed to harvest, and are important in the
value chain of marine products. Production stage where involved collecting and
harvesting depending on either wild caught or farmed by fishers. The collection stage is
where the marine products are collected to be sold. In Pantar, the collection stage is
conducted either by fishers or local traders. Intermediary trade plays a significant role in
the value chain on Pantar Island. The product has to pass through several traders
although sometimes they do not add value to the product. Retail is the next process in the
chain before the product reaches the end consumers. Several products also need to go
through processing stage where they are transformed into different forms, such as what
occurs with seaweed and top shells. Although often depicted as a one directional chain,
intra-chain linkages are most often of a two-way nature. In reality, there could be more
complex steps in the process (Hempel 2010; Gudmundsson et al. 2006; Wilkinson 2006).
The second step relates to the activities conducted in every step of the chain. Every actor
has different activities to transform the product addressing the preferences of the
customers. The activities could range from receiving, processing, transporting and
selling. All the activities are conducted to capture the value of the customers.
The third step is the identification of lead actors along the chain. The value chain
analysis identifies the key actors in every level of the value chain, and the value that is
created from activities by the chain members. The powerful actors control the business
connection and how income is distributed among the participants (Tanner 2006;
Humphrey and Schmitz 2001). It is important to understand the types of relations among
the chain members and their power dependency to assess how benefits are distributed
(Grunert et al. 2005; Ribot 2005). I highlighted power and rules in actor relationship
because they can form barriers to entry (Kaplinsky and Morris 2001) to the existing
chain. A small number of lead actors is an indicator that regulation is needed to ensure
that actors are not using their power to control the market (Velde et al. 2006).

Chapter 2. Methodology _______________________________________________________________________
43
Pricing reflects the value-adding that is transferred along the chain (Brown et al. 2010).
The value-adding can be the result of several activities that transform the product into a
better quality product that fulfils customer requirements or the result of activities that
simply make a non-available product available to the market. This attribute is important
to help understand the distribution of benefits. The interaction process between actors in
determining the price also contributes to an understanding of power.
2.4 Research Process and Data Collection Methods
This section describes field research process (ethics, timeframe language used), methods,
data analysis, and research challenges.
The approach at the field level on Pantar Island and in Indonesia was mainly qualitative
(semi-structured interviews, focus groups and PRA methods). The participatory rural
approach methods were used to obtain data and information from local knowledge and
practices. This allowed the local communities to share their knowledge and express their
perceptions and values about themselves and their environment (Chambers 2008). White
and Pettit (2004) emphasised that material endowment, perception, social interaction and
cultural meaning can only be explored by the participatory approach, and PRA is
considered as one of the tools to explore these local values. Through the exploration of
community experience, I was able to reflect more closely their knowledge and how they
view the world themselves. This approach also enabled the local community to learn
skills and share in the research process (Chambers 1992).
2.4.1 Field research process
Research permit
The field research permit from the Alor Government was obtained on 18 June 2008.
During this visit, I also introduced myself to the Department of Marine Affairs and
Fishery, and Planning and Development Bodies of Alor district. Then, I delivered a copy
of the permission letter to the head of the sub-district and government village leaders of
the targeted villages. I used this opportunity to explain my visit to conduct discussions

Chapter 2. Methodology _______________________________________________________________________
44
with members of coastal communities, and briefly asked about the village’s condition
and the contact details of fishers.
Ethical considerations
This research received approval from the Human Ethics Committee of Charles Darwin
University (Reference number H08035) on 14 July 2008 before conducting the data
collection. The ethical considerations were taken seriously during data collection by the
following steps described below.
Prior to the interviews and discussions with the coastal villagers, I introduced myself,
explained the purpose of the research and the participants' rights, and asked if they
agreed to participate. I informed the participants about how the data would be collected
(such as taking notes, photos and audio-recording) and processed. Before taking pictures,
I asked the participants for verbal permission. If they objected, I would not take a photo.
In addition, I informed the participants that this research was a voluntarily discussion.
There were no consequences if they chose not to attend or chose to withdraw from the
discussion. The discussions and interviews were conducted in a relaxed manner. The
participants could inform me if they felt uncomfortable and needed a break, and the
discussion would be continued at some other time. I informed the participants about the
length of time the interviews and discussions would likely require. I gave them the
contact details of the Head of School as well as the University’s Ethics Officer in case
they had any complaints.
Confidentiality of the participants was maintained through several ways. All the
transcribed data was stored in my personal laptop that only I could access. The tape
recordings were erased immediately as soon as the file had been transferred to the
personal laptop. The details of the participants were not available to anyone.
Pseudonyms were used for all participants in this study in order to ensure their
anonymity and personal security.

Chapter 2. Methodology _______________________________________________________________________
45
I also hired research assistants, as discussed further below. They were selected
purposively based on several reasons including the locality and their ability to
communicate with the participants. Prior to conducting the interviews, they were
informed to keep the data and information confidential and advised that they should not
inform anyone about the results. All the hard copy interview sheets were given to me.
Field research periods
The data collection in the four villages was conducted in June and August 2008,
November 2009 to January 2010, and June and September 2010. These multiple visits
allowed me to experience different seasons in the four villages. During this period, other
trips were made to other parts of Indonesia in order to collect data on community
participation in existing MPAs in Indonesia (Chapter 4) and the marine product value
chain (Chapter 6).
First contact on Pantar Island
The first contact with an institution in Kalabahi, the capital city of Alor district was with
the coordinator of the “Pro-air project” funded by GTZ, the German Organisation for
Technical Cooperation, in June 2008. He helped me in building contacts with the local
government which was useful for getting a letter of research permission from the Alor
Government.
I stayed with a former facilitators of the Pro-air project GTZ in Kabir when I first came
to Kabir in June 2008. He was originally from Blagar village but he had a good
relationship with the communities, especially with the Bajau people in Labuhan Bajo
hamlet (dusun/sub-village) in Kabir. This good connection opened the door to
communicate with community members smoothly in Pantar and Baranusa. He
introduced me to the son of the traditional king of the Kingdom of Pandai, and informal
leaders on Pantar Island who knew Pantar history. In Kabir, I also stayed with one Bajau
family in Labuhan Bajo hamlet in January and June 2010. The matriarch of the family
was a papalele (fish trader). Staying in Labuhan Bajo allowed me to understand their
livelihood strategies and they talked openly when I stayed with them.

Chapter 2. Methodology _______________________________________________________________________
46
The “Pro-air project” facilitator also introduced me to people in Baranusa. We sailed to
Baranusa and he brought me to one of his family members’ homes where I stayed. When
I first arrived in Baranusa, we were welcomed by the ex-temukung (the head of sub-
district during the Dutch Era, see Chapter 3) in Baranusa. He was believed to be more
than 100 years old. He explained the history of the Kingdom, the marine resources and
the gear used in Baranusa. Then, I visited a government leader in Blangmerang, the
village secretary. Like a snowball, one contact brought me to other contacts in Baranusa.
After familiarising myself with the situation in Baranusa, I sailed back to Kabir.
From Kabir, I sailed to Kangge Island with a fisherman in Kabir who also farmed
seaweed in Kangge. We stopped by Lapang Island on our way to Kangge. At the first
visit to this village, I stayed in the village leader’s house. The house was located up on
the hill and not very far from the coast or village meeting point, around 100 metres from
the coastline. However, only a few people visited the villager leader’s house for village
administrative matters. Therefore, I considered the house was not strategic for me to
understand the village condition as it was not a meeting point for the communities.
During my second and third visits, I stayed in the village secretary’s house. The village
secretary house was located in the coastal area, was a meeting point for the community,
his wife was a local trader (seaweed and other marine products), he had a kiosk where
people met during the day and every night people watched television in his house. This
place was a perfect location for me to meet people.
When I first visited Kayang village, the Marisa village leader introduced me to the
secretary of the Kayang village. I stayed in the village secretary’s house. The family in
Kayang welcomed me. I also had contacts with Kayang community members from a
school girl in Kalabahi. When I was in Kalabahi in September 2008, I stayed once with a
Makasar family who host a girl originally from Kayang. She also brought me to
communities in Kayang village.

Chapter 2. Methodology _______________________________________________________________________
47
A good relationship and trust were built through discussion and evolved through time.
The communities asked questions about me to get a better understanding of me. I let
them ask questions. Many people asked where I was studying and quite a few people
knew about Darwin because several of them had even been apprehended in Darwin due
to fishing violations at the border of the Australia-Indonesia sea. People always asked
about my origin and some Bajau people had been to my hometown or had families living
on Bintan Island. Other communities on Pantar Island knew my hometown was a transit
for eastern Indonesian immigrant workers to work in Malaysia and Singapore or some of
them had worked in that area too. When I was not actively conducting research in the
villages, I sometimes sat around with groups of people, listening to their conversation or
joining in card games or their Komoti game (a wooden board that has 14 holes in two
sets of seven and the players move the seeds from one hole to the other holes). These
interactions helped melt the ice between me as an outsider and the communities.
Languages used
Most people were able to speak Indonesian language, which was the main language I
used to communicate with them as a native Indonesian speaker. However, people also
used their local languages to talk amongst themselves to discuss issues. Quite often
someone acted as an interpreter, translating the discussion as it was underway. People
were very eager to discuss their lives. People were open and frank if they did not know
about things or if I misunderstood what their meant. I frequently asked the same
questions that I used for group discussions after the discussions or even during a short
visit to the villagers’ houses at different times.
Research assistants
During the data collection, I was helped by research assistants to measure the fish size,
and map the product value chains and household surveys (see also Section 2.4.9). Two
assistants in every village recorded the type of fish landed and measured the fish size
randomly from December 2009 to May 2010. In each village, one person was a trader
and the other one was a fisher. I selected these eight people to help me measure the fish
size during my absence. When I was in the field, I recorded the fish size by myself. Then

Chapter 2. Methodology _______________________________________________________________________
48
I asked them to record the type and size of the fish when I was not in the village. I left
rulers and notebooks which they could use to make the recordings. Surprisingly, one fish
recorder, a woman trader in Labuhan Bajo hamlet was not confident in writing although
she was able to read numbers. She managed to record the information by ensuring other
people wrote while she measured the fishes. The measurer described that the fishers and
traders whose fish were measured were very helpful by telling my research assistants to
measure the landed fish on the coast. These eight people were not paid. I only left
souvenirs for them.
To map the marine product chains, I hired one assistant in Kalabahi, Lewoleba and
Ambon in 2009. Their job was to help me in mapping the number of traders for a
particular marine product, conducting interviews with the traders about the value chain
of the product using the prepared semi-structured questions sent to them via email, and
writing up the results of the interviews. They returned information to me by email
regarding two marine products (sea cucumber and top shells). The assistants in Kalabahi
and Lewoleba had experiences in community development work and socio-economic
surveys conducted by the government. One assistant in Ambon was a researcher from
Indonesia Research Center in Ambon (LIPI). I explored the marine products and the
traders in those places as it gave me a picture of the wider actors in the market. Apart
from these areas, I myself interviewed the traders in the village, at local markets and
observed how marine products were processed, traded and transported to buyers on
Pantar Island which is explained in the discussion about the semi-structured interviews
(Section 2.5.6) and Chapter 6.
2.4.2 Literature review
A literature review on a range of topics such as community participation, social and
economic factors in marine protected areas, coastal livelihoods, small-scale fisheries and
value chain analysis was conducted over the course of this research. With regard to the
involvement of local communities in MPA establishment, a wide range of literature
(published material, official and unofficial reports, statistical reports, maps, satellite
images, historical documents and websites in English and Indonesian) was reviewed and

Chapter 2. Methodology _______________________________________________________________________
49
analysed. This included an analysis of existing policies and regulations for marine
natural resource management in Indonesia and available information about other MPAs.
Data on the social and economic characteristics of the coastal communities of these four
villages on Pantar Island was reviewed, such as statistical data and published materials.
2.4.3 Methods used to collect the data
A wide range of methods was used to collect the data with a variety of community
groups such as user groups of marine natural resources. One topic might be covered by
several methods. All the tools were used with small groups.
Data for SLA was collected based on the attributes of each asset, vulnerability situation,
institution and process, livelihood strategies and outcomes. The attributes in the human
asset category were labour, knowledge and skills, and health status. The natural asset
category consisted of habitat status, marine products, collection spots and stocks.
Physical assets covered infrastructure and producer goods, while social assets related to
the social network. Meanwhile data on the vulnerability context was collated based on
shocks, trends and seasonality. Data about transforming structures and processes was
collected based on institutions, government, policies and laws. The attributes of the
livelihood strategies and outcomes were also collected.
Based on the attributes of human assets, data was collected using several methods (Table
2.1). The number of people as an indication of the labour force was collected from the
statistics office and village leaders’ notes. Meanwhile, data on knowledge and skills was
collected from statistical data for formal education and using PRA tools, such as focus
group discussion (FGD), pie chart of time allocation, and household (HH) surveys to
support the qualitative data.

Chapter 2. Methodology _______________________________________________________________________
50
Table 2.1: Methods used to collect data on human assets
Human Assets Methods 1. Labour force:
a. Number of household members b. Ratio of workforce: household composition, does outsourcing exist?
Secondary data Focus group discussion
2. Knowledge and skills: a. Formal education b. Knowledge and skills related to livelihood activities
Secondary data FGD HH survey
3. Ability to work a. Health facilities b. Access to adequate food (quality, quantity and culturally
accepted)
FGD Key informant
interviews
Data on natural assets was collected using various methods including qualitative and
quantitative methods (Table 2.2). The four attributes in natural capital were the status of
the marine natural resources. This includes habitat status, the list of marine products and
their status, and the knowledge of collection/fishing locations.
Table 2.2: Methods used to collect data on natural assets
Natural Assets Methods 1. Habitat
Secondary data Observation
2. Fishing location
FGD using maps Observation
3. Marine product stocks FGD Measurement of fish length Fish identification and locations Secondary data Key informant interviews
4. Land, trees, crops FGD Resource map Observation
Data on the attributes of physical assets was collected using several methods (Table 2.3).
Meanwhile, data collection for financial assets (saving, credits and financial institutions)
was collected using FGD, HH surveys and institutional analysis (Table 2.4). The
attributes of social assets (such as social network) were collected using several methods
(indicated in Table 2.5).

Chapter 2. Methodology _______________________________________________________________________
51
Table 2.3: Methods used to collect data on physical assets
Physical Assets Methods 1. Infrastructure:
a. Transportation: seaport, boat landing, public transport to the nearest market/city
b. Water supply and sanitation c. Energy
FGD Social map Observation
2. Producer goods: a. Fishing equipment b. Catch storage and ice supplies c. Kiosk and market buildings d. Mobile phone
Social maps Observation FGD HH survey
Table 2.4: Methods used to collect data on financial assets
Financial Assets Methods 1. Savings (cash) 2. Financial institution (e.g. bank, micro-credit institutions) and
credit access 3. Regular inflows of money (e.g., remittances)
FGD Institutional analysis Key informant
interviews VCA
Table 2.5: Methods used to collect data on social assets
Social Assets Methods 1. kinship relationship 2. local village institutions (e.g., local institutions, government,
NGOs, farmer groups) 3. Non formal institutions and networks (customary rules)
Stakeholder analysis using Venn diagram
FGD Key informant interviews Observation
Assessing external factors, beyond the assets, are also important in SLA (DFID 1999).
They are the transforming structures and process, the vulnerability context which creates
the livelihood strategies, and the results in livelihood outcomes (Table 2.6). In the
present study, the attributes of livelihood outcomes were cash income, wellbeing and
food in order to understand what people want to achieve in their life. In regard to
wellbeing, fulfilling basic needs and perceptions of wellbeing were assessed through the
use of extra money and the coastal communities’ perceptions of wellbeing (Chapter 5,
Section 5.5). Food is part of fulfilling basic needs but it is discussed separately as it is
the most important part of livelihood outcomes.

Chapter 2. Methodology _______________________________________________________________________
52
Table 2.6: Data collection methods on transforming structures and process, vulnerability
context and livelihood strategies and outcomes
Components in SLA Attributes Methods 1. Transforming structures and process:
Government relations Private sector relations Policy and law Culture
FGD Key informant discussion Literature review
2. Vulnerability context: Shocks Storms
Disease Drought Earthquake Volcanic explosion
Village historical line FGD Semi-structured interviews
with key informants Literature review
Trends Gradual changes of fish captured Market price fluctuation in several
products
FGD Trend analysis Literature review
Seasonality Monsoon FGD Observation Literature review
3. Livelihood strategies Fishing activities Seaweed farming Selling marine products Migration Handwoven textiles Other activities related to livelihoods
FGD Livelihoods scenario
4. Livelihood outcomes: Cash income
Subjective wellbeing: o fulfillment of basic need and
secondary needs (entertainment) o the use of extra money
Food
Wealth ranking (Pretty et al. 1995) and stages of progress (Krishna 2004)
FGD perceptions of wealthier family and the use of extra money
Pie chart for expenditure
Data for VCA was collected by putting leading questions to key informants (see also
Section 2.4.6). From the leading questions, the marine product chains were mapped. For
example, by identifying the supplier and buyer I then categorised the position of this
actor along the chain.
Data was found based on the attributes in every chain (activities, actors, governance and
price setting). Data about activities included information on receiving, processing,
transporting and selling. Meanwhile, data about actors was identified from business links
and who they did business with. Data about governance in the form of relationships
Chapter 2. Methodology _______________________________________________________________________
53
between actors was extracted from several questions such as the nature of the
relationship, how they interacted (rules of agreement in business transactions, channel of
information, and reward system). Competition to get products is important to ensure
business could keep running. The leading questions related to how they knew the
suppliers, any prior agreement in the transaction, competitors in getting the products, and
challenges to ensure supplies. This led to information about power which was also
extracted from questions that covered business negotiations, price setting, who
determined the quality of products, and size of the business. Finally, data about price
was collected by using leading questions such as who decides the price, how the price is
determined, and the factors affecting price. One question led and interlinked to another
question to gather data about these attributes.
2.4.4 PRA
A range of participatory rural appraisal tools were used during focus group discussions
with user groups of marine natural resources (Pretty et al. 1995; Kumar 2002; Ellis and
Mdoe 2003; Pomeroy and Rivera-Guieb 2005; IFAD 2009). DFID (2000) stated that
participatory techniques help to derive the key characteristics of local community
livelihoods. These include: 1) space-related methods (resource map and mobility map);
2) time-related methods (trend analysis, historical line, seasonal diagram, daily activity
schedule) (Figure 2.3); and 3) Venn diagrams to understand the structure of the political
hierarchy and the structure of organisations, as well as links between organisations and
agencies. A wealth ranking was used to obtain community perspectives on wellbeing and
livelihood circumstances (Pretty et al. 1995). As follows, the ultimate goal of life was
assessed using a stage of progress exercise1 (Krishna 2004; Frey and Stutzer 2002).
These tools were used to guide the conservation during the focus group discussion, as
described in the next section.
1 The stage of progress exercise is conducted to determine collectively what constitutes a state of poverty and the priority. The initial questions were: Which expenditures are the very first ones to be made? As more money flows in, what does the household do in the second stage (not poor), and in the third stage (rich)?

Chapter 2. Methodology _______________________________________________________________________
54
Figure 2.3: Photos of several examples of PRA tools used Photo A: Village mapping of Kayang village. Photo B: Seasonal activities in Labuhan Bajo. Photo C: Activities conducted by women in Marisa every day. Photo D: Resource map in Lapang Island by Blangmerang villagers. Photo E: Assessing the pentagon asset of Coral Trout.

Chapter 2. Methodology _______________________________________________________________________
55
2.4.5 Focus group discussions
In a focus group discussion, a group of people gather together to discuss an issue of
concern (Liamputtong 2009). A focus group discussion allows the participants to
illustrate what people know, what people do, what people believe and to express what
they think. A focus group discussion enables the participants to discuss complex issues
beyond the individual scope (Bungin 2007). Each participant can contribute and control
the shared information.
To prepare for the FGD, I talked with informal and formal leaders in each village to
identify the targeted groups. The criteria of the participants of the small groups were the
community group members who access and benefit the most from marine natural
resources. The village leaders told me about the settlements of fishing families and
clarified several types of villagers’ livelihood activities. Having obtained a summary of
the marine user groups from the village leaders, I then made arrangements to meet with
the selected groups. The participants were invited verbally by village leaders (e.g.,
Kepala Desa, Ketua RT, Ketua RW) and also announced in the mosque by religious
leaders. I also invited people whenever I met them on the street or when there was a
group of people gathered who were identified as marine users. I conducted discussions
with women and men separately in every village in order to gain a better understanding
of different perspectives.
I facilitated the discussion and took notes. I asked questions, used PRA tools to get
structured information as described in the previous section and recorded all the
information on large sheets of paper (A0 size) to allow the participants to read and verify
the results during the discussion. These two tasks slowed down the discussion but
allowed me to clarify if there were any unclear terms or issues during the discussion. An
example of the focus group discussion held in Marisa village is shown in Figure 2.4. All
the data was transcribed into a computer file at the end of the day.

Chapter 2. Methodology _______________________________________________________________________
56
Figure 2.4: FGD in the villages Photo A: FGD for women’s group was conducted after collecting stones for mosque construction. Photos B and C show the FGD for feedback session in Marisa village where men, women and children joined the discussion.

Chapter 2. Methodology _______________________________________________________________________
57
The total number of focus group discussions conducted from June 2008 to July 2010 was
31 recorded group discussions. This involved approximately 233 people, as summarised
in Table 2.7, excluding people who joined the feedback sessions. This number excluded
people who left before the discussion finished due to time concerns and other things to
do or people who joined in the discussion after it had commenced.
There were sometimes unprepared and unplanned discussions that were conducted
without prior arrangements. I just jumped into the crowd when people gathered together
informally in certain locations. For example, unplanned discussions took place with a
group of women collecting shells on the seashore, women peeling tamarind, women
sitting in front of their house in the afternoon, and a group of men fixing nets. This also
increased the number of people involved in the discussions (Table 2.7).
Table 2.7: Number of people and focus group discussions conducted in 4 villages
Village Labuhan
Bajau Blangmerang Kayang Marisa
Period of FGD
Group discussions
F M F M F M F M FGD 1 7 5 14 5 7 8 15 12 FGD 2 5 12 6 5 8 - 17 -
June-August 2008 FGD 3 5 5 - - 4 - - -
FGD 4 10 - 5 6 10 8 30 16 Nov 2009-Jan 2010 FGD 5 - - 3 - - - 5 - Sub-total 27 22 28 16 29 16 67 28 June-July 2010
Feedback sessions
3 23 9 9 2 10 3 28
Total 30 45 37 25 31 26 70 56
Note: F= Female participants, M= Male participants
The format of FGD 1, 2 and 3 generally followed introductions and discussion around a
number of topics relating to fisheries and the fishery sector on Pantar Island as
summarised in Tables 2.1, 2.2, 2.3, 2.4, 2.5 and 2.6. This included marine resource use,
species sought and gear used, time spent conducting activities, daily household expenses,
and incomes and contributions from fishery-related activities to households (food and
income). In addition, a scaling system was used to discuss the status of assets in relation
to marine product harvest (presented in Section 5.2.7).

Chapter 2. Methodology _______________________________________________________________________
58
The format of FGD 4 and 5 focused more on post-harvest and marketing activities of
some key marine products such as fish, sea cucumbers, seaweed and top shells. I used a
mobility map to draw the flow of products and the market. These meetings tended to be
attended by much larger numbers of people, especially in Marissa village. In the
feedback session, I presented back the results from the previous discussions to the
participants in order to consider and clarify any uncertainties. The participants could
argue and clarify during the presentation. If there was a debate on an issue, further
discussion was conducted. In most cases, the participants agreed with the results of the
presentation.
The focus group discussions help the participants to express their thoughts in a more
relaxed manner when they see others having the same experience (Liamputtong 2009).
However, Liamputtong (2009) pointed out the drawbacks of this method. Not all
participants actively participate in a group discussion and the participants might find the
discussion is tiring as time goes on. To avoid these obstacles, I tried to facilitate the
discussions in a relaxed manner and in informal settings, such as locations where women
normally gathered to work together. I asked questions to those who rarely spoke in order
to seek their views, and whether in fact they agreed or otherwise with the outcomes of
the discussion. If the latter case, further information was sought and raised with the
entire group in follow-up discussions. Tension sometimes occurred but some rules were
previously agreed upon, including that the issues were only to be discussed in the forum
and that the facilitator would adopt a neutral role.
2.4.6 Semi-structured interviews
Semi-structured interviews with key informants were used to collect information about
experiences in the existing MPAs in Indonesia and the product chain. This technique
enables researchers to explore the complexities of a problem and the perspectives of the
key informants. Gillham (2000) highlighted that the thoughts and feelings of the
participants depend on the context. Therefore, the information collected through semi-
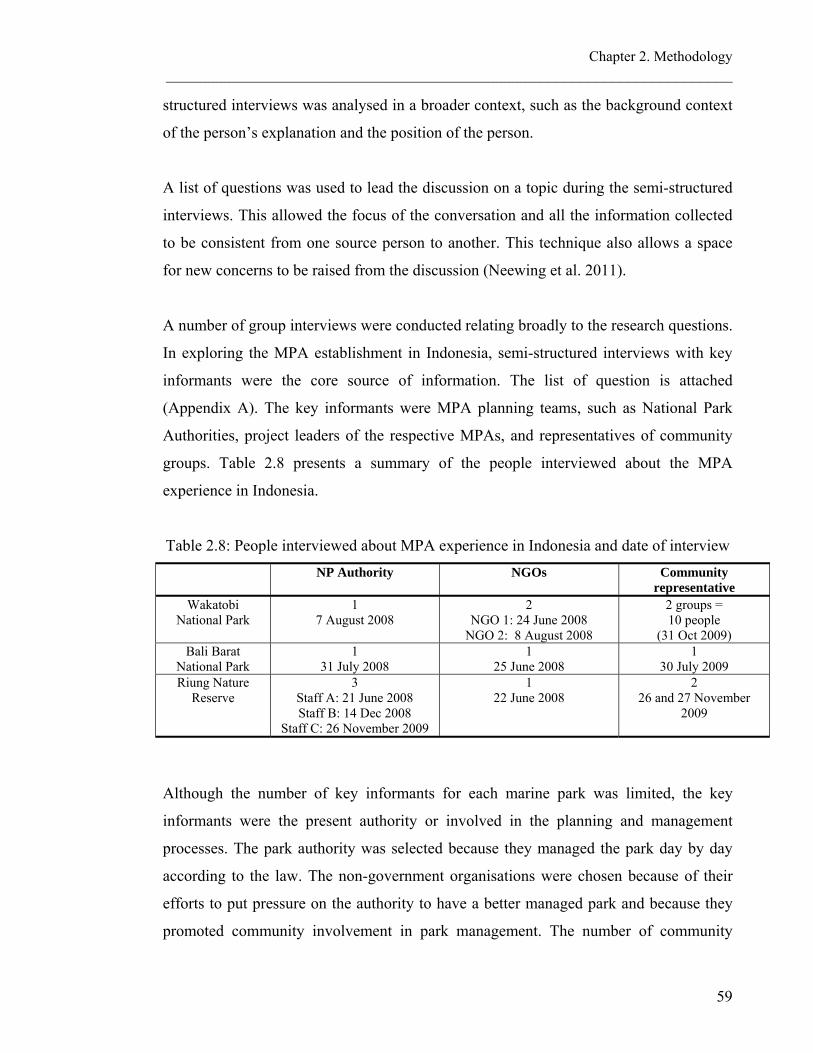
Chapter 2. Methodology _______________________________________________________________________
59
structured interviews was analysed in a broader context, such as the background context
of the person’s explanation and the position of the person.
A list of questions was used to lead the discussion on a topic during the semi-structured
interviews. This allowed the focus of the conversation and all the information collected
to be consistent from one source person to another. This technique also allows a space
for new concerns to be raised from the discussion (Neewing et al. 2011).
A number of group interviews were conducted relating broadly to the research questions.
In exploring the MPA establishment in Indonesia, semi-structured interviews with key
informants were the core source of information. The list of question is attached
(Appendix A). The key informants were MPA planning teams, such as National Park
Authorities, project leaders of the respective MPAs, and representatives of community
groups. Table 2.8 presents a summary of the people interviewed about the MPA
experience in Indonesia.
Table 2.8: People interviewed about MPA experience in Indonesia and date of interview
NP Authority NGOs Community representative
Wakatobi National Park
1 7 August 2008
2 NGO 1: 24 June 2008
NGO 2: 8 August 2008
2 groups = 10 people
(31 Oct 2009) Bali Barat
National Park 1
31 July 2008 1
25 June 2008 1
30 July 2009 Riung Nature
Reserve 3
Staff A: 21 June 2008 Staff B: 14 Dec 2008
Staff C: 26 November 2009
1 22 June 2008
2 26 and 27 November
2009
Although the number of key informants for each marine park was limited, the key
informants were the present authority or involved in the planning and management
processes. The park authority was selected because they managed the park day by day
according to the law. The non-government organisations were chosen because of their
efforts to put pressure on the authority to have a better managed park and because they
promoted community involvement in park management. The number of community

Chapter 2. Methodology _______________________________________________________________________
60
representatives was limited because I assessed the strategy taken by the marine reserve
authority and planning team who played an important role in providing meaningful
community participation (Buanes et al. 2004; Jentoft and Buanes 2005; Oracion et al.
2005; Chambers 2008). The interview with the community was used to check and
balance the information as well as assessing the community’s perspective.
The discussions with the key informants took two and a half to three hours on average.
The interviews with representatives from the planning team in each reserve were
conducted two to three times, while discussions with the key informants from the park
authorities were conducted once with each person. The interviews conducted to explore
the three case studies in Indonesia were held between July and August 2008, and in 2009
(Table 2.8) using several communication modes, such as telephone, intensive email or
face-to-face meetings. The results are presented in detail in Chapter 4.
Semi-structured interviews were also used in the livelihood data collection among the
Pantar Island communities, to enquire about the history of the settlement of the villages,
and to verify the information collected during the focus group discussions such as the
health status, natural resources changes over the years, the history of gear used, village
institutions and factors in the vulnerability context. Around ten people in each village
were interviewed, including women and men. This included the informal leaders
(women and men), fishermen and fisherwomen.
Semi-structured interviews were used to interview people about the value chains of
selected marine products (Chapter 6). A summary of the people interviewed for value
chain analysis is presented in Table 2.9. A range of key questions was asked to the
different types of traders about their business, volume of trade, quality of products,
investment, other actors in the value chain, flow of products, agreements and rules and
competition among actors, perceived trends and future possibilities for producers
(Appendix B).
At the village level, I interviewed people who were recommended by the communities or
mentioned during the focus group discussions. Two focus group discussions were held in

Chapter 2. Methodology _______________________________________________________________________
61
the four villages for seaweed and fish-based products during my visit from November
2009 to January 2010. I did not conduct focus group discussions for top shells because
only a few people collected this product, so the data was collected through key informant
interviews (Table 2.9).
In the write-up of the interviews, Trader I, refers to a buyer who buys from a village
trader, while Trader II buys product from Trader I. Trader 1 is a kind of bulk collector in
that area. An example of Trader II is a trader in Kalabahi. Twenty-seven sundried fish
traders in Kalabahi who sold in several markets in Kalabahi were interviewed during
November-December 2009. I also interviewed other actors in Jakarta, Makassar,
Surabaya, Bali, Ambon, Kupang, Lewoleba and Kalabahi. In addition, two shipping
companies in Makasar were consulted because they were sometimes contacted by traders
on Pantar Island or by the boat owners who sailed to Pantar Island to sell the marine
products. For seaweed, I visited two factories in Surabaya and Makassar to observe the
process of Carrageenan powder production. Exporters sometimes acted as traders, and
therefore were categorised as traders too.
Although the international actors were not able to be formally interviewed, I managed to
interview four people from the industry who were involved in international trade for
seaweed during the “Seaweed Business Forum” held in Surabaya, Indonesia on 15-16
July 2010. I interviewed two traders visiting from China for the sea cucumber trade in
Makassar on 29 May 2010 at Makassar. A trader who also acted as an exporter
introduced me to the Chinese traders.
I interviewed people from the Ministry of Marine Affairs and Fisheries at the district and
national level to gain their perspectives about policy. Regarding NGOs, I interviewed
two NGOs in Makassar and one NGO in Bali that had been involved in seaweed
activities for a long time.

Chapter 2. Methodology ____________________________________________________________________________________________________________
62
Table 2.9: People interviewed for mapping value chains of marine products
Intermediary Trade (Traders at several levels)
Industry Policy makers/Researchers Product
Village I II Exporters National District National
NGOs To-tal
# 5 # 4 # 8 # 5 # 2 # 1 # 1 # 3 29 Seaweed
9 Feb 2010 Feb 2010 July 2010
Oct 2009 Sept 2008 and 2009 Oct 2009 August 2009
August 2009 30 Nov 2009 20 Dec 2009 7 June 2010 Jan 2010 Dec 2009 and
21 Jan 2010 Feb 2010 and
June 2010 Oct 2009
17 May 2010 20 May 2010 24 May 2010 26 May 2010 27 May 2010
4 September 2009
25 July 2009
Nov 2009 – Jan 2010
9 September 2009 and discussion by email
28 July 2009
13 and 19 August 2009
July 2010
# 2 # 4 # 1 # 1 # 2 Top shells -
Sept 2008 Dec 2009
August 2009 June 2010
-
29 July 2009 Nov 2009 Jan 2010
9 July 2009
July 2009
10
# 1 # 6 # 2 # 6 # 1 # 1 Sea cucumbers July 2010 August 2009
Feb 2010 & June 2010 22 dec 2009 22 dec 2009 August 2009 Sept 2009
August 2009 23 May 2010
Jan 2010 Jan 2010 20 May 2010 27 May 2010 29 May 2010 8 June 2010
- Nov 2009 – Jan 2010
- July 2009 17
# 3 # 3 # 27 Sundried fish Jan 2010 Jan 2010 Nov-Dec 2010
- - - - 33
# 2 # 1 #2 Frozen fish
Jan 2010
-
Nov 2009 Jan 2010
-
30 Nov 2009 June 2010
- - 5
Total 11 15 42 11 5 3 4 3 94
Note: Trader 1 means a buyer who buys from village trader, Trader II means a buyer who buys product from Trader 1

Chapter 2. Methodology _______________________________________________________________________
63
2.4.7 Marine product measurement
The measurement of the length of marine products was used to examine the
sustainability of fish in the Pantar region. The data was used to support the natural asset
data (see Table 2.2). Length is most often used in research of this kind as it is easy to
measure (King 1995).
There are three ways in measuring fish length: the total length (from the snout to end of
the caudal fin), the standard length, and the fork length where the fish is measured from
the snout to the tail (Gloerfelt-Tarp and Kailola 1981). For the purpose of the present
study, I only used the standard length as it is capable of being easily and accurately
measured (King 1995). The standard length refers to the length from the tip of the snout
to the posterior end of the last vertebra or to the posterior end of the mid-lateral portion
of the hypural plate (Gloerfelt-Tarp and Kailola 1981; Lieske and Myers 2002; Ong
2007). Simply, the measurement excludes the length of the caudal fin (Figure 2.5). This
simple description helped me in explaining to the fishers and traders who assisted in
measuring and avoided mixing up measurements of the length of the fish in the field.
Meanwhile, the top shells were measured based on their basal diameter (Purwati 1996).
Figure 2. 5: Method in measuring fish length (Source: Gloerfelt-Tarp and Kailola 1981: Plate 1)

Chapter 2. Methodology _______________________________________________________________________
64
I trained one fisher and trader in every village. The methods in this training were by
showing them how to measure the standard length of a fish (Figure 2.6). We practised
measuring the real fish. They observed me in measuring fish length for several days.
Then, I observed them measuring the fish and recording the measurement. They
continued recording until May 2010 although I was not in the field during all that time. I
chose two fish landing spots in each village. Approximately 21,000 pelagic and demersal
fish as well as 203 trepang and 254 top shells were measured from December 2009 to
May 2010 by the research assistants in the four villages. The resulting data is explained
in detail in the discussion in Chapter 5 on natural assets and presented in Appendix C, D
and E.
Figure 2. 6: Measuring Tectus niloticus and fish
2.4.8 Marine product identification and locations found
In order to understand the species and fisheries on which livelihoods were dependant, I
undertook to broadly identify the species of fish/marine products harvested as well as the
general habitats/locations where particular species were found (see Table 2.2).
Handbooks of coral reef fish (Lieske and Myers 2002; Allen 2004) and maps of Pantar
Island were important tools to assist the discussions with the villagers as part of the
focus group discussions. I showed them pictures of fish from the books, and they
mentioned the local names of the fish and the locations of favorite fishing grounds. The
fishers also pointed on the map to the location of their favorite fishing spots for a

Chapter 2. Methodology _______________________________________________________________________
65
particular species. A list of fishing spots was also gathered from the fish measurement
catch log data (see below). Almost all of the information about fishing spots was cross-
checked by visiting the fishing locations with the fishers by boat rides on three occasions.
In addition, I took photos of the fish. I verified the fish pictures from the Internet
(www.fishbase.org) and the literature (Allen et al. 2003). This information and the
pictures were verified by the people who worked in the fishery sector. In some cases it
was difficult to identify the fish species. In this situation, the identification of fish could
only be made at the genus name level.
2.4.9 Household survey
A household survey was conducted to assess the individual households’ cash income,
fishing methods, and the duration of fishing activities per household in the four villages.
The intention was to complement the data that I collected from the focus group
discussions and semi-structured interviews. The household survey in every village was
conducted in December 2009-January 2010, during the west monsoon when fish were
abundant.
The number of households and respondents surveyed was 100 households in total and 25
respondents in each of the four villages. 13% of the respondents were women (wife of
the head of the household). The respondents were selected based on selecting every fifth
house in each sub-hamlet in every village to ensure the representation from each sub-
hamlet of every village. The respondents were the heads of households or the wives or
adult siblings of the head of household who knew about the family livelihood.
The respondents were asked about the main livelihood activities by household members,
the duration of the activities conducted per day, number of days in a month and the
month in which the activity is done, products, and the selling prices (Appendix F). Data
was extrapolated to describe the fishing method, duration of time used for preparing
fishing gear, and cash income.
Chapter 2. Methodology _______________________________________________________________________
66
The calculation of cash income from the household survey was the approximate amount
of total cash income per year (see also Section 2.4.12). This was due to the information
provided by respondents being highly dependent on people’s memories about the
activities conducted for the whole year, the season of the activities and the average fish
catch. The respondents also had to provide information about the related livelihood
activities of other family members. For example, the head of household was asked to
answer questions about his wife’s activity or his wife was asked to provide information
about the average fish catch which might be traded in the market at the nearest fishing
spot. The resulting estimates might undervalue the total income of the fishing family.
Unclear information regarding the livelihood activity sometimes occurred, so
verifications among the respondents and other family members were conducted to
collect better data about their cash income. The results of the household survey are
discussed in detail in Chapter 5 in relation to livelihood outcomes. The detailed data is
presented in Appendix G.
This household income was calculated during one off household interviews. I recognise
other methods such as Poverty and Environment Network/PEN that used recollection
approach (Lund et al 2008; Pouliot et al 2010; Tesfaye et al 2011) that allow more in
depth understanding on household incomes, but this was considered not a major focus on
this study hence the reliance on an estimate based on one off household survey, but
verified through FGD as discussed earlier in this section.
2.4.10 Observations
The methods described above were complemented by personal observations to identify
the communities’ social and economic activities, resource use patterns and assets:
including what people actually do, how they do it and the setting in which they operate
(Gillham, 2000). I took photos to help record the observations. In order to allow better
observation of the events or activities, I sometimes participated in the activities or
sometimes only acted as an observer. An example of my participative involvement was

Chapter 2. Methodology _______________________________________________________________________
67
accompanying the papalele to the markets. In addition, I participated in separate fishing
trips with three different fishermen in their motorised boats (15hp engine) in order to
observe fishing locations. They also showed me other fishers’ fishing grounds and I
managed to identify the fishing locations that were mentioned during the focus group
discussions. I also joined the 20 GT wooden boat of a buyer from Kupang. The buyer
anchored the wooden boat near the fishing grounds so the fishermen could sell the fish
directly on the sea. We sailed from Kangge Island to Rusa Island. This observation
enriched the collected data.
2.4.11 Triangulation
In order to ensure the accuracy of the collected data, several techniques and sources of
information were used to verify the data and information (Yin 1993; Miles and
Huberman 1994; Liamputtong 2009). Follow-up discussions were always conducted
with individuals from the focus group and or others with knowledge of particular issues
or topics in order to expand on information or other sources. For example, follow-up
discussions were conducted with other fishers, village leaders, local buyers and relevant
local government staff. In addition, I attempted to be consistent by asking the same
questions with different groups at different times.
I applied a number of methods to ensure the information gathered during the focus group
discussions was objective and representative of the livelihood activities of the population
in each location. As mentioned above, these focus group discussions were
complemented by key informant discussions with between 8-10 other men and women
(either identified by members of the focus group discussions for their local knowledge
and/or seniority and experience in the fishery sector activities) in order to clarify and
cross-check the information gathered during the focus group discussions. The data was
complemented by personal observations of a broad spectrum of fishing-related activities
in different seasons.

Chapter 2. Methodology _______________________________________________________________________
68
The cause-effect relationship of livelihoods and the degree of community dependence on
marine natural resources were explored. The result of the analysis was presented back to
the community at a feedback meeting in order to gain clarification, to enable the
community understand the research process and also to enlist the community to help in
data analysis by clarifying the cause and effect of events due to their knowledge in the
local context of assessing the causal effect.
Some of the questions related to the history of the MPA planning processes which took
place some years ago was cross-checked with written documents, websites and other key
informants (people) recommended by the respondents. For example, if key informants
could not remember a particular date, then I checked the associated parallel event in
written documents or websites. I verified policy issues with personnel in the
Perlindungan Hutan dan Kelestarian Alam (PHKA) (translated in English as the “Forest
Protection and Nature Conservation”), and the Ministry of Forestry and Marine Affairs
and Fisheries in Jakarta. For example, when a Park Officer responded that no technical
guidelines were provided for community participation in the Forestry Department, I then
verified this with the Head of Community Empowerment Division in PHKA-Ministry of
Forestry in Jakarta.
2.4.12 Data analysis
The qualitative data was analysed by sorting the data into themes and studying the
interrelations among the variables in order to build a logical chain of learning
(Huberman and Miles 1994; Creswell 1998; George and Bennett 2005; Moisander and
Valtonen 2006; Pawson 2007). Vayda (2009) explained that a causal explanation reports
what affects the occurrence of particular events, the entities in the causal relationship
and the nature of their relatedness. According to Pawson (2007), the causal explanation
is not a matter of one element (X) or a combination of elements (X1, X2) asserting
influence on another (Y); rather, it is the association of all the variables and operates in
specific contexts, making it important to analyse contexts. Therefore, understanding the
causal effect using a case study through qualitative methods provides a rich

Chapter 2. Methodology _______________________________________________________________________
69
understanding of contexts and helps define construct validity in terms that make sense to
stakeholders on the ground (Stern et al. 2012).
For the purposes of this research, the data and information were organised based on the
components of the sustainable livelihoods framework (assets, policies, strategies and
vulnerabilities and outcomes) and value chain analysis as discussed in the previous
section. Accordingly, the exploration of causal conditions and the relationship between
livelihoods, the value chain of marine products and marine natural resources was
conducted. Thus, the analysis was conducted by integrating the summary data focusing
on the impacts of an MPA on the communities’ livelihoods, assets and activities.
With respect to the quantitative data, the fish length and household survey data
(discussed in detail in Chapter 5) was analysed using descriptive statistic analysis. This
means the processed data was used to summarise the data patterns (Burdess 1994). The
means, median, frequency and group intervals were used to present the fish data by
using Excel software. The fish length data was contrasted with the first maturity at
length based on the literature in which the term “first maturity” is used to describe a fish
spawning for the first time (Cailliet et al. 1986). The results of the fish measurement can
be used to assess the status of fish in the Pantar Island region, thus contributing to
conservation considerations.
The cash income data per household was calculated from the products harvested and
selling prices. The method to obtain such information was asking the respondents about
their major source of cash income, selling price per unit and the amount of products
traded. If the respondents did not report the profit, then the profit was calculated from
the unit price multiplied by the volume and minus the costs, information about which
was gathered during the focus group discussions (e.g., involving the papalele, women
traders, and sellers of traditional food snacks).
In the household survey, the sampling error (percentage) was used to show the
difference between the statistics and the population (Hamburg 1985; Eriyanto 2007).

Chapter 2. Methodology _______________________________________________________________________
70
The equation of sampling error in a limited population was used as follows (Eriyanto
2007):
E= 2. (1 ) ( 1)
( 1)
NZ p p
nN
Z refers to the confidence level which is the probability another statistic will get the same result. If the confidence level is 90%, the z value is 1.65 based on standard score for z in statistics. If the confidence level is 95%, the z value is 1.96. p is the probability value E is the sampling error N is the population n is the sampling size. With 100 respondents in 810 households in four villages, the sampling error was 5% and
the confidence level was 90%.
2.4.13 Research challenges
Working across four villages was very challenging in terms of time. However, the
approach used enabled adequate coverage of the issues being investigated. I built
comfortable situations in which the community could discuss things with me. Unplanned
meetings, social events and long discussions sometimes happened which meant I had to
adopt a flexible approach in the field.
This research used several participatory methods that made me rely a lot on meetings
with people. Sometimes, the discussions were attended by more than 20 people which
created a crowded situation. I still conducted the discussion and then verified the data
after the discussion with the people who continued to sit around. There was a time when
the discussion was attended by fewer than five people. I had to reschedule or redo the
discussion with the same characteristic target group.
Although this research was qualitative in nature, a quantitative approach was also
applied. For instance, the sizes of the fish captured were measured in order to highlight

Chapter 2. Methodology _______________________________________________________________________
71
the sustainability issue of fish status in the Pantar Island region. This measurement
enabled this research to explore fishery-related concerns in this area. However, this
research did not measure the quota of fish captured and did not undertake a population
analysis of the fish stock. Therefore, no suggestions can be made regarding the
determined quota if a quota system is applied (Hinrichsen 2009; Doyen et al. 2012;
Sanchirico 2008).
With regard to the measurement of the fish, almost all the fish measured during the
measurement period were reef fish. The small pelagic fish were also measured but there
had been a misunderstanding in the sampling. I was thus aware of this bias in the
sampling. However, the small pelagic fish were important for fishers, in recognition of
which the data was still used to describe the fish stocks.
Fish identifications were the most challenging activities. The fishers used local names
and the English and Latin names were verified based on a fish handbook (Lieske and
Myers 2002). Sometimes two or three species of fish were called the same name. For
example, wehung in Alor language or Kiapu meang in Sama language or Coral Trout in
English could be considered as Cephalopholis sonnerati, Cephalopholis miniata,
Plectropomus leopardus or Cephalopholis urodeta. Another example is Kerappung in
Alor language or Kiapu in Sama language, which could be four possible Emperor or
Lethrinus spp (Lethrinus miniatus, L. borbocus, L. lentjan and L. nebulosus). In order to
contrast with the first maturity at length from the literature, the most caught species from
the fishers’ perception were used.
In mapping the marine products, I traced the products from the local level to the national
level. I was unable to interview actors at the regional or international levels, although I
interviewed people who had experience in international trade. This was because of the
language barrier as I was not able to speak Chinese languages, including Mandarin. Thus,
it made it difficult for me to communicate with them even though I sent emails to several
companies in Hong Kong, China and Singapore. Thus, I only interviewed people at the
national level. I explored the international trade such as seaweed and sea cucumber trade

Chapter 2. Methodology _______________________________________________________________________
72
as I met one sea cucumber trader from China in Makassar and three international actors
(or traders) in Surabaya (who traded with one company from China and two companies
based in the Philippines) during the Seaweed Business Forum on 15-16 July 2010.
I visited stores that sold sea cucumber in Singapore but was not able to communicate
with the owners as they spoke Mandarin only. Some people suggested that I should offer
them products with detailed quality and quantity, and then they would reply to my
emails. As I was bound to conduct ethical research (according to the Human Research
Ethics Guidelines) including that I have to provide prior information to participants
about my research and its consequences, I chose not to carry out this type of clandestine
interview.
In the next chapter I provide the environmental, social and economic context to the four
villages in Pantar Island.
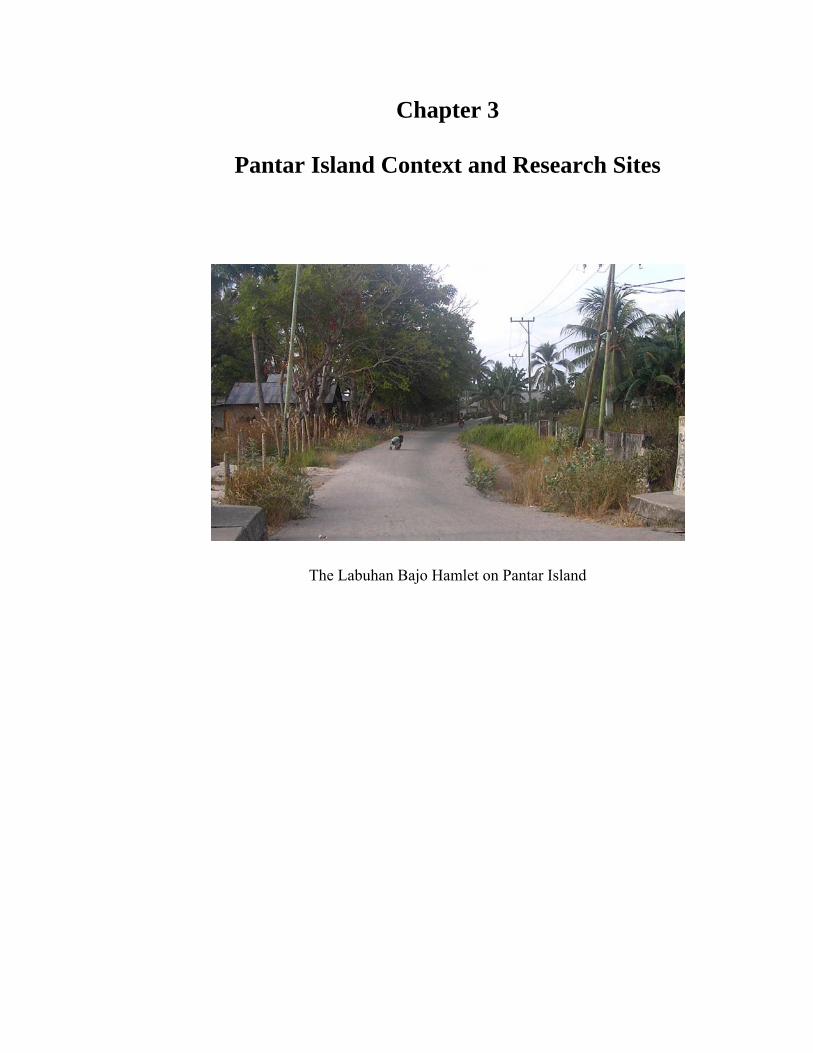
Chapter 3
Pantar Island Context and Research Sites
The Labuhan Bajo Hamlet on Pantar Island

Chapter 3. Pantar Island Context and Research Sites _____________________________________________________________________________
73
Chapter 3: Pantar Island Context and Research Sites
This chapter begins with a description of the geography, climate and marine biodiversity
of Pantar Island. In order to set the scene for the case study locations, the discussion in
this chapter situates Pantar Island within the local, national and regional context. An
overview of the local history of the settlements, languages, administration and economy
of the people living on Pantar Island is provided. The four case-study villages (Labuhan
Bajo hamlet (dusun) in Kabir village, Blangmerang village, Kayang village and Marisa
village) are broadly described covering the history of these settlements, their location,
physical development, administrative system, demography and ethnicity of residents,
and infrastructure and services.
3.1 Location, Climate and Marine Biodiversity of Pantar Island
Pantar Island is located to the north of the Sawu Sea, between Alor and Lembata Islands
in the Lesser Sunda Island chain in the eastern region of Indonesia. To the east of Pantar
Island is the Pantar Strait which separates Pantar Island from Alor Island and the small
islands of Treweg, Pura, Buaya, Ternate and Kefa. To the west is the Alor Strait which
separates Pantar Island from Lembata Island and small islands including Rusa, Kambing,
Kangge and Lapang Islands (Figure 3.1). Pantar Island is located in the middle of Alor
District Marine Conservation area which covers the entire sea of Alor from east to west.
The analysis about Alor District Marine Conservation Area is presented in details in
Section 7.3.

Chapter 3. Pantar Island Context and Research Sites _____________________________________________________________________________
74
Figure 3.1: Map of Pantar Island
The total land of Pantar Island is 728 km2 while the small surrounding islands vary in
size. On the main island, the land is rocky and hilly, with the highest point at Topaki,
1318 metres above sea level (asl). The active volcano Mount Sirung is located in the
south-east of Pantar Island (1365m asl) (PT Dalla Billa Sejati and Departemen Kelautan
dan Perikanan, 2004). According to Seach (2010), this volcano has erupted numerous
times in the last 150 years (in 1852, 1899, 1927, 1934, 1947, 1953, 1960, 1964, 1965,
1970 and 1987). A small ash and smoke eruption occurred most recently on in May 2012
(Manehat 2012). Every five to six years, periodic tectonic earthquakes (Bappenas 2005)
and tsunamis occur due to the island’s location in the Indo-Australian and Philippine
tectonic plates (Chen Ji 2004; Campbell-Nelson 2008).
As there is no rainfall data available for Pantar, we can refer to similar rainfall variations
from Alor (Figure 3.2). Pantar Island experiences a dry climate and short rainy season,
from December to March (Figure 3.2). There is usually little rain during the dry season
(April to November), with the driest month being September. The extreme variation in
rainfall is linked with the monsoons. The island experiences several monsoons: the east

Chapter 3. Pantar Island Context and Research Sites _____________________________________________________________________________
75
monsoon (angin timur) from April to August, the west monsoon (angin barat) from
November to March and a transitional period (musim pancaroba) between these two
major monsoons. The sea conditions during the west monsoon are rough, especially in
January and February. Strong winds and heavy rain generally occur in January and
February. Sea conditions in September and October are the calmest and these are also
the hottest months. The highest temperature recorded for Alor between September and
November in 2008 was 33.5ºC while the average percentage of sunshine was 97% in
September in 2008 (BPS Kabupaten Alor 2009).
0
100
200
300
400
500
Janu
ary
Febr
uary
Mar
chApr
ilM
ayJu
neJu
ly
Augus
t
Septe
mbe
r
Octob
er
Novem
ber
Decem
ber
Month
mm
2004
2005
2006
2007
2008
Figure 3.2: Rainfall rate in Mali Meteorology Station, Kalabahi in Alor Island from 2004 to 2008. (Source: BPS Kabupaten Alor 2009)
The Pantar and Alor Straits are important regions of marine and coastal ecosystem
biodiversity in eastern Indonesia (Tomascik et al. 1997). The straits are located within
the Indonesian area of the Coral Triangle, now considered one of the areas with the
highest marine biodiversity in the world. The sea is an important habitat for reef fish and
is a migratory channel for threatened species and mega fauna such as whales, dolphins
and turtles, as well as high commercial value species such as tuna and reef fish (Kahn
2002; Pet 2002). The practice of traditional whale hunting also exists on Lembata Island
(Barnes 1974). The reef, mangrove and seagrass support high value fishery in Alor
(WWF Indonesia 2010) which is part of the MPA network for the Lesser Sunda region

Chapter 3. Pantar Island Context and Research Sites _____________________________________________________________________________
76
(The Secretary of Directorate General of Marine, Coastal and Small Islands, The
Ministry of Marine Affairs and Fisheries 2009).
The Pantar and Alor Straits play a significant role in the ocean circulation (Tomascik et
al. 1997). The water currents in the Pantar and Alor Straits are influenced by the North
Pacific current and the Sawu Sea (Wyrtki 1961; Syamsudin et al. 2010). The current
flows from north to south during a rising tide and vice versa during the low tide. The
current flow is very strong in these straits. During each tide, large water masses are
pushed through the straits causing strong upwelling (Wyrtki 1961) and treacherous
currents of six knots and above (Fudge 2007). This gives the area an important role in
the exchange of marine life (especially marine mega fauna) between the Indian and
Pacific Oceans (Kahn 2002; Pet 2002).
3.1.1 Administrative system and history
Historically, the inhabitants of Pantar Island have experienced several systems of
government and administration, including a monarchy and Portuguese, Dutch and
Indonesian governments. With the coming of the Majapahit Empire in the early 14th
century (Barnes 1982), five small kingdoms, called Baranusa, Alor, Blagar, Pandai and
Kui, were established on Pantar and Alor Islands. The last emperor of Baranusa
Kingdom, Koliamang Baso, ruled an area that included Kangge Island until his death in
1978 (personal communication with Amir Syarifuddin Dagang, ex-temukung (head of
district), 2008). Today, the influence of Baranusa Kingdom is limited to customary law
and institutions for marriage arrangements and other cultural matters such as the
circumcision ceremony. The dynasty of the Baranusa Kingdom still inhabits the local
palace and has rights to allow cattle to graze on Batang Island and although there are no
watchmen, the cattle on Batang Island are never stolen due to respect for the traditional
ownership.
When the Portuguese traded in this area in the 16th century (Fox 2011), the head of the
administration area was called the capitan (kapitan in local term) who acted as an
administrator below the local king or raja (Gomang 1993). In 1923, the Dutch replaced

Chapter 3. Pantar Island Context and Research Sites _____________________________________________________________________________
77
the capitan system with districts (ketemukungan), headed by a temukung who governed
the district and was helped by kepala kampung (Gomang 1993; Stokhof 1979; du Bois
1944). The temukung was responsible for public law and order such as tax and crime,
while the civil aspects of society were ruled by the raja and customary laws.
Since 1965 (based on the Law of the Republic of Indonesia No. 19 of 1965 concerning
the government at village level), like other regions in Indonesia, Pantar Island came
under a new government system and part of the province of Nusa Tenggara Timur
(NTT) within the district of Alor. The town of Kabir became the capital of Pantar. As of
2012, there are five sub-districts (kecamatan) on Pantar Island (Figure 3.1) which are
part of the Alor District:
1. Pantar, which consists of 11 villages; the sub-district capital is Kabir
2. Pantar Barat, which consists of 7 villages; the sub-district capital is Baranusa
3. Pantar Barat Laut, which consists of 7 villages; the sub-district capital is Kayang
4. Pantar Tengah, which consists of 10 villages; the sub-district capital is Maliang
5. Pantar Timur, which consists of 11 villages; the sub-district capital is Bakalang.
The study sites are located in three sub-districts, namely, Pantar, Pantar Barat and Pantar
Barat Laut.
3.1.2 Small islands in Alor Strait
There are four small islands in the Alor Strait. Lapang and Batang Islands are located to
the north of the strait, and Rusa and Kambing Islands are located to the south of Pantar
Island (Figure 3.1). The area of Lapang Island is 3.13 km2 (BPS 2004), with a coastline
of approximately 8 km (based on measurements made using www.googleearth.com).
Lapang Island is a relatively flat island one to two metres above sea level with few trees.
The name “lapang” means plain and wide land in the Indonesian language. Batang
Island is located close to Lapang Island. The area of Batang is approximately 4.38 km2.
Kambing Island is located to the south of the Alor Strait and is 2.5 km2 in size. Rusa
Island is located near Kambing Island with a total area of 13.75 km2.

Chapter 3. Pantar Island Context and Research Sites _____________________________________________________________________________
78
These small islands come within the administrative boundaries of the closest settlements
on Pantar Island: Lapang and Batang Islands are administered by Blangmerang village,
and Rusa and Kambing Islands are administered by Kayang village. All the islands are
uninhabited but people from the four case study sites visit these islands for various
livelihood and cultural purposes. Traditionally, Batang Island is owned by members of
the Koliamang Baso family, and the traditional king in Baranusa has cattle grazing on
the island. Kambing Island has a large population of goats which belong to the Marisa
family in Kayang village (“kambing” means goats in the Indonesian language). People
from Kayang and Marisa villages have in the past buried people in caves on the island.
Ther are deer and a fresh water spring supply on Rusa Island.
3.1.3 Cultural groups and languages of Pantar
At least six main local languages are spoken by the inhabitants of Pantar Island (Stokhof
1979). The Lamma language is mostly used in the west of Pantar (Halton 2007) except
for the inhabitants of several villages such as Baranusa, Kayang and Kangge who speak
the Alor language (Figure 3.3). Teiwa is used in the middle of Pantar. Several languages
are used in east Pantar such as Nedebang, Kelon and Blagar. The community in Labuan
Bajo hamlet (dusun), Kabir speaks the Sama Bajau language (Verheijen 1986). Bahasa
Indonesia is spoken by most Pantarese and other ethnic groups such as Buton and Bugis
who lived in Labuhan Bajo hamlet (dusun).
Figure 3.3: Languages in Alor and Pantar (Source: Stokhof 1979:5)
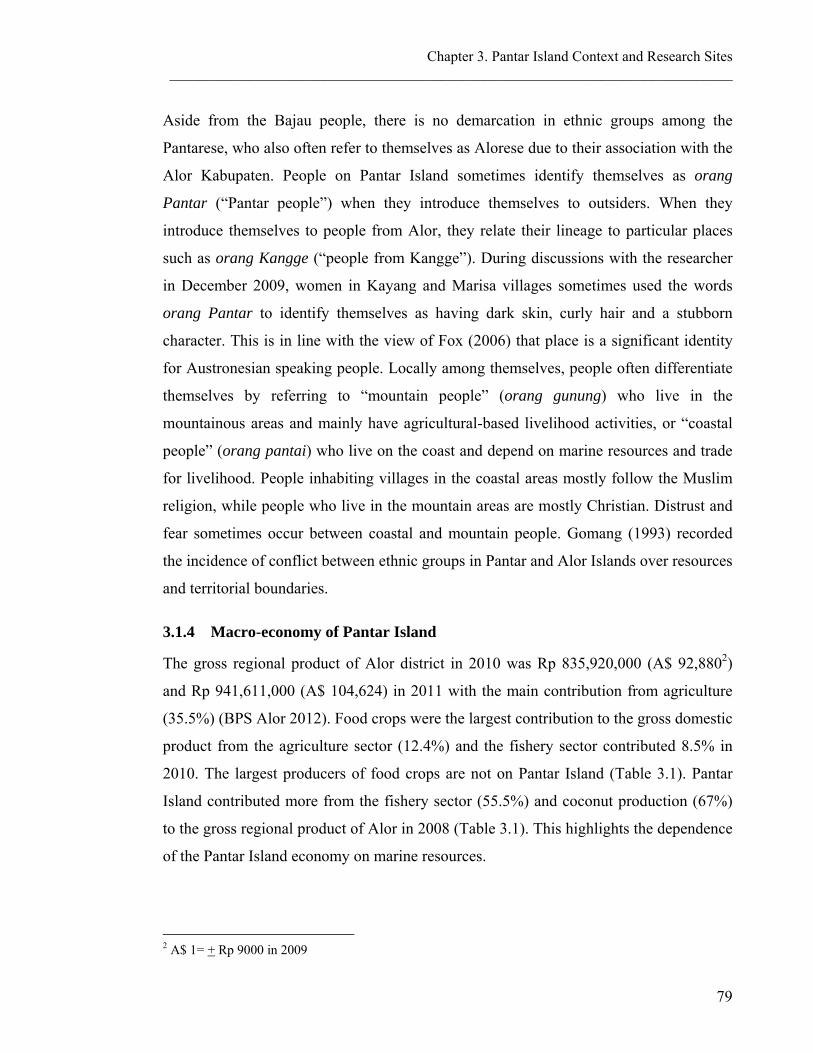
Chapter 3. Pantar Island Context and Research Sites _____________________________________________________________________________
79
Aside from the Bajau people, there is no demarcation in ethnic groups among the
Pantarese, who also often refer to themselves as Alorese due to their association with the
Alor Kabupaten. People on Pantar Island sometimes identify themselves as orang
Pantar (“Pantar people”) when they introduce themselves to outsiders. When they
introduce themselves to people from Alor, they relate their lineage to particular places
such as orang Kangge (“people from Kangge”). During discussions with the researcher
in December 2009, women in Kayang and Marisa villages sometimes used the words
orang Pantar to identify themselves as having dark skin, curly hair and a stubborn
character. This is in line with the view of Fox (2006) that place is a significant identity
for Austronesian speaking people. Locally among themselves, people often differentiate
themselves by referring to “mountain people” (orang gunung) who live in the
mountainous areas and mainly have agricultural-based livelihood activities, or “coastal
people” (orang pantai) who live on the coast and depend on marine resources and trade
for livelihood. People inhabiting villages in the coastal areas mostly follow the Muslim
religion, while people who live in the mountain areas are mostly Christian. Distrust and
fear sometimes occur between coastal and mountain people. Gomang (1993) recorded
the incidence of conflict between ethnic groups in Pantar and Alor Islands over resources
and territorial boundaries.
3.1.4 Macro-economy of Pantar Island
The gross regional product of Alor district in 2010 was Rp 835,920,000 (A$ 92,8802)
and Rp 941,611,000 (A$ 104,624) in 2011 with the main contribution from agriculture
(35.5%) (BPS Alor 2012). Food crops were the largest contribution to the gross domestic
product from the agriculture sector (12.4%) and the fishery sector contributed 8.5% in
2010. The largest producers of food crops are not on Pantar Island (Table 3.1). Pantar
Island contributed more from the fishery sector (55.5%) and coconut production (67%)
to the gross regional product of Alor in 2008 (Table 3.1). This highlights the dependence
of the Pantar Island economy on marine resources.
2 A$ 1= + Rp 9000 in 2009

Chapter 3. Pantar Island Context and Research Sites _____________________________________________________________________________
80
Table 3.1: Production of food crops of Alor and Pantar in 2008
Pantar Island
(tonnes) Alor District
(tonnes) Contribution of Pantar Island to
Alor District (%)
Rice 6,216.800
17,182.296 36.00 Corn 1714.8 10150.5 17.00 Cassava 4721.5 19535.6 24.00 Sweet potatoes 331.2 1353.1 24.50 Peanuts 12.5 61.9 20.00 Mung beans 45.6 164.1 28.00 Coconut 581 869 67.00 Cashew nuts 628 1455 43.00 Walnut 759 3074 25.00 Areca 6 74 8.00 Vanilla 1 43 2.30 Fishery 10314 18585.6 55.5
Source: BPS Alor 2009
Income per capita in Alor was recorded at Rp 4,100,601 (A$ 455.6) in 2010 while for
NTT province it was Rp 5,521,420 (A$ 613.5) (BPS Alor 2011). By contrast, the
Indonesian income per capita was A$ 4,578 in 2010 (UN ESCAP 2012). These figures
reflect that the people on Pantar Island as the majority in NTT province live under the
poverty line (Fitriana and Stacey 2012).
Although the fishery sector contributes to the Pantar Island local economy (Table 3.1),
the majority of the population engages in agricultural-based activities. The rained
farming system is mostly used for cassava, banana, corn, vegetables, fruits, tobaccos,
coconut and other trees such as cashew nuts. Crops are harvested annually in April and
some are stored for consumption throughout the year. Livestock, such as goats, pigs and
cattle, are also important. In addition, several people in Baranusa, Kolijahe village
(eastern Pantar) and Kayang also produce hand-woven textiles which are either used by
themselves or sold to mountain people for ceremonial purposes.
Of the 38 coastal villages on Pantar Island, only seven coastal villages have marine
livelihood activities as their major income source (BPS 2008). This includes the four
case study villages of Labuhan Bajo, Blangmerang, Marisa and Kayang villages which
rely on fishing, sailing and trade as their main livelihood activities (Gomang 1993).

Chapter 3. Pantar Island Context and Research Sites _____________________________________________________________________________
81
Some people who live in the inland and mountain areas also depend on marine resources
for food through traditional barter systems with coastal villagers at the local markets.
More recently, since 2006, a number of communities on Pantar Island have taken up
seaweed farming along the north to the west coast of the island including some who
traditionally have not fished (such as people from Wolu village).
People on Pantar Island have been involved in trade with outsiders for centuries. This
contact explains the introduction of Islam from the Makassar and Ternate Kingdom in
1460 by the Malayo-Muslim trading network (Klamer et al. 2008). People also had
contact with the Larantuka and East Timor Kingdom in 1847 (Farram 2004). In the
1930s Muhammadiyah and Syarikat Islam (Islamic trading companies) started trading
and had a significant influence on the coastal community in this area until the 1990s
(Gomang 1993). According to Gomang (1993), no specific agricultural product trading
was recorded. Baranusa Kingdom had intensive relationships with the Wetar Island
communities and other parts of East Timor because of the slave trade. Most of the
records noted that trading between Chinese, European and Makassar people occurred in
Alor Kecil village on Alor Island.
3.2 Description of the Study Sites
Four villages were selected as case study sites because they represented a selection of
coastal villages that were highly dependent on marine resources and contributed
significantly to the provision of marine products to the wider community through the
barter system. The case study sites were Labuhan Bajo hamlet, Blangmerang village,
Kayang village and Marisa village. This section describes the geographical context,
history of settlements, administrative system, demography and ethnicity, and
infrastructure and services of the four villages.
3.2.1 Geographical context
Blangmerang village, Labuhan Bajo hamlet and Kayang village are located on Pantar
Island and Marisa village is located on Kangge Island, approximately 2 km facing
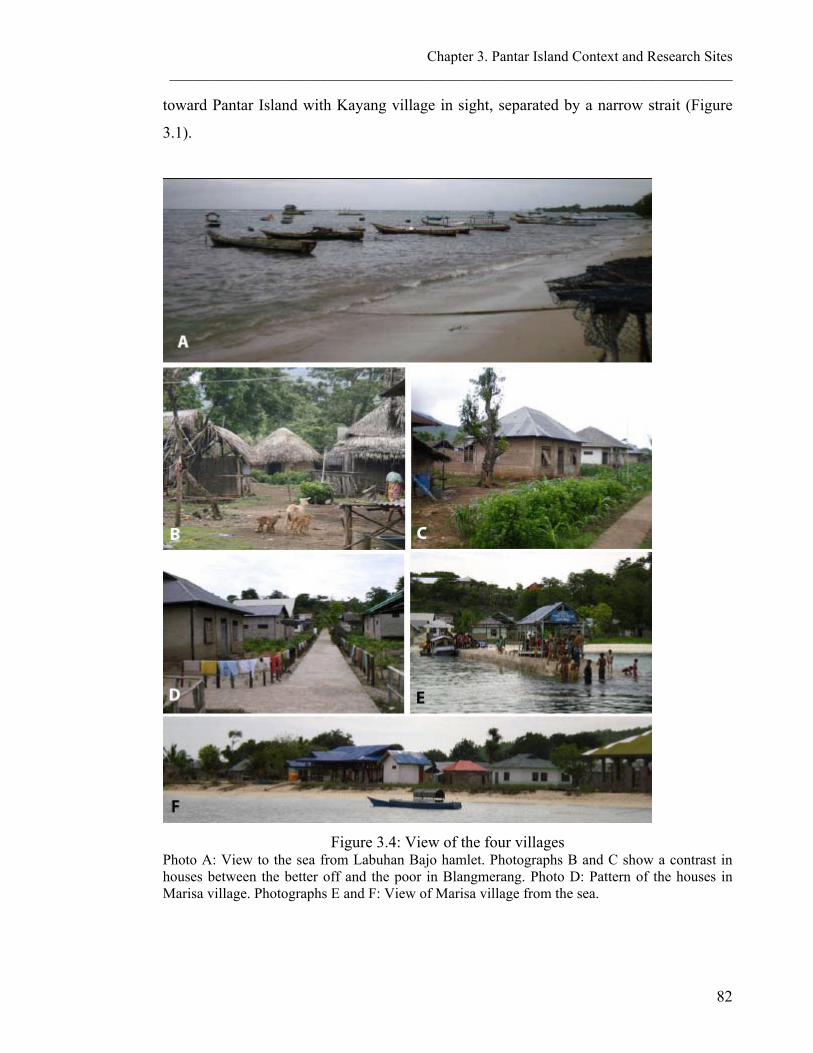
Chapter 3. Pantar Island Context and Research Sites _____________________________________________________________________________
82
toward Pantar Island with Kayang village in sight, separated by a narrow strait (Figure
3.1).
Figure 3.4: View of the four villages Photo A: View to the sea from Labuhan Bajo hamlet. Photographs B and C show a contrast in houses between the better off and the poor in Blangmerang. Photo D: Pattern of the houses in Marisa village. Photographs E and F: View of Marisa village from the sea.

Chapter 3. Pantar Island Context and Research Sites _____________________________________________________________________________
83
The total area of Kabir village is 10.01 km2 (BPS Kabupaten Alor 2009) in which
Labuan Bajo hamlet is only around 0.1 km2 in size (measurements made using
www.googleearth.com), while Blangmerang, Kayang and Marisa villages are 18.38 km2,
9.47 km2 and 13.17 km2, respectively (BPS 2004). The direct distance from Marisa
village to Kalabahi, the Alor district capital city, is approximately 87 km. The distance
between Kayang village and Kalabahi is 85 km, the distance between Baranusa and
Kalabahi is 60 km and the distance between Kabir to Kalabahi is 50 km (Table 3.2)
(BPS Alor 2009).
These villages can only be reached from Kalabahi, the capital of Alor, by sea
transportation. Labuhan Bajo hamlet can be reached in three hours from Kalabahi. There
are two choices to go to Kabir: passengers can stop directly in Kabir port or use a
different ferry and stop at Bakalang port which is the closest seaport in Pantar Island
from Kalabahi, and then continue with a rented motorbike (ojeg) for one hour.
Blangmerang can only be accessed from Kalabahi by ferry in four hours. Kayang and
Marisa villages can only be accessed from Kalabahi in a journey that takes six hours.
Table 3.2: Area, distance to capital city, administrative system, and ethnicity of the four case study sites
Village Approximate Area (km2 )
Distance to Kalabahi
(Km)
Trip to Kalabahi
(hours) by sea
Administrative system
Sub-district Labuhan Bajo hamlet
0.1 50 3 Pantar
Blangmerang 18.38 60 4 Pantar Barat Kayang 9.47 85 6 Pantar Barat Laut Marisa 13.17 87 6 Pantar Barat Laut Source: BPS Alor 2009
3.2.2 Administrative system
Kabir village, where Labuhan Bajo hamlet is located, is governed administratively under
Pantar sub-district. Blangmerang village is governed under Pantar Barat sub-district of
which Baranusa is the capital village. Kayang and Marisa villages are governed under
the Pantar Barat Laut sub-district of which Kayang is the capital village. The Pantar

Chapter 3. Pantar Island Context and Research Sites _____________________________________________________________________________
84
Barat Laut sub-district was set up in 2006 when it was separated from Baranusa sub-
district. Marisa was established as an independent village in 2000, before which time it
was governed under Kayang village (Table 3.2).
A discussion about Blangmerang can not be separated from a discussion about Baranusa.
Amir Sarifudin Dagang, the ex-temukung in Baranusa, spoke of the history of Baranusa
and Blangmerang in a conversation with the author on 25 August 2008. With the
growing population, Blangmerang became a village (desa) with its own village leader.
The two places were strongly connected economically and socially, and their
infrastructures became integrated. Therefore, Baranusa is also discussed as part of the
background perspective of Blangmerang village.
3.2.3 History of settlements
As described earlier, the settlements in Baranusa, Kayang and Kangge area occurred at
the end of the 16th century when the Munaseli Kingdom in Kolijahe was destroyed due
to earthquake and war (Gomang 1993), and many of the followers moved to Baranusa,
Kayang, Marisa and Lembata Island (from personal communication Marzuki Magang
who knew the oral history of Kabir, 2008.). This was verified by Pitang Meang Napa,
the informal village leader in Kayang and also verified by the village leader in Kangge
village.
According to the late Morikadese Rea from Labuhan Bajo hamlet (who was reputed to
be 114 years old when interviewed by the author in September 2008, and who since
passed away in May 2009), the Bajau people were welcomed in Kabir by local
authorities in the late 19th century. Nonci Rebana, the Bajau informal leader in Labuhan
Bajo, also told the same story. The son of Pandai Kingdom who governed the area at that
time and L. Th. Blegur, the leader of Warasi ethnic group, described a similar story in
conversations with the author in September 2008.
This first wave of Bajau people in Kabir was associated with the Bugis. This was
verified by Paman Naseng, Bajau leader in Kupang. The Bugis traded agricultural and
construction products from Sulawesi for local agricultural products, while the Bajau

Chapter 3. Pantar Island Context and Research Sites _____________________________________________________________________________
85
bartered fish products with the local people. At the time, the land on which present-day
Labuhan Bajo was built was given to them by the Warasi people in Kabir, who invited
Bajau people to live on the land. This was marked by a ceremony called banada-
bangkoto (and included a dance performance, called lego-lego which is a circle dance
originally from the Sultanate of Ternate (Visser and Voorhoeve 1987; Visser 1989),
reserved for special customary practices and exchanges which showed the importance of
the agreement) according to Nonci Rebana, the Bajau leader (personal communication
with Nonci Rebana, 2008). Banada is a tamarind tree and bangkoto means a river. Even
today, according to the leader of Warasi people, the Warasi people feel obliged to the
Bajau community for upholding the agreement. For example, the Warasi provided
freshwater through a piped system to Labuhan Bajau hamlet in 2008 (personal
communication with Pro-air Project facilitator in Kabir, 2008). The relationship between
the Bajau and Warasi people is amicable. If the Bajau find fish, the women traders
would bring the first fish to the Warasi village as a customary tribute, despite its hilly
location.
From the late 19th century most Bajau lived on their boats in the Kabir and surrounding
areas and Lapang Island. In 1961, an outbreak of disease lead to a number of Bajau
families moving to more permanent house dwellings on Lapang Island where they built
stilts house on the coastal fringe of Labuhan Bajo hamlet. The son of the Pandai King
stated that around this time there was an earthquake and many lives and boats were lost
(personal communication, 2008). Since then, the area has been called Labuhan Bajo
meaning “Bajo harbour”.
3.2.4 Demography and ethnicity
There is some variation in the population numbers in each of the four villages (Table
3.3). Verheijen (1986) reported that the population of Sama-speaking Bajau in this area
was 563 people in 1986. The population of Bajau people in Labuhan Bajo hamlet
(dusun) was noted at 881 by the village leader in 2008 (Table 3.3). This is approximately
a 38% population growth in two decades which may relate to movement of around 10

Chapter 3. Pantar Island Context and Research Sites _____________________________________________________________________________
86
households of Bajau from Timor Leste to Labuhan Bajo Hamlet in 1999 as reported by
local inhabitants.
Table 3.3: Population of Kabir, Blangmerang, Kayang and Marisa villages
Village 2004 2006 2008 Kabir Labuhan Bajo hamlet
2001 -
2544 -
2203 881*
Blangmerang 1215 1256 1498 Kayang 639 644 678 Marisa 931 937 1130
Source: BPS * noted by Labuhan Bajau hamlet village head as the small units of BPS data are village level not hamlet level.
There are two main ethnic groups in these villages, namely, people from Pantar Island
who live in Baranusa, Kayang and Marisa, and Bajau people who live in Labuhan Bajo
hamlet. People in Baranusa, Kayang and Marisa speak the Alor language, with local
dialects (Stokhof 1979), while Bajau people in Labuhan Bajo speak the Sama language.
Bajau people are the most direct users of marine resources and entirely depend on the
marine resources and have no agricultural land. Almost all the people in these four
villages are Muslim, with their communities having followed Islam since the 15th
century when it spread from the Ternate region of Indonesia. The communities in
Blangmerang are relatively homogenous. Only a few people are from the Lamahala
ethnic group in Adonara, Flores.
People in Blangmerang, Kayang and Marisa have different fam (meaning “family name”
in the Alor language). Thus several fam group in one suku (meaning “family group” in
the Alor language). This fam helps them in conducting strategy in their life and coping
with vulnerabilities that will be explained further in Chapter 5.
The Panggorang and Marisa suku in Kayang and Marisa have a strong influence in these
areas even today, including customary activities such as building a house and family
gatherings. The village leaders in Marisa village illustrated that these two family groups
still have their customary house (rumah adat), worship and a clear family line. The
customary house (rumah adat) of Marisa families is called pagulasa. Panggorang

Chapter 3. Pantar Island Context and Research Sites _____________________________________________________________________________
87
families own Kambing Island, including all the goats on that island. According to the
village leader in Kayang village, the Panggorang family still pays taxes to the
government in acknowledgment of their customary ownership.
Meanwhile, Bajau people who live on Pantar Island identify themselves as orang Bajo-
Pantar (Bajau people who live on Pantar Island). They use this term to differentiate
themselves from Bajau people who live in other places, such as on Lembata Island. They
have a strong maritime connection. When a baby is born, the placenta is offered to the
sea compared to land-based groups who bury the placenta. The marine cosmology and
intimate knowledge and skills shape their entire life with the sea (Stacey 2007). Stacey
(2007) further described that the Bajau consider the sea to be their garden and depend
exclusively on marine resources.
3.2.5 Settlements, infrastructure and services
The housing pattern in Labuhan Bajo hamlet follows the shoreline and is divided into
two areas by a main road along the coastline. The distance from one house to another is
1 or 2 metres. Most of the houses are built from wood and bamboo with palm leaf roofs
(Figure 3.5). The house pattern in Blangmerang and Kayang is a grid pattern. Plant
fences are used as a border from one house to another house. Most of the houses have
exposed brick walls and roofs (Figure 3.6 and Figure 3.7). The pattern of houses in
Marisa follows the coastline and there is no clear border from one house to another
(Figure 3.8). Most of the houses are built from bamboo. In 2010, twelve houses had
thatched roofs in Marisa village and the rest had corrugated iron roofs.

Chapter 3. Pantar Island Context and Research Sites _____________________________________________________________________________
88
Figure 3.5: Labuhan Bajo hamlet in Kabir village

Chapter 3. Pantar Island Context and Research Sites _____________________________________________________________________________
89
Figure 3.6: Village of Blangmerang

Chapter 3. Pantar Island Context and Research Sites _____________________________________________________________________________
90
Figure 3.7: Village of Kayang

Chapter 3. Pantar Island Context and Research Sites _____________________________________________________________________________
91
Figure 3.8: Village of Marisa on Kangge Island
The electricity in Kabir and Baranusa is available from 6.00pm to 6.00am and is
operated by the state power (Perusahaan Listrik Negara/PLN). However, it is unreliable
and depends on diesel supplies in Kabir and Baranusa. Almost every house in Labuhan
Bajo hamlet had electric lights, although only 50 houses had a legal electricity line with
a 450 watt capacity. One house might channel electricity to 4 to 5 houses. There was no
electricity supply from the state to Kayang and Marisa. Twenty houses in Kayang owned
diesel generators and one generator served 5 to 10 houses. The diesel generators started
to be used in Marisa village in 2005. Fourteen houses owned diesel generators, which
powered 74 houses in Marisa during my field visit in 2010. The owners charged Rp
20,000 (A$ 2.5) per light per month per house. The operating hours were 6.00pm-
10.00pm. Labuhan Bajau in Kabir and Blangmerang village in Baranusa had reasonably
reliable mobile phone signal coverage, but in Kayang and Marisa it was much weaker.

Chapter 3. Pantar Island Context and Research Sites _____________________________________________________________________________
92
Freshwater was abundant in Kabir. However, there was no freshwater source in Labuhan
Bajo hamlet. Bajau women collected water in the centre of Kabir in the mornings and
late afternoons. However, the round trip on foot took one to two hours per trip, including
the waiting time. Several houses in Labuhan Bajo hamlet had brackish wells which were
only used for cleaning purposes.
All the villagers in Blangmerang used an unprotected freshwater spring for drinking,
bathing and cooking (Figure 3.9). This spring was approximately 15 minutes walk from
the centre of the village. The brackish well was used for bathing and washing in
Baranusa sub-district. There was only one source of freshwater in Kayang village which
was also used by the villagers from Marisa village. At the end of 2009, Kayang village
received 156 rainwater tanks with a total 4,000 litre capacity from UNICEF. This
provision of the tanks was meant to address the issue of water shortages which are
common during the dry season in the Lesser Sunda Island chain. The tanks help the
villagers to store the water for two to three months, as described by a village leader in
2010.
Figure 3.9: Sole source of freshwater in Baranusa sub-district (villagers from Blangmerang also come to collect freshwater here)

Chapter 3. Pantar Island Context and Research Sites _____________________________________________________________________________
93
Water from the desalination plant in Marisa village was used for drinking water. The
quota of water per family was 20 litres per day. The desalination plant also generated
electricity for the whole village between 6.00pm and 9.00pm every day. When there was
no diesel supply, the whole village had no fresh water and electricity. At the end of 2009
and in early 2010 the machine did not operate because it had run out of diesel. In this
situation, the villagers in Marisa village collected freshwater from Kayang village by
dugout canoe. The schools, health clinic and shops in the villages are described in more
detail in Chapter 5.
3.3 Summary
Pantar Island in Nusa Tenggara Timur province is no exception to other islands in the
eastern part of Indonesia which are located far from administrative and economic centres
and have poor infrastructure and services as they are outside the main municipal area.
The major economic activities undertaken by Pantarese are agriculturally oriented
subsistence activities and coastal livelihoods. The fishery sector on Pantar Island
contributes significantly to the Alor district economy. Four locations were selected for
this research because the diverse ethnic groups in the four villages represented a
selection of the communities that were highly dependent on marine resources and were
the main users of the surrounding waters where a marine conservation area was
established in 2009. A more detailed profile of the complex livelihoods of the four
targeted villages is described in Chapter 5. Meanwhile, the next chapter explores the
experiences of the establishment of other marine protected areas in Indonesia

Chapter 4
Community Involvement in the Establishment of MPAs in Indonesia
Lapang Island

Chapter 4. Community Involvement in the Establishment of MPAs in Indonesia _____________________________________________________________________________
94
Chapter 4: Community Involvement in the Establishment
of MPAs in Indonesia
4.1 Introduction
This chapter explores the experience of establishing marine reserves in Indonesia with a
particular focus on community participation in the planning stage. The focus on the
planning or initial stages in establishing an MPA is considered to contribute significantly
to the successful implementation and outcomes (Chuenpagdee et al. 2013). Further, it
has been identified that involving communities and other key stakeholder groups in the
planning stage is critical in order to have MPA accepted by them (Andrade and Rhodes
2012). Such an approach also enables a better understanding of the social, cultural and
economic and historical context of the local communities affected by the MPA and also
has a greater likelihood of good operations of an MPA (Afiff and Lowe 2008; Gara
2010). Thus, this chapter also investigates how social and economic issues (broadly
defined as community profile, patterns, perceptions and knowledge of resource use and
customary rules and local institutions regulating these) and economic (broadly covering
household economic status, degree of dependency on marine resources, and market
influences and tourism enterprise) were integrated in marine park planning and
management in Indonesia. The results of the analysis and identification of lessons
learned will contribute to a strategic approach to support community involvement and
incorporate the livelihoods of coastal communities in the initial stage of MPA
establishment in Pantar (see Chapter 7).

Chapter 4. Community Involvement in the Establishment of MPAs in Indonesia _____________________________________________________________________________
95
As introduced in Chapter 1, this chapter aims to examine the question: “To what extent
have local communities been involved in the planning process to establish three MPAs in
Indonesia?” This question addresses the following issues:
- What was the degree of participation of local communities in the MPA planning
process?
- To what extent have social and economic issues in local communities been
considered in the MPA establishment?
This chapter is divided into five sections. The first section briefly discusses the methods
used to address the above questions. The second section defines the relevant concepts
including community, stakeholder groups and participation. The third section reviews
community involvement in natural resources management worldwide by considering the
experiences of three MPAs from Norway, the Philippines and the Solomon Islands. The
fourth section analyses the experience of the establishment of three MPAs in Indonesia
based on a literature review and my field experience of these sites. The final section
presents the lessons learned from the three specific case studies, followed by a summary
of the findings and conclusions.
4.2 Methods
Various methods were used to explore worldwide experiences and case studies in
Indonesia (see also Chapter 2). Figure 4.1 shows how the data and information were
collected and the process of analysis.

Chapter 4. Community Involvement in the Establishment of MPAs in Indonesia _____________________________________________________________________________
96
Figure 4.1: Method of data collection and analysis
The data collection process combined several methods. A literature review was
conducted to explore the participation of local communities and how social and
economic issues were considered in the planning process for MPA establishment. A
wide range of literature (published material, official and unofficial reports, statistical
reports, maps, satellite images, historical documents and websites in English and
Indonesian) were reviewed, including an analysis of the available information on other
MPAs in Indonesia.
A review of the literature on community participation in the establishment of three
MPAs: Norwegian coastal management, Mabini Reserve in the Philippines, and Marovo
Lagoon in the Solomon Islands was conducted. These case studies were selected as they
represent several types of marine resource management systems. Norway, as a wealthy
country and located in the northern hemisphere, uses a more integrated coastal zone
approach; the Mabini Reserve is managed by a management body; and Marovo Lagoon
is managed according to the traditional rules. The case studies reveal the challenges in
Chapter 4. Community Involvement in the Establishment of MPAs in Indonesia _____________________________________________________________________________
97
integrating several marine users and show how local fishers compete with more
powerful stakeholder groups in multiple uses of marine resources.
For the Indonesian case studies, I reviewed the literature on the establishment of two
marine national parks and one marine nature reserve in eastern Indonesia: Wakatobi
National Park, Bali Barat National Park and Riung Nature Reserve. A review of existing
policies and regulations for marine natural resource management was conducted to give
a policy context relating to how the marine reserves were established. This was
combined with nine semi-structured interviews with the key stakeholders who I
considered as part of the MPA planning teams, such as the National Park authorities,
project leaders of those MPAs and community organisations.
I assessed the case studies in Indonesia based on how the planning team of the respective
marine reserve conducted the stakeholder analysis to identify and understand their main
stakeholder groups. A short line of questioning about the respondents’ experience and
their role in the planning process was used as an opening for discussion. This was to
identify the extent to which the key informants understood the planning process and
management system of the respective marine nature reserves.
The questions in the interviews were divided into four sections (see Appendix A for the
list of questions):
1. Questions to assess the understanding of the planning team in relation to
stakeholder groups’ recognition.
2. Questions to identify the degree of participation by the local community in the
planning process.
3. Questions on how social and economic issues were taken into consideration in
the planning process.
4. Questions about the relevant zoning and management systems; this covered
policies and regulations, and conflicts.

Chapter 4. Community Involvement in the Establishment of MPAs in Indonesia _____________________________________________________________________________
98
4.3 Definition of Terms
This section discusses the conceptual definitions of community, stakeholder groups, and
participation. This conceptual framework, along with an investigation of worldwide
experiences, provides the background against which to assess the Indonesian situation in
involving local communities in the MPA establishment as discussed in the following
section.
Community
Dunham et al. (2006) classified communities in two types. In the first category, a
community is described as small, close-knit, and unified by shared experience, values
and accepted norms. This category of community is traditional, slow to change and
characterised by a sense of solidarity among its members. It implies homogeneous and
place-based communities. The second group of communities is described as large-scale,
impersonal, and linked only by the transactions involved in the pursuit of individual self-
interests. Dunham and colleagues emphasised that this categorisation is critical to
community development as it relates to socio-political-economic phenomena such as
democracy and capitalism.
McMillan and George (1986) identified four elements that build community, namely,
membership, influence, integration and fulfillment of needs, and shared emotional
connections. Membership is the feeling of belonging or sharing a sense of personal
relatedness. Influence is a sense of social relevance, of making a difference to a group
and of the group mattering to its members. The integration and fulfillment of needs is the
feeling that members' needs will be met by the resources received through their
membership in the group. Shared emotional connections relate to the commitment and
belief that members have shared and will share history, common places, togetherness,
and similar experiences.
Colombo and Senatore (2005) point out two main approaches to studying community in
the natural resources context. The first approach is grounded on a territorial-based

Chapter 4. Community Involvement in the Establishment of MPAs in Indonesia _____________________________________________________________________________
99
conception of community, and the second approach refers to a concept of community
based on a specific set of relations (social-network relationships).
Drawing from the above points, I define a community as a group of people residing in a
sub-village, a village or several villages in a coastal area setting, who use resources in a
common area and have shared historical experiences, kinship relations, values and
accepted norms. In practical terms, a community is a group of people who share a sense
of belonging and are different from other groups.
Communities are often heterogenous, including many sub-groups, often with diverse or
opposing needs, capacities and interests (Pollnac and Crawford 2000). Agrawal and
Gibson (1999) noted that a community has multiple actors and interests within it. These
interests will change depending on the new opportunities that emerge. Agrawal and
Gibson suggested that there is, therefore, a need to identify local politics and larger
social or economic forces, such as markets.
Stakeholder groups
In the natural resource management context, various actors are often defined as
stakeholder groups. The World Bank (2005) defines a stakeholder as “any entity with a
declared or conceivable interest or stake in a policy concern”. Stakeholders can be
individuals, organisations or unorganised groups, such as local users, government
agencies, civil society groups, universities and researchers. Freeman (in Mitchell et al.
1997) defined a stakeholder as “any group or individual who can affect or is affected by
the achievement of corporation’s objective”. In the marine natural resource context,
stakeholders are defined as all people, groups, communities and organisations who use
and depend on a resource, whose activities affect or are affected by the resource, or who
have an interest or ‘stake’ in these activities (Grimble and Wellard 1997; Pomeroy and
Rivera in Pomeroy and Douvere 2008).
There are multiple actors at different levels within the stakeholder groups in marine
natural resources management. Mitchell et al. (1997) categorised stakeholder groups
Chapter 4. Community Involvement in the Establishment of MPAs in Indonesia _____________________________________________________________________________
100
based on power, legitimacy on the basis of legal rights, and the urgency for immediate
action. It is common practice to categorise stakeholder groups into primary, secondary
and tertiary groups, based on their relative importance and power. A strategy should be
developed to treat the prioritised stakeholder groups that fall into all three categories
(Mitchell et al. 1997; Philips et al. 2003; Dunham et al. 2006). Bunce et al. (2002)
explained that the primary stakeholders in the marine resource context are assessed by
looking at their activities that affect the reefs either directly or indirectly. The primary
stakeholders are usually identified as an individual or group whose livelihoods highly
and directly depend on the marine resources and whose activities affect and are affected
by the marine protected area.
Several scholars consider it is important to know who does what, who influenced whom,
and the relationship between stakeholder groups (Grimble and Wellard 1997; Gelcich et
al. 2004; Reed 2008; Pomeroy and Douvere 2008; Benn et al. 2009). If one wants to
involve stakeholders in planning then it is critical to understand the stakeholders’
characteristics in regard to their socio-economic profiles and interests, the levels of
stakeholder groups and their relations. One powerful tool to understand the complexity
of stakeholders is stakeholder analysis.
Stakeholder analysis
Stakeholder analysis is a tool which involves the identification of all groups and
individuals who may have an interest or be directly or indirectly affected by resource
management changes, and analysis of their practices, responsibilities, interests and
relationships (Grimble and Wellard 1997). Several attributes must be considered in
analysing stakeholder groups, including: stakeholders’ positions on issues, the level of
influence they hold, level of interest they have, and the group or coalition to which they
belong (World Bank 2005) and the multiple “hats” they wear (Pomeroy and Douvere
2008). A stakeholder analysis enables the management body to understand the diverse
groups of community stakeholders. This enables the management bodies, for example, to
identify and understand which stakeholder is entitled to be involved in the participation
process.

Chapter 4. Community Involvement in the Establishment of MPAs in Indonesia _____________________________________________________________________________
101
Participation
What is participation?
Since participatory methods were promoted in managing rural development in eastern
Africa by Chambers in the early 1970s and were subsequently widely used in India
(Chambers 2005; 2008), it has become a popular approach in rural development globally.
This method changed the previous “top-down” development approach through
positioning local people at the centre of a process that empowers local people through
their self-analysis and planning, thus increasing program ownership (Chambers 1983;
1992; 2008; Driyamedia 1996; Carney 2002).
Participation has a wide range of definitions. DFID (in Chambers 2005) defined
participation as “enabling people to realize their rights to participate in and access
information relating to the decision making processes which affect their lives”. The
World Bank (in Chambers 2005) defines participation in development as “a process
through which stakeholder groups influence and share control over development
initiatives and the decisions and resources which affect them”. Uphoff and Cohen (in Ife
and Tesoriero 2006) emphasised people having a role in decision-making. This also
means taking into account the roles of marginalised actors (Coelho and Favaretto 2008).
Therefore, participation will grow and develop in a democratised, egalitarian and
equitable society (Chambers 2005). Basically, participation is a mechanism to allow
people to contribute or take part in the achievement of objectives.
There are several key elements in participation. Firstly, power is a strong element in
participation (Kelly 2005). Ife and Tesoriero (2006) stated that participation could range
from manipulation by power holders to citizens having control over decisions that affect
their lives, which is about the degree of control. However, power sharing is not an easy
issue. It relates to a complex and wide range of stakeholders with different interests and
different amounts of power (Jentoft 2007).
Chapter 4. Community Involvement in the Establishment of MPAs in Indonesia _____________________________________________________________________________
102
Secondly, the number of people participating in the event can fluctuate. The number of
stakeholder groups involved will affect the power sharing. New players come and go.
New opportunities attract people to come to that area due to economic drivers, and more
interested parties get involved due to increasing awareness and concern. The increased
number of stakeholder groups pushes groups to compete to make their voices heard.
Suarez de Viveroa et al. (2008) identified a participation paradox in which the greater
the number of stakeholders, the smaller the role each plays. Because of the different
levels of power and limited opportunities to have a role in the decision-making process,
the local community is becoming more marginalised. Cooke and Kothari (2001)
believed that participation could be a tyranny when there were unjust uses of power.
Finally, in an ideal world, participative planning processes must involve all people, and
participants should be at the centre of the planning process (Nichols 2002). On the other
hand, there are many groups with a ‘stake’ in marine resources and the number of groups
changes over time. One approach to deal with this fluidity is to set up a representative
system. Rockloff (2003) explains that, in a representative model of participation, a
community selects its leaders to be involved in the process and make decisions.
However, the question arises about whether the leaders in this model actually do act on
behalf of the public interest. Another problem in the participation of rural communities
relates to cultural barriers: people may not be used to expressing their opinions in a
community forum or they may depend highly on their leaders to speak for them.
Types of participation
Pretty et al. (1995) developed a model to understand participation which ranges from
passive participation to self-mobilisation where people participate by taking initiatives
independent of external institutions (Table 4.1). Arnstein (1969) described a ladder of
participation which involves eight levels: manipulation, therapy, informing, consultation,
placation, partnership, delegated power, and citizen control. These eight levels are
categorised into three main categories: non-participation which consists of therapy and
informing; the degree of tokenism which covers consultation, placation and partnership;
and the degree of citizen power which covers the last two levels (Table 4.1). Arnstein

Chapter 4. Community Involvement in the Establishment of MPAs in Indonesia _____________________________________________________________________________
103
emphasised that, at the highest level of participation, the participant must have control
and this is considered a participatory democracy. The models proposed by Arnstein
(1969) and Pretty et al. (1995) show the degree or scale to which stakeholders participate.
These two types of participation show a redistribution of power (Edward 2004) and
complement each other. The models were therefore used for further analysis of
participation in this study, as discussed in more detail in this chapter.
Table 4.1: Comparison of Arnstein and Pretty models of type of participation
Arnstein Pretty et al. Manipulation Passive participation. People participate by being told
what is going to happen. Therapy
Non-participation Informing Participation by giving information. People participate by answering questions designed by researchers and project managers.
Consultation Participation by consultation (being consulted by external agents. External agents define problems and solutions)
Placation (representation on a board or committee)
Participation for material benefit (e.g., cash, food).
Functional participation where people participate by forming groups to achieve project objectives. The involvement occurs after major decisions have been made.
Degrees of tokenism
Partnership Interactive participation where people participate in joint analysis which leads to an action plan and the formation of local groups or strengthening of existing groups.
Delegated power Degrees of citizen power Citizen control Self-mobilisation Sources: Arnstein (1969); Pretty et al. (1995)
Drawing from the definitions of participation, the following five key attributes of
participation were used in the present study to assess the stakeholders’ degree of
participation:
1 Activities leading to MPA establishment
2 Selection of participants: groups, the process of participants’ selection

Chapter 4. Community Involvement in the Establishment of MPAs in Indonesia _____________________________________________________________________________
104
3 Role of primary stakeholder groups, including marginalised groups
4 Shared control, decision-making and resources
5 Power to influence and make decisions.
4.4 Lessons Learned from Worldwide MPA Experiences
This section presents three case studies from around the world: Norwegian coastal zone
management, Mabini Marine Reserve in the Philippines, and Marovo Lagoon in the
Solomon Islands. All three marine reserves face similar problems in managing the
natural resources. One of these is the overexploitation of certain species, although the
degree to which this occurs varies from case to case. There are different characteristics
of these three marine reserves in terms of the main goal, area, number of people
accessing the resource, and reserve management system (Table 4.2).
Table 4.2: The characteristics of Norway coastal zone, Mabini Reserve and Marovo Lagoon reserve
Characteristic Norway Mabini Reserve, Philippines
Marovo Lagoon, Solomon Islands
Area 57,000 km of Norwegian coastal zone (Sovinsen
Reserved area 462.993 km2 and buffer zone area
700 km2 (Baines and Hviding

Chapter 4. Community Involvement in the Establishment of MPAs in Indonesia _____________________________________________________________________________
105
2003) is 50 m from the periphery of sanctuary3
1992).
Type of closure Coastal zoning regulation (Sovinsen 2003)
Whole year1 Periodic closure Few months to a year (Baines and Hviding 1992).
Number of people living in vicinity
10,657 people (2009) 68,000 people (1990) (www.ssb.no cited on 12 Dec 2009)
44,327 people in December 20034
8000 people (2009) 90% subsistence (Maloney 1994)
Main objectives of the reserve
Pelagic fish migratory corridor (herring, mackerel, salmon and cod) (Buanes 2004)
Coral reef conservation1
Oracion et al. (2005) - stockpiling resources for feast purposes (funerary or other)
- conserve bivalves mangroves
(Baines and Hviding 1992; Hviding 1998).
Threats to natural resources
- fish overexploitation - encroachment from development,
- marine space conflicts (Jentoft and Buanes 2005)
- over fishing, - blast fishing, - nitrification, - sedimentation - impacts from commercial ship traffic including the
discharge from ship grounding and cargo
(White and Vogt 2000; Oracion et al. 2005)
- over fishing or over harvesting if Tambu is open less than a year
- logging Foale and Manele (2004); Hviding 1998
Main stakeholder groups
- aquaculture industry - recreational fishing industry
- fishers - transportation sectors - county governor - fish processing plants Mikalsen and Jentoft 2001; Buanes et al. 2005; Mitchell et al. 1997
- fishers - tourism industry actors Oracion et al. (2005)
- fishers - customary chief (Bangara)
- other leaders - shells industry Aswani 2005; Hviding 1998
Norway Case Study
The fishery sector in Norway, as one of the largest seafood exporters in the world,
depends on the marine resource stocks. The Norwegian Government set up a reserve
along the coastal zone to conserve a pelagic fish migratory corridor. It covers 57,000 km
(Sovinsen 2003).
3 Republic of the Philippines: Resolution No. 102 2006, ordinance No. 04/2006: Mabini Marine Reserve 4 www.mabini.gov.ph accessed on 28 June 2008

Chapter 4. Community Involvement in the Establishment of MPAs in Indonesia _____________________________________________________________________________
106
The Norwegian coastal zone authority accommodated a wide range of stakeholder
groups through council representation. The fishing industry was strongly represented by
nine members, whereas the indigenous community only had one member on this council
(Mikalsen and Jentoft 2001).
The varied forms of participation in the Norwegian case are linked to differential power
relations (Buanes et al. 2005; Mitchell et al. 1997). Buanes et al. (2004) argued that the
agenda and issues discussed at meetings were highly dependent on how powerful a
stakeholder group was and whether they could influence other stakeholder groups. The
power of each stakeholder group was determined and played a significant role in
community involvement. Jentoft and Buanes (2005) emphasised that managers should
know the situation and understand each stakeholder group’s ambitions. This shows that
stakeholder recognition is critical in encouraging community involvement.
A coastal zone planner acted as a team member for community involvement in the
council. Coastal planners provided an arena and discourse for stakeholders to participate
in formal and informal ways. Buanes et al. (2004) found that responses in the listening
phase and direct contact with the coastal zone planning officer were the most common
forms of participation in the planning process. Working groups and public meetings
were rather time-consuming and resource-consuming but were a way of strengthening
such collaborative and integrative processes.
Gray and Hatchard (2008) noted that stakeholder groups’ participation helped to assess
the state of the ecosystem by supplying local knowledge and information to managers
and scientists. They also found that the participation process empowered the stakeholder
groups by providing them with information. This enabled the local stakeholder group to
make decisions and provided a framework in which to achieve agreements. White and
Vogt (2000) found that intensive education programs contributed to the local
community’s active involvement. White and Vogt emphasised that ethical relationships
would be the key link between stakeholder participation and management.

Chapter 4. Community Involvement in the Establishment of MPAs in Indonesia _____________________________________________________________________________
107
Mabini Reserve in the Philippines
Mabini Reserve, which was established for coral reef rehabilitation, covers 462,993 km2
and is 50 m from the periphery of the sanctuary as a buffer zone. More than 40,000
people live in the immediate vicinity of the reserve (Table 4.2).
Since it was established, there has been a growing number of new stakeholder groups in
Mabini, mainly ecotourism actors. The reserve authority established a collaborative
management system called the Community Resource Management Board to
accommodate all fishers and tourism sector actors. Power sharing arrangements amongst
the stakeholder groups and opportunities for joint decision-making were accommodated
in the management (Borrini-Feyerabend et al. 2004; Carlsson and Berkes 2005).
Initially, Mabini Reserve was a model for coastal management because of its success in
incorporating tourism and fishing sector benefits as well as conservation goals (White
and Vogt 2000). However, with the rapid expansion of the tourism industry, local fishers
have lost control and enjoyed fewer benefits. This has led to conflicts. Conflicts were
mainly caused by unclear regulations on the sanctuary area (Oracion et al. 2005).
Problems of ownership and appropriation arose. Fishers regard fish as resources that no
one owns until they are harvested, while resort owners prefer to treat the reserve area in
the manner of terrestrial territory. Fishers expressed negative sentiments towards tourism
actors who were mostly not residents in that area (White and Vogt 2000), but were
allowed inside the fish sanctuaries. Fishers felt less engaged in management decision-
making, feeling at the same time that they had the least access. In contrast, tourism
actors had the highest level of reserve access and control (Oracion et al. 2005).
Oracion et al. (2005) found that the community’s support of Mabini Reserve had
gradually decreased. The Community Resource Management Board was initially set up
as a discussion arena but was not beneficial to the local community because they felt
unable to compete with the tourism sector. As a result, community support gradually

Chapter 4. Community Involvement in the Establishment of MPAs in Indonesia _____________________________________________________________________________
108
decreased over time. In contrast, reserve managers still considered that the community’s
support was high, based on the compliance rates with regulations.
Marovo Lagoon in the Solomon Islands
The main objective of Marovo Lagoon in the Solomon Islands was to protect the barrier
reef of the lagoon. The barrier islands are fringed with mangrove forest and contain
Marovo’s most important fishing grounds (Baines and Hviding 1992). The area is
accessed by 8000 people and is significantly smaller than the other two marine reserves,
at 700 km2 (Table 4.2) (Baines and Hviding 1992).
The number of stakeholder groups in Marovo Lagoon is less than in the Norwegian
management area and Mabini Reserve (Table 4.2). Most Marovo fishers are members of
kinship groups and the customary owners of the reefs (Hviding 1998). The Marovo
people have great pride in their knowledge and understanding of the lagoon as a focus of
their culture and livelihood (Maloney 1994; Johannes and Hviding 2000). This pride led
them to guard their reefs on a daily basis.
The reserve is governed under a customary institution which is called tambu as a means
for conserving resources until they are required for a specific purpose such as funerary
and other feasts (Kinch et al. 2006). The management is in the hands of chief, called the
bangara who governs a puava (area) with a team of other leaders who provide advice to
the bangara (Hviding 1998; Kinch et al. 2006). The clan leader is powerful in managing
the resources. Henley (2008) argued the success of community-based management is the
ability of the community leader to exclude outsiders (a territorial approach) and apply
authoritarian management.
Although, the bangara is the key in tambu, the local community can join the discussion
during the tambu meeting but the decision-making power is in the hands of the bangara.
The traditional collective makes decisions about when and where to take marine
resources, gear restrictions, fish size, as well as market considerations (Hviding 1998).
Hviding (1998) explained that the members of kin groups are allowed to fish anywhere

Chapter 4. Community Involvement in the Establishment of MPAs in Indonesia _____________________________________________________________________________
109
as long as it is for subsistence. Meanwhile, the commercial users have to get permission
from the bangara. No outsider is allowed to exploit the resources.
The management is flexible toward changes, such as the changing perception of scarcity
and challenges by market forces, as well as community needs (Hviding 1998). For
example, when the price of Tectus niloticus shell was low, the clan leader banned the
harvesting of this species. Market aspects are thoroughly considered in the management
system. This type of decision also allows stocks to recover.
However, Foale and Manele (2004) argued that open season places chronic pressure on
the reef and invertebrate fish which leads to a decline in fish yield. If the tambu reopen
the lagoon within less than one year, many long-lived species will suffer from being
depleted. The closure can conserve the bivalves in mangrove areas but not other species
that need years to restock. The duration of taboos and traditional closures might not be
sufficient for the recovery of marine species from over-harvesting.
The decision of the customary-based reserve management is socially acceptable (Berkes
2005) within this community. Subsequently, compliance is high because the community
experiences benefits, sanctions are applied, and appropriate rules and monitoring are
maintained (Cinner 2007). Customary-based management has been long-accepted in the
Solomon Islands because it is based on the cultural context and considers the livelihoods
of the kin group members (Aswani 2005; Cinner and Aswani 2007; Tungale 2008).
In addition, there is a supporting factor that strengthens the customary-based
management applied in this area. The recognition of customary-based management is
legalised under the national law. For example, the Solomon Islands Lands and Titles Act
and the Penal Code give recognition to customary rights over such resources as fish and
shellfish. Another example of the recognition of customary-based management in the
law is the Fisheries Regulations 1972 and related legislation which specify certain
requirements for foreign and local commercial vessels to seek agreements with

Chapter 4. Community Involvement in the Establishment of MPAs in Indonesia _____________________________________________________________________________
110
customary owners before fishing within one nautical mile of a fishing village (Hviding
1998).
Lessons learned
These three reserves have their own uniqueness in terms of protection goals, area, wide
range of stakeholder groups and management systems. This leads to different degrees of
community involvement from one reserve to another, and results in varying degrees of
community influence in the management of the reserve.
The investigation of these three MPA experiences revealed that encouraging community
participation in marine reserves is challenging because of the growing number of
stakeholder groups and the changes over time in stakeholder relations, power and
interests. With reference to the Mabini Reserve and Norwegian management area case
studies, the protected areas involved a high number of stakeholder groups. This resulted
in local involvement changing over time. Therefore, a clear understanding of stakeholder
groups would help in encouraging community participation.
New opportunities create newcomers, and as a consequence the coastal community can
become powerless. A gap emerges between the stakeholders regarding their relative
power and ability to influence the management system. For example, the tourism actors
in Mabini and the fishing industry in Norway had taken over the access and control of
the resource. With the changes in the stakeholder numbers and relations, community
participation needs to be maintained and monitored. It is an ongoing, adaptive process to
allow adjustment to what is really happening (Friedman and Miles 2008; McVea and
Freeman 2005).
People must be enabled to participate and be supported in their participation (Ife and
Tesoriero 2006). Therefore, community participation needs enabling conditions. First,
stakeholder participation has to emphasis on the outcomes of empowerment, based on
trust, equity and learning processes (Reed, 2008). This means that participation needs to
empower the stakeholders by participation. Prior information and knowledge of marine

Chapter 4. Community Involvement in the Establishment of MPAs in Indonesia _____________________________________________________________________________
111
resources need to be supplied to the stakeholder groups to enable them to participate in
the discussion. A lesson from the Norwegian case study is that the intensive information
dissemination about the marine resource status empowered the local community to make
decisions and contributed to active involvement in the regulatory council. Second, the
stakeholders have to get involved from the beginning of the process of establishment
(Reed 2008). Chuenpagdee and Jentoft (2007) considered the involvement of
stakeholders must be at step zero during the establishment process. Third, a suitable
place and time are needed for a community to participate. In addition, it needs to be
facilitated by highly skilled facilitator and institutionalized (Reed 2008). Singleton
(2000) adds to ensure the participation should be put into system not depending on the
actions of particular party. Fourth, a wide range of stakeholder groups might need a
representative system, but marginalised groups need special attention, otherwise they
will not be able to compete with other stakeholder groups (such as the industrial sector).
Fifth, conservation works need to be linked with increasing the local community
livelihoods and markets of marine products. In the Mabini Reserve case study, a viable
tourism industry market did not encourage the coastal community to change their
livelihoods into the tourism sector. They had less ability to change their source of
livelihoods, which resulted in resentment that the tourism industry controlled more of the
marine natural resources and fishers had to compete with the tourism industry to access
the marine resources. Another illustration of the conservation links to people’s
livelihoods is customary marine tenure as shown in the Marovo Lagoon case. The
customary marine tenure is accepted by the community. The management is flexible
towards change and is able to meet the community’s needs as well as conserving the
resources (Cinner and Aswani 2007). Finally, involvement is not only about getting local
people involved in the activity but it is about sharing resources, access and control, and
having a role in decision-making. This will make the decision legitimate in the
community.
Having explored these three reserves from around the world, the focus of this discussion
turns next to Indonesia. In the next section, I explore the local community involvement
in the establishment of MPAs in Indonesia.

Chapter 4. Community Involvement in the Establishment of MPAs in Indonesia _____________________________________________________________________________
112
4.5 Case Studies in Indonesia: Wakatobi NP, Bali Barat NP and Riung
Nature Reserve
In the previous section, I discussed the key concept of community participation in
relation to international case studies. In this section, I discuss the historical and policy
context of community participation in Indonesia. This includes an overview of the
conditions in which the Bali Barat National Park, Wakatobi National Park and Riung
Nature Reserve were established. A profile of each of these case studies is then
presented in more detail.
4.5.1 Policy and historical setting of community participation in Indonesia
The practice of community participation in Indonesia’s development has evolved during
the course of changing political conditions. In the past, grassroots communities
participated in a form of gotong royong (working together to achieve the objective) in
which people shared opinions, responsibilities, assets and tasks to achieve common goal.
For example, every major activity in the community started with musyawarah
(discussing and agreeing on an issue) as a type of planning discussion within the
community.
During 1969-1997, a new era (orde baru) of central government was in place which
focused on high economic growth and national stability. In this era, the practice of
gotong royong was transformed into a type of community mobilisation in which people
were deployed to carry out allocated activities. There was less space for the community
to participate in discussion on the government’s programs. Top-down and repressive
approaches were dominant.
During this era, the Indonesian Government launched the Law of the Republic of
Indonesia No. 5 of 1990 on Natural Resources Conservation and Ecosystems. Under this
law, protected areas were categorised into several types: national parks (Taman
Nasional), strict nature reserves (Cagar Alam), wildlife sanctuaries (Suaka Margasatwa),

Chapter 4. Community Involvement in the Establishment of MPAs in Indonesia _____________________________________________________________________________
113
and nature recreation zones (Taman Wisata Alam) — each with its own regulatory and
management scheme. They were all managed under the Department of Forestry, the
Forest Protection and Nature Conservation (or PHKA, to use its Indonesian acronym)
with different levels of management. For example, national parks were governed at the
national level in which the budget, decision-making and management systems were
decided at the national level. The number of staff ranged from 30 to 50 people
depending on the size. The other categories were governed by the PHKA representative
in the region and most of the time with few staff. The national park management was
executed by a management authority, the Balai Taman Nasional. Other management
authorities included the Natural Resources Conservation Office (in Bahasa Indonesian
this is the Balai Kelestarian Sumber Daya Alam (BKSDA)), such as the Natural
Resource Conservation Body Unit in Riung.
In the post-Soeharto era from 1997, Indonesia experienced a more democratic era. Since
this time, many new regulations were applied to govern community involvement and
other stakeholder groups. Many new regulations were outlined to encourage community
participation in natural resources management. Several key regulations were:
1 The Forest Minister Regulation No. 19 of 2004 on collaborative management
(Peraturan Mentri Kehutanan No. 19/2004 tentang pengelolaan kolaborasi).
2 The Forest Minister Regulation No. 56 of 2006 on zoning guidelines (Peraturan
Mentri Kehutanan No. 56/2006 tentang zonasi).
3 The Government of Indonesia Regulation No. 6 of 2007 on forest management,
the preparation of forest management planning and forest use (Peraturan
Pemerintah No. 6/2007 tentang tata hutan, penyusunan rencana pengelolaan
hutan, serta pemanfaatan hutan).
The Forest Minister’s regulations on collaborative management were meant to improve
conservation area management by requiring collaboration between communities in and
surrounding the conservation area, government and private sectors. This decree outlined
that conservation activities should be planned collaboratively, acknowledge local
conditions and provide an opportunity for the local community to manage the resource

Chapter 4. Community Involvement in the Establishment of MPAs in Indonesia _____________________________________________________________________________
114
as part of the collaborative management. However, the decree did not describe the
process of community participation. This led to unclear interpretations of how to
position the grassroots community in collaborative management.
The Forest Minister’s regulations on zoning guidelines discussed zoning processes and
how to collaborate with stakeholder groups including communities. Articles 10 and 19 of
this decree recognised the equal opportunities of stakeholder groups and described an
approach to treating the stakeholder groups in conservation management. These two
decrees can be considered as complementing each other. The involvement of
communities in natural resource management was then strengthened by the regulations
on forest management and the preparation of forest management planning and forest use.
These laws created a space for communities to participate in natural resource
management. The laws outlined that the local community can participate in the planning,
zoning preparation and managing the resources. Beside those regulations, the law of the
Republic of Indonesia No. 32/2004 on decentralisation allowed for stronger participation
of communities in the public domain (Duncan 2007) and gave local leaders the power to
veto plans that were harmful to their local interest. These forestry-related regulations are
important components in the background setting of the three case studies in Indonesia.
4.5.2 Characteristics of Wakatobi NP, Bali Barat NP and Riung Nature
Reserve
In this section, I present the brief backgrounds and characteristics of Bali Barat NP,
Wakatobi NP and Riung Nature Reserve. These three MPAs were declared during the
Soeharto era (Table 4.3). Wakatobi was declared a national park in 1996, Bali Barat NP
and Riung Nature Reserve were established in 1986 and 19965, respectively. The zones
of the Wakatobi and Bali Barat NPs were established a decade after the declaration. At
the time of writing, Riung Nature Reserve had no zoning.
5 www.wwf.or.id accessed on 24 May 2008

Chapter 4. Community Involvement in the Establishment of MPAs in Indonesia _____________________________________________________________________________
115
Unlike Wakatobi and Bali Barat that are controlled by the national government, Riung
Nature Reserve is governed by the Natural Resource Conservation Body (BKSDA) in
Riung in collaboration with the Ngada district local government.
Table 4.3: Characteristics of Wakatobi NP, Bali Barat NP and Riung Nature Reserve
Characteristics Wakatobi NP Bali Barat NP Riung Nature Reserve
Year of declaration
1996 1986 1996
Zoning declaration
2007 1999 No zoning system in place
Marine reserve area
1,390 km2 6.22 km2 2 km2
Management system
National park authority
National park authority Nature reserve authority
Population living in the park area
91,497people (BPS 2006)
25,000 people 7,792 people
Main ethnic groups
Buton (Wanci, Binongko, Tomia, Kaledupa), Bugis, Bajau
Javanese, Maduranese, Bajau, Bugis, Mandar, Balinese
Riung, Bugis, Makasar and Bajau
Primary stakeholder groups based on interview
Fishers, district local government, fishery industry, tourism.
Fishers, tourism industry, seaport authority, aquaculture industry
Early stage: fishers Now: fishers, tourism industry (small and medium actors), seaweed farmers
Source: Wakatobi NP: Balai Taman Nasional Wakatobi dan Pemerintah Kabupaten Wakatobi 2006; WWF Indonesia 2006 Bali Barat NP: WWF-Indonesia 2002; Fitriana and Drestha 2006; Roung Nature Reserve: SK Menhut No 589/KPTS-II/1996; Atapada 2006
Wakatobi National Park
Wakatobi (or Tukang Besi Islands), which is an abbreviation of Wangi-wangi, Kaledupa,
Tomia and Binongko Islands, is located in Southeast Sulawesi (Sulawesi Tenggara)
Province. Wakatobi is located at the centre of high coral biodiversity (Figure 4.2) and
has 39 islands distributed in the Wakatobi archipelago.
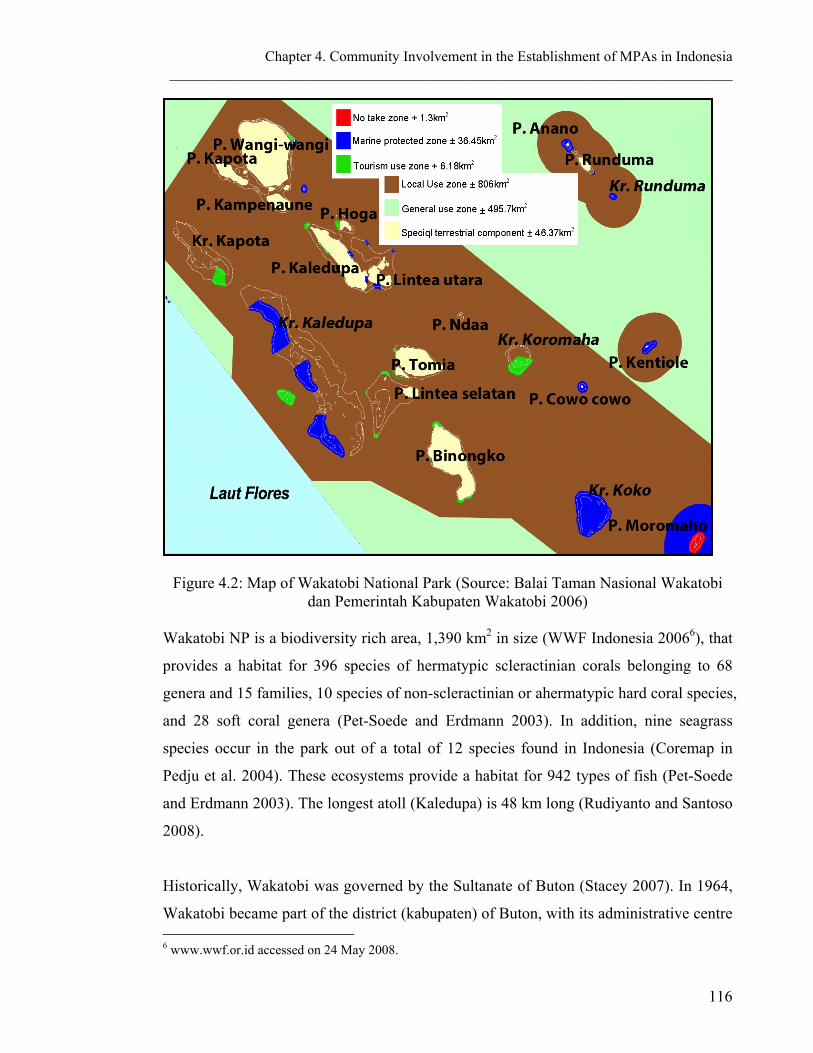
Chapter 4. Community Involvement in the Establishment of MPAs in Indonesia _____________________________________________________________________________
116
Figure 4.2: Map of Wakatobi National Park (Source: Balai Taman Nasional Wakatobi dan Pemerintah Kabupaten Wakatobi 2006)
Wakatobi NP is a biodiversity rich area, 1,390 km2 in size (WWF Indonesia 20066), that
provides a habitat for 396 species of hermatypic scleractinian corals belonging to 68
genera and 15 families, 10 species of non-scleractinian or ahermatypic hard coral species,
and 28 soft coral genera (Pet-Soede and Erdmann 2003). In addition, nine seagrass
species occur in the park out of a total of 12 species found in Indonesia (Coremap in
Pedju et al. 2004). These ecosystems provide a habitat for 942 types of fish (Pet-Soede
and Erdmann 2003). The longest atoll (Kaledupa) is 48 km long (Rudiyanto and Santoso
2008).
Historically, Wakatobi was governed by the Sultanate of Buton (Stacey 2007). In 1964,
Wakatobi became part of the district (kabupaten) of Buton, with its administrative centre 6 www.wwf.or.id accessed on 24 May 2008.

Chapter 4. Community Involvement in the Establishment of MPAs in Indonesia _____________________________________________________________________________
117
at Baubau province in Southeast Sulawesi. In 2004, the new district of Wakatobi was
established, with Wanci as the administrative centre. Roughly 90% of the Wakatobi
district administrative area is in the national park.
In 2003, there were approximately 91,497 inhabitants 7 while in 2006 there were
approximately 96,535 people (BPS 2006) living in the park. Based on Wakatobi census
data from 2006, 91% of people are ethnically Butonese (originating from the four main
inhabitated islands and the island of Buton) and 8% were Bajau people.
Bajau people were a minority group in the area, but relied almost exclusively on marine
resources (Stacey 2007) and were the main users of marine resources. Their main fishing
grounds were on major reefs (such as Kaledupa atoll and Kapota atoll) as well as in the
remote reef areas (Kentiole Island and Koko atoll) in the south-east of the park (Figure
3.2) (Pedju et al. 2004). Pedju et al. (2004) found the presence of fishing vessels from
outside Wakatobi was also high; these vessels were from Menui (central Sulawesi),
Sinjai (south Sulawesi), Saponde (southeast Sulawesi), Madura (East Java) and Hong
Kong.
Pedju et al. (2004) identified the tourism industry (especially diving) as increasing in
Wakatobi. There are several main players in the tourism industry in Wakatobi. Wakatobi
Dive Resort, located in Onemubaa/Tolandano Island, Tomia sub-district, targets the
high-end tourism market with dive packages including board and lodging. Wakatobi
Dive Resort has its own airstrip in Tomia to ensure easy access for its clients from Bali.
Operation Wallacea is an education-cultural tourism operation, catering mostly for
British university students who come to conduct short research projects for their degree
programs. All of the Operation Wallacea guests are accommodated in simple cottages
owned by Kaledupa residents. Another player in the Wakatobi tourism sector is Hoga
Island Diving which is owned by Butonese. Other tourism actors are live-aboard dive
vessels from Bali.
7 http://www.sultra.go.id accessed on 25 May 2008

Chapter 4. Community Involvement in the Establishment of MPAs in Indonesia _____________________________________________________________________________
118
The local government has an interest in exploiting marine resources to increase local
government income. Under the Law of the Republic of Indonesia No. 32 of 2004 on
autonomy and No. 33 of 2004 on the financial distribution of central and local
government, the district governments have been pushed to increase their own local
income. Protected areas have been considered as a potential source of local government
income. The bupati (head of Wakatobi district) defined three main developments in
Wakatobi: tourism industry, seaweed and fishing (Hugua 2006). These three sectors are
the main source of incomes for local government. Subsequently, Wakatobi NP as the
authority of the marine national park has to deal with the local communities who live
and utilise the marine resources and also deal with the local government that has an
interest in developing the area and increasing the income from marine resources.
Bali Barat National Park
Bali Barat NP is located on the north-western coast of Bali (Figure 4.3). Although it was
originally established to conserve Bali Starling (Leucopsar rothschildi) in 1986, this NP
covers some marine area (30% of its total area which is 6.22 km2) (WWF Indonesia
2002). The coral reefs occur almost continuously along the shoreline (including the
island) of the national park, with the exception of the mangrove forest area in Gilimanuk
Bay, and small areas in Terima and Banyuwedang Bay. This NP covers approximately
310 ha mangrove, 40 ha seagrass and 810 hectares of coral reef of which approximately
206 hectares (25%) is around Menjangan Island. This coral ecosystem is a habitat for
226 identified reef-related fish species (Pet Soede and Widyastuti 2001).

Chapter 4. Community Involvement in the Establishment of MPAs in Indonesia _____________________________________________________________________________
119
Figure 4.3: Bali Barat National Park Bali Barat NP is surrounded by a dense population of 25,000 people (Table 4.3). The
ethnic groups are diverse: Javanese, Madurese, Bajau, Bugis, Mandarese and Balinese.
Fishers from East Java and Madura also visit to fish in this area regularly. A large
tourism industry exists in the NP which comprises a variety of actors and levels. The
four largest resorts in this area are Waka Shorea Resort (PT. Shorea Barito Wisata),
Menjangan Jungle and Beach Resort (PT Trimbawan Swastama Sejati), Mimpi Resort
Menjangan, and PT Disthi Kumala Bahari. Several dive operators and small hotels
operate in this area. Other stakeholder groups are the seaport authority, and local
governments.
The impact of the economic crisis in 1998-1999, recurrent increases of petrol price, and
Bali Bombings in 2002 have resulted in an increase in the number of local fishers in this
area (Fitriana and Drestha 2006). The limited skills of local people and lack of
opportunities to benefit from the exploitation of other natural resources have forced
communities to use destructive fishing methods. In the meantime, there are no traditional
rules regulating access to marine resources in Bali Barat. Such a situation created de
facto open access and led to over-exploitative behaviour. In addition to these threats,

Chapter 4. Community Involvement in the Establishment of MPAs in Indonesia _____________________________________________________________________________
120
Bali Barat NP also suffers from many stresses, such as the rising temperature of seawater,
as a result of climate change, which causes coral to bleach, and uncontrolled tourist
activities (e.g., anchoring of boats in coral reef areas or people stepping on the coral
reef) (WWF Indonesia 2002).
Riung Nature Reserve
Riung Nature Reserve, or 17-islands, is located to the north of Flores Island. Initially, it
was established for the conservation of the Komodo Dragon which is found in this area.
During a Komodo Dragon survey in the early 1980s, surveyors from the BKSDA for the
Nusa Tenggara area found several clusters of coral reefs to the north of Flores. The
BKSDA under the Forestry Department and local government proposed all the marine
area as a marine reserve. Due to the increased tourism activities in this area, the local
government and conservation unit in Riung proposed to re-divide the marine reserve into
several categories. The area of the reserve became 30% of the total area which is 2 km2
marine nature reserve, 9.9 km2 tourism marine reserve and 4 km2 terrestrial components
(Table 4.3). As presented in Table 4.3, 7,792 people depend on the marine resources in
this area: these are mostly local people (suku riung) plus a small number of people from
Bugis, Makassar and Bajau who already inhabited the area.
Figure 4.4: Map of Riung Nature Reserve

Chapter 4. Community Involvement in the Establishment of MPAs in Indonesia _____________________________________________________________________________
121
4.5.3 Results
4.5.3.1 Stakeholder group recognition
Discussion with respondents from the three MPAs began with the author asking whether
the planning team or authorising body had conducted a stakeholder analysis during the
early stages of the MPA establishment, given it is one method to identify and understand
the relationships of the stakeholder groups.
From the discussion with key informants from marine reserve authorities and NGOs as
part of the planning team, it was revealed there was no special initiative to identify the
communities who lived around the reserves. All the park authority respondents reported
that the most common way to identify the local communities was by observation and
casual discussion with community leaders; no structured plan of stakeholder recognition
was involved.
4.5.3.2 Stakeholder group prioritisation
Although no stakeholder analyses were conducted, all of the respondents (11 people)
agreed that an understanding of stakeholder groups was important for the park. From the
discussion with key informants from the authorising bodies and NGOS, it was revealed
that through time the management body only had the knowledge of stakeholders in the
form of a list of stakeholder groups including diverse ethnic groups in the community
and the activities of each groups.
The key informants were asked to list and rank the stakeholder groups of the reserves.
This is one way to understand how the authorising bodies and other members of the
planning team prioritised and treated the stakeholder groups of the marine reserve. The
results of the respondents’ ranking of the top five most important stakeholder groups are
presented in Table 4.4. None of the respondents listed the local community, such as
fisher groups, as one of the top five priority stakeholder groups prior to the MPA
establishment process.

Chapter 4. Community Involvement in the Establishment of MPAs in Indonesia _____________________________________________________________________________
122
Table 4.4: Stakeholder rankings
Rank Wakatobi NP Bali Barat NP Riung Reserve Park authority
respondents Pioneer team
(NGO) respondents
Park authority
respondent
Pioneer team (NGO)
respondents
Park authority respondents
Pioneer team (NGO) respondents
1 Planning agency of Wakatobi District Government (Bappeda)
Park authority National government (Forest Department)
Park authority Bupati of Ngada District Government
Marine and Fisheries Department of Ngada District
2 Fisheries Affairs of Wakatobi Kabupaten
Buton District Government
Government at provincial level
3 customary institution leaders
TourismAffairs of Ngada District
Tourism Affairs Department of Ngada District
3 Pariwisata Affairs of Wakatobi District
Local NGO in Kendari and Buton
Bupati Dive operators Fishery Affairs of Ngada District
BKSDA Riung = nature reserve authority in Riung
4 Environment Agency of Wakatobi District
Government at sub-district level
Police and Army
Mimpi Hotel Government at sub-district level
Joint patrol team
5 Security (Police, Navy) University Village level government
Waka Shorea Resort
Village level government
Bappedalda (Environmental Impact Agency of Ngada local government)
As the results presented in Table 4.4 show, all the respondents considered the park
authority and district local government as their main stakeholder groups at the beginning
of the planning process. The representative from the NGO in Wakatobi considered that
they would prioritise formal institutions (e.g., government institution and local
government), rather than non-formal institutions (e.g., fisher groups). The park authority
of Wakatobi considered that the local government was closely related to the park’s
existence.
The representative of the NGO in Bali Barat considered the first stakeholder group to be
dealt with was the park authority because of their legal right to manage the park. The
authorising body of Bali Barat NP considered the Forest Department to be the main
stakeholder group, followed by government institutions at different levels. Similarly, the
park authority in Riung Nature Reserve considered that the Ngada District local
government was the formal institution to work with first. Riung respondents considered
that the local community would execute the orders from government. This was one
reason they prioritised working with government institutions at the initial stage.
Only Bali Barat respondents considered non-government stakeholder groups to be
among the top five stakeholder groups. These were the leaders of customary institutions
Chapter 4. Community Involvement in the Establishment of MPAs in Indonesia _____________________________________________________________________________
123
and tourism actors (hotels and dive operators). However, customary leaders do not have
a close relationship with fishers as most fishers are not Balinese and tourism actors have
little connection to fishers. The village governance system in Bali Barat is slightly
different from other areas in Indonesia. There are two village systems: customary
institutions (banjar) and villages under the government administrative system (desa
dinas). Banjar has its own rule, awig-awig, which is only applied to Balinese (mostly in
relation to farming or land-based activities). Even though the NGO staff involved the
leaders of customary institutions, it did not cover the fishers. Most fishers are from
Bajau, Madura and Jawa originating from outside of Bali. In summary, the local fishers
and community were not considered as a priority stakeholders during the initial
establishment of these three Indonesian MPAs.
4.5.3.3 Degree of participation in the planning process
The degree of community participation leading to MPA establishment was investigated
by asking the key informants eight questions. The key informants were asked about any
activities related to MPA establishment, the planning and implementing institutions as
well as the process to plan the activities, and about whether communities were involved
and in what way.
There are several main activities considered to be part of the activities leading to MPA
establishment: activities leading to MPA declarations, early biology surveys, social and
economic surveys, establishment of planning team, community forums (if any),
zoning/rezoning meetings, and joint patrols. Table 4.5 presents a summary of the data
gathered on preliminary activities from discussions with key informants and a review of
written reports.
As the results presented in Table 4.5 show, the communities in all parks were never
involved when the parks were established. After the parks’ declaration, a biology survey
was conducted in each park. The communities’ role was only to give prior information to
researchers as part of the biological baseline assessment in every park. During this

Chapter 4. Community Involvement in the Establishment of MPAs in Indonesia _____________________________________________________________________________
124
process, there was limited knowledge transferred from the surveyors to the community,
such as skills or information.
All three MPAs conducted social and economic surveys (Table 4.5). The planners and
implementers of these surveys were mostly park authorities and NGOs. In the social
economic survey, the communities in the three MPAs acted as respondents. Only the
local community in Riung Nature Reserve participated in the village meeting in 2007-
2008. During this meeting, the community was able to provide input regarding the social
and economic factors used for the survey.
A planning team was set up in Wakatobi NP in 2004. The members of the team were
mostly park authorities, NGOs and local government officials. The planning team was
set up in Wakatobi NP for the purpose of rezoning the national park. During the
discussion with key informants it was not revealed that a planning team was set up for
Bali Barat NP. In Riung Nature Reserve, a planning team was set up in 1999 initiated by
WWF Indonesia. Since the reserve was declared in 1996, only two activities by the area
authority had been implemented: patrols of the nature reserve (land and sea), and
informing the community about the conservation area. There was no other management
of the reserve. In response, WWF commenced a project to strengthen the nature reserve
management in 1999. As part of this closer collaboration by WWF Indonesia, a
management team with local government was established. The mission of the team was
to establish a nature reserve management system and build the ecotourism sector.
Members of the team included several agencies from Ngada district: Bappeda (Planning
Agency), Bappedalda (Environmental Impact Control Agency), BKSDA, Fisheries
Agency and WWF Indonesia. Unfortunately, no community representatives were
included as part of the team.
Building forums or local institutions is one of the key activities that lead to the MPA
establishment, through which communities could participate in other activities. These
activities were mostly initiated by NGOs in all marine reserves. For example, over time,
local communities were involved in the planning and decision-making of activities in

Chapter 4. Community Involvement in the Establishment of MPAs in Indonesia _____________________________________________________________________________
125
forums in Bali Barat NP. A communication forum for coastal communities was set up in
Bali Barat NP. This forum was called a coastal care forum (FKMPP). The ten members
represented a local NGO, fisher groups, customary institutions and tourism actors.
Initially, the communities acted as passive participants. However, over time, the
representatives of the communities were able to plan, execute and evaluate the activities.
One major program that involved all the communities surrounding Bali Barat NP was a
beach clean-up. The forum was able to inform wider communities about their objectives
and activities during the beach clean-up. Meanwhile, Wakatobi NP first set up a forum
in 2005. In this meeting, 22 people represented communities from 64 villages in
Wakatobi NP. One of the results of the first meeting was an agreement that discussions
about marine resources had to be conducted at the village level, not the district level.
This meeting resulted in a consensus regarding the joint patrol between the park
authority and local communities’ representatives. The number of community
representatives was two people in every patrol. These representatives were determined
through a forum meeting. Through this forum establishment activity, ten translators
became community organisers. An institution to accommodate tourism actors was also
set up in Riung in 2005. The participants were mostly local tourism actors in Riung
Nature Reserve.
Table 4.5 presents a summary of the activities related to rezoning. The local community
in Bali Barat demanded rezoning through regular forum meetings. However, no clear
plan was developed. Several activities were conducted to establish rezoning in Wakatobi
NP. It started with a presentation of an ecological survey by the planning team in 64
villages with the participants selected by each village leader in 2004. Because of no clear
criteria from the planning team about who should attend this meeting, the village leaders
normally chose the informal leaders. In this meeting, the planning team also presented
the rationale behind national parks and conservation activities to the participants. The
participants of this meeting could argue during this meeting. Another activity leading to
rezoning in Wakatobi was the first public consultation, conducted at village level and
then at sub-district level in 2006. The participants were also selected by the village
leaders. In this meeting, one main community input taken into account by the planning

Chapter 4. Community Involvement in the Establishment of MPAs in Indonesia _____________________________________________________________________________
126
team was to protect the inshore fishing area from outside fishers to fish in Wakatobi (4
miles from the land border only for Wakatobi people). However, the Bajau people
mostly rejected the idea of a no-take zone. According to one key informant, it was hard
to work with the Bajau people and the planning team was looking for ways to work with
the Bajau people more effectively. In 2007, several national public consultations were
conducted. There was no role for the communities in Wakatobi, and the consultations
were mostly conducted with NGOs, the Forest Department and the bupati (head of
district).
Riung Nature Reserve conducted several activities related to zoning. In 2002, the
ecological survey team presented their results. The community acted as an audience,
with no further involvement. The local community in Riung Nature Reserve demanded
rezoning since conflicts had occurred between fishers, tourism actors and aquaculture
farmers. The community meetings were conducted at district level and were attended by
the representatives of seven villages (Atapada 2006). Thus, in 2005, a plenary meeting
resulted in the representative system, called a forum, of mainly ecotourism actors to
negotiate with the government and some agreements to be followed up at the village
level. In 2007, community mapping was conducted to identify resource use. Prior to this
community mapping, a training course was conducted. This activity was initiated by an
NGO and the ecotourism forum selected the participants. During this meeting, the
community could contribute ideas and inputs since it was about resource use in Riung. In
2008, a survey of spawning aggregation areas (SPAG) was conducted by WWF and the
marine reserve authority. The local fishers supplied prior information on fish spawning
area. Few people from ecotourism were involved. Based on the discussion with local
fishers, the committee found four of the SPAG that were important and recommended
for inclusion in no-take zones.
Joint patrols were one activity in which the local community could participate in the
management of MPAs. Since 2003, joint patrols were established by the forum and
NGOs in Bali Barat NP. The forum shared a budget with the park authority as well as
the NGO. Each member of the forum selected the joint patrol participants, including the

Chapter 4. Community Involvement in the Establishment of MPAs in Indonesia _____________________________________________________________________________
127
fisher groups. It brought the park closer to the local people, increased community
ownership of the parks and supported the achievement of conservation objectives. As a
result of this activity, WWF Indonesia (2006) recorded that dynamite fishing decreased
steeply until zero from February 2004 to April 2006, while the cyanide fishing method
was rarely encountered. Joint patrols in Wakatobi NP were part of the park authority’s
program. The forum of communities in Wakatobi NP sent two people to participate in
joint patrols. The communities in Riung were also involved in joint patrols. In addition,
the local fishers helped the park authority in law enforcement by monitoring the use of
the reserve by non-Riung fishers and destructive fishing methods.
The last important activity is sustainable livelihood activities. In 2003, the forum of
communication for the coastal community in Bali Barat conducted a meeting with local
fishers to discuss livelihoods of the coastal community. This was the first local fishers’
engagement in the forum activities in Bali Barat NP. The forum invited at least five
representatives of local fishers from every village surrounding Bali Barat NP. The
meetings were conducted several times to formulate problems and find solutions. During
the discussions, the local fishers expressed their concerns and two-way discussions were
conducted, facilitated by an NGO. The fishers were able to conduct problem analysis,
plan, execute and monitor progress in the livelihood activities. The fisher groups were
also able to take part in decision-making. In 2004, the first meeting with fisherwomen in
Bali Barat NP was held. The forum had become more able to organise meetings since it
was first established, and the forum invited the women’s group. During this discussion,
the women decided the activities, planned, executed and monitored. The women’s
groups were able to design and influence the design of livelihood project implementation
and monitoring. Through these sustainable livelihood activities, the local fisher groups
were able to plan and organise their activities. One key informant from the communities
stated that these were the first activities planned and executed by the local fisher groups.
In Wakatobi NP, the only livelihood activity was the WWF activity to promote green
and fair products in 2007. WWF strengthened the communities’ products by involving
the producers in one of the management training sessions and an exhibition. Similarly, in

Chapter 4. Community Involvement in the Establishment of MPAs in Indonesia _____________________________________________________________________________
128
Riung, the communities were involved in the WWF green and fair products activity
since 2006.
To summarise the community participation, the local communities and especially the
local fishers were not involved during the declaration era, ecological survey and socio-
economic survey leading to the establishment of the MPAs. Since 2003, the arena for
community participation had existed through forums in all marine reserves, although the
participation was varied in every reserve. The most common roles were the local
communities, including the local fishers, being invited by the planning team or selected
by the village leaders. Following this step, the local fishers in Bali Barat NP were able to
make plans and be involved in the decision-making process especially livelihood-related
activities. This activity also encouraged the local fishers in Bali Barat NP to participate
more in the forum since the local fishers experienced direct benefit. Unlike Bali Barat,
the local fishers in Riung were less involved in any activities; only ecotourism actors in
Riung were involved in the marine reserve activities starting from 2007. The selected
local fishers in Wakatobi NP attended a presentation of the ecological survey results in
2004. In 2006, in the first public consultation on the zoning plan, the local communities
were able to contribute in setting the four nautical mile restriction for local fishers only.
However, the Bajau people mostly rejected the idea of no-take zones. The rejection
happened again at the second public consultation.

Chapter 4. Community Involvement in the Establishment of MPAs in Indonesia _____________________________________________________________________________
129
Table 4.5: Community’s role in the activities leading to the establishment of MPAs
Bali Barat NP Wakatobi NP Riung Nature Reserve Activities leading to
MPA establish-
ment
Year and detail activities
Community’s role Year and activities
Community’s role Year and activities
Community’s role
MPA declaration
1984 meeting of ten conservation areas in Bali 1986
Top-down, no involvement
1996 Top-down, no involvement
1996 The area was plotted on the map
Top-down, no involvement
Early biology survey
1999 coral reef, fisheries, and series of coral reef data 2003, threats analysis
Provide preliminary information Invited, actively involved in discussion
1990 By WWF and PHKA 2002-2003 Rapid Ecological Assessment, by WWF and TNC
None Supply preliminary information
2001 By WWF 2007-2008 SPAG training and data collection
Supply preliminary information, such as location of certain species. Participants, influence in early stage of activity, no influence in final decision
Social economic
survey
2003 by WWF As respondents 2005 perception survey on NP by NP in collaboration with WWF TNC
As respondents 2000 by WWF 2003 by World Neighbour 2007-2008 Participative village meeting
As respondents As respondents Participants, able to influence some adopted measures.
Planning team set up
- - 2004 (WWF TNC, park authority, local government)
1999 Management team (park authority, local government, WWF)
Forum/institution
establish-ment
2002 Facilitated by WWF 2003-2004 Forum’s monthly meeting 2003 beach clean-up
10 members: representing local NGO, fisher groups, customary institutions, tourism actors - Strengthen forum’s activity - Function as the office of the forum This activity involved almost all villagers. In this activity, the general community knew forum.
2005 -22 people represented 64 villages -10 translators increased their capacity to become community organisers
2005 Ecotourism community forum
Members are tourism actors. Since then many trainings were conducted such as ecotourism, handicraft, enterprise of art shop.

Chapter 4. Community Involvement in the Establishment of MPAs in Indonesia _____________________________________________________________________________
130
Table 4.5: Community’s role in the activities leading to the establishment of MPAs (Continued)
Bali Barat NP Wakatobi NP Riung Nature Reserve
Activities leading to MPA establish-ment
Year and detail activities
Community’s role Year and activities
Community’s role Year and activities
Community’s role
Meetings leading to Zoning/rezoning
Monthly meeting Rezoning was always discussed but there was no clear action.
2004 Presentation of ecological survey result to community by planning team. 2006 First public consultation of zoning plan at village level, then at sub-district level 2007 discussion at national level March 2007 Second public consultation at village and sub-district level. May 2007, Second national public consultation July 2007 Rezoning was signed by Dir-jen PHKA and head of district.
Conducted in 64 villages. The participants were selected by village leaders. Participants could argue during meetings. - Village representatives were invited, participated in discussion and provided input.
- One main community’s influence was to protect inshore fishing area from outside fishers to fish in Wakatobi (4 miles from land border only for Wakatobi people).
- Bajau people mostly rejected the idea of no-take zone.
Grassroots community or representatives had no role. Team initiated the meeting, village leader invited the participants. Again, Bajao people mostly rejected idea of no-take zone. No role No role
2002 -Team presented the ecological survey to 8 villages, at sub-district and district level. 2007 Community mapping to identify resource use pattern and social and economic. Initiated by WWF. 2008 SPAG, conducted by WWF and BKSDA.
Audience, no influence in decision-making. Forum selected the participants of first training, then forum organised community’s discussion. Supply preliminary info, few people from forum involved in monitoring.

Chapter 4. Community Involvement in the Establishment of MPAs in Indonesia _____________________________________________________________________________
131
Table 4.5: Community’s role in the activities leading to the establishment of MPAs (Continued) Bali Barat NP Wakatobi NP Riung Nature Reserve
Activities leading to MPA establish-ment
Year and detail activities
Community’s role Year and activities
Community’s role Year and activities
Community’s role
Joint patrol
2003- onwards One of the forum’s regular activities. Members of forum established patrol team and plan Each member of forum must appoint their staffs/members to join the patrol, including fisher groups.
2005 Through forum, it was agreed that 2 community representatives could join the patrol. They are selected by the forum.
Involved in joint patrolling. Fishers help monitor the reserve from non-Riung fishermen and destructive fishing methods.
Sustainable livelihood activities
June 2003 planning meeting 2003 onwards 2004 meetings: forum and women groups 2004-2006 technical training, cross visit, business training, management training 2006 WWF Phased out
Fishers were invited by forum, facilitated by WWF. The fishers were able to conduct problem analysis, plan, execute and monitor progress in the livelihood activities. The fisher groups were able to make decisions for themselves. Forum invited the women’s group. The women decided the activities, planned, implemented and monitored. Women groups were able to design, influence the design of project implementation and monitoring. Organisers, participants.
2007 Strengthening quality of community products by involving the community in green and fair products of WWF Indonesia.
Participants, fisher groups were not able to influence final decision.
2006 onwards Involved in handicraft, fish aggregating devices, business training. Now, they can plan and execute activities.

Chapter 4. Community Involvement in the Establishment of MPAs in Indonesia _____________________________________________________________________________
132
4.5.3.4 Social and economic considerations
Based on the discussions with key informants and a review of unpublished reports, the
social issues identified were the community profile, resource use pattern and local level
institutions (Table 4.6).
Table 4.6: Social issues considered in MPA planning stages in three MPAs in Indonesia
Social Issues Bali Barat Wakatobi Riung Type of social issues identified 2003 2005 2003
History of community and its settlements Y N Y Ethnic group identification Y Y Y
Community profile: Population (total, growth, HH composition/ ratio of workforce, migration)
Not migration Total population only
Total population only
Resource users’ group identification Y Y Y Method and gear used for harvesting marine products by different user groups
Y Y Y
Location Y Y Y
Community resource use pattern
Seasonal pattern Y Y Y Lists of local institution Y Y Y Membership system in the institution identified
Y Y Y
Rules in the institution identified Y N Y Local level institution
Connectedness to other organisations (power relations)
Y N Y
Rules Y N N Sanctions Y N Y Taboos N N Y Sea tenure N N N Customary rules Relation to other ethnic groups and institutions (e.g., government, business sector)
Y N N
Perception on events or activities that are believed to harm marine resource
N Y N
Community knowledge on marine resources:
1. traditional ecological knowledge on resource location
N Y Y
2. marine species N N Y 3. population size N N N 4. taxonomy N N N 5. reproduction process of certain marine species
N N N
Community knowledge and perceptions on marine resources
6. interdependency among marine resources
N N N
Note: N=no, Y=yes, it was identified
Source: discussions with key informants and a review of unpublished reports

Chapter 4. Community Involvement in the Establishment of MPAs in Indonesia _____________________________________________________________________________
133
The economic factors considered in MPA planning cover household economic status,
degree of dependency on marine resources, market influence on the planning process
and ecotourism (Table 4.7).
Table 4.7: Economic issues considered in MPA planning stages in three MPAs in Indonesia
Economic Issues Bali Barat Wakatobi Riung Household economic status
Y N Y
Contribution of marine-based activity to total family livelihoods
Y N Y
Purpose of harvesting marine products: 1. Commercial
Y Y Y
2. Subsistence Y N N
Degree of dependency on marine resources
Did you identify cash income beside marine resources?
Y N N
Commercial products Y Y N Demand and its trend (quality, quantity) N N N Who controls the price ? Y N Y Market influence Financial arrangement between harvesters (local community) and buyers
Y N N
Ecotourism prior to MPA establishment
Key actors and roles
Y Y Y
Note: Y=yes, it was identified; N=no
Bali Barat National Park
In Bali Barat, the social and economic concerns were identified using the participatory
method. The main reason was to have a better understanding of the communities and to
find a strategy to deal with the communities in relation to community awareness. In 2003,
a socio-economic survey was conducted by WWF for the purpose of improving
livelihoods through community mapping activities (Table 4.5). Therefore, household
economic status, the dependency on marine use and the markets were identified.
The key informant from an NGO described that the identification of socio-economic
issues covered local institutions and the rules of each institution, the history of the
community and community perceptions towards marine resources. This was also verified
by a key informant from the local fisher group who acted as a participant in the
discussion during the socio-economic assessment. Regarding the local institution, the
planning team identified the membership of every institution in Bali Barat. For example,

Chapter 4. Community Involvement in the Establishment of MPAs in Indonesia _____________________________________________________________________________
134
all local fishing community groups had inclusive membership while customary
institutions had exclusive membership and only applied to Balinese. The planning team
acknowledged this customary rule but it was not used widely for the MPA establishment
since the Balinese customary rule is mostly applied to land-based activities.
During the identification of stakeholder groups in Bali Barat, the planning team also
explored the history of the community in Bali Barat. This information was gathered to
develop a strategy to communicate effectively with the community due to a long history
of conflict and previous repressive action in this area. The planning team found that
discussions between the park authority and the community were rarely conducted. If
there was communication, it was more likely to be an announcement rather than a
discussion. Most of the actions taken by the park authority to address stakeholder group
needs and problems were reactive. Tension between the park authority and the local
community was quite high in Bali Barat NP. Several conflicts had occurred. These were
caused by an antipathy to the park authority due to the park’s differential treatment
between the local community and big companies, inconsistencies in the park authority
policies, and land tenure problems in the park which had never been resolved.
By understanding the situation in the community, the NGO transformed its approach to
position the community equally with the involvement of the NGO field facilitator,
increased staff facilitation skills and positioning the community at the highest priority.
As a result, it brought the issue of marine conservation closer to the community as well
as the park.
The key informants for Bali Barat NP explained that community perceptions on marine
resources were identified using the participatory method. One interesting finding was
that members of the community considered that the marine resources were created by
God who would provide readily for as many people as possible (Fitriana 2007). Based
on this finding, the NGO changed its approach in the communities and linked the marine
resources with beliefs.
Wakatobi National Park

Chapter 4. Community Involvement in the Establishment of MPAs in Indonesia _____________________________________________________________________________
135
A survey of community perceptions of marine resources was conducted in 10 villages by
WWF-TNC and NP in 2005. This was aimed at assessing the condition of marine
resources ten years ago compared to the present condition. Local beliefs were also
identified and considered in the biological survey. For example, Wahab village marine
area was considered dangerous (keramat) in traditional Bajau belief, therefore Bajau
people rarely fished in that area. When the biology survey was conducted, there was no
biological importance in terms of diversity or key functional species or ecosystem
vulnerability. Therefore, myths and legends were assessed and then verified with the
biology survey in relation to natural resources management.
The key informants of Wakatobi explained that they had identified the number of ethnic
groups in Wakatobi; however, there was no further understanding about the rules and
sanctions in the ethnic group institutions. For example, there was limited knowledge
about Bajau people.
In Wakatobi, no structured surveys were conducted by the MPA planning team to
understand the economic factors in the local community. The key informants from
Wakatobi reported that the planning team (WWF-TNC, NP authority and district
government representatives) had a casual understanding of capital dependence between
fishers and buyers. The key informants explained that the planning team recognised the
high value of marine resources which were used for commercial purposes, but the
subsistence purpose was not identified by the planning team. Both key informants
recognised the high demand of seaweed, live reef fish and tuna. Since 2005, seaweed
had been the primary marine product in this area. Luckily, the community agreed to farm
seaweed outside the core zone. The discussion with the key informants revealed that the
effect of price had not yet been considered. For example, if there was an increasing
demand for seaweed, the planning team had no sensible assessment of how the increased
demand would push people to farm seaweed in the NP area. The details about the NP
zoning are discussed in the next section.

Chapter 4. Community Involvement in the Establishment of MPAs in Indonesia _____________________________________________________________________________
136
One key informant knew that the community’s main livelihood was trading. The key
informants from the park authority and an NGO reported that the planning team had
recognised that the Bajau people were totally dependent on marine resources. However,
the planning team had not gathered data on trends in the Bajau community, for example
data on the times and the numbers of people who fished in other marine areas where the
community harvested the marine resources for subsistence purposes.
Wakatobi is one of Indonesia’s popular tourist destinations. The key informants reported
that they had suggested that the economic survey should include the tourism sector in
Wakatobi as it existed before the zoning process started. As discussed in the site
description, ecotourism in Wakatobi was promoted by Operation Wallacea through
research ecotourism. Operation Wallacea collaborates with the community in providing
simple accommodation for guests who are mostly researchers. Wakatobi Dive Resort
also operates in Wakatobi and several small hotels are run by Bugis people. Tourism
operators benefit the most from this industry, including the owners of restaurants and
small hotels. The incidental benefits to fishers are the use of their boats and fishers’
knowledge as a sea rider.
Riung Nature Reserve
Similar to Wakatobi and Bali Barat National Parks, limited social and economic surveys
had been conducted in Riung Nature Reserve prior to its establishment. The goal of the
subsequent social and economic survey was mainly to assess the marine resource use,
destructive fishing methods and government institution interests (Atapada et al. 2003).
The social and economic survey was also combined with a biology survey, such as the
mangrove and coral reef conditions, and the location of sea cucumbers, giant kima,
shells and reef fish.
The planning team had a chance to assess the community perceptions of marine
resources in 2003. This survey was meant to assess community perceptions on marine
resource systems and their traditional beliefs in relation to those values. The team found
a number of ongoing traditional practices relating to the take and use of juvenile fish,

Chapter 4. Community Involvement in the Establishment of MPAs in Indonesia _____________________________________________________________________________
137
and offerings to sea gods in a customary ritual (turun ke laut; literally, “go to sea”).
Seasonal harvest rules, such as the baubelek ceremony that opened the area to harvest
between July and August, were also in force. According to key informant leaders from
Riung Nature Reserve, these practices helped to manage the area since Riung Nature
Reserve did not yet have any zoning established.
A detailed understanding of community livelihoods was identified through a social and
economic survey at Riung Nature Reserve. The initial purpose of the survey was mainly
to collect data on marine products, gear and the intensity of fishing in a certain area
(Atapada et al. 2003). The survey identified household economic status, the degree of
dependency on marine resources and the characteristics of ecotourism. The key
informant from the NGO reported that the survey identified the contribution of marine-
based activities to total families’ livelihoods; however, the survey did not identify either
the use of marine resources for subsistence or commercial purposes. In regard to
ecotourism, the tourism sector had developed in this area since the reserve was declared.
According to the key informants, the group that benefited most from ecotourism
activities was the tourism sector; for example, boat owners, guides, restaurants and
home-stays. Similar to the Mabini case in the Philippines, only a limited number of
fishers were able to take up opportunities in the tourism industry.
The key informant from the NGO illustrated the commercial value of fish from Riung.
Most pelagic fish were sold at the local market. All the key informants from Riung
Nature Reserve agreed that the demand for pelagic fish species was high in Bajawa, the
capital city of Ngada district. However, the transportation costs and the risks were high
as the market was far away. All the products were therefore sold in the local market for
local consumption or to local collectors who would take the product to a wider market
(such as sea cucumbers).

Chapter 4. Community Involvement in the Establishment of MPAs in Indonesia _____________________________________________________________________________
138
4.5.3.5 Zoning and management system
Zoning and management are a critical part of an MPA because they govern the execution
of the MPA. This section discusses the process leading to zoning declarations in relation
to the three case study sites.
Bali Barat National Park
As a national park in Indonesia, Bali Barat NP follows the rules and regulations applied
to national parks under the national law (UU No. 5/1990). The zoning system in Bali
Barat NP had not changed since the park was declared in 1999. Initially, the zoning was
defined to conserve the Bali Starling bird. Since then, it had not been reviewed although
the local communities had requested the park authority to review the zoning system. The
restriction to certain areas had led to resentment within the coastal communities and thus
there were many cases of the law being broken regarding this restriction (WWF
Indonesia 2003).
Based on the regulation (UU No. 5/1990 and the regulation of the Forest Minister No.
56/2006 on zoning), local communities were not allowed to access and benefit from the
core zone. The local community could only access and benefit from the traditional use
zone. By law, the traditional zone allowed any efforts applied by local communities by
any means of traditional equipment for subsistence. The different interpretations
between the park authority and the local fishers regarding traditional use and equipment
had also created tensions.
Local communities had lived in this area long before the park was established in the
1930s (as explained by the key informant from the park authority); however, there was
no customary management of the marine area. The community’s representative
emphasised that it was their right to access and benefit from the marine resources, at
least in the traditional zone. The park authority considered protecting the zone was their
mandate by the law. Through the Coastal Care Forum (FKMPP), the local community
was continuously demanding a zoning change. Consensus on this issue had not been
achieved.

Chapter 4. Community Involvement in the Establishment of MPAs in Indonesia _____________________________________________________________________________
139
Empowerment activities increased the community’s confidence in negotiating with
outsiders. The fisher groups were able to organise themselves, deal with buyers and
advocate their rights to local government. Since that time, fishers were able to plan,
influence and make the final decisions on certain activities. However, they failed to get
access to the traditional use zone of the park.
Wakatobi National Park
The zoning plan for Wakatobi NP was developed through negotiation and public
consultation. In 2006, the planning team and park authority conducted the first public
consultation of the zoning plan at the village level. Village representatives were invited.
The key informant from the NGO explained that the participants of this public
consultation enquired whether the Wakatobi resources were exclusively for the
Wakatobi people. In the zoning plan, a local use zone was set up for 4 nautical miles
(Balai Taman Nasional Wakatobi-Pemerintah Kabupaten Wakatobi 2008). Both key
informants mentioned that the Bajau people mostly rejected the no-take zone plan as it
covered their main fishing area.
The zoning system results in a clear marine use area. Fishing methods and tools are
regulated in the plan. Based on the Wakatobi NP zoning plan manual, the local
community is allowed to access the tourism zone, local use zone and common use zone
(Balai Taman Nasional Wakatobi-Pemerintah Kabupaten Wakatobi 2006). The general
use zone covers 57.84% of the total area. Any traditional activity can be carried out in
the general use zone (Figure 4.2). Meanwhile, the common use zone, covering 35.66%
of the total area, is designed to accommodate the exploitation of marine use, especially
pelagic fish, to support Wakatobi district development. Fishers from outside Wakatobi
can fish in the common use zone. Respondents considered that this zoning system
protected marine resources as well as the Wakatobi people from outsiders who heavily
exploited the resource.

Chapter 4. Community Involvement in the Establishment of MPAs in Indonesia _____________________________________________________________________________
140
A series of biological data surveys had been conducted in Wakatobi NP. The biological
survey found there were 12 spawning aggregation sites of the 30 sites suggested by the
community in 2002-2003. After one year’s monitoring, four SPAGs were found to be
suitable for inclusion in the no-take zone. In the perception monitoring, it was assessed
that 1% of fishers were spending 20 days fishing per month in the core zone, 3% were
fishing in the protection zone and more than 80% were fishing in the local user zone area.
As a result of this finding, the area where most of the local fishers fished was set up as a
local use zone in the Wakatobi zoning plan. This information was brought back to
marine user groups for consultation. It was reported that most “users” (this term was
used by the respondents) agreed with the no-take zone apart from the Bajau community
and indirect users of the marine resources (e.g., teachers and civil servants).
The core zone, where mostly the Bajau people fish, has been designated based on
biological concerns. The key informants considered that the planning team had
considered Bajau livelihoods. They reported that there had been some brief
consultations; however, Bajau perspectives had not been incorporated in a detailed
manner.
Riung Nature Reserve
At the time of gathering data for the present study, no zoning had been put in place in
Riung Nature Reserve. The authorities allowed the local community to fish anywhere in
the area as long as they used environmentally-friendly fishing methods. No fishers from
outside Riung were allowed to fish in Riung Nature Reserve. The need for zoning had
been promoted as there had been many conflicts between fishers, seaweed farmers and
tourism actors.
4.5.4 Discussion
Based on the discussion with key informants, as presented in the results section, it is
apparent that none of the planning teams in the three marine reserves had conducted an
identification of the main stakeholder groups before these areas were declared marine
reserves. This is considered to have occurred due to the “top-down” approach to marine

Chapter 4. Community Involvement in the Establishment of MPAs in Indonesia _____________________________________________________________________________
141
reserve establishment. At that time, Indonesia was under a centralised national
governance system. Therefore, all the initiatives from the central government had to be
implemented in the field. In addition, as the main objective of the reserves was to
preserve the habitat, more attention was paid to protecting the environment from human
threats without considering the livelihoods of the local fishers. For example, the
initiatives to protect the Dragon Komodo in Riung and the coral reefs in all three marine
reserves disregarded the livelihoods of local fishers.
A decade after the declarations, there was still no structured method involved in
stakeholder group identification. The management authorities recognised that people
benefitted from the marine resources, however the approach was conducted in a casual
manner. No stakeholder group analysis was conducted when the reserves were
established. Stakeholder analyses on the interests, characteristics, power relationships
and the linkages among the actors were weak. Only Bali Barat conducted a stakeholder
analysis several years after an NGO started a project in that area in 2003.
Community participation
The results from the interviews with respondents from three parks showed that the level
of community participation in the planning process had changed over time. There was no
involvement of local communities when the parks were declared (1986 and 1996) and
very little involvement following this up until 2003. In the late 1980s, top-down and
repressive approaches were mostly still used.
Change occurred with the local community participating more in park activities after
2003 when there was a key driver, in this case an international NGO, seeking to establish
the park. This change was also supported by several new regulations since 2004,
especially the central government regulations on collaborative management, zoning
guidelines, forest management planning, and forest use. Participation is outlined in these
regulations; however, there are several interpretations and the resulting uncertainty has
led to variations in levels of community participation.

Chapter 4. Community Involvement in the Establishment of MPAs in Indonesia _____________________________________________________________________________
142
All the respondents from the marine reserve authorities expressed similar views that
participation meant the involvement of the community in the process of management
whereas the decision-making was the role of the government. In different conditions, the
participation of village leaders (kepala desa) as an extension of government was seen as
community involvement. The involvement of customary leaders (banjar) in Bali Barat at
beginning of the project was also considered as community involvement although it did
not really target the leader of the fishers as most of the fishers were not Balinese. The
ambivalent role of banjar and dinas in Bali Barat made more confusion how the banjar
could influence the fishers. Warren (1993) warned tensions between these two
organizations affected how they served the members and acted as development agent.
Therefore, the selection of community leaders in representing the main stakeholder
group is important.
Several methods were conducted by the planning team to encourage community
participation. In Bali Barat and Riung, the planning teams involved the targeted
communities through intensive meetings. This allowed the planning team to empower
communities’ capacity in relation to natural resource management and remind the
communities about the previously agreed plan. The planning team in Riung encouraged
and invited the local community to be more involved in activities since 2006 when a
project started to focus more on community empowerment. The meetings were targeted
to community-based tourism actors and were conducted from time to time. Moeliono
and Maing (2004) noted that the process of community involvement in Riung was quite
successful in coordinating the community to negotiate with government but it failed to
encourage the community representatives to organise themselves at the village level as
agreed in the meetings and to put pressure on the local government to fulfill its
commitments. In fact, Moeliono and Maing argued that the community representatives
waited for NGOs to take initiatives. Referring to the ladder of participation (Table 4.1),
the degree of participation in Riung is at the information-sharing stage.
In Bali Barat, at the early stage of developing livelihood activities in 2003, fisher groups
were at the partnership level with the NGO. The planning team enabled people to

Chapter 4. Community Involvement in the Establishment of MPAs in Indonesia _____________________________________________________________________________
143
participate in problem scoping and joint analysis which led to the action plan and
strengthening of existing groups. In 2007, the fishers were able to mobilise their
resources and find new opportunities.
The planning team in Wakatobi focused more at the area level and paid less attention to
individual community groups. In Wakatobi NP, community participation was by
representatives. Not all the community members had an opportunity to be consulted or to
participate as the invitees were selected by village leaders. By contrast Rockloff (2003)
suggests a representative model of participation where the communities select their
representatives. Later during the zoning process, there was an event held where
indigenous Wakatobi (Butonese) fishers were able to contribute to designing the local
use zone to protect their interests. However, the Bajau people were more or less
excluded from this consultation. This supports the argument by Clifton (2013) that the
planning team in Wakatobi NP failed to facilitate the conservation initiatives to suit the
Bajau context.
As indicated in the previous section, there was no participation at the early stages of the
marine reserve establishment. Over time, the degrees of participation varied. Wakatobi
achieved consultation by representatives, Bali Barat achieved a partnership, while Riung
was in the position of informing community members at an early stage and increased
partnership through certain activities. The NGOs were the main catalysts to encourage
community involvement for more than five years in each area and offered the highest
degree of participation as in the models of Arnstein or Pretty et al. (Table 4.1). This
indicates that degrees of citizen power in which the community is able to control and
take initiatives have not been achieved. Despite this, all the respondents agreed that
community participation was an important attribute for sustainability of park
management.
Seven reasons that might contribute to this varied degree of participation are proposed:
Chapter 4. Community Involvement in the Establishment of MPAs in Indonesia _____________________________________________________________________________
144
1) Knowledge about the fishers was not prepared well in advance, yet this knowledge
would be necessary to develop strategies to encourage effective fisher participation. The
illustrations from respondents revealed a lack of understanding about the local
communities. The respondents from the Wakatobi park authority stated that no cultural
leadership roles existed in the Bajau community, so the community members followed
their bosses or financial sponsors. One key informant from WWF-TNC believed that if
the Bajau people did not agree with the meeting’s result they easily sailed to other places
or provoked other people to not agree with the discussion. It was reported that the zoning
team in Wakatobi NP found it difficult to communicate with the Bajau people. The key
informant from WWF-TNC further stated that the communities had no tradition in
expressing their needs at public events and, therefore, the community leaders acted as
spokespersons. Furthermore, one respondent thought the Bajau people were afraid of the
conservation concept.
Lack of understanding about communities is also shown by the tendency to consider the
communities as homogenous. Once heterogeneity is realised, more effective approaches
can be taken. For example, a key informant from Riung Nature Reserve stated that the
MPA planning team only considered one main local ethnic group, the Riung, whose king
had responsibility and control over the land in the park area and who thus determined if
and how the land could be used. At that time, the park authority only considered whether
the king had been involved and believed that the whole community would follow the
king. In fact, while Riungese was the main local ethnic group there were also Bajau and
Bugis people who did not follow the king’s words and who also lived in different areas.
Bajau people were identified as the main user groups, yet no special approach was taken
in Wakatobi to facilitate their involvement. The key informants from the national park
knew the uniqueness of the Bajau people in terms of their living conditions (largely
living in stilt houses built above the water on coral reef foundations), their dependence
on marine resources, lack of land ownership and thus land-based livelihood strategies as
well as local social structures and institutional situation (Balai Taman Nasional
Wakatobi 2008). The key informant from WWF-TNC added that it was difficult to get

Chapter 4. Community Involvement in the Establishment of MPAs in Indonesia _____________________________________________________________________________
145
ongoing commitment and participation from members of the various Bajau villages due
to their mobility. A large proportion of the Bajau people travel seasonally (as well as a
semi-permanent migration to Nusa Tenggara Timur Province) to engage in various
distant shore fishing activities within the Australian Fishing Zone and along the borders
of Indonesia and Australia. Different approaches are needed for different communities as
the communities are heterogonous and have different livelihood portfolios.
2) For appropriate community consultation and to ensure a differentiated understanding
of communities, the implementing agency needs appropriate skills for community
engagement and guidelines for engagement from their management. Reeds (2008) also
considered highly facilitation skills contributed to the effective participation. This
includes the ability to adjust to the local situations and attitudes in the grassroots
communities. Wakatobi key informants suggested that if they had more varied expertise
including social, economic and anthropological expertise that could assess the social
concerns, they might have different approaches to marginalised communities. Thus, the
method of sharing information could be adapted to the characteristics of the
communities. The key informant from the NGO in Wakatobi explained that capacity-
building by increasing people’s confidence in presenting their opinions in the public
sphere, slowly but surely, helped in bridging the communication with user groups
(fishers, seaweed farmers and other people whose livelihoods depended on marine
resources).
3) Fishing communities were considered less important in the initial planning process.
This can be seen from the results showing that none of the respondents positioned fisher
communities in their top five stakeholder groups (refer to Section 4.5.3.2).
4) The participation arena was chosen by the planning team. However, it is worth asking
how fruitful the discussions were considering how the participants were chosen. For
example, the planning team in Wakatobi conducted discussions at the village level for
which the participants were selected by the village leaders. An understanding of village
politics would have helped the planning team to understand what was really happening

Chapter 4. Community Involvement in the Establishment of MPAs in Indonesia _____________________________________________________________________________
146
at the village level. Meanwhile, a communication forum for the coastal community in
Bali Barat was able to empower the local fishers to participate in the livelihood-related
activities, especially after they experienced real benefits.
5) The participation schedule and the frequency of activities leading to the MPA
establishment were a challenge for local communities. For example, the meeting times
might have prevented the local fishers from participating, as the local fishers and the
planning team had different work schedules. One key informant from Wakatobi
considered it was hard to get a time commitment from the local fishers. This might have
been caused by scheduling activities at the wrong time.
Intensive meetings with the local fishers in Bali Barat and local tourism actors in Riung
helped increase the participation. Similarly, the key informant from Wakatobi NP
reported that they experienced a long process to build communication with the local
communities. On the other hand, there were time pressures to achieve the desired
conservation outputs as specified in the project documents, while the local communities
had different timelines. A key informant from Wakatobi illustrated an example, if the
bupati (head of district) made a commitment and required a written documentation, the
planning team could prepare the document (e.g., letter) without consulting the grassroots
community. Cooke and Kothari (2001) considered that participation could be a tyranny
as the communities were forced to accept the decision made between the head of district
and planning team. This caused a debate in the communities when the planning team
announced the result of the agreement. Practices like this affected the extent to which
that the MPA was built at the grassroots level, nevertheless, the planning team achieved
their targets as required in the project document. In this context, Waisboard (2008)
argued that community participation can be institutionalised in a system that rewards
bureaucratic procedures, that is, in a system that aids bureaucracy. Pressures to “move
money” and accomplish goals within certain timetables pushed the planning team to
achieve outputs.

Chapter 4. Community Involvement in the Establishment of MPAs in Indonesia _____________________________________________________________________________
147
6) The need for community participation is outlined in the law but the implementation
by the park authority is varied depending on the interpretation. Detailed technical
guideline might be required to govern the policy as well as the ability to adopt
international guidelines into practical actions.
7) Challenges in encouraging community participation also occurred from the project
design that established MPAs with different priorities. For example, the Wakatobi key
informants emphasised that they were limited in their approach in enabling the
marginalised community because the priority of the Wakatobi project was to support the
management authority, thus approaches were targeted at the broader level instead of
dealing with particular ethnic groups. Meanwhile, in Riung Reserve, the project had
focused on community empowerment activities since 2006 and more management
attention had been paid to involving the local community in the marine management.
Bali Barat also experienced the same situation. The varied expertise in the planning team
had brought about a change in stakeholder group focus and involvement which resulted
in more support from the community.
In Bali Barat, the livelihood-related activities were developed by the local fishers. The
local fishers were able to deal with outsiders such as local governments, the park
authority and buyers, and they had the ability to design and implement activities outside
the park. However, the local fishers failed to influence the rezoning of the traditional use
access rights. In this context, the community was not able to mobilise its power to affect
the change (Reed et al. 2009). Several reasons might have led to this situation. Firstly,
power needs knowledge, time and interest to influence the decision-making process. The
empowered community also needs to attend to their daily lives while the effort to
advocate change needs persistence, time and energy. The park authority remained silent
as it lacked clear guidance from the central government. No-one took initiatives to
investigate the problems. The community felt it was beyond their power and that it was
the role of the park authority to deal with the central government. Secondly, there was no
political will from the park authority to renew the zoning system. Rezoning had been
outlined in the Forest Minister’s regulations about zoning; however, there was no

Chapter 4. Community Involvement in the Establishment of MPAs in Indonesia _____________________________________________________________________________
148
concrete action from the park authority or planning team. Thirdly, there was a lack of
NGO leadership, since WWF Indonesia had phased out from this area in 2006.
Social and economic considerations in MPA establishment
The results of the interviews reveal that the social and economic factors were assessed
by the MPA planning team after 2003 when NGOs started focusing their projects on the
local communities. The assessments were conducted with several purposes depending on
the NGO mandates in that area. For example, in Bali Barat a participatory assessment
was conducted on socio-economic factors related to the development of livelihoods in
2003, seven years after the park was declared; in Wakatobi a socio-economic survey was
conducted to identify the community’s perceptions of the park’s existence (Halim and
Mous 2006) some years after the declaration of the MPA; and in Riung WWF-Indonesia
conducted a socio-economic survey to assess the marine resource users in 2000 (four
years after declaration) with the main purpose to assess the dependency of stakeholder
groups on marine resources (Atapada et al. 2003). In addition, World Neighbour
conducted a socio-economic survey in 2003 in relation to conflicts related to natural
resources (Moeliono and Maing 2004). Overall it shows that social issues were not
identified when the marine reserves were declared. The social issues were investigated
later mainly by NGOs. The dynamic of the population and customary rule were not
assessed.
As indicated above, the focus of the NGOs in the three reserves, as the main drivers,
enabled the socio-economic factors to be considered. For example, in Bali Barat an
effort was made to find a better solution to livelihood problems. The local fishers,
including the users of destructive fishing methods and fishers who lived in the national
park, had better livelihood opportunities outside the park. This activity also empowered
the local fishers to deal with outsiders. However, the partnership level had little impact
on the community’s demand to access the traditional use zone.
Another example of how the approach to the community depends on the NGO mandate
is the Wakatobi case. The key informant from the NGO in Wakatobi explained that the

Chapter 4. Community Involvement in the Establishment of MPAs in Indonesia _____________________________________________________________________________
149
focus of the project had limited the NGO to working with the individual ethnic groups.
The planning team knew that almost 100% of the Bajau people’s livelihood depended on
the marine resources, however there was no structured plan to work with the Bajau
people. A lack of ability to understand the Bajau people led to an unclear plan about how
to find a better solution for the Bajau community. This might have made it difficult for
the Bajau people to subsist in a restricted area and, to some extent, may have pushed
them to travel and fish more in other prospected sea, such as the Indonesia-Australia
fishing border which historically was one of the Bajau fishing areas (Stacey 2007;
2007b).
In Riung, the planning team was able to identify local beliefs; however, the planning
team had not been able to integrate this knowledge into the MPA establishment.
Informal practices helped to manage the Riung area because Riung Reserve was yet to
be zoned.
One economic factor that was assessed by all the planning teams in these three reserves
was ecotourism. Ecotourism was a favoured activity for development in the protected
areas since it created income for the parks and for local governments. However, the
development of ecotourism had marginalised the local fishers as the main stakeholder
groups, as also illustrated in the Mabini Reserve case study in the Philippines (Section
4.4). In Bali Barat, tourism actors had a major role. The hotels ranged from five star
resorts to small hotels. This is one reason why the tourism actors were involved at the
initial stage of planning. The local fisher group representative in Bali Barat stated that
resentment always occurred because the resorts had access to the park, while the fishers
did not. The key informant from the park explained that the people had lived in that area
since the 1930s, when the local fishers were asked to stay away from the core, buffer and
traditional use zones, and the local fishers continuously questioned why the tourism
industry could access those zones and how they could acquire the same right. Direct
benefits from the tourism industry could only be experienced by communities if they
joined in the provision of services, such as diving through membership of the relevant
dive operator society. However, most of the five star hotels provided their own diving

Chapter 4. Community Involvement in the Establishment of MPAs in Indonesia _____________________________________________________________________________
150
service. Benefits could also flow to communities if they had boats to be used for diving
or transporting people to Menjangan Island for the purpose of pilgrimage; however, few
local people had boats.
In Wakatobi, the ecotourism industry ranged from five star resorts to small hotels and
research-ecotourism enterprises. The local communities were involved in research-based
ecotourism by providing accommodation and meals for tourists, but had less
involvement in the operations of the big companies. One local fisher group
representative from Tomia stated that the local fishers were asked to fish away from the
water around the resorts. In addition, as my field visit to Wakatobi in 2009 confirmed,
most of the people who benefitted from the ecotourism, such as the owners of restaurants
and small hotels or traders of fruit and vegetables, were not the local fishers.
In Riung, there was no specific zone for tourism. Conflicts occurred due to
misunderstandings about who could benefit from one area and by what method. The key
informants from Riung stated the tourism actors complained about the seaweed farming
areas that downgraded the view due to the use of plastic bottles as a buoy for the lines of
seaweed. Meanwhile, the key informants among the local fishers in Riung also
questioned why tourists could benefit from the area while they could not. Zoning had
been discussed to solve this problem. Similar to Wakatobi, most of the owners of hotels
and restaurants were Riung people. One Bajau family tried to open a home-stay but this
did not operate for long.
Zoning
The marine zones are used for integrating and managing several uses of marine
resources and interests by the fishing industry as well as the local fishers. The
determination of zonal boundaries is a challenge. The incorporation of social and
economic factors is critical, not only for the zoning process but also for the success of an
MPA (White and Vogt 2000; Dietz and Adger 2003; Christie 2004; Balgos 2005;
McClanahan et al. 2006; Gray and Hatchard 2008; Klein et al. 2008).

Chapter 4. Community Involvement in the Establishment of MPAs in Indonesia _____________________________________________________________________________
151
Bali Barat NP used the Bali Starling bird as the basis of zoning, and then evolved to
consider coral reef protection. In Riung Reserve, plotting on the map was used to define
the borders. Wakatobi NP had no zoning plan until ten years later.
The increased level of community participation in Bali Barat did not influence the park
authority to renew the zoning of the traditional use zone, although the law allowed the
zone to be changed. It is a limitation for the park authority to have the power to govern
the zone changes without a clear mechanism. The legal framework is not supplemented
by proper guidance regarding its application. A clear mechanism is needed for the park
authority as well as the local community to take further action.
In Wakatobi, a lack of understanding about Bajau people led to little consideration of the
community’s socio-economic factors in the determination of the core zone. This created
conflict. In 2009, a group of Bajau people demonstrated in front of the office of the head
of Wakatobi district to demand access to the reef area (as reported by the government
village leader of Mola Selatan). However, no action was taken by the planning team in
response to the demonstration.
In addition to the limitations in the zoning process, the use of colour maps created
misunderstandings when the maps were then copied in black and white. The key
informants from Wakatobi explained that the conflicts that occurred during the zoning
process were caused by misunderstandings about the colour coding of zones on the
national park map. Someone duplicated the zoning plan using black and white rather
than colour copies because the black and white copying was cheaper than colour copying.
The local fishers thought every site was restricted since every zone looked the same
colour. In fact, every zone had different colours with different rules, such as the
permitted gear and area. All of these activities are part of the initiative to disseminate the
zoning and community outreach and awareness program for students and wider
community for a longer term.
Chapter 4. Community Involvement in the Establishment of MPAs in Indonesia _____________________________________________________________________________
152
In short, regardless of the different management approaches of all the marine reserves
profiled in this chapter, all the marine reserves provided an arena for the local
communities to contribute to the management. The Norwegian coastal reserve had the
Norwegian regulatory council, the Mabini Reserve had the co-resource management
board, Marovo Lagoon had tambu meetings, Bali Barat NP had a forum, Wakatobi NP
was in the process of establishing a forum and Riung had an ecotourism forum. However,
learning from the Norwegian case, intensive and direct contact between coastal zone
planners and the indigenous people such as the fishers was helpful in enabling the
participation process.
In addition, the growing interest in establishing marine reserves pushes more stakeholder
groups to participate in the arena. This changes the support of local communities for the
marine reserve over time. For example, the increasing power of tourism actors in Mabini
Reserve marginalised the local fishers whose numbers decreased significantly (320
people in 1980 to 203 in 1994 (Oracion et al. 2005)). Similarly in the Norwegian coastal
reserve case, the fish farming industries took control of the marine resources away from
the indigenous people. The indigenous people were represented by one seat in the
regulatory council, while nine of the 11 seats were held by industry. Competition
between tourism actors and the local fishers also occurred in the Wakatobi, Bali Barat
and Riung cases. In the Marovo Lagoon case in the Solomon Islands, control over
marine resources was in the hands of the clan chief, the bangara, and the other leaders.
As discussed in regard to the international case studies, the success of the Marovo
Lagoon management approach resulted from the ability of the bangara to exclude
outsiders.
4.6 Conclusion
The experiences from the case studies discussed in this chapter highlight that community
participation is one of the critical issues in MPA establishment. The support of local
communities to the establishment of MPA fluctuated.
Chapter 4. Community Involvement in the Establishment of MPAs in Indonesia _____________________________________________________________________________
153
Learning from the worldwide experiences, community participation needs to be
encouraged by the relevant authorities; however, the degree of involvement needs to be
maintained and monitored due to competition with newcomers. The experience from
Norway shows that local communities were very much involved in the planning process
but then the fishing community had less power in the council that regulated the reserve
due to the representative system (9 of 11 seats were held by industry). The case of
Mabini Reserve in the Philippines case shows how fishing communities competed with
ecotourism actors to use the reserve. This also shows that particular stakeholder groups
may not be treated equally. Special attention is needed for marginalised communities
such as the Bajau people.
In the Marovo Lagoon case study, resonance with the existing customary management
system brought the new management system closer to the community, making it
adaptive towards market change and local livelihoods. The adaptive and inclusive
processes in decision-making meant the customary marine reserves were more accepted.
The customary system was also strengthened by national policy support.
The Indonesian experiences in establishing marine reserves show that the stage of
development reflects the nation’s political situation. Bali Barat NP, Wakatobi NP and
Riung Nature Reserve were established under the previous era in Indonesia’s political
history. Park approaches to communities have changed over time. At the time when the
parks were established in the 1980s, communities were not involved in the planning.
After 2000, community participation was more encouraged in park activity as outlined in
national policy.
In the real world, community participation is not easy. The planning teams of the three
profiled reserves in Indonesia encouraged community participation in a certain manner,
however the degree of participation was far from convincing. Participation varied due to
several enabling conditions. Firstly, the opportunity was provided for participation, yet it
was not comprehensive. Insufficient times and places meant only a few selected
communities were able to participate. Involvement of the village leaders as the extension

Chapter 4. Community Involvement in the Establishment of MPAs in Indonesia _____________________________________________________________________________
154
of government at the village level was considered to be community participation.
Secondly, a lack of appropriately skilled staff in encouraging community participation
contributed to limited community participation. This included the ability to recognise
stakeholder groups in the planning process. Thirdly, representation seems to be the best
solution in high populations but the selection process of the representatives should also
follow a participatory process. Fourthly, equal information between the planning team
and local fisher communities is necessary in order to have equal positions in decision-
making. Fifthly, an output-oriented project is important but it is also important to
consider the process. Finally, a clear mechanism on how to enable the community
participation should be set out in the policy.
As discussed in relation to the varied degrees of participation in the three Indonesian
marine reserves, the planning teams of all the three marine reserves identified and
incorporated limited social and economic concerns in the zoning plans, which mainly
covered eligible beneficiaries, marine resource use patterns, gear and location. However,
none of the planning teams of the three marine reserves had been able to assess in detail
the assets that supported the local livelihoods, let alone incorporate the livelihood
aspects into the zoning and management plans. Social and economic issues were not
incorporated effectively when the community’s livelihoods were totally restricted.
Overall, the discussion in this chapter has demonstrated the fundamental lessons learned
regarding community participation in MPA establishment. These results are used as the
inputs in developing the best practice guidelines for prospective marine reserves, as
discussed in Chapter 7.

Chapter 5
The Livelihoods of Coastal Communities on Pantar Island
Husband and wife are fishing in the water adjacent to Kayang Island in June 2010

Chapter 5. The livelihoods on Pantar Island _____________________________________________________________________________
157
Chapter 5: The Livelihoods of Coastal Communities on
Pantar Island
This chapter explores the livelihoods of the local communities in the context of an MPA.
The main research question, as addressed in Chapter 1, is: To what extent do local
communities’ livelihoods depend on the coastal and marine natural resources compared
to their other resources? This chapter also investigates how the communities cope with
the vulnerabilities. In the context of MPA establishment in Pantar, this is necessary to
provide an understanding of what will happen to the coastal communities if a restriction
is applied and what strategies they will apply.
This chapter is divided into four main sections. The assets of the communities on Pantar
Island are explored. The context of the vulnerability is discussed, including how it
influences the level of access and the diversity of the assets. Then, the transforming
structure and process are examined. Following this, the livelihood strategies and
outcomes are explored in order to assess how communities survive on Pantar Island.
5.1 Methods
As discussed in Chapter 2, a sustainable livelihood analysis framework (DFID 1999)
was applied. The framework includes a discussion about human, natural, financial,
physical and social assets, the vulnerability context, and the degree to which assets are
affected by the vulnerabilities over which people have limited or no control, the
transforming structure and process, and livelihood strategies people undertake to make a
living and outcomes. In relation to the transforming structure and process, the
effectiveness of assets is said to be enabled or hindered by existing structures in the
community such as government and private sector actors and the process that forms the
relationships such as laws, policy, culture and institutions. Livelihood strategies are the
ways in which assets are combined and activities are undertaken in order to achieve their
livelihood goals.

Chapter 5. The livelihoods on Pantar Island _____________________________________________________________________________
158
Data were collected using several methods (Chapter 2). Empirical data were gathered
from the field sites using several methods such as the participatory research appraisal
(PRA) method that included focus group discussions (FGD), stakeholder analysis using
Venn diagrams, institutional analysis, village maps, resource use mapping, pie charts of
time and seasonality, trend analysis, and village historical line. In addition, key
informant interviews, fish identification and resource maps, fish measurements, and
household surveys were also used.
A total of 31 focus group discussions were held involving approximately 233 people.
This excludes people who joined the feedback sessions (see Section 2.4.4). These FGD
were complemented with key informant discussions with between 8-10 other men and
women (either identified by members of the FGD for their local knowledge and/or
seniority and experience in fishery sector activities) to clarify the information gathered
during the FGD. The data were also complemented with the author’s personal
observations of a broad spectrum of fishing activities conducted by both men and
women in different seasons.
In the case of natural capital, the number of fish landed was recorded and the length of
the fish was measured by at least two fish traders in each village. Approximately 21,000
of demersal and pelagic fish as well as 203 trepang and 254 top shells were measured
from December 2009 to May 2010.
Qualitative data were analysed by classifying the data into parts under themes such as
assets, vulnerabilities and outcomes. The interrelations among the variables were
examined to build a logical chain of findings (Miles and Huberman 1994; Creswell
1998; Moisander and Valtonen 2006). The interrelations between assets, vulnerability
and background phenomena that constitute the survival and coping strategy in
livelihoods were assessed to generate key learnings. In terms of quantitative data, fish
length was presented by means, median, modus and frequency. These quantitative data
were contrasted with the first maturity at length based on the literature review. The

Chapter 5. The livelihoods on Pantar Island _____________________________________________________________________________
159
results of the fish measurement were used as a proxy to assess the status of particular
fish stocks in the study area. These data contributed to an analysis of the dependency of
communities on marine resources on Pantar Island.
5.2 Livelihood assets
Assets are used in activities to produce livelihood outcomes. These assets are classified
into human, natural, physical, financial and social assets. This section describes these
assets, and how people own and access certain levels of assets to make a living.
5.2.1 Human assets
Human assets contribute significantly to community livelihoods (DFID 1999; Chambers
1995; Beaulieu 2002). They comprise the labour force, knowledge and skills, and ability
to work. People can maintain their livelihoods because of skilled labour and the ability to
work. Several factors affect the labour force including household size and household
composition. Knowledge and skills comprise formal education and levels of knowledge
and skills that relate to particular livelihood activities that are transferred from
generation to generation. The ability to work can be affected by people’s health and that
includes access to adequate food and health care. Access to sources of livelihood is
discussed in detail in the section on social assets
Labour force
Household size is important for a family in these villages because household members
are a source of labour (Cho and Rogerson 1988; Apps and Rees 1996). Blangmerang
village had the biggest population, followed by Labuhan Bajau hamlet and Marisa
village (Table 5.1). The average number of household members in one household was
five people in 2009. Only Blangmerang village had seven people in one household in
2008. Marisa had the biggest proportion of female (60% of the total population). Two
other villages also had more female than male.

Chapter 5. The livelihoods on Pantar Island _____________________________________________________________________________
160
Table 5.1: Human assets in the four villages
Labuhan
Bajo Blangmerang Kayang Marisa
Population* 1017 (December 2009)
1498 (August 2008)
717 (December 2009)
937 (December 2009)
% of female* 48% 52% 57% 60% # of households (HH) *
239 224 158 189 Labour Force
# of people in one HH*
5 7 5 5
Formal education: # of schools***
SD=1, SMP=2, SMA=1
SD=1, SMP, SMA SD=1 SD=1, SMP=1
Knowledge and skills Related to
livelihood activities
- specialised fishing gear, marine products and locations - segregated by gender - transferred from generation to generation - see also Table 5.2
Staple food Rice Rice and corn Rice and corn Rice and corn
Ability to work
Health facilities*&***
Health centre = 1 One doctor, 4 midwives
Health centre = 1 (1 doctor, midwife, nurse, mobile clinic)
Health centre = 1 Midwives: 4
0
Notes: * Village leader’s record The latest record in Blangmerang during data collection was 2008 ** Discussion SD= Sekolah Dasar/Primary School
SMP= Sekolah Mengengah Pertama/Junior High School *** Observation SMA= Sekolah Menengah Atas/Senior High School
Knowledge and skills related to formal education
Limited school facilities existed in the four villages. There was only one primary school
(SD) in Marisa village with four teachers and 282 students registered in 2008. A Junior
High School (SMMP) was built in 2009 with two teachers employed but in 2010 one
teacher resigned (Table 5.1). In Kayang, there was only one primary school (SD) and no
junior high schools (SMP) existed. However, the primary school in Kayang had more
facilities than the school in Marisa village, including six teachers and sport facilities.
There was a new junior high school in a neighbouring village, Wolu village, which could
be reached in less than 30 minutes walk. The parents preferred to send their children to
Baranusa and Kabir although it was further from their home. An intense conflict
between Wolu and Kayang-Marisa (Kangge Island) in June 2008 discouraged parents
from sending their children to study in Wolu. At a women’s focus group discussion, it

Chapter 5. The livelihoods on Pantar Island _____________________________________________________________________________
161
was reported that the conflict had been triggered by a seaweed farming dispute and then
developed into a religious war (refer to the discussion about seaweed in Chapter 6).
Although the conflict was resolved, many parents still worried about sending their
children to Wolu.
Blangmerang village had only one primary school but other schools (other primary
schools, junior high school and senior high school/SMA) were located not very far away,
at about 15 minutes walk, in Baranusa sub-district. Similarly, in Labuhan Bajo hamlet,
students attended the schools in Kabir (2 junior high schools (SMP) and one senior high
school (SMA)).
The highest education level Marisa and Kayang was was primary school level. Soon
after a girl graduated from the primary school, her parents generally married her off and
she became part of the local labour force. During my visit to Marisa Village, I saw many
young girls carrying babies in Marisa village that I thought were sisters or brothers.
Instead, they were their children. When boys graduated from primary school, they
helped their parents in the village or worked in Malaysia. In Kabir village and Baranusa
sub-district, the average education level achieved was junior high school.
Figure 5.1: Human assets Photo A: The only school in Kayang. Photo B: Tide and moon cycles are the most important knowledge for fishers in this area for fishing or going anywhere with a dugout canoe.

Chapter 5. The livelihoods on Pantar Island _____________________________________________________________________________
162
Knowledge and skills related to livelihood activities
Since historical period, people from Alor-Pantar have been recognised for their
participation in maritime oriented activities of fishing, sailing and trading (Gomang
1993). The ex-temukung in Baranusa described the gear used by coastal people,
including bows and arrows, bamboo fish traps, a trappings stone where the remnant of a
fishing weir still could be seen, which were known long before outsiders came (personal
communication, Amir Syarifuddin, ex-temukung, 2008). Young men worked as ship
crew which was called me buah (go sailing) (Gomang 1993).
Men and women were involved in maritime-related activities in different ways. Table
5.2 shows the detailed marine and non-marine activities (such as agriculture and
handwoven textiles), fishing gear used, marine products collected by gender. This
information was gathered through focus group discussions and observations.
Hand-line and hook fishing methods were the most favoured fishing methods in this area
(Table 5.2). Women also used this method to catch demersal fish. These women were
mostly old women and widows in Labuhan Bajau. The old women in Labuhan Bajo
collected worm as baits in the muddy area and fished by paddling canoes or from the
shore. Women in Marisa also fished from canoes. Only men used hand-lines and hooks
or lures from a motor-boat. However, no outboard engine was less than six horsepower
(hp) in Labuhan Bajo (see Section 5.2.3 on physical assets). Men also had the knowledge
and skill to use spear guns, except Bajau people in Labuhan Bajau who did not use this
method anymore. Unlike most people in Blangmerang who used cast nets, only three
people in Kayang and two people in Marisa used cast nets (Section 5.2.3). One person in
Kayang bought a set of cast nets when he returned from Malaysia in 2010. The
inspiration to use cast nets was driven by the use of nets for fencing off seaweed from
fish predators. Lempara (mid-water trawlers) are only used in Labuhan Bajo and
Blangmerang. Bajau people and one person from Blangmerang used kite fishing to catch
tuna.

Chapter 5. The livelihoods on Pantar Island _____________________________________________________________________________
163
Table 5.2: Maritime-related activities segregated by gender in the four villages on Pantar Island
Labuhan Bajo
Blangmerang Kayang Marisa
Livelihood activities
Men
Wom
en
Men
Wom
en
Men
Wom
en
Men
Wom
en
By methods Hand-line and hook with paddle canoe Y Y Y Y Y Y Hand-line and hook with outrigger canoe (outboard machine <6hp)
- Y Y Y
Hand-line and hook with powered motor-boat (outboard machine > 6hp)
Y Y Y Y
Speargun - - Y Y Y Cast net with outrigger canoe (outboard machine <6hp)
Y Y Y
Cast net with powered motor-boat Y Y Y - - Mini-trawl (lempara) Y Y - - - - Kite fishing with a powered motor-boat with engine < 25 hp)
Y Y
Net shark (drift net) Y Y Fish trap (ker) Y Y Y Free-dive Y Y Y Y Seaweed farming Y Y Y Y Y Y Y Y Collecting shells Y Y Y Y Y Dynamite Y Y
By Products Demersal fish Y Y Y Y Y Y
Pelagic fish Y Y Y Y Edible sea urchin Y
Shells (turban shells, mud creepers, oysters, clams, cockles, spider conch)
Y Y Y Y
Spider conch Y Y Y Bivalves (mussels, anadara sp) Y Y Y Y
Collecting sea cucumber Y Y Y Y Y Y Y Collecting top shells (Tectus niloticus) Y Y Y Y Y Y
Sun-dried fish Y Y Y Y Y Salted fish Y Y Y Y Y Y
Trading marine products Sun-dried fish trade Y Y Y Y Y Y Y
Fresh fish trade Y Y Y Y Y Y Y Salted fish trade Y Y Y
Seaweed local buyers Y Y Y Y Y Y Y
Other activities Agricultural farming (cassava, corn, bananas) Y Y Y Y Y Y
Collect drumstick leaves Moringa oleifera (local name: marungga, Indonesian: Kelor)
Y Y Y Y
Tamarind-related work Y Y Y Y Handwoven textiles Y Y
Y= yes, it shows the actor. Source: focus group discussions and observation
Chapter 5. The livelihoods on Pantar Island _____________________________________________________________________________
164
A few men were involved in shell collection but they did not consider themselves as
shell collectors. However, men were more active in collecting spider conches (Lambis
spp). During my visit in Lapang Island, a pile of spider conch shells was found in
Lapang Island. Men free-dived to collect top shells at basal diameters between six and
ten centimetres. Two people in Marisa, one person in Kayang and less than five people
in Blangmerang were well-known as top shell divers.
Sea cucumbers were collected by men using spears and underwater torches around
Lapang, Rusa and Kambing Islands. In Labuhan Bajo hamlet, the fishers used gear
called ladong, worked as a spear, which is four metres in length, with a 2 kilogram metal
iron on the bottom and a 15 centimetre hook. With this ladong, they only needed paddle
outrigger canoes and masks. The women were involved in post-collection activities, such
as removing the internal organs, boiling and sun-drying them. The women also collected
sea cucumber if they found it when they fished or farmed seaweed and then they
processed it.
Women caught demersal fish in inshore waters by hand-line fishing methods (Table 5.2).
Women were less involved in catching pelagic fish. The favourite fishing methods for
women were fish trapping (using ker) to catch fish near reefs and collecting seashells
(Figure 5.2). The fish trapping method works by positioning the ker in front of the rock
and then the fisherwomen push the small fish into the trap by a stick or their hands.

Chapter 5. The livelihoods on Pantar Island _____________________________________________________________________________
165
Figure 5.2: Ker, the favoured fishing method by women Cone shell (Photo B) and eel (Photo C) are examples of marine produce collected using ker by women in the intertidal waters. Photographs B and C were taken by Prof. Anthony Cunningham in Dili.
Women collected shells, such as turban shells, top shells, mud creepers, oysters, clams,
cockles, sea cucumber (less than 10cm length), bivalves and top shells in the intertidal
waters and mangrove areas (Figure 5.3). Only Bajau women collected sea urchins
(Trineustes gratilla) for food from the intertidal areas in front of their villages. Seaweed
was farmed by both men and women. The activities involved in farming seaweed are
discussed in detail in Chapter 6.

Chapter 5. The livelihoods on Pantar Island _____________________________________________________________________________
166
Figure 5.3: Women collect shells for household consumption in mangrove habitat in Kangge Island
Only men undertook dynamite fishing. During group discussions in Blangmerang and
Marisa, the participants identified six people who used dynamite to catch pelagic fish,
such as belo-belo (Round scad/Decapterus species) with cast nets to collect stunned fish
in Marisa and seven people in Blangmerang. In Marisa, the focus group participants
talked about fishers from a village in Lembata Island who also used this method in the
Alor Strait, west of Kangge Island.
Women were the main fish traders at the village level, especially Bajau women and
Blangmerang. When they traded the fish to Kalabahi in Alor or Atambua in Timor Island,
men act as trader. There had been a change of women’s role in Bajau community, from
only doing domestic work to being involved more in income-based work, such as fish
trading (papalele). During the focus group discussions, women revealed that the reasons
for this role change were that the earnings from the fish catch were not certain and the
men were rarely at home due to fishing activities. Women, on the other hand, always
stayed at home and had to feed the whole family. The women bought fish from
fishermen. The fish were then processed and brought to market.

Chapter 5. The livelihoods on Pantar Island _____________________________________________________________________________
167
In addition to marine-related livelihood activities, people also had knowledge and skills
for other livelihood activities. People in Blangmerang, Kayang and Marisa villages
farmed cassava, corn and beans during the rainy season. Only the Bajau people entirely
depended on marine resources. The women had knowledge in processing tamarind fruit
(Tamarindus indica) to be sold to traders from Makassar. The women in Baranusa and
Kayang also had the skill to produce handwoven textiles.
Knowledge related to marine resource locations
During the focus group discussions with the fishermen and fisherwomen in the
respective villages, the extent of the locations fished in waters around Pantar Island were
shown in Figure 5.4. The Bajau people caught fish in the waters in front of their village,
and travelled the greates distances to fish around Lapang Island, the reefs on the north of
Lapang Island, north of Pantar Island and around Rusa Island. The Bajau people built
temporary houses if the fishing grounds were far from Labuhan Bajo hamlet. For
example, seven Bajau families had their temporary houses on the reef to the north of
Lapang Island where the area was about the size of soccer field according to D, a fisher;
and five Bajau families had temporary houses on Lapang Island.

Chapter 5. The livelihoods on Pantar Island _____________________________________________________________________________
168
Figure 5.4: Fishing spots around Pantar Island Notes: Name of fishing spots from focus group discussions: 1. Nuha lolong; 2. Wato tenahang peng; 3. Liang awo; 4. Tambubur; 5. Sarang burung; 6. Tanjungpasir; 7. Ane gantung; 8. Kabinge; 9. Watu balu; 10. Uba sigi; 11. Uma sigi; 12. Jomblewang; 13. Tuwaonong; 14. Anablahang; 15. Kalabahi Tide; 16. Wailing; 17. Watu gunting; 18. Ambiang lolong; 19. Tana tawa; 20. Parlewa; 21. Tuwak tide; 22. Wati bawa; 23. Ikuwitiuling; 24. Watang; 25. Kolitawang; 26. Tanjung soyang; 27. Watodang; 28. Ane anang; 29. Berak peng and berak; 30. Koliheng; 31. Wolu; 32. Topobali; 33. Liangburang; 34. Wato manuk; 35. Wakspati; 36. Wato maru; 37. Ane miteng; 38. Kabaku; 39. Liang lodong; 40. Larang lodu; 41. Pei; 42. Watang nebo; 43. Bita namangleing; 44. Manapa blahan; 45. Nubi blewang; 46. Kangge harbour; 47. Tongke; 48. Hari lolong; 49. Kayang harbour; 50. Patra; 51. Io; 52. Lempara; 53. Lemur blewang; 54. Tongke; 55. Nubi bajo; 56. Raha wutung; 57. Ombelahang; 58. Karang ujung; 59. Naka panjang; 60. Naka blokor; 61. Wallo ; 62. Batang Island; 63. Nuha wutung; 64. Blangmerang coast; 65. Kura Island; 66. Ketapang; 67. Baranusa bay; 68. Rumpon; 69. Kabir harbour; 70. Labuhan bajo coast; 71. Haring kolam susu; 72. Coast of Pandai; 73. Coast of North Pantar; 74. North of Pantar.
Fishers from Labuhan Bajo Fishers from Blangmerang Fishers from Kayang
Fishers from Marisa
Demersal Pelagic Fish Both pelagic and demersal

Chapter 5. The livelihoods on Pantar Island _____________________________________________________________________________
169
The people from Blangmerang caught fish in the waters in front of their village, around
Batang and Lapang Islands, and Nuhawutung at the Cape to the north of Blangmerang
villages. People from Kayang and Marisa caught fish surround Rusa, Kambing and
Kangge Islands and Tanjung Soyang at the Cape to the south west of Pantar Island.
Aside from people in the four villages, fishermen from the four study villages also fished
in this area (Figure 5.4). Fishermen from Air Mama village, neighboring village of Kabir
Village, captured pelagic fish to the north of Pantar and near Nuhawutung. Fishers from
Lembata, Ternate and Pura Islands, and Bima also fished in Lapang and Rusa Islands.
Fishermen from Tanah Haur, Lembata Island, captured pelagic fish to the north west of
Kangge Island.
The fishers named the fishing grounds based on the landmarks and features in that area,
activities and incidents that had taken place in various places. The toponymy of several
places around Kayang village is an example of local knowledge of places linked to
fishing grounds: wattodang (a stepladder stone), ane anang (small area of white sand),
tua pittu (seven palm trees), berak peng (a big tree) and wattomanuk (a bird stone).
Several places on Kambing Island were kelabeng awa (the nest of eagle), pellang hari
(tree), watto bawa (a stone of big drum), ikuwitiulung (someone caught a goat here), and
watang (a resting place). Toponymy was also based on the people’s activities in the past
such as pei on Kangge Island (a place to sleep or rest during fishing) and nubibajo on
Lapang Island (a reef where the Bajau people fished).
Ability to work
Ability to work is represented by status of health care facilities and whether people had
access to adequate food (quality and quantity). The villagers obtained food through
farming (crops such as corn as main staple food) or by bartering or purchasing food.
Corn was farmed and harvested in the wet season to be used as staple food by villagers,
except Bajo people who do not farm. The harvests were stored above the cooking fire in
the kitchen. The smoke from the fire preserved the corn before it was used until next
harvest. If the stock was not enough for a year, the villagers borrowed from their

Chapter 5. The livelihoods on Pantar Island _____________________________________________________________________________
170
neighbours or bought more in the market. Vegetables were rarely grown in the villages,
apart from marungga (drumstick (Moringa oleifera)) leaves. Adult women (and
sometimes children) collected and stir-fried the leaves. Some fruits like banana were also
important foods for breakfasts and in the afternoons. Besides local production, the
communities in Blangmerang, Kayang and Marisa villages obtained foods through trade
with the marine products. Bajo people obtained their staple food (rice) only from trade in
fish. The local trading system meant this area had less food shortages unless there was
an extreme climate event which prevented traders from other islands from visiting Pantar
Island. For example, in November 2009, people in Kayang and Marisa villages had a
hard time in terms of food availability as traders did not visit this area because of bad
weather. The economic importance of local trade in food has been known for a long time
(Fox 2011) with people trading to Flores, Timor and other small islands (see also the
discussion in Chapter 6). Even if is a harvest failure in Pantar, corn still can be found in
the market. Corn from other places in the province can be distributed in the market
considering the production of corn in the province was in surplus from 2006 to 2011
(BPS NTT 2011).
Rice was brought by Alor or Makassar traders to the village markets on Pantar Island.
Baranusa also had rice fields (for black rice and white rice) but the production was only
enough for subsistent consumption. The price of black rice was higher as the people
believed black rice provided better nutrients. The villagers mixed the black rice with
white rice. Rice was sometimes mixed with ground corn meal. The traders also brought
vegetables, betel nut, rice, sugar, flour, fruit and kitchen equipment to sell at local
markets.
The health facilities were very limited in this area and there was no health facility in
Marisa village (Table 5.1). Kabir, Baranusa and Kayang had one health clinic with
midwives, while Marisa had no health staff. If villagers suffered from a serious disease
they had to go to Kalabahi. In addition, this area lacked adequate fresh water and
sanitation (as discussed in Chapter 3, Section 3.2.5). There was no date on the health
condition of the local population available however, people in FGD stated the main

Chapter 5. The livelihoods on Pantar Island _____________________________________________________________________________
171
diseases found in this area were malaria and diseases related to sanitation and lack of
clean water. The health problems were identified during focus group discussions and
were verified by a health staff member in Kayang village (personal communication
2009).
5.2.2 Natural Assets
The most important natural assets of the coastal communities were marine resources
although some villagers in Blangmerang, Kayang and Marisa villages were able to
access land to farm corn and beans during the wet season and access to coconut trees.
Natural assets include of the status of habitats (coral reefs, mangrove and seagrass). The
status of marine resources involves the assessment of resources caught and fish length to
identify if present exploitation threatens the sustainability of the stocks. The status of
natural assets affects the livelihood strategy.
Habitat status
Habitats are particularly important to maintaining the integrity of marine resources (Noss
et al. 1997). There are three key main habitats in marine resources: mangrove forest,
seagrass area, and coral reefs. The status of mangrove is indicated by the diversity and
density while seagrass is the coverage area. A good status of coral reefs is indicated by
hard coral cover.
Mangroves
Mangrove density in Pantar was mostly between medium to low density, except in one
certain area in Baranusa Bay. Mangrove areas around Kangge Island were mostly
medium density with a total area of 12.97 hectares (Figure 5.5). On Lapang Island, the
density of mangrove trees was low with a total area of 1.87 hectares (Bakorsurtanal
2007). Along the coast of Baranusa Bay, the mangrove trees grew in high density in
certain areas and also medium and low densities in one location. The total mangrove
area at Baranusa Bay was 306.16 hectares (Bakorsurtanal 2007). Mangrove areas along
the coast on the north of Pantar covered 27.05 hectares with medium and low density
(Bakorsurtanal 2007). The low density of the mangrove area along Kabir coast to north

Chapter 5. The livelihoods on Pantar Island _____________________________________________________________________________
172
Pantar reported in the literature were supported by the participants of focus group
discussions in Labuhan Bajo hamlet. The late Morikadese Rea reported that mangrove
trees were denser when he first arrived in Kabir (personal communication 2009). One
reason for this was the logging of the trees for housing and boat construction.
Figure 5.5: Location of mangrove, coral reefs and seagrass around Pantar Island Source: Bakorsurtanal 2007
On Kangge Island, the mangroves trees found were Rhizophora spp, Brugueira
gymnorrhiza and Avicennia sp (Ninef el at. 2005). On Lapang Island, mangroves were
only found in the east of the island and the most common species found were
Rhizophora species. Ninef et al. (2005) regarded the density of mangroves around
Kangge and Lapang Islands and the recruitment of young mangroves as low.
WWF Indonesia (2010) found seven species of mangrove in the Baranusa sub-district.
These were Rhizophora stylosa, Rhizophora apiculata, Sonneratia alba, Bruguiera
gymnorrhiza, Lumnitzera racemosa Avicennia marina and Phemphis acidula. They

Chapter 5. The livelihoods on Pantar Island _____________________________________________________________________________
173
found the Phemphis acidula (sentigi in local language) was almost extinct due to
massive collection for ornamental trees which were sold to a trader from Kalabahi
(Figure 5.6). They also found logging of Bruguiera gymnorrhiza for firewood and house
stilts.
Figure 5.6: Valuable sentigi, Phemphis acidula
Photo A: A sentigi tree in Lapang Island in 2008. Photo B: Sentigi trees are sold in an exhibition in Kupang 2007. Photo B was taken by Prof. Anthony Cunningham. Seagrass
The coverage of seagrass beds in this area had been decreasing since it was mapped in
2007. The total area of seagrass beds around Pantar Island was 1,172.1 hectares based on
a remote sensing map (Bakorsurtanal 2007). Ground-truthing by WWF Indonesia in
2010 found the coverage of seagrass beds in Lapang Island was only 58.8% from the
total area mapped in 2007. Seagrass beds occurred along the coast of Pantar Island from
Tanjung Soyang-Kayang-Baranusa to the north of Pantar until the east of Pantar (in front
of Pura Island) (Figure 5.5). A large seagrass bed grew at the coast of Baranusa Bay and
north of Pantar. Seagrass also grew around Kangge and Lapang Islands. The participants
of the focus group discussions showed the location of seagrass on the map. The
participants reported that seagrass beds were found in Blangmerang Bay, Kabir Bay and
Lapang Island. Seagrass in Blangmerang Bay included Syringodium isoetifolium,
Halophila ovalis, Cymodocea serrulata and Halodule uninervis, all of which were part
of the dugong diet and Enhalus acoroides (Fudge 2007). Fudge (2007) also described
four types of seagrass on Lapang Island: Halophila ovalis, Thallasia hemprichii,
Syringodium isoetifolium, and Cymodocea serrulata. The most common species on
Lapang Island was Cymodocea serrulata (Ninef et al. 2005).

Chapter 5. The livelihoods on Pantar Island _____________________________________________________________________________
174
Coral reefs
Coral reefs were found around all the islands (Figure 5.5). The most concentrated reefs
were on Lapang Island, especially on the north side of the island (Figure 5.5). The
remote sensing map showed a concentration of coral reefs around Rusa Island, along the
coast of Wolu, south of Kangge Island, Baranusa Bay, and along the coast of Kabir to
the north of Pantar Island (Figure 5.5). A high concentration of coral reefs was also
found around Rusa (Figure 5.7) and to the south-east of Kangge Island (Bakorsurtanal
2007).
Hard coral cover is one indicator of coral habitat as hard coral helps in establishing a
healthy coral reef ecosystem (Burkepile and Hay 2008; Glynn and Enoch 2011). WWF
Indonesia (2009) found the hard coral coverage was in average condition around Pantar
Island. The hard coral reef in the worst condition was around Batang Island, with
13.60% out of the total coverage in poor condition (WWF Indonesia 2009). Rubble was
mostly found on the sea bottom around Batang Island. North Pantar, Beang onong and
Lapang Island had average hard coral cover of 40.80%, 37.10% and 27.30% coverage,
respectively. Based on the mapping of reefs, it was considered overfishing and
destructive fishing were high threats around Pantar Island (Burke et al. 2012).
Figure 5.7: Coral reefs at Rusa and Kambing Islands Photo A: Coral reefs at Kambing Island. Photo B: Coral reefs at Rusa Island. Photographs taken by WWF Indonesia/Yoga in May 2011.

Chapter 5. The livelihoods on Pantar Island _____________________________________________________________________________
175
Status of marine resources
This section discusses the status of marine resources by first presenting the data on the
most common fish caught in every village and then the length of fish compared with the
length at first maturity (Lm) from the literature. From December 2009 to May 2010, 99
folk categories of fish based on local names were recorded and approximately 21,000 of
demersal and pelagic fish as well as 203 trepang and 254 top shells were measured.
Only 69 folk categories of fish were processed into statistic data as the rest was recorded
less than 10 fish. The record showed the diversity of fish harvested and preferences for
certain species among the villages different favoured fish that they mostly caught
(Appendix C).
The majority of landed fish in Labuhan Bajo and Blangmerang were pelagic fish. Most
of the recorded fish in Labuhan Bajo hamlet were ikan mane (long toms/Tylosurus
crocodilus). This was followed by tongkol or ikan turinga (Eastern little tuna or
Euthynnus affinis), belo-belo (round scad (Decapterus sp)) and Bangkumis (yellowfin
tuna (Thunnus albacares)). Lember (halfbeaks (Hyporhamphus dussumieri)) was
recorded the least. However, I observed halfbeaks was caught in the thousands at one
time over my field visit period. This gap might have been because the fish were not
recorded when the traders were busy taking the fish from the boat and processing it.
Another reason might be that the fish were processed by the owner of the boat and
transported to Atapupu, so the recorders did not realise that this fish had been landed.
Similarly, the fishers in Blangmerang caught pelagic fish with the most recorded being
melus (big-eye scad (Selar chrumenopthalmus)). Belo-belo (round scad (Decapterus sp))
was recorded the second most frequently caught fish and serea (yellowfin tuna (Thunnus
albacares)) was recorded as the third most frequently caught fish. In Blangmerang,
kakak tua (blue barred parrot fish) and reef fish were also considered among the five
most commonly caught fish.
In Kayang and Marisa villages, the fishers mostly caught reef fish. The most commonly
caught fish was kerappung (emperor fish (Lethrinus spp)) and wehung (coral trout
(Cephalopholis spp)), respectively (Figure 5.8C). The fishers in Kayang and Marisa only

Chapter 5. The livelihoods on Pantar Island _____________________________________________________________________________
176
used hand-line and hook fishing methods, with paddled canoes, sometimes with
outboard engines (less than 6 hp).
Among the top fish caught, the fishers considered Tylosurus crocodilus, Decapterus sp,
Hyporhamphus dussumieri and Euthynnus affinis were the most pelagic fish caught.
Meanwhile, the reef fish were emperor fish (Lethrinus spp)), coral trout (Cephalopholis
spp) (Figure 5.8), red snapper and parrot fish. Therefore, these eight fish were selected to
assess the fish stock based on the length frequency distribution. The data were compared
with the length at first maturity from the literature (Table 5.3).
Figure 5.8: Measurement of marine product lengths Photo A: Yellowfin tuna. Photo B: Tectus niloticus is measured. Photo C: The most commonly caught fish by fishers from Kayang and Marisa villages.

Chapter 5. The livelihoods on Pantar Island _____________________________________________________________________________
177
Table 5.3: Frequency distribution of length of the important fish captured considered by fishers
Length in catch (SL) cm Local name Species mean mode
Percentage of Fish caught below Lm
Lm (maturity) cm
Area of reference
References
Mane (Alorese)/ Timboloah (Sama)
Tylosurus crocodilus
40.97 76 75% 60 India Ocean Lock 1986 in Froese and
Binohlan 2000 Belo-belo/ Kowi (Alorese)/ Gagadeh (Sama)
Decapterus spp 16.54+ 2.6 16,8 13%
D.macrosoma=14.3 D. ruselli=14.9
North Java Sea
Prihartini et al. 2007
Lember (Alorese) / Tempae (Sama)
Hyporhamphus sp 18.72+2.1 20 -
Not available Valenciennes, 1847 (fishbase.org) Common length 19 cm
Serea (Alorese) Turinga (Sama)
Euthynnus affinis 23+7.3 20 12%
48 (FL) In India 43 (Pillai and Menon 2000)
FAO8
Kerappung (Alorese)/ Kiapu (Sama)
Lethrinus spp
25.23+5.2 24
100% 89%
7%
L. nebulosus=46 L.miniatus=31 L. borbocus=? L.lentjan= 18
Asia Pacific L.Lentjan in New Caledonia
www.fishbase.org
Kalawok (Alorese)/ Mogoh (Sama)
- Scarus ghobban - Scarus rubroviolaceus
21.2+5.1 20 95% Scarus ghobban=36 Wakatobi www.fishbase.org
Wehung (Alorese)/ Kiapu merah (Sama) Dayah Taringa in (Sama) (Plectropomus sp)
Cephalopholis spp
33.36+7.9 36 14% 8%
24%
Cephalopholis miniata=26 C. urodeta=17cm Plectropomus leopardus= 30
www.fishbase.org
Kamea (Alorese)/ Ha Ahang (Sama)
Lutjanus spp
25.49+7.8 23 98%
Lutjanus malabaricus Male 47 and female 60 cm (FL) Lutjanus argentimaculatus=55 (FL)
Asia Pacific www.fishbase.org
Note: mean and mode were calculated refer to Appendix D
8 http://www.fao.org/fishery/species/3294/en accessed on 11 May 2011

Chapter 5. The livelihoods on Pantar Island _____________________________________________________________________________
178
The most frequent length recorded of ikan mane (in Alorese) or timboloah (in Sama) or
long toms (Tylosurus crocodilus) occurred at 76 centimetres (Table 5.3 and Appendix D).
The common size in Indonesia is 60 centimetres (Subani 2002). 75% of ikan mane or
timboloah or long toms were caught below the length at first maturity (Appendix D).
The most likely species under the belo-belo category was Decapterus macrosoma and D.
ruselli. Belo-belo (tempae in Sama) (round scad (Decapterus spp)) were caught almost
80% above the length at first maturity and the most frequent length occurred at 16.8
centimetres (Appendix D). Lember (Alorese) or tempae (Sama) is considered as
Hyporhamphus sp. It is related to long toms (order Beloniformes) (Collette 2004). This
fish were caught thousands based on my observation. One owner of a mid-water trawler
said that they caught halfbeaks of 5000 fish in one trip in 2008. The crew of the mid-
water trawler in Blangmerang said they caught 7500 fish on their first trip. However, this
fish was the least recorded, at 51 fish out of 21,000 fish recorded (Appendix D). Due to
the abundant number of this fish during the year and as agreed by the fishers and local
traders, this fish was considered to be an important fish. There was no available
information on length at first maturity, however the most common length caught was 19
centimetres (www.fishbase.org). Tongkol or ikan turinga (Eastern little tuna (Euthynnus
affinis)) were caught almost 90% below the length at first maturity (Appendix D). The
most common catch size length was 20 centimetres which was below the length of
maturity (Table 5.3).
The fish called kerappung (Alorese) or kiapu (Bajau) are snub-nose emperor (Lethrinus
borbonicus), red-throat emperor (L. miniatus), red-spot emperor (L. lentjan) and
spangled emperor (L. nebulosus). This identification was conducted by the fishers by
looking at the coral reef book (Lieske and Myers 2001). The fishers in Kayang and
Marisa considered L. miniata and L. lentjan were the most caught species. The length at
first maturity of L. lentjan was 18 centimetres which meant only 8% of the fish were
recorded below the length at first maturity. If the standard was L. miniata, then almost
85% of the fish were below the first maturity length (Appendix D) and the most frequent
length occurred at 24 centimetres.

Chapter 5. The livelihoods on Pantar Island _____________________________________________________________________________
179
The kalawok (in Alorese) or mogoh (in Sama) (blue barred parrot fish (Scarus ghobban))
or ember parrotfish (Scarus rubroviolaceus) were caught 90% below the length at first
maturity (Appendix D) and the most frequent length occurred at 20 centimetres (Table
5.3).
The fish known as wehung (Alorese) or kiapu merah (Sama) are Cephalopholis miniata,
C. urodeta and Plectropomus leopardus. Since there were several fish that had the same
name, I asked about the most fish caught which was C. miniata based on the discussion
with fishers in Kayang and Marisa. The length at first maturity of Cephalopholis miniata
was 26 centimetres. The record showed that 14.5% of fish recorded were below the first
maturity. If the first maturity length of C. urodeta and Plectropomus leopardus were
used, then 8.5% and 24%, respectively, of the fish were caught below the length of first
maturity (Appendix D). The most frequent length of fish caught was at 36 centimetres
(Table 5.3). The fish called kamea (Alor) or ha ahang (Sama) is Lutjanus malabaricus
and L. argentimaculatus. Almost 99% of the fish caught were below the length at first
maturity (Appendix D) and the most frequent length was 23 centimetres (Table 5.3).
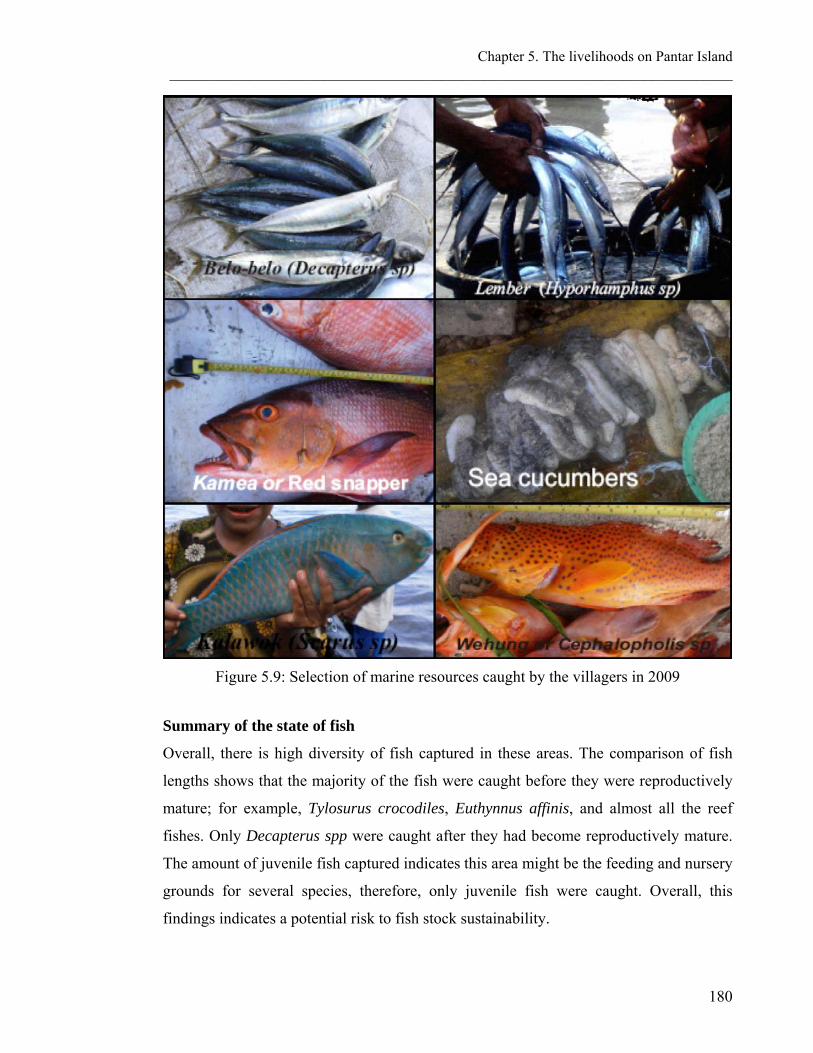
Chapter 5. The livelihoods on Pantar Island _____________________________________________________________________________
180
Figure 5.9: Selection of marine resources caught by the villagers in 2009 Summary of the state of fish
Overall, there is high diversity of fish captured in these areas. The comparison of fish
lengths shows that the majority of the fish were caught before they were reproductively
mature; for example, Tylosurus crocodiles, Euthynnus affinis, and almost all the reef
fishes. Only Decapterus spp were caught after they had become reproductively mature.
The amount of juvenile fish captured indicates this area might be the feeding and nursery
grounds for several species, therefore, only juvenile fish were caught. Overall, this
findings indicates a potential risk to fish stock sustainability.

Chapter 5. The livelihoods on Pantar Island _____________________________________________________________________________
181
Seaweed, top shells and sea cucumbers
A large proportion of households living near the coast in Pantar Island engage in
seaweed farming. People in Labuhan Bajau farmed seaweed on the Kabir shoreline,
Lapang Island and Kangge Island. Baranusa people farmed the seaweed on Lapang
Island. The Blangmerang village leader reported that 183 households from Blangmerang,
excluding Bajau people, cultivated seaweed on Lapang Island in 2008. Kayang people
farmed seaweed along the coast in front of their villages and in Wolu village. Marisa
villagers farmed seaweed surrounding Kangge Island.
Other important products from this area were bia or lola (top shells (Tectus niloticus))
and sea cucumbers. They were not the main source of livelihoods for villagers but these
two products provided a significant source of cash income to some households. From
December 2009 to May 2010, 254 lola were recorded mostly from Blangmerang village.
The mean diameter the caught lola was 8.76+1.57. Purwati (1996) explained that lola
achieves its reproductive maturity at a basal shell diameter of 5.5-6 centimetres, its
maximum base at diameter 16 centimetres and the growth rate is 25-30 millimetres per
year. This shows the lola recorded were still beyond the first maturity (Figure 5.8B)
although the women and children sometimes collected juvenile lola which they found
along the intertidal waters in front of their villages and this catch might not be recorded.
In Kayang, for example, M collected three top shells at 15 centimetres in height and 10
centimetres at basal diameter. By comparison, in Baranusa and Kabir, most of the top
shells were just 7 centimetres in height and 5 centimetres in diameter. Women in Kayang
village collected top shells with basal diameters less than 5 centimetres in the waters in
front of their village during low tide.
5.2.3 Physical Assets
There are two types of physical assets: infrastructure and producer goods. Infrastructure
consists of public goods such as transportation, electricity, water supply and sanitation.
The electricity, water supply and sanitation conditions of the study sites were discussed
in Chapter 3. Meanwhile, producer goods are equipment that are commonly privately

Chapter 5. The livelihoods on Pantar Island _____________________________________________________________________________
182
owned by a household to produce or catch fish in supporting their livelihoods, catch
storage and ice supplies, kiosk and market buildings, and mobile phones.
Transportation
Sea transport is very important in this area. Wooden boats (kapal kayu) transport people
and products to the markets and the nearest city. There was one wooden boat to transport
people from Marisa village which always stopped over in Kayang village. Kayang
village also had one wooden boat and three smaller boats (15 hp) to transport people.
There were four wooden boats in Baranusa: two were used to transport to Kalabahi and
two smaller boats sailed to Kabir. A Pelni (a government-owned ship) that sailed to
Kalabahi, Lembata and Kupang, stopped by in Baranusa seaport once every two weeks.
Since Blangmerang is located near Baranusa seaport, the Blangmerang people used the
wooden boats from Baranusa. In Kabir, two wooden boats sailed from Kabir to Kalabahi
almost every day and sailed to Weiring on market day on Thursday. The schedule of
these wooden boats depended on the market day (Figure 5.10). For example, wooden
boats from Kabir, Baranusa and Marisa had a trip to Weiriang, Lembata Island every
Thursday. Wooden boats from Baranusa to Kalabahi, Kabir to Kalabahi, Lamallu to
Kalabahi and Bakalang to Kalabahi sailed everyday.
Figure 5.10: Network of local transport in Pantar Island
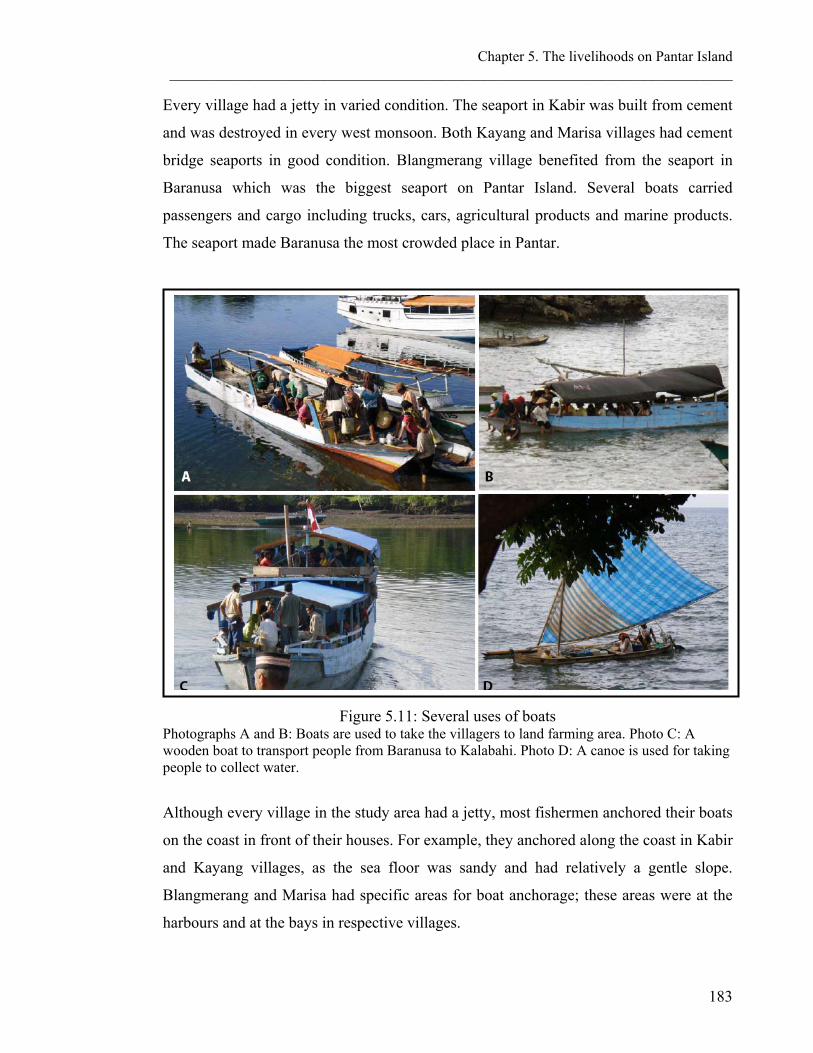
Chapter 5. The livelihoods on Pantar Island _____________________________________________________________________________
183
Every village had a jetty in varied condition. The seaport in Kabir was built from cement
and was destroyed in every west monsoon. Both Kayang and Marisa villages had cement
bridge seaports in good condition. Blangmerang village benefited from the seaport in
Baranusa which was the biggest seaport on Pantar Island. Several boats carried
passengers and cargo including trucks, cars, agricultural products and marine products.
The seaport made Baranusa the most crowded place in Pantar.
Figure 5.11: Several uses of boats Photographs A and B: Boats are used to take the villagers to land farming area. Photo C: A wooden boat to transport people from Baranusa to Kalabahi. Photo D: A canoe is used for taking people to collect water.
Although every village in the study area had a jetty, most fishermen anchored their boats
on the coast in front of their houses. For example, they anchored along the coast in Kabir
and Kayang villages, as the sea floor was sandy and had relatively a gentle slope.
Blangmerang and Marisa had specific areas for boat anchorage; these areas were at the
harbours and at the bays in respective villages.

Chapter 5. The livelihoods on Pantar Island _____________________________________________________________________________
184
In addition to the ocean transportation, people used motorbikes in this area. Women
traders, for example, mostly used motorbikes to transport their products. They rented the
motorbike (ojeg) to go back and forth to the market. For example, a trader from Labuhan
Bajo in Kabir rented a motorbike to transport fish to Bakalang and a Baranusa trader
used a motorbike to transport fish for sale at the Wolu market. Having good access to
transportation was important for women traders as it enabled them to deliver the fish in
time to a wider market and reduced the risks of fish decaying.
Fishing equipment
Fishing gear is the main equipment used by coastal communities. As discussed in the
section on human capital, the main pieces of fishing equipment used in all villages were
hand-lines and hooks. The fishermen also used cast nets. Two cast nets were available in
Marisa, three people had cast nets in Kayang, five sets of cast nets were in Blangmerang,
and the Labuhan Bajo community owned 27 cast nets for pelagic fish and five nets for
demersal fish (Table 5.4). Other fishermen who did not have the nets could borrow nets
from the owners when they needed them. The borrowers had to give a certain quantity of
fish to the owners of the cast nets although there was no fixed percentage.
Table 5.4: Fishing equipment in the four villages
Labuhan Bajo Blangmerang Kayang Marisa Hand-lines and hooks All fishers Cast nets 32 5 3 2 Mid-water trawl 4 1 0 0 Kite fishing 60 1 0 0 Dynamite fishing 0 7 0 6 FAD 1 1 0 0 Paddled canoes All fishing households 57 sailed canoes Boats with engines 6 hp few few 1 120 Boats length at 7-10m (< 20 hp engine)
20 8 0 4
Boats length at 10-12m (20-25 hp engine)
78 0 0 0
Boats with engines 25 hp
0 5 0 1
Boats with engines 30 hp
6 0 0 1
Boats with engines > 115 hp
- - - 3

Chapter 5. The livelihoods on Pantar Island _____________________________________________________________________________
185
There was one mid-water trawling boat used by the fishermen in Blangmerang and four
mid-water trawling boats in Labuhan Bajo hamlet. However, of the four mid-water
trawling boats in Labuhan Bajo hamlet, only one mid-water trawl boat operated in 2009
and two mid-water trawl boats operated in early 2010.
Figure 5.12: Boats and fishing mehods Photo A: A bajau man shows how to use kite fishing. Photo B: Ready to go fishing. Photo C: A canoe with an outboard engine. Photo D: A lempara from Blangmerang departing on a fishing trip. One main type of fishing equipment in Labuhan Bajo hamlet was kite-fishing gear for
tuna (Figure 5.12 A). Based on the Labuhan Bajo hamlet leader’s record, there were 60
boats with engine 20-25 hp using kite-fishing in Labuhan Bajo hamlet (Table 5.4). They
used to paddle canoes before boats were equipped with engines in 2006.
Fish Aggregating Devices (FAD), manmade floating objects to attract pelagic fish, could
be found in this area. The FAD is a permanent, semi-permanent or temporary structure
made from any material and used to lure fish (FAO 2011). In Pantar, a FAD was made
from bamboo, woods or coconut leaves, and attached to the sea bottom using a
Chapter 5. The livelihoods on Pantar Island _____________________________________________________________________________
186
polypropylene rope with a concrete block as an anchor on the ground. On the surface, a
battery operated torch sometimes directs the fishers to them and they are there as a safety
measure to avoid collisions. Other FADs only have coconut leaves as a sign. Once, one
fisher asked the boat driver to replace the battery of the torch when I sailed from
Baranusa to Kabir in the evening. One FAD was in front of Kabir village, and one was in
Baranusa village in early 2010. The fishermen said there used to be four FADs in
Baranusa and Kabir. These broke apart as the ropes holding them could not withstand
the strong winds and waves.
Another piece of fishing equipment used in the four villages was wooden goggles, which
were carved made from local tree species in their villages. Fishermen in Blangmerang,
Kayang and Marisa used spear guns or ladong to catch demersal fish or trepang (the
Bajau people didn’t use spears any longer as discussed in the section on human assets).
Apart from these pieces of fishing equipment, women had a special fish trap, called ker,
as described in the section on human capital. Some local fishers who farmed seaweed
invested in rope, seedlings of the seaweed, and temporary huts near the farming area.
Almost all fishing households in the four villages had canoes. This type of canoe was
sometimes complemented with the sails (57 boats with sails on Kangge Island). In
Kangge, the fishers received a simple outboard engine, called katinting, which had an
engine capacity of less than 6 hp from the Fishery Department in Alor at the end of 2009.
This brought the total number of outboard engines, katinting, to 120 engines in Kangge
Island in 2010 (Figure 5.12 C). The beneficiaries were those who had paddled canoes or
were willing to provide paddled canoes. Due to the motor’s weight and its position in the
water, those who already had canoe had to raise the hull of the canoe. When I asked
several fishermen if they really needed the boat engine, they said it was provided so they
would use it. Some of them worried about the increased operational cost because of the
diesel. In the focus group discussions, women complained about this motor aid because
they could not operate the canoe anymore as men controlled the motorised boat. The
issue around lack of ownership of physical assets by women has been discussed at the
Foreign Aid for Gender Equality Workshop by the United Nations University and World

Chapter 5. The livelihoods on Pantar Island _____________________________________________________________________________
187
Institute for Development Economic Research in Helsinki in 2012 as a key issue
requiring attention.
There were several motor-boats in the four villages. In 2009, the communities in
Labuhan Bajo hamlet owned 78 boats that were 10-12 metres in length with 20-25 hp
engines, and 20 boats that were 7 to 10 metres long with an inboard engine capacity of
less than 20 hp. The village leaders of Labuhan Bajo noted sixty boats with engine
capacity of 30 hp in 2006. In Baranusa, there were five boats with inboard engine
capacity of 25 hp and eight boats with inboard engine capacity of 15 hp. The last type of
boat was used to collect sea cucumber that comprises 3 to 4 crews. In Marisa, there was
one motorised boat with an inboard engine capacity of 25 hp, one motorised boat with
inboard engine capacity of 30 hp, four motorised boats with an inboard engine capacity
of 15 hp and three motorised boats with an inboard engine capacity of more than 115 hp.
The village leader in Kayang said that motor-boats started being used in 2000. Before
that, they had to paddle the canoe to Kalabahi.
Another series of producer goods were used during seaweed farming activities. Some
local fishers invested in rope and temporary houses if the farming area was far from their
homes. For example, villagers of Blangmerang built temporary houses on Lapang Island.
One household had an average 200 lines with 22.5 metres per line. All of the people in
these areas used an off-bottom farming system where two sticks were planted to tie the
rope and the propagules of around 100 grams of seaweed were tied with nylon or
polyethylene line in the rope in every 25 centimetres.
The results from the household surveys support the result of the group discussions about
the type of fishing method (Figure 5.13). Most of the respondents used multiple fishing
methods and 19 fishing methods were identified. The most commonly used fishing
methods in the four villages were the hand-line and hook fishing methods from a motor-
boat with engine capacity of less than 6 hp (55 respondents). Another 18 respondents
used the hand-line fishing method. Twenty five respondents used spear guns for fishing
and this method was most widely used in Marisa village (13 respondents). Collecting

Chapter 5. The livelihoods on Pantar Island _____________________________________________________________________________
188
shells in the intertidal waters was also identified from the household surveys (18
respondents). Kite-fishing was only practised by Bajau people. Two respondents from
Blangmerang and Marisa villages identified using dynamite for fishing.
Figure 5.13: Fishing-related activities based on household surveys (n=100) (the respondents could indicate more than one fishing-related activity)
Catch storage and ice supplies
When fish are caught are either stored in the boat. Women fish traders needed the
storage to store and carry their fish, in a round plastic gallon (25 kg). The women in
Labuhan Bajo could also rent a fish storage box from a trader (A$1 per night). This kind
of fish box was normally used for tuna as it had a bigger space than a round plastic
gallon. Ice supplies were only available when there was electricity supply such as in
Labuhan Bajo and Blangmerang village. One kiosk owner in Labuhan Bajo made ice
blocks in a round tube shape (approximately 30 cm long and 10 cm wide). The price
ranged between Rp1000-2000 (A$0.12-0.25). The customers were mostly women
traders. However, the supplies were not stable. During the focus group discussions,
women traders complained about the price and unstable supplies. No one made ice in
Kayang and Marisa villages as the electricity was generated by diesel and only used for
lights and television for four hours in the evening. There were no ice factories in
Kalabahi, the city of Alor, or in Lembata. One trader from Kupang brought their own ice
blocks from Kupang.

Chapter 5. The livelihoods on Pantar Island _____________________________________________________________________________
189
Kiosks and market buildings
Physical buildings are part of physical assets, and a physical building such as a kiosk
provides trading and social interactions. Kiosks provided daily needs and fishing
equipment. Sometimes the kiosk owners also acted as a buyer of fish products and
bridged the fishers with the outside world.
Nine kiosks provided daily supplies, two meatball food kiosks and five telephone credit
kiosks. These were open during the day in Labuhan Bajo hamlet. Other kiosks provided
material construction, daily needs, and cloth in Kabir village. In Blangmerang, there
were several pedlars but in Baranusa, there were ten big wholesalers of daily needs and
house construction materials. Meanwhile, Kayang had one kiosk providing household
supplies and seven smaller kiosks for daily needs. Only six kiosks could be found in
Kangge Island.
Unlike kiosks that opened every day, markets only opened during market days from
morning to midday (Chapter 6). All villages had one building for a market except
Baranusa as they traded at the harbour where the roof was only a shady tree (Figure
5.14). The market buildings in Kabir, Marisa and Kayang villages were very basic with a
roof and cement floor, but no walls. The market in Kayang had ceased business in mid-
2009 although they had one market building.
Figure 5.14: Market in Baranusa where papalele from Blangmerang sold their fish

Chapter 5. The livelihoods on Pantar Island _____________________________________________________________________________
190
Mobile Phones
The cheap mobile phone handsets, affordable top-up cards and innovative ways of credit
payment increased the use of mobile phones. Mobile phones are the most extensive
communication mode in rural areas in Asia (de Silva et al. 2008; Zainudeen et al. 2010).
This is also true for Pantar Island. Almost all households in Labuhan Bajo and
Blangmerang had mobile phones while in Kayang and Marica villages only selected
households had mobile phones. One main driver is that the mobile phone signal was
strong in Blangmerang and Labuhan Bajo. There was only one spot that could receive
mobile phone signals in Kayang village while it was possible to use a mobile phone in
several spots in Marisa village.
Mobile phones are useful for getting market information for non-local market oriented
products. For example, the seaweed local traders used mobile phones to get price
information from national traders. Based on my observation, men mostly controlled the
use of mobile phones. Men were considered to be the head of households and normally
controlled all the household’s assets (Firth 1983), especially when it involved
technology and communication with the outside world.
5.2.4 Financial Assets
This section discusses the financial assets including savings, financial institutions and
credit access.
Savings
Savings can be in the form of cash money and item (e.g. jewelry) that can be converted
into cash quickly. The source of saving is cash income earned from livelihood activities
and remittance from families who work outside Pantar (typically in Malaysia or
Singapore). The details about cash income are explained further in a later section on
livelihood outcomes.

Chapter 5. The livelihoods on Pantar Island _____________________________________________________________________________
191
In the absence of a formal financial institution in Pantar, the communities saved their
money in the form of jewellery, kitchen equipment, household furniture, or just kept the
money in their houses. During focus group discussions with women groups in each of
the four villages, jewellery was the most favoured form of savings as it can be pawned
quickly. Meanwhile, the remittances were irregular. One ex-migrant worker in Marisa
(personal communication in 2009) said that they sent home money and other household
supplies wit workers when they returned home but this was very rare. However, having
someone working overseas was an asset to be called upon when in difficulty.
Financial institutions and credit access
There was no formal financial institution in the four villages. Some extra money was
used for savings as discussed above and some of the villagers asked the owners of the
kiosks to keep their money. Kiosk owners acted as financial institutions without giving
interest. The savers could withdraw their money at any time. This saving system was
built from trust. Only a few people had bank accounts in the capital city, Kalabahi, Alor
District capital city.
The coastal villagers also benefited from the relations with local traders, kiosk owners
and neighbours to borrow money in difficult situations. This is also described in Chapter
6 in relation to the relationship between actors and the power of village traders. Abraham
(1985) illustrated that subsistence credit is one of the survival strategies of small fishers
in coping with the uncertainty about the number of fish they can capture.
Case study examples of the types of savings used by villagers in their interactions with
local traders in the respective villages are illustrated. The extra money of one fisherman
was saved with PHB, a trader in Labuhan Bajo hamlet. When the fisherman needed the
money for buying house materials he withdrew the money or asked PHB to provide the
materials. The situation was the same with grocery kiosks. In another case, the villagers
borrowed Rp800,000 (A$100) by pawning 10 grams of gold jewellery to BS, a Chinese-
Indonesian trader in Kabir in 2009. The instalment was agreed between the borrowers
and BS, and the borrower had to pay Rp100,000/month (A$12) for the interest rates. If

Chapter 5. The livelihoods on Pantar Island _____________________________________________________________________________
192
the borrower planned to pay twice (Rp400,000 (A$50) per month), the borrower had to
pay the instalment in total Rp500,000 (A$51.5) per month. If the borrower planned to
pay eight times, the instalment was Rp100,000 (A$12) per month plus another
Rp100,000 (A$12) for the interest. So, the total instalment was Rp200,000 (A$24) per
month. The longer duration of the instalment, the loan will multiply dramatically.
Meanwhile, the villagers could get Rp1,800,000 (A$200) by pawning 10 grams of gold
with an interest rate of Rp25,000/month (A$2.5) in a pawning institution in Kalabahi,
the capital city of Alor. However, they had to cover several costs such as transportation,
meals and waiting time. Every month the borrower had still to pay this cost for paying
the instalments. Due to this reason, they preferred to pawn their jewellery in Kabir
instead of in Kalabahi although the interest was higher. This shows that local traders
play an important role in the village financial system (Crona et al. 2010).
A rotating savings group, called arisan, was an informal financial institution operating in
the four villages. An arisan group in Blangmerang and Marisa required the member to
pay Rp100,000 (A$12.5) in cash per month. Other arisan groups were called housing
arisan because the instalment was cement as the purpose was to build a house for
members. The arisan group provided a direct benefit to the members and members tried
to fulfil the requirements. This saving group was independent from government or non-
government micro-finance programs.
The limited access to financial institutions indicates an opportunity for micro finance
institutions. It is widely recognised that micro finance can raise incomes and reduce
poverty especially for poor households that suffer from unpredictable income, as it can
be used to start or expand businesses and diversify household incomes (Midgley 2008;
Bauchet et al. 2011). However, if a micro finance institution was to begin operating in
Pantar, it should consider the local loan system and not replace the local traders as they
are part of the market system at the local level (as discussed further in Chapter 6 about
the relation between kiosk owners and fishing families).

Chapter 5. The livelihoods on Pantar Island _____________________________________________________________________________
193
5.2.5 Social Assets
The social assets considered in this present study are social networks (Chapter 2). Not
only the village institutions and the network but also how one person is linked with
another as a result of a kinship relationship or membership at the local institutions. This
section discusses the types of institutions that existed in the villages in Pantar including
kinship relations, village institutions and non-formal institutions. Village institutions are
set up by the government or non-government organisations, while non-formal
institutions have no clear structures but are tied together by the participating members.
Kinship relationships
This section discusses how a kin relation and the identity of place are social assets for
the people in the targeted villages. Bajau people in Labuhan Bajo hamlet have a kin
relationship among Bajau people. Most of them were born in Kabir but had kinship ties
with other Bajau communities especially those from Southeast Sulawesi which promoted
mobile livelihood strategies (Stacey 1999). This kin relationship enabled them to fish in
other places, and they received support if they had difficulties in the remote fishing
grounds (such as shelter from bad weather). Within the Bajau communities in Kabir, an
effort to support each other still occurred. If someone planned to send their children to
study outside Kabir, such as Kalabahi or Kupang, the children could ask for financial
support from other families and those who were willing to help would provide cash
support.
Meanwhile, kinship relationships in Blangmerang, Kayang and Marisa villages were
structured under the family groups (Chapter 3). Family name was important in these
three villages. In these communities, a strong extended family system and a spirit of
collaboration with shared values and customs across generations were still applied.
During the circumcision ceremony of the Panggorang family group (whose family
names are Magi, Laba, Gole or Atolojo) in 2010, all members of the family group
prepared the event, such as the provision of foods and tents, and provided gifts to the
boys and girls. When A. Tupong conducted a prayer for the beginning of his house
construction, for instance, all the Tupong family helped in the events (e.g., bringing

Chapter 5. The livelihoods on Pantar Island _____________________________________________________________________________
194
foods). Again, when another prayer for placing the roof was conducted, all the Tupong
family came and helped.
In daily lives, one household can ask for help from their family groups if they have
difficulty. This is likely to happen within an extended family group, most easily
identified by a common family name. For example, M. Magi can ask for rice and give
their caught fish to S. Magi. In a different situation, M. Magi as a member of the Magi
family also distributed to other Magi families the coconuts or bananas, as the result of a
fish barter for example. This family network system was an asset for their survival
strategy.
In addition to kinship, the hamlet/sub-village areas, where they lived, were also
important as local institutions. It shows where they belonged and they received benefit to
access farming in the waters in front of their villages. For example, the coastal villagers
in Labuhan Bajo hamlet or Marisa village farmed seaweed in the waters in front of their
houses. In a different case, the Bajau people in Kabir farmed seaweed on Kangge Island
when they had permission from their family in Marisa village or the village leader in
Kangge. For fishing activities, people from Pantar could fish anywhere in Pantar, with
no need to ask permission.
People in these four villages relied on their kinship in traditional institutions as a strategy
in the time of crisis. This supports the finding by Bebbington et al. (2006) that local level
institutions played a significant role in livelihood strategies during the economic crisis in
Indonesia 1998-1999.
Village institutions (formal)
In these four villages, typical village organisations were in place, such as village level
government, sub-hamlet village leaders, and PKK/Pemberdayaan Kesejahteraan
Keluarga (Family Welfare Movement). The PKK is a formal government-led women’s
organisation which is socially and politically structured from the very lowest level in the
community up to the national level. The PKK at the village level is very active in infant

Chapter 5. The livelihoods on Pantar Island _____________________________________________________________________________
195
health and maternal programs. As it benefited many women, this program had relatively
high attendance during baby weight days according to midwives in Kabir (personal
communication, 2009 and observations).
Other village organisations were set up to respond to government and non-governmental
programs. These groups were supposed to have leaders and organisational structure as
required by many governmental programs. During this research, only two such
institutions existed: seaweed farmers’ groups, and loan groups. One seaweed farming
group in Kabir and one group in Marisa were initiated by Swisscontact (a non-profit
organisation that links private enterprise and rural development) and the Department of
Fishing and Marine Affairs at Alor district. Nothing was heard about the group in Kabir.
Meanwhile, a group in Kangge had developed their seed money into a saving and loan
mechanism.
Loan groups had been set up by WWF Indonesia in the four villages. WWF Indonesia
provided seed fund and members of the group could access the fund. Two people from
the groups in every village had attended training on community organising. As of 2010
nothing had yet happened on the ground.
Other institutions that existed in Labuhan Bajo hamlet were the fishermen group and
cooperative. The fishermen group had 60 fishermen as members to respond to a program
from the Department of Fisheries and Marine Affairs at district level. However, there
were no activities related to the group and many fishermen did not know about this
group. A fishers’ cooperative in Kabir had 60 men as members. This cooperative was set
up to access government funds from the Social Department of Alor district. The money
was used for providing diesel to fishermen and they had to pay the instalments.
Unfortunately, the harvest from marine resources was not enough for the fishermen to be
able to repay the money. Everyone in Labuhan Bajo hamlet, not only members, could
buy the diesel. After the collapse of the cooperative, the distribution of diesel was
controlled by local traders as usual as before the cooperative.

Chapter 5. The livelihoods on Pantar Island _____________________________________________________________________________
196
Non-formal institutions
A non-formal institution is an institution with no clear structure but tied together by the
participating members. For example, people organised themselves based on similarities
in livelihood activities. They went and worked in a location at the same time so they
shared experience, risks and challenges within the members. They also shared a patron-
client relationship with traders. The papalele, for example, grouped themselves to get
fish to sell to customers and rented a wooden boat to get to the nearest market. There
was no formal leader and structure in this organisation.
In addition, an organisation was set up by a local trader to form a fishermen group to fish
together. For example, H. Moru, an informal leader in Labuhan Bajo hamlet, called 12 to
15 hand-line fishermen from Labuhan Bajo hamlet to fish around Alor, especially blue-
barred parrotfish. This group was set up to respond to a request from a trader, Y, in
Kupang. The trader, Y, anchored the wooden boat and collected the fish from the
fishermen, weighted the fish on the boat and stored the fish in an ice box. The price was
based on the weight of the fish at Rp12,000/kg (A$1.5). The buyer sent the money to H.
Moru and he distributed the money to the fishermen at Rp10,000/kg (A$1.25) per
kilogram.
In summary, this section has explored the five assets of coastal communities in Pantar.
In regard to human assets, everyone in the house is considered as labour force. The
education facilities were inadequate. Pantar Island represents the typical condition of
formal education services in this region. The human development index of NTT
province was ranked 30 out of 33 provinces in Indonesia in 2011 (BPS, 2013). In
relation to knowledge and skills, the people have a wide range of knowledge about
marine resources such as the locations, conditions, and how and when to capture. They
also have knowledge of land-based activities such as farming and handwoven textiles.
Health was quite problematic in this area because facilities and health staffs were
inadequate.

Chapter 5. The livelihoods on Pantar Island _____________________________________________________________________________
197
Natural assets include the status of key habitats (mangrove, seagrass and coral reefs) and
the most captured marine resources. In the study area, mangrove forest was relatively
medium to low density. The coverage area of seagrass had been decreasing since 2007
while the status of coral reefs was varied. The status of the most captured marine
resource indicates a potential risk to the sustainability, except Decapterus spp. Seaweed
had been a popular product to be farmed although the production was unstable.
Physical assets for infrastructure were inadequate while producer goods such as fishing
equipment were used optimally by fishers. The facility for markets was basic and ice
supplies were limited. With good connections for the mobile phone signals in Labuhan
Bajo and Blangmerang, the villagers could contact the outside world.
Financial assets include savings, financial institutions and access to credit. Non formal
financial institutions existed so the communities saved their money in the form of
jewellery, kitchen equipment, household furniture, or just kept the money in their houses.
However, people could access credit from kiosk owners, village traders, pawn shops and
through their social networks. The social network as one form of social assets enabled
villagers to survive in this area.
5.2.6 Community’s perception of their assets based on the selected marine
products
Having discussed the livelihood assets, this section discusses how the community in the
four villages perceived the status of assets and how they were able to mobilise those
assets in relation to the selected marine products as discussed in the section on natural
assets. The villagers chose the marine products and mostly it significantly contributed to
their daily life in terms of cash money and activities. Figure 5.14 shows the scale of
assets in relation to marine products. This pentagon asset was drawn from group
discussions. The assets were explained to the participants and the scale 1 to 5 was also
described with one as the least and five is the highest score. The community was asked
to define the status of the assets scaling it from one to five. They were free to define and

Chapter 5. The livelihoods on Pantar Island _____________________________________________________________________________
198
agree on their own criteria. This process was verified by conducting the same process
several times with different groups in each village.
Note: H= Human asset, N= Natural asset, S=Social asset, F= Financial asset, P=Physical asset. Scale 1-5
Source: Focus group discussions in each village conducted in June and August 2008, and June and
September 2010.
Figure 5.15: The community’s perception on their assets regarding with selected marine
products

Chapter 5. The livelihoods on Pantar Island _____________________________________________________________________________
199
Pelagic fish
Villagers in Labuhan Bajo hamlet considered Hyporhamphus sp (lember in the local
name, or halfbeaks) was the fish most often captured. They had confidence that they had
knowledge of the fishing spots, the spawning time, and the best time to catch according
to their experience, gear and equipment needed. Therefore they considered the human
assets to be at scale 5 (Figure 5.15). The Bajau people considered social assets to be at
scale 5 as there was no social constraint to catch. The owners of the boats were able to
provide supplies for the trip, and this put the financial assets at 5 (Figure 5.15).
Unlike human, natural, social and financial assets, physical assets were considered to be
at scale 2 (Figure 5.15). The reasons for this were that the existing mid-water trawling
boats were not enough to catch this fish, as only two boats operated currently. They
would expect two boats more to get to a scale of 5. Overall, they agreed to scale physical
assets at 2 (Figure 5.15).
Hyporhamphus sp were also abundant for Blangmerang fishers. Only one mid-water
trawler operated in this area. The fishermen considered they had less capacity to catch
and sell Hyporhamphus sp than Bajau people. Therefore they gave a scale of 3 on human
assets but had confidence in other assets, which they scored at 5 (Figure 5.15). Fishers in
Marisa village had less knowledge or understanding of this fish. However, they believed
the natural assets were good for this fish, they had no access constraints and were able to
mobilise their physical assets to catch this fish.
Villagers caught Decapterus sp for almost the whole year but the peak season was
during the rainy season. Fishers in Labuhan Bajo hamlet had confidence of their
knowledge about where and when to fish (e.g., around FADs), the ability of natural
resources to provide this fish, no social constraints, and they had the necessary gear such
as hand-lines and hooks. Everyone could catch this fish. Similarly, fishers in
Blangmerang had confidence in their assets, excluding physical assets. They believed
that more boats were needed. Meanwhile, fishermen in Marisa village had confidence in

Chapter 5. The livelihoods on Pantar Island _____________________________________________________________________________
200
their asset to catch this fish but they argued about how women could sell it. Therefore
they scored human assets at a scale of 3 (Figure 5.15). Fishers in Kayang did not catch
Decapterus sp as much as fishers in the other three villages.
Demersal Fish
Fishers in Labuhan Bajo hamlet did not consider demersal fish as a winning product as
there was not abundance although they sold parrot fish (Scarus spp) and coral grouper
(Chepalopholis spp). Therefore they didn’t scale their assets to this fish. The case was
similar with the Blangmerang fishers, who also did not scale their assets to this fish.
Fishers in Kayang targeted mainly demersal fish (Cephalopholis spp). They had
confidence that they knew the spawning season and the habitat. They only needed basic
supplies for fishing so financial assets were not a problem. If one fisher did not have a
canoe, he could easily borrow one from friends. Meanwhile, fishermen in Marisa scaled
human assets at 3 as they didn’t really know the spawning season (Figure 5.15).
However, they were very sure they still could catch coral grouper as long as the sea was
still good for this fish.
Seaweed
All the fishers regarded seaweed as new to them and therefore they considered they had
little knowledge of this farming. They didn’t know how to treat the “ice-ice” disease and
they didn’t know the best methods of responding to fluctuating climate conditions and
sea temperatures. Therefore, human assets were scaled at 3 in Blangmerang, Labuhan
Bajo and Marisa villages (Figure 5.15). Participants in Kayang village scaled human
assets at 4 as they claimed that they were the only farmers who survived the ice-ice
outbreak (Figure 5.15). In 2008-2009, they experienced the ice-ice outbreak, so they
considered the sea was not good enough for a certain time. People in Labuhan Bajo and
Blangmerang scaled natural assets at 3, and Marisa people scaled natural assets at 4.
Fishers in Kayang village scaled the natural assets at 5 as they didn’t experience the
outbreak; they farmed the whole year while others only farmed during the rainy season.
All the participants of the focus group discussions felt confident about other assets which

Chapter 5. The livelihoods on Pantar Island _____________________________________________________________________________
201
they scaled at 5 as they could provide the equipment and seedlings needed, and had no
problems with the financial asset to support this activity.
Sea cucumbers
The collection of sea cucumbers was an interesting livelihood activity as it was not the
main source of cash income according to the participants of the focus group discussions
but it was one of source of cash income. All the participants in the group discussion
agreed there had been a decline in sea cucumber stocks. They told me that on Lapang
Island, sea cucumbers had been easy to collect a long time ago but now the men had to
dive deeper while the women only collected two to three sea cucumbers per trip in
mangrove areas. It was the same case with Rusa and Kambing Islands, where they
considered no more trepang in those areas. However, a group of people from Pulau Pura
collected a tonne of trepang in Rusa and Kambing Islands in early 2010. Therefore, the
natural assets were scaled at 2 in Blangmerang and at 3 in Labuhan Bajo and Marisa
(Figure 5.15). The participants in Kayang still considered that natural assets were able to
provide sea cucumbers, therefore they scaled the natural assets at 5, as shown by the case
described above. They believed that if they had the knowledge and equipment they could
collect more sea cucumber in the future.
As stock decreased, better skills and equipment were needed to collect the trepang that
was not previously reached. Only a few people had the skills to identify the trepang
spots, and were willing to dive manually deeper. The participants in Labuhan Bajo
believed that they had knowledge about where, how, and the best time to catch sea
cucumbers, therefore it was scaled at 5 as a human asset. The Bajau fishermen in Kabir
considered they had the knowledge to collect sea cucumbers but it was difficult to find
now. Only a limited number of people were able to collect sea cucumber in
Blangmerang and Kayang, so the participants in the group discussion scaled the human
assets at 2 while the participants in Marisa scaled the human assets at 3 (Figure 5.15).
Participants in Labuhan Bajau, Blangmerang and Kayang agreed that the equipment to
catch and the supplies needed were accessible and could be afforded. Therefore they
scaled infrastructure and social assets at 5.

Chapter 5. The livelihoods on Pantar Island _____________________________________________________________________________
202
Top shells
Top shells were not the main livelihood activity but provided supplementary cash
income. All the participants of group discussion, including men and women, considered
they had little knowledge about how this creature spawned and about the habitat and
time of catching. They believed after the rainy season was the best time to collect top
shells. In relation to this resource, the participants in Kayang scaled the human assets at
2 while the participants in Labuhan Bajo, Marisa and Blangmerang scaled the human
assets at 3 (Figure 5.15). All the participants considered that stock had been declining as
it was more difficult to find now although they still could find it and therefore they
scaled the natural assets at 3 (Figure 5.15). By contrast, fishers in Kayang still
considered the natural assets were plenty, and they scaled the natural assets at 5. No
complicated gear and supplies were needed for collecting top shells (only torch), so all
the group discussion participants agreed to scale the financial, physical and social assets
at 5 (Figure 5.15).
In general, the participants of the group discussions believed they were able to mobilise
their financial, physical and social assets to benefit from the resources. The participants
would invest their physical, financial and human assets if the output and benefits of the
livelihoods could be gained although it has a risk to experience failure in harvest and
fluctuation of price. For example, the people in these four villages were relatively new to
seaweed farming. They learned how to understand the climate and to adapt to the sea
conditions although some of the knowledge is insufficient to understand the
characteristic of seaweed farming and market forces. They invested in equipment and
seedlings as they observed their neighbour experienced a significant benefit and because
it was easy to do despite the outbreak that occurred. This shows how they were willing
to mobilise their assets to gain better livelihood outcomes. The constraint in exploiting
the resource was only their ability to understand the sea condition (temperature, salinity,
chemical contents of the sea). Changes of sea condition forced the fishers to develop
better skills and knowledge in seaweed farming.

Chapter 5. The livelihoods on Pantar Island _____________________________________________________________________________
203
5.3 Vulnerability context
The vulnerability context is the external context that has an impact on people’s
livelihoods. This section presents the analysis of the vulnerability of these four villages.
The section starts by describing several important events and then categorising those
important events as shocks, trends and seasonality that contribute to vulnerability.
The important events that were considered as risks are presented to give a brief picture
of the vulnerability conditions in this area (Table 5.5). The data and information in this
table were gathered through focus group discussions using a timeline from a PRA tool
(Pretty et al. 1995) and interviews with key informants. In one village, the data collected
from the first group were verified with other groups and key informant interviews. Table
5.5 shows the chronological events in these areas. Several external factors that can be
recognised as the cause of vulnerability are described further under the categories of
shock, trend and seasonality.
Table 5.5: Important events in the four villages
Year Important events 16th Century Villagers from Kayang Village moved to Marisa in Kangge Island 1810 Kayang village was re-opened by Munaseli kingdom 1830 War between Baranusa and Wolu 1900 Earthquake
Tsunami at 3 m height Bajau arrived in Kabir around that year
1923 Reddish sea (like sulfur) in Baranusa Bay 1930 Fishermen in Kangge started using spear for fishing 1940 Conflicted between Wolu and Kangge using arrow
Gorang family moved to Kayang 1953 Volcanic mountain in Lembata exploded 3 times
Famine in Kayang, less rainfall 1958 Comet (tailed star) in Baranusa sky 1960 Tsunami in Baranusa 1962 Rice growing started in Kangge 1963 Earthquake
Bajau people started building houses in Kabir because earthquake made it unsecure to live on the sea

Chapter 5. The livelihoods on Pantar Island _____________________________________________________________________________
204
Table 5.5: Important events in the four villages (Continued) Year Important events 1965 - A long dry season
Wheat bulgur was introduced as food by the government. People ate mangrove fruits by frying without oil and pounding the fruits (tit). The villagers in Blangmerang sought cassava in Adonara, Flores. The Bajau ate mangrove fruits and coconut meat. The coconut meat was chopped in cubes and infants ate young coconut meat. Fish was traded for coconuts as the coconut supplies in the village were not enough.
- Madrasah primary school was started in Kayang and Kangge - Cotton was used for fishing lines in Kayang and Kangge. To get a stronger line, the cotton was soaked into natural dyes from tree bar.
1970s The owners of kiosks in Kabir were sent to jail in Kalabahi for selling material for dynamite fishing
1972 - Sun eclipse - Traders started business in Kangge
1975 Dry season People in Kayang, Marisa and Blangmerang collected cassava from Waiwuring (eaten and planted). During this time, the mountain people in Pantar Island also looked for shellfish and mangrove fruits in mangrove areas.
1977 - The first use of nylon as fishing line - Chinese traders started business in Kalabahi - Dry season in Kangge Villagers in Kangge ate buah bidara (ziziphus mauritiana) and morungga (Moringa oleifera). These two fruits and leaves are memorable because they were the only food available although Moringa sp is also a daily food until now.
1978/79 The first big wooden boat (Pelni) traveled to Weiriang, Baranusa, and Kalabahi 1981 - Started planting corn in Baranusa
- 2 ships sank in Baranusa - Electricity started in Kabir, 50 houses had meters. Until now the number of houses with electricity meters has not increased.
1982 - Sun eclipse - Started having outboard machine for canoe (Johnson), sold goat to Dili - Dry season - Diarrhea in Kayang Villagers in Kayang ate beans, papaya trunk, guwang (Corypha utan). The stems of guwang was pounded and eaten. Kangge villagers were supported by villagers from Allumang due to dry season.
1983 - Conflicts with mountain people - Deer population census in Rusa Island by Forest Department (1002 deer)
1986 A motor-boat was used in Kayang. The villagers in Kayang Village used to travel for two days using canoe to Kalabahi and on foot for seven hours to Baranusa.
1987 - Earthquake (22 Nov 1987), strong wind, many houses were destroyed in Labuhan Bajo and Kayang
- they found less lola after the earthquake Feb 1989 Sea abrasion to 30-40 m in Kabir 1991 - Earthquake
- Kiosks opened in Kangge 1992 Outboard engine wooden boat was used in Kangge

Chapter 5. The livelihoods on Pantar Island _____________________________________________________________________________
205
Table 5.5: Important events in the four villages (Continued) Year Important events 1994-95 - Earthquake in Kangge (7 pregnant women, many kids died)
- Diarrhea in Baranusa - First visit from medical staffs to this area - Dug latrines and salted water dug wells were started in Baranusa
1995 No yield from corn in Kayang but had more money so coastal villagers could buy food 1999s - 30 Baranusa people died at Australia-Indonesia border sea because of storm. This
shock stopped them from fishing at the border sea. - Bajau people from East Timor moved to Labuhan Bajo, Kabir
2000 - New sub-district in Kayang - One diesel generator in Kangge
3 March 2003 Storm 2004 Earthquake in Kangge, many moved to Kalabahi 2005 - Good harvest in trepang
- Storm in Kabir - ProAir GTZ started fresh water project in Kabir
2006 - Earthquake, high tide 3 m and low tide to the middle of the sea. Found dead fish in 7 days. - Started planting cashew nut but the cashew nut tree failed to fruits. The farmers said it was caused by the smoke from slash and burn method conducted by mountain people
- Boat for tuna fishing started in Kabir 2007 - Started planting seaweed
- Many leaf roof was replaced with zinc roof in Kangge 2008 - The price of seaweed went up, more investment in seaweed
- Less time to farm land - Ice-ice outbreak relates to seaweed farming - Islamic Junior High School was built in Kayang - Conflicts between Kangge-Kayang and Wolu (July)
Dec 2008-2009 -The price of seaweed: free fall of prices (as discussed in Chapter 6) - Ice-ice outbreak for seaweed, many stopped farming seaweed. Only a few villagers in Kayang and Kangge still farmed seaweed but the harvest was not good. Due to low harvest, many local traders became bankrupt and traders phased out from this area.
2009 - Islamic school was built in Kangge - Lapang Island was declared closed by the local government. This puzzled the fishers and seaweed farmers. The Blangmerang villagers accused the village leader of selling Lapang Island.
- Swiss contact support seaweed program in these areas - UNICEF provided 156 rain water tanks for Kayang Village by the end of 2009. Around this time, the wooden boat that carried the material was sunk due to bad weather.
- The Department of Marine Affairs and Fisheries of Alor district donated 80 outboard engines to fishers in Kangge
Source: Focus group discussion and semi structured interview with key informants
Shocks
Shocks are unpredictable events that have a significant effect on livelihoods. Two types
of shocks occurred in this area: natural shocks and non-natural shocks. The natural
shocks that occurred in this area were earthquakes, tsunamis, mountain explosion, dry

Chapter 5. The livelihoods on Pantar Island _____________________________________________________________________________
206
season and seaweed disease (Table 5.5). The effect of natural shocks varied from
temporary disruption of normal lives to complete devastation, for example earthquakes
that devastated the physical assets and a long dry season that changed the staple food
habit (Table 5.5).
The non-natural shocks were horizontal conflicts between villages on Pantar Island, the
coming of traders from outside Pantar and the fluctuating price of seaweed. This caused
extreme psychological stress and the destruction of physical assets. For example, a
conflict between Wolu and Kayang and Kangge in July 2008 was triggered by the
seaweed farming and then developed into religious conflict. The conflict was solved by
customary resolution. The traditional village leaders declared a peace agreement through
traditional sworn. Seaweed farming also caused other disputes but it caused less stress. A
clash between older and younger farmers in Kangge Island occurred, and seaweed was
claimed to be the problem. The government village leaders and traditional leaders
conducted a meeting with all the farmers in that area.
Other non-natural shocks were the coming of traders from outside Pantar Island and the
price of seaweed (Chapter 6). The traders from Kupang and Makassar bought fish
directly from the fishers on the sea in a big quantity and left a limited amount of fish to
the local markets. Less fish were available for women to barter and this increased the
local price.
The fluctuation of seaweed prices caused vulnerability for the villagers. By the end of
2008 the price of dried seaweed increased dramatically and then the price went into free-
fall in early 2009. This bankrupted many local traders because of the different selling
and buying prices (discussed in Chapter 6). This indicates the villagers were also
vulnerable to the wider political economy (Adger 1999) despite the relative remoteness
of the island. The villagers expected the price of seaweed would increase again. There
was no action carried out by the villagers, however global stakeholder groups had a
discussion to overcome this situation (Chapter 6).

Chapter 5. The livelihoods on Pantar Island _____________________________________________________________________________
207
Trends
A trend is a gradual change of something that has been observed. In this case it includes
the trends of declining numbers of fish and marine resources harvested by fishers. The
most observed trend was the decrease of top shells and sea cucumbers. The men in the
group discussions in Labuhan Bajo mentioned that they used to collect sea cucumbers in
the waters in front of their village. Now they had to seek further afield in Lapang Island
but the result was still less. They considered it was more difficult nowadays to find these
creatures (see also Section 5.2.6). They had to dive deeper or harvest around Lembata
Island. The men in the group discussion in Labuhan Bajo considered that technology had
changed and the increasing price drove people to catch more which affected the natural
assets. For example, they used to collect trepang with ladong and by free diving. Now
people used hookah lines and a compressor.
In Blangmerang, the members of the group discussions said that the size of the collected
sea cucumber was smaller and they were difficult to find. Similarly with top shells, one
participant, HL, said that he could collect 50-60 top shells per hour in the past. Now he
could only collect fewer than five top shells per day. The participants in Blangmerang
said that the collectors used to be only from Pantar, they knew each other, and only
collected two species H. scabra (teripang buang kulit) and H. fuscogilva (teripang susu).
Now, more people from outside Pantar collected trepang in this area and every species
was collected.
Seaweed farming was part of the trends in this area. Seaweed farming changed the
source of people’s livelihoods. When seaweed farming gave more benefit, many people
left their fishing activities and neglected to maintain their fishing equipment. This was
revealed during focus group discussions in the four villages. Due to the success of
seaweed, cash money had played a significant role in the trading system including in bad
weather.

Chapter 5. The livelihoods on Pantar Island _____________________________________________________________________________
208
The increased price of many food supplies and petrol worsened the vulnerability
condition. The participants in the Blangmerang groups reported that the increased petrol
price had caused an increase in the operational costs especially since they started to use
motor-boats. This condition shows how macro economics affects people in the remote
areas.
A gradual change in trends could create new opportunities for coastal villagers who
could benefit from the condition. For example, the increased number of motor boats in
Labuhan Bajo hamlet and Marisa triggered the establishment of several petrol traders in
the areas. Similarly, the development of seaweed interested people to become local
traders in the region. But for some, the changes created more difficulties due to the lack
of physical asset control, financial asset problems and the limited capacity to participate
in the market chain.
Seasonality
The seasonality category refers to recurrent changes that increase vulnerability. The
seasonality factor that occurs in this area is monsoon. There are two main seasons in
Pantar: west monsoon and east monsoon. The west monsoon starts in December and
lasts until March. This is also the wet season when most of the villagers are engaged
with farming and fishing-related activities (Table 5.6). The east monsoon starts in July
and lasts until September and is normally dry. This pattern was revealed during the focus
group discussions with men and women.
During the west monsoon, the villagers were busy with fishing and farming (Table 5.6).
When there was a storm (January-February), people could not go to the sea, so they only
fished along the coast. Family foods depended on shallow water shells collected by
women, a lot of seaweed farming ties were broken, fewer food traders came to the area
and sometimes there were no boats in and out of Pantar at all. The local traders had to
process the fish during the wet season. The availability of salt and ice was crucial during
this season.

Chapter 5. The livelihoods on Pantar Island _____________________________________________________________________________
209
In the east monsoon, when it was normally dry, pelagic fish was scarce while reef fish
could still be caught. Reef fish were easily found near the reef around Lapang, Kambing
and Rusa Islands. During this season, the supply of fresh water was limited in Kayang,
Marisa and Blangmerang villages. The villagers in Marisa and Kayang had to wait for
more than two hours to collect water in a well in Kayang. During the east monsoon, the
temperature of the sea was higher and it was more humid, as described during the focus
group discussions. The seaweed growth was not good at this time as the sea temperature
was higher than the ideal temperature for seaweed to grow (26-32oC) (Ask 1999). Fewer
activities were available in the villages during the east monsoon. This season caused
more out-migration as part of their livelihood strategies (Table 5.6).
To conclude, the external conditions that mainly caused vulnerability conditions in this
area were a long dry season and disease affecting seaweed farming. These caused losses
and people had to start their activities from the beginning. The ability to rebound
depended on the assets and external support. Otherwise, they fell into a poverty trap.
Climate conditions influence how people make a choice but they adapt by learning and
adjustment. Monsoon affects fish availability and rain affects how people do their
livelihood activities, as discussed in Section 5.5 on livelihood strategies.

Chapter 5. The livelihoods on Pantar Island _____________________________________________________________________________
210
Table 5. 6: Seasonal calendar for the four villages based on focus group discussions and field verification
Factors Jan Feb Mar Apr May Jun Jul Aug Sept Oct Nov Dec
Rain and temperature ¤ ☼ Wind
- - - - - -
Wave - - - - -
Demersal fish Grouper/parrotfish/ snapper ░ - - - - -
Chub fish/trevally - - - - , , Black triggerfish in front of Kayang and Marisa Villages Pelagic fish : Tuna by Labuhan Bajo Fishermen
at Timor sea
Halfbeaks
Round scad Skipjack Tuna Seaweed - - - - Sea cucumber - - - - - - - Top shells - - - - - - Land-based activity
Harvest
- handweaving : Baranusa and Kayang - collected tamarind by women all villagers - dried coconut - cashew nut: Baranusa - a few men in Kayang work as brick makers in Lembata
Note:
Heavy rain and storm
Rain
Less rain
¤ Hot ☼ Hotter
Hottest 4 Strongest wind 4 Stronger wind 4 Windy
Higher wave High wave
Wave 1. Current
░ Spawning
Harvesting season
Easy to capture
Less captured
Chapter 5. The livelihoods on Pantar Island _____________________________________________________________________________
211
5.4 Transforming Structures and Processes
The transforming structures and processes can enable or hinder how people mobilise and
combine their assets to pursue livelihood outcomes. Existing structures in the
community can include government and private sectors, and the processes that forms the
relations include laws, policy, culture (societal norms and beliefs) and institutions (DFID
1999). The transforming structure, process, and vulnerability context influence how
people mobilise and combine their assets as a strategy to pursue livelihood outcomes.
The transforming structures and processes are strongly related with social assets. The
structures such as government, local institutions and private-commercial activities at the
district level have been discussed in relation to social assets.
Pantar follows Indonesian law. In terms of administrative system, the four villages
experienced changing. Marisa and Kayang villages were used to be one village and part
of Baranusa Sub-Districts. In 2006 Marisa was separated with Kayang and these villages
were governed under Pantar Barat Laut Sub-District (Chapter 3). Blangmerang was also
became a new village in 2008 (Chapter 3). The new created village level of
administrative area is one way to enable the government at village level getting closer
with the people and changing the governing center (McWilliam 2011). The presence of
the administrative village leader helped people in administrative matters such as to
proceed the identification card. However, villagers do not limit their access to marine
resource and markets by way of administrative boundaries.
The new administrative area also made projects from non government organizations
target a wider group of people as most of the projects targets was based on village as a
unit. For example, Swisscontact supported seaweed farming for people in Marisa.
Similarly, the UNICEF built 159 water tanks in Kayang. So the new created villages
enable other organization to see the area wider.
Although this area is relatively remote from the administration centre, regulations about
citizenship are applied effectively by the village government as it is the main task of
government staffs at village level. By contrast, less attention is paid to the

Chapter 5. The livelihoods on Pantar Island _____________________________________________________________________________
212
implementation of the laws related to fishing equipment, transporting marine products,
environmental and fisheries management rules aiming at protecting habitats and
resources in Rusa Island. The laws related to marine-related activities are further
discussed in Chapter 7.
Private sector agents are part of the structure and play a significant role in the area where
limited government intervention is applied. Private sector agents, such as pawn shops,
and kiosk owners, help coastal villagers in coping with difficult situations but pawn
shops and kiosk owners can also sometimes result in the coastal villagers especially the
poorest with a long-term debt. The relationship between private sector agents and coastal
villagers is explained in more detail in relation to the market chain of marine products
(Chapter 6).
5.5 Livelihood strategies
The aim of exploring livelihoods strategy is to understand how people act in their
livelihoods, adapt towards changes and evolve to threats and opportunities (DFID 2000;
Birkmann 2006). The livelihood strategy is a combination of a range of activities to
survive in daily life and cope with vulnerable condition. The ownership and access to
assets in livelihoods permit the livelihood strategies to be constructed (Allison and
Horemans 2006). The coping strategy varies for different people, in general there are
patterns in coping with difficult situations and daily life. The strategies are grouped into
adaptation, diversification, and migration (refer to Chapter 2). This section discusses the
four groups of livelihood strategies conducted by the communities in the four villages.
Adaptation
Adaptation is the process of adjustment in response to a change in the physical
environment and exclusion from economic, social and political systems (Denevan 1983).
The villagers in the four villagers had the ability to adapt with the environment. Their
daily life depended on the monsoon and they adapted to these monsoonal seasons by
conducting different activities (Table 5.6).

Chapter 5. The livelihoods on Pantar Island _____________________________________________________________________________
213
The west monsoon was the busiest time as the pelagic fish were abundant and the
participants reported it was a good time for land and seaweed farming. More fish were
available to be processed but the lack of sun made it difficult to sun-dry the fish. The
roads to go to the markets were slippery due to the bad conditions and hilly topography.
It was the most challenging season for women traders but they also gained more profits
as a result of processing and selling fish, as well as land farming.
During the east monsoon from May to November, pelagic fish were not as abundant as
during the west monsoon but the numbers of reef fish captured were constant (Table 5.6).
During this lean fishing period, the women in the four villagers collected and peeled
tamarind fruit (from Tamarindus indica) and dried coconut. Women in Blangmerang
also collected cashew nuts. Some of them also produced handwoven textiles in
Blangmerang and Kayang. They sold the peeled tamarind fruit to a trader from Makassar
that visited once a week or simply sold the processed tamarind (asam) fruits to a trader
in Kabir.
The communities in the four villages also adapted with the environment in responding to
shocks. All local natural capital was utilised during the long dry seasons in 1953, 1965,
1975, 1977 and 1982. They ate food from mangrove fruits, coconut meat, papaya trunk,
guwang (Corypha utan), and buah bidara (Ziziphus mauritiana). In 1975, not only
coastal villagers but also mountain people went to coastal areas to find edible mangrove
fruits from Rhizopora spp and Sonneratia spp (Miles et al. 1990; Duke and Allen 2006).
During that time, the infants of Bajau had young coconut meat for food. They traded fish
only for coconut as the coconut supplies in the villages were insufficient for the villagers
during the long dry season in 1970s.
Communities have inherent capacities to adapt with the change of environment (Adger
2003). Although the west monsoon limited the villagers’ ability to go to the sea, for
example, the villagers in the four villages learned from the past and their ancestors about
when, where and how to catch fish based on monsoons. The villagers in the four villages
learned how to go to a place for fishing by observing tidal, current and seasonal hazards.

Chapter 5. The livelihoods on Pantar Island _____________________________________________________________________________
214
In addition to inherent capacity, the adaptation also involves learning and adjustment.
The learning process could be inherited from their parents, watching others, followed by
trial and error to get a suitable method that suits them, “on the job training” and
transferred by local traders. The ways to find the favourite fishing grounds were
inherited from their parents. In the same way, by understanding the wind, current
direction system and types of fishing gear, the fishers gained the knowledge from the
senior fishers. The women carefully observed the tidal system to collect shells and clean
the rope of the seaweed during the low tide. As seaweed farming had been recently
introduced in this area, seaweed farmers observed how their neighbours farmed,
processed and dealt with the local buyers. The local buyers translated the requirement of
seaweed into local language; for example, the 35% moisture content was translated as at
least 1.5 days of sun-drying. The local buyers played an important role in spreading this
practical knowledge (Chapter 6). The young men joined boat crews and learned how to
fish using this equipment as part of their “on the job training”.
However, the ability to adapt depends on the level of exposure, social network and
access to economic resources (Yohe and Tol 2002; Smit and Wandel 2006; Birkmann et
al. 2011). When the level of exposure is beyond their capacity, intervention or help from
the wider community is needed. Short-term intervention from the government can
reduce the vulnerability of a coastal community (Adger et al. 2005). An example of
government intervention in this area was the government distribution of wheat bulgur as
food to Blangmerang villagers to overcome famine in 1965. In the era of autonomy, the
district government is the key to deliver programs and projects, including aid during a
crisis. The law No 34/2004 on local government outlines the role of the district
government in executing their development priorities. Even though a project can be
funded from the national budget, the implementation remains the district government
responsibility. For example, the government dug latrines and wells in Baranusa to avoid
the occurrence of a diarrhoea outbreak in 1994-1995. Another intervention from the
government was the involvement of the police from the district level to solve a conflict
between Bajo people and sub-district police in Kabir.
Chapter 5. The livelihoods on Pantar Island _____________________________________________________________________________
215
The support from neighbouring villages and a kinship network helps to rebuild
livelihoods on Pantar Island after major shocks. For example, the support from families
helped people affected by a scarcity of food and by debt at local kiosks. In 1975, the
villagers of these four villages collected cassavas for food from Waiwuring and Adonara
in Flores Island. Marisa villagers were supported by villagers from Allumang during a
long dry season. Cultural bonding solved a conflict in Wolu in 2008. A strong social
cohesion among the villagers on the island helps them cope with vulnerable conditions
(Adger 2003; Bebbington et al. 2006). The communities in the four villages had the
ability to adapt with the environment and social cohesion also helped them rebuild their
self-sufficiency after major shocks.
Diversification
The second livelihood strategy is diversification. The villagers in the four villages
engaged in multiple activities of income generation for survival (Ellis 2000; de Haan and
Zoomers 2003; Ireland 2004; Campbell et al. 2005(b)). The diversity can be seen
through several sources of income. A fisherman in Labuhan Bajo, for example, had
multiple gears depending on the type of fish as discussed in human assets. The villagers
in Blangmerang, Kayang and Marisa had approximately half hectare of arable farmland
that could be farmed during the wet season. The women in Blangmerang and Kayang
also produced handwoven textiles. All the women collected and peeled tamarind. The
women in Labuhan Bajo were very active in processing and selling the fish. Seaweed
cultivation was the major component of diversification in this area. Seaweed is the focus
of a more detailed later discussion in Chapter 6.
Migration
The third livelihood strategy is migration (McLennan and Smit 2006). There are several
reasons for villagers to migrate. First, a temporary relocation to a safer place is
undertaken to cope with major shocks such as earthquakes, volcanic eruptions and
conflicts. For example, Women and children in Kayang village moved to Kangge Island
when a conflict between Wolu and Kayang in July 2008. Migration also occurred when

Chapter 5. The livelihoods on Pantar Island _____________________________________________________________________________
216
there were fewer livelihood opportunities in Pantar. One example of temporary out-
migration was that villagers from Kayang and Marisa worked in a brick company on
Lembata Island during the low season in fishing, generally in September and October.
During the wet season, these people returned home to help their family with farming or
fish processing.
Many other examples of mobility were found. Ht (semi structured interviewed, 2009)
informed me that year he had gone tuna fishing in the Timor Sea and later sold the fish
in Atapupu, Timor Island. The divers of sea cucumbers had moved to find sea cucumber
around Lembata (generally during the wet season in January and February). For example,
trepang collectors from Blangmerang. This pattern follows the monsoon and fish season.
According to village leaders in Blangmerang 2008, approximately 50 men from
Blangmerang joined boats as crew to collect sea cucumbers at the Scott reef inside an
area known MOU Box (Stacey 2007; Visser and Adhuri 2010; Prescott et al 2013).
During the discussion with the men’s group in Blangmerang in 2008, almost all
participants admitted that they had travelled to this area at least once to participate in the
fishery. But in 2010, only a few said they remained interested in fishing in that area.
Several reasons prevented them from fishing more in that area. They were separated
from their families in Blangmerang and the risks were higher than the gains. However,
younger men were still tempted to go to Rote Island and fish south in the Timor Sea.
This form of migration was supported by existing social and economic networks
between Pantarese and communities on Rote Island. Similarly, people in Labuhan Bajo
and Kabir had fished along the reefs and shoals along Indonesian and Australian using
their own boats or as part of a predominantly Rotinese fishing crew.
Young men and women from Pantar also worked in Malaysia and Batam. The village
leader of Marisa village noted that 163 people (18% of the total population) worked in
eastern Malaysia in 2008. Meanwhile, the village leader in Kayang noted that 8% of the
total population worked in Malaysia. In Blangmerang, the village leader reported that
4% of the total population worked in Malaysia. No-one in Kabir was identified as
currently working in Malaysia. This out-migration of young people to Malaysia was

Chapter 5. The livelihoods on Pantar Island _____________________________________________________________________________
217
quite common in the NTT province and was recognised one of the origin areas for
migrant workers in Malaysia (Barlow and Gondowarsito 2008; Hugo 2005). According
to the village leader in Marisa, about half the migrant workers worked in the
construction industry and the rest worked for logging companies, plantations and
households in eastern Malaysia. During the discussion with a women’s group in Marisa
village in 2009, it was revealed that many married men who worked outside of the
village returned with a new wife and three to four children. This situation added to the
household size, labour force and also the family burden as the number of people to be
supported in a house increased. In early 2010, I observed that 14 people (men and
women) had returned home because of work permit problems in Malaysia.
Due to the lack employment opportunities locally, young people also travelled outside of
their villages to study. For example, in 2009 the village leader of Marisa noted that five
people from Marisa village studied in Makassar, Kalabahi (10 people), Kupang (50
people) and the Islamic boarding school in Java (50 people). Many students also studied
at senior high school in Kabir and Baranusa. In the four villages, schools had poor
standards (see the discussion on human assets). As a result, parents sent their children
out of the village for education, which incurred more expenses and also reduced the
amount of time and labour that could be allocated to production activities. This supports
the finding by Black et al. (2011) that economic, education and environment factors are
the drivers of migration.
All these livelihood strategies were taken by the coastal villagers if they saw
opportunities available, benefits, low costs and less risk. The coastal villagers adapted
with the monsoon and external environment over time, intensified the activity if the
benefit was above the cost, diversified the livelihood portfolio and migrated to find
opportunities. They mobilised all their assets to do a wide range of activities although
the capacity to do the activities varied depending on what assets they had and could gain
access to. In addition, savings for the future in the form of jewellery (as discussed in the
financial assets section) and social networks (as discussed in the social asset section)
were part of the strategy to cope with sudden shocks or to expand to new activities. The

Chapter 5. The livelihoods on Pantar Island _____________________________________________________________________________
218
coastal communities in these four villages felt these combinations of livelihood
strategies enabled them to survive on Pantar Island. The result of these strategies, that is,
the livelihood outcomes, is now discussed further.
5.6 Livelihood outcomes
Livelihood outcomes are the output or achievement from the livelihood strategies of the
communities. The livelihood outcomes are achieved through a combination of assets and
considering the enabling and hindering factors from the vulnerability situation and
structures and process. As discussed in Section 2.2.7, the discussion about livelihood
outcomes is limited to the current status of cash income, wellbeing and food. This
research did not look at any interventions to assess the changes in increased wellbeing,
reduced vulnerability, improved food security and more sustainable use of natural
resources. However, the changes are discussed further in Chapter 7 as part of the
consideration of the implications of restricted marine resource access.
5.6.1 Cash income
The amount of cash income varied in general. Different economic classes of people had
different cash incomes. The wealthy families had bigger incomes. Table 5.7 presents a
summary of the amount of cash income. This was based on the most common sources of
cash income in the village based on the focus group discussions conducted in 2009-2010.
Cash income was earned mainly from marine resources such as trade of fish captured,
trading and seaweed farming (focus group discussions). The marine products included
fish, seaweed, top shells, sea cucumber and the meat from other shells (turban shells,
mud creepers, oysters, clams, cockles, spider conch). Other sources of cash income were
from peeling tamarind, and work on other people’s lands (Table 5.7). Other sources of
cash income but not common were work in the nearest city, motorbike rental, selling
snacks or income from remittances.
The amount of money earned by the papalele (women traders) varied depending on the
fish season and type of fish (focus group discussions with women’s groups in 2009-

Chapter 5. The livelihoods on Pantar Island _____________________________________________________________________________
219
2010). In Kabir and Baranusa, from December to March when fish were abundant, the
earnings of papalele ranged from Rp100,000 to Rp150,000 or A$12.5-18.75 per day
(Table 5.7). The examples of calculation can be seen in Figure 5.16. From July to
November (low season) when there were less fish, the papalele could earn Rp25,000 -
Rp30,000 (A$3.12) per day. The earning was a result of selling several types of fish:
halfbeaks, reef fish and chopped bigger fish, such as trevally and Euthynnus affinis.

Chapter 5. The livelihoods on Pantar Island _____________________________________________________________________________
220
Table 5. 7: Most common source of cash income in the four villages from main livelihood activities
Kabir (Per transaction)
Blangmerang (Per transaction)
Kayang (Per transaction)
Marisa (Per transaction)
Source of cash
income
Season
Rupiah A$ Rupiah A$ Rupiah A$ Rupiah A$ December-March
100,000 -150,000
12.5 - 18.75 100,000 -150,000
12.5 - 18.75 barter 0 barter 0 Women traders selling fish July-
November 25,000-30,000
3.12-3.75 25,000-30,000
3.12-3.75 barter barter
December-March
75,000-150,000
9.4 – 18.75 75,000-150,000
9.4 – 18.75 75,000
9.4 60,000-75,000
7.5 – 9.4 Fish
July-November
30,000-300,000
3.75 – 37.5 30.000-300.000 Mostly nothing
0 60,000-75,000 7.5 – 9.4
60,000 7.5
December-March
0 0 35,000 4.37 35,000 4.37 0 0 As a labourer on other people’s land
July-November
0 0 0 0 0 0 0 0
December-March
3,200,000/season 400 3,200,000/season 400 3,200,000/season 400 3,200,000/season 400 Seaweed farming 2 harvests @200kg (Rp8000/kg)
July-November
0 0 0 0 0 0 0 0
December-March
0 0 0 0 0 0 0 0 Peeling tamarind
July-November
28,875
3.6 28,875
3.6 0 0 0 0
Note: A$1= Rp8.000,-. Information was collected from focus group discussions.

Chapter 5. The livelihoods on Pantar Island _____________________________________________________________________________
221
The earnings from catching fish (as fishers) also varied depending on the season. From
December to March, pelagic fish were the main target. The fishers from Blangmerang
and Labuhan Bajo brought home around Rp50,000-150,000 (A$6.25-18.75). Fishers
from Kayang or Marisa who fished in Rusa Island for 6 hours might get 60 fishes, salt
them and bring them home. The wives then brought the fish to barter at the market or
sold the fish to the village trader. This is explained further in Chapter 6 in relation to the
trading system.
The earnings from catching fish (as fishers) also varied depending on the season. From
December to March, pelagic fish were the main target. The fishers from Blangmerang
and Labuhan Bajo brought home around Rp50,000-150,000 (A$6.25-18.75). Fishers
from Kayang or Marisa who fished in Rusa Island for 6 hours might get 60 fishes, salt
Figure 5.16 Examples of earning calculation of papalele A papalele from Kabir
The earning calculation of papalele from selling 500 Hyporhamphus sp.
Costs:
- 500 Hyporhamphus sp (@ Rp 1,000 (Aus$ 0.12) per five fish) during high season of fish
(January to March)= Rp 500,000 (A$ 62.5)
- during low season of fish (Rp 5000 ($ 0.62) per five fish
- Salt Rp 40.000 (A$ 5) per sack that can be used four times for the same amount of fish.
Selling price:
Rp 8,000-10,000 (A$ 1- 1.25) for 5 fish during low season and Rp 5,000 (A$ 0.62) per 5-10
fish during high season
Earning: Rp 100,000 to Rp 150,000 or A$ 12.5 - 18.75 per day
A papalele in Kabir.
She bought Rp 75,000 (A$ 9.4) of a Thunnus albacares and then chopped into 20 pieces (3-5cm width).
The chopped fish were sold at Rp 5,000 (A$ 0.62) per piece. The profit was Rp 25.000 (Aus$ 3.2) per
fish.
A papalele from Blangmerang.
She bought round scad at Rp 100,000 (A$ 12.5) per two baskets. The fish were sold to the mountain
people with cost of transportation Rp 50,000/trip (A$ 6.25). She gained Rp 150,000 (A$ 18.75) through
these sales.

Chapter 5. The livelihoods on Pantar Island _____________________________________________________________________________
222
them and bring them home. The wives then brought the fish to barter at the market or
sold the fish to the village trader. This is explained further in Chapter 6 in relation to the
trading system.
During the low season of fishing (July to November), the price of fish was much higher.
For example, a blue barred fish was valued at Rp10,000/fish (A$1.25) during the high
season and Rp30,000 (A$3.75) per fish in the low season for the same size. Sometimes,
the fishermen didn’t get any fish. Thus, the women had to collect shells for family
consumption as well as to be sold. One fisher said that life as a fisherman was like
gambling. With 10 litres diesel, he could get nothing or Rp300,000-/trip (A$37.5).
Other cash income sources were from collecting seaweed which had become a main
source of cash income. On average, people harvested 200 kilograms at Rp8,000 (A$1)
per kg of sun-dried seaweed. During this season, the seaweed farmers earned
Rp3,200,000 or A$400. Meanwhile, the incomes from sea cucumbers and top shells
could not be predicted as a definite source of cash income (Chapter 6). The participants
in Blangmerang and Kayang said it was more difficult to collect top shells and sea
cucumber nowadays. If they found it, they would collect it.
Other sources of cash income were from working on other people’s land during the wet
season. In December, people who had land prepared their land for corn or bean farming.
Many young girls from Blangmerang and Kayang helped to prepare the land. They
received Rp35,000 (A$4.30) per preparation.
During the low fishing season, women in Labuhan Bajo and Blangmerang earned cash
income from collecting, processing and selling tamarind, at Rp28,875/per day (A$3.6).
The costs of collecting tamarind were only from the tamarind at Rp15,000 (A$1.80) per
sack and motorbike rent at Rp6,000 (A$0.75) per return trip. They normally collected
two sacks of tamarind. After two days, the peeled and seedless tamarinds were valued at
Rp93,750 (A$11.70) (@ Rp2500/kg). They earned Rp57,750 (A$7.20) for two days
work.

Chapter 5. The livelihoods on Pantar Island _____________________________________________________________________________
223
Another source of cash income was to work as a labourer in construction work. This
work was especially done by people from Kayang and Marisa. As a group, 20 people
made bricks in Lembata during dry season from April-July when less work was available
in their villages. In four months, one person earned Rp3,000,000 (A$375) on average or
equal with Rp750,000 (A$93.75) per month but this work was only occasional work.
This section shows that the communities engaged in several activities for source of
income (Table 5.7). This supports the argument by Ellis 2000 that rural communities
tend to engage in complex and multiple activities of income generation for its survival
strategies.
Remittance from emigrant workers
Remittance from emigrant workers (“TKI” in Indonesia abbreviations) was not regular
income but it contributed significantly to household incomes. Marisa village on Kangge
Island had the most emigrant workers, followed by Kayang and Baranusa. No Bajau
people worked as emigrant workers in Malaysia or Singapore. The workers sent around
Rp300,000-1,000,000 (A$37.5-125) each three months but irregularly. They also sent
supplies (e.g., plastic drums, soap, detergent and clothes) if someone returned to the
villages. A former emigrant worker said the reason why he rarely sent money home was
because most of the migrant workers were young and they spent the money. They sent
money home if someone else returned to the home village or near the Eid Fitri Islam
celebration after Ramadhan. Although the amount of emigrant remittance was small for
this area, it was one of source of income especially during the low season of fish and had
a positive impact on the economic growth in general (Adams and Page 2005; Yang
2008; Irving et al. 2010; Bayangos and Jansen 2011; Ziesemer 2012).
A household survey was also conducted in 2010 to assess the household cash income
(see also Chapter 2 Section 2.4.9). This survey supports the result of the income
assessment through focus group discussions. The survey results are summarised in Table
5.8. The result of the household survey (Appendix G) revealed that 63% of the
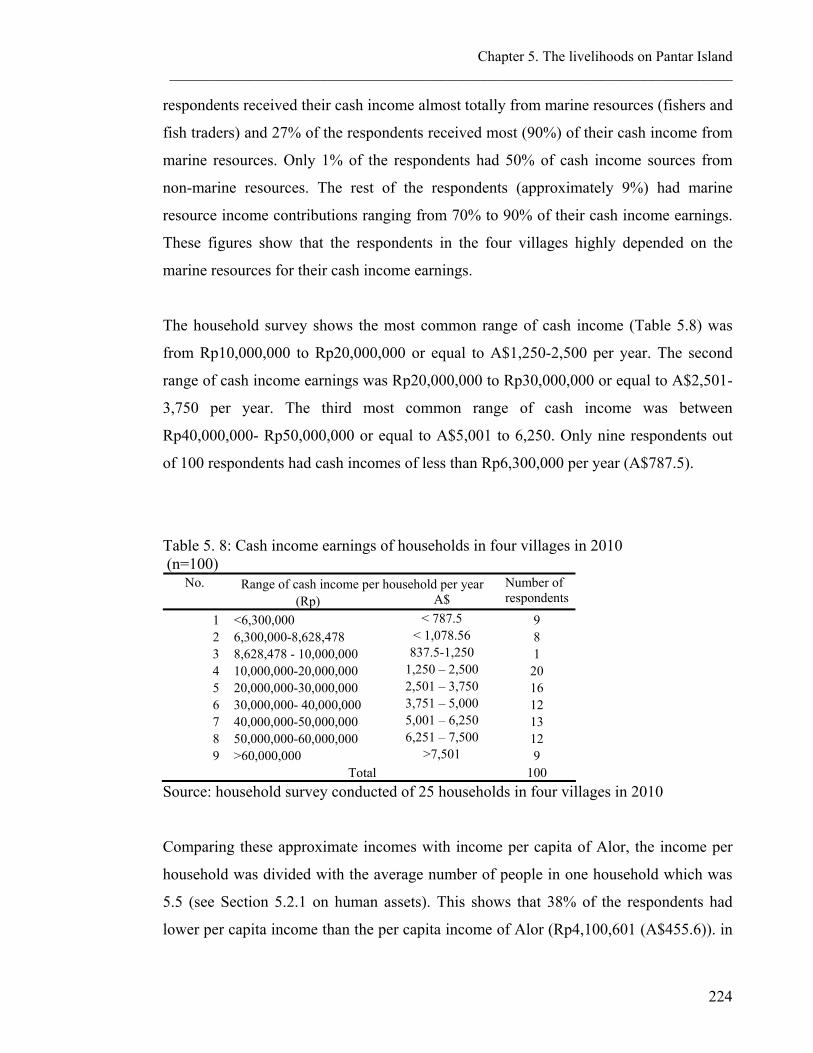
Chapter 5. The livelihoods on Pantar Island _____________________________________________________________________________
224
respondents received their cash income almost totally from marine resources (fishers and
fish traders) and 27% of the respondents received most (90%) of their cash income from
marine resources. Only 1% of the respondents had 50% of cash income sources from
non-marine resources. The rest of the respondents (approximately 9%) had marine
resource income contributions ranging from 70% to 90% of their cash income earnings.
These figures show that the respondents in the four villages highly depended on the
marine resources for their cash income earnings.
The household survey shows the most common range of cash income (Table 5.8) was
from Rp10,000,000 to Rp20,000,000 or equal to A$1,250-2,500 per year. The second
range of cash income earnings was Rp20,000,000 to Rp30,000,000 or equal to A$2,501-
3,750 per year. The third most common range of cash income was between
Rp40,000,000- Rp50,000,000 or equal to A$5,001 to 6,250. Only nine respondents out
of 100 respondents had cash incomes of less than Rp6,300,000 per year (A$787.5).
Table 5. 8: Cash income earnings of households in four villages in 2010 (n=100)
Range of cash income per household per year No.
(Rp) A$ Number of respondents
1 <6,300,000 < 787.5 9 2 6,300,000-8,628,478 < 1,078.56 8 3 8,628,478 - 10,000,000 837.5-1,250 1 4 10,000,000-20,000,000 1,250 – 2,500 20 5 20,000,000-30,000,000 2,501 – 3,750 16 6 30,000,000- 40,000,000 3,751 – 5,000 12 7 40,000,000-50,000,000 5,001 – 6,250 13 8 50,000,000-60,000,000 6,251 – 7,500 12 9 >60,000,000 >7,501 9
Total 100
Source: household survey conducted of 25 households in four villages in 2010
Comparing these approximate incomes with income per capita of Alor, the income per
household was divided with the average number of people in one household which was
5.5 (see Section 5.2.1 on human assets). This shows that 38% of the respondents had
lower per capita income than the per capita income of Alor (Rp4,100,601 (A$455.6)). in

Chapter 5. The livelihoods on Pantar Island _____________________________________________________________________________
225
2010 (see Section 3.1.4 regarding the macro economy of Alor). These incomes are also
lower than NTT province averaes (Rp5,521,420) (A$613.50) (BPS 2011). There were
62% of respondents’ households that had income above the per capita income of Alor.
5.6.2 Wellbeing
The villagers in Pantar had their own local values about ways to pursue better livelihood
outcomes which were subjective according to their perceptions, experience and
neighbour conditions (Griffin 1988; Ryff 1989; Ryan and Deci 2001; Diener 2005).
People were happy if they had more cash income for buying more foods, a better house
and furniture, and clothes. A house was one output that the villagers pursued in their
livelihoods. With the success of seaweed farming in 2007-2008, the villagers improved
the houses with cement walls and zinc corrugated roofs. Basic needs are important for
daily lives and for economic productivity which will be an investment to end poverty
(Healey 2006). Expenditures and the use of extra money were assessed as one way to
understand what Pantar people pursued in their lives.
Expenditures
The focus group discussions with women and men revealed three categories of
expenditure:
- Daily expenditures. These included primary necessities of the family members
such as food and fishing-related activities
- Monthly expenditures such as education, electricity.
- Yearly expenditures such as feasts, ceremonies (wedding, circumcisions and house
construction ceremonies), education, investments and saving. There were at least 3
to 5 big cultural ceremonies in each village per year.
Figure 5.17 presents the most common expenditures by households in the respective
villages (based on focus group discussions). These expenditures were the average
expenses of people in the villages without identifying the social-economic status such as
wealthier or poor families. In fact, the wealthier families might spend more than the
average family for cultural feasts or even daily consumption (Beard 2007; Rao 2001).

Chapter 5. The livelihoods on Pantar Island _____________________________________________________________________________
226
Labuhan Bajo Blangmerang Kayang Marisa (Rp) A$ (Rp) A$ (Rp) A$ (Rp) A$
Daily
Basic needs 7,421,667 928 6,752,500 844 8,881,667 1,110 11,458,080 1,432
children pocket money 1,825,000 228 1,825,000 228 1,825,000 228 1,825,000 228
Fishing related expenses
17,746,000 2,218 9,090,000 1,136 5,878,000 735 10,404,000 1,301
Monthly expenses
Education 120,000 15 120,000 15 300,000 38 300,000 38
Yearly
Customary Ceremonies
2,775,000 347 3,187,500 398 3,525,000 441 3,585,000 448
Eid Fitr (Islam Feast) 300,000 38 550,000 69 420,000 53 450,000 56
Electricity 180,000 23 240,000 30 180,000 23 180,000 23
Total 30,367,667 3,796 21,765,000 2,721 21,009,669 2,626 28,202,080 3,525
2431
42 416
8
9 6
58 4228 37
1017 19 14
0 1 1 11 1 1 1
-
10
20
30
40
50
60
70
80
90
100
Labuha
n Bajo
Blangm
erang
Kayan
g
Mari
sa
%
Electricity
Education
Customary + islam Ceremonies
Fishing related expenses
children pocket money
Basic needs
Figure 5.17: Annual principal expenditures of the four villages in Pantar Island (Source: focus group discussions in 2009-2010)
The data shows that annual household expenditure for people in each of the villages
ranged from Rp21,009, (AUD$) to Rp 30,367,667 (AUD$). The villagers in Labuhan
Bajo needed at least Rp30,367,667 (A$3,796) for annual daily living expenses,
education, and annual feasts. The villagers in Blangmerang required at least
Rp21,765,000 (A$2,721) annually, while the villagers in Kayang and Marisa villages

Chapter 5. The livelihoods on Pantar Island _____________________________________________________________________________
227
required at least Rp21,009,667 (A$2,626) and Rp28,202,080 (A$3,525) annually,
respectively.
The average expenditure for daily basic needs (such as rice, sugar, coffee, betel and palm
fruit, and kerosene) for the four villages was Rp8,628,478.83 (A$1,078.56) per year.
Kayang and Marisa villages had the biggest expenses from basic needs. This excluded
staple food for villagers in Blangmerang, Kayang and Marisa villages as their staple
food was corn which they obtained from their own land and barter. With reference to the
distribution of expenditure, the biggest expense was fishing-related activities in Labuhan
Bajau and Blangmerang villages. The participants of the focus group discussions in
Labuhan Bajo said they invested approximately 58% of the cash money in fishing-
related equipment and operational costs (Figure 5.17). The villagers in Blangmerang and
Marisa invested almost 40% of their expenses in fishing equipment (Figure 5.17).
Kayang villagers spent 28% of the total expenses to fishing-related activities. The reason
why Kayang villagers did not invest as much as the other villagers on marine-related
activities was because they only used the hand-line fishing method for which some of
the materials were cheaper and locally made.
A significant expense was also allocated to cultural ceremonies. Ten percent of the total
expenses were spent on cultural ceremonies in Labuhan Bajo, while the participants of
the focus group discussions in Marisa village spent 14% of their total expenses on
cultural ceremonies. Blangmerang and Kayang villagers spent 17% and 19% of total
expenditure on cultural ceremonies, respectively. In relation to ceremony expenses, one
village might conduct five traditional ceremonies per month and one big family group
(such as Panggorang family groups in Kayang and Marisa village) might have had at
least one big circumcision ceremony per year. The circumcision was a religious practice
but the ceremony and feasts followed by the circumcision were cultural events. If the
organiser was a neighbour then the villagers brought 2 kilograms of rice, 5 packets of
noodles, 5 eggs, wheat flour, coffee and sugar. If the organiser was blood-related, the
villagers had to bring at least one goat or cash equal to the price of a goat. The family
lineage within the Panggorang family whose family names were Magi, Laba, Gole or

Chapter 5. The livelihoods on Pantar Island _____________________________________________________________________________
228
Atolojo, for example, had to pledge Rp2,000,000 (A$250). These ceremonies were
normally conducted during the dry season (July-November).
In addition, parents also had to allocate pocket money for their children and significantly
contributed to the annual expenditures. The women participants of the focus group
discussion described that the children did not understand about money until this area
successfully harvested seaweed in 2007. Expenditure on education was low as primary
education was free unless the children travelled to another island to study.
In contrast with the incomes provided from the household survey, 17% of the
households from the total household survey (n=100) earned less (e.g. less than Rp
8,628,478 or A$1,078.56) than what was needed to cover costs of basic daily necessities
(Rp8,628,478 or A$1,078.56) per year) in the four villages. Meanwhile, with reference
to the World Bank poverty line standard (USD 2 per day or US$730 per year), all the
households according to the total households surveyed lived above the poverty line.
Use of extra money
Assessing the use of income that was surplus to cover the household needs is important
to understand how the Pantar people pursued their livelihoods. The patterns of the use of
extra money were almost the same in the four villages (based on the focus group
discussions). The men’s groups said they mostly invested any extra money into producer
goods such as fishing or seaweed farming equipment. The fishing families invested in
fishing equipment such as wooden boats and engines, fishing gear and more ropes for
seaweed. The men’s groups in Blangmerang and Labuhan Bajo described how proud
they felt to have a motorised boat or mid-water trawler. House renovations were the
second choice of the men’s groups.
The women’s group prioritised the use of extra money to stock more rice (normal daily
buying was 1 to 2 kg while they were able to buy 5 kg from the extra money), vegetables
as they rarely ate vegetables, clothes for their children, kitchen equipment and house
furniture. The women traders invested the extra money in buying more fish to be

Chapter 5. The livelihoods on Pantar Island _____________________________________________________________________________
229
processed and sold. Those who produced handwoven textiles bought more cotton threads
if they had extra money. The extra money was also used for buying jewellery and house
furniture. Mama Tina, a papalele in Labuhan Bajo Kabir, considered her income was
higher than her husband. She said that she was able to buy jewellery and saved money
for their kids because of her fish trade. She proudly said that in nine years she was able
to save money, fix their houses and buy several items of jewellery (4 rings, 2 bracelets
@ 20 grams, and 3 other jewels (15 grams, 5 grams and 3 grams)).
The group discussions in the four villagers also illustrated how they used the extra cash
income for buying entertainment devices (e.g., TV, parabolic satellite television antenna),
mobile phone and electricity generators. During discussions in Kayang and Marisa, the
participants regarded a power generator as one symbol of richness apart from being able
to conduct a customary ceremony without debt. The provisions of gifts for weddings or
circumcision ceremonies were also one of their driving forces to earn extra cash income.
Both the men’s and women’s groups invested in education as the last compared to other
expenses. Contrasting the expenditure on feast and education, the participants of the
focus group discussions prioritised feasts first and then education, although they were
proud to send their children to go to school.
5.6.3 Food
Provisions of food from livelihood activities were one of the main livelihood outcomes.
Detailed discussions on food and food security was not conducted as part of this study
(with the focus on income) and only some general observations can be made regarding
whether food security is a major issue in Pantar. According to the focus group
discussions eating meals three times a day were considered adequate. Ground corn meals
were the main staple food for the villagers in Blangmerang, Kayang and Marisa villages
(Figure 5.18). Rice sometimes was provided during special events, such as a wedding or
circumcision ceremony. The Bajau community ate rice as their staple food. Vegetables
were reported to be difficult to find in this area and were obtained mainly through barter.
People from some villages collected drumstick tree (Moringa oleifera) leaves for

Chapter 5. The livelihoods on Pantar Island _____________________________________________________________________________
230
household consumption. This was one of the few plants with edible leaves that grew in
this dry region. Other vegetables such as snake beans were harvested from their own
crops during the wet season. The consumption of animal protein, such as fish, was also
major food item consumed in all households.
Figure 5.18: Important foods for coastal communities Photo A: Jagung titi, a corn is fried without oil in stoneware and punched while it is still hot. Photo B: A process to make ground corn. Photo C: Cassava and banana are important foods for barter. Photo D: Marine products collected in the intertidal waters for household consumption.
5.7 Conclusion
This chapter uncovered the complexity of villagers lives on Pantar Island. The assets of
the coastal villagers in four villages were explored in order to understand how they
owned and accessed the assets as well as the interweaving of all the assets, the
vulnerability context, and the livelihood strategies and outcomes.

Chapter 5. The livelihoods on Pantar Island _____________________________________________________________________________
231
The exploration of assets indicated that the villagers in the four villages managed their
assets depending on the natural assets (marine resources). Marine resources were the
main focus of their activity. Knowledge and skills related to marine resources were
inherited from their parents and were part of their tradition and identity. In relation to
financial assets, marine-related activities were the major source of cash income and also
the biggest expense. Other patterns of livelihood strategies also depended on marine
resource such as the temporary out-migration which was based on fish season. The
coastal communities had the ability to mobilise their assets to cope with difficulties and
transform the assets into productive activity. The more benefits from marine resources,
the more investment in other assets was made.
A wide range of activities were undertaken by the coastal villagers to survive and to
cope in vulnerable conditions. The strategies were mainly affected by the monsoon. The
coastal villagers adapted with monsoonal cycles, were involved in multiple activities,
intensified the most benefit activities and emigrated to find opportunities. The coastal
communities had the flexibility to move from one livelihood to another depending on the
opportunities and benefits generated. Livelihood outcomes were achieved as a result of
the activities conducted. Daily foods were available but also some households earned
enough cash incomes to cover their daily expenses for basic needs, but other did not. In
the next Chapter, I turn to a detailed analysis of the trade in marine products, the role of
trade and training networks in the region and opportunities for improving the livelihoods
of people on Pantar.

Chapter 6
Marine Product Value Chains
Men and women are attaching seaweed to the line on Lapang Island

Chapter 6. Marine Product Value Chains _______________________________________________________________________
232
Chapter 6: Marine Product Value Chains
In Chapter 5, the high dependency of Pantar Island’s coastal communities on marine
resources was examined. Understanding how the market operates and identifying the
interventions that can enhance the position and participation of local communities along
the value chain is one approach to improving their livelihoods through income and other
benefits (Mitchell et al. 2011; Loc et al. 2010; M4P 2008). Conducting a value chain
analysis (VCA) could help in assessing the barriers to market entry which typically
include “weak bargaining power and poor marketing strategies, monopolies among
traders, poor product-holding infrastructure, difficulties meeting quality standards and
lack of market information” (Jacinto and Pomeroy 2011). The VCA can also assist to
lowering risks, and therefore better integrate the communities into the market and
upgrade the products sold (Jacinto and Pomeroy 2011; M4P 2008).
The VCA maps how a product is produced and transferred, including identifying the
activities conducted to bring the product to market and mapping the actors, their
relationships and the values transferred along the chain (Kaplinsky and Morris 2001). In
the study area, the relationships and roles of market actors (e.g., traders, bosses or
middlemen) significantly influence the local fishers’ livelihoods and earnings. A lead
actor can control the price of a product and also affect how benefits are distributed
among the actors along the chain (Grunert et al. 2005; Ribot 2005). Conducting a value
chain analysis is one way to identify the lead actors and the linkages between the actors
(M4P 2008). This helps understand the constraints faced by coastal communities in
earning a living, examining the solutions and options for upgrading in order to increase
the value of products which, in turn, can increase benefits and reduce risks (Giuliani et al.
2005; Loc et al 2010; Mitchell et al. 2011).
This chapter examines the role of local and international markets in the local livelihoods
on Pantar Island and explores the value chains of selected marine products harvested by

Chapter 6. Marine Product Value Chains _______________________________________________________________________
233
local producers. The main research question guiding the analysis (as set out in Chapter
1) is: How are communities involved in the barter and commercial marketing of key
marine resources? Two subsidiary questions are addressed: What is the value chain for
key marine products? Are there ways to improve the participation of coastal
communities in the value chain?
This chapter is divided into two sections. The first section explores the core processes of
four types of marine products, namely, fish, sea cucumber, top shells, and seaweed.
These products were selected for analysis through the focus group discussions because
they were the most harvested and contributed significantly to household income in the
study area. In addition, the focus group participants believed these products were
marketable.
The six core processes in the value chain are the input, production, collection,
intermediary trade, wholesale and retail marketing, and consumption (M4P 2008). In the
value chain analysis, the various activities involved in every stage are examined. The
activities can range from receiving and processing to transporting and selling products.
Inputs are needed for production. In the study area, for example, fishers catch or harvest
products and transport them to landing sites, where they are either sold directly to traders
or processed for later sale or barter. The products can also be further on sold by
intermediary traders and processed further (e.g., freezing, sun-dried, salted or filleted) to
produce a different product. This is often referred to as value adding. Finally, the
products in a chain are resold or distributed to retailer(s) before being bought and
consumed by customers (Hempel 2010).
As part of the value chain analysis reported in the first section, the actors in each of the
product value chains and the relationships between the actors are explored. The
examination of powerful actors helps in identifying who controls the market for products
and the barriers to entry (Kaplinsky and Morris 2001; De Haan 2012; Hall et al. 2013).
The lead actors sometimes affect how the price is set. This part of the discussion
considers the price and how the price is established. The price reflects the value adding
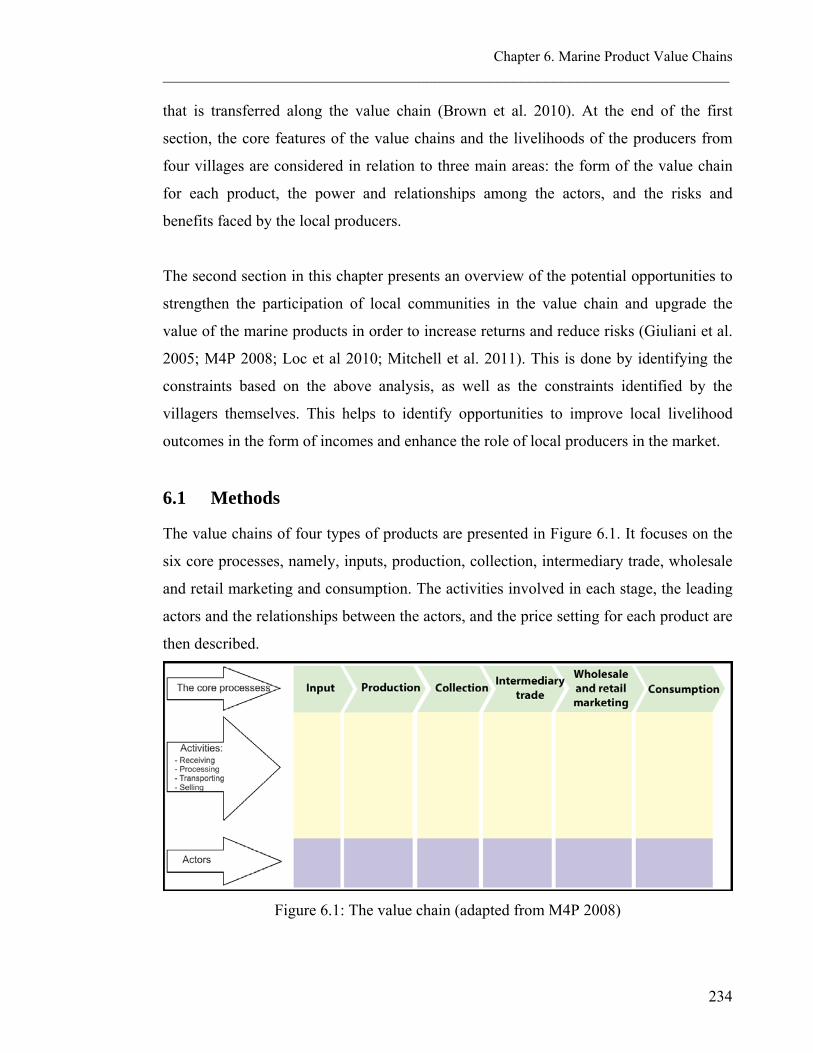
Chapter 6. Marine Product Value Chains _______________________________________________________________________
234
that is transferred along the value chain (Brown et al. 2010). At the end of the first
section, the core features of the value chains and the livelihoods of the producers from
four villages are considered in relation to three main areas: the form of the value chain
for each product, the power and relationships among the actors, and the risks and
benefits faced by the local producers.
The second section in this chapter presents an overview of the potential opportunities to
strengthen the participation of local communities in the value chain and upgrade the
value of the marine products in order to increase returns and reduce risks (Giuliani et al.
2005; M4P 2008; Loc et al 2010; Mitchell et al. 2011). This is done by identifying the
constraints based on the above analysis, as well as the constraints identified by the
villagers themselves. This helps to identify opportunities to improve local livelihood
outcomes in the form of incomes and enhance the role of local producers in the market.
6.1 Methods
The value chains of four types of products are presented in Figure 6.1. It focuses on the
six core processes, namely, inputs, production, collection, intermediary trade, wholesale
and retail marketing and consumption. The activities involved in each stage, the leading
actors and the relationships between the actors, and the price setting for each product are
then described.
Figure 6.1: The value chain (adapted from M4P 2008)

Chapter 6. Marine Product Value Chains _______________________________________________________________________
235
As mentioned above, the four products selected for the VCA were fish, seaweed, sea
cucumbers and top shells. They were identified in the focus group discussions, were
commonly harvested and contributed significantly to household income; in addition, the
focus group participants believed the products were marketable. The discussion in the
focus groups included type of product traded, the availability, popularity and demand for
the product, and the vulnerability of the product.
The information presented in this chapter is based on 94 semi-structured interviews (see
also Chapter 2, Section 2.4 and Table 2.9) and focus group discussions with producers
and other stakeholders including:
Fishers
Village traders – traders who lived in the villages, namely, the papelele and kiosk
owners (who also acted as input suppliers for some value chains)
Bulk collectors – traders who bought in large quantities from village traders
Intermediary traders who had inter-island trading links to Ambon, Kupang (West
Timor), Lembata and Kalabahi (Alor)
Retailers – sellers who mostly sold sun-dried fish at the local markets
National-level traders in Jakarta and Surabaya (Java), Makassar (South Sulawesi),
and Bali
Industry players, namely, the managers and staff of two seaweed factories in
Surabaya (Java) and Makassar (South Sulawesi) and two shipping companies
based in Makassar (South Sulawesi)
Exporters who exported marine products to other countries (the exporters were
mostly based in Makassar, Surabaya, Atambua and Jakarta)
International traders from China
Policy-makers related to the value chain; for seaweed, this involved discussions
with staff from Badan Penerapan dan Pengkajian Teknologi/BPPT (the Agency
for Assessment and Application of Technology in Indonesia), and for all
products, it involved discussions with staff from the Ministry of Fisheries and
Marine Affairs.

Chapter 6. Marine Product Value Chains _______________________________________________________________________
236
The results of the findings from the qualitative data are analysed by classifying the data
by themes and studying the interrelations among the key attributes in the chain including
product description, activities, actors, relationships between actors, and prices.
6.2 Value Chains of Marine Products
A wide range of marine products was harvested by the people in the four villages,
including several types of pelagic and demersal fish, molluscs, sea urchins, sea
cucumbers and seaweed. Among the wide variety of marine products harvested, the
communities (during focus group discussions) identified several species of fish, seaweed,
sea cucumber and top shells as the products which they considered to be important to
their livelihoods. This was based on two main factors: 1) the regular availability of these
products (i.e., regardless the season); and 2) the contribution of these products to cash
and non-cash income for the majority of households (see also Chapter 5, Section 5.2.6
for a discussion of the communities’ perceptions of the selected marine products).
6.2.1 Fish product value chain
Several species of demersal and pelagic fish were harvested by all four villages in Pantar.
A summary of the main species fished and traded at the local markets is presented in
Table 6.1.

Chapter 6. Marine Product Value Chains _______________________________________________________________________
237
Table 6.1: Main species fished and traded in Pantar
Home village of fishers English Scientific name
Local name Labuhan Bajo
Blangmerang Kayang Marisa
Halfbeaks Hyporhamphus dussumieri
Lember (A) Tempae (S)
√ √ x √
Round scad Decapterus sp Belo-belo (A) √ √ √ √ Coral trout Cephalopholis
spp Wehung (A) √ √ √ √
Parrotfish Scarus spp Kalawok (A) √ √ √ √ Red snapper Lutjanus spp Kamea (A) √ √ √ √ Eastern little tuna
Euthynnus affinis
Tongkol (A) Turinga (S)
√ √ √ √
Skipjack tuna
Katsuwonus pelamis
Cakalang (A) √ √ √ √
Trevally Caranx spp Kue (A) √ √ √ √ Note: A=Alor language, S=Sama Bajau language (where available), v=yes it was caught by fishers, x=it was not caught. Although halfbeaks were not caught by fishers from Kayang, local traders in Kayang also sold this at local market as they bought the halfbeaks from neighbouring fishers.
Among the several species traded, there were common characteristics regarding how the
fish were transferred along the value chain from producers to end consumers. These
common characteristics include the types of input to fishers (such as fishing equipment,
petrol for engines, cigarette, coffee, sugar and petromax light), the gear used to capture
the fish, the methods of collection by village traders (papalele and kiosk owners), the
way intermediary trade was conducted at the village level (which included bulk
collectors), the export activities and the sale of the products by retailers at the market
(Figure 6.2).
Halfbeak value chain
The value chain of halfbeak production in the three villages of Blangmerang, Labuan
Bajo and Marisa is the same (Figure 6.2). Inputs were provided by kiosk owners in the
villages and by kiosk owners in Kalabahi (the nearest town). Fishers from Blangmerang,
Labuhan Bajo and Marisa caught halfbeaks all year but the fish were considered most
abundant during the west monsoon period between January and March. Halfbeaks were
not caught by fishers from Kayang, however local traders in Kayang also sold this at
local market as they bought the halfbeaks from neighbouring fishers. The fishers sold

Chapter 6. Marine Product Value Chains _______________________________________________________________________
238
most of this fish to the papelele and sold some back to the kiosk owners at the collection
stage.
Figure 6.2: Value chain of halfbeak production in four villages in Pantar Source: FGD, semi structured interview with key informants.
The village traders (papalele or kiosk owners) then decided whether the fish would be
sold fresh (chilled) or salted and dried, depending on the availability of ice and salt. At
the selling (intermediary) stage, the papalele sorted the fish according to size, and stored
the fish in baskets near their house or at the selling point. The fresh fish might be sold
door to door on foot or by motorbike, or by the roadside in the home village of the
papalele (such as in Labuhan Bajo), or brought to the nearest market. The sun-dried fish
would be transported by rented motorbike by the papalele to be sold to the nearest
markets or to more distant markets such as the Wolu, Weiriang or Bakalang markets by
a regular wooden boat (kapal motor). At the markets, the fish would be sold by the kiosk
owners or papalele to the end consumers, namely, local Pantarese including people from
the mountain villages.
Village traders sometimes sold sun-dried fish to bulk collectors who were from Alor
Kecil, Kalabahi and Atambua, in Timor Island (Figure 6.2). One fisher from Labuhan
Bajo (Bh, lempara owner; interviewed in 2009) said he salted and sun-dried halfbeaks,
transported the fish to Atapupu and sold the fish directly to a Chinese-Indonesian trader

Chapter 6. Marine Product Value Chains _______________________________________________________________________
239
in Atapupu. The bulk buyers sorted the fish and distributed the sun-dried fish to sellers
in their local markets. The trader in Atambua was also an exporter. He exported the sun-
dried fish to Dili, Timor Leste. According to Bh, a bulk buyer from Labuhan Bajo, this
exporter exported several commodities to Dili. The consumers, either in Kalabahi, Dili
or Atambua, bought fish from retailers in the market.
Another bulk buyer from Atapupu came with a boat to Baranusa port and bought fresh
halfbeaks (and round scad) caught by fishers from Labuhan Bajo, Air Mama and
Blangmerang Villages. I saw this boat anchored in Baranusa in 2009 and 2010 and the
owner buying fish from fishers. The papalele were annoyed if a fisher sold directly to
bulk buyers as this impacted on their livelihoods.
Round scad
The value chain for round scad is shown in Figure 6.3. Inputs were sold by kiosk owners
in the village or in Kalabahi or Weiriang. At the production stage, fishers commenced
the activities by preparing the fishing equipment such as boats, logistics and gear. The
fishers travelled to and from the fishing grounds to catch fish. Having caught the fish,
the fishers transported the fish to the landing site. In order to sell at the right time, a
fisher who used a dugout canoe would sometimes ask the other fishers who used motor
boats to bring the fish to his wife at the landing spot. Then the fisher’s wife sold the fish
directly at the market or sold to the papalele.

Chapter 6. Marine Product Value Chains _______________________________________________________________________
240
Figure 6.3: Value chain of round scad from four villages in Pantar Source: FGD, semi structured interview with key informants.
Village traders bargained the price with fishers and then collected the fish from the boat.
The fish were then processed by the papalele depending on the availability of ice and
salt, and the timing of the market day. For example, fifty belo-belo would need four
blocks of ice (30cm length and 12cm width) or approximately five kilograms of salt
(one-fifth of a 25kg salt sack @A$5/sack). If ice or salt was not available, then the
papalele and kiosk owners hung the fish by the tail on racks to dry it. According to MT,
one of the female papalele (semi-structured interview in 2009), this technique allowed
the water and blood to drip through the fish head.
The fish were transported to the markets (Weiriang, Kalabahi, Lamallu and Bakalang
markets) from landing sites in the villages using wooden boats that sailed regularly on
market days or by using rented motor bikes. In the markets, the village trader sold the
chilled or sun-dried fish to bulk collectors who were mostly from Kalabahi in Alor or
Weiriang in Lembata Island. In some cases, the bulk collector from Alor bought in
Bakalang market and then distributed their fish to retailers in Kalabahi market.
Consumers could buy the fish from fishers directly or from village traders or retailers in
the market.

Chapter 6. Marine Product Value Chains _______________________________________________________________________
241
Coral trout, parrot fish and red snapper value chain
The production of coral trout, parrot fish and red snapper all followed a similar value
chain in Pantar. Therefore, the production of these fish is presented in one value chain
even though they are different species (Figure 6.4).
Figure 6.4: The value chain of coral trout, parrotfish and red snapper from four villages in Pantar
Source: FGD, semi structured interview with key informants.
The input suppliers were the kiosk owners in the four villages or in Kalabahi or
Weiriang in Lembata Island. The majority of fishers who caught these three species were
fishers from Kayang and Marisa, although some fishers from Labuhan Bajo Hamlet and
Blangmerang did target these fish but to a lesser extent (Chapter 5). When the day of the
fish catch matched market day, the fishers landed near the market and sold directly to the
consumers or papalele at local markets. If not, the fishers from Marisa and Kayang
landed the fish in their villages and their relatives sliced and sun-dried the fish to be sold
to kiosk owners.
Chapter 6. Marine Product Value Chains _______________________________________________________________________
242
The moisture content of the sun-dried fish was an important consideration in price. If the
kiosk owners considered the moisture content to be still high, they would sun-dry the
fish themselves to get better moisture content. The kiosk owners stored the fish until
market day or until they had sufficient quantity to take the fish to the market. During the
market day, the kiosk owners transported the fish to distant markets (at Weiriang and
Wolu markets) for cash and barter, or to the Kalabahi market in Alor where the fish were
sold. The arrangement between the fishers and kiosk owners allowed fishing families to
borrow money and goods from the kiosks. The kiosk owners normally brought the sun-
dried fish to Kalabahi or Weiriang market in Lembata Island at the same time as when
they purchased new stock for the kiosk.
The fishers also sold the fish directly to the bulk buyers from Kupang, Makassar (South
Sulawesi) and Atapupu in West Timor who visited Pantar Island with their own boats
equipped with ice for storing fish. For example, in 2009 a trader from Kupang bought
fresh fish directly from fishermen in Marisa village, stored the fish in a tank full of ice,
processed the fish into fillets in Kupang and then sold the fish to another bulk buyer. The
next bulk buyer then processed fillets into 300-400 gram packets in 10 kilogram lots in
Surabaya and exported the product to destination countries. This bulk buyer from
Kupang also acted as an exporter as well as a bulk buyer and processor.
Eastern little tuna, skipjack tuna and trevally
The production of eastern little tuna, skipjack tuna and trevally had a similar value chain
in Pantar. Therefore, the production of these fish is presented in one value chain as
illustrated in Figure 6.5.

Chapter 6. Marine Product Value Chains _______________________________________________________________________
243
Figure 6.5: Value chain of eastern little tuna, skipjack tuna and trevally Source: FGD, semi structured interview with key informants.
The input suppliers in this value chain were the kiosk owners in the village or in
Kalabahi or Weiriang who sold fishing equipment. At the production stage, the fishers
prepared the fishing equipment, and travelled to and from the fishing spots to fish. The
fish was sold to papalele who decided how to sell these fish depending on the season
and ice availability. The giant trevally, for example, was sliced and sold to the
consumers in the market in the village (Figure 6.6).

Chapter 6. Marine Product Value Chains _______________________________________________________________________
244
Figure 6.6: A papalele from Labuhan Bajo is slicing the fish in order to add value at Kabir market
Photo A: Slicing giant trevally into several cuts. Photo B: A woman is measuring the size of each cut by using her thumb. Photo C: Epinephelus polyphekadion (a slow growing grouper) is cut into pieces. Photo D: Slicing fish ready to be sold.
These large fish could also be smoked. In Labuhan Bajo, one papalele smoked fish by
placing a smoking unit (for this purpose, a drum previously used for asphalting was cut
in half and metal grids were placed on the top) by the roadside (Figure 6.7). Meanwhile,
in Blangmerang, the papalele prepared the smoked fish at home. They used their
traditional stove (made of bricks, with metal grids placed on the top of the bricks). The
papalele sold the smoked fish at the seaport on market days in Baranusa or on the day
when a boat to Kalabahi was about to depart.

Chapter 6. Marine Product Value Chains _______________________________________________________________________
245
Figure 6.7: Selling smoked and fresh fish by the road in Labuhan Bajo Hamlet
The fishers also sold these three species of fish to bulk buyers from Kupang and
Kalabahi, Makassar and Surabaya whose boats were equipped with ice for storing the
fish (shown in the value chain diagram in the processing stage; Figure 6.5). One buyer
from Kupang anchored a boat in Marisa and Kabir for a week in February 2010. He
bought pelagic fish (especially tuna, skipjack and mackerel). Similar to the chain for
coral trout, parrotfish and red snapper, this buyer brought the fish to Surabaya to be
processed as fillets or canned fish. Then, the processed fish were distributed to shops and
sellers before it reached the end consumers.
Summary of processing and trade for fish products
Table 6.2 presents a summary of the fish species harvested and traded from Pantar and
the four ways they were sold, namely, locally on Pantar (in the villages or outside the
villages but still on the island), locally in the region (on nearby islands) or for
international consumption. Halfbeaks were sold as fresh fish but mostly sun-dried (Table
6.2). Round scad were sold mostly fresh or chilled. During the discussions with the
papalele in Labuhan Bajo, the participants indicated they preferred to sell fresh scad
quickly because this species tends to decay quickly. Sun-dried scad were not a popular
product as the flesh was easily damaged during the sun-drying process. Consequently,

Chapter 6. Marine Product Value Chains _______________________________________________________________________
246
not many buyers liked the sun-dried meat of scads. Coral trout, parrot fish and red
snapper were sold fresh, chilled with ice or sun-dried depending on market days and the
availability of inputs (such as ice, salt and firewood). At the local markets, these fish
were sun-dried by slicing the fish into two pieces and sun-drying the pieces for one day
(Figure 6.8 B and C). Villagers from Kayang and Marisa sold sun-dried and fresh fish,
while villagers from Blangmerang and Labuhan Bajo sold only fresh fish at the local
market. Chilled red snapper were also sold to buyers from Kupang and Makassar.
The sun-dried fish from Kayang and Marisa were highly valued among traders in
Kalabahi because of their high quality. At Bakalang market on Pantar Island, the
mountain people also preferred sun-dried fish from the Bajau papalele because of its
cleanliness and quality processing.
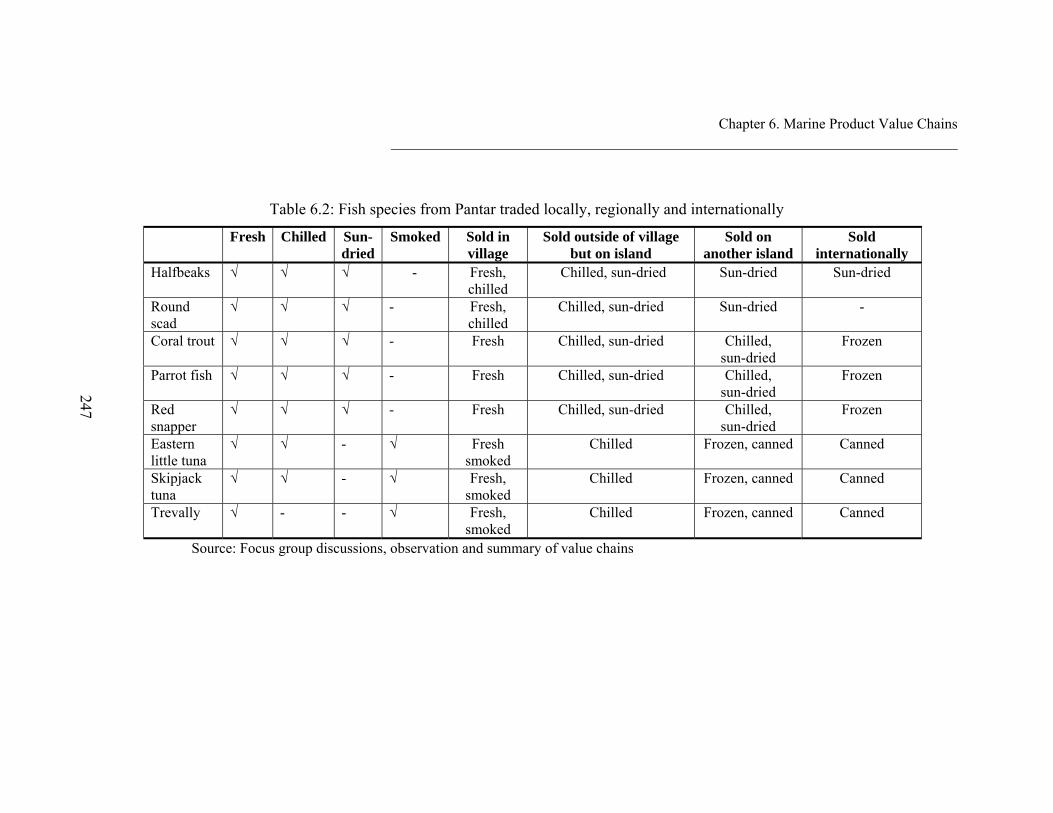
Chapter 6. Marine Product Value Chains _______________________________________________________________________
247
Table 6.2: Fish species from Pantar traded locally, regionally and internationally
Fresh Chilled Sun-dried
Smoked Sold in village
Sold outside of village but on island
Sold on another island
Sold internationally
Halfbeaks √ √ √ - Fresh, chilled
Chilled, sun-dried Sun-dried Sun-dried
Round scad
√ √ √ - Fresh, chilled
Chilled, sun-dried Sun-dried -
Coral trout √ √ √ - Fresh Chilled, sun-dried Chilled, sun-dried
Frozen
Parrot fish √ √ √ - Fresh Chilled, sun-dried Chilled, sun-dried
Frozen
Red snapper
√ √ √ - Fresh Chilled, sun-dried Chilled, sun-dried
Frozen
Eastern little tuna
√ √ - √ Fresh smoked
Chilled Frozen, canned Canned
Skipjack tuna
√ √ - √ Fresh, smoked
Chilled Frozen, canned Canned
Trevally √ - - √ Fresh, smoked
Chilled Frozen, canned Canned
Source: Focus group discussions, observation and summary of value chains

Chapter 6. Marine Product Value Chains _______________________________________________________________________
248
Figure 6.8: Sun-dried and smoked fish Photo A: Two women in Labuhan Bajo Hamlet are turning the round scad fish so the fish will dry properly. Photo B: Another method of sun-drying fish in Marisa Village. Photo C: Sun-dried fish at the market. Photos D and E: Smoked fish at Baranusa market.

Chapter 6. Marine Product Value Chains _______________________________________________________________________
249
Fish markets
The value chains of the fish production show the variation and extent of the local and
regional trade routes and destinations. Figure 6.9 shows the locations of the markets
where fish products were sold in Pantar and the weekly schedule of the market days on
which they were sold.
Figure 6.9: Locations of markets and route of fish products in and out of Pantar Island Note: The fish could be sold at the producer’s home village or at the market depending on the volume and the market day schedule. The relative sizes of the round shapes show the number of sellers, and the schedules of weekly markets around Pantar Island indicate when the markets are held. Note: M=Monday, Tu=Tuesday; W=Wednesday; Th=Thursday; Sa=Saturday, Su=Sunday. The information regarding the number of sellers was based on the observation carried out in this study. There were several popular markets in Pantar. One of the popular markets was the
market in Weiriang, Lembata Island (Figure 6.9). The village traders from Labuhan Bajo
sailed to Weiriang market using regular wooden boats for six hours, the village traders
from Blangmerang sailed in four hours, and the village traders from Marisa and Kayang
sailed in two and half hours. The village traders from Labuhan Bajo also had preferred
markets in Bakalang and Lamallu in which to sell the chilled or sun-dried fish. Some
papalele in Labuhan Bajo avoided the Bakalang market because of the poorly asphalted
roads, although potential buyers from Alor Island attended that market. However, if one
papalele had more than three baskets (@ 20kg), for example, she sold at Bakalang
market as there were more buyers offering higher prices there.

Chapter 6. Marine Product Value Chains _______________________________________________________________________
250
Another marketplace was Waewerang on Lembata Island where traders from Lembata
and Flores met (Figure 6.9). Around ten village traders from Marisa Village sometimes
sold their sun-dried fish in Atadei and Waewerang. They sailed using a rented motor
boat, arrived in Atadei on Sunday morning, then continued the trip to Waewerang, and
returned to Marisa on Sunday evening.
Key actors
Different actors were involved in every stage of the fish production value chain. At the
beginning of the value chain in Pantar, kiosk owners played an important role by
providing inputs for the producers to harvest the fish. The fishers bought fishing
equipment such as hooks and lanterns by cash in the village or in Kalabahi or Weiriang.
If the equipment (e.g., nets) was considered expensive by the fishers, the kiosk owners in
the village sometimes provided the equipment by credit. At the production stage, men
and women acted as producers (Chapter 5). The fishers worked by themselves or as the
crew for halfbeak mid-water trawlers.
At the collection stage, village traders such as kiosk owners and papalele played an
important role (Figure 6.10). The number of papalele in Blangmerang was around 40 (in
2009) while almost all the women in Labuhan Bajo Hamlet were papalele
(approximately 100 women). Village traders in Kayang and Marisa were mostly kiosk
owners (three women and two men in Kayang and ten women kiosk owners in Marisa).
The roles of the kiosk owners were providing inputs, sometimes supplying the daily
needs of the fishing families, and buying sun-dried fish in Kayang and Marisa Villages.
At the intermediary trade stage, bulk buyers from Labuhan Bajo bought from several
village traders and then transported and distributed the fish to retailers in Kalabahi, Alor
or in Atapupu, West Timor. The buyer in Atapupu exported the sun-dried halfbeaks to
Dili. For coral trout, parrotfish and red snapper, there were processors in Kupang who
processed fillets and canned fish. They also acted as exporters. Thus, the importers in the
destination country distributed the fillet and canned fish to retailers who then sold the
fish to consumers.

Chapter 6. Marine Product Value Chains _______________________________________________________________________
251
New players in the supply chain emerged in 2010 when traders from Kupang, Makassar
and Atapupu began to come to Pantar Island with their own boats equipped with ice for
storing the fresh fish.
Figure 6.10: Papalele
Photo A: The fishermen come with boats and the papalele collect the fish. Photo B: Bajau traders negotiate with fish owners. Photo C: A papalele in front of her house in Blangmerang. Photo D: Papalele selling fish at Weiriang market. Photo E: Consumers waiting for the filleted fish.
Chapter 6. Marine Product Value Chains _______________________________________________________________________
252
Relationship between actors for fish products
There were no written agreements shaping the business relationships between the
various actors along the chain. The relationship between the papalele and fishers was
based on the type and quality of fish traded among them. The fishers could sell the fish
to any papalele. If the papalele considered that the price from the fishers was too high,
they bargained to get a better price. The papalele then paid the fish owner after all the
products were sold out. The fishers preferred selling their fish to papalele instead of
selling directly to consumers because it meant the fishers did not have to worry about
whether their fish would be bought by the customers in the market.
Other forms of trade relationships were based on trust and personal connections. One
example was the relationship between the kiosk owners as village traders and producers.
The kiosk owners knew the fisher families and vice versa. The kiosk owners provided
supplies and lent cash to the producers, sometimes for daily needs or in emergencies,
and fully trusted that the fishers would sell the fish to them. The relationship between the
fishers and kiosk owners made the fishing activity accessible to all the villagers in Pantar
(see the discussion on financial assets in Chapter 5). If the producers did not have fishing
nets, they could credit those inputs from a kiosk. One fisher I interviewed in Kayang
(January 2010), said that he obtained a cast net on credit from a local trader. The value
of this cast net was Rp200,000 per set (A$25), while the price in Kalabahi was
Rp150,000 per set (A$18.75). This was a good price for him because he didn’t have to
pay additional costs such as the costs for travelling to the nearest city to buy fishing
equipment. He paid in credit or later sold the catch to the kiosk owners.
Price setting
The fish were bartered or sold by cash. The prices of the fish products were determined
in several ways, depending on the products. The details of the price setting are discussed
here.

Chapter 6. Marine Product Value Chains _______________________________________________________________________
253
Barter
The fishers or the papalele bartered directly with the mountain people on Pantar Island
(Figure 6.12). The fish could be exchanged for fruit, vegetables or rice. The prices of the
fish were based on the size and type of the fish. For example, in Weiriang market, three
red snapper sized 20 cm in circumference (in local terms, the size of an adult hand)
would be equivalent of one bunch of bananas. However, there were no fixed rules. The
normal barter process for the mountain people at the markets was to put a bunch of
bananas or a small plate of peanuts down and ask for five sun-dried reef fish (Figure
6.11). This started the bargaining process, which continued until consensus was reached.
Figure 6.11: Barter process – the fish are put on the top of the peanuts and then the barter negotiations start at Weiriang market
Sale for cash
The papalele and kiosk owners normally set the price of fish purchased from fishers
based on the volume of the fish captured and the sizes of the fresh fish. Different prices
were applied for the different quality sun-dried fish (i.e., based on moisture content).
Table 6.3 presents the selling price differences between the fishers and papalele for fish.

Chapter 6. Marine Product Value Chains _______________________________________________________________________
254
The papalele sold fish to other sellers or end-consumers at double the price regardless of
the mode of transportation they used (Table 6.3). This helped to pay for the inputs that
were necessary to process the fish (e.g., salt, ice) and the cost of transportation to the
market. There were no price differences between one papalele and another in the four
villages.
Table 6.3: Average selling price for fresh fish at village level in Pantar in 2009
(fishers and papalele)
Fresh fish Fishers sell to papalele Papalele sell to end consumers or bulk collectors
Halfbeaks in Labuhan Bajo and Baranusa (low catch of
fishing season)
Rp5000/10 fishes (A$0.625)
Rp10,000/10 fish (A$1.25)
Halfbeaks in Labuhan Bajo (west monsoon)
Rp1000/6 fish (A$0.125)
Rp5000/12 fish (A$0.625)
Round scad in Marisa Village 25 cm in length
Rp10,000/15 fish (A$1.25)
-
Round scad in Labuhan Bajo, Marisa and Kayang Villages
Rp1000/4 fish (A$ 0.125)
Rp5000/8 fish (A$0.625)
Coral trout in Labuhan Bajo 35 cm at length
Rp10,000/fish (A$2.50)
Rp15,000-20,000/fish (A$1.875-2.50)
Source: Focus group discussions in 4 villages
The papalele considered it was more profitable to sell fish on Pantar Island rather than
selling at distant markets such as Kalabahi on Alor Island. For example, the selling price
of halfbeaks (in Labuhan Bajo and Blangmerang) was Rp1,000,000 (A$125.00) per five
baskets (@ 40kg per basket), while the selling price to a bulk collector in Kalabahi
would be Rp900,000 (A$112.5). However, the papalele had to sell in Kalabahi or further
away at other markets if the landed fish was abundant. The selling price in Kalabahi was
lower than in Pantar because the papalele were not able to bargain with the bulk buyers.
The bulk buyers in Kalabahi exploited the fact that the Pantar traders did not like stay
long in Kalabahi; neither did they like to return home with the fish. Therefore, the bulk
collectors in Kalabahi set the price as low as possible. One trader from Labuhan Bajo
(Bh, semi structured interview in 2009) reported the experience of bulk buyers in
Kalabahi exploiting him and bargaining a low price for his halfbeak fish. He said a bulk
buyer in Atapupu was more understanding and would buy at a more reasonable price

Chapter 6. Marine Product Value Chains _______________________________________________________________________
255
than the bulk collector in Kalabahi. A summary of the price differences between the
buyers in Kalabahi and Atapupu is presented in Table 6.4.
Table 6.4: Cost and margin of a trader selling halfbeaks in Kalabahi and Atapupu in 2009
Bh sold to buyer in Atapupu Bh sold to buyer in Kalabahi Indonesian
Rupiah (Rp) A$ Indonesian Rupiah
(Rp) A$
Bh purchased at this cost: 1600 kg
16,000,000 (@10,000/kg)
2,000 (@1.25)
16,000,000 (@10,000/kg)
2,000 (@1.25)
Bh sold to buyer at this price:
27,200,000 (@17,000/kg)
3,400 (@A$2.125)
11,200,000 (@ 7000/kg)
140 (0.87)
Marketing cost: Rental boat: Petrol: Payment for goods (@Rp50/kg): Seaport fee: Truck: Labour: Total:
1,500,000 500,000 300,000 120,000 200,000 100,000 2,720,000
187.50 62.50 37.50 15 25 12.50 340
500,000 250,000 0 0 200,000 100,000 1,050,000
62.50 31.25 0 0 25 12.5 131.25
Bh’s income 8,480,000 1,060 (5,850,000) (731.25) Note: Source of price at Atapupu was from semi-structured interview with trader Bh in December 2009
When the kiosk owners acted as village traders, they priced the fish based on their
previous knowledge of the fish prices and the demand for that particular fish at the
market based on their previous visits to the market. The kiosk owner might refuse to
accept sun-dried fish from fishers or argue about the fish quality, while the fishers had
less power to negotiate. The trader also had to consider the 10% weight loss of the sun-
dried fish while storing the fish for at least a week before it was sold to the market.
W (semi structured interview in 2009), a kiosk owner in Kayang, illustrated the margin
cost and profit in trading sun-dried fish. She stated that she normally received a profit of
around Rp5.000/fish (A$0.625) for trevally, for example. The kiosk owners bought the
fish at Rp18,000-20,000/fish (A$2.25-2.50), and then they sold the fish at Rp23,000-
25,000/fish (A$2.875-3.125) in Kalabahi market. The Kalabahi sellers then sold the fish
at Rp35.000-Rp40.000 (A$4.375-5.00) to the end consumers.

Chapter 6. Marine Product Value Chains _______________________________________________________________________
256
With the purchase of various fish products by traders based in Kupang, Makassar and
Atapupu directly from fishers, these traders bought fish at higher prices than if they
purchased the fish from the papalele. Table 6.5 shows the price differences between the
papalele and the bulk collectors who came from Kupang or Makassar.
Table 6.5: Price differences for fresh fish species purchased by traders from Kupang/Makassar and village papalele
Bulk buyer from Kupang/Makassar* Papalele** (Rp) A$ (Rp) A$
One tuna at 30 kg
180,000 (@ 6000-9000 per kg)
22.50 (@0.75-1.125 per kg)
60,000/fish 7.50/fish
Grouper at 60 cm length
60,000 (@ 12,000/kg)
7.50 (@ 1.25/kg)
40,000/fish 5.00/fish
Other grouper at 20 cm length
8,000/kg 1.00/kg 1,600/fish 0.20/fish
Coral trout 8,000/kg 1.00/kg 5,000/fish 0.60/fish Source: * R, a buyer from Kupang (personal communication in 2009) and verified with fishers from Labuhan Bajo from whom R purchased fish ** Focus group discussions
Summary
Similar value chains were found for fish species across all four villages. Fish (fresh and
sun-dried) were bartered. The fish were sold fresh, chilled, salted, smoked or sun-dried,
and were sold whole or filleted. Most of the fish was sold for local consumption in
Pantar and sold for local consumption in inter-regional island markets. The value chains
of the fish production were diverse and complex, with a number of village, island and
regional and international linkages.
6.2.2 Seaweed value chain
Seaweed (Eucheuma sp) is an export-oriented product in Indonesia. Indonesia is the
biggest seaweed producer in the world (95,120 MT in 2009) followed by the Philippines
(70,500 MT) (Dakay 2010). Almost 80% of Indonesia’s seaweed production is for
export. There was an increase in the volume of exported seaweed from Indonesia in the
period from 2002 to 2008 (Figure 6.12). At the global level, at the time of this study,
seaweed industries producing carrageenan were concentrated in Asia: five big

Chapter 6. Marine Product Value Chains _______________________________________________________________________
257
companies processed refined carrageenan (RC) in the Philippines, while five big
companies and around 50-60 small and medium sized carrageenan factories were based
in China (IFC 2007). In 2007, 52% of the total production went to China and Hong
Kong (KKP9). In the same year, Indonesia exported 13% of total production to the
Philippines. In 2007, Indonesia exported 12% of total production to Vietnam, although
Vietnam didn’t have a processing company (MMAF). Several key informants in
Surabaya and Makassar said they exported to China via Vietnam to reduce costs.
Indonesia also exported to South Korea, Spain, France, Denmark and other European
countries (MMAF 2012).
Figure 6.12: Seaweed export data from Indonesia (Trade Department of Indonesia 2000-
2008)
Apart from exporting sun-dried seaweed as raw material for carrageenan factories,
Indonesia also processed seaweed. In 2009, thirteen companies processed seaweed into
semi-refined carrageenan and alkali-treated chips based in Indonesia (Anggadiredja
2010). The Indonesian export of processed seaweed increased in 2012 compared to
previous years (Ministry of Trade 2012). Indonesia also imports carrageenan powder
(Ministry of Trade 2012).
9 Kementrian Kelautan dan Perikanan/KKP, Statistik Kelautan dan Perikanan 2005-2008. Available at http://www.kkp.go.id/upload/jica/
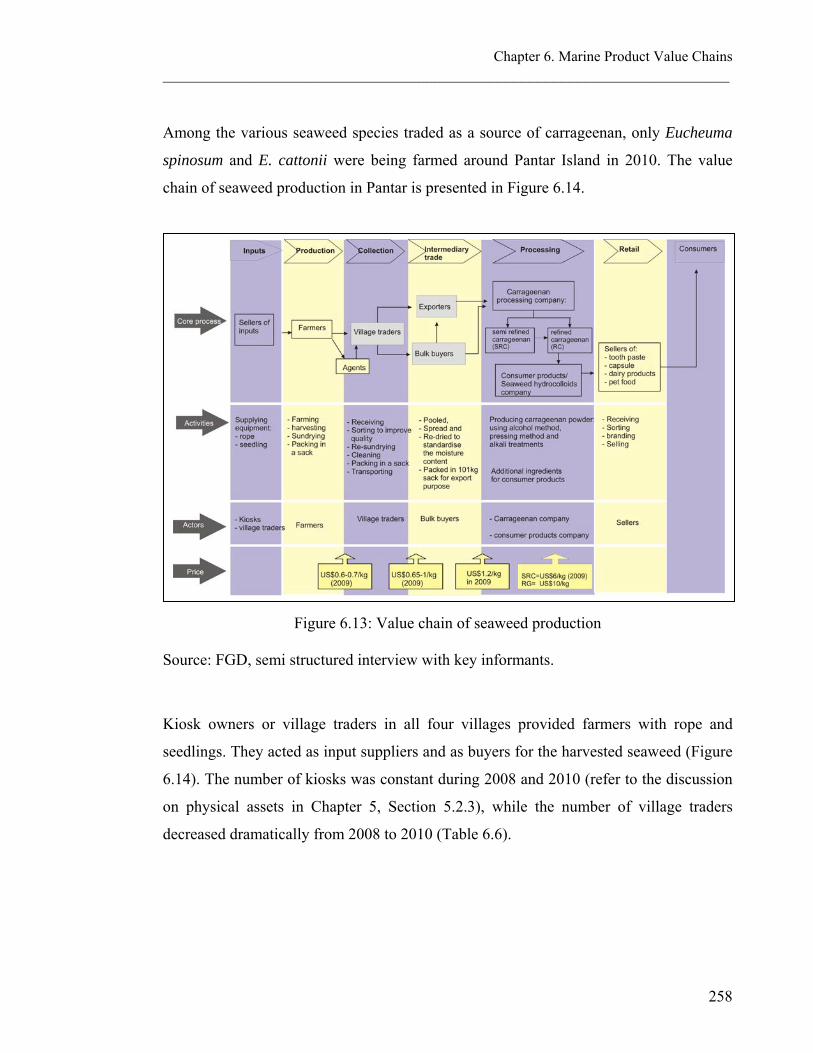
Chapter 6. Marine Product Value Chains _______________________________________________________________________
258
Among the various seaweed species traded as a source of carrageenan, only Eucheuma
spinosum and E. cattonii were being farmed around Pantar Island in 2010. The value
chain of seaweed production in Pantar is presented in Figure 6.14.
Figure 6.13: Value chain of seaweed production
Source: FGD, semi structured interview with key informants.
Kiosk owners or village traders in all four villages provided farmers with rope and
seedlings. They acted as input suppliers and as buyers for the harvested seaweed (Figure
6.14). The number of kiosks was constant during 2008 and 2010 (refer to the discussion
on physical assets in Chapter 5, Section 5.2.3), while the number of village traders
decreased dramatically from 2008 to 2010 (Table 6.6).

Chapter 6. Marine Product Value Chains _______________________________________________________________________
259
Table 6.6: Number of kiosks and village traders
Labuhan Bajo Blangmerang Kayang Marisa Kiosk owners (2008, 2010)
9 10 8 6
Village traders (2008) 10 8 8 9 Village traders (2010) 1 1 2 4
The farmers (both women and men) farmed in tidal zones in front of their villages or in
areas near their villages. During strong currents, the women searched and collected
seaweed that had come loose from ropes along the beach or inshore waters. This activity
sometimes created disputes among farmers because some people were accused of
stealing other people’s seaweed (see the discussion on the vulnerability context in
Chapter 5).
The number of seaweed farmers in Pantar had fluctuated since 2008. When prices were
high in 2008, most villagers (men and women, including school children) in the four
villages farmed seaweed. Villagers from Kayang farmed seaweed in front of their village
and at Wolu which is one hour on foot to the south-west. Villagers from Marisa Village
farmed seaweed in front of their village and at Tapobali on Kangge Island. Villagers
from Blangmerang and Labuhan Bajo also farmed seaweed in front of their villages and
on Lapang Island. In 2008, 58 temporary houses of Blangmerang villagers and 10
temporary houses of Bajau people were evident on Lapang Island. After the ice-ice
outbreak in 2009, only villagers from Marisa and Kayang Villages continued to farm
seaweed and a few people farmed seaweed on Lapang Island. In early 2010, there were
72 temporary houses in Wolu and almost 100 temporary houses for Marisa villagers in
Tapobali, Kangge Island. Eleven Bajau families from Labuhan Bajo also farmed
seaweed on Kangge Island. In early 2010, three Bajau families from Labuhan Bajo and
44 families of Blangmerang started farming seaweed on Lapang Island by buying
seaweed seedlings from Kayang and Kangge seaweed farmers.
The farmers dried the harvested seaweed (done by men and women) by spreading it on a
plastic sheet on the ground for one and a half days depending on the temperature. The
village traders appointed one or two farmers as their contact person in seaweed farming
Chapter 6. Marine Product Value Chains _______________________________________________________________________
260
areas where the farming location was far from their own village. The role of these agents
was normally to arrange meetings between the seaweed farmers and village traders in
which they discussed quality requirements and price. An additional role of the agents
was to weigh the seaweed. The village traders also sometimes left money with the agents
to pay to the farmers. The village traders would collect the seaweed when they visited
the farming areas. The village traders often re-dried the seaweed when the moisture
content was too high. The seaweed was packed in plastic sacks and transported to
Weiriang or Bana, for example, using the regular ferry service.
Intermediary trade at the local level was conducted by bulk buyers/collectors who
actually acted as brokers. They were situated outside the communities, had a good
market network and did not add value to the product. The bulk buyers were each
connected to their own village traders. For example, the village traders from Kayang and
Marisa had a link with a bulk buyer in Weiriang or to a company from Surabaya that had
an agent in Lewoleba, Lembata Island who visited Marisa and Kayang frequently. A
village trader from Blangmerang who lived on Lapang Island had a link with a bulk
buyer from Surabaya.
At the national level, the intermediary trade actors were exporters. Most seaweed
exporters who were purchasing from Pantar Island were situated in Makassar and
Surabaya. Local trader, L in Weiriang, sold his product to a company in Makassar. A
Surabaya export company posted three people in Lewoleba, Lembata Island to purchase
seaweed from this area.
On receipt of the product, the exporters in Surabaya would often pool, spread and re-dry
all the seaweed to standardise the moisture content. The exporters also cleaned the
seaweed of the plastic ropes, algae and sand in a machine before it was packed. They
repacked the seaweed into 100 kg sacks so the sacks can be stored efficiently in a
container to be sent to destination countries (F, exporter in Makassar, semi structured
interview in 2010).

Chapter 6. Marine Product Value Chains _______________________________________________________________________
261
The seaweed met its end consumer in different forms of products. In the processing
companies in Makassar, Surabaya or Jakarta, the seaweed was processed into semi-
refined carrageenan and into refined carrageenan products such as chips and powder.
The carrageenan content in the Eucheuma species acts as a hydrocolloid which is used in
meat processing and in the production of dairy foods, water gels, soft candy, toothpaste,
pet food and medicines.
Relationships between the actors
At the beginning of the seaweed value chain, the relationships between the actors were
mostly based on a business relationship but also based on personal connections. Farmers
took inputs from village traders but then sold the product back to the village traders. The
village trader trusted that the farmers would sell the seaweed to them as they knew the
family of the farmers and lived in the same village. Another example of the combination
of business relationships and personal connections occurred in 2009 when the seaweed
farmers faced the ice-ice outbreak; during that time, the bulk buyers provided money for
the village traders to provide seedlings and rope for seaweed farmers.
The relationship between the bulk buyers from Weiriang, for example, and the exporters
in Makassar indicated the importance of trust and personal relationships. The exporters
stored money with a village trader to ensure supply without any guarantee that the
exporter would get the seaweed. Due to demand being higher than supply from 2008 to
2009, even though the factory had provided money in advance to the local trader, the
factory had to bargain the price three times in order to get the products from the bulk
collectors (semi-structured interview in 2009 with I, a staff member of a factory in
Jakarta).
One new trader on Lapang Island had connections with a buyer from a trading company
in Jakarta (PT BSM) from whom he received money in January 2010. With this money,
he bought seedlings from Kayang Village and distributed the seedlings to 25 farmers on
Lapang Island. The harvested dried seaweed was later pooled in Kalabahi and then

Chapter 6. Marine Product Value Chains _______________________________________________________________________
262
shipped to Surabaya where it was sent to a processing factory in Malang, East Java
(semi-structured interview in 2010 with M, Lapang Island trader).
At the end of the value chain, the relationship between the bulk buyers, exporters and
processing companies was based on price, quality, delivery time and quantity. These
criteria were mentioned by all the key informants who were interviewed in this study.
There was no special contract with the factories. When the exporters had stock, they
informed the processing companies with whom they had links in Indonesia or overseas.
The factories then sent a purchase order. Some factories paid 80% when the purchase
order was agreed upon, and sometimes the companies paid only 20% depending on how
long they had worked together and the history of their relationship. A complaint would
affect the final payment.
Price setting
At the global level, the price of seaweed is set by processing companies in China and
Philippines (Wang 2010). Therefore, any changes in demand in China affect the price
setting in Indonesia. Changes in global pricing during 2008 to 2010 affected local trade,
incomes and relationships among the actors in the seaweed value chain in Pantar. Most
traders considered that the fluctuation in 2008 (Figure 6.15), for example, was caused by
an increased demand in China due to the Olympics and by the harvest failure in the
Philippines due to typhoon (Dakay 2010).
During the focus group discussions (2009), some seaweed farmers mentioned the
benefits they received from the increased prices in 2008. For example, they were able to
renovate their houses. However, some village traders from Kayang said they went
bankrupt in 2009 as they bought seaweed at Rp18,000/kg (A$2.25) while the selling
price was only Rp13,000/kg (A$1.625). At that time, the price changed every day.
A trader from Surabaya pulled out of trading with Kayang and Marisa Villages because
of unstable stock due to the ice-ice outbreak from the end of 2008 to 2009. During this
time, the low prices also meant that a bulk collection company, UD Rumput Laut, based

Chapter 6. Marine Product Value Chains _______________________________________________________________________
263
in Kupang (semi-structured interview in 2009 with A, company owner) also stopped
buying from Pantar as did PT Gumindo Perkasa Industry, a carrageenan processing
company in Jakarta.
Figures 6.15 and 6.16 contrast the price fluctuations at the export level and Pantar level.
Figure 6.15 shows the price fluctuations at export level from 2003-2009, while Figure
6.16 shows the price fluctuations at farmer level in 2008-2010.
Figure 6.14: Average price of seaweed in USD at export level from exporter countries (Dakay 2010)
Shanghai Brilliant Gum, the biggest carrageenan company in China, was the market
leader and controlled the seaweed price in Indonesia as it was the biggest buyer. The
price paid by Shanghai Brilliant Gum was at US$1300/tonne in January 2010,
US$1400/tonne in February, US$1400/tonne in March and US$1400-1600/tonne in May
to June 2010. As seaweed is an export-oriented product, the US dollar fluctuation against
the Indonesian rupiah affects the price at export level. Most of the exporters anticipated
the dollar/rupiah exchange rate fluctuation. The exporters also converted the
US$ received into rupiah as soon as possible because of the fluctuating exchange rate
and because they needed to pay the farmers in rupiah.
0500
10001500200025003000
2003 2004 2005 2006 2007 2008 2009 2010Year
US
D/M
T

Chapter 6. Marine Product Value Chains _______________________________________________________________________
264
Figure 6.15: Price of seaweed in USD/kg at farmer level in Pantar from August 2008 to June 2010 (Source: Focus group discussions and verified in semi-structured interviews
with village traders)
Figure 6.14 shows the difference of margin of buying and selling dried seaweed between
different actors in the seaweed value chain (Figure 6.14). The price difference between a
trader buying from farmers and selling to bulk buyers was Rp500/kg (USD$0.0625) in
2009-2010. The difference between the bulk buyer and the village trader was USD0.05-
0.3 per kilogram. Then, the bulk collector sold at USD1.2/kg. The factory sold
carrageenan at USD6.00/kilogram for semi-refined carrageenan and USD10.00/kg for
refined carrageenan.
At the village trader level, the price difference between buying from farmers and selling
to bulk buyers was Rp500/kg (US$0.0625) in 2009-2010. The bulk collector, L, in
Weiriang was one of the seaweed buyers who survived the twin shocks of the price crash
and the ice-ice outbreak. He said that he ran his business in a transparent way with his
village traders, revealing his costs and the profits from the business. L said that, in 2009-
2010, the difference in price between buying and selling was Rp500 per kg (US$0.0625)
and the village trader received the same profit margin as well. The transport cost was
charged to him at Rp150/kg (US$0.01875). He added that he only took a small profit to

Chapter 6. Marine Product Value Chains _______________________________________________________________________
265
cover all the costs. He had lower transportation costs because he also sent several forest
and agroforestry products to Makassar using his own wooden boat.
According to F, an exporter in Makassar (semi-structured interview in 2010), the price
difference between buying from a bulk collector and selling to an exporter was around
Rp200-1000/kg (US$0.025-0.125). Meanwhile, JR, an exporter based in Surabaya
(personal communication in 2010), stated that the price difference between selling to a
processing company overseas and buying from bulk buyers was Rp1000/kg (US$0.125).
Another key informant in Makassar (Am, semi-structured interview in 2010), stated that
the price difference between buying and selling was Rp200/kg (US$0.025) in 2010,
while another exporter in Makassar (Ar, semi-structured interview in 2010) stated that
the price difference was Rp50/kg-Rp100/kg (US$0.00625-0.0125) in 2010. This showed
that the profit margin received by the exporter was not as high as the margin for the
village trader; however, the exporters traded in a large quantity and therefore gained
higher profit.
Summary
Seaweed was considered to be an export-oriented product in Pantar. It was farmed in the
village, processed in companies in Surabaya, Makassar and Jakarta, used by consumer
product companies as additional ingredients, and met the consumer in different forms of
products such as toothpaste, dairy and pharmaceutical products. Producers in Pantar
were only involved in the production and collection stages. After the product left Pantar,
the villagers did not know about the use of the seaweed. The value chain of the seaweed
production was complex at the collection and intermediary trade stages as it involved
many actors. Village traders played a key role in this value chain. The seaweed value
chain was linked to and influenced by the international market.

Chapter 6. Marine Product Value Chains _______________________________________________________________________
266
6.2.3 Sea cucumber value chain
Sea cucumbers are well known in Chinese culture as a food delicacy. The improved
living standard of people in China since the 1980s has stimulated the consumption of
luxury foods such as sea cucumbers (Chen 2004), which has meant an increase in
demand for the species (Prescott et al. 2013).
In Indonesia, the number of sea cucumber landings increased steadily from 1980 to 2005
(MMAF, 2009). At the time of writing, many species of sea cucumbers (called trepang
in Indonesian, menawe in Alorese or ballok in Sama Bajau) were harvested in Indonesia
(from regions including NTT, Maluku, East Kalimantan, Papua, South Sulawesi (the
Spermonde Archipelago) (Purwati 1996; Tuwo 2004; Manez and Ferse 2010), largely
for export, although some species are processed and consumed domestically in Indonesia.
At the time of this study, dried whole sea cucumber was the most common product
traded in Indonesia. Other products derived from sea cucumber produced locally in Java
were crispy snacks called otot, made from the dried cuvierian tubules of sea cucumbers.
The value chain of sea cucumber production from Pantar Island is presented in Figure
6.17. The value chain starts with the input suppliers providing fishers from the four
villages with the equipment they need to collect sea cucumbers.

Chapter 6. Marine Product Value Chains _______________________________________________________________________
267
Figure 6.16: Value chain of sea cucumbers in Pantar from 2009-2010 Source: FGD, semi structured interview with key informants.
Fishers from the four villages collected any species of sea cucumber in the coastal areas
around Pantar. A number of men from Baranusa, five men from Labuhan Bajo Hamlet,
and three men from Marisa Village often fished by free diving for sea cucumber in
deeper waters around Blangmerang and Rusa Islands (Figure 5.4 in Chapter 5). Some
men from these four villages also dived off Batang Island, Lapang Island and Baranusa
Village and sometimes travelled to Lembata Island to collect sea cucumber. During the
focus group discussions, the participants in Kayang mentioned that they collected sea
cucumber opportunistically in the inter-tidal zone area in front of their village.
Sea cucumbers were also collected by women in all four villages in the inter-tidal zone
in waters in front of their villages or in mangrove areas around Pantar. Women from
Labuhan Bajo Hamlet also collected sea cucumbers around Lapang Island; however,
according to the women interviewed, these were generally small in size (e.g., juveniles).
During the focus group discussion with women in Labuan Bajo Village, they reported
that they collected one small basket of sea cucumbers per trip. A summary of the most

Chapter 6. Marine Product Value Chains _______________________________________________________________________
268
common sea cucumber species collected in Pantar from December 2009 to May 2010 is
shown in Table 6.7.
Figure 6.17: Women clean sea cucumbers that were collected in a mangrove area in
Lapang Island
Table 6.7: List of sea cucumber species collected in Pantar (December 2009 to May 2010)
English name Latin name Indonesian name Most commonly collected species
Sand fish Holothuria scabra Teripang buang kulit Sean Blackfish Actinopyga lecanora T.kapok White teat fish H. fuscogilva T. susu Pinkfish Holothuria edulis T. cera Black sea cucumber H. vacabunda T. talengko Prickly redfish Tlielenota ananas or
stichopus ananas Nanas
Species less frequently collected Black teatfish Holothuria whitmae Koro batu Curryfish Stichopus hermanni Tkk Lollyfish Holothuria atra Cerak hitam Source: Observation and household surveys (refer to Chapter 5, Section 5.2.2)
Having collected the sea cucumbers, the fishers (men or women) processed it by
cleaning, removing the internal organs, boiling, sun-drying and salting. These activities
required boiling equipment, drying stands and salt.
The sea cucumbers collected were sold to village traders. There were only two active
local traders for sea cucumbers in Pantar in 2010. One was based in Labuhan Bajo
Hamlet and one was based in Bana Village neighbouring Labuhan Bajo Hamlet (this
trader also received marine products from Wetar, Kei Islands). When I visited Pantar in

Chapter 6. Marine Product Value Chains _______________________________________________________________________
269
2012, there was only one trader in Bana controlling the sea cucumbers (and top shell
trade) in Pantar Island.
The local traders conducted a further round of processing (e.g., cleaning, re-boiling, sun-
drying and washing) to 40%-50% of the original moisture content. The sea cucumbers
were then sent by boat to exporters or bulk collectors in Makassar. The number of
exporters in Makassar was difficult to identify as there was no clear definition of
whether a trader was an exporter or bulk collector. In discussions with traders in
Surabaya and Makassar, they identified at least six companies based in Makassar (S,
semi-structured interview in 2010) and seven companies based in Surabaya that exported
sea cucumbers (P, semi-structured interview in 2010).
The exporters further dried the sea cucumber to reach 10%-20% of the original moisture
content before the product was exported overseas. One exporter in Makassar reported he
preferred to buy unsalted (raw) sea cucumbers from fishers so he could process them
himself depending on his clients’ particular requirements. He believed that the process
conducted by the fishers reduced the quality of the sea cucumbers and he had to re-
process the sea cucumbers thoroughly to get a better quality product (Az, semi-
structured interview in 2009). Different quality sea cucumbers of the same species
obtained different prices (Figure 6.19).
Figure 6.18: Different quality sea cucumbers at different prices in the local or export markets The first sea cucumber (Holothuria sp) on the left was processed with salt before being boiled and was priced at Rp315,000/kg (1 kg consisted of 40 pieces), with China as the main market. The middle sea cucumber (species unknown) was processed without salt and was selling at Rp420,000/kg (1 kg consisted of 6 pieces), with China as the main market. The third sea cucumber was salted after boiling and was selling at Rp380,000/kg (1 kg consisted of 28 cucumbers), with Korea as the main market.

Chapter 6. Marine Product Value Chains _______________________________________________________________________
270
From Makassar, the destination countries were mainly China, Taiwan, Hong Kong,
South Korea, Malaysia and Japan. One importer from China was interviewed for the
present study in 2010. He stated that his company had retailers all over China and
distributed directly to customers. Thus, from Makassar, the sea cucumbers might also be
sold to restaurants in Jakarta or Makassar. Photographs of the same species of sea
cucumber sold from a local trader in Pantar and from a market shop in Shanghai, China,
illustrate the difference in quality (Figure 6.20).
Figure 6.19: Sea cucumber (Thelenota ananas) at local traders in Pantar and China
The photo on the left is Thelenota sp at local trader in Bana, Pantar; the photo on the right is Thelenota sp at a Shanghai market, China (2010).
Relationships between the actors
At the beginning of the chain, the fishers sold their product to one or two local traders.
The relationship between the local traders and the bulk buyers/exporters was mostly
based on personal connections. The village traders sold to the bulk collectors in
Makassar who treated them well, provided food when they travelled to Makassar, treated
them like a close friend or family, and lent them money during difficult times. The bulk
collectors sometimes provided cash in advance to village traders to purchase sea
cucumbers. This indicates that the relationship was built on trust.

Chapter 6. Marine Product Value Chains _______________________________________________________________________
271
Price setting
At the village level, the price of the sea cucumber was set by village traders based on the
price list provided by importers and distributed by exporters in Makassar. An example of
a price list for sea cucumbers was provided by a Korean company and is shown at
Appendix H. This list was current as at 2009, and used by one exporter (S, interviewed
in 2010). There were different prices for different species of sea cucumbers depending
on the quality, moisture content and shape. The exporter, S, further described that the
price increased by 20% during Chinese New Year (January). The fishers sometimes
asked for a higher price for their product. In this case, the exporters had to re-negotiate
the price with the importers. Table 6.8 shows the price differences between the exporters,
traders and fishers in Pantar.
Table 6.8: Price differences of sea cucumber (white teat, H. fuscogilva) at exporter (Makassar) and village trader level in 2010
Importer buys from exporter*
Traders** Pantar***
White teat per kg
A$187.5 Rp1,500,000-376,000
A$156.30 per kg Rp1,250,000/kg
(10-15 sea cucumber per kg)
A$100 Rp800,000 per kg
(1kg=2 sea cucumber)
* List from exporter (Appendix H); this price is set by importers based in Korea ** Interview with trader, Th, in Pantar *** Focus group discussions in Blangmerang in 2009
Summary
The villagers collected, processed and sold sea cucumbers to village traders for cash
income. The village trader determined the price of the sea cucumber based on their
experience on previous trade with buyers from Makassar or Kupang. The fishers tended
not to know the current market price. The village trader negotiated the price with the
exporter or bulk collector. As the sea cucumber was an export-oriented product, events
and trends in China affected the price received by fishers in Pantar.

Chapter 6. Marine Product Value Chains _______________________________________________________________________
272
6.2.4 Top shell value chain
The value chain of top shells (Tectus niloticus) (or kalla in Alorese and lallak in Sama
Bajau language) followed a similar value chain as sea cucumbers (Figure 6. 21).
Figure 6.20: Value chain of top shell production from Pantar, 2009-2010 Source: FGD, semi structured interview with key informants.
The top shell value chain in Pantar started with the input suppliers providing equipment
to fishers from the four villages. Although the inputs were not significantly important in
collecting top shells, the fishers still needed battery torches and they bought these from
the kiosk owners.
The fishermen from Pantar normally collected top shells by free diving in the evening
which was reported to be the best time, because the fishers believed the top shells moved
to find food in the evening. The movement of top shells is affected by heat stress
(Purcell and Cheng 2010). The top shells hide in crevices in the reef during the day to
seek shade and move a short distance in the evening. Only a few men knew the best
locations for harvesting top shells and understood the best time to dive; these included

Chapter 6. Marine Product Value Chains _______________________________________________________________________
273
five men from Baranusa, five men from Labuhan Bajo and three men from Marisa
Village. Other villagers (both men and women) collected small top shells (e.g., with a
basal diameter size less than 5cm) opportunistically in the inter-tidal zone.
Once collected, the top shells were left to decompose to enable the flesh to be taken out
of the shell easily. The empty top shells were sold to a local trader in Bana Village (near
Kabir in Pantar) (the same trader also bought sea cucumbers) who sold directly to a
processing factory in Makassar. The top shells were transported to Makassar The local
trader sometimes sold shells to the captain of the perahu pinisi. In this case, the captain
acted as an intermediary trader and he then sold to the factory.
As noted in the value chain in Figure 6.20, the top shell is used in the production of
buttons, particularly blank buttons. At the time of this study, there were three blank
button companies in Makassar: one was an Indonesian company and two were Korean
companies. In Indonesia there was one other button factory, a Korean-owned factory in
Kediri, and one factory in Jakarta, Java. The button companies had strong connections
with Korean companies, and most of the products were sent to Korea (M, semi-
structured interview in 2009).
In the factory, the outer shells of top shells are polished and then cut and shaped into
blank buttons. The shells are also used for handicrafts and as an ingredient in some types
of paint (ICECON 1997). In the value chain identified in the present study, the unused
parts of the shell (e.g., the top side of the shells) were sent to handicraft businesses in
Java or a paint factory in Makassar and Korea. The blank buttons was exported to button
factories in Korea, Italy, China, the US, Hong Kong and Germany (M, processor based
in Makassar, semi-structured interview in 2009).
In the discussions conducted in the present study, the fishermen said that top shells were
difficult to find nowadays. Some were still found around Lapang and Kangge Islands.
The fishers conjectured that the reduction in the number of top shells was caused by high
competition with fishers from Bima, Sumbawa and other areas who dived using

Chapter 6. Marine Product Value Chains _______________________________________________________________________
274
technology such as hooks and lines and compressors. This enabled the divers to access
the top shells that were out of reach to the local divers. Other sources of top shells in
Indonesia included the islands in Maluku Province, Gorontalo, the Spermonde
Archipelago in South Sulawesi, and Kotabaru Kalimantan (Purnomo 2004; Az, exporter
based in Makassar, semi-structured interview in 2009: M, semi-structured interview in
2009).
Although the fishers in Pantar and traders in Makassar (A, semi-structured interview in
2009) considered that the supply of top shells was lower than it was ten years ago;
however, it was difficult to estimate the amount of top shell exported from Pantar in
recent years. Table 6.9 provides an indication of the amount of top shell sent to
Makassar through the main top shell trader from July 2011 until May 2012. The average
was 500 kilograms per month (Th, local trader in Bana, semi-structured interview in
2012).
Table 6.9: Top shells sent to Makassar by a trader in Bana
Year Month Quantity (Kg)
2011 July 500 August 800 Sept 500 Oct 500 Nov 500 Dec 5002012 Jan 1000 Feb 1000 March 960 April 1845 May 1000
Total 9105Source: Th, a trader in Bana, Pantar

Chapter 6. Marine Product Value Chains _______________________________________________________________________
275
Relationships between the actors
The relationships between the actors (fishers and local trader in Bana) in the top shell
value chain were based on personal connections. The local trader treated the fishers well
when the fishers visited Bana such as providing them with food and accommodation.
This attracted fishers to sell the product to him.
The trading of top shells required a permit in Indonesia. Therefore, the local traders who
had trading permits looked after the collectors below them. The traders’ ability to protect
their suppliers from being caught by authorities due to not having a permit was an
important consideration for the top shell collectors. For example, the police randomly
checked the owners of the products in Kalabahi and Makassar seaport when top shells
were transported. In that situation, the collectors only had to mention the name of the
exporter and the police would contact the exporter and visit the warehouse to enquire
into the trade permit (S, trader in Makassar, semi-structured interview in 2009). The
police also checked the pinisi and enquired the owners of the product that transported
from Kabir to Makassar. The captain mentioned the owner of the products and the
products were free to be transported (A, shipping company in Makassar, semi-structured
interview in 2009). In fact, at the time of this study, only two companies had licences to
trade top shells in NTT Province.
Price setting
The price of top shells (per kilo for unprocessed and clean shells) was set by the blank
button factories and then communicated to the village traders. The fishers reported they
would accept any price paid by local traders without bargaining (focus group discussion
in Marisa, 2009). Based on this, the village trader determined the price of top shells at
village level. The fishers could not bargain with the village trader. The factory owners
interviewed in Makassar believed that the demand for buttons was relatively stable. The
price of top shells in Indonesian rupiah fluctuated against the US dollar. In January 2009,
fishers in Pantar received Rp45,000 (A$5.70 per kilogram), while the Makassar factory
owners purchased a kilogram from local traders for Rp55,000 (A$6.90). By June 2010,
the price received by fishers in Pantar had decreased to Rp25,000 (A$3.20 per kilogram),

Chapter 6. Marine Product Value Chains _______________________________________________________________________
276
while a factory in Makassar purchased at Rp40,000 per kilogram (A$5/kg). Figure 6.22
presents a summary of the price fluctuations in Makassar and Pantar.
0
24
6
8
Augus
t 2008
Jan
2009
Oct 20
09
Nov 200
9
Jan
2010
May
2010
June
201
0
A$/
Kg Makassar
Pantar
Figure 6.21: Price of top shells per kilogram in Makassar and Kabir
(Y=A$/Kg, X=month) Note: This is the buying price paid by village traders to fishers and the buying price paid by traders in Makassar. Sources for the buying price were village trader HM, a trader in Kabir, and Th, trader in Bana-Pantar. The sources for the buying price in Makassar were interviews with four traders in Makassar.
Summary
Top shells were mostly collected by free diving in the waters around Pantar and were
collected for sale. The fishers considered it was hard to find top shells. The village
traders played a significant role in this business as they linked the fishers with the
processing company, collected the top shells from fishers and transported the product to
the processing company based in Makassar. As top shell was an export-oriented product,
similar to seaweed and sea cucumber, the price in Indonesian rupiah fluctuated against
the US dollar.
6.3 Discussion
6.3.1 Core processes of the value chain
The core processes of the value chains of the marine products presented here (fish, sea
cucumber and top shells) followed similar steps as suggested by M4P (2008). The value
chain is not, however, a simple line; it usually has several chains (Hempel 2010). The
value chains of the fish in the study area were diverse and complex within villages and
islands and had international linkages. There could be more than one and stages such as
Chapter 6. Marine Product Value Chains _______________________________________________________________________
277
collection and intermediary trade stages have several lines depending on the type of
product and actors involved. For example, the actors involved at the intermediary trade
stage in the seaweed value chain included village traders, several layers of bulk
collectors and exporters before the product reached the processing company.
The integrated chain of products from Pantar to the international market shows the
potential for producers to capture higher value. For example, fish that were purchased by
a bulk collector who visited the area in a boat with a tank full of ice received a higher
price than the fish purchased by the local traders. The trade in sea cucumbers, top shells
and seaweed as export-oriented products had brought cash income to the villages. The
increased demand and price of seaweed were enjoyed by most of the coastal villagers.
Relatively new actors in the trading chain for fish products (coral trout, parrotfish, red
snapper and tuna) were traders from Kupang and Makassar who purchased fish at a
higher price than if the same fish was sold at local markets. This indicates an opportunity
for fishers to obtain better value than through the local market. As illustrated by Bene et
al. (2010), the international fish trade is an engine for economic growth for small-scale
fisheries and for poverty reduction.
However, bulk buying traders who have links with national and international markets are
also a threat to the natural assets. Fishers will increase fishing efforts due to the higher
prices offered. Traders provide supplies for fishing that minimise the fishermen’s initial
cost. This can put more pressure on fish stocks. Sd, a fisher in Marisa Village, stated that
he would optimise his fishing effort when a bulk buyer was in the village (semi-
structured interview in 2010). In addition, this type of trading was not favoured by
papalele, due to the decreased number of fish landings in the village and subsequent
impact on the papalele earnings. Lower numbers of fish landings could also affect the
availability of local fish and consumption, and thus food security, as fish were an
affordable source of protein in Pantar. The lower fish landings might cause a decreased
number of papalele, as suggested by Salagrama and Salka (2010) who found that a high
proportion of people involved in the fish value chain in Nias Indonesia were losing out
due to fish being transported directly to the markets in the city.

Chapter 6. Marine Product Value Chains _______________________________________________________________________
278
The analysis of the fish value chain showed how fish were important marine products for
coastal people and inland communities through trade. The local market for fish is
important for economic development in Pantar because villagers are able to participate
in the value chain. Shackleton et al. (2007) pointed out that local markets provide a
guaranteed way of reaching some of the poorest people participating along the value
chain. The local market has fewer barriers to entry, minimal capital is required to start
the trade, knowledge and skills are accessible, and the material can often be harvested at
minimum cost or no cost at all.
6.3.2 Power and relationships between actors
Reflecting on the relationships between various actors in the value chains, it is important
to understand how actors interact in the value chain (Grunert et al. 2005; Ribot 2005)
and who has more power, especially in setting the price. As discussed by Hall et al.
(2013), powerful actors shape the way a market works. Power may arise from social
status, the ability to take advantage of the needs or ignorance of the other, superior
financial or technological capacity, or a monopolistic position in the market
(Schreckenberg et al. 2006).
The assessment of an actor’s power is based on an understanding of the relationships
between the actors. Based on the results of this VCA, three factors were identified as a
basis for the value chain relationships in Pantar: business, trust, and personal
connections. Trust and personal relationships had the main influence on how one actor
interacted with another. The kiosk owners in all the villages established and built a
patron-client relationship with the fishing families. As a patron, the kiosk owner met
many needs including protection and food security for the fishing families (see also
Chapter 5, Section 5.5); in return, the kiosk owner gained benefits through an ensured
fish supply and profit through the increased sales of the input supplies that could be
cheaper if purchased in other locations or towns (Putra 1993; Pelras 2006; Stacey 2007).

Chapter 6. Marine Product Value Chains _______________________________________________________________________
279
The lives of the fishers depended heavily on kiosk owners (Crona et al. 2010). The kiosk
owner might refuse to accept sun-dried fish from the fishers or argue about fish quality,
so the fish owner had less negotiation power. The kiosk owner controlled the fishers and
maintained the supply to his or her buyers.
In the production of seaweed, sea cucumbers and top shells, the role of bulk buyers, such
as L in Weiriang (Lembata Island) and Th in Bana (Pantar), was powerful along the
value chain. Although an exporter might store money with them to ensure the supply of
stock, the bulk buyer determined what quantity of product would be sent to which
trader/exporter. The bulk buyers in Weiriang and Bana acted as the gate-keepers
between the processing companies and the fishers, had networks in the outside world,
and lived in the local areas. The fishers knew their families and trusted them.
The relationship between the papalele and fishers was based on business. The fishers
can sell the fish to any papalele from their village or other villages. If the papalele
considered the price charged by the fishers to be too high, they bargained to get a better
price. The papalele paid the fish owner only after all the products were sold. The fishers
preferred to sell their fish to papalele because the fishers then did not have to worry if
their fish could not be absorbed by market. The papalele decided what to do with the fish,
which was either sold directly or processed.
6.3.2 Risks and benefits
The risks and benefits of local producers in Pantar were experienced in several ways.
The results of this study showed that the fishers experienced risk due to their poor
bargaining power to get better prices for their fish (Loc et al. 2010) and reduced stocks
(as discussed in more detail in Chapter 5). Meanwhile, the papalele also experienced the
risk of fish decaying due to the limited availability of ice and salt and poor transportation
from land sites to local markets.
Benefits were reflected in the profits gained and the relationships established among the
actors. The producers benefited from the relationships established with the village

Chapter 6. Marine Product Value Chains _______________________________________________________________________
280
traders, as the village traders provided security for their livelihoods. For example, the
village traders provided supplies and lent money to producers, with the supply of marine
products as the guarantee. In terms of profit gained, the papalele and kiosk owners
(village traders) experienced the highest profit margin from fish products. The village
traders sold the fish at double the amount of the buying price but they still had to
upgrade the product (smoke, sun-dry) and bear some risks such as covering the
transportation costs, and there was the possibility of fewer bulk collectors offering a
good price. The fishers, as producers, still benefited from a profit margin although it was
not as high as the margin for the village trader.
In the seaweed value chain, the producers gained a higher benefit per kilogram than the
village trader, bulk buyer or exporter. The buying price from village trader to farmers
was around US$1/kg in 2009. However, as the quantity traded by farmers was smaller
than the quantity traded by the bulk buyer or exporter, the total benefit received by the
seaweed farmers was smaller than for the other actors. The fluctuating price in 2008 did
not limit them to farming seaweed as the actual benefit received (income) during the low
price period was actually still higher than the cost to farm. The risk faced by the farmers
included the failure to harvest due to disease or the plants being washed away by strong
currents. The village traders gained less benefit than the producers, but they traded in
larger quantities and the risk was low as the upgrading process only involved packing
the seaweed and they traded using exporters’ money. The exporters experienced the
most benefit among all the actors in the chain as they traded in larger quantities. The
exporters, however, bore the most risk due to price fluctuations and the US dollar
exchange rate against the rupiah, and they also had to ensure the quality of the product.
The processing company sold the processed seaweed at a much higher price (as shown
above in Figure 6.13); however, more inputs were required. Bixler and Porse (2010)
pointed out that the profit margin for a processing company can be low due to the cost of
energy, intensive inputs and technology. In addition, consumer goods companies are
sometimes reluctant to pay a higher price for food additives (which are the function of
the seaweed product, carrageenan hydrocolloid).

Chapter 6. Marine Product Value Chains _______________________________________________________________________
281
In the sea cucumber chain, the fishers had a lower risk but the gain was lower than the
gain for other actors further down the value chain (e.g., white teat fish in Table 6.8). The
main risk the farmers faced was reduced stock. The exporters set the price with the
village trader and, based on this price, the village trader determined the value of the sea
cucumbers from the producers. The village trader processed the sea cucumbers but they
could not gain a high profit margin as the fishers asked for a high price. The village
trader had to agree with this in order to maintain good relationships with the fishers and
to ensure the fishers did not sell the sea cucumber to another trader. The exporters
benefited more than other actors; however, they took a risk in adding value to the
products in order to fulfil the international traders’ requirements. The exporters needed
to have the capability to predict the moisture content of the sea cucumbers, as moisture
content was a key factor in determining the sea cucumber price. The exporters also
needed to consider timing to set the price. The demand usually began to increase from
December to January until reaching the highest demand in February (during Chinese
New Year). Some retailers in China, for example, had to store their expensive sea
cucumbers because end-consumers only bought this product for special occasions (Sf,
exporter in Makassar, semi-structured interview in 2010).
In the top shell value chain, the producers obtained a higher profit margin than other
actors per kilogram traded (Figure 6.22). The village traders gained only half the profit
of the villagers, while the processing company gained only half of the village trader’s
profit per unit; however, the quantity traded determined the total profit gained.
6.4 Strengthening community participation in the marine product
value chains
The value chain analysis across different products for local and export markets provided
information about how the communities were involved in the value chain. Two key
opportunities were identified for strengthening the capacity of coastal communities to
increase their livelihood benefits (in terms of income) and reduce the risks they face
along the value chain (Hempel 2010; Schreckenberg et al. 2006; Jacinto 2004): 1)

Chapter 6. Marine Product Value Chains _______________________________________________________________________
282
overcoming constraints at the village level to reduce loss and cost, 2) upgrading the
product value to increase benefits.
6.4.1 Constraints to reduce loss and cost of the products
Several constraints to reducing loss in the value chains in Pantar were identified by the
participants in this study, including: a) product availability, b) financial support
availability, c) infrastructure and equipment, and d) market information. Table 6.10
provides a summary of the main constraints encountered by the communities in the four
villages, as expressed by the participants in the group and individual discussions.
Table 6.10: Constraints expressed by fishers and village traders in four villages
Stage in the value chain
Labuhan Bajo Blangmerang Kayang Marisa
Inputs No concern, the input is available and accessible in the village
No concern, the input is available and accessible
No concern, the input is available and accessible
No concern, the input is available and accessible
Production - the catch is unpredictable
- FAD construction is not strong to survive from current and wave - fishing business is not favoured for bank loans
- only one mid-water mini trawl to catch pelagic fish - the FAD is not strong - fishing business is not favoured for bank loans
No concern No concern
Fish
Collection: By village traders (papalele)
- poor road condition to Bakalang market
- scarcity and high price of ice
- poor storage to carry the chilled fish to the market
- during rainy season, fish are not dried properly
- lack of credit to purchase more fish
- poor road condition to markets?
- scarcity and high price of ice
- poor storage to carry the chilled fish to the market
- during rainy season, fish are not dried properly
- lack of credit to purchase more fish
- poor road condition to Wolu market
- lack of ice - lack of salt
availability - during rainy
season, fish are not dried properly
- lack of credit to purchase more fish
- poor road condition to Wolu market - lack of ice - during rainy season, fish are not dried properly - lack of credit to purchase more fish

Chapter 6. Marine Product Value Chains _______________________________________________________________________
283
Table 6.10: Constraints expressed by fishers and village traders in four villages (continued)
Stage in the value chain
Labuhan Bajo Blangmerang Kayang Marisa
Inputs No concern No concern No concern No concern Production Hard to find - hard to find
- lack of skills to identify the location
Hard to find
- lack of skills to identify the location
Sea cucum
bers Village trader - needs further processing for better quality
- lack of information about demand required by buyer
- low and irregular production for transporting to other places (not economically viable to transport)
- irregular and low production (not economically viable to transport)
- needs further processing for better quality
- low quality - low quality
Inputs No concern, the input is available and accessible
No concern, they can access input in the village
No concern, they can access input in the village
No concern, they can access input in the village
Production - limited availability
- limited availability - competition with divers from other islands
- limited availability
- limited availability - competition with divers from other islands
Top shells
Village trader 4 lack of information about order
5 low production
6 lack of information about order
- the producers sold to Labuhan Bajo
- the producers sold to Labuhan Bajo

Chapter 6. Marine Product Value Chains _______________________________________________________________________
284
Table 6.10: Constraints expressed by fishers and village traders in four villages (continued)
Stage in the value chain
Labuhan Bajo Blangmerang Kayang Marisa
Inputs Seedlings are difficult to find after ice-ice outbreak
Seedlings are difficult to find after ice-ice outbreak
Seedlings are difficult to find after ice-ice outbreak
Seedlings are difficult to find after ice-ice outbreak
Production - ice-ice outbreak for seaweed farming
- change of climate and sea temperature
- strong wave causes tied seaweed to loosen
- ice-ice outbreak for seaweed farming - the change of climate and sea temperature
- ice-ice outbreak for seaweed farming - the change of climate and sea temperature
- ice-ice outbreak for seaweed farming - the change of climate and sea temperature - conflicts between farmers sometimes occurred due to claiming the ownership of fallen seaweed
Seaw
eed
Village trader (Intermediary trade)
- seaweed is not properly dried and cleaned of stone and rope - fluctuating price so have to determine buying price from farmers - lack of information about price
- seaweed is not properly dried and cleaned of stone and rope - fluctuating price so have to determine buying price from farmers - information shared about price
- seaweed is not properly dried and cleaned stone and rope - fluctuating price so have to determine buying price from farmers - information shared about price
- seaweed is not properly dried and cleaned of stone and rope - fluctuating price so have to determine buying price from farmers - information shared about price
Source: Focus group and individual discussions in four villages (2009-2010)
The constraints at the production stage in the fish value chain were product availability
and ecological knowledge about marine resources. Inputs were not considered to be a
concern due to the availability and accessibility of inputs in the village, including the
provision of these by kiosk owners. The fishers in Labuhan Bajo highlighted that they
considered the catch to be unpredictable. They sometimes caught nothing. In

Chapter 6. Marine Product Value Chains _______________________________________________________________________
285
Blangmerang, the fishermen considered that the production of small pelagic fish was low
because there was only one mid-water trawler in that village. The construction of the fish
aggregating devices (FAD) appeared to be an issue as the fishermen in Labuhan Bajo
and Blangmerang reported that they had lost several devices that were swept away by
strong currents and waves. When the fishers wanted to add more mid-water trawlers or
FAD, financial support was problematic as the fishing business was not favoured by
banks for bank loans.
At the collection stage of the fish chain, the state of the infrastructure and the lack of
inputs for processing fish were the main issues (Table 6.10). Poor road conditions plus
the scarcity of ice and salt were considered to be more of a problem by the village
traders. During the rainy season, the papalele had to deal with muddy roads or go out of
business. Electricity to produce ice was scarce and expensive, and this influenced the
decisions of the papalele about buying fish to sell. The papalele only used baskets to
store and carry the fresh or chilled fish to the market. This meant the fish could rot easily
and had to be sold quickly. In addition to these constraints, the papalele also discussed
that access to credit was limited in the area during 2008-2010 when they had planned to
expand their business.
A problem in the top shell value chain was the availability of stock. The local producers
believed that the size of the top shells was getting smaller and smaller in the natural
habitat (Section 6.3.2); in addition, they had to compete with divers from Ternate and
Buaya Islands who used hooks and lines to dive, while fishers from Pantar only free
dived. The trading of top shells was also regulated under the Natural Resources Act (the
Regulation of the Government of Indonesia No. 7/1999), and only a company who was
licensed could trade. The traders in Pantar didn’t have this licence, however they didn’t
mention this as a constraint. The risk of a random check by police made them very
secretive about the type and quantity of product traded.
Sea cucumbers were hardly found in Pantar any more according to the study participants
in Blangmerang and Labuhan Bajo (see the discussion on natural assets in Chapter 5).

Chapter 6. Marine Product Value Chains _______________________________________________________________________
286
Other constraints faced by the fishers were low quality of the sea cucumber catch due to
the need for processing (boiling and salting). The fishers sold the sea cucumber to the
village trader and then the village trader reprocessed it and waited for orders from buyers.
The quality issue was also raised by sea cucumber buyers in Makassar. The lack of
quality control due to the lack of local ability or willingness to process sea cucumbers
was a major concern. The poorly processed product delivered by the fishers downgraded
the quality. The bulk buyer in Makassar complained about the poor processing by the
producer and stated that he preferred to buy raw sea cucumbers in order to avoid double
processing and higher costs (Az, semi-structured interview in 2009). He further added
that if the village traders were willing to improve their processing, they might get a
different price.
Another breakout of ice-ice disease was the main concern for the seaweed farmers in
Pantar Island. During an ice-ice outbreak, all the seaweed has to be harvested leaving no
seedlings in the sea, creating a lack of seedlings for future farming. The lack of seedlings
and the low level of knowledge about how to handle the disease were among the
constraints identified by the farmers. In order to avoid further disease outbreak and
impacts, MS, a representative from FMC Biopolymer (semi-structured interview in
2009) suggested that farmers should take the seaweed out of the sea and farm it again
after several months. Producers can take steps to benefit from the best time to farm
seaweed through a better of understanding of the sea conditions, temperature and
weather. The best time to farm seaweed in this area was said to be from December to
July when the sea temperature was not too high. Other research has established that
seaweed grows better at 20-32o Celsius (Ask 1999).
Another constraint faced by seaweed farmers was the strong wave actions that loosened
the ropes to which the seaweed was tied. In addition, in Marisa Village, it was identified
that there was the risk of conflict due to the activity of collecting seaweed that had fallen
from the ties. This was considered to be a constraint because it was impossible to know

Chapter 6. Marine Product Value Chains _______________________________________________________________________
287
who was the owner of the seaweed, and the villagers were free to collect. However, this
constraint didn’t deter them from farming.
Regarding the post-harvesting stage of the seaweed value chain, the traders complained
about the moisture content and purity of the products they received from the farmers.
The local traders found sand, sandstone, plastic rope and salt mixed with the seaweed
packed in the plastic bags. Those foreign materials were sometimes introduced when
farmers collected the seaweed after the sun-drying process if the seaweed was sun-dried
on the ground without a base (Figure 6.23). Sand, rubble and foreign materials were
easily unintentionally introduced when the seaweed was packaged into sacks for
transportation.
Figure 6.22: Seaweed sun-dried on the ground in Marisa Village in 2010
In summary, the actors faced several constraints. Product availability and knowledge
about the current status of products as well as the climate and the environment were
among the challenges to reducing loss. Infrastructure and the lack of inputs for
processing fish were the main problems. As suggested by Jacinto and Pomeroy (2011),
apart from tradable volume, the methods of preservation and transport affect the
producer’s ability to get a higher price. Furthermore, a lack of information about the
product requirements caused low quality and price, and market information was limited
in this area. Access to credit was also problematic, as revealed during the focus group
discussions with the women village traders in the four villages (Table 6.10). No formal
lending institution was present in the study area. Pawn shops were only available in

Chapter 6. Marine Product Value Chains _______________________________________________________________________
288
Kabir and Kalabahi. The focus group discussion participants in Blangmerang (2010)
described that they could not get bank loans for buying new boats or fixing lempara. The
fishermen from Labuhan Bajo similarly had no access to credit to construct FADs
because the bank argued that the FAD construction was not a viable business. The
marine product business tended not to be favoured by the banks for loans. These were
the main constraints faced by the value chain actors at the village level.
6.4.2 Upgrading the products
Upgrading the products could add more value. This could be in the form of new
technology or methods and upgrading the value of the product (Schreckenberg et al.
2006; Subedi et al. 2007; Hempel et al. 2010; Jacinto and Pomeroy 2011). New
technology could lead to a modification of the existing gear used to harvest marine
products or farm seaweed. New methods to improve the value of the fish caught could
include rearing the juvenile marine products and waiting strategically for better prices.
Other innovation opportunities are to upgrade the products and adapt to new changes.
For example, value could be added locally to ensure the fish can be stored for a longer
time during abundant periods such as the west monsoon. One group of papalele said
they washed the fish several times using clean water and put a lot of salt on the fish. This
resulted in a good quality of sun-dried products. This process should be maintained.
Fishers could also get a better price for the sea cucumbers if they were willing to process
the product to the required quality of at least 50% dryness. The necessary technology
and methods are simple and could be transferred from exporters to farmers. The
exporters in Makassar said they had asked the fishers several times to process the sea
cucumber better but the fishers didn’t change their methods. The fishers knew how to
add value, but they still resisted implementing the changes. During the focus group
discussions, it was revealed that the fishers wanted to get money as soon as they
collected the products, whereas processing a good quality product required four to five

Chapter 6. Marine Product Value Chains _______________________________________________________________________
289
days. A bulk buyer in Bana confirmed that this was the reason for the fishers’
unwillingness to process the sea cucumber to a better quality standard.
The simplest way to increase the value of seaweed locally would be to improve the
quality: the seaweed should be harvested after 45 days to get a better gel strength.
Several fishers harvested in 30 days due to high demand and were also afraid of their
seaweed being stolen. Until the seaweed was processed, it was difficult to specify
whether it had been harvested in less than 45 days. Another quality requirement was for
the seaweed to be clean of sand, other algae, crushed gravel and calcareous growths. At
the industrial level, a moisture content level of over 35% would increase the cost as it
required more seaweed to result in the same amount of carrageenan contents. Purity was
needed to protect the products and the processing machines. With 35% moisture content
and 3% purity, the farmers would get a better price. One example of a new method in
post-harvesting is sun-drying the seaweed on a para-para (frame made from bamboo) or
hanging the attached seaweed on a rope (as if drying clothes) to improve the purity.
Another activity to add value to the seaweed would be to produce food products such as
jelly, puddings, crisps or sweets (Hambali et al. 2004; Poncomulyo et al. 2006; Fitriana
2007). The main ingredient in such products would be seaweed and the only additional
ingredients required would be those that fishing families were already using, such as
sugar, coconut milk and flour (depending on the food). The duration of the food making
process would be about the same as the normal cooking time and would only require
around 200 grams of seaweed. Children and adults like the taste of such products
because of the crunchiness and gel content. However, producers would need to create a
new market chain of seaweed-based food at the local markets. This product development
to support livelihood diversification is an option but would need to be carefully studied,
to ensure it would be socially, culturally and economically sound without negative
impacts.
Another way to increase value would be to at least process seaweed into alkali-treated
cottonii (seaweed flour) or semi-refined carrageenan chips. There had been discussions

Chapter 6. Marine Product Value Chains _______________________________________________________________________
290
to build seaweed processing companies in NTT Province. The idea was to build a
seaweed industry closer to the producers. However, a seaweed plant would need a lot of
water (1:10) and a good supply of electricity. At the time of this study, these two inputs
were scarce in NTT Province. Overall, multiple-level interventions, both local and
global, would be needed for the seaweed value chain as the local activity was strongly
interlinked with global policies and actions (Rodima-Taylor et al. 2012).
Other interventions
The management of resources and their habitats is needed in order to ensure supply. At
the time of this study, there was no resource management in place for any of the selected
products. Even though there were laws in place, they were rarely enforced. This is
discussed in more detail in the next chapter.
The introduction of aquaculture approaches would be one way to maintain the
availability of top shells and sea cucumbers destined for regional or international
markets. Small-scale sea ranching utilising simple technology could improve the supply
of certain marine products such as top shells and sea cucumbers. This would require
more research into the type of technology that is applicable in this area.
A reliable supply of ice and salt would lead to an upgrade of the value due to better
methods of preservation and expanded sales. Making this improvement would support
the women in the villages as they were mostly involved in the papalele role and
supported their local and family economies (Pryck 2013).
When I travelled to other parts of Indonesia that farmed seaweed, I observed the farmers
sun-drying the seaweed that was still attached to the rope just like drying clothes. Others
dried the seaweed on a bamboo frame without any plastic sheets. These methods enable
the water to drop directly and prevent the decay of the seaweed branches. Once the
seaweed was dry, these farmers sold it to their village traders. Improving the farmers’
knowledge about seaweed by understanding the optimal sea conditions for farming
would reduce loss of the product. These types of capacity building strategies would

Chapter 6. Marine Product Value Chains _______________________________________________________________________
291
require periodic mentoring and monitoring processes in order to improve and maintain
the capacity being built. Improving road conditions would also enable the communities
to access distant markets. In addition, innovation, skills and technology to add value to
the product are needed to create product differentiation (Yu et al. 2008).
Interventions to improve participation in the value chain could also emphasise the
strengthening of the capacity in a group. Jacinto and Pomeroy (2011) suggested that
working in a group is one way to improve the bargaining power in selling products and
purchasing inputs. A group approach would be necessary in strategies such as providing
ice and salt, improving farming techniques, sharing price information to groups, selling
products in a group, and initiating new activities that need large capital and energy.
As discussed in Chapter 5 (Section 5.2.5) in relation to social assets, a sense of
togetherness tied the participating members in executing activities. Hence, supporting a
group of people to meet customers’ requirements would be more effective than
individual-focused interventions. In addition, collective action as part of the Indonesian
rural economic system would strengthen the shared and common initiative among
villagers.
6.5 Conclusion
This chapter examined the value chain of marine products from Pantar Island. This
analysis mapped the production of four types of marine products – namely, various
species of fish, sea cucumber, top shells and seaweed – from producers to end
consumers, the market actors (producers, buyers and exporters), and the relationships
between the actors and how the prices were set. The aim of this chapter was to identify
opportunities to improve producer (and local trader) participation and improve
livelihood benefits and outcomes in terms of income as well as to reduce the
vulnerabilities and risks to livelihoods.
The analysis of the value chains of the marine products discussed in this chapter showed
that Pantar was strongly linked with the macro-economy in the region. The sun-dried

Chapter 6. Marine Product Value Chains _______________________________________________________________________
292
fish was traded mostly at the local market and involved more villagers in the area as
producers or village traders. The sea cucumber, top shell and seaweed examples
demonstrated how the value chains of Pantar marine products were part of international
market networks.
Actors with different roles were involved at every level of the value chains. Along the
chains, people from Pantar participated at the producer and village trader levels. Village
traders played a significant role in all of the product value chains. The village trader
provided equipment for fish production stages and communicated the product quality
and quantity standards. The village traders also supported fishing families in times of
need for daily provisions or emergencies.
There are opportunities to increase the benefits for fishers in Pantar. Addressing the
constraints (reduced stocks for all products, poor road conditions, scarcity of ice and salt,
lack of financial support, lack of knowledge and skills to identify the best fishing spots,
and the low quality of the sea cucumber and seaweed product) and upgrading the
products to get better value are among the key ways to strengthen the participation of the
communities along the chain.
Other challenges faced by the fishers and farmers in securing their livelihoods within
global and regional value chains were their limited capacity to negotiate the terms of
trade and limited access to credit for new initiatives or product expansions. Innovations
could include new methods for farming and better post-harvesting processes to increase
quality.
Looking at the ongoing trend of the demand for marine products in the market (local and
export), the fishers tended to exploit marine products when a big buyer offered a higher
price. Yet, in the meantime, the sustainability of marine resources was a significant
concern. The fishers experienced the supply of fish as a concern. Without resource
management, this would be expected to have serious impacts on the supply availability
of marine resources, connected ecosystems and thus livelihood outcomes (namely,

Chapter 6. Marine Product Value Chains _______________________________________________________________________
293
income, wellbeing and the provision of other services) in the short and long term. The
management of the marine products should consider the supply of the product as well as
the impact on local trade and people’s livelihoods. The next chapter discusses ways to
improve the management of the marine resources in Pantar with the participation of the
local communities.

Chapter 7
Potential Livelihood Implications and Opportunities from an MPA on Pantar Island
Papalele, women traders, are approaching the boat that just returned from fishing in
August 2008

Chapter 7. Potential implications and opportunities _______________________________________________________________________
294
Chapter 7: Potential Livelihood Implications and
Opportunities from an MPA on Pantar Island
This chapter presents a synthesis of the results and discussion regarding the
establishment of an MPA in Pantar, and the potential implications for the livelihoods of
communities on Pantar Island. This synthesis is developed from the examination of
lessons from Indonesia’s experiences in setting up MPAs as discussed in Chapter 4,
community livelihoods as discussed in Chapter 5, and market factors that affect the
degree to which people can exploit the resources as discussed in Chapter 6. The main
question considered in this chapter is: To what extent will local livelihoods be affected if
restrictions are placed on access to marine natural resources under the MPA?
This chapter also addresses three subsidiary issues. Firstly, what are the potential
impacts of MPA establishment? Secondly, are there other ways of achieving
conservation without adversely impacting on livelihoods? Thirdly, what are likely to be
the best practice for the establishment of an MPA on Pantar Island in terms of improving
livelihoods and achieving conservation goals?
This chapter starts by contextualising the Pantar Island conservation initiative within the
global context, which is driving Indonesia to establish MPAs. Initially in 2006 the Pantar
Strait marine conservation area was established and then it was extended as the Alor
District Marine Conservation Area. Indonesia’s contemporary legal framework for
implementing the conservation initiatives in coastal and marine areas is then discussed.
This includes a review of the current policy, its implementation and the central actors for
the management of marine resources. It also discusses the impact of regional autonomy
on marine resource conservation. This discussion contributes to an understanding of how
to strengthen the roles and rights of communities in the MPA. The potential impact of an
MPA on livelihoods is discussed by presenting an analysis of impacts from the different
types of management to be used in the conservation area zones and by five livelihood
asset classes. Consideration of gender is also provided in this assessment. The final part
Chapter 7. Potential implications and opportunities _______________________________________________________________________
295
of this chapter discusses the potential policy and action responses to reduce the impact
on communities and to improve local livelihoods.
7.1 Pantar MPA within global and national marine conservation
context
In recent years (as noted in Chapter 4), there has been a growing global movement
towards the establishment of marine conservation areas. Two international initiatives
have driven Indonesia’s conservation initiatives: the Vth World Parks Congress which
was held in Durban in 2003, and the Coral Triangle Initiative on Coral Reefs, Fisheries
and Food Security (CTI-CFF 2009). Each of these is discussed below.
7.1.1 Durban Action Plan
The World Parks Congress is a 10 yearly event, organised by the IUCN. The Vth
Congress in 2003 resulted in the Durban Action Plan. The Plan is not an
intergovernmental document but it has had a tremendous impact in assisting national
governments to create new protected areas. The Durban Action Plan urges national
governments and any contracting parties to the plan to ensure that viable representations
of every threatened species or under-protected ecosystems are conserved by 2010 (IUCN
2005a). The Congress called for the establishment of a global network of MPAs. The
Durban Action Plan targeted the achievement of a significant reduction in the current
rate of loss of biological diversity by 2010. The Durban Action Plan also encouraged the
establishment of trans-boundary initiatives and one of these regional initiatives in the
Asia-Pacific region was the Coral Triangle Initiative (discussed below). The Congress
recommended that national governments have at least 20% to 30% of each habitat in
strictly protected areas and to contribute to a global target for healthy and productive
oceans (IUCN 2005b). The Congress encouraged the contracting parties (including
Indonesia) to develop a management effectiveness plan to be applied to at least 10% of
all protected areas by 2010. As part of this commitment, the government of Indonesia
resolved to establish 10 million hectares of marine protected areas in 201010. This
10 http://www.cbd.int/Island/cop8.shtml

Chapter 7. Potential implications and opportunities _______________________________________________________________________
296
includes the existing and new MPAs. This was to underlie several new marine protected
areas in Indonesia, including the Alor District Marine Conservation Area.
7.1.2 Coral Triangle Initiative on Coral Reefs, Fisheries and Food Security
The CTI-CFF stretches across six countries, and includes the most bio-diverse reefs on
earth (WWF Australia 2009). The leaders of Indonesia, Malaysia, Papua New Guinea,
the Philippines, Solomon Islands and Timor Leste signed a declaration launching the
Coral Triangle Initiative on 15 May 2009.
The Regional Plan of Action (RPoA) is a core element of the CTI-CFF. The CTI-CFF
RPoA is the overarching strategy for the national action plans and consists of a non-
legally binding document which sets out the core goals, targets and actions for a ten-year
period. In the RPoA, the CTI-CFF aimed to address priority threatened biodiversity from
the impacts of climate change, over-fishing, unsustainable fishing methods and land-
based sources of pollution. These factors were stated to adversely affect food security,
employment and the standard of living of people who are dependent on resources for
livelihoods (CTI-CFF 2009). The CTI-CFF articulated the following five goals, namely
that:
1. Priority seascapes should be designated and effectively managed
2. An ecosystem approach was required for the management of fisheries and other
marine resources
3. Marine protected areas needed to be established and effectively managed
4. Climate change adaptation measures needed to be implemented, and
5. The status of threatened species needed to be improved.
The RPoA identifies potential coordination opportunities and joint priorities of all
member countries. Mechanisms for information exchange and synergistic learning
among overlapping institutions are needed. This is a challenge where coordination
involves multiple policy domains featuring different institutional arrangements
(Fidelman and Ekstrom 2012). In the past, marine resource policies and programs were
scattered among different agencies with little coordination (Rudiyanto 2002). This is

Chapter 7. Potential implications and opportunities _______________________________________________________________________
297
especially the case in a country like Indonesia where the decentralisation process gives
local governments the power to manage and control their areas. The Philippines applies
a similarly decentralised government system (Fidelman et al. 2011).
Another challenge to achieving conservation targets in the RPoA is how the perceived
conservation benefits in the CTI-CFF can bring direct benefits to local users. More than
120 million people, particularly those living in coastal communities, depend directly on
local marine resources for their livelihoods (CTI-CFF 2009). Whittingham et al. (2003)
reported that 5-20% of the coastal people in the CTI countries live on less than US$1 per
day. Clifton (2009) suggests that the CTI-CFF as a large-scale high profile conservation
program needs to carefully address how to help local communities adapt to new
restrictions due to the expanding network of MPA in the region. The challenge is to
ensure that efforts to increase the sustainable use of marine resource will not marginalise
the local users.
Indonesia, (and the other 5 countries), developed a National Plan of Action (NPoA). The
NPoA is based on the Indonesian Government’s long-term strategic plan related to CTI-
CFF. Through the NPoA, Indonesia shows the commitments specific to Indonesia’s
position and conditions, as well as priority actions aimed at achieving the targets agreed
in the RPoA (CTI-CFF Indonesia 2009).
Since the NPoA was initiated, there has been progress in Indonesia (Rudianto 2012).
Under goal one, Indonesia has set priority seascapes that serve as geographic foci for
major investments and action during 2010-2020 (National Secretariat CTI-CFF
Indonesia 2009). The geographic foci include Sawu, Sunda-Banda, Sulu Sulawesi, Birds
Head and Bismarck Solomon Seascapes (National Secretariat CTI-CFF Indonesia 2009).
Under the fishery goal, Indonesia developed a live reef fish management plan and
reviewed the management plan for tuna (National Secretariat CTI-CFF Indonesia 2009).
Under the threatened species target of the NPoA, a management plan for dugong, sea
turtles and sharks was developed but by late 2012 it had yet to become legally binding

Chapter 7. Potential implications and opportunities _______________________________________________________________________
298
(Rudiyanto, The Secretary of Interim Regional Secretariat personal communication,
2012).
As a priority marine conservation area, the “Sawu Sea” covers the entire Sawu Sea with
two main areas: Sumba strait and the Timor-Rote-Sabu Seas. The Alor District Marine
Conservation Area is part of the larger integrated Sawu Sea MPA although it is not
considered as the main geographic focus for the establishment of Sawu Sea MPA.
Several activities have been conducted since 2008, such as increasing the capacity of the
local planning body and awareness by local government and developing a draft
management plan for the Savu Sea including the institutional arrangements and
financing mechanism (TNC 2008; 2013).
7.2 Indonesia’s Recent Legal Framework for Establishing MPAs
There has been a major shift in policy on marine resources in Indonesia in recent years.
As discussed in Chapter 4, the Ministry of Forestry had the administrative mandate and
power to manage marine conservation. In 1999, the Ministry of Marine Affairs and
Fisheries (MMAF) was established with the government recognising the uniqueness of
marine ecosystems and the contribution of marine resources to Indonesia’s economic
situation. From that time, marine resources and new marine conservation policies were
administered under this ministry (KKP 2008).
There are two main laws regulating the conservation marine resources:
1. The Law of the Republic of Indonesia No. 27 of 2007 on the management of
coastal zones and small islands
2. The Law of the Republic of Indonesia No. 45 of 2009 which is an amendment to
Law No. 31/2004 on fisheries.
Law No. 27 of 2007
Law No. 27 of 2007 defines conservation as efforts for the protection, preservation and
exploitation of coastal zones and small islands, including their ecosystems, in order to
guarantee the existence, supply and sustainability of coastal zone and small island

Chapter 7. Potential implications and opportunities _______________________________________________________________________
299
resources, through the preservation and improvement of resource quality and diversity
(Article 1, paragraph 19). The conservation actions carried out for the protection and
preservation of the ecosystem coastal zones and small islands (e.g., fisheries resources)
relate to the habitat of marine biota, the migration channels of fish and other biota,
traditional cultural sites, and unique areas that are vulnerable to change (Article 28).
This law outlines the planning strategy for coastal areas and small islands, the utilisation
of the resources including the right to undertake business in coastal areas, conservation,
community empowerment, and surveillance and monitoring. This law recognises that the
coastal areas and small islands need to be preserved and exploited for the greatest benefit
of the people. It also acknowledges the role of local government in managing the
resources. For example, the zoning plans of coastal areas are determined by regulations
at the local government level.
Law No. 45 of 2009
The law on fisheries provides the legislative basis on which fisheries can be managed
sustainably. This law gives authority to the Ministry of Marine Affairs and Fisheries to
determine the potential capacity of marine resources for exploitation and to allocate the
allowable catch in certain areas, as well as to define the fishing equipment that may be
used and the space that may be used for aquaculture. This law also outlines two types of
conservation: marine conservation and the protection of fish sustainability.
In order to execute conservation initiatives, these two laws (Undang-Undang/UU) are
carried out under several government regulations (Peraturan Pemerintah/PP) and
ministerial decrees (Peraturan Mentri/PerMen) (refer to Figure 7.1).

Chapter 7. Potential implications and opportunities _______________________________________________________________________
300
Figure 7.1: Legislation governing establishment of MPAs in Indonesia The law No 45/2009 on fisheries is explained in detail in the government regulation (PP
No 60/2007) and the regulation of the minister (Figure 7.1). Meanwhile the law No
27/2007 on the management of coastal zones and small islands is explained directly by
the regulation of Minister of Marine Affairs and Fishery. These regulations are used as
umbrella for establishing an MPA in Indonesia. The discussion about these laws is in
relation to four themes: the lead agency for marine conservation; the role of local
governments in the era of autonomy; the approach to MPA establishment; and the
associated zoning process for MPAs.
Lead government agency in MPA establishment and management
Marine conservation is administered by the MMAF under the Law No. 27 of 2007 on
management of coastal zones and small islands and Law No. 45 of 2009 on Fisheries
(which is explained in Peraturan Pemerintah (PP) (regulation) No. 60/2007). Under
these two laws and government regulation, the Ministry of Forestry handed over eight
provincial level marine reserves (Table 7.1) to be managed by the MMAF. Excluded
from the hand-over several national parks that are still administered by the Ministry of
Forestry. This includes Wakatobi National Park, Bali Barat National Park, Teluk
Cendrawasih National Park in Papua and Riung Nature Reserve (refer to Chapter 4). If

Chapter 7. Potential implications and opportunities _______________________________________________________________________
301
the national park is larger in size, it is governed directly under director of
PHKA/Perlindungan Hutan dan Kelestarian Alam (Forest Protection and Nature
Conservation) while other types of reserves which are smaller in size and governed
under BKSDA/Balai Kelestarian Sumber Daya Alam (Natural Resource Conservation
Body), a division in PHKA (The Minister of Forestry Degree No 13/2005).
Table 7.1: MPAs handed over by the Ministry of Forestry to the Ministry of Marine Affairs and Fisheries
No. Marine Reserve Area (ha) 1 Banda Sea 2,500 2 Part of south east of Aru Sea 114,000 3 Raja Ampat in Papua 60,000 4 Islands of Gili Ayer, Gili Meno and Gili Trawangan in West
Nusa Tenggara 2,954
5 Kapoposan archipelago 50,000 6 Padaido archipelago 183,000 7 Panjang archipelago in Irian Jaya 271,630 8 Pieh Island in West Sumatra 39,900
Source: www.dkp.go.id sighted on 5 March 2009
Role of local governments
Both laws outline the role of national and local governments As part of the
decentralisation process in Indonesia, local governments are encouraged to prepare a
marine use zoning plan for MPAs that correspond to the local district (Kabupaten)
development plan (based on Law No. 27). The role of local government in managing the
coastal and marine resources is supported by other laws. These include Law No. 26 of
2007 on spatial planning (UU No. 26/2007 tentang Tata Ruang) and Law No. 32 of 2004
on regional government (UU No. 32/2004 tentang Pemerintahan Daerah) (the latter is
also known as the ‘law of autonomy’ and outlines the role of the district government in
executing their development priorities, including marine conservation (Article 18). Law
No. 32 of 2004 gives the authority to district local governments to manage coastal waters
and resources within four nautical miles from the shoreline to offshore or archipelagic
waters (Article 18).
The control of the coastal area by local government can be a threat to national
conservation plans if the local government has a different development plan priority to

Chapter 7. Potential implications and opportunities _______________________________________________________________________
302
that of the national government. For example, in order to increase revenue, a local
government may grant permits to exploit marine resources under its jurisdictional area
(Law No. 32/2004, Article 18). Gunawan and Visser (2012) reported on this occurring in
the region of Berau in East Kalimantan, where the uncontrolled issue of permits by local
government to outside fishers (‘nelayan Andon’) to exploit district waters threatens
national conservation goals of the MPA as well as local fisher livelihoods. Potentially a
similar situation could occur in the coastal areas around Pantar Island. Achieving the
conservation goals in Pantar as part of the Alor District Marine Conservation Area could
be in conflict with the local government priorities to raise revenue through issuing
fishing permits to outsiders.
Approach to MPA establishment
Under the law no 45/2009 the existing marine conservation areas managed under Bupati
decree or by local government regulation at the district level are considered only to be
proposed marine protected areas by the local government - not formally declared yet
(PerMen No. 2/2009 on the procedures for determining conservation areas, Article 27).
Under the law No 45/2009 the local government can propose the district-level
conservation area to the Ministry of Marine Affairs and Fisheries. The areas are then
declared as marine protected areas at the national level by the Ministerial decree. In May
2012, 36 marine conservation areas had been initiated by District local governments in
Indonesia11.
This was the case with the Alor District Marine Conservation Area, which was declared
by Alor Bupati decree in May 2009. At the time of writing (August 2013), the local
government was in the process of completing the required documentation to MMAF, to
have the area declared as an MPA as discussed later in this chapter (Section 7.3.2).
However, as late as February 2014 the Alor District Marine Conservation Area has not
yet been declared by the Minister of Marine Affairs and Fisheries.
11 http://www.kp3k.dkp.go.id/ktnl accessed on 10 May 2010
Chapter 7. Potential implications and opportunities _______________________________________________________________________
303
The required procedure for setting up a marine conservation area by the district
government is outlined under Peraturan Mentri (PerMen) No. 2/2009 on the procedures
for determining conservation areas. These processes involve: developing an inventory of
a potential protected area; conducting a survey of the ecology, economy and social
culture of the community; disseminating the survey results and holding feedback
sessions with the communities, especially regarding the area and type of the
conservation area; carrying out public consultation; and coordinating actions among the
relevant government offices (Articles 9, 10, 13, 14, 15, 16). PerMen No. 2/2009 also
outlines the role of local governments in establishing marine conservation areas and
setting up steering committees for the zoning system (Articles 13, 14, 20, 21, 24 and 25).
However, no suggestion is made as how to encourage community involvement and
recognise local communities as the main stakeholders. The recognition of the equal
opportunity of stakeholder groups is not expressed and approaches as to how to position
the stakeholder groups in conservation management are not well articulated. The
involvement of communities is only to be covered during “socialization” and public
consultation. There is a risk of marginalising the lower levels of the community in public
consultation. There is no article in the regulation outlining the activities that can be
collaborated on or how to provide an opportunity for the local community to manage the
marine area as part of the management. Thus it is difficult for communities to proclaim
their right and access to resources. In a discussion about the use of public consultation in
involving community in the resource management, Voyer et al. (2012) argued for the
inclusion of information dissemination and public consultation methods among the
social and economic considerations in MPA planning.
Therefore local government can choose to neglect to consult with and include the
communities who live and use the marine resources in the area being declared. As
discussed in Chapter 4, key informants from government representatives mentioned that
one of the reasons that fishers were less involved and not considered as one of the main
stakeholder groups in the three MPAs is that they were not explicitly mentioned in the
regulations or even the technical guidelines.

Chapter 7. Potential implications and opportunities _______________________________________________________________________
304
According to the regulations of the Ministry of Marine Affairs and Fisheries (PerMen
No. 16 and PerMen No. 17 of 2008), social and economic factors should be considered
in the establishment of an MPA. Article 13 outlines the data on socio economic such as
number of population, source of livelihoods, education, religion, infrastructure, local
wisdom, artifacts and regional plan. PerMen No. 17 also mentions that the purpose of a
management strategy is to improve social and economic activities of local communities
(Article 34). This regulation states that local communities must be able to access and
conduct their livelihood activities in a conservation area. However, PerMen No. 16 and
PerMen No. 17 do not state how to incorporate these social and economic factors in the
conservation plan.
Similarly, PerMen No. 2/2009 outlines that the determination process should incorporate
social, culture and economic criteria (Articles 4 and 5). Article 4 paragraph 3 says that
social and cultural factors include community support, potential conflict of interests and
threats and local wisdom. The economic factors (article 4 paragraph 4) include the value
of fisheries, tourism and aesthetic values, and access to the area. Article 5 also explains
that a proposal for an MPA should assess the potential conflicts in marine use and the
determination process should be supported by the communities, although the type of
community support needed is not clearly explained.
Process of zoning
Under PP No. 60 of 2007 on fish resource conservation, all marine protected areas
should have a zoning system as part of the management system (Article 17). This
regulation sets out four categories: i) the core zone, ii) sustainable fishing zone, iii) use
zone and iv) other use zone. PerMen No. 30/2010 outlines the criteria for and the
allowed activities in the zones. Local communities can access all zones, except the core
zone. At least 2% of the total sea area should be allocated to the core zone (Article 9,
Paragraph 3). For the purpose of the zoning process, social and economic data should be
incorporated (Article 9, Paragraph 4) by a team established for this purpose. Such a team
can include representatives from the management body, government institutions,
universities, non-government organisations, community and customary groups, and
Chapter 7. Potential implications and opportunities _______________________________________________________________________
305
private companies. Thus the local communities have a chance to be involved in the team
(Article 30,a). Another way for communities to get involved is by participating the
public consultation on the zoning (Article 30, f and h).
The regulations of the Ministry of Marine Affairs and Fisheries (PerMen No. 16 and
PerMen No. 17 of 2008; which refer to Law No. 27/2007) govern conservation in coastal
areas and around small islands. These regulations define a marine conservation area as a
marine protected area that is managed by a zoning system, to maintain a fishery and its
ecosystem management in a sustainable manner. PerMen No. 17 divides conservation
areas into 3 zones: i) core zone, ii) limited use zone, and iii) other zones. The core zone
is a restricted zone where no one can enter or exploit resources. The criteria for a core
zone are that the area is an important area for one of the following: for spawning, nesting,
as a nursery or feeding grounds, or as a migratory route for fish.
PerMen No. 17 of 2008 on conservation areas also outlines how customary use (loosely
defined as an area used for customary purposes) can be accommodated (Article 8,
Paragraph 1), provided the area is shown to be a sacred area for the local community
(Article 8, Paragraph 2). In this regard, the regulation states that the local community’s
interests must be taken into account. However, if no customary laws exist then the
communities’ interests are unlikely to be appropriately accommodated in the zoning plan.
There are several areas, including Pantar Island, where the traditional rules of
concerning the sea appear to no longer exist. But some local communities have rules for
local users (for example an area where they will not go for fishing or if they want to go
for fishing in an area where they must ask permission from the land owner nearby). This
was revealed in this study during the focus group discussions at the four villages (see
Chapter 4).
The PerMen No. 16 of 2008 (Article 3) clearly states that the zoning plan process should
involve the community. PP No. 60/2007 states that the community and customary
groups can be part of the zoning plan team. However, it is not clear which parts of the
community should participate in the process and how to enable this to happen.

Chapter 7. Potential implications and opportunities _______________________________________________________________________
306
In summary there are some major limitations in the regulations to the approach by local
government to establish MPAs in relation to the involvement of communities in the
process. During the establishment phase, community involvement is limited only to
public consultation and no clear means of involving the communities is specified. What
support is needed from the communities for determination of MPA, and how the
community will be represented are unspecified. In the next section I examine how these
issues have played out in the Alor Sea conservation area.
7.3 Alor District Marine Conservation Area
This name given to what is now called the Alor District Marine Conservation Area by
the government was “Sea Garden” (‘Taman Laut’ in Indonesian) (2002). Then it became
the Pantar Strait Conservation Area (Kawasan Konservasi Laut Daerah Selat Pantar)
(2006) and then the Alor District Marine Conservation Area (2009) (Kawasan
Konservasi Perairan Daerah/KKPD). This section reviews the background to the
establishment of the Area, NGO participation and their role in the preparation of the
zoning plan during the period from 2002-2013.
7.3.1 Background to the Pantar Strait MPA
The islands in Alor district are located at the junction of the Banda-Flores Sea and Indian
Oceans and are separated by narrow passages that are of major importance to cetacean
movement (Kahn 2002). The WWF-TNC identified several reasons to set up a marine
conservation in this area in 2002. These included the need for the creation of a cetacean
corridor (e.g., blue whales and sperm whales), protection for dolphins, marine turtles
(leatherback) and manta ray, and to relieve extensive fishing pressure from some places
in this area (Pet-Soede 2002).
The Pantar Strait was declared a “Sea Garden” by Bupati Decree No. 5 of 2002 (SK
Bupati No. 5/2002 tentang Taman laut Selat Pantar). This decree stated the focus of this
area was for marine tourism and habitat protection from destructive fishing methods.
This declaration was supported by national and local governments and NGOs. A meeting
Chapter 7. Potential implications and opportunities _______________________________________________________________________
307
in Jakarta encouraged the Bupati of Alor to enhance the marine management system for
both migratory marine mammals and coastal and offshore habitats (Kahn 2004).
Following this meeting, a study concerning the spatial planning of the Pantar strait was
conducted by a consultant in 2004 (Dalla Billa Sejati and Department of Marine Affairs
and Fisheries, 2004). The meeting and study resulted in a change of the marine park’s
status to become a marine conservation area through Bupati Decree No. 12 of 2006 on
the determination of Pantar Strait as a district conservation area (Peraturan Bupati Alor
No. 6/2006 tentang Penetapan Selat Pantar sebagai Kawasan Konservasi Daerah). This
decree stated that the objectives were to protect the coral reef habitats and provide a
migratory corridor for cetaceans. The Pantar Strait Conservation Area covered an area of
480.44 km2 in the Pantar Strait.
The Alor local government constructed an information board near a jetty in Alor Kecil
village on Alor Island in 2006 to inform the communities and visitors about the
established of the Conservation Area. During 2006 to 2009 there was no management
system in place: the area was effectively a “paper park”. When I visited this area in
2008-2009, fishers from communities of Pulau Pura, Bakalang and Kokar in the Strait
did not know of the conservation area.
An event was held on 22 November 2008 to celebrate the declaration of the Pantar Strait
conservation area. This involved a traditional lego-lego dance led by the Bupati of Alor
on Lapang Island. The planning team (involving representatives from the Fisheries
Department of Alor District and WWF) only invited village leaders from Baranusa to
this event. In fact, the area being declared is not only used by Baranusa people to fish
around Lapang Island but also people from Kabir, Kangge, Lembata and other villages
in Pantar also fish around Lapang Island (Chapters 5 and 6). The lego-lego event was
followed by a workshop attended by all village leaders of Alor District in Kalabahi, Alor
on 24-25 November 2008. This workshop resulted in a verbal agreement among
participants to close Lapang and Batang Islands from being utilised for.

Chapter 7. Potential implications and opportunities _______________________________________________________________________
308
On 28 November 2008, an information board was built on Lapang Island to inform
people that the area was closed to fishing. When I told this to several fishermen in
Labuhan Bajo, Kabir and Baranusa around that time, none of them knew about it. During
June-July 2009, there was a reaction from the Blangmerang community against the
conservation initiative. Their issue was the fear that Lapang Island was being sold to
outsiders. I traced the development of this misperception with village leaders in
Blangmerang Village, WWF Indonesia, the District Department of Marine Affairs and
Fisheries in Kalabahi and fishers from Blangmerang Village. According to R, Staff from
Alor District Marine Affairs and Fisheries, a tourist in Lapang Island read the
announcement of the closing of Lapang Island. The tourist asked an eldery fisherman in
Lapang Island why he still fished in that area. That frightened the fisherman who
returned to the village of Blangmerang and told his family and friends about this fishing
ban in Lapang Island. This was verified by Z, a WWF-Indonesia staff member. The issue
became controversial, especially during the parliamentary election in 2009. In June 2010
when I visited Lapang Island, the information board had been taken down was used as a
base to dry seaweed.
Marzuki, a local historian from Baranusa who lived in Kabir, explained that Baranusa
Kingdom once governed access to the area and the allowed fishing methods and vessels
on Lapang Island (personal communication, 2008). Several regulations made by the
Kingdom existed that specified the allowed area and time for wud in Baranusa Language
(bubu - fish trap), and allowed top shells to be collected for six months a year. However,
this regulation was no longer enforced. In 1982-87, Baranusa sub-district leader, Syarif,
revitalised the Baranusa Kingdom rule to close Lapang Island from fishing activities.
However, many people disagreed with the rule, especially the Bajau people from Kabir,
because they wanted to continue fishing around Lapang Island. As the resentment raised
conflict, the rules were abandoned.

Chapter 7. Potential implications and opportunities _______________________________________________________________________
309
7.3.2 Alor District Marine Conservation Area
The Alor district government extended the Pantar Strait Conservation Area to adjacent
waters. This decision was declared by Bupati Decree No. 6//2009, signed on 13 March
2009 (see Appendix I). The area covers the entire Alor Sea. The conservation area is
now called Alor District Marine Conservation Area.
Figure 7. 2: Map of Alor District Marine Conservation Area (Source: Bupati Decree No. 6/2009)
The Alor District Marine Conservation Area covers the entire sea of Alor from east to
west (Figure 7.2). The coordinates were determined from the outer point of the Alor
border and then a line was drawn to shape a square. The border with Lembata Island was
drawn from four nautical miles from the coast based on Law No. 32 of 2004 that gives
the authority to district government to manage the resources up to 4 nautical miles. The
total conservation area of 4,000km2 covers Lapang Island (3.13km2), Batang Island
(4.38km2), Kambing Island (2.50km2) and Rusa Island (13.75km2). These four islands

Chapter 7. Potential implications and opportunities _______________________________________________________________________
310
were declared tourism-based conservation marine areas in 1983 at which time a deer
survey was conducted on two islands and since 2002 have been managed by the Forestry
Department as follows:
1. Lapang and Batang Islands which cover 1100 hectares each, of tourism area,
under the Forestry Ministry Decree No. 89/1983.
2. Rusa Island which covers 1,384.65 hectares of tourism area, under the Forestry
Ministry Decree No. 8820/2002
3. Kambing Island which covers 2,500 hectares
The objectives of the Alor District Marine Conservation Area are:
1. To protect the critical habitats for nursery grounds, feeding grounds, and
spawning grounds;
2. To manage the stability of fish stocks;
3. To protect critical ecosystems; and
4. To improve social and economic conditions for local communities (Bupati
Decree No. 6/2009 tentang Kawasan Konservasi Laut Daerah Alor).
Since 2009, it has been difficult to assess progress towards achievement of these
objectives as the planning team (Alor Local government and WWF) are still engaged in
several activities to develop a number of outputs to submit to MMAF as required by the
PerMen No 2/2009 in order for MMAF to declare the area an MPA (as of late 2013).
These included a preliminary survey of the marine ecology, a workshop organised by the
local government with local stakeholders, public consultation and a management plan
that include zoning (approved by Bupati in April 2013).
The objectives were taken literally from the laws without considering local priorities.
The objective 1 and 3 were taken from article 33 of PerMen no 17/2008 while the
objective 2 was taken from article 5 paragraph 3 PerMen No 2/2009 and the objective 4
was taken from article 34 of PerMen no 17/2008. The fishers did not know of these
objectives (based on focus group discussions in the four villages). The objectives are to
general to respond to the local area’s environmental needs and the local communities’

Chapter 7. Potential implications and opportunities _______________________________________________________________________
311
livelihood concerns. As Jentoft et al. (2011) warned, unclearly stated goals might have
different meanings to different people which might result in placing the communities’
concerns as the lowest priority.
7.3.3 NGO initiatives in Alor
The Alor District Marine Conservation Area is supported by two international NGOs -
WWF and TNC. Most of the planning activities were driven by WWF-Indonesia as
WWF had a strong presence in this area under their Alor-Solor Project, which has
existed since 2006 (WWF Indonesia 2006). Due to the active role of WWF in this area,
it is important to assess their activities in relation to the Alor District Marine
Conservation Area.
WWF-Indonesia, as a leading conservation organisation in this area, had the goal to set
up a MPA and a marine management plan for Alor, Solor and Lembata region (WWF-
Indonesia 2006). The team identified 21 villages that were considered to be their main
target across the region in Alor-Solor and Lembata. The criteria were: coastal villages
thought to be involved in or the location of illegal fishing; more community leaders who
can influence to their own and neighbouring villages; and accessibility. Among 21
villages in this region, WWF-Indonesia prioritised seven villages (Blangmerang, Kayang,
Marisa, Kabir, Adang, Kabola, and Kokar) for their project activities in Alor District.
WWF conducted a social and economic baseline survey in these villages in 2008-2009.
This survey covered general data on activities of 7 communities including marine use,
conservation threats and constraints to meeting with the communities. The data were
collected from government institutions and from discussions with village leaders. This
survey report was used as a supporting instrument to establish a sustainable livelihood
program for local communities of seven villages (WWF-Indonesia 2009a) (see the
discussion on social assets in Chapter 5).
In early 2009, WWF – Indonesia in collaboration with the District Department of Marine
Affairs and Fisheries assessed the area spatially. This resulted in a map showing the
conservation borders that was attached to Bupati Decree No. 6/2009 (see Figure 7.2

Chapter 7. Potential implications and opportunities _______________________________________________________________________
312
above). In 2009, these two organisations also conducted a survey of coral reef and fish
biomass. The survey was conducted in 13 locations in Pantar Strait, north of Pantar
Island, including Lapang and Batang Islands (WWF Indonesia 2010). In March 2010, an
initiative to determine the borders of Alor District Marine Conservation Area was
conducted.
WWF-Indonesia formed seven different community groups in the targeted villages in
Alor District to award small grants for the community group from WWF-Indonesia in
early 2010. The grants were distributed in September 2010. Social and economic
indicators were selected and measured (such as fishing methods, fish captured) on the
basis of intervention or activities (Eghenter 2011). To provide an opportunity for
communities to be involved in conservation activities, WWF-Indonesia initiated a
meeting in Kalabahi in November 2010 with communities from Alor Island, Flores
Timur and Lembata Island. The purpose of the meeting was to establish a discussion
forum for local communities in the Alor-Solor region. Most of the participants were
village leaders from the 21 targeted villages in Alor, East Flores and Lembata districts -
the area of WWF-Indonesia Alor Solor Project (Atapada and Purnomo, 2008).
WWF Indonesia also conducted ecological studies to assist in develop zoning plan (e.g.,
a study of coral health and identification of spawning sites to determine the core zone) in
2011 (WWF-Indonesia 2012). This included identifying the important habitats, the
location of spawning areas and nursery grounds. In 2012, WWF-Indonesia conducted an
evaluation of fisheries performance of Alor Sea (WWF-Indonesia 2012a). The results of
these studies were used for the zoning plan.
A summary of the key declarations, initiatives, assessments by the local government and
the NGO from 2002 to 2013 is provided in Table 7.2 below.

Chapter 7. Potential implications and opportunities _______________________________________________________________________
313
Table 7.2: The process of the establishment of Alor District Marine Conservation Area
Year Activities led to the establishment of Alor District Marine
Conservation Area
2002 Declaration of “Sea Garden” of Pantar Strait (Taman laut Selat Pantar) through Bupati Decree No. 5 of 2002
2002 Ecology survey in Pantar by WWF-TNC
2004 A meeting hosted by Alor Local Government on migratory marine mammals and coastal and offshore habitats in Selat Pantar in Jakarta
2004 A study on Spatial Planning of Pantar Strait by PT Dalla Bila Sejati and Department of Marine Affairs and Fisheries
2006 WWF-Indonesia commenced the Alor-Solor Project
2006 The Pantar Strait Conservation Area was declared through Bupati Decree No. 12 of 2006
22 Nov 2008 A traditional lego-lego dance led by the Bupati of Alor on Lapang Island to celebrate the declaration of the Pantar Strait conservation area
24-25 November 2008
Workshop attended by all village leaders of Alor District in Kalabahi, Alor on 24-25 November 2008. This workshop resulted in a verbal agreement among participants to close Lapang and Batang Islands from being utilised.
28 November 2008
An information board was built on Lapang Island
2008-2009 WWF conducted a social and economic baseline survey in 21 targeted villages of WWF-Indonesia Solor Alor Project
Early 2009 WWF –Indonesia in collaboration with the District Department of Marine Affairs and Fisheries assessed the area spatially
13 March 2009 The Alor District Marine Conservation Area is determined through Bupati decree No. 6/2009
2009
WWF-Indonesia and Department of Marine Affairs and Fisheries of Alor District conducted a survey of coral reef and fish biomass in 13 locations in Pantar Strait, north of Pantar Island, including Lapang and Batang Islands.
March 2010 A survey to determine the borders of Alor District Marine Conservation Area was conducted.
Early 2010 WWF-Indonesia formed a community group in seven targeted villages in Alor District to award small grants from WWF-Indonesia
September 2010 The grants were distributed to 7 villages May-October
2011 An ecological study by WWF-Indonesia was conducted.
Feb-March 2012 Public consultation by planning team to the representatives of communities at sub-district level in the capital city of coastal subdistrict.
June 2012 Discussion between ADMCA planning team and Alor local governments about zoning plan
12 April 2013 The management plan and zoning of Alor District Marine Conservation Area was designated through Bupati Decree No 4/2013
January 2014 The declaration of Alor District Marine Conservation Area is waiting for Minister of Marine Affairs and Fisheries approval

Chapter 7. Potential implications and opportunities _______________________________________________________________________
314
7.3.4 Proposed zoning plan
The planning team prepared the first draft of the zoning at the end of 2011 (Table 7.2).
Thus, meetings with the community representatives at sub-district level were organised
to inform them about the draft zoning plan on February-March 2012. Then, discussions
were held with government officers where this draft was presented at a meeting in
Kalabahi (Alor District Governments 2012). In April 2013, the Bupati approved this
zoning plan (Peraturan Bupati No. 4/2013) (Figure 7.3).
In line with PP No 60 2007, the draft of zoning plan establishes four types of zones: a
core zone where no activities are allowed, a protection zone with only limited activities
are allowed, a tourism zone, and a sustainable fisheries zone (Table 7.3). The proposed
total area for the core zone is 7,731.44 hectares and the protection zone is 7,746.35
hectares (Bupati Decree No 4/2013) (Figure 7.3). In November 2013, this document was
being discussed at the provincial level with the intention to submit to the MMAF to be
determined as a marine conservation area by the Minister.

Chapter 7. Potential implications and opportunities _______________________________________________________________________
315
Figure 7.3: Map of proposed zoning plan of Alor District Marine Conservation Area (Source: Peraturan Bupati No. 4/2013)

Chapter 7. Potential Implications and Opportunities ____________________________________________________________________
316
Table 7.3: Regulations governing activities in the Alor District Marine Conservation Area
Activity Core Zone Protection Zone
Tourism Zone
Sustainable Fishery Zone
Traditional fishing (canoe with no engine)
X √ √ √
Demersal fishing (hand-line and hooks)
X √ √ √
Troll fishing X √ √ √ Farming X √ √ √ Gillnet X X X √ Fish trap X X X √ Stone weir fishing method X X X √ Dive to collect sea cucumbers, lobsters and shells
X X X √
Spear gun X X X √ Collecting fish in the intertidal waters
X X X √
Fish aggregating devices X X X √ Purse seine (<2inch) X X X X Lift nets X X X √ Research P √ √ √ Boat sailing without stop x) √ √ √ Boat sailing and anchoring x) √ √ √ Tourism X √ √ √ Restoration √ √ √ √ Education √ √ √ √ Customary and cultural use √ √ √ √ Source: Peraturan Bupati No. 4/2013 on the proposed zoning plan of the Alor District Marine Conservation Area. Note: √=permitted; X=forbidden; x)= allowed to sail without stop in emergency situation, P=prior permit required; A=local fishers only; G=general fishers permitted
Over the last seven years, a series of activities have taken place culminating in the
determination for the ASDCA. As shown above there has been relatively little
community consultation in this process. It was largely driven by non-government
organization with the support of the local government. In the next section I examine
how this determination could impact on local livelihoods of Pantar island coastal
communities.
7.4 Potential Changes in Livelihoods and Their Implications
This section analyses the potential implications of the proposed zoning plan and
establishment of the proposed MPA on local livelihoods where only limited activities
would be allowed.

Chapter 7. Potential Implications and Opportunities ____________________________________________________________________
317
7.4.1 Livelihood impacts due to the zoning plan
The immediate implication of the zoning system is a spatial separation of users from
the marine resource. The no-take rule will apply in the core zone where entry will
only be permitted for customary purposes. Fishers can catch fish in the protection
and tourism zones but only with outrigger canoes and hand-line fishing methods.
Other activities allowed in these two zones are farming, tourism and customary
activities. Meanwhile, in the sustainable fishery zone, people can fish (except purse
seine with a mesh size less than two inches).
Several zones are scattered around the coasts of the small islands adjacent to Pantar
Island: Rusa Island, Kambing Island, Tanjung Soyang, Batang Island, Lapang Island,
and Kabola-Alila (Figure 7.3). Waters adjacent to half of Rusa Island will be
restricted and almost the entire coast of Kambing Island. The entire coast of Tanjung
Soyang, which is located to the south east tip of Pantar Island, is heavily utilised for
fishing but will be closed (see the discussion in Chapter 5 on natural capital). This
will impact on fishers from Marisa, Kayang and Labuhan Bajo (Table 7.4). The
closing of the north of Lapang and Batang Islands will be likely to impact on fishers
from Blangmerang village and Labuhan Bajo and fishers from Lembata Island who
also fish in this area. Restricting access to the north of Lapang Island will particularly
impact on Bajau people as they mostly catch and temporarily live in huts above the
coral reef in this area (Chapter 5). Kabola and Alila are located on the Alor Island.
Only Bajo fishers are reported to capture fish in this area (Figure 7.3). Table 7.4
presents a summary of the communities that will potentially suffer from restrictions
by gender. This table resulted from an analysis of impacts from the four Pantar Island
villages regarding the core zone area (Table 7.4 and Figure 7.3) and fishing locations
as discussed in Chapter 5.
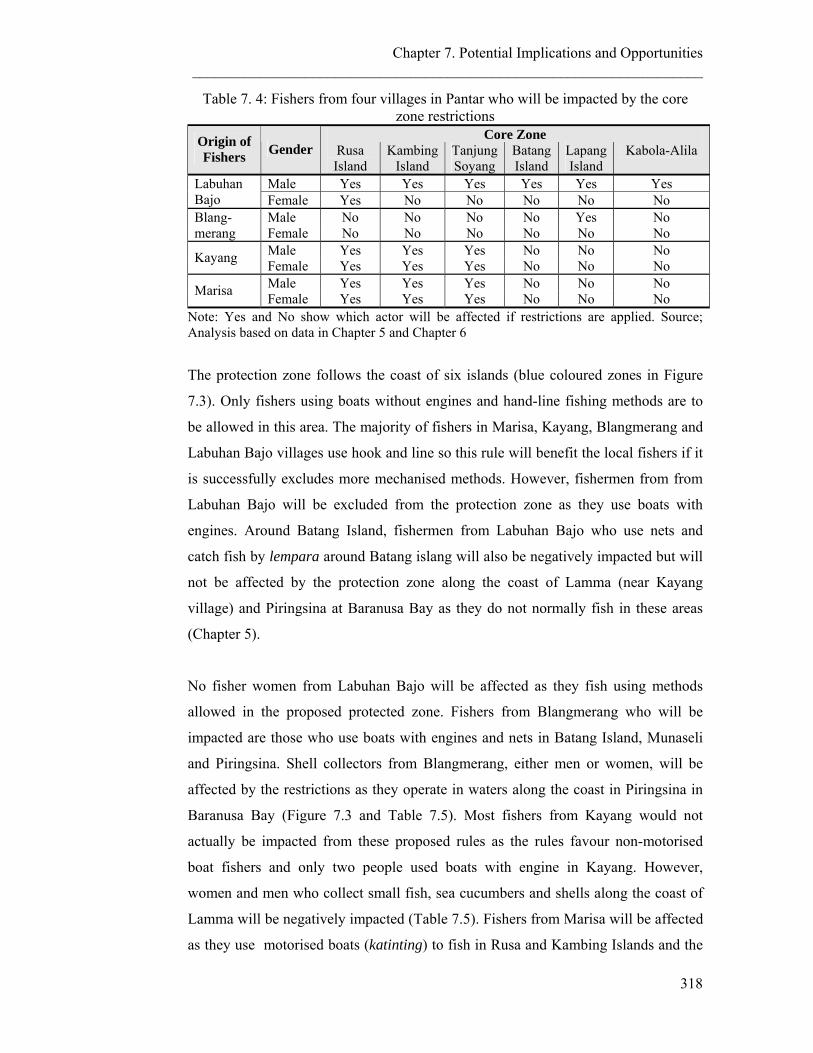
Chapter 7. Potential Implications and Opportunities ____________________________________________________________________
318
Table 7. 4: Fishers from four villages in Pantar who will be impacted by the core zone restrictions
Core Zone Origin of Fishers
Gender Rusa Island
Kambing Island
Tanjung Soyang
Batang Island
Lapang Island
Kabola-Alila
Male Yes Yes Yes Yes Yes Yes Labuhan Bajo Female Yes No No No No No
Male No No No No Yes No Blang-merang Female No No No No No No
Male Yes Yes Yes No No No Kayang Female Yes Yes Yes No No No Male Yes Yes Yes No No No Marisa Female Yes Yes Yes No No No
Note: Yes and No show which actor will be affected if restrictions are applied. Source; Analysis based on data in Chapter 5 and Chapter 6
The protection zone follows the coast of six islands (blue coloured zones in Figure
7.3). Only fishers using boats without engines and hand-line fishing methods are to
be allowed in this area. The majority of fishers in Marisa, Kayang, Blangmerang and
Labuhan Bajo villages use hook and line so this rule will benefit the local fishers if it
is successfully excludes more mechanised methods. However, fishermen from from
Labuhan Bajo will be excluded from the protection zone as they use boats with
engines. Around Batang Island, fishermen from Labuhan Bajo who use nets and
catch fish by lempara around Batang islang will also be negatively impacted but will
not be affected by the protection zone along the coast of Lamma (near Kayang
village) and Piringsina at Baranusa Bay as they do not normally fish in these areas
(Chapter 5).
No fisher women from Labuhan Bajo will be affected as they fish using methods
allowed in the proposed protected zone. Fishers from Blangmerang who will be
impacted are those who use boats with engines and nets in Batang Island, Munaseli
and Piringsina. Shell collectors from Blangmerang, either men or women, will be
affected by the restrictions as they operate in waters along the coast in Piringsina in
Baranusa Bay (Figure 7.3 and Table 7.5). Most fishers from Kayang would not
actually be impacted from these proposed rules as the rules favour non-motorised
boat fishers and only two people used boats with engine in Kayang. However,
women and men who collect small fish, sea cucumbers and shells along the coast of
Lamma will be negatively impacted (Table 7.5). Fishers from Marisa will be affected
as they use motorised boats (katinting) to fish in Rusa and Kambing Islands and the

Chapter 7. Potential Implications and Opportunities ____________________________________________________________________
319
south coast of Kangge Island (Figure 7.3). Since sea farming would still be allowed,
there will be no impact on seaweed farmers in all four villages.
The tourism zone, which is identical to the protection zone in terms of regulation,
covers the area of north of Pantar Strait to Pulau Pura. Only few villagers from the
four villages capture fish in this area. It is mostly used by villagers from the east
coast of Pantar to Alor Island. Learning from Mabini Reserve in Philippine (Chapter
4, page 108) conflict occurred due to resentment by local fishers to tourism actors
about difference in arrangements accessing marine resources. This caused decreasing
support by fishers to marine resource management activities.

Chapter 7. Potential Implications and Opportunities ____________________________________________________________________
320
320
Table 7.5: Impacts of restricted zone on marine users and activities from four villages in Pantar
Protection Zone Origin
of Fishers Gender West coast
of Rusa Island
North coast of Kambing
Island
South coast of Batang Island
West to South coast of
Kangge Island
Coast of Lamma-
Beangonong
Coast of Munaseli
Coast of Piringsina to Baolang
Coast of Beang
Male Be Be Be,N, CN Be No Be,N, CN, L, BL, Kf
No Be,N, CN Labuhan Bajo
Female No No No No No No No No
Male No No Be, N, CN No No Be,N, CN,Be,N, CN,
Sh No Blang-
merang Female No No No No No No Sh No Male No No No No N, Sg, Sc No No No
Kayang Female No No No No
Kr, Hs, Sc, Sh
No No No
Male Be Be No Be, Sc, Sg No No No Be Marisa
Female No No No No No No No No Source: Analysis based on data in Chapter 5 and Chapter 6 and Figure 7.3 Be = boat with engine N = net Sg = spear gun CN= cast net L = lempara (mid-water trawler) BL = bottom long line
Kf = kite fishing Kr = ker/fish trap Hs = hook and stick Sc = sea cucumbers Sh = shells No = fishers rarely do activities in the area

Chapter 7. Potential implications and opportunities __________________________________________________________________________
321
The potential implications to livelihood assets and outcomes are shown in Table 7.6.
Table 7.6: Potential impacts on livelihoods due to displacement from fishing grounds by assets and outcomes
Livelihood Assets Human Natural Physical Financial Social
Outcome
competition in new fishing areas
new knowledge about fish in new places needed
fishing becomes less attractive source of livelihoods
increased out-migration
allows restocking improved condition of habitats intensive fishing in allowed places immediate low catch improved catch overtime (long term)
adjustment of the gear with new regulations
displacement of people to other fishing spots
More capital needed to invest in new gear
limited access to sea
competition in fishing and selling fish
conflicts in new areas
conflicts with regulators
new leadership established
more dependence on families and capital providers
impacts on marketing system less (short term) food for household consumption tempted to fish in the restricted areas where little enforcement negative attitude to conservation and fisheries management
Potential implications for human assets
Competition between displaced and existing fishers will be greater in the conservation
areas. Geer et al. (2013) found that the remaining open grounds in Moreton Bay Marine
Park (in Australia) were overcrowded. This will be likely to happen in Pantar as the core
zone will move people to the protection zone and other zones and regions of the Pantar
Sea (Figure 5.4 and Figure 7.3). New knowledge will be needed to fish at the new areas,
such as knowledge about tides and good fishing grounds (based on focus group
discussions; refer to Section 5.2.6). Although the knowledge of good fishing grounds is
common knowledge, information on fishing spots and methods are highly secret,
especially spots that produce commercially valuable marine products (McGoodwin
1990). If fishers are displaced beyond boundaries of the areas known to them, it will
create confusion among them when they try to identify new fishing grounds (Teh et al.
2012).

Chapter 7. Potential implications and opportunities __________________________________________________________________________
322
In the longer term, the restricted access and the displacement of fishers and the increased
competition is likely to cause fishing to become less attractive as a source of livelihood.
As a result, fewer people will fish. A study in the Philippines found that 50% of the
fishers surveyed will leave the fishery sector when daily catches fall to 0.5 kg (Mualil et
al. 2011). In addition, more alternative source of income that provides better income will
push people to move away from fishing, for example seaweed farming (Section 5.6.1 on
page 218 and Table 5.7 on page 219). The case study in Pantar Island shows that
seaweed farming had given better income for the villagers and took their time to manage.
They conducted less fishing activity than seaweed farming. If people leave the fishing
industry, then fishing knowledge will be lost.
If fishing becomes less attractive, more people will try to find work in other areas such
as working as crew on pelagic fish boats or in other areas. Especially in Pantar where the
options to diversify livelihoods are limited, this situation will push more people to
migrate and will affect the population structure over time. This already happened during
the low fishing season (as discussed in Chapter 5), when villagers find another source of
income in Lembata or leave to work in Malaysia.
Potential implications for natural assets
The core zones are created to help facilitate the recovery of marine resources (Russ and
Alcala 2003). As a result, fish will be more abundant in the restricted areas due to
environmental improvement and less pressure (Byers and Nonburg 2007).
In the longer term, the fish caught will increase around the core zone through “spill-
over” resulting from increases in fish populations within the conserved zone (Roberts et
al. 2001; Gell and Roberts 2003; Roberts et al. 2005). The Apo Island Marine Reserve in
the Philippines was established over 20 years ago. The fishers experienced the fish catch
increased by 30% and time spent fishing was 15% shorter (van Beukering et al. 2007). It
is expected that fish will be in abundance in the multiple use zone due to spill-over;
however, the size of the restricted area must count fish movement rate (McClanahan and
Mangi 2000; Gell and Roberts 2003; Pitchford et al. 2007; Unsworth et al. 2010). If the
Chapter 7. Potential implications and opportunities __________________________________________________________________________
323
migration rate area is smaller than the restricted zone, the total catch will be relatively
small.
During focus group discussions in this study, the fishers in Pantar queried who would
benefit from the abundant fish in the core zone, especially reef and demersal fish as a
result of MPA. The fishers imagined that they would have an immediate low catch due
to conservation restriction. However, Yasue et al. (2010) found in the Philippines,
fishers catch size was bigger than the fishers’ perception about their likely fish catch size
in the restricted area that they could access.
On the other hand, fishing pressure in the zones where it is still allowed might increase.
People will fish there more there because they can no longer fish where they did before
the zones were established. The fishers may intensify fishing activities by using more
capital intensive equipment and labour. A similar situation can exist with an open and
closed season system where more intensive fishing effort is squeezed into the open
season (Hanneson 1998).
The restrictions in mangrove areas (such as along the coast of Piringsina to Baolang in
Baranusa Bay on Pantar island) will also prevent firewood logging in protected
mangrove forests and prevent the sentigi hunters accessing these areas (see Chapter 5).
As a result, mangrove destruction will decrease if a management system is implemented
effectively and mangrove logging is not displaced to unprotected forests. The protection
of mangroves could provide a better environment for mangrove resources (such as a
better habitat for shells) in the allowed areas. Women might gain benefits if they could
access the mangroves to collect shells but, unfortunately, the collection of shells is not
allowed along the coast of Piringsina to Baolang where women and children from
Blangmerang and neighbouring villages previously collected shells.
Potential implications for physical assets
Fishers will have to adjust their gear due to new regulations. Fishers from Blangmerang
and Labuhan Bajo hamlet who want to continue fishing in the protection zone will have

Chapter 7. Potential implications and opportunities __________________________________________________________________________
324
to use boats without engines. This would mean longer travel time to and from fishing
groups and the risk of fish decay due to longer travel time and may leave the motors,
which are a significant capital asset, unproductive and an effective loss of capital. The
number of people who fish in the areas where fishing is allowed may increase as
discussed before. Investment may be needed in new fishing gear to overcome at least the
near term disadvantages of loss of access to fishing grounds. This would likely escalate
competition between fishers and once the more efficient gear is in general use it will
become hard to reverse this trend. Fishers may also have to modify or replace their
existing boats so they can sail further distances to fishing grounds.
Potential implications for financial assets
An alteration of fishing methods would affect the type of fishing, the species caught and
the way that they were processed and may also shift the loction where the fish are sold.
Many fishers from this area use sail powered vessels and use the currents and tides to
assist them – it is a low technology method. In the protection zones, they they can only
use boats with no engines to fish in the allowed areas around Rusa Island. The fishers
from Blangmerang and Labuhan Bajo have to prepare more logistical support (e.g., salt,
meals, cigarettes and torches). In addition, fishers who use cast net have to ensure they
catch pelagic fish far from the coast. For example, there would be restrictions on
catching fish along the Lamma coast, Batang Island and north of Munaseli where they
normally catch pelagic fish. Lempara owners also have to ensure that they catch fish far
from Munaseli coast. This is likely to cause an increase fuel costs to enable fishing far
from the coast.
Potential implications for social assets
Several impacts on social assets will occur due to the restricted zones (Table 7.3).
Fishers are likely to disagree about who can operate inside the protection zones. Serious
threat of being robbed of their livelihood and consequently their identity will cause the
local fishers to not support or comply with the rules on the marine protected areas.

Chapter 7. Potential implications and opportunities __________________________________________________________________________
325
Displacement fishing areas can create problems. The fishers who live near that area will
expect to have priority, while other fishers who have had access to that area for a long
time will demand the same rights that they have exercised in the past. Conflicts might
occur on the fishing grounds between fishers from the nearest communities and fishers
from Pantar and further afield.
Another impact is that this new management system will create complicated set of rules
for management and compliance by locals. The rules, and in particular a strict
monitoring control and surveillance system, could make the fishers feel oppressed
(Table 7.4). The new management system will force the fishers to address more
complicated rules and challenge their open access attitudes (Acheson 1981). Compliance
is always a challenge in MPAs (Andrade and Rhodes 2012). Conflict between law
enforcers or government agents at the village level and fishers is unavoidable. As
discussed in Chapter 3, the experiences in Wakatobi and Bali Barat MPAs show that
conflicts can arise because of resentment to zoning.
With the new management rules, fishing will be illegal under various conditions in the
different zones. Fishers are likely to be tempted to fish in the restricted areas if there is
inadequate enforcement (Byers and Nonburg 2007) and the risk of apprehension is low
relative to the potential rewards (Sumaila et al 2006). A surveillance system and
adequate enforcement are needed if the MPA is to achieve its goals. Considering there
are several core zones and protection zones scattered throughout this area, an
enforcement system will need to have the capacity to cover a relatively large area and
move officers efficiently between the zones. This is a significant challenge for the
conservation program. As well an effective enforcement program will challenge the
social values in the area (Christie 2004).
The new management system will potentially shift in decision making power, trust and
leadership to manage resources from village leader to MPA manager who is appointed
by the government. With the MPA, there will be a management system different with the
current administrative structure. The authority of managing the natural resources will be

Chapter 7. Potential implications and opportunities __________________________________________________________________________
326
on the hands of management authority. Meanwhile, fishers will still consider the village
leader as their representative and, if recent experience is anything to go by, the coastal
villagers would argue with the village leaders about the restriction. The closing of
Lapang Island in March 2009 to fishing caused fishers from Blangmerang village to
resent tourists who were able to access the area while the fishers were forced to leave the
islands. The fishers accused the Blangmerang village leader of having sold the island.
This shows how restriction creates conflict between fishers and village leaders when the
discussion is not conducted properly.
In addition to resentment of outsiders, e.g., tourists, groups that are in favour of the MPA
and those against it can be expected to form naturally within the community. Those
against it may necessarily disagree with the idea but they have limited choices for
livelihoods and exclusion from formerly accessible areas/activities reduces their
opportunities. Resentment and indifference will be even greater if community
involvement has not been fully effective. And, as discussed by Oracion et al. (2005) and
Buanes et al. (2005), fishers demand tangible benefits from the protection of resources.
Fewer tangible benefits arising from the MPA will result in decreased support for it and
increases resentment towards other stakeholder groups such as tourism operators (White
and Vogt 2000).
Fishers from Pantar usually spent one or two days on a fishing trip. The smaller fishing
area near their home is likely to cause them to fish away and the use of boats with no
engines in certain areas is likely to cause them to spend more time on the sea. Their
families left behind will depend more on their ties in the village for daily supplies or for
help when they experience difficulties (e.g. periods of sickness of a family member). It
could strengthen their attachment with other families in the villages but may as well as
make them more dependent on those who provide funds for the fishing activities
(Acheson 1981).

Chapter 7. Potential implications and opportunities __________________________________________________________________________
327
Potential implications for local markets
The supply of demersal fish at local markets could also change because of the
displacement of people from fishing grounds and longer trips to travel to markets due to
using outrigger canoes. Based on observation and discussions with the fishers (as
described in Chapter 6), the fishers sold their fish at the markets near their fishing areas
to avoid having to purchase salt to dry the fish. Higher competition in catching demersal
fish will make some fishers catch more small pelagic fish (such as big eye scad (Selar
crumenopthalmus) and round scad (Decapterus sp). This would change the fish product
components value chain sold at local market among fishers and papalele as described in
Chapter 6.
Potential implications for household food
Questioned about the impact of the restrictions, fishers stated that they cannot live
without access to their source of income. Zegler (2008) found that fishermen lost their
livelihoods (income and food) due to the establishment of an MPA in Belize. The
ecological benefits of marine reserves occurred over time (Silvert and Moustakas 2011),
but in the short term the fishers needed to survive. Fish is a source of protein and
nutrition for fishers’ families (as mentioned in Chapter 5 and 6). The permanent
restriction of the use of mangroves and seagrass beds will affect the shell collection (e.g.,
women who collect shells), thus reducing household consumption of these species.
People consume and barter fish for rice, bananas and cassava (Chapter 5). A reduction in
availability of different types of sun-dried fish in certain seasons might adversely affect
local diets for the mountain people who depend on this source of food through bartering
and trade with coastal villagers.
In addition, there will be also potential implication to fishing as identity. Fishers in
Kayang, Marisa and Blangmerang had land with which to farm corn but they considered
themselves largely as fishers not farmers. Almost all the focus group participants in the
four villages investigated in the present study had never imagined that a restriction
would be applied in their areas because they had accessed that area ‘forever’. One fisher
in Kayang village said that he and his family would die because marine resources were

Chapter 7. Potential implications and opportunities __________________________________________________________________________
328
his family’s main livelihood and fishing was their only source of income. As discussed
by many scholars, fishing is not only about food but also about identity (McGoodwin
1990; Pollnac et al. 2001; Marschke 2005; Onyango 2011); therefore, this family
imagined they would suffer a loss due to detachment to the sea and fishing activities.
The fishing culture that gives meaning to the coastal villagers’ lives may be replaced by
another if they are forced to substantially abandon this activity. McGoodwin (1990)
describes the sources of enjoyment of the fishing life as working outdoors, freedom from
regimentation, challenging risks and pride in being fishers.
All of this discussion regarding potential implications assumes the regulation will be
enforced. The enforcement will likely be concentrated in the core zone and protection
zone as these areas where mostly the park give attention –refer to Case study in Bali
Barat and Wakatobi (Chapter 4). In addition, an area near the tourism center would be
watched by the tourist agency (Refer to Wakatobi case Chapter 4). If the regulation is
applied strictly then the implication is as discussed above. Even though the regulation is
not enforced, it can still create resentment due to the core and protected zones. The case
in Lapang Island shows there was resentment by fishers towards conservation initiatives
when the conservation activities started.
Summarising the above discussion, the longer term will see implications for livelihoods
caused from the short term impact. As fishing is restricted, potential implications include
a displacement of fishing efforts to other areas, a change in livelihood activities, a
decline in knowledge or new knowledge about fishing and marine resources in other
areas, emigration from the area with implications for the local economy and society, and
a loss of the fishing life-style and identity. I predict that the hardship experienced due to
the MPA will create a negative response to conservation effort (Momtaz and Gladstone
2008; Oracion 2005; Buanes et al. 2005).
The following section discusses best practices towards achieving results to reduce
impacts on communities.

Chapter 7. Potential implications and opportunities __________________________________________________________________________
329
7.5 Approaches for Best Practices for Sustainable Livelihoods and
Marine Conservation in Pantar
An MPA is one tool is used to conserve the biological diversity and productivity of
marine resources but efforts to spatially organise marine resources have created conflicts
related to marine resources (Pomeroy et al. 2007). An incorporation of social and
economic issues in the criteria for the establishment of an MPA is critical to its success
(Kelleher 1999; Hockings et al. 2000; Dietz and Adger 2003; Christie 2004; Balgos
2005; Klein 2008). An MPA is established based on ecological criteria sonly it will not
be sensitive to local impacts and may result in considerable negative social and
economic changes (Chapin 2004; Christie 2004; West et al 2006; Klein 2008). Thus, the
challenge is to incorporate the socio-economic considerations and enable the resource
users to engage fully effectively in such a way that leads to equal collaboration and
ownership among resource users (Pollnac and Pomeroy 2005).
The establishment of an MPA involves complex choices. Marine resources have a wide
range of values (Kelleher et al. 1999; Harmon and Putney 2003) derived from multiple
stakeholder groups who have different interests (Pollnac and Crawford 2000). Ecological
values (e.g., biodiversity and resource sustainability) in the long term, which are mostly
advocated by global environmental movements (Toropova et al 2010), often compete
with the shorter term social and economic values and needs of local people. There is
always a question of whose values and interests should be prioritised in which time
frames.
Globally, there has been a gradual change in thinking on the purpose of MPAs. Now,
MPAs are not only considered as a tool for conservation but also as a way to improve the
livelihoods of the local fishers (Brown 2002a; Leverington et al. 2008; Mascia et al.
2010; Turner et al. 2012). Ignoring these dimensions might result in failure in the
management (Claudet and Guidetti 2009; Carneiro 2011). The IUCN, as a global
conservation network, recognises these interests by allowing traditional and local people

Chapter 7. Potential implications and opportunities __________________________________________________________________________
330
to be part of the decision-making processes of protected areas at all levels (Pomeroy et al.
2004).
As discussed in the previous section, the establishment of core zones in the Alor District
Marine Conservation Area is likely to affect the livelihoods of fishers in Pantar. This in
turn will affect the livelihoods of fishing communities and their lifestyles, as people are
not simply the resource users but have social and cultural interactions with the resources
(West et al. 2006). Learning from experiences from the establishment of other MPAs in
Indonesia, researchers found the establishment of MPAs to have:
1. Negative impact on local fishers in Komodo National Park (Suprihatin 2002);
2. No impact on the fish production and no significant increased income of the
majority of local fishers surrounding Pulau Seribu National Park (Hariyadi
2005);
3. No impact on the economic wellbeing of local fishers in Karimun Jawa
National Park (Maksum 2006); and
4. Increased local opportunities in general in Bunaken National park where
fishers in Maratua and Siladen Islands in Bunaken National Park argued
against the establishment of the national park and they chose not to be
involved in the national park’s activities although tourism sectors have
(Leisher et al. 2007).
These few examples clearly identify a gap between theory and application in MPAs in
Indonesia. They suggest that there is a critical need to find effective ways to reduce the
adverse impacts and increase the benefits for fishers and resource users in Pantar and
elsewhere. The following section identifies several guiding principles when establishing
marine protected areas in Alor to meet conservation goals and maintain or improve rural
livelihoods.
7.5.1 Recognition of fishers as the main stakeholder group
As illustrated in the discussion in Chapter 4, a lack of knowledge about local
communities’ interests in the planning and implementing process causes low levels of

Chapter 7. Potential implications and opportunities __________________________________________________________________________
331
support from the community during the establishment process. Especially, when the
prioritisation of stakeholders based on power, legitimacy and legal right (Mitchell et al.,
1997), fishers will be most likely to be out of these grouping as their have less power
(Mabini Case study), and there is no legal tenure system to acknowledge fishers as the
main stakeholder. Bunce et al. (2002) highlight primary stakeholders are usually
identified as an individual or group whose livelihoods highly and directly depend on the
marine resources and whose activities affect and are affected by the marine protected
area. Considering this category then fishers should be the primary stakeholder groups.
The local fishers use marine resources as their source of livelihood. Thus, those who
suffer most from restrictions will be mainly the local fishers. The planning bodies should
recognise that the local fishers are the main stakeholders (Pomeroy and Douvere 2008)
and it is important is to recognise the fishers’ case dependent territorial interests in
zonation.
Local fishers have different characteristics and actors within a village (Singleton 2009).
They are crewmen and local traders, and these relationships are based on kinship. In
addition, the actors in fishing and related activities also include women (Fitriana and
Stacey, 2012). Women participate in fishing activities in several ways as described in
Chapter 5. They fish and collect shells, engage in fish processing as well as trading.
Therefore, women should be recognised as one of the key stakeholder groups. As
discussed in Chapter 4, the incorporation of the knowledge of fisherwomen was one of
the success factors in managing marine resources in the Solomon Islands (Aswani and
Weiant 2004). With this perspective, the MPA planning bodies should consider local
fishers (e.g., men and women) and traders as the main actors and consider their interests
first.
Apart from this, there is a need to recognise broader stakeholder groups and
differentiation within a stakeholder category. This will help to understand the driving
force of problems related to marine resources and lead to finding better approaches to
the cause of the problems. Stakeholder analysis is critical to the establishment of MPAs.

Chapter 7. Potential implications and opportunities __________________________________________________________________________
332
This will help to identify whose interests are represented by a group of people. For
example, as described in Chapter 6, traders in Bana village in Pantar are powerful in
influencing the harvesting of top shells and sea cucumbers. With this in mind, it is
essential to position them as the key partner in marine resource management and they
should be involved from the beginning of the process of the establishment of an MPA
(Ferse et al. 2010).
7.5.2 Participation of the main stakeholder groups in decision-making during the
establishment process
The establishment of Alor District Marine Conservation Area is strongly supported by
big NGOs and government. West, Igoe and Brockington (2006) considered the power
and partnership by these conservation NGOs were formidable. If the communities had a
choice or had been consulted properly, the zoning area might be quite different in terms
of size, place and rules. The community might have different priorities for managing the
marine resources. Therefore, the planning body needs to provide extra time to encourage
community participation and discuss with the community the importance of marine
conservation to get the community support.
With the recognition of the local fishermen and women as the main stakeholder groups,
the marine resource management should be directed through community participation
(Chambers 2005). Community participation will enable social and economic factors to
be incorporated in the MPA management system, as discussed in Chapter 4. The
participation creates an opportunity for the local users to understand the consequences of
marine resource management and to articulate the community goals for an MPA. This
will allow the local fishers to understand the MPA establishment process and to realise
their objectives. The attributes may not be changed or ignored but they may be
restructured to make them operational (Espinosa-Romero et al. 2011). Greater
involvement of local fishers will also reduce the incidence of major conflicts and
compliance problems. It will raise the level of political commitment and local ownership
from fishers and other stakeholder groups and these are important factors for successful
marine conservation (Pollnac and Pomeroy 2005; Crawford 2006).

Chapter 7. Potential implications and opportunities __________________________________________________________________________
333
Since local fishers comprise several entities, both within and outside the village, a
question arises about whether the fishers from outside but who also use the marine
resources, should be involved. Community participation should also include fishers from
outside the villages if they have used the marine resources for a long time. In the case of
Lapang Island, as described in Chapter 5, fishers from Labuhan Bajo-Kabir, Marisa,
Bana, East Pantar, Lembata and Alor Island fished around Lapang Island. Ignoring these
outside fishers would cause tensions. In North Sulawesi, where the community-based
planning system did not extend to fishers from outside the village, cause conflict
(Crawford 2009).
Those responsible for planning an MPA needs to have a clear understanding of the
reason for involving local fishers (Human and Davies 2010) and at what levels the
community should be involved. Participation is more than being consulted. It is about
getting local people involved in the decision-making process (Pretty et al. 1995; Kelly
2005; Arnstein 1969). Furthermore the local communities’ right has to be respected and
protected.
In order to enable the local fishers to participate in the planning and management
process, it is important to have the involvement of local fisher representatives. However,
the election of these representatives must follow discussion amongst local fishers. It
should be recognised as a critical task for a local government official and be resources
appropriately. In terms of the Alor District Marine Conservation Area, local fisher
representatives should be full members of the planning bodies.
Several enabling conditions are needed for community participation, as discussed in
Chapter 4. First, stakeholders’ participation has to emphasis on empowerment, based on
trust, equity and learning process (Reed 2008). Social trust should be built to enabling
the community participation (Singleton 2000). Prior information and knowledge of
marine resources strengthen the fishers on marine resources. The fishers have different
views on restriction. Sharing information on the benefits of conservation will help local

Chapter 7. Potential implications and opportunities __________________________________________________________________________
334
fishers to decide the best options for Pantar Island. By providing information in advance,
the fishers will be able to provide better feedback and contribute to objective decisions.
Second, the communities have to get involved from beginning. Third, adequate time
must be allocated for the community to get fully involved in the establishment process.
Fishers are busy and their first priority is to catch fish for their families and their time
involved in the process, which takes them away from fishing, should be compensated as
it is for all the government and NGO officials paid to conduct the process. The planning
team has to be patient to match the time of fishers and project. Furthermore, the fishers
are not used to extensive discussions. Clifton (2013) found gradual community
participation improved acceptance of marine conservation concept in Wakatobi MPA.
This shows that encouraging community participation takes energy but can help the
implementation of marine conservation. Fourth, different groups within a village should
be invited for the discussions, not only the village leaders. Village leaders do not always
represent the fishers as most are not fishers.
Reflecting on the process of the zoning plan in Pantar as discussed in section 7.3.3, the
planning team needs to conduct meetings with the communities in order to encourage
more community participation. One meeting at sub-district level will hardly be enough
to inform the communities about the initiatives, let alone to expect their participation in
decision-making (Chapter 4).
7.5.3. Prioritising local problems of marine resource sustainability
The Alor District Marine Conservation Area is one of the many conservation areas in
Indonesia that are part of the effort to achieve global conservation targets. However,
imposing international conservation targets at the local level creates a challenge for the
benefits of the MPA (Jentoft et al. 2011). There is a need to scale down the global
concerns to the local interests. If the local people realise that harvesting pressure on
natural resources threatens their livelihoods and businesses, they will most likely support
efforts to protect their livelihoods. In addition, if incentives are promoted for efforts by
local fishers to protect the resource, it will likely contribute to the success of marine

Chapter 7. Potential implications and opportunities __________________________________________________________________________
335
resource management (Acheson 2005). Prioritising local problems allows the local
fishers to incorporate the conservation issues into their daily lives.
Clear objectives and goals are needed for a successful MPA, as discussed by Jentoft et al.
(2011). The current government objectives for the Alor District Marine Conservation
Area are intangible and are taken literally from the national law without recognising
local problems (Section 7.3.1). Unless the objectives are clear and their consequences
are well known local fishers to should not be expected to understand and support the
MPA establishment.
7.5.4. Integration of local stakeholders, government and market
When planning and managing the resources, the integration of local stakeholders,
government and market actors is needed. As discussed in the previous section, the
recognition of local stakeholder groups empowers local fishers to participate in and
influence the decision-making process to better incorporate livelihood issues and
increase compliance among the local users. The government, through state laws and
regulations, needs to ensure that local initiatives are acceptable within the community
and strengthened by state law. This enables the local communities to manage and
conserve the marine resources from outside market pressure. Learning from the Solomon
Islands case (Chapter 4), local initiatives for managing marine resource was recognized
by the state and the customary management system also applicable to commercial fishers
from outside the area (Hviding 1998). In addition, the joint effort between community
based marine conservation and government driven MPA strengthens the implementation
of the MPA at local and regional level (Abecasis et al. 2013).
The market actors could strengthen the conservation initiatives. The collectors for
example could be means to encourage and direct local fishers to practise sustainable
fishing methods. This has been discussed in Chapters 5 and 6, where it was explained
that local traders had a great influence on local fishers’ livelihoods. This supports the
findings from Karimun Jawa that economic actors are crucial in achieving conservation
goals (Campbell et al. 2013). In addition, the market actors can play a role in economic

Chapter 7. Potential implications and opportunities __________________________________________________________________________
336
initiatives to support diversified livelihoods. Diversified livelihoods are a means to
reduce pressure on marine resources. However, without market opportunity, effort to
introduce diversified livelihoods will backfire on marine resources sustainability. The
local fishers will give up the new livelihood options and return to previous work, and
intensify their efforts to exploit marine resources. This will threaten the sustainability of
the marine resources.
7.5.5 Reducing fishing efforts while improving the economic standard of living of
coastal communities
As discussed by Allison and Ellis (2001), livelihood improvement must not focus on
increasing production but livelihood diversification in other sectors for livelihood
security and environmental sustainability. Livelihood diversification has been one
strategy of fishing families in Pantar to survive and improve incomes (Chapter 5).
Singleton (2009) highlighted that livelihood diversification gives employment
opportunities in the village as well as reducing out-migration. Diversified livelihoods
can also contribute to reducing fishing efforts through the reduction of time spent fishing
(Sievanen et al. 2005; Crawford 2002).
This effort does not mean to eliminate fishing effort totally considering the cultural and
social aspects that are attached to it by fishing families (Acheson 1981; Pollnac et al.
2001), but it is expected that their fishing efforts would reduce. The diversification
depends on the willingness of fishers to change to other livelihoods (Peterson and Stead
2011). Mualil et al. (2011) found that fishers are motivated to exit the fishery when
offered suitable alternative sources of income. Some viable opportunities for Pantar may
be in the area of mariculture such as sea cucumber, or tourism initiatives. However, any
identification of opportunities must be conducted with best practices to identify whether
the supplementary livelihoods can relieve pressure on current marine resources as well
as assessment of positive and negative impacts (Stacey et al 2012)
The principle in introducing complementary livelihoods is that the product introduced
will be likely to succeed because there are known buyers for it (demand). For example,

Chapter 7. Potential implications and opportunities __________________________________________________________________________
337
high demand for seaweed led to a major income increase and an occupational shift from
fishing activities to seaweed farming which enabled the local community in Bunaken NP
to effectively manage its reef (Christie 2005; Cullen 2007; Crawford 2009).
To ensure the success of mariculture, an intensive technical tutorial system is required.
Mariculture needs knowledge and new skills about how to feed and care for the products.
As discussed by Ahmed et al. (2008), institutional and organisational support, training
facilities and extension services help to prevent or cope with crisis situations and to
reduce risks in mariculture activities.
The marine-tourism industry is considered to be a non-extractive use of marine resources
(Townsend 2003; de Groot and Bush 2010). Marine-tourism could generate incomes for
villagers and for marine protected areas (Cesar et al. 2003; Buckley 2004; Conservation
International, 2008; Peters and Hawkin 2009; Wielgus et al. 2010). In Bunaken NP, this
sector generated alternative income for women (Sievanen 2008; Dasaluti 2009;
Friliyantin 2009). Riung Nature Reserve, as discussed in Chapter 4, developed
community-based tourism where coastal villagers provided accommodations and boats,
became tour guides, and produced traditional art for tourists (Atapada 2009).
One way to ensure the communities experience the benefits is to develop pro-poor
tourism (Shen et al. 2008) and involve the local community in the chain of industry.
Diedriech and Garcia-Buades (2009) suggested the use of local perceptions as indicators
to measure tangible impacts of tourism in the community. This will allow coastal
villagers to feel the benefits and support the tourism program.
7.5.6 Adaptive management system
Marine resource management typically involves multi-stakeholder groups with various
interests and power relations (Agrawal and Gibson 1999; Pollnac and Crawford 2000).
With these varied purposes and concerns, the management bodies face uncertainty and
complex problems (Coyne 2005; Jentoft and Chuenpagdee 2009; Khan and Neis 2011).
Therefore, planning bodies need to create an adaptive management system and be alert

Chapter 7. Potential implications and opportunities __________________________________________________________________________
338
to the impact of such interventions (Ban et al. 2011; McFadden et al. 2011; Williams
2011; Allen and Gunderson 2011). The planning bodies need to adapt to the local
problems and use a diversified approach to achieve conservation goals and improve the
benefits for local communities (Campbell et al. 2013). Adaptive management recognises
that complete knowledge of ecosystems is complex and the effects of human actions and
natural perturbations on ecosystems are sometimes unpredictable (Noss et al. 1997). As
presented in Chapter 4, one factor that members of the community accept in the marine
management system is flexibility towards change and being able to meet the community
needs, as well as meeting resource conservation goals (Cinner and Aswani 2007).
Learning from this experience, a management system needs to be responsive to local
problems and learn from the interaction with the local fishers.
Adaptive management also recognises combining several approaches in marine
resources management. Spatial regulation, such as a zoning system, must be
accompanied by other fishery management tools and efforts to increase the livelihood
outcomes. Generally an optimal management approach includes a variety of measures
including spatial (protected areas), temporal and fishing gear controls. Used well these
measures can achieve the conservation goal with the least impact on the fishers.
7.5.7 Other opportunities for fisheries management and minimising impacts in
Pantar Island
Even though there will be restrictions to fishing and collecting practice by men and
women (and children) from the 4 villages in Pantar there are existing issues concerning
the sustainability of stocks. Considering the likely unsustainable fishing in this area,
fishery management tools that regulate fishing how much fishing effort is applied, what
gear is used and what sizes of fish and other organisms can be captured. Achieving
sustainable resource use by regulating fishing practices has been successful in some
parts of the world. It is an important alternative to restricted zoning in an MPA in Pantar
Island and it is also likely to be an important factor in the success of any MPAs given
their relatively small size. Fishery tools that might be useful in Pantar include: gear

Chapter 7. Potential implications and opportunities __________________________________________________________________________
339
regulations including mesh and hook size, and vessel size; fish size limits; and laws
prohibiting destructive fishing, coral breaking, and protecting juvenile fish so that they
can grow and yield more and reproductive. Some means of controlling the amount of
fishing effort or to set allowable catch quotas have been important to successful fisheries
management outcomes. Table 7.7 presents options in regulating fishing practices and the
potential impacts.
Table 7.7: Fishery management tools and potential impacts
Management tools
Limitations Impact on livelihood assets Sources
Total allowable catch quotas
often species-specific but can be multi-species
high information needs and advanced monitoring controlling and surveillance system needed
Can have problems of by catch, discarding, habitat damage by fishing gear
only quota holders can catch fish and others who catch for quota with various arrangement.
protect the resources from outsiders
reselling of quota might be attractive or unavoidable, this makes original fishers detach from the sea and quota might be controlled by large industry
maintains stocks and delivers sustainable fisheries
Squires et al. 1998; Botsford and Parma 2005; Townsend et al. 2006; Brady and Waldo 2009; Olson 2011
Regulating gear, including mesh size, vessels
small mesh size regulations will not be effective if more fishers catch the fish the area
vessel limit is designed to control number of vessels and fishing effort
new investment is needed for new gear or modification of existing gear
reduces fishing efforts and fishing mortality – there are optimal levels of effort and mortality in every fishery
FAO 1997; Clark 2006; Griffith 2008; McCluskey and Lewison 2008
Size limits needs monitoring on size caught
can lead to discards if gear does not exclude unwanted sizes
allows juvenile fish to escape, grow and reach reproductive sizes
human: need to spread the knowledge of the benefits that accrue from this measure
Eble et al. 2009; Ferreira 1995; Adams et al. 2000; Begg et al. 2005; Mapleston et al. 2008
Law enforcement for destructive fishing
Ban destructive fishing method, reef mining, and protect mangrove habitat
habitat protection and protection of non-target species/sizes
conflicts might occur in the short term
Byers and Noonberg 2007; Warner and Pomeroy 2012

Chapter 7. Potential implications and opportunities __________________________________________________________________________
340
Potential implications of total allowable catch
Total allowable catch (TAC) quotas are one of the most complex and data intensive
fishery management systems. They are intended to maintain stocks of targeted species
above the desired target minimums and to maintain a sustainable fishery (Table 7.7).
This type of quota allocates a right to catch fish (Brady and Waldo 2009) to an
appropriate group and therefore excludes outside fishers (Squires et al. 1998). The rights
can be allocated in a number of ways ranging from an allocation to a group where
individuals in the group compete for a share of the total, as individual rights that can be
transferred between individuals or not. The system is therefore flexible and could
include community group allocations, for example. But since some form of rights are
allocated the involvement of fishers in determining these rights is crucial to ensure the
local community gets the most benefit (Brady and Waldo 2009; Townsend et al. 2006)
and that the system is successful.
There is always a concern about how much quota is allocated as there is an uncertainty
concerning the fish population. Often uncertainty in the population is affected by random
or indirect environmental factors (Botsford and Parma 2005) which make it difficult to
evaluate the rule and benefits of a TAC. A recording system of fish landings needs to be
set up and in a multi-species fishery this would be a major undertaking. In the case of
Pantar Island where literacy is a problem and there is no experience with such system, a
self-recording system would be a difficult, if not impossible, task. Another concern is
that large enterprises may buy all the quotas, ending the long tradition of small-scale
operations (Olson 2011; Brady and Waldo 2009; McCay 1995) however quota systems
exist where limits are placed on who and how much quota may be owned. If this was
not controlled and the quota was acquired by a small group there will impact on the
financial and social assets of fishers in the long term (Table 7.7).

Chapter 7. Potential implications and opportunities __________________________________________________________________________
341
Potential implications of regulating gear
In the zoning plan, fishing gear is regulated. In the protection and tourism zones, only
the hand-line fishing method by boats without engines is allowed; while in the
sustainable fishery zone, all fishing activities except the purse seine with a mesh size less
than 2 inches are allowed. The regulation on gear will provide some control over the
fishing capacity as one way to manage fishing effort which is important to prevent
overfishing (FAO 1997; Clark 2006; Griffith 2008; McCluskey and Lewison 2008).
However, the planning team also needs to consider the gear that will not result in the
harvest of species and or sizes of fish that should not be exploited. During the focus
group discussions, the participants discussed how to let the smaller fish or spawning fish
go with the adjustment to gear. Awareness of gear options and new investment to make
adjustments with gear modifications are needed.
Potential implications of fish size limit
Fish size regulation is intended to allow juvenile fish to escape from being captured.
This type of regulation has to be implemented with catch and release rules: only fish of a
defined size can be caught, and the smaller ones (or larger ones) should be released.
Fecundity (number of eggs produced) generally increases in line with the weight of the
fish once the fish is reproductively mature, i.e. fish are better spawners if they are bigger,
this includes species such as the unicorn fish (Eble et al. 2009), and coral trout (Ferreira
1995; Adams et al. 2000; Begg et al. 2005) which are just two of the many species
caught in Pantar. To ensure that only the fish of the correct size are caught, information
about adult fish and how this system works towards sustainability needs to be made
known to all fishers and it is likely that strict monitoring needs to be in place (Table 7.7).
The gear used, such as hooks, must minimise injury and bleeding of released fish
(Mapleston et al. 2008) for this approach to be successful. A modification to existing
gear might be needed but it will not affect the financial assets drastically as long as the
gear can be bought at local markets or in Kalabahi.

Chapter 7. Potential implications and opportunities __________________________________________________________________________
342
Potential implications of law enforcement to destructive fishing methods
Several laws exist to regulate fishing and its related habitat use. However, the
enforcement of these laws is still weak in the Pantar area. Therefore, there is a need to
enforce these laws more effectively and that may require a capacity to do this at the
village level. Fishermen may resent enforcement (Table 7.7); however, enforcement will
preserve the natural assets and if it is applied equitably it should eventually be accepted.
Within the village, persuasion and peer group pressure can be used to prevent destructive
fishing methods. Compliance of outside fishers, however, needs a higher level of
enforcement. As illustrated in Chapter 4, villagers feel powerless to counter this problem.
Therefore, a combination of intervention of law enforcement from higher authorities and
local community authorities within the bounds of their authority needs to be encouraged.
In summary there will be limited access to certain areas as a consequence of the zoning
implementation. Removal from existing fishing grounds causes the displacement of
activity to other fishing areas (West et al. 2006; Cernea and Schmidt-Soltau 2006;
Mascia and Claus 2008). In addition, a change of fishing methods will be required to
enable some fishers to operate sustainably in the zones where fishing is allowed.
7.6 Conclusion
The effort to achieve global and national conservation targets in Indonesia has driven the
establishment of a large 400,083 hectare MPA in the Alor-Pantar region. A review of the
establishment process of the MPA and associated planning activities was conducted to
examine the potential implications on local livelihoods. The most obvious impact will be
restrictions on groups of fishers to access certain areas of coastal waters. As well as
causing a likely displacement of fishing to other areas, this has further implications for
livelihoods, including, the loss of traditional access and rights, reduction in incomes and
food for household consumption – in the worse case scenario – the loss of fishing culture
and sea attachment. The analysis has demonstrated the problems and gaps in
establishment of the ASMCA. It has shown the local authorities and the leading NGO in
the region have given little attention to consider the implications of the proposed MPA
Chapter 7. Potential implications and opportunities __________________________________________________________________________
343
on livelihoods, activities and outcomes. Further the level of feasibility and assessment
conducted appears to be of a poor standard and lacks appropriate detail (e.g., social and
economic assessments). Indeed there has been no impact assessment of the protected
area. No meaningful engagement to local communities to provide discussion and
learning amongst key stakeholders to understand the changes of rules in utilising the
marine resource have been undertaken either. This is in common with other regions of
Indonesia and in other parts of the world in relation to the engagement of local people in
marine conservation (e.g., Affiff and Lowe 2008, Clifton 2009, West et al 2006,
Springer 2009).
Six key principles are critical in establishing an MPA in Alor to minimise livelihood
impacts and achieve optimum conservation outcomes. Firstly, there is a need for
government and other planning agencies to acknowledge that fishers are the main
stakeholder group. Local fishers in a village are heterogeneous entities, however.
Understanding the diversity and power relationships within and between fishers will help
to encourage them to participate as the main actors. Secondly, fisher participation in
decision-making is one way to incorporate social and economic factors in a proper way
at the planning stage. The local fishers will define the management system that is
suitable for them and address local problems instead of having these imposed upon them
by an outside agency. Thirdly, the integration of local stakeholder groups, government
through policy and legal documents, and market support will strengthen the conservation
initiatives in the area. Fourthly, diversifying and improving livelihoods and the living
standards of fishers may lead to reduced fishing efforts. Fifthly, the application of
various fisheries management tools will be needed to complement the MPA and remain
for some objectives a viable alternative. Furthermore, within the communities there is
the potential to control effort to some extent. Finally, an innovative approach in
management that is practical, adaptive and a combination between conservation and
development activities is likely to increase the conservation success and bring more
benefits to the local fishers. This will avoid the creation of yet another so-called “paper
park” (Dudley and Stolton 1999).

Chapter 8
Conclusion
This man is fishing using hand and line method in the waters near Lapang Island in September 2008

Chapter 8: Conclusion _______________________________________________________________________
344
Chapter 8: Conclusion
This thesis has examined the potential impacts of the establishment of an MPA on
coastal communities on Pantar Island, located in Nusa Tenggara Timur Province, in the
eastern region of Indonesia. Four objectives (and associated questions) were considered:
1) to assess past approaches to the establishment of MPAs in Indonesia; 2) to examine
the marine-related livelihood dependence of communities on Pantar Island; 3) to explore
the impact of an MPA on community livelihoods on Pantar Island; and 4) to identify
opportunities and best practices to improve the livelihood strategies of coastal
communities and mitigate the potential impacts of an MPA on Pantar Island.
Sustainable livelihood analysis was used as a framework for data collection and analysis
to examine the livelihoods of the communities in four villages on Pantar Island. Value
chain analysis was used to map the production of selected products from producers to
consumers including identification of market actors, activities conducted along the chain,
the relationships between the actors and price setting. Several methods were used for
data collection including participatory research methods (actor analysis, village maps,
resource use mapping, pie charts of time and seasonality, and focus group discussions),
semi-structured interviews, household surveys, and observation. Quantitative data such
as length of different marine species were analysed using a descriptive statistic analysis
by presenting the means, median, modus and frequency. The results provide a rich
understanding of the potential implications of an MPA adjacent to Pantar Island and
some best practices needed to be implemented by stakeholders to balance the goals of
conservation and improved livelihoods.
This concluding chapter summarises the major insights and findings of the research
based on the different assessments conducted in chapters 3 to 7 to address each objective.
Policy recommendations and suggestions for further research are also provided.

Chapter 8: Conclusion _______________________________________________________________________
346
8.1 Principal Findings
The exploration of the four key research questions, presented in Chapter 1, revealed
important findings about the potential implications of the establishment of an MPA and
ways to improve community participation and livelihoods. This section presents the
findings related to each of the four key research questions.
1. To what extent have local communities been involved in the MPA planning
process to establish three MPAs in Indonesia? What was the degree of
participation of local communities in the planning process? To what extent were
social and economic issues considered in the MPA establishment?
The first objective of this thesis was to examine the approaches taken to establishing
MPAs in Indonesia. This included an examination of the level of local participation in
three MPAs established in Indonesia (Wakatobi National Park, Bali Barat National Park
and Riung Nature Reserve), the incorporation of social and economic aspects into
planning, the role of local governments and the relationship between marine resource
users and planning agencies (such as NGOs and government). The findings from this
line of enquiry were presented in Chapter 4.
The local communities in the three case studies participated in several activities during
the MPA establishment (such as providing preliminary information for a biological
resource survey, attending a forum or institution establishment, attended rezoning
meetings and joint patrol). However, most of the time, the local communities were not
involved in the decision-making processes. The marine reserve authorities in these three
case studies played a far greater role in making decisions than the local people. Indeed,
as Pollnac and Pomeroy (2005) have suggested the involvement of local communities in
the decision-making process is important in order to maintain commitment to MPAs and
to create a sense of local ownership. Andrade and Rhodes (2012) also highlight that
community participation in decision making process in 52 protected areas globally is the
only variable that significantly relates to the compliance of stakeholders in MPAs. The
consequence of low levels of participation in decision-making in these three marine

Chapter 8: Conclusion _______________________________________________________________________
347
reserves resulted in the lack of commitment and ownership of the local communities and
resulted in several instances of tensions. The government authorities considered fishers
to be a less important stakeholder group. The government authority might argue that all
the stakeholder groups, including the communities, were involved during the process
through the representative system of village leaders. Involvement of the village leaders
as the extension of government at the village level was considered to be community
participation. The government authorities often lack the ability to recognise the
heterogeneity of coastal communities (Singleton 2009). In the case of the three MPAs
investigated in the present study, the selection of representative was not clear and there
was no system to share information from the representative who attended the meeting to
wider communities.
Over time, the levels of participation varied and changed in the case study areas. The
intervention of international NGOs to encourage community participation and a
government reformation movement in Indonesia led to changes in marine resource
management regimes in the sites. Even so, the local communities were not able to
achieve the highest degree of participation, namely, citizen power, as defined by
Arnstein (1969) and Pretty et al. (1995). The varied degree of local participation showed
that the planning bodies were unclear about the degree to which the communities should
be involved.
The marine reserve authorities in these three case studies played a major role in
managing the marine resources. International NGOs supported the authorities
significantly in establishing the management system as well as supporting activities on
the ground that included community involvement. The existence of NGO staff and
activities on the ground encouraged participation. Learning from this situation, paying
attention to maintaining good relationships with local communities was necessary in
order to encourage community involvement and gain local support.
As shown in the three Indonesian MPA case studies, social and economic aspects were
considered in different ways by the planning bodies and the international NGOs in the

Chapter 8: Conclusion _______________________________________________________________________
348
MPA planning (refer to Section 4.5.3.4 Social and Economic issues). Social and
economic aspects began to be considered when the authorising bodies conducted
livelihood programs in Bali Barat and Riung, assessed people’s perceptions of the MPA
in Wakatobi and worked with marine resource users to deal with conflict in Riung. Lack
of appropriate knowledge about local culture, and ambitious project goals and timelines
often limited a structured plan to incorporate social and economic aspects in MPA
establishment. In this sense, the relevant authorities failed to properly consider social
and economic aspects in MPA establishment or as critical factors in the zoning plans to
regulate marine resource use.
2. To what extent do local communities’ livelihoods depend on the coastal and
marine natural resources compared to their other resources? How do the
communities cope with vulnerability?
The second objective was to examine the marine-related livelihood dependence of
communities on Pantar Island addressed in Chapters 5 based on the application of the
sustainable livelihood analysis framework and assets-based analysis (DFID 1999). By
looking in depth at the livelihood system, this research unveiled the complexity of the
activities and vulnerabilities of fishing households whose main livelihood activities
depended on marine resources and related activities (as discussed in Chapter 5). Chapter
6 applied a value chain analysis to also contribute findings to this objective.
The coastal communities conducted diverse livelihoods. However, the ways in which
local people used and managed their assets indicated that marine-related activities were a
major part of the diversified livelihood portfolio. In terms of human assets, this research
has shown that people in the four villages invested their time, knowledge and skills in
fishing-related activities more than in any other activity such as agriculture.
In terms of natural assets, the fishers targeted multiple species and size classes. The
findings indicated that the sustainability of several species should be of concern. The
fishers targeted multiple species and size classes. The fishers did not let the smaller fish

Chapter 8: Conclusion _______________________________________________________________________
349
go, as there was no guarantee that they would catch it tomorrow. This situation is a
classic tragedy of the common pool resources (Ostrom 1994). Depending on the season,
the fishers mostly exploited pelagic and reef fish in almost all areas around Pantar Island.
Most of the fish captured during the research period (of 6 months) were undersized and
caught before they were reproductive mature (e.g., 75% of Tylosurus crocodilus, 90% of
Euthynnus affinis, 90% Lutjanus spp, 90% Scarus spp). Sea cucumbers and top shells
were also collected but the catch per unit of effort had decreased and size were also
reported to be smaller than in the past (see Chapter 5). This indicates that coastal
fisheries in this area of Pantar are potentially vulnerable in terms of stock sustainability
and fisheries need to be better managed to avoid these fish being further depleted.
With the producer goods as part of physical assets, apart from investing in fishing
equipment, fishers also invested in seaweed farming as a new of sources of income. As
discussed in Chapter 5, seaweed farming has absorbed their energy and time. The
income from seaweed farming as discussed in Chapter 5 (page 223) is more predictable.
This indicates that the dependency on wild caught fisheries might change in the future in
favour of other opportunities, considering the high level of competition in exploitation of
the declining resource. However evidence from others studies have shown that fishers
will continue to fish even when their catch drops significantly (e.g., Slater et al 2013).
In addition to physical assets, the poor condition of public infrastructure sometimes
limited the opportunities for fishing households to expand their marine product trade and
benefit from this expansion. However, fishers still invested in fishing equipment. This
was reflected in the analysis of financial assets which showed that the allocation of
money for fishing equipment was greatest in Labuhan Bajo and Blangmerang, while in
Kayang and Marisa the expenditure for fishing equipment was the second priority
allocation after covering the cost of traditional ceremonies.
In Pantar, social assets are held within kinship groups, groups of people doing the same
activities (such as the papalele and shell collectors), and a relation with local traders.
The kinship relation allows them to freely catch fish or farm seaweed in their kinship

Chapter 8: Conclusion _______________________________________________________________________
350
areas (DFID 1999). The bonding in these groups as social assets helped the local people
survive and cope with vulnerabilities (Putnam 2000; Rydin and Holman 2004;
Bebbington et al 2006).
The analysis of the livelihood assets indicated that the people in Pantar had their own
strategies to live and to cope with difficult situations. The three different strategies used
by the fishing households in Pantar were adaptation, diversification, and migration
(Purvis 2002; Marschke 2005; De Haan and Zoomers 2003). The coastal communities
adapted with the climate and the environment. They carried out several activities
depending on the monsoons. During the peak fishing season they intensified fishing
activities, catching as much as they could in order to increase their income. Fishing was
the main source of livelihood; however, some fishers also worked agricultural plots or
farmed seaweed. They had multiple sources of income as a diversification strategy.
Although there was livelihood diversification, opportunities were becoming fewer. For
this reason, some people migrated to work in towns and cities in Kalabahi or to Malaysia.
In other cases, following the fish (such as catching tuna in the Timor Sea) was also a
type of temporary migration.
With regard to livelihood outcomes, marine-related activities were the major source of
income for Pantar villagers. They invested the extra money in fishing equipment
although some money was allocated as savings in the form of jewelry in order to cope
with uncertainty in fishing. It did not appear that people invested in education. Food was
available through purchase, trade including barter, harvested from their own crops, and
fishing and sharing through their social networks (as indicated in the discussion on social
assets in Chapter 5).
A wide range of activities were undertaken mainly based on the opportunities and
benefits generated from marine resources. These activities demonstrated that the coastal
communities on Pantar Island were highly dependent on marine resources.

Chapter 8: Conclusion _______________________________________________________________________
351
3 How are communities involved in barter and commercial marketing of some key
marine resources? What is the marketing system for key marine products? Are
there any ways to improve the participation of coastal communities in the value
chain?
The second objective of this research was also addressed in Chapter 6. The investigation
guided by these research questions led to the finding that the fishers were not isolated
from the wider economic system. Their exploitation efforts and outcomes were
determined by many factors such as price fluctuations and power over access to
resources (such as marine resources, financial and logistics). Analysis of the market
mechanisms helped in explaining factors affecting utilisation patterns and the livelihoods
of the fishers.
The discussion in Chapter 6 showed that the local villagers were involved mostly at the
producer and village trader levels. A large variety of fish species were sold or bartered at
local markets for food and cash income. The location of the marine resources relative to
the market, and the availability of ice and salt, determined what (e.g., fresh, sun-dried,
salted, chilled, smoked), how and where marine products were sold. Through local
markets, marine products brought benefits to the wider population on Pantar Island
through barter and trade by the papalele (women village traders).
Marine products such as seaweed, sea cucumbers and top shells from this area were sold
to international markets. However, the local fishers only knew the value chain up to the
stage where it reached the local traders in Pantar. After that stage, the local traders sold
to traders out of Pantar Island. In the case of seaweed, for example, the local producers
did not have knowledge about the prices paid further along the value chain. A quick
harvest and relatively low investment brought a significant cash income to many
producers, despite several cases of social impact such as conflict. Nevertheless, they
continued to produce and sell the seaweed commodity.

Chapter 8: Conclusion _______________________________________________________________________
352
Communities mostly participated at the beginning of the value chain (producer level)
and as trader at village level. The level of participation and the value of the marine
products in Pantar can be improved in several ways. The first way would be to address
the constraints identified along the value chains especially at the local markets. The local
markets brought benefits to many coastal villagers including non-coastal villagers (who
farmed in the inland mountain areas). The second would be to upgrade the products.
This would include improving processes, products and volume. Providing a better
quality of sun-dried seaweed, for example, would assure buyers about quality and lead to
increased prices. Processing the products into more sophisticated forms, such as
processing seaweed into carrageenan powder, would be more difficult as the Pantar area
lacked many inputs. In addition, ensuring the sustainability of inputs such as salt and ice
would be important factors in improving product quality. Increasing the volume of wild
products would be a concern because the research in the present study indicated that the
marine natural resources in the area were becoming unsustainable (as discussed in
Chapter 5, however more detailed research is needed). A third option would be to
strengthen the relation and coordination among the local traders in the island. As
discussed by Coles et al. (2011), horizontal coordination helps to reduce costs related to
small volumes and low supplier capabilities. Ensuring long-term trading terms and
enabling access to the next step of the value chain would help to increase participation in
the chain. This would apply to products that were marketed to international trade.
Participation in the global trade could improve the value of some marine products due to
the higher prices offered (such as fish as discussed in Section 6.2.3). On the other hand,
participation in the global market could also be an incentive for fishermen to exploit
more of the targeted marine resources. Without effective fisheries management tools, the
sustainability of the fishery industry is threatened (Gudmundsson 2006). Moreover,
participation in the global market affects the availability of marine products at local
markets which would in turn affect the food security system on Pantar Island. As Allison
(2011) pointed out, international trade can absorb marine products in a massive quantity
and this can lead to the collapse of the local market. This could bring in more income for

Chapter 8: Conclusion _______________________________________________________________________
353
fishing families but also marginalise many of the villagers who participated in
processing and marketing, such as the papalele.
As indicated in the results reported in Chapter 6, local villagers in the four study villages
were involved in the barter and commercial trade of marine products through local
traders. The role of local traders might not be beneficial as the fishers had to sell the
products to them without any power to bargain for higher prices. The traders also applied
high interest rates when the fishers borrowed money from them (see Chapter 5).
However, the benefit was that local traders provided financial support when the fishing
families were in uncertain situations (such as low catch of fish, and during the west
monsoon, or major household expenditures or illness) with only the social relationship as
the warranty (Acheson 1981). The local traders also had the higher risk that the price of
the products could change, there might be no buyers, and quality issues might be raised.
Considering this situation, taking loans from local traders was also a strategy of the local
fishing families for survival on Pantar Island.
Drawing from the above discussion, a marine conservation initiative, that impacts on
livelihoods must consider the value chain of marine products harvested by local
communities. As Midgley (2008) suggested strategies to improve livelihood outcomes
within marine contexts should involve a multi-faceted approach with a variety of
activities, including economic growth, the increase in market value of the products and
services produced. This has mostly not occurred in Pantar Island and under the MPA
development program.
4. To what extent would local livelihoods be affected if restrictions were placed on
access to marine natural resources? What is the impact of MPA establishment on
livelihoods? What is likely to be the best practice for the establishment of an
MPA in Pantar in terms of addressing the people’s livelihood issues and
achieving conservation goals?

Chapter 8: Conclusion _______________________________________________________________________
354
The third and fourth objectives of this research relate to these research questions 4 and
were addressed in Chapter 7. From the analyses of the current conservation initiative in
Pantar to establish a zoning plan, it appeared that the communities were not significantly
involved in the process although the level of participation developed through the process
but it was still insufficient or low. It was at the level of manipulation at the beginning
(Table 4.1: Comparisons of Arnstein and Pretty model of type of participation, page 103),
but the level of participation increased to informing where participation was by giving
information and people participated by answering questions designed by project
managers (see Table 4.1).
The activities led to the establishment were the representatives of the local communities
were invited to public consultation at the sub-district level. Fishers were asked to
identify and share information about their fishing practices during spawning aggregation
and ecology surveys. Most of the process in preparing the zoning plan was led by the
WWF, in collaboration with the district Department of Marine Affairs and Fisheries. The
zoning plan was signed as a Bupati regulation in April 2013. At the time of writing (July
2013), this signed document was being discussed at the provincial level and would then
be discussed at national level. The planning team was also preparing a management plan
as an attachment to the proposal of Alor District Marine Conservation areas to the
Minister (who has the power to approve the determination of the Alor District Marine
Conservation Area as a marine park). Reflecting on the process of the establishment of
the MPA in Pantar as discussed in section 7.5.3, the planning team should conduct
meetings with the communities more intensively. The results of meetings at sub-district
level would not reach the fishers. As suggested by Gray and Hatchard (2008) if
communities receive sufficient information they can be better involved to help them in
the decision making process.
The zoning plan sets out four types of zoning: core, protected, tourism and sustainable
fisheries zones. Restricted access to certain zones will change the level of coastal use by
the communities. In the core zone (with restricted zone), the most obvious impact will be
a separation of fishers from their former fishing grounds. Fishers who normally fished

Chapter 8: Conclusion _______________________________________________________________________
355
along the coast of Tanjung Soyang (near Kayang Village), in the core zone for example,
will be displaced. Similarly, Bajau people who normally fished and lived temporarily to
the north of Lapang Island (core zone) will not be able to access these areas. Potentially,
restricted usage if enforced could have a positive impact on the natural capital. The most
exploited fish population might become more abundant and would have a better
environment to recover in the restricted zones (Byers and Nonburg 2007).
In the proposed zoning plan, fishers will only be able to fish using outrigger canoes and
the hand-line fishing method in the protected and tourism zones. Competition will be
high in the allowed fishing spots and overcrowding could occur in the protected zone
(Chapters 5 and 7). Crowding in fishing areas will cause fishers to find new fishing
grounds, thus shifting the problem. New knowledge and investment in gear and boats
will be needed to access these new fishing spots; and in the worst case scenario there
will be a loss of fishing knowledge, cultural values, identify and sea attachment. In the
longer-term, this could increase migration and affect the demographic structure of the
population in this area. Disregarding the short-term needs of local fishers to fulfill their
livelihood outcomes will bring challenges to marine conservation. Tensions and law
breaking might occur and local fishers could experience a reduced income and flow on
effect on food insecurity and nutrition elements which could be as a potential research to
assess the links between livelihoods, health and economic analysis of household
dependence on marine resource in the future.
Therefore, fisheries management approaches that actually enforce a strong program of
management and optimise livelihoods through diversified strategies are crucial. If
successful, this can enhance local livelihoods as well as reduce the out-migration that
can cause social problems. As discussed by Sievanen et al. (2005) and Crawford (2002),
diversification helps in reducing fishing efforts while also improving incomes although
diversification needs to consider fishers’ cultural identity and attachment towards sea.
However, a more likely successful situation is one where fisheries resources are well
management, existing livelihoods are strengthened and diversification opportunities are

Chapter 8: Conclusion _______________________________________________________________________
356
considered. This combination might lead to alternative ways to achieving conservation
goals while mitigating livelihood impacts.
During the course of the present research, several principles in establishing MPAs to
better achieve conservation and livelihood goals were identified as follows:
1) Recognition of fishers as the main stakeholder group, with the understanding that
fishers as the main user group comprise several different stakeholder groups
(Agrawal and Gibson 1999; Pollnac and Crawford 2000; Pomeroy and Douvere
2008).
2) Participation of the main stakeholder groups in the decision-making process is
important (as discussed in Chapter 4) to give opportunities to local fishers to
understand the processes and consequences. This will increase ownership,
compliance and transparency of the process (Dorsner 2004; Rodriquez-Izquirde
et al. 2010; Andrade and Rhodes 2012).
3) Prioritising local problems will scale down the benefit to locals instead of
imposing international conservation targets. This allows local fishers to
understand and as a result support the conservation efforts (Jentoft et al. (2011).
4) Integration of local stakeholder groups, government and the actors in the market
will strengthen the establishment of MPAs. The role of government is to support
and enable the local fishers in managing the marine resource and addressing
external factors, such as the use of unsustainable methods by fishers from outside
Pantar. Meanwhile, traders can also be targeted to help influencing fishers to
practise sustainable fishing (Crona et al 2010).
5) An adaptive management approach and flexible decision-making by planning
team are needed. This is because uncertainty in the marine ecosystem and human
influence are high and the uncertainty is sometimes beyond the ability of humans
to understand the connection (Noss et al. 1997). In certain situations, the results
of interventions need to be considered over longer periods of time, before the
outcomes can be observed.

Chapter 8: Conclusion _______________________________________________________________________
357
8.2 Main Contributions
This thesis has examined how the establishment of an MPA potentially impact on the
livelihoods of coastal communities and the coastal environments and sea is an important
resource. Not only did the people in the four case study villages depend on the marine
resources, the wider population on Pantar Island also depended on these resources
through trade (Chapter 6). Thus, the research shows that establishment of an MPA
establishment can impact on the wider island and inter-regional communities and their
livelihoods.
An MPA that includes a restricted zone would potentially have a more significant impact
on the livelihoods of communities. While such restrictions would bring good results for
natural resources, the human, financial, physical and social assets will be impacted
(Chapter 7). With the spatial separation of users from the marine resources, new
knowledge will be needed. Competition between displaced and existing fishers will be
greater in other zoned regions within the conservation areas. The fishers would
experience economic hardship in the short term. The fishers would be likely to access
the restricted areas where there is little enforcement. Negative attitudes to marine
conservation will arise.
Different ways are therefore needed to avoid conservation initiatives that cause negative
social, culture and economic impacts - in the short term such as a reduction in income
and other benefits - and shift problems to other places are therefore needed (Chapter 4).
The MPA planning team needs to recognise local fishers as the main actor in the marine
resources value chain and encourage their participation in the MPA process.
Participation is more than being consulted. It is about having local people involved in the
decision-making (Arnstein 1969; Pretty et al 1995). Community participation provides
an opportunity for local users to understand the MPA establishment process, to provide
feedback on the MPA objectives, and to influence the marine resource management
system before it is implemented. In addition, community participation should also
include fishers from outside the villages who have used the marine resources for a long
time.

Chapter 8: Conclusion _______________________________________________________________________
358
Establishing an MPA is about building a commitment between direct users, government
and actors in the market (Abecasis et al. 2013; Campbell et al. 2013). Commitment
fluctuates based on the interests and benefits (De Vivero et al. 2008; Jentoft et al. 2011).
If the local fishers consider that the MPA brings better livelihoods, the planning body
will gain support. The results reported in Chapters 5 and 6 suggest there are ways to
improve the livelihoods of coastal communities on Pantar Island. Livelihood
diversification has been one strategy used by fishing families in Pantar to survive and
improve incomes and interventions could focus on strengthening existing systems and
considing new opportunities.
Improving the participation in the marine resources market would also bring about better
livelihood outcomes. As presented in Chapter 6, fishers and farmers faced a series of
challenges in securing their livelihoods in the face of changing market relations.
Recognising the constraints and promoting innovations to upgrade the value of the
products will lead to higher benefit.
This research also contributes to the discussion on how to improve the livelihood
outcomes of coastal communities by looking at market opportunities. As suggested by
Allison (2011), without market opportunity, improving livelihoods by increasing
production has little value. Value chain analysis was used to assess ways to improve the
participation of local communities at the different stages of the market. Several ways
were identified through improved assets or better policies. The analysis of livelihoods
added to the results on the structure and function of the value chain by comparing the
vulnerability of fishers and farmers to economic and political change. This combination
strengthened the analysis of livelihood outcomes.
The results of this research make a contribution to the literature and to the development
of practical strategies for establishing an MPA on Pantar Island. This study does not
mean to counter the establishment of MPAs. What this study suggests, however, is the
need to better understand the potential implications of MPA establishment so that the
Chapter 8: Conclusion _______________________________________________________________________
359
planning bodies better anticipate and minimise the potential problems that may occur.
The planning bodies need to critically question whether MPAs with restricted areas
closed to fishing are an appropriate tool that can be effectively implemented. The
planning bodies also need to incorporate several management tools, including
sustainable use to achieve the conservation objectives. As the most important goal is
surely to avoid the creation of “paper parks” (Dudley and Stolton 1999), the planning
bodies need to ensure that the local communities benefit the most from MPAs. This
research is intended to make a contribution to this wider goal. This research supports
other studies on practical approaches to MPA establishment and makes a major
contribution to the available literature on the impacts of the marine protected area
program in the Coral Triangle.
This thesis also contributes to the debate regarding marine conservation versus people.
As the relationship between marine conservation and humans is a complex issue (Jentoft
and Chuenpagdee 2009), this research has shown livelihood is important to be
considered when assessing the impact of an MPA. Sustainable livelihoods analysis
incorporates biological, social, cultural and economic factors in one framework. As
many scholars have suggested, an understanding of these cultural, social and economic
complexities is critical to the success of MPA management (Chapter 1). However in
practice there are a limited number of where this is the case. By exploring the competing
social, cultural, economic and ecological issues in MPAs, this research recommends
more appropriate strategies for establishing MPAs in Indonesia in the future.
8.3 Practical Recommendation for MPAs in Indonesia
The lessons drawn from this study can contribute to the successful establishment of
marine protected area on Pantar Island and can inform national policy on MPAs. The
synthesis of what has worked or failed in the past approaches to the establishment of
marine reserves provides a set of lessons learned for how new MPAs should be planned
and implemented in relation to livelihoods. The findings presented in this thesis provide
opportunities for local and national governments to improve the success of marine
protected areas, and increase local community wellbeing.

Chapter 8: Conclusion _______________________________________________________________________
360
8.3.1 Recommendations for local government
The planning team for an MPA needs to have a clear plan and objectives about the
establishment of MPAs. To achieve this, the objective of marine reserves needs to be
clearly written and understood by local communities. In addition, the flow of
information about the plan from the planning team to communities has to be clear. The
planning team needs to ensure all communities are aware of the MPA initiative and
better incorporate their interests through community participation. Community
participation is a long process that requires skills in understanding and encouraging the
communities; therefore, appropriate skills on the ground and clear guidance are needed
to encourage local participation as complex problems are being faced.
Analysis of the process of the zoning plan in Pantar revealed that community
representatives were invited during one public consultation about the first draft of the
zoning plan at sub-district level. Broader communities were not involved during the
process. In parallel with the process to gain determination as a marine park at provincial
and national levels, the planning team should inform broader communities about this
plan. One meeting at sub-district level is not enough to inform the communities about
the initiatives, let alone to expect their participation in the decision-making process at
the highest rung of the participation ladder (Arnstein 1969). A study of 52 protected
areas around the world found that community participation in decision-making processes
for the establishment of protected areas was a crucial variable that related to the level of
compliance (Andrade and Rhodes 2012). If a high level of compliance is expected, the
planning team needs to encourage community participation in the initial decision-
making. The management plan is part of the preparation process, and opportunities
should be created for communities to be involved in how to execute the management of
conservation areas. Therefore, the planning team should conduct meetings in villages
with different community entities to advise and discuss the management plan.
Better management of marine resources is expected to benefit the natural habitat and
improve the livelihoods of coastal villagers (as discussed in Chapter 1). Therefore, the

Chapter 8: Conclusion _______________________________________________________________________
361
establishment of an MPA needs to be complemented with development initiatives.
Examples of such initiatives include: supporting the diversification of livelihoods;
increasing the participation of local fishers in the value chain; investing in better roads
that connect one village to another; ensuring a stable supply of ice and salt to enable the
abundant fish to be processed; improving the supply of clean water; and providing
access to financial institutions. Development projects that focus on these improvements
will indirectly improve the livelihood outcomes of fishing families.
8.3.2 Recommendations for national government
The communities on Pantar started to build agreement among themselves about how to
manage their marine resources. At the time of writing (August 2013), the community-
conserved areas that were accepted by most of the local fishers were not recognised
under national law. As discussed in Chapter 7, the two national laws recognising
traditional initiatives in conservation are the Law No. 27 of 2007 and the Regulation of
the Minister of Marine Affairs and Fisheries No. 17 of 2008. Under these laws,
traditional initiatives are categorised under maritime conservation only if the customary
law still functions or the sites are the place of shipwrecks or historical and ritual sites. In
Pantar, the customary laws were not as strongly regulated as the “sasi” tenure practices
in Maluku (Harke 2006). Acknowledgement of the local initiatives under the national
law would make the local initiatives applicable to outside communities which would be
especially helpful in relation to law enforcement. Therefore, local initiatives to conserve
the marine resources also need a legal platform.
In addition to acknowledging local initiatives, the government should review the policy
so that local fishers are clearly recognised and prioritised as the main stakeholder group.
The current laws (Law No. 27 of 2007 and Law No. 45 of 2009) do not enable local
fishers to be recognised as the main stakeholders. With clear recognition, the
implementing agencies will involve the local fishers in a more meaningful way, rather
than just in minimal public consultation as outlined in the current laws (as discussed in
Chapter 7, Section 7.2). The government should recognise community participation at all

Chapter 8: Conclusion _______________________________________________________________________
362
levels of the decision-making process in MPA establishment. The government
management system can not just close the area without consulting the local fishers. A
more consultative process will create more acceptance by the local communities. As
discussed in Chapter 4, the lack of recognition in the laws and regulations limits the
ability of government officers to facilitate community participation.
8.3.3 Recommendations for conservation practitioners
Two main areas could be improved for ongoing MPA programs largely driven by NGOs
in the region
1) Livelihood assessments as part of MPA planning to consider potential impacts
and opportunities which go much further than basic socioeconomic surveys and
assessments.
2) Set up long term participatory monitoring programs to evaluate impacts and
changes. This has been an area commonly under-resourced and not well featured
in conservation programs in and around protected areas in the world (e.g Stacey
et al 2013)
8.4 Further Research
This study presented the extent to which certain fish species were harvested before they
were reproductively mature (Chapter 5); it did not use predictive modeling to assess the
potential implications of harvesting on fish stocks because of human exploitation. Such
modeling would provide detailed predictions of the harvest and status of marine products
as a result of better management. In addition, a fish stock analysis might be needed if a
quota system is to be applied in the MPA (Hinrichsen 2009; Doyen et al. 2012). This
type of analysis allows the measuring of the population status and the building of
structural ecosystem models that can optimise sets of quotas across multiple species
(Sanchirico et al. 2008).
There is a still a dearth of studies which consider the impacts of MPAs on local people
and their livelihoods. In addition regular monitoring of impacts is rarely conducted
particularly in relation to socioeconomic impacts, although there are some examples
Chapter 8: Conclusion _______________________________________________________________________
363
such as that done by the LMMA network in parts of Indonesia and Pacific Islands
(Cohen et al 2008). There is a need for livelihood and wellbeing impact assessments of
any MPA activities in the Pantar region, with a particular focus on the impacts on
livelihood outcomes and in particular food and food security. Some studies are underway
at the time of writing by Mascia et al. (2010) and Glew et al (2012) in Papua,
particularly within the context of the CTI-CCF in Indonesia and the wider Asia-Pacific
region with the need for conservation projects to pay greater attention to livelihood
impacts in their feasibility activities. There are opportunities for detailed wellbeing
analyses around the contribution of marine resources to local communities (Coulthard et
al. 2011; Foale et al. 2013; Weeratunge et al. 2013; Urquhart et al 2013) and new
frameworks are in development to address this gap (e.g. Weeratunge et al 2013). There
are also opportunities to establish key variables and monitoring programs to assess both
short, mid and long term impacts of the conservation initiatives in Pantar. There is likely
to be a problem with income and potentially food insecurity and flow on effects
regarding health given the dependence on fish, the role of fish in nutrition in coastal
regions such as Indonesia. This could be as a potential research area to further assess the
links between livelihoods, health (nutrition) and economic analysis of household
dependence on marine resource in the future in the Pantar region.
8.5 Final Comments
This thesis examined the livelihood conditions in four villages on Pantar Island. The
exploration of assets, livelihood strategies and outcomes has led to the recognition of the
important marine-related activities in those communities. The establishment of an MPA
potentially brings negative impacts to the coastal villagers. A balance between
conservation efforts and the improvement of communities’ livelihoods will reduce
hardship. The recognition and meaningful participation of fishers in marine resource
management as well as the prioritisation of local problems should be integrated in the
best practices. The coastal communities are the main stakeholder groups and planning
bodies need to see the local fishers as the main actors in marine resource management,
not as the objects of marine policy.

Chapter 8: Conclusion _______________________________________________________________________
364
This study reveals that effective management of the marine resources in Pantar Island
and surrounding waters requires a multi-faceted approach. Utilisation of marine
resources is an essential component of the coastal communities’ livelihood strategies and
has intrinsic socio-economic and cultural values. The challenge, not insurmountable is
for conservation initiatives to recognise and consider the linked socio-ecological system
between livelihoods and marine resources, and that there are inherent tradeoffs for both
livelihoods and conservation in establishing MPAs.

References _____________________________________________________________________________
364
References
Abecasis, R.C., Longnecker, N., Schmidt, L., Clifton, J. (2013). Marine conservation in remote small islands settings: factors influencing marine protected area establishment in the Azores. Marine Policy 40: 1–9.
Abraham, A. (1985). Subsistence credit: survival strategies among traditional fishermen.
Economic and political weekly. 20 (6): 247-252. Acheson, J. M. (2005). Developing rules to manage fisheries: A cross-cultural perspective. In L.
W. Botsford, Parma, A.M. (eds). Marine conservation biology. Washington DC, Island Press: 351-361.
Acheson, J. M. (1981). Anthropology of fishing, Annual Review Anthropology, 10:275-316. Acciaioli, G. (2004). From economic actor to moral agent: Knowledge, fate and hierarchy
among the Bugis of Sulawesi. Indonesia 78 (October 2004). Adams Jr, R. H. and Page, J. (2005). Do international migration and remittances reduce poverty
in developing countries? World Development 33(10): 1645-1669. Adams, S. , Mapstone, B. D. , Russ, G. R. and Davies, C. R. (2000). Geographic variation in the
sex ratio, sex specific size, and age structure of Plectropomus leopardus (Serranidae) between reefs open and closed to fishing on the Great Barrier Reef. Can. J. Fish. Aquat. S. 57(7): 1448–1458.
Adger, W.N., Hughes, T. P. , Folke, C., Carpenter, S.R., Rockstrom, J. (2005). Social-Ecological
Resilience to Coastal Disasters, Science, 309: 1036-1039. Adger, W.N. (2003). Social Capital, Collective Action, and Adaptation to Climate Change.
Economic Geography 79(4): 387–404. Adger, W.N. (1999). Social Vulnerability to Climate Change and Extremes in Coastal Vietnam.
World Development, 27 (2): 249-269. Adnan, H., Porse, H. (1987). Culture of Eucheuma cottonii and Eucheuma spinosum in
Indonesia. Hydrobiologia 151/152: 355-358. Afiff, S., Lowe, C. (2008). Collaboration, conservation and community: a conversation between
Suraya Afiff and Celia Lowe. In Sodhi, N.S., Acciaoli, G., Erb, M., Tan, A.K. (eds). Biodiversity and human livelihoods in protected areas: case studies from the Malay Archipelago. Cambridge University Press.
Afonso, P., Fontes, J., Santos, R.S. (2011). Small marine reserves can offer long term protection
to an endangered fish. Biological Conservation 144: 2739–2744. Agrawal, A., Redford. K. (2006). Poverty, development and biodiversity conservation: Shooting
in the dark? Wildlife Conservation Society.
References _____________________________________________________________________________
365
Agrawal, A. (2001). Common Property Institutions and Sustainable Governance of Resources, World Development, 29(10): 1649 - 1672.
Agrawal, A. and Gibson, C.C. (1999). Enchantment and Disenchanment: the role of community
in natural resource conservation. World Development. 27 (4):629-649. Ahmed, N., Allison, E.H., Muir, J.F. (2008).Using the Sustainable Livelihoods Framework to
Identify Constraints and Opportunities to the Development of Freshwater Prawn Farming in Southwest Bangladesh. Journal of the world aquaculture society. 39 (5): 598-611.
Ahmed, N (2007). Value chain analysis for hilsa marketing in coastal Bangladesh, Aquaculture
News, 33. Akamine, J. (2005). Role of the Sea cucumber Traders in the Depleting Resource Management:
A Philippine Case. Indigenous Use and Management of Marine Resource. Senri Ethnological Studies. 67: 259-278.
Allen, C.R., Gunderson, L.H. (2011). Pathology and failure in the design and implementation of
adaptive management. Journal of Environmental Management. 92: 1379-1384. Allen, C.R. and Sattaur, O. (2002). Sustainable livelihoods approaches: engaging with SL or just
best development practice? University of Bradford, UK. Allen, G. R. (2004). Handy pocket guide to the Tropical coral reef fishes of Indonesia. Periplus
editions. Singapore. Allen, G. R., Steene, R., Humann, P., DeLoach, N. (2003). Reef fish identification: Tropical
pacific. New World publications Inc. Jacksonville, Florida, USA. Allison, E.H. (2011). Aquaculture, fisheries, poverty and food security. Working paper. 2011-65.
World Fish Centre. Allison, E.H., Bene, C., Andrew, N.L. (2011). Poverty reduction as a means to enhance
resilience in small-scale fisheries. In Pomeroy, R.S., Andrew, N.L. (eds). Small-scale fisheries management: Frameworks and approaches for the developing world. CAB International. UK. 216-247.
Allison, E.H., Horemans, B. (2006). Putting the principles of the Sustainable Livelihoods
Approach into fisheries development policy and practice. Marine Policy 30: 757-766. Allison, E.H., Ellis, F. (2001. The livelihoods approach and management of small-scale fisheries.
Marine Policy, 25: 377–388. Alor District Government (2012). Draft 1 Zoning plan of Alor District Marine Conservation
Area. Bappeda-DKP-Team PPKLD-WWF Indonesia. Ammarel, G. (2002). Bugis migration and modes of adaptation to local situations. Ethnology 41
(1): 51-67.

References _____________________________________________________________________________
366
Anderson SC, Mills-Flemming J, Watson, R., Lotze HK. (2011). Serial exploitation of global sea cucumber fisheries. Fish and Fisheries 12(3): 317-339.
Andrade, G.S.M., Rhodes, J.R. (2012). Protected Areas and Local Communities: an Inevitable
Partnership toward Successful Conservation Strategies?" Ecology and Society 17(4): 16. Anggadiredja, J.T. (2010). The Sustainable Strategy for Indonesian Seaweed Industrial
Development (Report Study) . Presented at SEABFEX III, Surabaya. Indonesia. Anggadiredja, J.T., Zatnika, A., Purwoto, H., Istini, S. (2006). Rumput laut. Penebar Swadaya. Apps, P. F. and Rees, R. (1996). Labour supply, household production and intra-family welfare
distribution. Journal of Public Economics 60(2): 199-219. Arnstein, S.R. (1969). A Ladder of Citizen Participation, Journal of the American Planning
Association, 35 (4): 216-224. Ashley, C. and Carney, D. (1999). Sustainable Livelihoods: Lessons from early experience. In
www.livelihoods.org Ask, E. I. (1999). Cottonii and Spinosum cultivation handbook, FMC Biopolymer, Philadelphia,
USA. Asmedi, R. (2004). Teripang: Komoditas unggulan yang menjanjikan. Oxfam-GB Indonesia
Office. Aswani, S., Christie, P., Muthiga, N.A., Mahon, R., Primavera, J.H., Cramer, L.A., Barbier, E.B.,
Granek, E.F. Kennedy, C.J., Wolanski, E., Hacker, S. (2012). The way forward with ecosystem-based management in tropical contexts: Reconciling with existing management systems. Marine Policy. 36(1): 1-10.
Aswani, S., (2005). Customary sea tenure in Oceania as a case of rights-based fishery
management: Does it work? Reviews in Fish Biology and Fisheries. 15:285–307. Aswani, S. and Weiant, P. (2004). Scientific Evaluation in Women’s Participatory Management:
Monitoring Marine Invertebrate Refugia in the Solomon Islands. Human Organization Vol. 63 (3): 301-319.
Atapada, Z. (2009). Laporan program perkembangan promosi dan pemasaran kerajinan
tradisional Riung Artshop tahun 2007-2008. Unpublished report. WWF Indonesia. Atapada, Z., Purnomo, F.S. (2008). Pola Pemanfaatan Sumberdaya Laut dan Pesisir serta
kondisi social ekonomi desa target WWF di Kabupaten Alor, Flores Timur and Lembata. Project Alor Solor. Unpublished report. WWF Indonesia.
Atapada, Z., Prayitno, W., Meme, M.Y., Manuputy, J., Hilmi, M. (2003). Sebuah seri report:
kawasan pesisir dan laut Ngada. Program Nusa Tenggara. WWF-Indonesia. Atmaja, S.B. and Nugroho, D. (1995). Aspek Reproduksi Ikan Layang Ledes (Decapterus
macrosoma) dan Siro (Amblygaster sim) sebagai pertimbangan dalam pengelolaan di Laut Jawa. Jurnal Penelitian Perikanan Indonesia. 1 (3).

References _____________________________________________________________________________
367
Azam, M.S., Imai, K.S. (2009). Vulnerability and poverty in Bangladesh. Working Paper 141
Chronic Poverty Research Centre. Economics, School of Social Sciences. University of Manchester, UK
BPS/Badan Pusat Statistik (2013). Jumlah dan Persentase Penduduk Miskin per propinsi 2007-
September 2012. BPS Badan Pusat Statistik Kabupaten Alor/BPS (2009). Alor in Figures 2009. Badan Pusat Statistik
Kabupaten Alor. Kalabahi. BPS (2010). Profil kemiskinan di Indonesia Maret 2010. Berita Resmi Statistik No. 45/07/Th.
XIII, 1 Juli 2010 available at http://www.bps.go.id/brs_file/kemiskinan-01jul10.pdf BPS (2004). Alor Dalam Angka in 2004. BPS
BPS (2008). Alor Dalam Angka. BPS
BPS Alor (2011). Alor Dalam Angka. BPS
BPS Alor (2012). Alor Dalam Angka. BPS
Biro Pusat Statistik (2006). Wakatobi dalam Angka. Biro Pusat Statistik. Jakarta. BPS NTT (2011). Produksi Tanaman Padi dan Palawija NTT. Berita resmi statistic November
2011. Bappeda Alor (2013). Zonasi Kawasan Konservasi Perairan Daerah Kabupaten Alor. Ban, N.C., Adams, V.M., Almany, G.R., Ban, S., Cinner, J.E., McCook, L.J., Mills, M., Pressey,
R.L., White, A. (2011). Designing, implementing and managing marine protected areas: Emerging trends and opportunities for coral reef nations. Journal of Experimental Marine Biology and Ecology 408: 21–31.
Baines, G., Hviding, E. (1992). Traditional Environmental Knowledge from the Marovo Area of
the Solomon Islands. In Johnson, M. (ed). LORE: Capturing Traditional Environmental Knowledge. The Dene Cultural Institute and the International Development Research Centre. Ottawa.
Bakorsurtanal (2007). Peta Indonesia. Bakorsurtanal. Balai Taman Nasional Wakatobi-Pemerintah Kabupaten Wakatobi (2008). Rencana Pengelolaan
Taman Nasional Wakatobi 1998-2023 (Revisi 2008). Balai Taman Nasional Wakatobi dan Pemerintah Kabupaten Wakatobi (2006). Buku Zonasi
Taman Nasional Wakatobi, Chapter 2: 5-14. Balgos, M.C. (2005). Integrated coastal management and marine protected areas in the
Philippine: concurrent problem, Ocean and coastal management, 48:972-995 Bappenas (2005) Rehabilitasi dan rekonstruksi Kabupaten Alor Provinsi NTT Pasca Gempa:
Rencana. Republik Indonesia. Available at

References _____________________________________________________________________________
368
http://www.bappenas.go.id/node/92/490/rencana-rehabilitasi-dan-rekonstruksi-kabupaten-alor-provinsi-ntt-pasca-gempa/ Accessed 9 January 2009
Barlow, C. and Gondowarsito, R. (2008). Socio-economic conditions and poverty alleviation in
East Nusa Tenggara. In Resosudarmo, B.P and Jotzo, F. Against poverty: Development, resources and the environment in Eastern Indonesia. Institute of Southeast Asian Studies. Singapore. 94-121.
Barnes, R. (1982). The Majapahit dependency Galiyao In: Bijdragen tot de Taal-, Land- en
Volkenkunde. KITLV journals-Leiden.138 (4): 407-412. Barnes, R. H. (1974). Kédang: a study of the collective thought of an eastern Indonesian people,
Oxford: Clarendon Press. Barth, F. (2010). Introduction to ethnic groups and boundaries: the social organisation of
cultural difference. In Martinello, M and Rath, J (eds) Selected studies in international migration and immigrant incorporation. Amsterdam University Press, Amsterdam: 407-436.
Bauchet, J., Marshall, C., Starita, L., Thomas, J., Yalouris, A. (2011). Latest findings from
randomized evaluations of microfinance. Consultative Group to Assist the Poor. The World Bank.
Bavinck, M., Chuenpagdee, R. (2005). Current Principles. In Kooiman, J., Bavinck, M., Jentoft,
S., Pullin, R. (eds). Fish for life: Interactive governance for fisheries. MARE Publications Series No. 3. Amsterdam University Press. Amsterdam.
Bayangos, V. and K. Jansen (2011). Remittances and Competitiveness: The Case of the
Philippines. World Development 39(10): 1834-1846. Beard, V. A. (2007). Household Contributions to Community Development in Indonesia. World
Development 35(4): 607-625. Beaulieu, L. J. (2002). Mapping the Assets of Your Community: A Key component for Building
Local Capacity. Instructor's Guide (227). Bebbington, A., Dharmawan, L., Fahmi, E., Guggenheim, S. (2006). Local Capacity, Village
Governance, and the Political Economy of Rural Development in Indonesia, World Development, 34(11): 1958–1976.
Bebbington, A. (1999). Capitals and Capabilities: A framework for analysing peasant viability,
rural livelihoods and poverty in the Andes. London, IIED and DFID. Becker, G.S. (1965). A theory of the allocation of time. The economic of journal. 299 (LXXV):
493-517. Begg, G.A., Mapstone, B.D., Williams, A.J., Samantha Adams, S., Davies, C.R., Lou, D.C.
(2005). Multivariate life-history indices of exploited coral reef fish populations used to measure the performance of no-take zones in a marine protected area. Can. J. Fish. Aquat. Sci. 62(3): 679–692.

References _____________________________________________________________________________
369
Bell, J. D., Purcell, S.W., Nash, W. (2008). Restoring small-scale fisheries for tropical sea cucumbers. Ocean & Coastal Management 51(8-9): 589-593.
Belton, B.D.N. (2010). The Social Relations of Aquaculture Development in South and Southeast
Asia. PhD Thesis. Institute of Aquaculture, University of Stirling. Scotland, UK. Bene, C., Lawton, R., Allison, E.H. (2010). Trade matters in the fight against poverty:
Narratives, perceptions and (Lack of) evidence in the case of fish trade in Africa. World Development. 38 (7): 933-954.
Bene, C., Macfadyen, G. & Allison, E.H. 2007. Increasing the contribution of small‐scale
fisheries to poverty alleviation and food security. FAO Fisheries Technical Paper. No. 481. Rome, FAO. 125p.
Bene, C., (2004), Poverty in small scale fisheries: a review and some further thoughts, in Neiland,
Arthur E., and Bene, C. (eds.), Poverty and small scale fisheries in West Africa, FAO, Netherland, 59-80.
Bene, C., (2003). When fishery rhymes with poverty: a first step beyond the old paradigm on
poverty in small-scale fisheries. World Dev 31:949–975. Benn, S., Dunphy, D., Martin, A. (2009), Governance of environmental risk: New approaches to
managing stakeholder involvement, Journal of Environmental Management, 80: 1567-1575.
Berghofer, A., Wittmer, H., Rauschmayer, F. (2008). Stakeholder participation in ecosystem-
based approaches to fisheries management: A synthesis from European research projects, Marine Policy, 32: 243-253.
Berkes, F. (2005). Commons theory for marine resource management in a complex world In J.
M. S. Nobuhiro Kishigami, Indigenous use and management of marine resources. Osaka, National Museum of Ethnology: 13-31
Berkes, F., and Folke, C. (1998). Linking Social and Ecological Systems for Resilience and
sustainability. In Berkes, F., and Folke, C. Linking Social and Ecological Systems: Management Practices and Social Mechanisms for Building Resilience. Cambridge; New York: Cambridge University Press.
Berman, R., Quinn, C., Jouni Paavola, J. (2012). The role of institutions in the transformation of
coping capacity to sustainable adaptive capacity. Environmental Development. Bhavnani, A., Chiu, R. W., Janakiram, S., Silarszky, P. (2008). The rural of mobile phone in
sustainable rural poverty reduction. ICT Policy Division. Global Information and Communication Department (GICT). The World Bank.
Birkmann, J. (2011). First- and second-order adaptation to natural hazards and extreme events in
the context of climate change. Natural Hazards. 58:811–840 Birkmann, J. (2006). Measuring vulnerability to natural hazards: towards disaster resilient
societies. United Nations University Press. New York.

References _____________________________________________________________________________
370
Bixler, H.J., Porse, H. (2010). A Decade of Change in the Seaweed Hydrocolloids Industry. Paper presented at XX ISS in Mexico.
Black, R., Richard, S. Bennett, S.R.G., Thomas, S.M. Beddington, J. R. (2011). Climate change:
Migration as adaptation. Nature, 478 (7370): 447-449. Bodin, O., Crona, B. (2009). The role of social networks in natural resource governance: What
relational patterns make a difference? Global Environmental Change 19: 366–374. Bodin, O., Crona, B. (2007). Management of Natural Resources at the Community Level:
Exploring the Role of Social Capital and Leadership in a Rural Fishing Community, World Development, 36(12): 2763–2779.
Borrini-Feyerabend, G. Kothari, A., Oviedo, G., Phillips, A. (2004). Indigenous and Local
Communities and Protected Areas: Towards Equity and Enhanced Conservation. IUCN. Botsford, L. W., and Parma, A.M. (2005). Uncertainty in marine management.. In Norse, E.A
and Crowder, L.B (eds). Marine conservation biology. Washington DC, Island Press: 375-392.
Brown E.O. M.L. Perez, L.R. Garces, R.J. Ragaza, R.A. Bassig and Zaragoza, E.C. (2010).
Value Chain Analysis for Sea Cucumber in the Philippines. Studies & Reviews 2120. The WorldFish Center, Penang, Malaysia. 44.
Brady, M. and Waldo, S. (2009). Fixing problems in fisheries—integrating ITQs, CBM and
MPAs in management. Marine Policy 33: 258–263. Brown, Be (2007). “Resilience Thinking Applied to the Mangroves of Indonesia.” IUCN &
Mangrove Action Project; Yogyakarta, Indonesia Brown, K (2002a). Innovations for conservation and development. The Geographical Journal.
16b.1: 6-17. Buanes, A., Jentoft, S., Maurstad, A., Soreng, S.U., Karlsen, R., (2005). Stakeholder
participation in Norwegian coastal zone planning, Ocean and Coastal Management, 48: 658-669.
Buanes, A., Jentoft, S., Karlsen, G.R., Maurstad, A., Søreng., S. (2004). In whose interest? An
exploratory analysis of stakeholders in Norwegian coastal zone planning, Ocean & Coastal Management 47: 207–223.
Bungin, B. (2007). Penelitian kualitative: komunikasi, ekonomi, kebijakan public, dan ilmu
social lainnya. Kencana Prenada Media Group. Jakarta. Buckley, R. (2004). Environmental impacts of ecotourism. Ecotourism series 2. CABI
Publishing. United Kingdom. Bunce, L., Townsley, P., Pomeroy, R., and Pollnac, R. (2000). Socio-economic Manual for
Coral Reef Management. Australian Institute of Marine. Townsville, Australia. Available at www.reefbase.org

References _____________________________________________________________________________
371
Burdess, N. (1994). The really understandable stats book: For people who prefer English words and phrases to mathematical symbols and formulae. Prentice Hall Australia Pty Ltd. New South Wales, Australia
Burke, L., Reytar, K., Spalding, M., Perry, A. (2012). Reefs at risk: Revisited in the coral
triangle. World Resources Institute. Washington DC. Burke, L., L. Selig, and M. Spalding. (2002). Reefs at Risk in Southeast Asia. World Resources
Institute. Washington DC. Burkepile, D.E., Hay, M.E. (2008). Herbivore species richness and feeding complementarity
effect community structure and function on a coral reef. PNAS.105 (42): 16201–16206. Byers, J.E., Noonburg, E.G. (2007). Poaching, enforcement and the efficacy of marine reserves.
Ecological Applications, 17(7): 1851-1856. Cahn, M. (2006). Sustainable Rural Livelihoods, Micro-Enterprise and Culture in the Pacific
Islands: Case studies from Samoa. PhD Thesis, Development Studies, Massey University, Palmerston North, New Zealand.
Cailliet, G.M., Love, M.S., and Ebeling, A.W. (1986). Fishes: A field and laboratory manual on
their structure, identification and natural history. Wadsworth Publishing Company. California, USA.
Campbell, B.M., Sayer, J.A., Frost, P., Vermeulen, S., Perez, M.R., Cunningham, A., and Prabhu,
R. (2003). Assessing the performance of natural resource systems. In Campbell, B.M., Sayer, J.A., Integrated natural resource management: linking productivity, the environment and development. UK, CABI Publishing and Centre for International Forestry Research: 267-292.
Campbell, J., Townsley, P., Whittingham, E., Ward, A., Viryak, S., Bunthoeun, S., Ponley, H.,
Dyna, E., Ly, N., Panha, P., Sony, C., Sopanha, C., Sophany, K., Mayonry, I., Sreymom, S., and Chhin, N. (2005). Understanding the factors that support or inhibit livelihood diversification in coastal Cambodja, An output from DFID-funded research in Cambodia. IMM Ltd, Exeter, UK.
Campbell, S. J., Kartawijaya, T., Yulianto, I., Prasetia, R., Clifton, J. (2013). Co-management
approaches and incentives improve management effectiveness in the Karimunjawa National Park, Indonesia. Marine Policy 41: 72-79.
Campbell-Nelson, J. (2008). Religion and Disaster A Critical Reflection Post Alor Earthquake
2004. Working Paper 8. Institute of Indonesia Tenggara Timur Studies Publications. Carlsson, L. and Berkes, F. (2005), Co-management: concepts and methodological implications,
Journal of Environmental Management, 75: 65–76. Carneiro, G. (2011). Marine management for human development: A review of two decades of
scholarly evidence. Marine Policy. 35(3): 351-362. Carney, D. (2002). Sustainable livelihoods approaches: progress and possibilities for change.
London: DFID.

References _____________________________________________________________________________
372
Carney, D., Drinkwater, M., Tamara Rusinow, Koos Neefjes, Samir Wanmali, Naresh Singh
(2002). Livelihood Approached Compared: A brief comparison of the livelihoods approach of the DFID-UK, CARE, Oxfam, UNDP, FAO.
Carney, D., (ed) (1998). Sustainable rural livelihoods: what contribution can we make?
Department for International Development, London. Cattermoul B., Townsley P., and Campbell J. (2008). Sustainable Livelihoods Enhancement and
Diversification (SLED): A Manual for Practitioners. IUCN. Cernea, M.M., Schmidt-Soltau, K. (2006). Poverty risks and national parks: policy issues in
conservation and resettlement. World Development, 34: 1808–1830. Cesar, H.J.S., Burke, L., and Pet-Soede, L. (2003). The Economics of Worldwide Coral Reef
Degradation. Cesar Environmental Economics Consulting, Arnhem, and WWF-Netherlands, Zeist, The Netherlands. 23.
Cesar, H.J.S., van Beukering, P., Pintx, S., Dierking, J. (2002). Economic valuation of coral
reefs of Hawaii. University of Hawaii, DAR, NOAA. Chambers, R. (2008). Revolutions in Development Inquiry, Earthscan, London. Chambers, R. (2008). The development of Sustainable Livelihoods Approaches (SLA) at the IDS
Livelihoods Network's SLA seminar 13th October 2008 interviewed in www.eldis.org Chambers, R. (2005), Ideas for development, Earthscan, London, VA Chambers, R., and Conway, G.R. (1992). Sustainable rural livelihoods: practical concepts for
the 21st century. Institute of Development Studies discussion paper no. 296. Brighton, GB: University of Sussex Institute of Development Studies.
Chambers, R. (1983). Rural development, putting the last first, Longman, Harlow, UK. Chambers, R. (1995). Poverty and Livelihoods: Whose reality counts? Environment and
Urbanisation, 7 (1). Chambers, R. (1992). Rural appraisal: rapid, relaxed and participatory. IDS Discussion Paper
311. Chang, H.J. (2003). Globalization, Economic Development and the Role of the State. London:
Zed Books. Chapin, M. (2004). A challenge to conservationists can we protect natural habitats without
abusing the people who live in them? Earth Watch 17:17–31. Charles, A. (2010). Fisheries and marine protected areas: A spatial bioeconomic analysis of
distributional impacts. Natural Resource Modeling 23(2): 218-252.

References _____________________________________________________________________________
373
Chen Ji, C (2004). Kepulauan Alor, Indonesia Earthquake. Available at www.tectonics.caltech.edu/slip_history/2004_indo-kep_alor/alor.html accessed 30 April 2010.
Chen, Jiaxin (2003). Overview of Sea cucumber farming and sea ranching practices in China.
Beche de mer Information Bulletin, 18. May 2003. Choo, Poh-Sze (2008). Population status, fisheries and trade of sea cucumbers in Asia. In
V. Toral-Granda, A. Lovatelli and M. Vasconcellos (eds). Sea cucumbers. A global review of fisheries and trade. FAO Fisheries and Aquaculture Technical Paper. No. 516.Rome, FAO. pp. 81-118.
Cho, J.O. and Rogerson, R. (1988). Family labor supply and aggregate fluctuations. Journal of Monetary Economics 21(2-3): 233-245.
Christie, P. (2005). Observed and perceived environmental impacts of marine protected areas in
two Southeast Asia sites. Ocean & Coastal Management 48: 252–270. Christie, P. (2004). MPAs as biological success and social failures in Southeast Asia, American
Fisheries Society Symposium 42, pp. 155–164. Chuenpagdee, R., Pascual-Fernandez, J.J., Szelianszky, E., Alegret, J. L., Fraga, J., Jentoft, S.
(2013). Marine protected areas: Re-thinking their inception. Marine Policy 39: 234-240. Chuenpagdee, R., Jentoft, S. (2011). Situating poverty: a chain analysis of small scale fisheries.
In Jentoft, S., Eide, A (eds). Poverty mosaics: realities and prospects in small scale fisheries. Springer. Amsterdam: 27-42.
Chuenpagdee, R., Jentoft, S. (2007). Step zero for fisheries co-management: What precedes
implementation. Marine Policy 31: 657–668. Chuenpagdee, R., Juntarashote, K. (2011). Learning from the Experts: Attaining Sufficiency in
Small-Scale Fishing Communities in Thailand. Poverty Mosaics: Realities and Prospects in Small-Scale Fisheries. Springer: 309-331.
Chullasorn, S. and Martosubroto, P. (1986). Distribution and important biological features of
coastal fish resources in Southeast Asia. Food and Agriculture Organisation of the United Nations. Rome.
Cinner J.E., Daw, T., McClanahan, T.R. (2009) Socioeconomic factors that affect artisanal
fishers’ readiness to exit a declining fishery. Conservation Biology. 23(1): 124-130. Cinner J.E., Aswani, S. (2007). Integrating customary management into the modern conservation
of marine resources. Biological Conservation. Cinner J.E. (2007). Designing marine reserves to reflect local socioeconomic conditions: lessons
from long-enduring customary management systems, Coral Reefs, 26:1035–1045. Clark, J., and Carney, D. (2008). ESRC Research seminar Sustainable Livelihoods Approaches –
What have we learnt? DFID.

References _____________________________________________________________________________
374
Clark, C. W. (2006). Fisheries bioeconomics: why is it so widely misunderstood? Population Ecology 48(2): 95-98.
Clark, C. W. (2002). Renewable resources: fisheries, in Jeroen C.J.M. van den Bergh, Handbook
of Environmental and Resources Economics, Edward Elgar Publishing Inc, Northampton, 109-121.
Claudet, J. and Guidetti, P. (2010). Improving assessments of marine protected areas. Aquatic
Conservation: Marine and Freshwater Ecosystems. 20:239-242. Clifton, J. (2013). Refocusing conservation through a cultural lens: Improving governance in the
Wakatobi National Park, Indonesia. Marine Policy. Clifton, J. (2013). Compensation, conservation and communities: an analysis of direct payments
initiatives within an Indonesia marine protected area. Environmental Conservation 40 (3): 287–295.
Clifton, J., Majors, C. (2011). Culture, Conservation, and Conflict: Perspectives on Marine
Protection Among the Bajau of Southeast Asia. Society and Natural Resources. 0:1–10. Clifton, J. (2009). Science, funding and participation: key issues for marine protected area
networks and the Coral Triangle Initiative. Environmental Conservation: 1-6. Coelho, V.S.P., and Favareto, A. (2008), Questioning the Relationship between Participation and
Development: A case study of the Vale do Ribeira, Brazil, Article in Press, World Development.
Cohen, P., Valemei, A.D., Govan, H. (2008). Annotated Bibliography on Socio-economic and Ecological Impacts of MPA in Pacific Island Countries. ReefBase Pacific. Worldfish Bibliography 1870. The Worldfish Center, Penang, Malaysia.
Collette, B.B. (2004). Family Hemiramphidae Gill 1859: halfbeaks. Annotated checklists of
fishes. Checklist 22.California Academy of Sciences. Coles, A., Mitchell, J., Owaygen, M., Sheperd, A. (2011). Conclusions. In Mitchell, J and Coles,
C (eds). Markets and rural poverty: Upgrading in value chains. International Development Research Centre. Earthscan. Washington DC: 235-260.
Colombo, M. and Senatore, A. (2005). The Discursive Construction of Community Identity,
Journal of Community & Applied Social Psychology, 15: 48–62. Conand, C. (2004). Present status of world sea cucumber resources and utilisation: an
international overview. In Conand, C., Purcell, S., Uthicke, S., Hamel, J., Mercier, A. (eds). Advances in sea cucumber aquaculture and management. FAO Fisheries Technical Paper 463.
Concu, N. and Atzeni, G. (2012). Conflicting preferences among tourists and residents. Tourism
Management: 1-8. Conservation International (2008). Economic Values of Coral Reefs, Mangroves, and
Seagrasses: A Global Compilation. Center for Applied Biodiversity Science, Conservation International, Arlington, VA, USA.

References _____________________________________________________________________________
375
Cooke, F. M. (2004). Symbolic and social dimensions in the economic production of seaweed.
Asia Pacific Viewpoint 45(3): 387–400. Cooke, B., and Kothari, U. (2001). The case for participation. In Cooke, Bill. and Kothari, Uma
Participation: the new tyranny, Zed books, London, 1-15. Coulhard, S., Johnson, D., McGregor, J.A. (2011). Poverty, sustainability and human wellbeing:
a cosial wellbeing approach to the global fisheries crisis. Global Environmental Change 21: 453-463.
Cowen, R. K., Gawarkiewicz, G.G., Pineda, J., Thorrold, S.R., Werner, F. E. (2007). Population
connectivity in marine systems: an overview. Oceanography. 20 (3): 14-21. Coyne, R. (2005). Wicked problems revisited. Design Studies 26(1). Crawford, B., M.D. Herrera, N. Hernandez, C.R. Leclair, N. Jiddawi, S. Masumbuko, and M.
Haws. (2010). Small Scale fisheries Management: Lessons from Cockle Harvesters in Nicaragua and Tanzania. Basins and Coasts News 2 (4): 5-11.
Crawford, B. (2009). Factors influencing the success of community based marine protected
areas in north Sulawesi Indonesia. PhD Thesis. University of Rhode Island Crawford, B., Kasmidi, M., Korompis, Pollnac, R.B. (2006). Factors Influencing Progress in
Establishing Community-Based Marine Protected Areas in Indonesia. Coastal Management, 34:39–64.
Crawford, B. (2002). Seaweed Farming: An Alternative Livelihood for Small-Scale Fishers?
Working paper. Coastal Resource centre. University of Rhode Island. Creswell, J. W. (1998). Qualitative inquiry and research design: Choosing among five traditions.
California, USA, Sage Publications. Crona, B., Nystrom, M., Folke, C., and Jiddawi, N. (2010). Middlemen, a critical social-
ecological link in coastal communities of Kenya and Zanzibar. Marine Policy 34(4): 761-771.
CTI-CFF Indonesia (2009). Indonesia National Plan of Actions. National Secretariat of CTI-CFF
Indonesia. CTI-CFF (2009). Regional plan of action. CTI-CFF (Coral Triangle Initiative on Coral reefs,
Fisheries, and Food Security). Cullen, L.C. (2007). Marine resource dependence, resource use patterns and identification of
economic performance criteria within a small Indo-Pacific island community. PhD Thesis. Department of Biological Sciences. University of Essex. UK
Cunningham A.B., Ingram W., Daos Kadati W., Howe J., Sujatmoko S., Refli R., Liem J.V.,
Tari A., Maruk T., Robianto N., Sinlae A., Ndun Y., Made Maduarta I., Sulistyohardi D. and Koeslutat E. (2011). Hidden economies, future options: trade in non-timber forest

References _____________________________________________________________________________
376
products in eastern Indonesia. ACIAR Technical Reports No. 77. Australian Centre for International Agricultural Research: Canberra. 115.
Cunningham, A.B. (2009). Culture, Livelihoods and Conservation. In Stacey, N., Boggs, G.,
Campbell, B., Steffen, W. (eds). Prepare for Impacts: when people and environment collide in the tropics. Charles Darwin University Press. Darwin.
Daskon, C. (2010). Cultural Resilience: The roles of cultural traditions in sustaining rural
livelihoods: A case study from the Kandayan villages, Central Srilanka. Sustainability. 2:1080-1100.
Dakay, B. (2010). The future of carrageenan Industry. Presented at the Seawseed International
Business Forum and Exhibition/SEABFEX III, Surabaya, Indonesia. Dasaluti, T. (2009). Analisis Pengembangan Usaha Mikro Dalam Mendukung Pemberdayaan
Perempuan di Pulau Kecil. (Studi Kasus di Pulau Bunaken, Kota Manado, Sulawesi Utara). Master Thesis. Sekolah Paska Sarjana. Institut Pertanian Bogor. Bogor
Davies, J., White, J., Wright, A., Maru, Y., LaFlamme, M. (2008). Applying the sustainable
livelihoods approach in Australian desert Aboriginal development. The Rangeland Journal. 30: 55–65.
Denevan. W. M. (1983). Adaptation, Variation, and Cultural Geography. Professional
Geographer, 35 (4), 399–406. de Vivero, J.L.S., Mateos, J.C.R., Corral, D.F. (2008). The paradox of public participation in
fisheries governance. The rising number of actors and the devolution process. Marine Policy 32: 319–325
de Sherbinin, A., VanWey. L. K, McSweeney, K. Aggarwal, R., Barbieri, A., Sabine Henry, S.,
Hunter, L.M., Twine, W., Walker, R. (2008). Rural household demographics, livelihoods and the environment. Global Environmental Change 18: 38–53.
De Silva, H., Zainudeen, A., Ratnadiwakara, D. (2008). Perceived economic benefits of telecom
access at the Bottom of the Pyramid in emerging Asia. LIRNEasia (www.lirneasia.net) Dearden, P., Roland, R., Allison, G., and Allen, C. (2002). Sustainable Livelihood Approaches –
From the Framework to the Field. Supporting Livelihoods - Evolving Institutions. de Groot, J., Bush, S.R. (2010). The potential for dive tourism led entrepreneurial marine
protected areas in Curacao. Marine Policy. 34: 1051–1059. de Haan, L. (2012). The livelihood approach: A critical exploration. Erdkunde 66(4): 345-357. de Haan, L, Zoomers, A. (2005). Exploring the Frontier of Livelihoods Research. Development
and Change, 36(1): 27–47. Diedrich, A., Garcia-Buades, E. (2009). Local perceptions of tourism as indicators of destination
decline. Tourism Management 30: 512–521.

References _____________________________________________________________________________
377
Diener, E., Biswas-Diener, R. (2005). Psychological Empowerment and Subjective Well-being. In Narayan, D., Measuring Empowerment, Washington DC, The World Bank
Dietrich, S. (1984). A note on Galiyao and the early history of the Solor-Alor islands. Bijdragen
tot de Taal-, Land- en Volkenkunde 140: 2/3, Leiden, 317-326. Dietz, S. and Adger, W. N. (2003), Economic growth, biodiversity loss and conservation effort,
Journal of Environmental Management, 68:23-35. Department for International Development, UK (DFID) (1999) Sustainable livelihoods guidance
sheets, Numbers 1–8. London: DFID: Available online: www.livelihoods.org. Department for International Development, UK (DFID). (2000). Sustainable livelihoods
guidance sheets. Methods. DFID. Department for International Development, UK (DFID). (2001), Governance and SL Approach,
SL guidance Sheet, October 2001. de Viveroa, S. J.L., Mateosa, R.J., del Corral, F (2008). The paradox of public participation in
fisheries governance. The rising number of actors and the devolution process, Marine Policy, 32 (3): 319-325.
Djohani, R. (2009). Governance in Indonesia’s marine protected areas: A case study of Komodo
National Park. In Cribb, R., Ford, M. (eds). Indonesia beyond water’s edge: Managing an archipelagic state. Institute of Southeast Asian Studies. Singapore. pp 157-171
Domeier, M, L., Colin, P.L., Donaldson, T. J., Heyman, W. D., Pet, J. S., Russell, M., Sadovy,
Y., Samoilys, M. A., Smith, A., Yeeting, B.M., and Smith, S. (2002). Transforming coral reef conservation: reef fish spawning aggregations component. Spawning Aggregation Working Group Report, The Nature Conservancy, Hawaii, April 22, 2002. p. 85 (http://www.scrfa.org/doc/FSAS.pdf).
Dorsner, C. (2004). Social Exclusion and Participation in Community Development Projects:
Evidence from Senegal. Social Policy & Administration 38(4): 366-382. Dorward, A., and Kydd, J. (2004). The Malawi 2002 food crisis: the rural development challenge,
Journal of Modern African Studies, 42 (3): 343–361. Dorward, A., Poole, N., Morrison, J., Kydd, J., Urey, I. (2003). Markets, Institutions and
Technology: Missing Links in Livelihoods Analysis. Development Policy Review. 21 (3): 319–332.
Dorward, A. (2001). Pro-Poor Livelihoods: Addressing the Market/Private Sector Gap. Paper
presented at Sustainable Livelihoods Seminar on ‘Private Sector and Enterprise Development’, Crown Plaza Hotel, Manchester. Available at http://www.dfid.gov.uk/R4D/PDF/outputs/R7823c.pdf
Doyen, L., Thebaud, O., C. Béné, C., Martinet, V., Gourguet, S., Bertignac, M., Fifas, S.,
Blanchard, F. (2012). A stochastic viability approach to ecosystem-based fisheries management. Ecological Economics 75: 32-42.

References _____________________________________________________________________________
378
Dregde, D. (2012). Place change and tourism development conflict: Evaluating public interest. Tourism Management 31: 104–112.
Driyamedia (1996), Berbuat Bersama Berperan Setara: Acuan penerapan Participatory Rural
Appraisal, Driyamedia. du Bois, C. (1944), The people of Alor: A social-psychological study of an east Indian Island,
Harvard University Press, USA. Dudley, N., Mansourian, S., Stolton, S. and Suksuwan, S. (2008), Safety NetProtected areas and
poverty reduction: Arguments for Protection, WWF – World Wide Fund for Nature. Dudley, N. and Stolton, S. (1999). Conversion of paper parks to effective management:
Developing a target. Report to the WWF-World Bank Alliance from the IUCN/WWF Forest Innovation Project.
Duke, N.C., Meynecke, J.-O, Dittmann, S., Ellison, A.M., Anger, K., Berger, U., Cannicci, S.,
Diele, K., Ewel, K.C., Field, C.D., Koedam, N., Lee, S.Y., Mmarchand, C., Nordhaus, I., Dahdouh-Guebas, F. (2007). A World Without Mangroves? Science 317. p 41.
Duke, N.C., and Allen, J.A (2006). Rhizophora mangle, R. samoensis, R. racemosa, R.
harrisonii (Atlantic–East Pacific red mangrove). Available at: http://www.agroforestry.net/tti/Rhizophora-AEP.pdf
Duncan, C.R. (2007). Mixed outcomes: the impact of regional autonomy and decentralization on
indigenous ethnic minorities in Indonesia, Development and change, 38 (4): 711-733. Dunham, L., Freeman, R.E. and Liedtka, J. (2006). Enhancing stakeholder practice: a
particularized exploration of community Business Ethics Quarterly, 16 (1): 23-42. Duygan, B., Bump, J.B. (2007). Can Trade Help Poor People? The Role of Trade, Trade Policy
and Market Access in Tanzania. Development Policy Review. 25 (3): 293-310. Eble, J.A., Langston, R., Bowen, B.W. (2009). Growth and Reproduction of Hawaiian Kala,
Naso Unicornfish. Fisheries Local Action Strategy. Honolulu. Edgar, G. J. (2011). Does the global network of marine protected areas provide an adequate
safety net for marine biodiversity? Aquatic Conservation: Marine and Freshwater Ecosystems 21(4): 313-316.
Edward, P. (2004). Developing effective partnerships in natural resource management, PhD
thesis, Griffith University. Eghenter, C. (2011). Measuring social impacts of conservation in the Coral Triangle Initiatives.
Unpublished Workshop report. WWF Indonesia. Ellis, F. (2000). Rural livelihoods and diversity in developing countries. Oxford University Press.
New York. Ellis, F. (1998). Household Strategies and Rural Livelihood Diversification: Survey Article, The
Journal of Development Studies 35.

References _____________________________________________________________________________
379
Ellis, F., Allison, E. (2004). Livelihood diversification and natural resource access. Livelihood
Support Program (LSP) Working Paper 9, Food and Agriculture organization of the United Nations.
Ellis, F., Biggs. (2001). Evolving Themes in Rural Development 1950s-2000s. Development
Policy Review, 19 (4): 437-448 Ellis, F., and Mdoe, N. (2003). Livelihoods and Rural Poverty Reduction in Tanzania, World
Development, 31 (8): 1367-1384. Eriksson, H., de la Torre-Castro, M., Olsson, P. (2012). Mobility, Expansion and Management of
a Multi-Species Scuba Diving Fishery in East Africa. PLoS ONE 7(4) Eriyanto (2007). Teknik Sampling Analysis Opini Publik. LKiS. Yogyakarta. Espinosa-Romero, M.J., Chan, K.M.A., McDaniels, T., Dalmer, D.M. (2011). Structuring
decision-making for ecosystem-based management. Marine Policy 35: 575–583. Evans, S.M., Gill, M.E., Retraubun, ., A.S.W., Abrahamz, J., Dangeubun, J.(1997).
Traditional management practices and the conservation of the gastropod (Trochus nilitocus) and fish stocks in the Maluku Province (eastern Indonesia). Fisheries Research 31: 83-91
FAO/ Food and Agriculture Organization of the United Nations (2011). Fishing Technology Equipments. Fish Aggregating Device (FAD). Technology Fact Sheets. FAO Fisheries and Aquaculture Department. http://www.fao.org/fishery/equipment/fad/en accessed on 3 August 2011.
FAO (2011a). Marine protected areas and fisheries. FAO Technical guideline for responsible
fisheries. 4: 4. FAO. Rome. FAO (2010). 2008 Year Book: Fishery and aquaculture statistics. Food and Agriculture
Organisation of the United Nations, Rome. FAO (2009). The state of world fisheries and aquaculture 2008. FAO Fisheries and Aquaculture
Department. FAO Fisheries and Aquaculture Department. Rome. FAO and World Fish Center (2008). Small-scale capture fisheries: A global overview with
emphasis on developing countries. Food and Agriculture Organization of the United Nations (FAO), World Fish Center, the World Bank.
FAO (2007). The world’s mangroves 1980-2005. FAO Forestry paper 153. FAO. Rome. P. 89. FAO (2005). Review of the state of world marine fishery resources. Fisheries Technical Paper.
457. Rome. p235. FAO (2003). Status and trends in mangrove area extent worldwide. By Wilkie, M.L. and
Fortuna, S. Forest Resources Assessment Working Paper No. 63. Forest Resources Division. FAO, Rome. (Unpublished) available at http://www.fao.org/docrep/007/j1533e/J1533E00.htm accessed on 25 November 2011

References _____________________________________________________________________________
380
FAO (1997). Fishery Management. FAO Technical guidelines for sustainable fisheries No. 4.
FAO. Rome. Farram, S. G. (2004). From 'Timor Koepang' to 'Timor NTT': A political history of west Timor,
1901-1967. PhD Thesis, Faculty of Law, Business and Arts, Charles Darwin University, Darwin.
Farrington, J. and Mitchel, J. (2006). How can the Rural Poor Participate in Global Economic
Process? Natural Resources Perspectives, 103. Farrington, J., Ramasut, T., Walker, J. (2002). Sustainable Livelihoods Approaches in Urban
Areas: General Lessons, with Illustrations from Indian Cases. Working Paper 162. Overseas Development Institute. London. UK. Available at http://www.odi.org.uk/resources/download/2009.pdf
Farrington J., Carney, D., Ashley,C., Turton, C. (1999). Sustainable livelihoods in practice:
Early applications of concepts in rural areas. Natural Resources Perspective, 42. Ferdose, F. (2004). World markets and trade flows of sea cucumber/beche-de-mer. In Lovatelli,
A., Conand, C., Purcell, S., Uthicke, S., Hamel, J., Mercier, A. (eds). Advances in sea cucumber aquacultureand management. FAO Fisheries Technical Paper 463. Food and Agriculture Organization of the United Nations. Rome.
Fernandez, C.J.J. (2010). Marine protected area: a case study in north-eastern Iloilo,
Philippines. Master thesis. Massey University. New Zealand. Ferreira, B. P. (1995). Reproduction of the Common Coral Trout Plectropomus
Leopardus (Serranidae: Epinephelinae) from the Central and Northern Great Barrier Reef, Australia. Bulletin on Marine Science. 56 (2): 653-669.
Ferse, S.C.A., Manez Costa,M. Mez, K.Z., Adhuri, D.S., Glaser, M. (2010). Allies, not aliens:
Increasing the role of local communities in marine protected area implementation. Environmental Conservation. 37 (1): 23–34
Fidelman, P. and Ekstrom, J. A. (2012). Mapping seascapes of international environmental
arrangements in the Coral Triangle. Marine Policy 36(5): 993-1004. Fidelman, P, Evans L, Fabinyi M, Foale S, Cinner J, Rosen F. (2011). Governing large-scale
marine commons: contextual challenges in the Coral Triangle. Marine Policy 36(1): 42-53.
Firth, R. (1983). We, the Tikopia: A sociological study of Kinship in primitive Polynesia.
Stanford University Press, California. Fitriana, R and Stacey, N. (2012). The Role of Women in the Fishery Sector of Pantar Island,
Indonesia. Asian Fisheries Science Special Issue. Asian Fisheries Society. 25S:159-175. Fitriana, R. (2007). 1000 hari di Bali Barat: sebuah proses belajar bersama masyarakat. Jakarta,
WWF Indonesia.

References _____________________________________________________________________________
381
Fitriana, R. and Drestha, M. (2006), Seaweed Farming as a tool to empower the coastal community in natural resources management. Case study: Community surround Bali Barat National Park, presented in Coastal Zone Asia Pacific (CZAP) conference, Batam.
Fisher, R.J., Maginnis, S., Jackson, W.J., Barrow, E., Jeanrenaud, S. (2005). Poverty and
conservation: landscapes, people and power. Landscape and livelihoods series 2. IUCN. Foale, S., Adhuri, D., Alino, P., Allison, E.H., Andrew, N., Cohen, P., Evans, L., Fabinyi, M.,
Fidelman, P., Gregory, C., Stacey, N., Tanzer, J., Weeratunge, N. (2013). Food security and the Coral Triangle Initiative. Marine Policy 38: 174–183.
Foale, S., Manele, B. (2004). Social and political barriers to the use of Marine Protected Areas
for conservation and fishery management in Melanesia. Asia Pacific Viewpoint, 45 (3): 373–386
Folke, C. (2006). The Economic Perspective: Conservation against Development versus
Conservation for Development, Conservation Biology. 20 (3). Forst, M.F. (2009). The convergence of Integrated Coastal Zone Management and the
ecosystems approach. Ocean & Coastal Management. 52 (6): 294-306. Fox, H., Soltanoff, C. S., Mascia, M. B., Haisfield, K.M., Lombana, A.V., Pyke, C R., Wood, L.
(2012). Explaining global patterns and trends in marine protected area (MPA) development. Marine Policy 36(5): 1131-1138.
Fox, H., Erdmann, M.V. (2000). Fish yields from blast fishing in Indonesia. Coral Reef 19:114. Fox, J.J (2011). Reconsidering Eastern Indonesia. Asian Journal of Social Science 39: 131-149. Fox, J. J. (2006). The Poetic Power of Place comparative perspectives on Austronesian ideas of
locality. Canberra, ANU E Press. Fox, J. J. (1977). The harvest of the palm: Ecological change in Eastern Indonesia. Cambridge,
Mass, Harvard University Press. Frey, B. S., and Stutzer, A., (2002). What can economist learn from happiness research? Journal
of Economic Literature, XL: 402-435 Friedman, A.L., Miles, S. (2008). Developing Stakeholder Theory, Journal of Management
Studies, 39 (1): 1 – 21 Friliyantin, T. (2009). Strategi pengembangan usaha mikro dan kecil sektor bahari di pulau kecil
(Studi Kasus Pulau Bunaken, Kota manado, Sulawesi Utara). Master Thesis. Sekolah Paska Sarjana. Institut Pertanian Bogor.
Froese, R.; Binohlan, C. (2000). Empirical relationships to estimate asymptotic length, length at
first maturity and length at maximum yield per recruit in fishes, with a simple method to evaluate length frequency data. J. Fish Biol. 56, 758–773.

References _____________________________________________________________________________
382
Fudge, J. (2007). The Solor and Alor Islands Survey Results 26 July to 11 August 2007, WWF Indonesia.
Fulton, E. A., Smith, A. D. M., Johnson, C. R. (2003). Effect of complexity on marine
ecosystem models. Marine Ecology Progress Series 253: 1-16. Ganter, R. (2008). Muslim Australians: the deep histories of contact. Journal of Australian
Studies 32 (4). Gaillard, JC., Maceda. E.A., Stasiak, E., Le Berre, I., Espaldon, M.V.O. (2009), Sustainable
livelihoods and people’s vulnerability, in the face of coastal hazards, Journal coast conservation, 13:119–129.
Gara, A.M.Z (2010). The use of social marketing as a means of promoting environmental
conservation: A case study of Indonesian biodiversity campaigns. MA Thesis. Department of Communication. The University of Texas at El Paso. USA.
Geer, van de C., Mills, M., Adams, V. M., Pressey, R. L., McPhee, D. (2013). Impacts of the
Moreton Bay Marine Park rezoning on commercial fishermen. Marine Policy 39: 248-256.
Gelcich, S., Omar, D., Iribane, O., Del Carpio, G., DuBois, R., Horta, S., Pablo, I.J., Godoy, N.,
Coayla, P.P., Carlos, C.J. (2009). Marine ecosystem-based management in the Southern Cone of South America: Stakeholder perceptions and lessons for implementation. Marine Policy 33(5): 801-806.
Gelcich, S., Edwards-Jones, G., Kaiser, M.J. (2004). Importance of attitudinal differences among
artisanal fishers toward co-management and conservation of marine resources, Conservation Biology, 19 (3): 865-875.
Gell, F.R., Roberts, C.M. (2003). Benefits beyond boundaries: the fishery effects of marine
reserves and fishery closures. Trends in Ecology and Evolution 18, 448–455. George, A.L. and Bennett, A. (2005). Case Studies and Theory Development in the Social
Sciences. Cambridge Mass. And London: MIT Press. Gertler, P., Levine, D., Moretti, E. (2009). Do microfinance programs help families insure
consumption against illness? Health economics, 18: 257-273. Gilliland, P.M., Laffoley, D. (2008). Key elements and steps in the process of developing
ecosystem-based marine spatial planning. Marine Policy 32: 787– 796. Ginting, S.P. (2011). Towards decentralized coastal management policy in Indonesia. In
Chuenpagdee, R (ed). World small scale fisheries contemporary visions. Eburon. Delft. Giuliani, E., Pietrobelli, C., Rabellotti, R. (2005). Upgrading in Global Value Chains: Lessons
from Latin American Clusters, World Development Vol. 33, No. 4, pp. 549–573. Glew, L., M.B. Mascia and F. Pakiding (2012). Solving the Mystery of MPA Performance:
monitoring social impacts. Field Manual (version 1.0). World Wildlife Fund and Universitas Negeri Papua, Washington D.C. and Manokwari, Indonesia.

References _____________________________________________________________________________
383
Gloerfelt-tarp, T., Kailola, P. (1981). Trawled fishes of Southern Indonesia and Northwestern
Australia. The Australian development Assistance Bureau-The Directorate General of Fisheries, Indonesia and The Germany Agency for Technical Cooperation.
Glynn, P.W., Enochs, I.C. (2011). Invertebrates and Their Roles in Coral Reef Ecosystems. In
Dubinsky, Z and Stambler, N. Coral reefs: an ecosystem in transition. Springer. New York. pp 273-325
Gomang, S.R. (2006). Muslim and Christian alliances: Familial relationship between inland and
coastal peoples of the Belagar community in eastern Indonesia. Kononlijk Instituut voor Taal-, Land-en Volkenkunde.BKI.162 (4): 468-489.
Gomang, S.R. (1993). The people of Alor and their alliance in Eastern Indonesia, MA Thesis,
Department of Sociology, University of Wollonggong, Wollonggong. Gordon, H.S. (1954).The Economic Theory of a Common-Property Resource. Journal of
Political Economy, 62 (2): 124-142. Gray, T., and Hatchard, J. (2008). A complicated relationship: stakeholder participation and the
ecosystem-based approach to fisheries management, Marine policy, 32: 158-168. de Groot, J., Bush, S.R. (2010). The potential for dive tourism led entrepreneurial marine
protected areas inCuracao. Marine Policy. 34: 1051–1059. Great Barrier Reef Marine Park Authority (2009). Great Barrier Reef outlook report 2009. Great
Barrier Reef Marine Park Authority. Available at http://www.gbrmpa.gov.au/__data/assets/pdf_file/0018/3843/OutlookReport_Full.pdf accessed on 12 December 2011
Griffith, D. R. (2008). The ecological implications of individual fishing quotas and harvest
cooperatives. Frontiers in Ecology and the Environment 6(4): 191-198. Griffin, J. (1988). Well-Being: Its Meaning, Measurement, and Moral Importance, Oxford
University Press. Grimble, R., and Wellard, K. (1997). Stakeholder Methodologies in Natural Resource
Management: a Review of Principles, Contexts, Experiences and Opportunities, Agricultural systems, 55 (2): 173-193
Grunert, K.G., Jeppesen, L.F., Jespersen, K.R., Sonne, A., Hansen, K., Trondsen, T., Young, J.A.
(2005). Market orientation of value chains A conceptual framework based on four case studies from the food industry, European Journal of Marketing, 39 (5/6). pp. 428-455.
Gudmundsson, E.; Asche, F.; Nielsen, M. (2006). Revenue distribution through the seafood
value chain. FAO Fisheries Circular. 1019: 51p. FAO. Rome. Guidetti, P., Claudet, J. (2009). Comanagement practices enhance fisheries in Marine Protected
Areas. Conservation Biology. 24 (1):312-318.

References _____________________________________________________________________________
384
Gunawan, B. I. and Visser, L. E. (2012). Permeable Boundaries: Outsiders and Access to Fishing Grounds in the Berau Marine Protected Area. Anthropological Forum 22(2): 187-207.
Haan, de Leo., and Zoomers, A. (2005). Exploring the frontier of livelihoods research,
Development and change, 36 (1), pp 27-47. Halim, A., Mous, P. (2006). Community Perception of Marine Protected Area Management in
Indonesia, A report to National Oceanic and Atmospheric Administration (NOAA), TNC, Bali.
Hall, S.J., Hilborn R., Andrew, N.L, Allison, E.H. (2013). Innovations in capture fisheries are an
imperative for nutirition strategy in the developing world. Pnas. Early edition: 1-6. Hall, C.M. (2001). Trends in ocean and coastal tourism: the end of the last frontier? Ocean &
Coastal Management 44: 601–618 Halpern, B.S., Walbridge, S., Selkoe, K., Kappel, C.V.,Micheli, F., Bruno, J.F., Casey. K.S.,
Ebert, C., Fox, H.E., Fujita, R., Heinemann, D., Lenihan, H.S., Madin, E.M.P., Perry, M.T., Selig, E.R., Spalding, M., Steneck, R., Watson, R. (2008). A Global Map of Human Impact on Marine Ecosystems. Science. 319 (5865): 948-952.
Halpern, B. (2003). The impact of marine reserves: do reserves work and does reserve size
matter? Ecological Applications 13(1):S117-S137 Halpern, B., and Warner, R. R. (2002). Marine reserves have rapid and lasting effects. Ecology
Letters 5(3): 361-366. Halton, G. (2007). What is bahasa Lamma?Logonyms, dialectology, and the future of
endangered languages, University of Alaska. Hambali, E., Suryani, A., Wadli. (2004). Membuat aneka olahan rumput laut. Penebar Swadaya.
Jakarta. pp 87. Hanneson, R. (1998). Marine reserves: what would they accomplish? Marine resource
Economics 13: 159-170. Hardin, R. (1982). Collective Action. Baltimore, Johns Hopkins Univ. Press. Hardin, G. (1968). The tragedy of the commons. Science 162: 1243-1248. Hardy, P., Bene, C., Doyen, L., Schwarz, A. (2013). Food security versus environment
conservation: A case study of Solomon Islands small-scale Fisheries. Environmental Development. 8: 38-56.
Hargreaves-Allen, V., Mourato, S., Milner-Gulland, E.J. (2011). A Global Evaluation of Coral
Reef Management Performance: Are MPAs Producing Conservation and Socio-Economic Improvements? Environmental Management. 47:684–700
Harrison, E. (2000). Gender, Rights and Poverty Issues: Lessons for the sector, Background
Paper For DFID/FGRP-3/ARP Workshop On: Practical Strategies for Poverty Targeted Research, held in The Melia Hotel, Hanoi,Vietnam,7-11November.

References _____________________________________________________________________________
385
Harmon, D., Putney, A.D. (eds) (2003). The full values of parks: from economics to the
intangible. Oxford, Lanham, Rowman and Littlefield publishers. Harkes, I, H. T. (2006). Fisheries co-management, the role of local institutions and
decentralisation in Southeast Asia With specific reference to marine sasi in Central Maluku, Indonesia Fisheries co-management, the role of local institutions and decentralisation in Southeast Asia With specific reference to marine sasi in Central Maluku, Indonesia. PhD Thesis. Institute of Environmental Sciences. University of Leiden
Harmon, D., Putney, A.D. (eds) (2003). The full range value of parks: from economics to the
intangible. Oxford. Lanham. Rowman & Littlefield publishers Haryadi, A. (2004). Socio-Economic Analysis of Marine Protected Area’s Benefits in Kepulauan
Seribu, Jakarta (In Indonesia). Ph.D Thesis. Bogor Agricultural University. Healey, J. (2006). World Poverty, The Spinney Press. Hempel, E. (2010). Value Chain Analysis in the Fisheries Sector in Africa. INFOSA. Henley, D. (2008). Natural resources management: Historical lessons from Indonesia. Human
Ecology. 36: 273-290 Herkenrath, P and Harrison, J. (2011). The 10th meeting of the Conference of the Parties to the
Convention on Biological Diversity—a breakthrough for biodiversity? Fauna and Flora International. Oryx.45 (1):1-2
Herr, M.L., Muzira, T.J. (2009). Value Chain Development for Decent Work: A guide for
development practitioners, government and private sector initiatives. International Labour Organization.
Hidayati, D., Rachmawati, L. (2002). Data Dasar Asek Sosial Terumbu Karang Indonesia.
Coremap. Jakarta. Hilborn, R. (2007). Managing fisheries is managing people: what has been learned? Fish and
Fisheries, 8: 285-296. Hind, E.J., Hiponia, M.C., Gray, T.S. (2009). From community-based to centralized national
management-A wrong turning for the governance of the marine protected area in Apo Island, Philippines? MarinePolicy.
Hinrichsen, R. A. (2009). Population viability analysis for several populations using multivariate
state-space models. Ecological Modeling 220: 1197-1202. Hirmen, S, A.H., Lapong, I., Haryanto, B., Antasari, Jaidi, Sugito, Sukir , N.(2005). Laporan
Studi Pola Pemanfaatan Sumberdaya Pesisir dan Laut di Perkampungan Nelayan Kabupaten Berau, Program Bersama Kelautan Berau, TNC-WWF-Indonesia.

References _____________________________________________________________________________
386
Hockings, M., Stolton, S., Dudley, N. (2000). Effectiveness: a framework for assessing the management of protected areas, Best practices protected areas guidelines series no.6, IUCN.
Hoeksema, B. (2001). Joint expedition: WWF Wallacea and Leiden University. Horwood, J.W., Nichols, J.H., Milligan, S. (1998). Evaluation of closed areas for fish stock
conservation. Journal of Applied Ecology. 35: 893-903. Hugo, G. (2005). Asian experiences with remittances beyond small change: making migrant
remittances count. D. F. Terry and S. R. Wilson. Washington, Inter-American Development Bank: 341-374.
Hugua (2006). Wakatobi's Districts Natural Resources Related to Community Empowerment.
Presented at CZAP Conference in Batam. Human, B.A. and Davies, A. (2011). Stakeholder consultation during the planning phase of
scientific programs. Marine Policy 34: 645–654. Humphrey, J., and Schmitz H. (2001). Governance in Global Value Chains, IDS Bulletin vol 32
No.3. Hussein, K. (2002). Livelihoods Approaches Compared: A Multi-Agency Review of Current
Practice. London, UK: DFID. Hviding, E. (2006). Knowing and managing biodiversity in the Pacific Islands: challenges of
environmentalism in Marovo Lagoon. UNESCO. Hviding, E. (1998). Contextual flexibility: present status and future of customary marine tenure
in Solomon Islands. Ocean & Coastal Management 40: 253-269. Idrus. M.R. (2009). Hard habits to break: Investigating Coastal Resource Utilisations and
Management Systems in Sulawesi, Indonesia. PhD Thesis. Department of Geography. University of Canterbury.
IFAD (2004). Trade and rural development: Opportunities and challenges for the rural poor,
IFAD Discussion Paper, Rome. IFAD (2009). Good practices in participatory mapping. IFAD. ICECON/The Icelandic Consulting for Fisheries (1997). Aspects of the industry, trade, and
marketing of Pacific Island Trochus: A report for the World Bank. In Trochus, Information Bulletin, 5. October 1997.
IFC (2007). Preliminary study- Chinese market for seaweed and carageenan industry. IFC. Ife, J., and Tesoriero, F. (2006). Community development, 3rd edition, Pearson education
Australia. ILO/International Labour Organisation (2012). Combining Value Chain Development and Local
Economic Development. ILO.

References _____________________________________________________________________________
387
Ireland, C. (2004). Alternative sustainable livelihoods for coastal communities- A review of
experience and guide to best practice, IUCN Irving, J., Mohapatra, S., Dilip, R. (2010). Migrant Remittance Flows: Findings from a Global
Survey of Central Banks. World Bank, Washington, D.C. Irz, Z., Stevenson, J.R., Villarante, P., Morissens, P. (2007). The Equity and Poverty Impacts of
Aquaculture: Insights from the Philippines. Development Policy Review. 25 (4): 495-516 Islam, G, M. N., Yew, T.S., Abdullah, N.M.R., Viswanathan, K.K. (2011). Social capital,
community based management, and the fishers’livelihood in Bangladesh. Ocean and coastal management. 54: 173-180.
Islam, S.B. and Habib, M.M. (2013). Supply Chain Management in Fishing Industry: A Case
Study. International Journal Supply Chain Management. 2 (2):40-50. IUCN (2005a). The Durban Action Plan. Available at
http://cmsdata.iucn.org//downloads/durbanactionplan IUCN (2005b). The Durban Recommendation. Available at
http://cmsdata.iucn.org//downloads/durbanrecommendation.pdf Jacinto, E.R., Pomeroy, R.S. (2011). Developing markets for small scale fisheries: Utilising the
value Caín approach. In Pomeroy, R. S., Andrew, N. (eds). Small scale fisheries management: Frameworks and approaches for the developing world. CAB International.
Jacinto Jr. E. R. (2004). A research framework on value chain analysis in small fisheries,
Tambuyog Development Centre, Philippines. Jentoft, S. Chuenpagdee, R., Pascual-Fernandez, J.J. (2011).What are MPAs for: On goal
formation and displacement. Ocean & Coastal Management 54: 75-83 Jentoft, S., Chuenpagdee, R. (2009). Fisheries and coastal governance as a wicked problem,
Marine policy. 33(4): 553-560. Jentoft, S. (2007). In the power of power: the understated aspect of fisheries and coastal
management, Human Organisation. 66. 4: 426-437. Jentoft, S., and Buanes, A. (2005). Challenge and myths in Norwegian coastal zone
management, coastal management 33:151-165 Johannes,R.E., Hviding, E. (2000). Traditional knowledge possessed by the fishers of Marovo
Lagoon, Solomon Islands, concerning fish aggregating behaviour. SPC Traditional Marine Resource Management and Knowledge Information Bulletin .12: 22-29.
Johannes,R.E., L. Squire, T. Graham, Y. Sadovy and H. Renguul. (1999). Spawning
aggregations of groupers (Serranidae) in Palau. The Nature Conservancy Marine Research Series Publication No. 1, p144.

References _____________________________________________________________________________
388
Jones, P.J.S., Qiu, W., De Santo, E. (2011). Governing Marine Protected Areas: Getting the balance right. Technical Report. United Nation Environment Program (UNEP).
Kahn, B. (2005). Indonesia Oceanic Cetacean Program Activity April-June 2005. Apex
Environmental Kahn, B. (2004). Indonesia Oceanic Cetacean Program Activity Repot October-December 2003.
Apex Environmental Kahn, B. (2002). Alor rapid ecological assessment technical report. Prepared for WWF-
Wallacea and TNC-Indonesia. APEX Environmental. Kambewa, P., Nagoli, J., Hüsken, S.M.C. (2009). Vulnerability of female fish traders to
HIV/AIDS along the fish market chain of the south-eastern Arm of Lake Malawi. Analysis report. The WorldFish Center and the Food and Agriculture Organization of the United Nations (FAO), with financial assistance from the Swedish International Development Cooperation Agency (Sida) and the Norwegian Ministry of Foreign Affairs.
Kanjii, N., MacGregor, J., and Tacoli, C. (2005). Understanding market-based livelihoods in a
globalising world: combining approaches and methods, International Institute for Environment and Development (IIED).
Kaplan, D.M., Botsford, L.W., Jorgensen, S.(2006). Dispersal per recruit: an efficient method for
assessing sustainability in marine reserve networks. Ecological Applications, 16(6): 2248–2263.
Kaplinsky, R. (2002). Globalisation and Enqualisation: what can be learned from value chain
analysis? Globalisation and Trade, p 117-146. Kaplinsky, R., and Morris, M. (2001). A handbook for value chain research. Report prepared for
IDRC. Kelleher, G. ed. (1999). Guidelines for marine protected areas. IUCN. Kelly, D. (2005). Power and participation: participatory resource management in south west
Queesland, PhD Thesis, University of Queensland. Australia. Kenchington R., Ward Trevor, and Hegerl, E. (2003). The Benefit of Marine Protected Areas,
Commonwealth of Australia. Khan, A. S. (2012). Understanding Global Supply Chains and Seafood Markets for the
Rebuilding Prospects of Northern Gulf Cod Fisheries. Sustainability 4: 2946-2969. Khan, A. S., Neis, B. (2011). The rebuilding imperative in fisheries: Clumsy solutions for a
wicked problem? Progress in Oceanography. 87 (1-4):347-356. Kinch, J., Mesia, P., Kere, N., Manioli, J., Bulehite, K. (2006). Socioeconomic baseline study:
Eastern Marovo Lagoon, Solomon Islands. IWP-Pacific Technical Report (International Waters Project) No. 35

References _____________________________________________________________________________
389
King, M. (1995). Fisheries biology, assessment and management. Fishing new books. KKP/ Kementrian Kelautan dan Perikanan (2011). Salurkan Paket Bantuan Langsung ke
Masyarakat melalui Pengembangan Usaha Mina Pedesaan.(PUMP) Thursday, 10 March 2011 available at www.perikanan-budidaya.kkp.go.id. Sighted on 21 March 2011
KKP (2010). Menuju Produsen Rumput Laut Terbesar di Dunia. Info Media 7 August 2010.
Available at http://www.kkp.go.id/index.php/arsip/c/3180/Menuju-Produsen-Rumput-Laut-Terbesar-di-Dunia/ Sighted on 20 October 2011
KKP/ Kementrian Kelautan dan Perikanan (2009). Kelautan dan Perikanan dalam Angka. KKP KKP/ Kementrian Kelautan dan Perikanan (2012). Statistik Kelautan dan Perikanan 2005-2008.
Available at http://www.kkp.go.id/upload/jica/web01/DATA%20BASE/data%20html/6.5.HTML
KKP/ Kementrian Kelautan dan Perikanan (2008). Sejarah KKP. 19 May 2008. Available at
http://www.kkp.go.id/index.php/arsip/c/5111/Sejarah-KKP/?category_id=63 Accessed on 28 May 2012.
Klaer, N.L. and Smith, D.C. (2012). Determining primary and companion species in a multi-
species fishery: Implications for TAC setting. Marine Policy 36: 606–612. Klamer, M., Ger, R., van Staden M. (2008). East Nusantara as a linguistic area. In Muysken, P
(ed), From linguistic areas to areal linguistic, John Benjamins Publishing Company. Amsterdam. The Netherlands.
Klein, C.J., Chan, A., Kircher, L., Cundiff, A.J., Gardner, N., Hrovat, Y., Svholtz, A., Kendall,
B.E., and Airame, S. (2008). Striking a balance between biodiversity conservation and socioeconomic viability in the design of marine protected areas, Conservation Biology.
Koeshendrajana, S., Hartono, T.H. (2006). Indonesian live reef fish industry: status, problems
and possible future direction. In Johnston, B., Yeeting, B. Economics and marketing of the live reef fish trade in Asia–Pacific. ACIAR Working Paper No. 60. Australian Centre for International Agricultural Research, Canberra. Australia.
Kothari, A. (2008). Protected areas and people: the future of the past. Parks. 17 (2) Durban+5 KPMG. (2004). Seafood industry value chain analysis: cod, haddock and nephrops. KPMG
Centre for Aquaculture & Fisheries. Krishna, A. (2004). Escaping Poverty and Becoming Poor: Who Gains, Who Loses, and Why?
World Development, 32 (1): 121-136 Kronen, M. (2002). Women’s fishing in Tonga: Case studies from Ha’apai and Vava’u islands.
SPC Women in Fisheries Information Bulletin 11 Kumar, S. (2002). Methods for community participation: a complete guide for practitioners,
ITDG publishing, London, UK.

References _____________________________________________________________________________
390
Kumara MP, Jayatissa LP, Krauss KW, Phillips DH, Huxham M. (2010). High mangrove density enhances surface accretion, surface elevation change, and tree survival in coastal areas susceptible to sea-level rise. Oecologia. 164 (2):545-553.
Kusnadi, M. A. (2003). Akar Kemiskinan Nelayan, Ikis. Lal, Padma., Lim-Applegate, H., Scoccimarro, M. (2003). The adaptive decision making process
as a tool for integrated natural resources management: focus, attitudes, and approach. In Campbell, B.M, and Sayer, J.A., Integrated natural resources management: linking productivity, the environment and development, CABI publishing, 65-86.
Largo, D.B, Fukami, K., Nishijima, T., Ohno, M. (1995). Laboratory-induced development of
the ice-ice disease of the farmed red algae Kappaphycus alvarezii and Eucheuma denticulatum (Solieriaceae, Gigartinales, Rhodophyta). Journal of Applied Phycology 7: 539-543.
Leisher, C., van Beukering, P., Scherl, L.M. (2007). Nature’s Investment Bank: How marine
protected areas contribute to poverty reduction. Department of the Environment and Water Resources-Australian Government.
Lester, S. E., and Ruttenberg, B.I. (2005). The relationship between pelagic larval duration and
range size in tropical reef fishes: a synthetic analysis. Proceedings of the Royal Society B 272:585–591.
Leverington, F., Hockings, M., Costa, K.L. (2008). Management effectiveness evaluation in
protected areas: Report for the project ‘Global study into management effectiveness evaluation of protected areas’, The University of Queensland, Gatton, IUCN WCPA, TNC, WWF-Australia.
Lewis, R.R. (1982). Mangrove Forest. In Lewis, R.R (ed). Creation and Restoration of coastal
plant communities. CRC Press. Boca Raton. Florida. Liamputtong, P. (2009). Qualitative research methods. 3rd editions. Oxford University Press.
Melbourne. Australia. Liese, C. (2003). Renewable resource exploitation in a developing country: motives, markets and
migration in a coral reef fishery. PhD thesis. Department of Environment.Duke University.
Lieske, E., Myers, R. (2002). Coral reef fishes. Revised edition. Princeton University Press. New
Jersey. Lockwood, M. (2006). Global protected area framework. In Lockwood, M., Worboys, G.L. &
Kothari, A. (eds.). Managing protected areas. A global guide. (pp. 73-100). Sterling, VA.: Earthscan.
Loc, V.T.T., Bush, S.R., Sinh, Khiem, N,T. (2010). High and low value fish chains in the Mekong Delta: Challenges for livelihoods and governance. Environment Development Sustainable 12:889–908.

References _____________________________________________________________________________
391
Lotze, H.K., Lenihan, H.S., Bourque, B.J., Bradbury, R.H., Cooke, R.G., Kay, M.C., Kidwell, S.M., Kirby, M.X., Peterson, C.H., Jackson, J.B.C. (2006). Depletion, degradation, and recovery potential of estuaries and coastal zones. Science 312, 1806 -1809.
Lowe C. (2004). Who is blame? Logics responsible in the live reef food fish trade in Sulawesi,
Indonesia. SPC Live Reef Fish Information Bulletin No. 10. Lund, J.F., Larsen, H.O., Chhetri, B.B.K., Rayamajhi, S., Nielsen, J.O., Olsen, S.S.,
Uberhuaga, P., Puri, L., Córdova, J.P.P. (2008). When theory meets reality – how to do forest income surveys in practice. Forest & Landscape Working Papers. 29. 48 pp. Forest & Landscape Denmark, Hørsholm.
Lunn KE, Dearden P. (2006b). Fisher’s needs in marine protected area zoning. Coastal
Management 34 (2):183–198. MacKnight, C.C. (1976). The voyage to Marege: Macassan trepangers in northern Australia.
Melbourne University Press. 175. Maksum, M.A. (2006). Analyses of Economic Benefits of Marine Protected Area to fisheries in
Karimunjawa (in Indonesia). Master Thesis. Graduate Program of Rural Planning and Development. Bogor Agricultural University.
Maloney, J. (1994). Marovo Lagoon, SI: Sustainable Human / Land Relationship. Manehat, O. (2012). Gunung Sirung di Alor Meletus. Tribun news Minggu, 13 Mei 2012.
Available at http://www.tribunnews.com/2012/05/13/gunung-sirung-di-alor-meletus accessed 6 August 2012
Manez, K. S., Ferse, S.C.A. (2010). The History of Makassan Sea cucumber Fishing and Trade.
PLoS ONE 5(6). Mapleston, A., Welch, D., Begg, G.A., McLennan, M., Mayer, D., I. (2008). Effect of changes in
hook pattern and size on catch rate, hooking location, injury and bleeding for a number of tropical reef fish species. Fisheries Research 91: 203–211
Marine Parks Authority New South Wales (2008). A review of benefits of marine protected areas
and related zoning considerations. Marine Parks Authority New South Wales. Available at http://www.mpa.nsw.gov.au/pdf/A-review-of-benefits-MPAs.pdf
Marshall, E., Rushton, J., Schreckenberg, K., Arancibia, E., Edouard, F.,and Newton, A. (2006).
Practical Tools for Researching Successful NTFP Commercialization: A Methods Manual. NTFP Commercialisation Research Method. DFID, UK
Marshall, E., Schreckenberg, K., Newton, A.C. (2006). Commercialization of non-timber forest
products Factors influencing success Lessons learned from Mexico and Bolivia and policy implications for decision-makers.
Marschke, M.J., Berkes, F. (2006). Research Exploring Strategies that Build Livelihood
Resilience: a Case from Cambodia. Ecology and Society, 11(1).

References _____________________________________________________________________________
392
Marschke, M.J. (2005). Livelihood in context: learning with Cambodian fishers. Dissertation. University of Manitoba, Winnipeg, Manitoba,Canada.
Marine Parks Authority New South Wales (2008). A review of benefits of marine protected areas
and related zoning considerations. Marine Parks Authority New South Wales. Available at http://www.mpa.nsw.gov.au/pdf/A-review-of-benefits-MPAs.pdf
Martoyo, J., Aji, N., Winanto, T. (2005). Budi Daya trepang. Penebar Swadaya. Mascia, M.B., Claus, A.C., Naidoo, R. (2010). Impacts of Marine Protected Areas on Fishing
Communities, Conservation Biology, 24, 5. Mascia, M.B. and Claus, C. A. (2008). A property rights approach to understanding human
displacement from protected areas: the case of marine protected areas. Conservation Biology 23(1):16-23.
Mascia, M.B. (2003). The Human Dimension of Coral Reef Marine Protected Areas: Recent
Social Science Research and Its Policy Implications. Conservation Biology, 17 (2): 630–632.
Mathews, E., Bechtel, J., Britton, E., Morrison, K., McClenned, C. (2012). A Gender Perspective
on Securing Livelihoods and Nutrition in Fish-dependent Coastal Communities. Report to The Rockefeller Foundation from Wildlife Conservation Society, Bronx, NY.
McCay, B.J. (1995). Social and ecological implications of ITQs: an overview. Ocean & Coastal
Management, 28 (1-3): 3-22. McClanahan, T.R. (2011). Human and coral reef use interactions: From impacts to solutions?
Journal of Experimental Marine Biology and Ecology 408: 3–10. McClanahan, T.R., Marnane, M.J., Cinner, J.E. Kiene, W.E. (2006). A Comparison of Marine
Protected Areas and Alternative Approaches to Coral-Reef Management. Current Biology.16: 1408–1413.
McClanahan, T.R., Davies J, Maina J. (2005). Factors influencing resource users and managers’
perceptions towards marine protected area management in Kenya. Environment Conservation. 32:42–49
McClanahan, T.R., Mangi, S. (2000). Spillover of exploidable fishes from a marine park and its
effect on the adjacent fishery. Ecological Applications. 10: 1792-805 McCluskey, S.M., Lewison, R.L. (2008). Quantifying fishing effort: a synthesis of current
methods and their applications Quantifying fishing effort: a synthesis of current methods and their applications. Fish and Fisheries. 9: 188-200
McCrea-Strub, A., Zeller, D., Sumaila, U.R., Nelson, J., Balmford, A., Pauly, D. (2011).
Understanding the cost of establishing marine protected areas. Marine Policy. 35: 1–9 McFadden, J.E., Hiller, T.L., Tyre, A.J. (2011). Evaluating the efficacy of adaptive management
approaches: Is there a formula for success? Journal of Environmental Management. 92: 1354-1359

References _____________________________________________________________________________
393
McGoodwin, J.R. (2001). Understanding the cultures of fishing communities: a key to fisheries
management and food security. FAO Fisheries Technical Paper 401. FAO, Rome. McGoodwin, J.R. (1990). Crisis in the World’s Fisheries: People, Problems, and Policies.
Stanford: Stanford University Press. p235. McGrath, K. (2004). The feasibility of using zoning to reduce conflicts in the exclusive
economic zone. Buffalo Environmental Journal. 11: 183-220. McKenzie, L.J., M.A. Finkbeiner, and H. Kirkman. (2001). Methods for Mapping Seagrass
Distribution. Global Seagrass Research Methods. Elsevier Science B.V. Amsterdam. p473.
McLeman, R. and Smit, B. (2006). Migration as an Adaptation to Climate Change. Climate
Change 76 (1-2): 31-53. McMillan, D., George, D.M.C. (1986). Sense of Community: A Definition and Theory, Journal
of Community Psychology, 14: 6-23. McShane, T.O., Hirsch, P.D., Trung, T.C., Sngorwa, A.N., Kinzig, A., Monteferri, B.,
Mutekanga, D., Thang, H.V., Dammert, J.L., Pulgar-Vidal, M., Welch-Devine, M., Brosius, J.P., Coppolillo, P., O’Connor, S. (2011). Hard choices: Making trade-offs between biodiversity conservation and human well-being. Biological Conservation 144: 966–972.
McVea, J.F. and Freeman R.E. (2005). A Names-and-Faces Approach to Stakeholder
Management: How Focusing on Stakeholders as Individuals Can Bring Ethics and Entrepreneurial Strategy Together, Journal of Management Inquiry, 14 (1): 57-69.
McWilliam, A. (2011). Marginal governance in the time of pemekaran: Case studies from
Sulawesi and West Papua. Asian Journal of Social Science 39: 150-170 Midgley, J. (2008). Microenterprise, global poverty and social development. International Social
Work 51(4): 467–479 Mikalsen, K.H., Jentoft, S. (2001), From user groups to stakeholders? The public interest in
fisheries management. Marine Policy, 25: 281-292. Miles, M.B., Huberman, A.M. (1994). Qualitative data analysis. Sage Publications. California. Miles, H.D. Kokpol, U., Chittawong, V., Tip-Pyang, S., Tunsuwan, K., Nguyen, C. (1990).
Mangrove Forests: The Importance of Conservation as a Bioresource for Ecosystem Diversity and Utilization as a Source of Chemical Constituents with Potential Medicinal and Agricultural Value. IUPAC. Available at http://old.iupac.org/symposia/proceedings/phuket97/miles.pdf
Millennium Ecosystem Assessment/MEA (2005). Ecosystems and Human Well-being:
Biodiversity Synthesis. World Resources Institute, Washington, DC.

References _____________________________________________________________________________
394
Mills, D.J., Nguyen D.Q.D., Juinio-Meñez, M.A., Raison, C.M., and Zarate, J.M. (2011). Overview of sea cucumber aquaculture and sea-ranching research in the South-East Asian region. Presented at ACIAR-SPC Asia Pacific Tropical Sea cucumber Aquaculture symposium. 15-17 February 2011. New Caledonia. Available at www.worldfishcenter.org/resource_centre/WF_3033.pdf
Minnegal, M. and Dwyer, P. (2008). Mixed messages: Buying back Australia’s fishing industry.
Marine Policy 32: 1063– 1071 Mitchell, J., Sheperd, A., Keane, J. (2011). An introduction. In Mitchell, J., Coles, C (eds).
Markets and Rural Poverty: Upgrading in Value Chains. Earthscan. London. 1-15. Mitchell, J., and Shepherd, A. (2006). Productive Strategies for Poor Rural Households to
Participate Successfully in Global Economic Process, IDRC, ODI, UK. Mitchell, R., Agle, B.R., Wood, D.J. (1997). Toward a theory of stakeholder identification and
salience: defining the principle of who and what really counts, Academic of Management Review, 22 (4): 853-886.
Ministry of Marine Affairs and Fisheries/MMAF (2012). Technical guidelines for evaluating the
management effectiveness of aquatic, coasts and small islands conservation areas (E-KKP3K). MMAF.
MMAF/ Ministry of Marine Affairs and Fisheries/MMAF (2009). Data Series 1982-
2009.MMAF Moeliono, M. (2008). Hands off, hands on: communities and the management of national parks
in Indonesia. In Sodhi, N.S., Acciaoli, G., Erb, M., Tan, A.K. (eds). Biodiversity and human livelihoods in protected areas: case studies from the Malay Archipelago. Cambridge University Press.
Moeliono, I., Maing, B.P. (2004). The Riung Conservation Area in Flores, Indonesia: Lessons
from Failure in Improving Governance, Managing Conflicts, and Inducing Institutional Reform. Paper presented at the 10th IASCP Biennial Conference in Oaxaca, Mexico, 9-16 August 2004.
Moisander, J. and Valtonen, A. (2006). Qualitative marketing research: A cultural approach.
London, Sage Publications. Momtaz, S., and Gladstone, W. (2008). Ban on commercial fishing in the estuarine waters of
New South Wales Australia: Community consultation and social impacts, Environmental Impact Assessment Review, 28: 214-225.
Morgan, G.R. (1995). Optimal fisheries quota allocation under a transferable quota (TQ)
management system. Marine Policy, 19 (5): 379-390. Moser , C., Norton, A. with Conway, T., Ferguson, C., Vizard, P. (2001). To Claim our Rights:
livelihood security, human rights and sustainable development.

References _____________________________________________________________________________
395
Moser , C. (1996). Confronting crisis: A comparative study of household responses to poverty and vulnerability in four urban communities. ESD Monographs Series No. 8. The World Bank. Washington, DC.
Moyle, P.B., and Cech, J.J. (1996). Fishes: An introduction to Ichthyology. 3rd edition. Prentice
Hall. New Jersey. Muallil, R.N., Geronimo, R.C., Cleland, D., Cabral, R.B., Doctor, M.V., Cruz-Trinidad, A.,
Alino, P.M. (2011). Willingness to exit the artisanal fishery as a response to scenarios of declining catch or increasing monetary incentives. Fisheries Research. 111: 74– 81
Mukerjea, J. (2009). Market research on value added seaweed products in Southeast Sulawesi,
Indonesia. A report to Bina Bahari Seaweed Cooperative. Myers, R., and Worm, B. (2003). Rapid worldwide depletion of predatory fish communities.
Nature, vol. 423, pp. 280-283. Making Market Systems Work Better for the Poor/M4P (2005). An introduction to the concept.
Discussion paper prepared for the ADB-DFID ‘learning event’ ADB Headquarters, Manila. Available at http://www.urbanlandmark.org.za/downloads/DFID_M4P_An_introduction_to_the_concept.pdf
Making Market Systems Work Better for the Poor/M4P (2008). Making Value Chains Work
Better for the Poor: A Toolbook for Practitioners of Value Chain Analysis. DFID MMAF/Ministry of Marine Affairs and Fisheries (2010). Marine and fisheries statistic 2005-2008.
MMAF. Available at: http://www.kkp.go.id/upload/jica/web01/DATA%20BASE/data%20html/6.5.HTML
Nagelkerken, I., van der Velde, G. (2004). Relative importance of interlinked mangroves and
seagrass beds as feeding habitats for juvenile reef fish on a Caribbean island. Marine Ecology Progress series. 274: 153–159.
Nagelkerken, I., Roberts, C. M., van der Velde, G., Dorenbosch, M., van Riel, M. C., Cocheret
de la Morinière, E., Nienhuis, P.H. (2002). How important are mangroves and seagrass beds for coral-reef fish? The nursery hypothesis tested on an island scale. Marine Ecology Progress Series. 244 (29): 299–305.
Nagelkerken, I., van der Velde, G., Gorissen, M. W., Meijer, G. J. , Van't Hof, T., and den
Hartog, C. (2000). Importance of Mangroves, Seagrass Beds and the Shallow Coral Reef as a Nursery for Important Coral Reef Fishes, Using a Visual Census Technique. Estuarine, Coastal and Shelf Sciences. 51 (1): 31-44.
Nam, S., Bunthang, T. (2011). Fisheries resources in Cambodia: Implications for food security,
human nutrition and conservation. Narayan, D. (2000). Voices of the Poor. Can anyone Hear Us?, Oxford University Press, Inc. Neewing, H., Eagle. C.M., Puri, R.K., and Watson, C.W. (2011). Conducting research in
conservation: A social science perspective. Routledge. New York.

References _____________________________________________________________________________
396
Neilson, J. (2007). Institutions, the governance of quality and on-farm value retention for
Indonesian specialty coffee, Singapore Journal of Tropical Geography 28: 188–204. Neish, I and Julianto, B. (2010). Prospects for Seaweed Product Development in Global Markets
With focus on Indonesia. Presented at the Seaweed International Business Forum and Exhibition, SEABFEX lll Sheraton Hotel, Surabaya, 14-17 July 2010.
Nichols, L. (2002). Participatory program planning; including program participants and
evaluators, evaluation and program planning, 25: 1-14. Nikijuluw, V.P.H (2010). “Minapolitan”A cluster approach for seaweed industry. Presented at
the Seaweed International Business Forum and Exhibition (SEABEX III) Surabaya 15 Juli 2010.
Ninef, Jotham S. R., Sunardi, V., Angwarmasse, I., Foenay, M., Tallo, I., Lawole, I., Langga, A.,
Blegur, G.E. (2005). Profil Pulau-pulau kecil di Kabupaten Alor, Dinas Perikanan and Kelautan provinsi NTT.
Noss, R. F., O'Connell, M.A., Murphy, D.D. (1997). The science of conservation planning:
Habitat conservation under the endangered species act. Washington DC, Island Press. Obiero, E., Nenobesi, D. (2007). Market Assessment on Fisheries and Aquaculture in Nusa
Tenggara Timur. VSO Indonesia. Olson, J. (2011). Understanding and contextualizing social impacts from the privatization of
fisheries: An overview. Ocean & Coastal Management 54: 353-363. Ong, L. (2007). The ecological importance of parrotfish as bioeroders and sediment producers
and their conservation within small marine protected areas. PhD Thesis. University of Hawai'i at Manoa. Hawaii. United States.
Onyango, P. O. (2011). Occupation of Last Resort? Small-Scale Fishing in Lake Victoria,
Tanzania. In Jentoft, S., Eide, A (eds). Poverty Mosaics: Realities and Prospects in Small-Scale Fisheries. Springer.
Oracion, E. G., Miller., M. L., Christie, P. (2005). Marine protected areas for whom? Fisheries,
tourism, and solidarity in a Philippine community, Ocean and Coastal Management, 48: 393-410.
Orams. M. (1999). Marine tourism: development, impacts and management. Routledge. London. Osseweijer, M. (2001). Taken at the flood: Marine resource use and management in the Aru
Islands (Maluku, Eastern Indonesia). PhD Thesis. University of Leiden. Leiden. Netherlands.
Ostrom, E. (2011). Background on the Institutional Analysis and Development Framework.
Policy Studies Journal 39(1):7–27. Ostrom, E., Gardner, R., Walker (1994). Rules, Games and Common Pool Resources. The
University of Michigan Press.

References _____________________________________________________________________________
397
Ostrom, E. (1990). Governing the commons: The evolution of institution for collective action.
Cambridge, Cambridge University Press. Parks, J. E., Salafsky, N. (2001). Fish For the Future? A Collaborative Test of Locally-Managed
Marine Areas as a Biodiversity Conservation and Fisheries Management Tool in the Indo-Pacific Region: Report on the Initiation of a Learning Portfolio. The World Resources Institute. Washington DC, USA.
Pawson, R. (2007). Causality for Beginners. NCRM Research Methods Festival 2008, Leeds
University. http://eprints.ncrm.ac.uk/245/. Pedju, M., Purwanto, Santiaji, V., Hanan, S., Fudge, J., Barmawi, M. (2004). A Report on a
baseline survey in Wakatobi Marine National Park to assess resource status, use and perception, WWF-Indonesia and The Nature Conservancy.
Pelras, C. (1996). The Bugis. John Wiley and Sons Ltd. Peters, H., Hawkins, J.P. (2009). Access to marine parks: A comparative study in willingness to
pay. Ocean & Coastal Management 52(3-4): 219-228. Petersen, E., Muldoon, G., Johnston, W. (2007). Market analysis of the live reef food fish trade.
Network of Aquaculture Centres in Asia-Pacific. Available at http://www.enaca.org/modules/news/print.php?storyid=913
Peterson, A.M., Stead, S.M. (2011). Rule breaking and livelihood options in marine protected
areas. Environmental Conservation: 1-11. Peterson, R.B., Russell, D., West, P., Brosius, J.P. (2010). Seeing (and Doing) Conservation
Through Cultural Lenses. Environmental Management. 45:5–18. Pet-Soede, L., and Erdmann, M. (2003). Rapid Ecological Assessment Wakatobi National Park,
WWF-Indonesia and The Nature Conservancy. Pet-Soede, L., Erdmann M.V. (1998). Blast fishing in southwest Sulawesi, Indonesia. NAGA
21(2): 4-9. Pet-Soede, L. (2002). The Solor and Alor islands Expedition Results Data collected during 2
reconnaissance trips: 9-12 September, 2001 and 7-19 May, 2002, WWF Indonesia-TNC. Pet-Soede, L., & Widyastuti, P. (2001). Kegiatan Perikanan Pantai di Wilayah Bali Barat, Draft
satu laporan fisheries campaign WWF Wallacea, WWF Wallacea, Bali. Phillips, R. R. Freeman, E., and Wicks, A.C. (2003). What stakeholder theory is not. Business
Ethics Quarterly, Volume 13 (4): 479-502. Pita, C., Pierce, G.J., Theodossiou, I., Macpherson, K. (2011). An overview of commercial
fishers’ attitudes towards marine protected areas. Hydrobiologia. 670:289–306. Pitchford, J.W., Codling, E.A., Psarraa, D. (2007). Uncertainty and sustainability in fisheries and
the benefit of marine protected areas. Ecological Modelling. 207: 286–292.

References _____________________________________________________________________________
398
Poelinggomang, E.L. (2002). Makassar abad XIX: Studi tentang kebijakan perdagangan
maritime. Kepustakaan popular Gramedia. Jakarta. pp 40 and 44. Pouliot, M., Ouedraogo, B., Simonsen, H. L., and Smith-Hall, C. 2010. Household-level studies
of forests and poverty in Burkina Faso: Contextual information, methods and preliminary results. Forest & Landscape Working Papers. 47. Forest & Landscape Denmark.
Polidoro, B.A., Carpenter, K.E., Collins, L., Duke, N.C., Ellison, A.M. (2010). The Loss of
Species: Mangrove Extinction Risk and Geographic Areas of Global Concern. PLoS ONE 5(4)
Pollnac, R.B., Pomeroy, R.S. (2005). Factors influencing the sustainability of integrated coastal
management projects in the Philippines and Indonesia. Ocean & Coastal Management 48: 233–251
Pollnac, R.B., Pomeroy, R.S., Harkes I.H.T. (2001). Fishery policy and job satisfaction in three
southeast Asian fisheries. Ocean Coastal Management. 44: 531-544. Pollnac, R.B., and Crawford, B.R. (2000). Assessing behavioural aspects of coastal resource
use. Proyek Pesisir Publications Special report. Coastal Resources Centre Coastal Management Report #2226. Coastal Resources centre, University of Rhode Island, Narragansett, Rhode Island.
Pomeroy, R., and Douvere, F. (2008). The engagement of stakeholders in the marine spatial
planning process, Marine Policy, 32: 816– 822. Pomeroy, R., Mascia, M.B., Pollnac, R.B. (2007). Marine Protected areas: social dimension.
Background paper 3. pp 149-182. In FAO. Report and documentation of the Expert workshop on marine protected areas and fisheries management . FAO Fisheries Report No 825. FAO.
Pomeroy, R., Parks, J., Pollnac, R., Campson, T., Genio, E., Marlessy, C.,Holle, E., Pido, M.,
Nissapa, A., Boromthanarat, S., Nguyen Thu Hue (2007). Fish wars: Conflict and collaboration in fisheries management in Southeast Asia, Marine Policy, 31:645–656
Pomeroy, R., and Rivera-Guieb, R. (2005). Fishery co-management: A practical Handbook,
CABI publishing, IDRC, Canada. Pomeroy, R., Parks, J.E., Watson, L.M. (2004). How is your MPA doing? A guidebook of natural
and social indicatorsfor evaluation MPA management effectiveness, IUCN. Pomeroy, R., and Viswanathan, K.K. (2003). Experiences with Fisheries Co-management in
Southeast Asia and Bangladesh. In D.C. Wilson, J.R. Nielsen and P. Degnbol (eds.) The Fisheries Co-management Experience, Accomplishments , Challenges and Prospects. Dordrecht: Kluwer Academic Publishers. p. 99-117.
Poncomulyo, T., Maryani, H., Kristiani, L. (2006). Budidaya dan pengolahan rumput laut. PT
AgroMedia Pustaka. Jakarta. p 67.
References _____________________________________________________________________________
399
Poole, N., Buckley, C.P. (2006). Innovation challenges, constraints and opportunities for the rural poor. International Fund for Agricultural Development.
Porter, M. (1990). The competitive advantage of nation, London, Macmillan. Prescott, J., Vogel, C., Pollock, K., Hyson, S., Oktaviani, D., Panggabean, A.S. (2013).
Estimating sea cucumber abundance and exploitation rates using removal methods. Marine and Freshwater Research 64: 599–608.
Pretty , J., and Ward, H. (2001). Social Capital and the Environment. World Development 29(2):
209 - 227. Pretty, J.N., Gulit, I., Scoones, I., Thompson. J. (1995). Metode Pembelajaran dan Aksi
Partisipatif: Panduan untuk Pelatih, Participatory Methodology, IIED, London, UK. Prihatini, A. Anggoro, S., Asriyanto. (2007). Analisis tampilan biologis Ikan Layang
(Decapterus sp) hasil tangkapan purse seine yang didaratkan di PPN Pekalongan. Jurnal Pasir Laut, 63 (1): 61-75.
Pryck, J.D. (2013). Good practice policies to eliminate gender inequalities in fish value chains.
Food and Agriculture Organization of the United Nations. Rome. Dalla Billa Sejati (2004). Penyusunan rencana tata ruang dalam rangka penataan konservasi
laut di Selat Pantar, Nusa Tenggara Timur. Laporan Akhir. PT Dalla Billa Sejati- Direktorat Tata Tuang Pesisir dan Pulau-Pulau kecil Departemen Kelautan dan Perikanan.
Purcell, S.W., Cheng, Y.W. (2010). Experimental restocking and seasonal visibility of a coral
reef gastropod assessed by temporal modeling. Aquatic biology 9: 227–238. Purvis, J. (2002). Fish and livelihoods: Fisheries on the eastern floodplains, Caprivi. Directorate
of Environmental Affairs, Ministry of Environment and Tourism, Namibia. Pullin, R.S.V., Sumaila, U.R. (2005). Aquaculture. In Kooiman, J., Bavinck, M., Jentoft, S.,
Pullin, R. (eds). Fish for life: Interactive governance for fisheries. MARE Publications Series No. 3. Amsterdam University Press. Amsterdam.
Purwati, P. (1996). Trochus: Status, Hatchery Practice and Nutrition. In proceedings of a
workshop held at Northern Territory University, 6-7 June 1996. Chan Lee and Lynch, P.W. (eds)
Putnam, R.D. (1993). The Prosperous Community: Social Capital and Public Life. The
American Prospect No. 13. Putnam, R.D. (2000). Bowling Alone: The Collapse and Revival of American Community. Simon
& Schuster. New York. Putra, H. S. A. (1993). The politics of agrarian change and clientelism in Indonesia: Bantaeng,
South Sulawesi. PhD Thesis. New York, Columbia University.

References _____________________________________________________________________________
400
Rakodi, C. (1999). A Capital Assets Framework for Analysing Household Livelihood Strategies: Implications for Policy. Development Policy Review 17: 315–342.
Ramachandran, S. (2009). The poor and the private sector: Public private community
partnership: Case studies from the field. ACCESS Development Services. New Delhi. Rao, V. (2001). Celebrations as social investments: Festival expenditures, unit price variation
and social status in rural India. Journal of Development Studies 38(1): 71-97. Reed, M.S. (2008). Stakeholder participation for environmental management: A literature review,
Biological Conservation, 141: 2417- 2431. Reed, M.S., Graves, A., Dandy, N., Posthumus, H., Hubabeck, K., Morries, J., Prell, C., Quinn,
C.H., Stringer, L. (2009). Who’s in and why? A typologu of stakeholder analysis methods for natural resource management, Journal of Environmental Management, 90: 1933-1949.
Rees, S.E., Rodwell, L.D., Searle, S., Bell, A. (2013). Identifying the issues and options for
managing the social impacts of marine protected areas on small fishing community. Fisheries Research 146:51-58.
Rees, S. E., Attrill, M.J., Austen, M.C., Mangi, S.C., Rodwell, L.D. (2013a). A thematic cost-
benefit analysis of a marine protected area. Journal of Environmental Management 114(0): 476-485.
Retraubun, A. (2010). Policy for supporting seaweed industry. Presented at the Seaweed
International Business Forum and Exhibition (SEABEX III) Surabaya 15 Juli 2010. Ribot, J.C. (2005). Policy and Distributional Equity in Natural Resource Commodity Markets:
Commodity-Chain Analysis as a Policy Tool: A Research Concept Paper. World Resources Institute. Washington, D.C.
Rice, J. (2009). Preliminary report on the management implications and effectiveness of
potential bylaws in the Kaledupa fisheries, Wakatobi National park, Operation Wallacea.
Riisgaard, L., Anna Maria Escobar Fibla, A. M. E., Ponte, S (2010). Gender and Value Chain
Development. The Danish Institute for International Studies. Denmark. Roberts, C.M., Bohnsack, J.A., Gell, F., Hawkins, J.P., Goodridge, R. (2001). Effects of marine
reserves on adjacent fisheries. Science 294, 1920–1923. Roberts, C.M., Hawkins, J. P., Gell, F. R. (2005). The role of marine reserves in achieving
sustainable fisheries. Philosophical transactions of the royal biology society. 360: 123-132.
Rockefeller Foundation (2013). Securing the livelihoods and nutritional needs of fish-dependent
communities. Rockefeller Foundation

References _____________________________________________________________________________
401
Rockloff, S.F. (2003). Organising for sustainable natural resources management: representation, leadership and partnership at four spatial scales, PhD thesis, Murdoch University, Perth. Australia.
Rodemeir, S. (2010). Islam in the Protestant environment of the Alor and Pantar Islands.
Indonesia and the Malay world. 38 (110): 27-42 Rodima-Taylor, D., Olwig, M.F., Chhetri, N. (2012). Adaptation as innovation, innovation as
adaptation: An institutional approach to climate change. Applied Geography 33: 107-111. Rodríguez-Izquierdo E., Gavin, M.C., Macedo-Bravo, M.O. (2010). Barriers and triggers to
community participation across different stages of conservation management. Environmental Conservation 37 (3): 239–249.
Roe, D. (2008). The origins and evolution of the conservation poverty debate: a review of key
literature, events and policy processes. Fauna & Flora International, Oryx, 42(4), 491–503
Ruddle, K. (2008). Reconsidering the Contribution of Fisheries to Society and Millennium
Development Goals. In K. Tsukamoto, T. Kawamura, T. Takeuchi, T. D. Beard, Jr. and M. J. Kaiser (eds). Fisheries for Global Welfare and Environment, 5th World Fisheries Congress 2008, pp. 399–411.
Rudianto, E. (ed) (2012). Buku saku Coral Triangle Initiative on coral reefs, fisheries and food
security. CTI-CFF Regional Secretariat Interim. Rudiyanto, W., Santoso, P. (2008). Memilih alternative pengelolaan TN Wakatobi yang efektif.
Available at www.phka.go.id Rudiyanto, A. (2002). A critical appraisal of marine and coastal policy in Indonesia including
comparative issues and lessons learnt from Australia. PhD thesis. Department of History and Politics. Faculty of Arts. University of Wollonggong. Australia.
Russ, G.R., Alcala, A.C. (2003). Marine reserves: rates and patterns of recovery and decline of
predatory fish: 1983–2000. Ecological Applications 13, 1553–1565. Ryan, R. M., and Deci, Edward L. (2001). On Happiness and Human Potentials: A Review of
Research on Hedonic and Eudaimonic Well-Being. Annu. Rev. Psychol 52: 141-166. Rydin, Y., and Holman, N. (2004). Re-evaluating the Contribution of Social Capital in
Achieving Sustainable Development. Local Environment 9(2): 117 - 133. Ryff, C. D. (1989). Happiness Is Everything, or Is It? Explorations on the Meaning of
Psychological Well-Being, Journal of Personality and Social Psychology 57(6): 1069-1081
Sabatini, F. (2009). Social capital as social networks: A new framework for measurement and an
empirical analysis of its determinants and consequences. Journal of Socio-Economics 38(3): 429-442.

References _____________________________________________________________________________
402
Sachs, J. D. (2005). The end of poverty: Economic possibilities for our time. New York, The Penguin press.
Sadovy, Y. J. and Vincent, A. C. J. (2002). Ecological Issues and the Trades in Live Reef Fishes.
Chapter 18. In: Coral Reef Fishes: Dynamics and Diversity in a Complex Ecosystem, Peter F. Sale, ed., Academic Press, San Diego, pp. 391-420.
Salagrama, V. (2006). Trends in poverty and livelihoods in coastal fishing communities of Orissa
State, India. FAO Fisheries Technical 490. Salayo, N.D., Perez, M.L., Garces, L.R., Pido, M.D. (2012). Mariculture development and
livelihood diversification in the Philippines. Marine Policy 36: 867–881 Salagrama, V., Salka, A. (2010). A study of the fisheries post harvest and market supply chains
in Nias Island, North Sumatra Province, Indonesia. FAO Nias Information Bulletin 1. Food and Agriculture Organization of the United Nations.
Salm, R., Clark, J.V., Siirila, E. (2002) Marine and coastal protected areas: A guide for planners
and managers. 3ed editions. IUCN. Washington DC.WSSD (2002). The Plan of Implementation of The World Summit on Sustainable Development (WSSD). 5 September 2002 in http://www.worldsummit2002.org/ accessed on 20 March 2011.
Sanchirico, J. N., Smith, M.D., Lipton, D.W. (2008). An empirical approach to ecosystem-based
fishery management. Ecological Economics 64(3): 586-596. Sanchirico, J. N., Holland, D., Quigley, K., Fina, M. (2006). Catch-quota balancing in
multispecies individual fishing quotas. Marine Policy 30 : 767–785 Savage, S. (2007). The mysterious Mokos of Alor, Bachelor of Arts Thesis, Charles Darwin
University, Darwin. Schalkwyk, J. (2000). Culture: Culture, Gender equity and development Cooperation. Canadian
International Development Agency. CIDA. Scheyvens, R. (2011). Tourism and Poverty. Taylor and Francis. New York. Scholz, A., Bonzon, K., Fujita, R., Benjamin, N., Woodling, N., Black, P., Steinback, C. (2004).
Participatory socioeconomic analysis: drawing on fishermen’s knowledge for marine protected area planning in California. Marine Policy. 28 : 335–349.
Schreckenberg, K. Rushton, J., Te Delve, D. W. (2006). NTFP value chains: What happens
between production and consumption. In Marshall, E., Schreckenberg, K., Newton, A.C. (eds), Commercialisation of NTFP: factors influencing success. UNEP and WCMC.
Schreckenberg, K., Camargo, I., Withnall, K., Corrigan, C., Franks, P., Roe, D., Scherl, L. M.
and Richardson, V. (2010). Social Assessment of Conservation Initiatives: A review of rapid methodologies, Natural Resource Issues No. 22. IIED, London.

References _____________________________________________________________________________
403
Secretariat of the Convention on Biological Diversity (2009). Protected Areas in Today’s World: Their Values and Benefits for the Welfare of the Planet. Montreal, Technical Series no. 36, i-vii + 96 pages.
Secretariat of the Convention on Biological Diversity (2009). Biodiversity, Development and
Poverty Alleviation: Recognizing the Role of Biodiversity for Human Well-being. Montreal, 52 pages
The Secretary of Directorate General of Marine, Coastal and Small Islands Department Marine
Affairs and Fishery (2009). Peranan Taman Nasional Perairan Laut Sawu Terhadap Perikanan Berkelanjutan Berbasis Ekosistem. Presented at National Workshop on Sawu Sea National Park in Jakarta 23 November 2009
Scoones, I. (2009). Livelihoods perspectives and rural development. Journal of Peasant Studies.
36 (1) Scoones, I. (1998). Sustainable Rural Livelihoods: A Framework for analysis. IDS Working
Paper 72. Seach, J. (2010). Sirung Volcano Eruption available at www.volcanolive.com/sirung.html
accessed on May 10th 2010. Sen, A. (1999). Commodities and Capabilities, Oxford University Press. Sen, A. (1984). Resources, Values and Development. Oxford. Blackwell. Sen, S. (2010a). Developing a framework for displaced fishing effort programs in marine
protected areas. Marine Policy 34(6): 1171-1177. Shackleton, S., Shanley, P., Ndoye, O. (2007). Invisible but viable: recognising local markets for
nontimber forest products, International Forestry Review Vol.9(3) Shen, F., Hughey, K.F.D., Simmons, D.G. (2008). Connecting the sustainable livelihoods
approach and tourism: A review of the literature. Journal of Hospitality and Tourism Management.15: 19-31.
Sidlea, R.C., Taylor, D., Lu X.X, Adger, W.N., Lowe, D.J., de Lange, W.P., Newnham,R.M.,
Dodson, J.R. (2004). Interactions of natural hazards and society in Austral-Asia: evidence in past and recent records. Quaternary International 118–119: 181–203.
Sievanen, L. (2008). Social seascapes, political landscapes: Conflict and cooperation within an
Indonsian marine park. Ph.D Thesis. University of Washington. Sievanen, L., Crawford, B., Pollnac, R., Lowe, C. (2005). Weeding through assumptions of
livelihood approaches in ICM: Seaweed farming Philippines and Indonesia. Ocean & Coastal Management. 48: 297–313.
Silvert, W., Moustaka, A. (2011). The impacts over time of marine protected areas: A null
model. Ocean & Coastal Management. 54: 312-317.

References _____________________________________________________________________________
404
Simpson, M. C. (2009). An integrated approach to assess the impacts of tourism on community development and sustainable livelihoods. Community Development Journal 44 (2): 186-208.
Smeeding, T.S., Weinburg, D.H. (2001). Toward a uniform definition of household income.
Review of Income and Wealth. 47 (1): 1-24 Smith, T. F., Alcock, D., Thomsen, D., Chuenpagdee, R. (2006). Improving the Quality of Life
in Coastal Areas and Future Directions for the Asia-Pacific Region. Coastal Management. 34: 235-250.
Smit, B., Wandel, J. (2006). Adaptation, adaptive capacity and vulnerability. Global
Environmental Change 16: 282–292. Singleton, S. (2009). Native People and Planning for Marine Protected Areas: How
“Stakeholder” Processes Fail to Address Conflicts in Complex, Real-World Environments, Coastal Management, 37 (5):421-440.
Singleton, S. (2000). Cooperative of capture? The paradox of Comanagement and community
participation in natural resource management and environmental policy making. IIFET 2000 Proceedings.
Sinha, C. (2005). Effect of mobile telephony on empowering rural communities in developing
countries. International Research Foundation for Development (IRFD). Slater, M.J., Mgaya, Y.D., Mill, A.C., Rushton, S. P., Stead, S.M. (2013). Effects of social and
economic drivers on choosing aquaculture as a coastal livelihood. Ocean and Coastal Management. 72: 22-30
Sodhi, N.S., Acciaoli, G., Erb, M., Tan, A.K. (eds). (2008). Biodiversity and human livelihoods
in protected areas: case studies from the Malay Archipelago. Cambridge University Press.
Solis, M.J.L, Draeger, S., Cruz, T.E.E. (2010). Marine-derived fungi from Kappaphycus
alvarezii and K. Striatum as potential causative agents of ice-ice disease in farmed seaweed. Botanica Marina 53 (6): 587-594.
Sovinsen (2003). Integrated Coastal Zone Management (ICZM): The Allocation of Space in
Norwegian Aquaculture – from local lottery to central planning? Norwegian College of Fishery Science, University of Tromsø, Norway.
Squires, D., Campbell, H., Cunningham, S., Dewees, C., Grafton, R.Q., Herrick, S.F., Kirkley, J.,
Pascoe, S., Salvanes, K., Shallard, B., Turris, B., and Vestergaard, N. (1998). Individual transferable quotas in multispecies fisheries. Marine Policy 22 (2): 135-159.
Srinivasan, T., Watson, R., Sumaila, U.R. (2012). Global fisheries losses at the exclusive
economic zone level, 1950 to present. Marine Policy 36: 544–549. Stacey, N., Karam, J., Meekan, M.G., Pickering, S., Ninef, J. (2012). Prospects for whale shark
conservation in eastern Indonesia through Bajo traditional ecological knowledge and community-based monitoring. Conservation and Society 10, 63-75.

References _____________________________________________________________________________
405
Stacey, N. (2007). Boats to Burn: Bajo fishing activity in the Australian Fishing Zone. Asia
Pacific Environment Monograph 2. The Australian National University Press. Canberra. Australia.
Stacey, N. (1999). Boats to burn: Bajo fishing activity in the Australian fishing zone. PhD Thesis.
Charles Darwin University. Darwin, Australia. Steneck, R.S. (2006). Staying Connected in a Turbulent World. Science. Vol. 311 no. 5760 pp.
480-481. Stern, E., Stame, N., Mayne, J., Forss, K., Davies, R., Befani, B. (2012). Broadening the range
of designs and methods for impact evaluations. Department for International Development. Working Paper 38.
Stevenson, T. C., Tissot, B.N., Walsh, W.J. (2013). Socioeconomic consequences of fishing
displacement from marine protected areas in Hawaii. Biological Conservation 160:50-58. Stokhof, W. A. L. (1979). Preliminary notes on the Alor and Pantar languages (eastern
Indonesia), Canberra, The Australian National University. Syamsudin, F., van Aken, H.M., Kaneko, A. (2010). Annual variation of the southern boundary
current in the Banda Sea. Dynamics of Atmospheres and Oceans 50: 129–139 Subani, W (2002). Jenis-Jenis Ikan laut Ekonomis Penting di Indonesia. Balai Riset Perikanan
Laut (BRPL). Departemen Kelautan dan Perikanan Subedi, B., Dhungana, H., Khadka, D., Gyawali, S. (2007). Local Communities and Natural
Products: A Manual for organizing Natural Resource Management Groups for Resource Management Planning, Enterprise Development and Integration Into Value Chains. A report for the International Resources Group. Asia Network for Sustainable Agriculture and Bio-resources.
Sulaeman, S. (2006). Pengembangan agribuisnis komoditi rumput laut melalui model klaster
bisnis. Infokop No. 28 Tahun XXII. Sumaila, U.R., Alder, J., Keith, H. (2006). Global scope and economics of illegal fishing.
Marine Policy. 30 (6): 696-703 Suprihatin, J. (2002). Fisheries Pattern in National Marine Park Komodo: A Spatial and
Temporal Analysis (in Indonesia). Graduate Program of Coastal and Maine Resources. Bogor Agricultural University.
Swartz, W., Sala, E., Tracey S., Watson, R., Pauly D. (2010). The Spatial Expansion and
Ecological Footprint of Fisheries (1950 to Present). PLoS ONE 5(12): e15143. Sweeney, R.J., Tollison, R.D., Willet, T.D. (1974). Market failure, the common-pool problem,
and ocean resource exploitation. The Journal of Law & Economics. 17: 179-192 Svensson, P., Rodwell, L.D., Attrill, M.J. (2008). Hotel managed marine reserves: A willingness
to pay survey. Ocean and Coatal Management. 51: 854–861

References _____________________________________________________________________________
406
Tanner, K. (2006). The seashell trade of Tanzania: a value chain analysis, in Harvew, W. (ed),
RGS-IBG Annual Conference Report, University of Cambridge. UK Tao, T.C.H., Wall, G., Wismer, S. (2010). Culture and Sustainable Livelihoods. Journal of
Human Ecology, 29(1): 1-21 Teh, L. C. L., Teh, L.S.L., Meitner, M.J. (2012). Preferred Resource Spaces and Fisher
Flexibility: Implications for Spatial Management of Small-Scale Fisheries. Human Ecology. 40:213–226
Teh, L. C. L., Teh, L.S.L., Starkhouse, B., Sumaila, U.R. (2009). An overview of socio-
economic and ecological perspectives of Fiji’s inshore reef fisheries Marine Policy 33: 807–817
Tesfaye, Y., Roos, A., Campbell, B.M., Bohlin, F. (2011). Livelihood strategies and the role of
forest income in participatory-managed forests of Dodola area in the bale highlands, southern Ethiopia. Forest policy and economics. 13: 258-265
Thomas, L and Middleton, J. (2003). Guidelines for Management Planning of Protected Areas.
IUCN Gland, Switzerland and Cambridge, UK. ix + 79pp. Thornburn, C.C. (2000). Changing Customary Marine Resource Management Practice and
Institutions: The Case of Sasi Lola in the Kei Islands, Indonesia. World Development. 28 (8): pp. 1461-1479.
Thiele, M. T., Pollnac, R. B., Christie, P. (2005). Relationships between coastal tourism and
ICM sustainability in the central Visayas region of the Philippines. Ocean and Coastal Management. 48(3-6): 378-392.
TNC/The Nature Conservancy (2008). Final report Sawu Sea Project 2008-2009. Unpublished
report. TNC. TNC/The Nature Conservancy (2012). Sawu Sea Annual Report 2012. Sawu Sea MPA
Development Project. Unpublished report. TNC. Tol, R., van Dijk, K., Acciaioli, G. (eds) (2000). Kuasa dan usaha di masyarakat Sulawesi
Selatan. Translated by Abu, AR.(2009) Toner, A. (2002). Something for everyone? Exploring the foundations of sustainable livelihoods
approaches, Presented at ‘Supporting Livelihoods, Evolving Institutions’ workshop held at Bradford Centre for International Development 29/30th May 2002
Tomascik, T., Mah, A.J., Nontji, A., Moosa, M.K. (1997). The ecology of the Indonesian seas
part 2. Singapore, Dalhousie University. Toropova, C., Meliane, I., Laffoley, D., Matthews, E. and Spalding, M. (eds.) (2010). Global
Ocean Protection: Present Status and Future Possibilities. Brest, France: Agence des aires marines protégées, Gland, Switzerland, Washington, DC and New York, USA: IUCN WCPA, Cambridge, UK : UNEP-WCMC, Arlington, USA: TNC, Tokyo, Japan: UNU, New York, USA: WCS. 96pp.

References _____________________________________________________________________________
407
Townsend, R.E., McColl, J., Young, M.D. (2006). Design principles for individual transferable
quotas. Marine Policy 30:131–141. Townsend, C. (2003). Marine ecotourism through education: A case study of divers in the
British Virgin Islands. In Garrod, B., Wilson, J.C. (eds). Marine ecotourism: Issues and experiences. Great Britain, Cromwell Press: 138-154.
Tschumi, P., Hagan, H. (2008). A synthesis of the Making Markets Work for the Poor
(M4P) Approach. The Swiss Agency for Development and Cooperation (SDC) and Department for International Development (DFID), UK.
Tugault-Lafleur, C. and Turner, S. (2009). The price of spice: Ethnic minority livelihoods and cardamom commodity chains in upland northern Vietnam Singapore Journal of Tropical Geography 30: 388–403
Tungale, R. (2008). Livelihoods and customary marine resource management under customary
marine tenur: Case studies in the Solomon Islands. Master Thesis. Lincoln University. Turner, W. R., Brandon, K., Brooks, T.M., Gascon, C., Gibbs, H.K., Lawrence, K.S.,
Mittermeier, R.A., Selig, E.R. (2012). Global Biodiversity Conservation and the Alleviation of Poverty. Bioscience 62(1): 85-92.
Tuwo, A. (2004). Status of sea cucumber fisheries and farming in Indonesia. p. 49–55. In:
Advances in sea cucumber aquaculture and management. Lovatelli, A.; Conand, C;Purcell, S.; Uthicke, S.; Hamel, J.–F.; Mercier, A. (eds). FAO Fisheries Technical Paper.No. 463. Rome, FAO.
UN ESCAP (United Nation Economic and Social Commissions for Asia Pacific) (2012).
Statistical yearbook for Asia and the Pacific 2012. ESCAP Statistic Divisions.
Unsworth, R.K.F., Cullen, L.C., Pretty, J.N., Smith, D.J. Bell, J.J. (2010). Economic and subsistence values of the standing stocks of seagrass fisheries: Potential benefits of no-fishing marine protected area management. Ocean & Coastal Management 53: 218-224
Urquhart, J., Acott, T., Zhao, M. (2013). Introduction: Social and cultural impacts of marine
fisheries. Marine Policy 37(0): 1-2. Uyenco, F.R., Saniel, L.S., Jacinto, G.S. (1981). The ice-ice problem in seaweed farming. In
Levring T (ed.), Proceeding Tenth International Seaweed Symposium Walter de Gruyter & Co., Berlin: 625-630.
Van Beukering, P., Cacatian, J., Stellinga, J., Sultanian, E., Leisher, C. (2007). The Role of
Marine Protected Areas in Reducing Poverty. Case study 4: Apo Island (Philippines). The Nature Conservancy.
Vayda, A.P. (2009). Explaining human actions and environmental changes. Altamira press.
United Kingdom. Pp 302.
References _____________________________________________________________________________
408
Te Velde, D.W., Rushton,J., Schreckenberg, K., Marshall, E., Edouard, F., Newton,A., Arancibia, E. (2006). Entrepreneurship in value chains of non-timber forest products. Forest Policy and Economics, 8: 725– 741.
Verheijen, J. A. J. (1986). The Sama/Bajau language in the lesser Sunda Islands. Canberra, Dept.
of Linguistics, Research School of Pacific Studies, Australian National University. Vermeulen, S., Woodhill, J., Proctor, F., Delnoye, R. (2008). Chain-Wide Learning for Inclusive
Agrifood Market Development A guide to multi-stakeholder processes for linking small-scale producers to modern market development. International Institute for Environment and Development, the Capacity Development and Institutional Change Programme (Wageningen University).
Vierros, M., Tawake, A., Hickey, F., Tiraa, A. and Noa, R. (2010). Traditional Marine
Management Areas of the Pacific in the Context of National and International Law and Policy. Darwin, Australia: United Nations University – Traditional Knowledge Initiative.
Visser, L.E. and Adhuri. D. (2010). Territorialization re-examined: Transborder marine
resources exploitation in Southeast Asia and Australia. In: W. De Jong. Sneider and N. Ishikawa (eds). Transborder governance of forests, river and seas: 83-98. London Earthscan.
Visser, L.E. (2004). Challenging coasts: Transdisciplinary excursions onto integrated coastal
zone development. MARE publication series 1. Amsterdam University Press. Amsterdam.
Visser, L.E. and C.L. Voorhoeve. (1987). Sahu-Indonesia-English Dictionary and Sahu
Grammar Sketch, Verhandelingen KITLV 126. Dordrecht/Province: Foris Publications Visser, L.E. (1989). My rice is is my child: Social and territorial aspects of swiden cultivation in
Sahu, Eastern Indonesia, Verbandelingen KITLV 136. Doedrech/Providence: Foris Publications.
Vimal, R., Pluvinet, P., Sacca. C., Mazagol, P., Etlicher, B., Thompson, J. D. (2012). Exploring
spatial patterns of vulnerability for diverse biodiversity descriptors in regional conservation planning. Journal of Environmental Management. 95(1): 9-16.
Voyer, M., Gladstone, W, Goodall, H. (2012). Methods of social assessment in Marine Protected
Area planning: Is public participation enough? Marine Policy 36: 432–439. Yasue, M., Kaufman, L., Vincent, A.C.J. (2011). Assessing ecological changes in and around
marine reserves using community perceptions and biological surveys. Aquatic Conservation-Marine and Freshwater Ecosystems. 20(4): 407-418.
Wang, Jin Yuan (2010). The Development of Seaweed Industry (Carrageenan Seaweeds) in
China. Shanghai Berlian Gum. Presented at the Seaweed International Business Forum and Exhibition/SEABFEX III, Surabaya, Indonesia.
Waisboard, S. (2008). Are International Aid and Community Participation Inevitably at Odds?
MAZI article, at http://www.communicationforsocialchange.org/mazi-articles.php?id=386 cited on 4 December 2008

References _____________________________________________________________________________
409
Walker, B.L.E., Robinson, M.A. (2009). Economic development, marine protected areas and
gendered access to fishing resources in a Polynesian lagoon. Gender, Place and Culture. 16 (4): 467–484
Walpole, M., Wilder, L. (2008). Disentangling the links between conservation and poverty
reduction in practice. Fauna & Flora International, Oryx, 42(4), 539–547 Warren, C. (1993). Adat and Dinas : Balinese communities in the Indonesian state, Oxford
University Press, Kuala Lumpur;New York. Warner, T. E., R. S. Pomeroy (2012). Creating compliance: A cross-sectional study of the factors associated with marine protected area outcomes. Marine Policy. 36(4): 922-932. Waylen, K.A., Fischer, A., McGowan, P.J.K, Thirgood, S.J., Milner-Gulland, E.J. (2010). Effect
of Local Cultural Context on the Success of Community-Based Conservation Interventions. Conservation Biology. 24 (4):1119–1129
Weeratunge, N., Bene, C., Siriwardane, R., Charles, A., Johnson, D., Allison, E.H., Nayak, P.K.,
Badjeck, M. (2013). Small scale fisheries through the wellbeing lens. Fish and fisheries. Weeratunge, N., Snyder, N.K. A and C.P. Sze. (2010). Gleaner, fisher, trader, processor:
understanding gendered employment in fisheries and aquaculture. Fish and Fisheries 11: 405–420.
West, P., Igoe, J., Brockington, D. (2006). Parks and peoples: the social impact of protected
areas. Annual Review of Anthropology. 35:251-77. West, P., and Brockington, D. (2006). An anthropological perspective on some unexpected
consequences of protected areas, Conservation biology, 20(3):609-616. White, C., and Costello, C. (2011). Matching spatial property rights fisheries with scales of fish
dispersal. Ecological Applications, 21(2), 2011, pp. 350–362. White, C., Kendall, B. E., Gaines, S., Siegel, D.A., Costello, C. (2008a). Marine reserve effects
on fishery profit. Ecology Letters 11(4): 370-379. White, A.T., Christie, P., D’Agnes, H., Lowry, K., Milne, N. (2005). Designing ICM projects for
sustainability: Lessons from the Philippines and Indonesia. Ocean & Coastal Management 48: 271-296.
White, A.T., and Vogt, H. T. (2000). Philippine Coral Reefs Under Threat: Lesson Learned After
25 Years of Community Based Reef Conservation. Marine Pollution Bulletin. 40 (6): 537-550.
White, A.T., Hale, Lynne Z., Renard, Y., Cortessy, L. (1994). Collaborative and Community
Based Management of Coral Reefs Lesson from Experience. Kumarian Press, Connecticut.

References _____________________________________________________________________________
410
White, S. and Pettit, J. (2004). Participatory approaches and the measurement of human well-being. WeD Working Paper 08. Wellbeing in Developing Countries ESRC Research Group. UNU-WIDER.
Whittingham E, Campbell J, Townsley P. (2003). Poverty and reefs. Volume 1: A global
overview. Paris: DFID-IMM-IOC/UNESCO; 2003.
Wielgus J., Sala, E., Gerber. (2010). Assessing the ecological and economic benefits of a no take marine reserve. Ecological economics. 67: 32-40.
Wielgus J., Balmford, A., Lewis, T.B., Mora, C., Gerber, L.R. (2010). Coral reef quality and
recreation fees in marine protected areas. Conservation Letters. 3(1): 38-44. Will, M. (2008). Promoting Value Chains of Neglected and Underutilized Species for Pro-Poor
Growth and Biodiversity Conservation. Guidelines and Good Practices. Global Facilitation Unit for Underutilized Species, Rome, Italy.
Williams, B.K. (2011). Adaptive management of natural resources framework and issues.
Journal of Environmental Management. 92: 1346-1353 Williams, M. (2008). Why Look at Fisheries through a Gender Lens? Development 51: 180-185. Williams, M. J., Williams, S.B., Choo, P.S. (2010). From women in fisheries to gender and
fisheries. Williams, M. J. (2010). Gender dimensions in fisheries management. In R.Q. Grafton, R.
Hilborn, D. Squires, M. Tait and M. Williams (eds). Handbook of Marine Fisheries Conservation and Management: 72-96. Oxford University Press, Oxford.
Williams, R. (1981). Culture. Fontana. London. Wilkinson, J. (2006). Fish: A global value chain driven onto the rocks. Sociologia Ruralis. 46
(2): 139-153 Wilkinson, C. (2004). Status of the coral reefs of the world 2004. Global Coral Reef Monitoring
network. Wilson, S.K., Fisher, R., Pratchett, M.S., Graham, N.A.J., Turner, N.K.R.A., Cakacaka, A.,
Polunin, N.V.C and Rushton, S.P. (2008). Exploitation and habitat degradation as agents of change within coral reef fish communities, Global Change Biology, 14: 2796–2809.
Wilson, DC., Raakjaer, J., Degnbol, P. (2006). Local ecological knowledge and practical
fisheries management in the tropics: a policy brief. Marine Policy; 30: 794-801. Woolcock, M., Narayan, D. (2000). Social Capital: Implications for Development Theory,
Research, and Policy. The World Bank Research Observer. 15 (2): 225-49. Woolcock, M. (1998). Social capital and economic development: toward a theoretical synthesis
and policy framework, Theory and Society, 27(2): 151-208. World Bank (1990). World Development Report: Poverty, New York: Oxford University Press.

References _____________________________________________________________________________
411
World Fish Center (2005). Fisheries and the Millennium Development Goals: Solutions for
Africa. Penang, World Fish Center. WRI/World Resources Institute (2005). World Resources 2005: The Wealth of the Poor —
Managing Ecosystems to Fight Poverty. UNEP/UNDP/WRI/World Bank, Washington, DC, USA.
The World Bank (2005). Stakeholder Analysis, The World Bank. WWF-Australia (2009). The coral triangle and climate change: Ecosystems, people and societies
at risk. WWF-Australia. WWF-Indonesia (2010). Ringkasan Laporan Hasil Survei Ekologi Kabupaten Alor. Unpublished
report. WWF-Indonesia. WWF-Indonesia (2012). Coral Reef Health Survey in 2011. Unpublished report. WWF-
Indonesia. WWF-Indonesia (2012a). Fishery performance evaluation in Alor using EAFM. Unpublished
report. WWF-Indonesia. WWF-Indonesia (2009). Ringkasan hasil studi baseline ecology Kabupaten survey Alor, WWF
Indonesia. WWF-Indonesia (2009a), Baseline Survey of Communities in Alor-Solor Project. WWF-
Indonesia. Unpublished report. WWF-Indonesia (2006). Data pelanggar patroli, Unpublished report. WWF-Indonesia (2006). Sustainable Livelihoods and Coastal Resource Management in Berau
and Solor-Alor, Indonesia. Unpublished project document. WWF-Indonesia (2003). Threats to Bali Barat NP, Unpublished report. WWF-Indonesia (2002). Friends of the reef project document. Unpublished report. WWF
Indonesia. Wyrtki, K. (1961). Physical Oceanography of the Southeast Asian Waters. Naga Report Volume
2. The University of California Yang, D. (2008). International Migration, Remittances and Household Investment: Evidence
from Philippine Migrants’ Exchange Rate Shocks. The Economic Journal 118(528): 591-630.
Yajri, F. (2008). Penghapus derita 10 tahun, Trubus, 464 XXXIX, July 2008. Yasue, M., Kaufman, L., Vincent, A.C.J. (2011). Assessing ecological changes in and around
marine reserves using community perceptions and biological surveys. Aquatic Conservation-Marine and Freshwater Ecosystems. 20(4): 407-418.

References _____________________________________________________________________________
412
Yin, R. K. (1993). Application of case study research. Applied social research methods series. Vol 34. Sage Publications.
Yohe, G., Tol. R.S.J. (2002). Indicators for social and economic coping capacity moving toward
a working definition of adaptive capacity. Global Environmental Change 12: 25–40 Yu, R., Kam, L.E., Leung, P.S. (2008). The seafood supply chain and poverty reduction. In
Briones, R.M. and Garcia, A.G. (ed). Poverty reduction through sustainable fisheries: Emerging policy and Governance Issues in Southeast Asia. Institute of Southeast Asian Studies. Singapore. pp 145-188.
Zainudeen, A., Tahani Iqbal, T., Samarajiva, R. (2010). Who's got the phone? Gender and the
use of the telephone at the bottom of the pyramid. SAGE publication. Zegler, M.E. (2008). Marine protected area impacts on livelihoods ad marine resource use:
Belizean Case Study. PhD Thesis. Interdepartmental Graduate Program in Marine Science, University of California, Santa Barbara. USA.
Ziesemer, T. H. W. (2012). Worker remittances, migration, accumulation and growth in poor
developing countries: Survey and analysis of direct and indirect effects. Economic Modelling 29(2): 103-118.
www.tectonics.caltech.edu/slip_histiry/2004_indo-kep_alor/alor.html
http://www.alorkab.go.id/web/index.php?hal=seja accessed in 10 May 2010 www.mabini.gov.ph sighted on 28 June 2008 www.wwf.or.id sighted on 24 May 2008 http://www.sultra.go.id sighted on 25 May 2008 www.fishbase.org accessed on 11 May 2011 http://www.fishbase.org/Summary/speciesSummary.php?ID=12895&genusname=Hyporhamphus&speciesname=dussumieri&lang=English http://www.fao.org/fishery/species/3294/en accessed on 11 May 2011 http://en.wikipedia.org/wiki/Sea_cucumber_(food) accessed on 31 October 2011 http://www.iucn.org/about/ sighted on 6 December 2010


Appendix _____________________________________________________________________________
413
Appendix A Semi structured interview to address question 1 of research proposal
Key informants to be interviewed: 1. Park authority/ Steering committee of planning process 2. WWF/TNC project leader 3. Community groups 4. Local NGOs Introduction I am a PhD student of School for Environmental Research, Charles Darwin University (CDU), Darwin, Australia. I am doing research as part of my PhD project entitled, “Assessing the impact of MPA establishment on livelihoods, case study Pantar Island, Kabupaten Alor, NTT, Indonesia”. For this research, I will explore the experience of the establishment of other MPAs in Indonesia to analyse to what extent local communities have been involved in the MPA planning process, and particularly, how social and economic consideration have been considered in establishment of the MPA. This semi structured interview does not mean to evaluate the effectiveness of this MPA. This is to study the learning process that could be implemented in other areas. I will ask you a series of questions covering four main topics in relation to the planning process in the MPA:
1. Degree of participation of local communities in the planning process 2. Social consideration 3. Economic consideration. This includes market influence. 4. Zoning and management process
This interview will not take longer than 2 hours to complete. Your individual name will no be identified in my thesis. Your information will be stored and presented in coded by organisation. If you have any consents regarding this interview, please let me know or you could contact my School director, supervisor and CDU ethics officer. Their contact details are on my introduction sheet. Do you agree to the interview being recorded? Yes / No Name of interviewee ( for research purpose only): Job Title: Role in the park planning process: Date: Time started: Time ended:

Appendix _____________________________________________________________________________
414
Section 1: Degree of participation of local communities in the planning process 1.1 Stakeholder analysis
1.1.1 Did you (or your organisation) conduct a stakeholder analysis as part of MPA establishment process?
1.1.2 Did you (or your organisation) have any knowledge of stakeholder groups prior to the MPA establishment process?
1.1.3 Which stakeholders did you get to know prior to the MPA establishment process?
1.1.4 Please list of your top 10 key stakeholder groups and how many individuals you dealt with and exist in each group?
1.1.5 Please rank them based on the most important one to the least important stakeholder group in MPA establishment
1.1.6 Why did you rank them at this level? 1.1.7 How did you involve the most important key stakeholder or primary key
stakeholder group in the MPA planning process or other relevant activities? 1.1.8 What could have been done differently for stakeholder participation if you have
a chance to replicate in other places with similar conditions?
1.2 Participation of grass root user group in MPA planning process 1.2.1 What kind of activity did this MPA have regarding the establishment? 1.2.2 Who initiated, invited people to the meetings, and led the meetings? 1.2.3 How long did the consultation process take? 1.2.4 Did the participation of grass root user group change over time? If so, which one
changes over time? 1.2.5 Were there any constraints to stakeholder participation?
Section 2: Social Considerations 2.1 How was the social and economic information collected? (Using specific participatory
methods? Household surveys? Interviews?) 2.2 Can you list all the reports relating to social and economic surveys? 2.3 Were biological surveys conducted? 2.4 What were the links between biological and socio-economic surveys, If any? 2.5 How did you (park planning committee) take into account this information in the zoning
and management plan? 2.6 Were ethnic groups identified? 2.7 Were different resource user groups identified? 2.8 Were local level institutions identified? 2.9 Were members of the local institution identified? 2.10 Were the rules in the institution also identified, if any? 2.11 Who are the members in the institution? Inclusive/exclusive organisation? 2.12 Did you identify the population trend? (e.g. population growth, migration) 2.13 Were the history of community and its settlements identified? 2.14 Is there any special belief about marine resources in that area? (rules, norms?) 2.15 Is there any local folklore associated with marine resources? (myth, taboo, legend) 2.16 Community perception
2.16.1 Did you identify the community perceptions about marine resources in general? (cosmology, trends)
2.16.2 Did you identify the method and gear used for harvesting marine products by different user groups?

Appendix _____________________________________________________________________________
415
2.16.3 Did you identify community perceptions on events or activities that are believed to harm marine resources?
2.16.4 Is there any traditional ecological knowledge in that area? Held and followed by whom?
2.16.5 Did you identify community knowledge on resource location, mobility of marine species, population size, taxonomy, reproduction process of certain marine species and interdependency among marine resource?
2.17 Local (traditional) access and rights 2.17.1 Was there any traditional or local sea tenure in that area? 2.17.2 Were there any traditional/local seasonal
restrictions on marine resource use & for which species?
2.17.3 Were there any traditional/local restrictions on where marine resource use could take place & for which areas? (these should be named and/or located on a map)
2.17.4 Were there any traditional/local restrictions on what fishing gear (or fishing methods) could take be used?
2.17.5 Was there any rule on who can access marine resources? (sea access right)
2.18 Was there any other fishers (from outside the area) catch/harvest the marine products in this MPA? 2.18.1 How was the intensity of outside marine users? (low, medium, high) 2.18.2 Were there any local rules/norms in dealing with fishers from outside?
Section 3: Economic Issues 3.3 Dependency on marine resources was identified
3.2.1 Did you have any knowledge of resource use in particular area? E.g. temporary settlements, different type of fishing activities: including netting, seashell collection, ecotourism, by group/gender/season, etc.
3.2.1 Did you identify the purpose of each activity? (commercial/domestic/exchange), If it is for commercial purposes who and where is the buyer?
3.2.1 Did you identify the actors of each activity? E.g. who benefit from the marine resource the most, how many people are involved in each activity, where they were from.
3.2.1 Did you identify the location of each activity? 3.2.1 Did you identify the equipment and technology used to exploit the marine
resources? (cost and value of each) 3.2.1 Did you identify the time and season for exploiting marine resources? 3.2.1 Did you identify the contribution of this activity to total family livelihoods?
3.4 Did you identify cash income and other livelihoods besides marine products? 3.5 What do you think the level of importance of a particular marine resource to particular
community in general? And why? 3.6 Ecotourism
3.6.1 Did any tourism activity exist before planning process? 3.6.2 Did any tourism activity exist during planning process? 3.6.3 Did any tourism activity exist after planning process? 3.6.4 Who were [are?] the key actors in ecotourism? [and what roles do they play?] 3.6.5 Do you think there are any benefits to ecotourism? 3.6.6 Who benefit the most from ecotourism?

Appendix _____________________________________________________________________________
416
3.7 Market Influence 3.2.1 Did you identify the most commercial marine product and service from this
area? 3.2.1 Please list top five of the most commercial marine products identified during the
planning process. Was there any change since that time? 3.2.1 Did you identify any demand trends of those products? 3.2.1 Was there any change in quality requirements of those products? 3.2.1 Did you identify who sell the products? And where is it sold? 3.2.1 Is there price control, or is it determined by different markets? (who control the
price?) 3.2.1 Did you identify the financial arrangements of marine products harvest system? 3.2.1 Was there any quota for those marine products? Who control the quota if there
was any? 3.2.1 are there times when go can’t sell a particular category of marine
product?” & “which products” & “why” Section 4: Zoning and management system a. How did you define core zone and other multiple use zones in MPA? b. Was there any public consultation prior to this zoning? c. Did the existing zoning or the legalised zoning change since the public consultation? If
there is any differences, why? d. How was it consulted back to the community? e. How often do the working group meet with the community to discuss any dynamic
change? To cope with market demand? f. Which area/zone is local community allowed to benefit from? g. How did you identify the zone to be used? h. What could have been done differently if you have a chance replicate the process? i. Conflicts:
i. Were there any conflicts since the MPA was established? E.g. within community, between park and community, between park and local government?
ii. What kind of conflicts? Please list top two/three of conflicts. iii. When did the conflicts happen in general? Was there any trends? iv. Who played a part in each conflict? v. Do you know the reason behind those conflicts?
vi. What scale was the conflict? vii. Was there any conflict resolution process in place?
viii. What effect did it have on the planning process? j. Policy and regulation
i. Was there any existing/new policy provided/declared to support participatory planning process?
ii. Did you have any policy and regulation difficulties in involving stakeholder groups in the planning process?
Any other comments, you would like to make?

Appendix _____________________________________________________________________________
417
Appendix B Guiding questions on marine product value chains for traders A. KEY INFORMANT IDENTITY/RESPONDANT Name : (Address) : B. MANAGEMENT IDENTIFICATION 1. How long have you been involved in this business? 2. Number of worker if any: person(s) 3. Type of payment to worker: (daily, monthly, percentage) 4. Volume of trade with supplier and buying price
Products Type/class of the products (e.g. wet, air dry, smoked,
class A)
Quantity traded permonth
Unit Buying price/unit
Trepang Lola (trochus) Seaweed 5. Do you know the source of this product? (location) - Sea cucumbers: - Top shells: - Seaweed: 6. Are there any products harvested from Pantar Island? 7. Who is your Supplier? Name, address, Area coverage of buying 8. Source of capital:(private, loan, other sources)
Date of interview: Name of interviewer: Length of interview:

Appendix _____________________________________________________________________________
418
C. COST AND BENEFIT ANALYSIS No Component Unit Price/unit Quantity per
unit Total
quantity
1 COST
Investments:
5. Building/warehouse
6. Land
7. Equipment
8. Business permit cost
9. Insurance
Raw Material purchasing:
Operational costs
1 Transport:
Car
Fuel
Labour
Boat
Others:
2 Electricity
3 Marketing transaction cost: phone, information shared
d. other costs:
2. Trade Volume
Type of Products Quantity traded per month
Unit Selling Price
Sea cucumbers Top shells Seaweed 3. Type of upgrading if any: between buying and selling
Commodities Type of upgrading Practices Performance Sea cucumbers Top shells Seaweed
Appendix _____________________________________________________________________________
419
4. Who is your buyer? No Name Address Products Quantity
bought Unit Buying
price perunit
How long have been buying from you?
5. Could you draw the physical flow of the products? (from harvesters to end consumers) D. GOVERNANCE (in relation to suppliers and traders) Traders and Suppliers
1. Pricing: who decide the price? Between you and suppliers?.................... 2. How do you know your suppliers?................ 3. Rule of agreement with supplier?
3.1.Form of ordering: 3.2.Form of Payment: 3.3.Other
4. Reward (bonus) if obeyed? 5. Sanction? 6. Length of agreement with suppliers? 7. The nature of contract relationship? 8. How do you conduct the quality control? 9. Have you ever provided technical assistance to your suppliers? 10. Perception to business risk………………………………………………………….
(like challenge, doesnot like challenge) Traders and Buyers
1. Pricing: who decide the price? Between you and buyers?................................. 2. How do you know your Buyers?................ 3. Rule of agreement with Buyers?
a. Form of ordering: b. Form of Payment: c. …
4. Reward (bonus) if obeyed? 5. Sanction?
Rule, reward and sanction No List of rule Maker Sanction Reward

Appendix _____________________________________________________________________________
420
5. Comments on changes in price? Products Price
Fluctuation when impacts Changes as a
result Sea cucumbers Seaweed: Top shells
6. Who conducts the quality control? 7. Is there any technical assistance from buyers? 8. Length of agreement with buyers? 9. The nature of contract relationship
E. CHALLENGES FACED? Any challenges?
F. Others
- What do you think of an international trader (e.g. China/Korean buyer) buying directly from farmers or local traders at village level?
o Have you ever seen this situation? Yes / No o What sort of products?
Type of seaweed: Type of sea cucumbers: Lola:
o How did they communicate? Translator: Body language: Helped by the government office:
o Payment system? o Do you think this is going to be a long term business relationship? o Other comments:
Thank you

Appendix _____________________________________________________________________________
421
Appendix C The most frequently caught fish in the four study villages from December 2009 to May 2010
Local name English term Scientific name Labuhan Bajo Village
1. Mane Long tom fish Tylosurus crocodilus 2. Turinga (tongkol) Eastern little tuna Euthynnus affinis 3. Belo-belo (Gagadeh) Round scad Decapterus sp 4. Bangkumis (Tuna) Yellowfin Tuna Thunnus albacares 5. Lember* Halfbeaks Hyporhamphus dussumieri
Blangmerang Village - Melus Big eye scad Selar chrumenopthalmus - Belo-belo (Kowi) Round scad Decapterus sp - Serea (Tongkol) Eastern little tuna Euthynnus affinis - Lamoru (Bawok) Fusiler Lemuru sp - Kalawok (Kakak tua )
1. Bluebarred parrotfish 2. Redlips parrotfish
1. Scarus ghobban 2. Scarus rubroviolaceus
Kayang Village 2. Kerappung Grouper Lethrinus spp 3. Kalawok (Kakak Tua)
1. Bluebarred parrotfish 2. Redlips parrotfish
1. Scarus ghobban 2. Scarus rubroviolaceus
4. Kamea (Kakap Merah)
Red Snapper Lutjanus spp
5. Wehung Coral trout Cephalopholis spp 6. Pada Rabbitfish Siganus spp
Marisa Village 1. Wehung Coral trout Cephalopholis spp 2. Kalawok (Kakak Tua)
1. Bluebarred parrotfish 2. Redlips parrotfish
1. Scarus ghobban 2. Scarus rubroviolaceus
3. Kamea (Kakap Merah)
Red Snapper Lutjanus spp
4. Kerappung Grouper Lethrinus spp 5. Gergahing Giant trevally Caranx melampygus
Note: * based on observation.
All the fish data in this table are from fish landed recorded.

Appendix _____________________________________________________________________________
422
Appendix D Descriptive statistic analysis of fish size
No Fish name
Sample size (cm)
frequency Frequency relatives
Cumulative frequency
more than (≥)
Mode median mean of sample standard deviation
1 Allong 19 19 9.268 205 26 19 26.34146341 1024.045
21 4 1.951 186 114.125
24 5 2.439 182 27.412
25 5 2.439 177 8.998
26 60 29.268 172 6.996
27 25 12.195 112 10.842
28 50 24.390 87 137.537
29 36 17.561 37 254.441
31 1 0.488 1 21.702
n 205 100 2.806
No Fish name Sample size
(cm) frequency frequency
relatives cumulative frequency more than (≥)
Mode median mean of sample standard deviation
2 anerui 19 6 12.245 49 20 20.89 19.91836735 5.060
20 41 83.673 43 0.273
21 2 4.082 2 2.340
n 49 100.000 0 0.400

Appendix _____________________________________________________________________________
423
No Fish name Sample size
(cm) frequency frequency relatives cumulative
frequency more than (≥)
Mode median mean of sample
Standard deviation
3 bakabi 28 8 61.538 13 28 28 34.923 9.251
43 2 15.385 5
48 3 23.077 3
n 13 100
No Fish name Sample size
(cm) frequency frequency
relatives cumulative frequency more than (≥)
Mode median mean of sample
standard deviation
4 bandeng 5 2 20.000 10 33 33 56.2 37.818
33 3 30.000 7
84 1 10.000 6
87 1 10.000 5
92 1 10.000 2
95 2 20.000 2
n 10 100
No Fish name Sample size
(cm) frequency frequency
relatives cumulative frequency more than (≥)
Mode median mean of sample
standard deviation
5 Barawo 11 7 26.923 26 13 13.04 13.192 1.789
13 11 42.308 19
15 7 26.923 8
18 1 3.846 1
n 26 100

Appendix _____________________________________________________________________________
424
No Fish name Sample size
(cm) frequency frequency
relatives cumulative frequency more than (≥)
Mode median mean of sample
standard deviation
6 baripa 15 6 6.593 91 20.136 19.483 19.385 1.705
18 11 12.088 85
19 29 31.868 74
20 36 39.560 45
21 1 1.099 9
23 8 8.791 8
n 91 100
No Fish name Sample size
(cm) frequency frequency
relatives cumulative frequency more than (≥)
Mode median mean of sample
standard deviation
7 batu-batu 2 2 66.667 3 2 2 2.333 0.577
3 1 33.333 1
n 3 100
No Fish name Sample size
(cm) frequency frequency
relatives cumulative frequency more than (≥)
Mode median mean of sample
standard deviation
8 bawo long 14 76 49.67320261 153 14 14 15.804 1.888
16 16 10.45751634 77
18 61 39.86928105 61
n 153 100

Appendix _____________________________________________________________________________
425
No Fish name Sample size
(cm) frequency frequency
relatives cumulative frequency more than (≥)
Mode median mean of sample
standard deviation
9 Belo-belo 10 250 4.349 5749 16.18 17.5 16.544 2.603
11 1 0.017 5499
12 500 8.697 5498
14 295 5.131 4998
15 179 3.114 4703
16 1406 24.456 4524
17 859 14.942 3118
18 893 15.533 2259
19 796 13.846 1366
20 559 9.723 570
25 2 0.035 11
27 7 0.122 9
35 2 0.035 2
n 5749 100.000
No Fish name Sample size
(cm) frequency frequency
relatives cumulative frequency more than (≥)
Mode median mean of sample
standard deviation
10 benggol 16 869 55.741 1559 16 16 16.633 0.783
17 393 25.208 690
18 297 19.051 297
n 1559 100.000

Appendix _____________________________________________________________________________
426
No Fish name Sample size
(cm) frequency frequency
relatives cumulative frequency more than (≥)
Mode median mean of sample
standard deviation
11 Blanak 42 63
No Fish name Sample size
(cm) frequency frequency
relatives cumulative frequency more than (≥)
Mode median mean of sample
standard deviation
12 Blangkuning 15‐26 9 12.68 71 91.23684 86.72222 77.289 30.625
27‐38 3 4.23 62
39‐50 0 0.00 59
51‐62 9 12.68 59
63‐74 2 2.82 50
75‐86 12 16.90 48
87‐98 27 38.03 36
99‐110 4 5.63 9
111‐122 0 0.00 5
123‐134 2 2.82 5
135‐146 3 4.23 3
n 71 100
No Fish name Sample size
(cm) frequency frequency
relatives cumulative frequency more than (≥)
Mode median mean of sample
standard deviation
13 bulu babi 7 1 50 2 8.5 2.12
10 1 50 1
n 2

Appendix _____________________________________________________________________________
427
No Fish name Sample size (cm)
frequency frequency relatives
cumulative frequency more than (≥)
Mode median mean of sample
standard deviation
14 gergahing 12 3 1.974 152 28 28 52.145 36.378
17 5 3.289 149
18 1 0.658 144
21 4 2.632 143
22 1 0.658 139
28 82 53.947 138
32 1 0.658 56
42 1 0.658 55
79 2 1.316 54
80 2 1.316 52
85 29 19.079 50
87 1 0.658 21
110 3 1.974 20
123 7 4.605 17
125 10 6.579 10
n 152 100

Appendix _____________________________________________________________________________
428
No Fish name Sample size (cm)
frequency frequency relatives
cumulative frequency more than (≥)
Mode median mean of sample
standard deviation
15 cakalang 13 49 12.312 398 26 26 29.814 9.57
22 3 0.754 349
23 11 2.764 346
24 26 6.533 335
25 56 14.070 309
26 60 15.075 253
27 13 3.266 193
28 20 5.025 180
36 14 3.518 160
37 23 5.779 146
38 16 4.020 123
39 59 14.824 107
42 3 0.754 48
45 45 11.307 45
n 398 100
No Fish name Sample size
(cm) frequency frequency
relatives cumulative frequency more than (≥)
Mode median mean of sample
standard deviation
18 Caranx gigi 24 20 58.824 34 24 24 43.323 23.444
70 1 2.941 14
71 13 38.235 13
n 34 100

Appendix _____________________________________________________________________________
429
No Fish name Sample size
(cm) frequency frequency
relatives cumulative frequency more than (≥)
Mode median mean of sample
standard deviation
19 cumi-cumi 8 8 36.36 22 8 9 14.818 7.215
9 3 13.64 14
15 2 9.09 11
21 3 13.64 9
22 2 9.09 6
23 3 13.64 4
29 1 4.55 1
22 100.00
No Fish name Sample size
(cm) frequency frequency
relatives cumulative frequency more than (≥)
Mode median mean of sample
standard deviation
20 darata 15 7 1.25 560 26 26 30.24 10.63
18 35 6.25 553
19 19 3.39 518
20 26 4.64 499
21 14 2.50 473
22 22 3.93 459
23 17 3.04 437
24 6 1.07 420
25 83 14.82 414
26 147 26.25 331
27 1 0.18 184

Appendix _____________________________________________________________________________
430
28 1 0.18 183
29 8 1.43 182
31 17 3.04 174
32 4 0.71 157
43 9 1.61 153
45 9 1.61 144
46 32 5.71 135
47 63 11.25 103
48 19 3.39 40
49 21 3.75 21
n 560 100.00 0
No Fish name Sample size
(cm) frequency frequency
relatives cumulative frequency more than (≥)
Mode median mean of sample
standard deviation
21 dommok 26 4 9.09 44 52 39 42.02 8.053
32 2 4.55 42
34 1 2.27 41
35 1 2.27 40
36 2 4.55 38
37 1 2.27 36
38 6 13.64 35
39 3 6.82 29
41 1 2.27 26
42 1 2.27 25
43 2 4.55 24

Appendix _____________________________________________________________________________
431
46 2 4.55 22
47 6 13.64 20
49 3 6.82 12
52 9 20.45 9
n 44 100.00
No Fish name Sample size (cm)
frequency frequency relatives
cumulative frequency more than (≥)
Mode median mean of sample
standard deviation
22 etang 8 1 0.60 166 42 41 37.795 7.637
11 1 0.60 165
12 3 1.81 164
15 1 0.60 161
18 5 3.01 160
19 1 0.60 155
20 1 0.60 154
21 3 1.81 153
31 2 1.20 150
32 1 0.60 148
33 6 3.61 147
34 1 0.60 141
35 5 3.01 140
36 7 4.22 135
37 4 2.41 128
38 7 4.22 124
39 20 12.05 117
41 34 20.48 97
42 40 24.10 63

Appendix _____________________________________________________________________________
432
43 23 13.86 23
n 166 100
No Fish name Sample size
(cm) frequency frequency
relatives cumulative frequency more than (≥)
Mode median mean of sample
standard deviation
23 ewa 39 1
42 2
No Fish name Sample size (cm)
frequency frequency relatives
cumulative frequency more than (≥)
Mode median mean of sample
standard deviation
24 Golong 18 19
No Fish name Sample size (cm)
frequency frequency relatives
cumulative frequency more than (≥)
Mode median mean of sample
standard deviation
25 Gurita 2 1 2.22 45 48 24.7 29.956 11.186
15 1 2.22 44
21 7 15.56 43
23 5 11.11 36
24 6 13.33 31
25 3 6.67 25
28 2 4.44 22
29 5 11.11 20
31 2 4.44 15
32 1 2.22 13

Appendix _____________________________________________________________________________
433
33 1 2.22 12
45 2 4.44 11
48 9 20.00 9
n 45 100.00
No Fish name Sample size (cm)
frequency frequency relatives
cumulative frequency more than (≥)
Mode median mean of sample
standard deviation
26 hiu 17 1 4.35 23 81.74 36.61
26 2 8.70 22
31 1 4.35 20
53 1 4.35 19
57 1 4.35 18
60 1 4.35 17
63 1 4.35 16
64 1 4.35 15
73 1 4.35 14
83 2 8.70 13
84 1 4.35 11
95 2 8.70 10
110 1 4.35 8
113 1 4.35 7
117 2 8.70 6
120 1 4.35 4
121 1 4.35 3
123 1 4.35 2
149 1 4.35 1
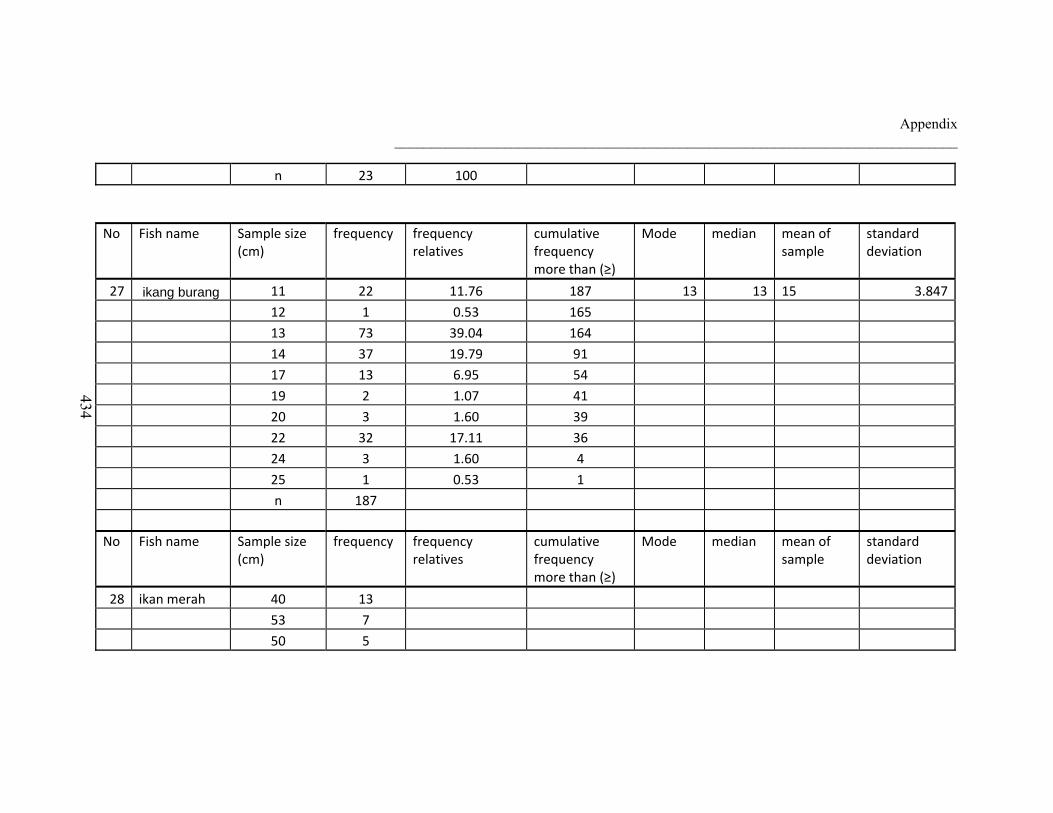
Appendix _____________________________________________________________________________
434
n 23 100
No Fish name Sample size
(cm) frequency frequency
relatives cumulative frequency more than (≥)
Mode median mean of sample
standard deviation
27 ikang burang 11 22 11.76 187 13 13 15 3.847
12 1 0.53 165
13 73 39.04 164
14 37 19.79 91
17 13 6.95 54
19 2 1.07 41
20 3 1.60 39
22 32 17.11 36
24 3 1.60 4
25 1 0.53 1
n 187
No Fish name Sample size (cm)
frequency frequency relatives
cumulative frequency more than (≥)
Mode median mean of sample
standard deviation
28 ikan merah 40 13
53 7
50 5

Appendix _____________________________________________________________________________
435
No Fish name Sample size
(cm) frequency frequency
relatives cumulative frequency more than (≥)
Mode median mean of sample
standard deviation
29 ikang wajang 26 1 6.67 15 34 34 32.06 3.327
27 3 20.00 14
34 11 73.33 11
n 15 100
No Fish name Sample size (cm)
frequency frequency relatives
cumulative frequency more than (≥)
Mode median mean of sample
standard deviation
30 Ille 20 21 6.82 308 26 24 24.094 3.538
21 83 26.95 287
22 45 14.61 204
24 17 5.52 159
26 121 39.29 142
34 21 6.82 21
n 308
No Fish name Sample size
(cm) frequency frequency
relatives cumulative frequency more than (≥)
Mode median mean of sample
standard deviation
31 iting molong 12 3 1.43 210 48 24 23.976 4.605
16 9 4.29 207
17 6 2.86 198
18 2 0.95 192
19 17 8.10 190

Appendix _____________________________________________________________________________
436
21 24 11.43 173
23 16 7.62 149
24 48 22.86 133
25 13 6.19 85
25 9 4.29 72
26 18 8.57 63
27 19 9.05 45
28 6 2.86 26
29 4 1.90 20
34 15 7.14 16
45 1 0.48 1
n 210 100
No Fish name Sample size
(cm) frequency frequency
relatives cumulative frequency more than (≥)
Mode median mean of sample
standard deviation
32 kabakku 0 _ 9 8 2.85 281.00 54.39933 51.52454 43.788 15.953
10 _ 19 12 4.27 273.00
20 _ 29 67 23.84 261.00
30 _ 39 3 1.07 194.00
40 _ 49 17 6.05 191.00
50 _ 59 163 58.01 174.00
60 _ 69 11 3.91 11.00
n 281 100
33 kabarehing 46 1

Appendix _____________________________________________________________________________
437
No Fish name Sample size
(cm) frequency frequency
relatives cumulative frequency more than (≥)
Mode median mean of sample
standard deviation
34 kadera 5 5 8.93 56 15 15 14.2143 3.338
13 14 25.00 51
14 3 5.36 37
15 22 39.29 34
16 1 1.79 12
17 1 1.79 11
18 10 17.86 10
n 56
No Fish name Sample size (cm)
frequency frequency relatives
cumulative frequency more than (≥)
Mode median mean of sample
standard deviation
35 kakak tua 16 10 3.34 299 20 20 21.21 5.04
17 22 7.36 289
18 52 17.39 267
19 10 3.34 215
20 88 29.43 205
21 28 9.36 117
22 46 15.38 89
23 11 3.68 43
25 7 2.34 32
26 2 0.67 25

Appendix _____________________________________________________________________________
438
31 8 2.68 23
35 2 0.67 15
37 1 0.33 13
38 5 1.67 12
40 4 1.34 7
42 1 0.33 3
47 2 0.67 2
n 299 100.00
No Fish name Sample size
(cm) frequency frequency
relatives cumulative frequency more than (≥)
Mode median mean of sample
standard deviation
36 Kakap 5‐14 17 1.42 1197 22.92 24.37267 25.49 7.8
15‐24 589 49.21 1180
25‐34 482 40.27 591
35‐44 93 7.77 109
45‐54 6 0.50 16
55‐64 2 0.17 10
65‐74 8 0.67 8
n 1197 100.00
No Fish name Sample size (cm)
frequency frequency relatives
cumulative frequency more than (≥)
Mode median mean of sample
standard deviation
37 kerang 4‐7cm

Appendix _____________________________________________________________________________
439
No Fish name Sample size
(cm) frequency frequency
relatives cumulative frequency more than (≥)
Mode median mean of sample
standard deviation
38 kerapu 19 34 30.09 113 19 21 28.22 9.66
20 19 16.81 79
21 7 6.19 60
29 1 0.88 53
34 9 7.96 52
36 22 19.47 43
39 2 1.77 21
42 16 14.16 19
46.5 3 2.65 3
113 100.00
No Fish name Sample size (cm)
frequency frequency relatives
cumulative frequency more than (≥)
Mode median mean of sample
standard deviation
39 kerapu lumpur 20 15 83.33 18 20 20 21.111 3.008
24 2 11.11 3
32 1 5.56 1
n 18 100

Appendix _____________________________________________________________________________
440
No Fish name Sample size (cm)
frequency frequency relatives
cumulative frequency more than (≥)
Mode median mean of sample
standard deviation
40 karappung 8 14 0.94 1483 24 25 25.23 5.21
15 20 1.35 1469
16 5 0.34 1449
17 28 1.89 1444
18 49 3.30 1416
19 45 3.03 1367
20 54 3.64 1322
21 153 10.32 1268
22 68 4.59 1115
23 99 6.68 1047
24 196 13.22 948
25 89 6.00 752
26 82 5.53 663
27 113 7.62 581
28 126 8.50 468
29 66 4.45 342
30 56 3.78 276
31 59 3.98 220
32 18 1.21 161
33 31 2.09 143
34 79 5.33 112
36 20 1.35 33
45 13 0.88 13
n 1483 100.00
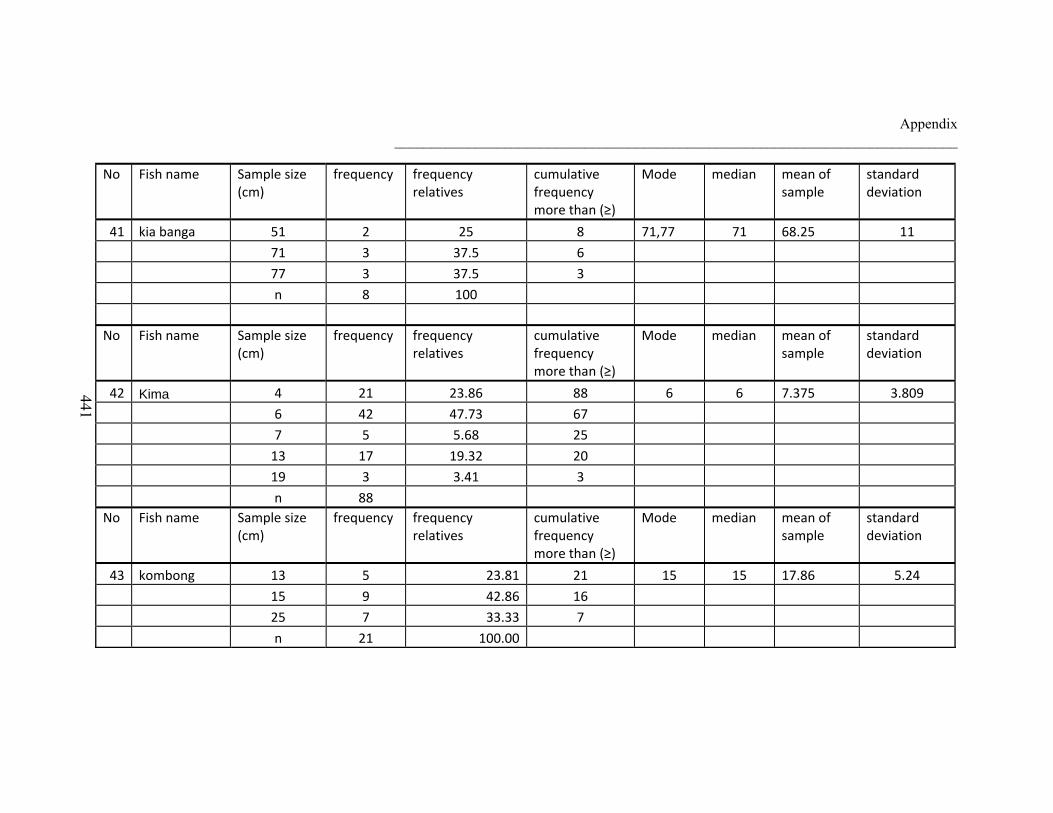
Appendix _____________________________________________________________________________
441
No Fish name Sample size (cm)
frequency frequency relatives
cumulative frequency more than (≥)
Mode median mean of sample
standard deviation
41 kia banga 51 2 25 8 71,77 71 68.25 11
71 3 37.5 6
77 3 37.5 3
n 8 100
No Fish name Sample size (cm)
frequency frequency relatives
cumulative frequency more than (≥)
Mode median mean of sample
standard deviation
42 Kima 4 21 23.86 88 6 6 7.375 3.809
6 42 47.73 67
7 5 5.68 25
13 17 19.32 20
19 3 3.41 3
n 88
No Fish name Sample size (cm)
frequency frequency relatives
cumulative frequency more than (≥)
Mode median mean of sample
standard deviation
43 kombong 13 5 23.81 21 15 15 17.86 5.24
15 9 42.86 16
25 7 33.33 7
n 21 100.00

Appendix _____________________________________________________________________________
442
No Fish name Sample size
(cm) frequency frequency
relatives cumulative frequency more than (≥)
Mode median mean of sample
standard deviation
44 Kome Kabaku 5 5
No Fish name Sample size (cm)
frequency frequency relatives
cumulative frequency more than (≥)
Mode median mean of sample
standard deviation
45 Kor-kor 16 19
11 5
No Fish name Sample size (cm)
frequency frequency relatives
cumulative frequency more than (≥)
Mode median mean of sample
standard deviation
46 kubar 41 5 3.82 131 46 46 45.59 1.44
42 1 0.76 126
43 10 7.63 125
45 28 21.37 115
46 53 40.46 87
47 34 25.95 34
n 131 100.00
No Fish name Sample size (cm)
frequency frequency relatives
cumulative frequency more than (≥)
Mode median mean of sample
standard deviation
47 kullong 7 3

Appendix _____________________________________________________________________________
443
No Fish name Sample size (cm)
frequency frequency relatives
cumulative frequency more than (≥)
Mode median mean of sample
standard deviation
48 kwang-kwang 12 5
No Fish name Sample size (cm)
frequency frequency relatives
cumulative frequency more than (≥)
Mode median mean of sample
standard deviation
49 Lamadah 120 2 28.57 7 125 125 125 5
125 4 57.14 5
135 1 14.29 1
7 100.00
No Fish name Sample size (cm)
frequency frequency relatives
cumulative frequency more than (≥)
Mode median mean of sample
standard deviation
50 lamoru 6 2 1.09 184 17 17 16.59 5.27
7 9 4.89 182
8 1 0.54 173
10 2 1.09 172
11 10 5.43 170
12 5 2.72 160
13 42 22.83 155
17 53 28.80 113
18 9 4.89 60
19 24 13.04 51
23 5 2.72 27
26 13 7.07 22
29 9 4.89 9

Appendix _____________________________________________________________________________
444
n 184 100.00
No Fish name Sample size (cm)
frequency frequency relatives
cumulative frequency more than (≥)
Mode median mean of sample
standard deviation
51 Lapakarang 28 7 11.11 63 30 31 41.08 23.92
29 7 11.11 56
30 11 17.46 49
31 10 15.87 38
32 4 6.35 28
33 3 4.76 24
35 5 7.94 21
37 3 4.76 16
45 3 4.76 13
60 1 1.59 10
63 1 1.59 9
70 3 4.76 8
102 2 3.17 5
120 1 1.59 3
122 2 3.17 2
n 63 100

Appendix _____________________________________________________________________________
445
No Fish name Sample size (cm)
frequency frequency relatives
cumulative frequency more than (≥)
Mode median mean of sample
standard deviation
52 Lawoni 20 43 16.10 267 27 27 25.55 2.99
22 2 0.75 224
23 16 5.99 222
24 28 10.49 206
25 12 4.49 178
26 26 9.74 166
27 55 20.60 140
28 49 18.35 85
29 35 13.11 36
30 1 0.37 1
n 267 100.00
No Fish name Sample size (cm)
frequency frequency relatives
cumulative frequency more than (≥)
Mode median mean of sample
standard deviation
53 lember 14 5 10.42 48 20 20 18.7254902 111.651
15 5 10.42 43 69.396
17 8 16.67 38 23.819
18 7 14.58 30 3.684
20 12 25.00 23 19.493
21 6 12.50 11 31.040
22 5 10.42 5 53.612
24 3 6.25 0 83.461
n 51 106.25 7.923137255

Appendix _____________________________________________________________________________
446
No Fish name Sample size (cm)
frequency frequency relatives
cumulative frequency more than (≥)
Mode median mean of sample
standard deviation
54 lobster 13 4 15.38 26 27 22 20.8 5.72
14 5 19.23 22
21 3 11.54 17
22 2 7.69 14
24 2 7.69 12
25 2 7.69 10
26 2 7.69 8
27 6 23.08 6
n 26 100.00
No Fish name Sample size (cm)
frequency frequency relatives
cumulative frequency more than (≥)
Mode median mean of sample
standard deviation
55 lola 4 1 0.39 254 10 9 8.76 1.57
6 12 4.72 253
7 49 19.29 241
8 60 23.62 192
9 33 12.99 132
10 80 31.50 99
12 19 7.48 19
n 254 100.00

Appendix _____________________________________________________________________________
447
No Fish name Sample size (cm)
frequency frequency relatives
cumulative frequency more than (≥)
Mode median mean of sample
standard deviation
56 loli 17 26 11.45 227 19 19 22.1 5.87
18 16 7.05 201
19 79 34.80 185
21 30 13.22 106
22 18 7.93 76
26 14 6.17 58
27 9 3.96 44
28 17 7.49 35
29 6 2.64 18
42 12 5.29 12
n 227 100.00
No Fish name Sample size (cm)
frequency frequency relatives
cumulative frequency more than (≥)
Mode median mean of sample
standard deviation
57 mane 20 5 5 100 76 29 40.97 21.1
21 13 13 95
26 5 5 82
27 6 6 77
28 13 13 71
29 13 13 58
31 8 8 45
40 5 5 37
49 1 1 32
54 3 3 31

Appendix _____________________________________________________________________________
448
57 1 1 28
59 2 2 27
63 1 1 25
67 1 1 24
69 3 3 23
76 20 20 20
n 100 100 0
No Fish name Sample size
(cm) frequency frequency
relatives cumulative frequency more than (≥)
Mode median mean of sample
standard deviation
58 melus 8 5 1.29 387 16 16 16.14 2.01
12 10 2.58 382
13 5 1.29 372
14 26 6.72 367
15 75 19.38 341
16 121 31.27 266
17 46 11.89 145
18 88 22.74 99
19 9 2.33 11
30 2 0.52 2
n 387 100.00

Appendix _____________________________________________________________________________
449
No Fish name Sample size (cm)
frequency frequency relatives
cumulative frequency more than (≥)
Mode median mean of sample
standard deviation
59 Mulle 13 5 3.50 143 16 17 17.15 2.66
15 16 11.19 138
16 45 31.47 122
17 23 16.08 77
18 22 15.38 54
19 21 14.69 32
20 10 6.99 11
42 1 0.70 1
n 143 100.00
No Fish name Sample size
(cm) frequency frequency
relatives cumulative frequency more than (≥)
Mode median mean of sample
standard deviation
60 nuir 23 20 9.57 209 29 28 27.88 1.91
25 3 1.44 189
26 16 7.66 186
28 71 33.97 170
29 90 43.06 99
31 9 4.31 9
209 100.00

Appendix _____________________________________________________________________________
450
No Fish name Sample size (cm)
frequency frequency relatives
cumulative frequency more than (≥)
Mode median mean of sample
standard deviation
61 pada 8 8 0.83 964 17 17 17.77 3.55
10 5 0.52 956
12 14 1.45 951
13 50 5.19 937
14 79 8.20 887
15 97 10.06 808
16 80 8.30 711
17 203 21.06 631
18 74 7.68 428
19 164 17.01 354
20 16 1.66 190
22 28 2.90 174
23 98 10.17 146
24 8 0.83 48
26 11 1.14 40
27 19 1.97 29
28 10 1.04 10
n 964 100.00

Appendix _____________________________________________________________________________
451
No Fish name Sample size (cm)
frequency frequency relatives
cumulative frequency more than (≥)
Mode median mean of sample
standard deviation
62 Tenggiri 13 1 0.51 195 31 30
30.43 mean of sample 13.95 4.03
17 2 1.03 194
21 3 1.54 192
22 4 2.05 189
27 5 2.56 185
28 12 6.15 180
29 43 22.05 168
30 29 14.87 125
31 49 25.13 96
32 20 10.26 47
33 14 7.18 27
34 2 1.03 13
36 2 1.03 11
40 1 0.51 9
41 5 2.56 8
47 3 1.54 3
n 195 100.00 0

Appendix _____________________________________________________________________________
452
No Fish name Sample size (cm)
frequency frequency relatives
cumulative frequency more than (≥)
Mode median standard deviation
63 T buang kulit 11 16 10.32 155 16 14 1.95
12 45 29.03 139
14 29 18.71 94
16 65 41.94 65
155 100.00
No Fish name Sample size (cm)
frequency frequency relatives
cumulative frequency more than (≥)
Mode median mean of sample
standard deviation
64 terbang 20 4 10.26 39 24 24 22.03 3.58
21 6 15.38 35
23 9 23.08 29
24 12 30.77 20
25 5 12.82 8
11 3 7.69 3
n 39 100.00 0
No Fish name Sample size (cm)
frequency frequency relatives
cumulative frequency more than (≥)
Mode median mean of sample
standard deviation
65 tiae 12 7 0.10 73 16 17 16.7 2.07
15 5 0.07 66
16 22 0.30 61
17 14 0.19 39
18 11 0.15 25
19 8 0.11 14

Appendix _____________________________________________________________________________
453
20 6 0.08 6
n 73 1.00 0
No Fish name Sample size (cm)
frequency frequency relatives
cumulative frequency more than (≥)
Mode median mean of sample
standard deviation
66 tongkol 12 14 1.76 795 20 21 23 7.43
13 1 0.13 781
17 6 0.75 780
18 12 1.51 774
19 63 7.92 762
20 272 34.21 699
21 144 18.11 427
22 103 12.96 283
23 26 3.27 180
24 13 1.64 154
25 10 1.26 141
27 2 0.25 131
28 28 3.52 129
30 14 1.76 101
31 15 1.89 87
32 6 0.75 72
36 10 1.26 66
37 9 1.13 56
40 1 0.13 47
42 8 1.01 46
45 12 1.51 38

Appendix _____________________________________________________________________________
454
48 18 2.26 26
60 8 1.01 8
n 795 100.00 0
No Fish name Sample size (cm)
frequency frequency relatives
cumulative frequency more than (≥)
Mode median mean of sample
standard deviation
67 tuna 16 1 0.34 292 130 125 112.72 28.59
18 4 1.37 291
19 5 1.71 287
21 1 0.34 282
23 1 0.34 281
38 3 1.03 280
55 9 3.08 277
70 2 0.68 268
75 2 0.68 266
82 3 1.03 264
83 2 0.68 261
86 5 1.71 259
89 1 0.34 254
90 1 0.34 253
93 4 1.37 252
95 1 0.34 248
96 2 0.68 247
97 4 1.37 245
98 18 6.16 241
100 19 6.51 223

Appendix _____________________________________________________________________________
455
105 3 1.03 204
116 34 11.64 201
118 2 0.68 167
122 3 1.03 165
125 34 11.64 162
128 7 2.40 128
130 52 17.81 121
132 46 15.75 69
135 14 4.79 23
138 4 1.37 9
140 2 0.68 5
165 3 1.03 3
292 100.00 0
No Fish name Sample size (cm)
frequency frequency relatives
cumulative frequency more than (≥)
Mode median mean of sample
standard deviation
68 welabi/bawok 9 3 1.07 281 28 30 34.7 12.5
14 6 2.14 278
15 6 2.14 272
16 4 1.42 266
18 5 1.78 262
20 7 2.49 257
21 3 1.07 250
22 19 6.76 247
24 9 3.20 228
25 3 1.07 219

Appendix _____________________________________________________________________________
456
28 50 17.79 216
30 38 13.52 166
36 14 4.98 128
37 6 2.14 114
38 1 0.36 108
39 6 2.14 107
40 13 4.63 101
41 7 2.49 88
42 2 0.71 81
43 3 1.07 79
44 1 0.36 76
45 5 1.78 75
46 5 1.78 70
48 9 3.20 65
49 16 5.69 56
51 9 3.20 40
54 14 4.98 31
55 2 0.71 17
58 6 2.14 15
59 7 2.49 9
62 2 0.71 2
n 281 100.00 0

Appendix _____________________________________________________________________________
457
No Fish name Sample size
(cm) frequency frequency
relatives cumulative frequency
more than (≥)
Mode median mean of sample
standard deviation
69 wehung 10 1 0.22 461 36 34 33.36 7.99
11 1 0.22 460
12 11 2.39 459
13 8 1.74 448
14 2 0.43 440
15 5 1.08 438
16 9 1.95 433
17 2 0.43 424
18 5 1.08 422
19 3 0.65 417
22 1 0.22 414
23 5 1.08 413
24 1 0.22 408
25 11 2.39 407
26 3 0.65 396
27 4 0.87 393
28 11 2.39 389
29 9 1.95 378
30 19 4.12 369
31 4 0.87 350
32 10 2.17 346
33 52 11.28 336
34 65 14.10 284

Appendix _____________________________________________________________________________
458
35 26 5.64 219
36 74 16.05 193
37 5 1.08 119
38 5 1.08 114
39 3 0.65 109
40 11 2.39 106
41 24 5.21 95
42 32 6.94 71
43 15 3.25 39
44 8 1.74 24
45 5 1.08 16
46 11 2.39 11
n 461 100.00 0

Appendix _____________________________________________________________________________
459
Appendix E Length of the most captured fish in cm (SL=standard length) recorded from December 2009 to May 2010 and length at first maturity Note: Y is frequency and X is length in cm. Dotted vertical lines represent the length at first maturity based on the literature.
Mane Fish (Long tom fish/Tylosurus crocodilus ) (n=100)
0
4
8
12
16
20
20 23 26 29 32 35 38 41 44 47 50 53 56 59 62 65 68 71 74
Length (cm)
frequency
Belo-belo (Round scad (Decapterus sp) )(n=5749)
0
200
400
600
800
1000
1200
1400
10 11 12 13 14 15 16 17 18 19 20 21 22 23 24 25 26 27 28 29 30 31 32 33 34 35
Lm=60cm
Lm=14.3-15.5cm
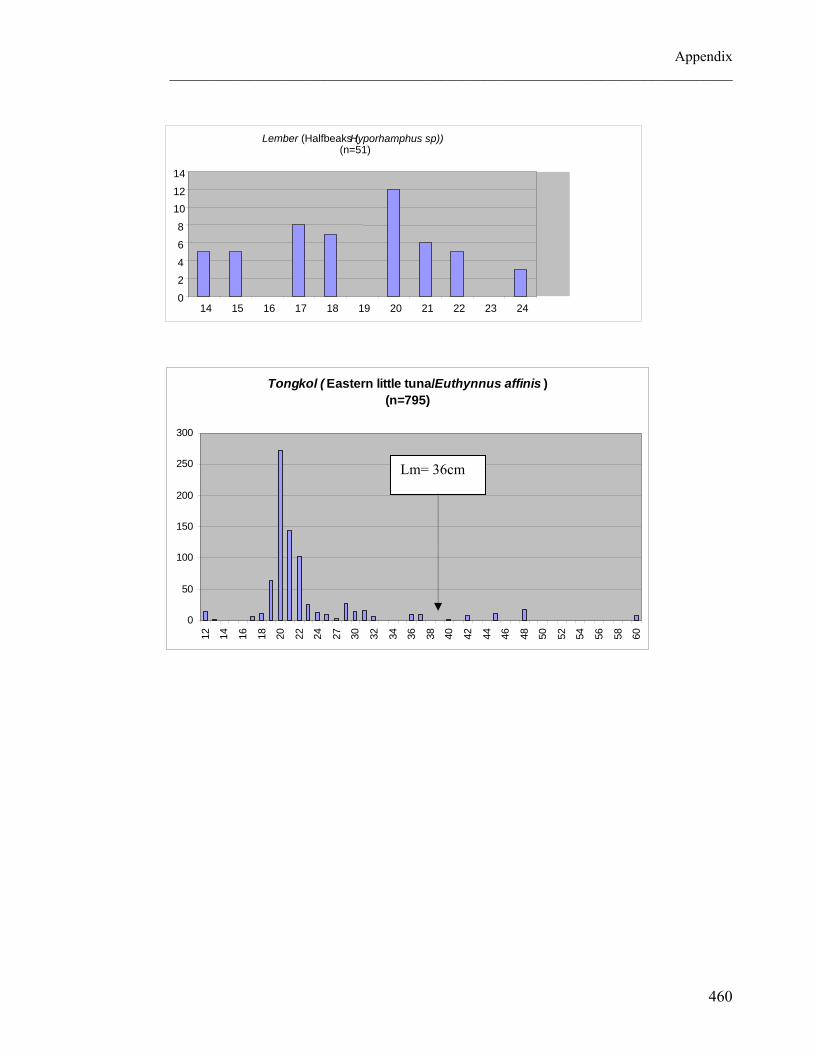
Appendix _____________________________________________________________________________
460
Tongkol ( Eastern little tuna/Euthynnus affinis ) (n=795)
0
50
100
150
200
250
300
12 14 16 18 20 22 24 27 30 32 34 36 38 40 42 44 46 48 50 52 54 56 58 60
Lember (Halfbeaks (Hyporhamphus sp)) (n=51)
0
2
4
6
8
10
12
14
14 15 16 17 18 19 20 21 22 23 24
Lm= 36cm

Appendix _____________________________________________________________________________
461
Kerappung (Grouper/Snubnose emperor )(n=1483)
0
50
100
150
200
250
8 12 16 20 24 28 32 36 40 44
Kalawok (Parrot fish/Scarus spp )(n=299)
0
10
20
30
40
50
60
70
80
90
100
16 18 20 22 24 26 28 30 32 34 36 38 40 42 44 46
Lm= 18cm
Lm= 31cm
Lm= 35cm

Appendix _____________________________________________________________________________
462
Wehung (Coral trout/Cephalopholis spp)(n=461)
0
10
20
30
40
50
60
70
80
10 12 14 16 18 20 22 24 26 28 30 32 34 36 38 40 42 44 46
Kamea ( Red snapper/ Lutjanus spp)(n=1197)
0
100
200
300
400
500
600
700
5-14 15-24 25-34 35-44 45-54 55-64 65-74
30cm
Lm= 17cm
Lm= 26cm
Lm 55cm

Appendix _____________________________________________________________________________
463
Appendix F Household survey A. Respondent: Name: Village: Hamlet: Number of HH member: Who is the head of the family? B. Fishing gear Do you have these fishing gears? No Fishing gear Season to use
this gear Duration once it is
used (time) (day/hour)
Targeted fish (detail in below
table)
Caught per unit
in average
Price of the fish
Fishing 1 Handline with
outrigger canoe (mancing dgn
katinting)
2 Speargun (tembak)
3 Throw/cast net with outrigger canoe (lempar
jala dengan katinting)
4 Cast net with one engine
5 Mini trawl (lempara)
6 drift/bottom longline (jala)
7 Kite fishing ( with engine)
8 Net Shark (drift net?)
9 Fish trap (ker) 10 Collecting
shells
11 Collecting Seacucumber
12 Collecting Top shells
13 Seaweed farming
14 Seaweed traders (local buyers)
Name of surveyor: Date:

Appendix _____________________________________________________________________________
464
Targeted fish Fish caught Frequency Months caught Amount Price Of caught Per fish caught month Euthynnus affinis Thunnus albacares Katsuwanus pelamis Decapterus spp Hyporhampus Dussumieri Lutjanus Seaweed Sea cucumbers Topshells etc C. Local Traders 1. Do you buy and sell marine products? Y N Type of fish amount Do you process before selling it? (chopped/sundried/salted) D. Other activities beside marine resource: 1. Do you have agricultural plot? Y N
Area: Ha Plant: Corn, Cassava, Bean, Do you plant every year? When is the harvesting time?
2. Do you have other family members work in other areas? Y N (Kupang/Rote/Malaysia/Singapore/Tanjungpinang/Batam ?
a. Do you receive money from them? Y N Regularly? Accidentally? When?................. b. How much do you receive money in average? …………… 3. What are other activities that support your family?
- Hand-weaving Y N
- Trade?
-Others?..........................................
Thank you
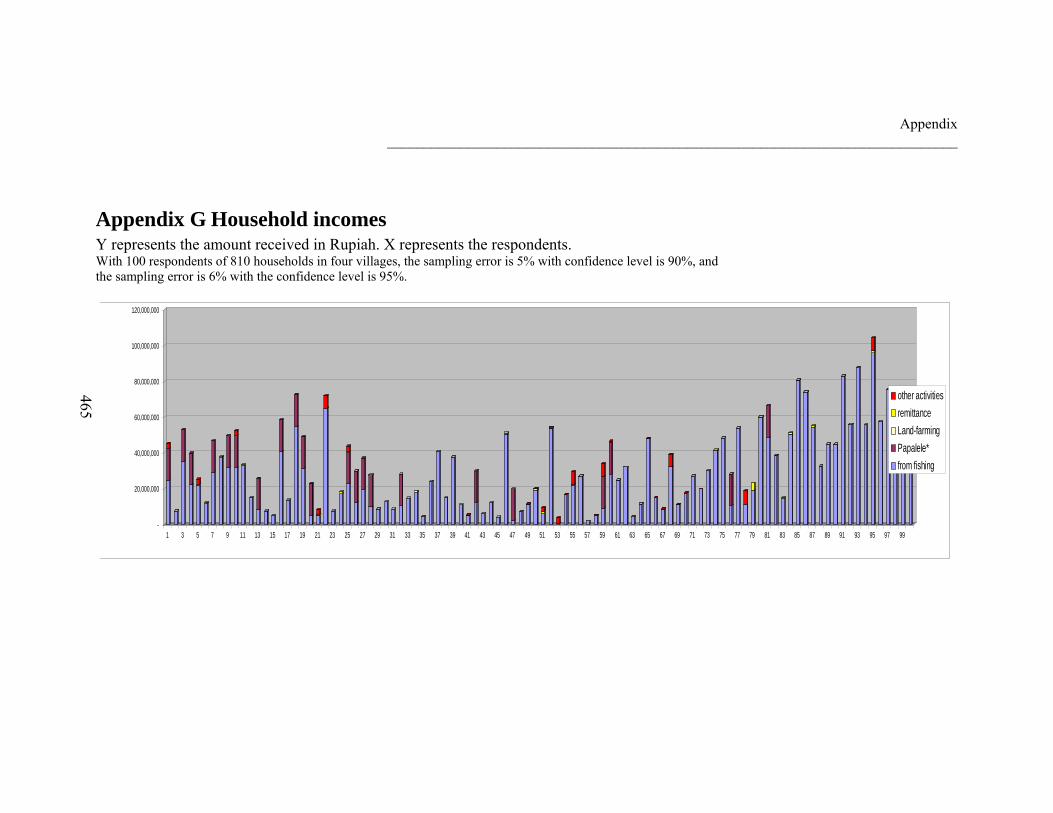
Appendix ______________________________________________________________________________
465
Appendix G Household incomes Y represents the amount received in Rupiah. X represents the respondents. With 100 respondents of 810 households in four villages, the sampling error is 5% with confidence level is 90%, and the sampling error is 6% with the confidence level is 95%.
-
20,000,000
40,000,000
60,000,000
80,000,000
100,000,000
120,000,000
1 3 5 7 9 11 13 15 17 19 21 23 25 27 29 31 33 35 37 39 41 43 45 47 49 51 53 55 57 59 61 63 65 67 69 71 73 75 77 79 81 83 85 87 89 91 93 95 97 99
other activities
remittance
Land-farming
Papalele*
from fishing

Appendix ______________________________________________________________________________
466
Appendix H The price of sea cucumbers that was used by traders The list of this price was provided by an exporter based in Makassar. The prices are shown in Indonesian rupiah. Other exporter also used the same list

Appendix _____________________________________________________________________________
467
Appendix I The decree of Bupati Alor number 6 of 2009 on the Alor District Marine Conservation Area

Appendix _____________________________________________________________________________
468

Appendix _____________________________________________________________________________
469

Appendix _____________________________________________________________________________
470
Top Related
Copyright © 2022 FDOKUMEN

