


Bahasa
Halaman
Hukum

ORIGINAL ARTICLE
Assessing sources of inconsistencies in genotypes
and their effects on genome-wide association
studies with HapMap samples
H Hong1, L Shi1, Z Su1, W Ge1,WD Jones2, W Czika3, K Miclaus3,CG Lambert4, SC Vega5, J Zhang6,B Ning7, J Liu7, B Green7, L Xu1,H Fang8, R Perkins1, SM Lin9,N Jafari10, K Park11, T Ahn11,M Chierici12, C Furlanello12,L Zhang13, RD Wolfinger3,F Goodsaid13 and W Tong1
1Division of Systems Toxicology, National Centerfor Toxicological Research, US Food and DrugAdministration, Jefferson, AR, USA; 2ExpressionAnalysis, Suite, NC, USA; 3SAS Institute, SASCampus Drive, Cary, NC, USA; 4Golden Helix.,Bozeman, MT, USA; 5Health Solutions Group,Microsoft, Seattle, WA, USA; 6Systems Analytics,Waltham, MA, USA; 7Division of PersonalizedNutrition and Medicine, National Center forToxicological Research, US Food and DrugAdministration, Jefferson, AR, USA; 8Z-Tech Corp,an ICF International Company at National Centerfor Toxicological Research, US Food and DrugAdministration, Jefferson, AR, USA; 9BiomedicalInformatics Center, Northwestern University,Chicago, IL, USA; 10Center for Genetic Medicine,Northwestern University, Chicago, IL, USA;11Samsung Advanced Institute of Technology,Giheung-gu, Yongin-si Gyeonggi-do, Republic ofKorea; 12Fondazione Bruno Kessler, Trento, Italyand 13Office of Clinic Pharmacology, Center forDrug Evaluation and Research, US Food andDrug Administration, Silver Spring, MD, USA
Correspondence:Dr H Hong, Division of Systems Toxicology,National Center for Toxicological Research, USFood and Drug Administration, 3900 NCTRRoad, Jefferson, AR 72079, USA.E-mail: [email protected] views presented in this article do notnecessarily reflect those of the US Food andDrug Administration.
Received 11 December 2009; accepted15 February 2010; published online 6 April 2010
The discordance in results of independent genome-wide association studies(GWAS) indicates the potential for Type I and Type II errors. We assessedthe repeatibility of current Affymetrix technologies that support GWAS.Reasonable reproducibility was observed for both raw intensity and thegenotypes/copy number variants. We also assessed consistencies betweendifferent SNP arrays and between genotype calling algorithms. We observedthat the inconsistency in genotypes was generally small at the specimenlevel. To further examine whether the differences from genotypingand genotype calling are possible sources of variation in GWAS results,an association analysis was applied to compare the associated SNPs.We observed that the inconsistency in genotypes not only propagated tothe association analysis, but was amplified in the associated SNPs. Ourstudies show that inconsistencies between SNP arrays and between genotypecalling algorithms are potential sources for the lack of reproducibilityin GWAS results.The Pharmacogenomics Journal (2010) 10, 364–374; doi:10.1038/tpj.2010.24;published online 6 April 2010
Keywords: repeatability; association; genotype; calling algorithm; intensity; copy number
Introduction
Genome-wide association studies (GWAS) aim to identify genetic variants acrossthe human genome that might be associated with phenotypic traits. Theflourishing of GWAS1–30 makes the technology a promising field of research.However, replication studies show that only a small portion of associated lociin the initial GWAS can be replicated, even within the same populations.For example, in replication studies of GWAS for type 2 diabetes mellitus, Zegginiet al.5 replicated associations for only 10 out of 77 SNP-based loci tested, Scottet al.6 10 out of 80, Easton et al.8 8 out of 57, and Steinthorsdottir et al.16 2 out of47. Moreover, lists of associated SNPs identified in different GWAS for a disease,such as type 2 diabetes mellitus, can be quite different. Though the differencesmight be explained by population structure, they might also be due to technicalbiases, or both.
Given the complexity of GWAS, multiple sources of Type I (false positive)and Type II (false negative) errors exist. GWAS are based on the common trait-common variant hypothesis, which implies that the genetic architecture ofcomplex traits consists of a number of common alleles, each conferring a smallincrease in risk to the individual.31 Therefore, the likelihood of detecting anindividual SNP association is usually small and requires a large sample size
The Pharmacogenomics Journal (2010) 10, 364–374& 2010 Macmillan Publishers Limited. All rights reserved 1470-269X/10
www.nature.com/tpj
to achieve adequate statistical power to detect true associa-tions. The selection of participants for GWAS is anadditional potential source of variability because of inaccu-rate participant ascertainment, biased selection of cases orcontrols, and population stratification. Case–control mis-classification can reduce study power and result in spuriousassociations.32 Non-genetic covariates (for example smok-ing33 and obesity3), when confounded with outcome, alsogenerate Type I errors. Population stratification inflates theType I error rate around variants that are informative aboutthe population substructure,34 but its influence is a matterof debate.35,36 Statistical tools have been developed tocorrect for population stratification34,37,38 and are nowincorporated into GWAS analyses. An emerging standardin GWAS analysis is to filter low-quality arrays and SNPsbefore statistical testing as genotyping errors, especially ifdistributed differentially between cases and controls, cangenerate spurious associations.39 Further complexitiesemerge because of the need for multiple testing corrections.Methods used in GWAS include Bonferroni correction, falsediscovery rate,40 and false positive report probability,41 all ofwhich have a different impact on evaluating the significanceof associations.
In addition, attention to accurate genotyping is needed.42
Efforts to detect, prevent, and eradicate sources of technicalerrors and biases in genotyping are important for improvingthe quality and gaining confidence in GWAS results. Thisstudy was designed to evaluate aspects of technical robust-ness of genotyping.
Accurate and reproducible genotype calls are paramount,as biases in genotypic measurements can lead to an inflationof false associations. Large variances in genotypic measure-ments diminish the accuracy of calls and may inflate theType II error rate. Different SNP array technologies exhibitdifferent biases and variance characteristics because of probeand protocol differences. In addition, within the sametechnology platform, there are different genotypic callingalgorithms developed and used. To our knowledge, thereare currently no thorough evaluations of the replicationconsistency (repeatability and reproducibility) betweengenotype calls obtained using different calling algorithmsor between different SNP arrays. Furthermore, it is importantto assess how differences in genotype calls (because oftechnical reasons: algorithm or array) impact the down-stream association analyses.
This study addresses several fundamental questions inGWAS: (1) Are current genotyping technologies robust?(2) Can consistent genotypes be obtained when differentSNP arrays are used? (3) What is the likelihood that differentcalling algorithms generate different calls given identicalraw intensity data? (4) Do differences in genotype callsimpact downstream association analysis and generatediscordant results?
To answer these questions, technical robustness wasassessed by genotyping six subjects four times usingAffymetrix Genome-Wide Human SNP 6.0 array (Affy6),the consistencies in the genotype calls between algorithmsDM,43 BLRMM,44 and Birdseed45 and between Affy6 and
Affymetrix GeneChip Human Mapping 500K array set(Affy500K) were examined using the 270 samples from theHapMap,46 and the impact on the association analyseswas evaluated.
Materials and methods
DNA samples
DNA samples for the three HapMap subjects (NA10385,NA12448, and NA12449, labeled as N10385, N12248, andN12249 in our study) are from a trio and were obtained fromthe HapMap consortium.
The NCTR DNA samples (labeled as N13, N59, and N8)are from three anonymous human liver specimens from theUS Cooperative Human Tissue Network that were usedfor human genomic DNA extraction, and these liver tissuesamples were confirmed by pathological analysis to beobtained from normal donors.
GenotypingFour replicates of the six DNA samples were genotyped usingAffy6 according to the standard protocol from Affymetrix.On a 96-well plate, DNA samples are placed in 24 wells. Eachwell contains 2.0–2.5 mg of DNA at a concentration ofB100 ng ml–1. The 24 DNA samples were placed in threecolumns of the 96-well plate (samples are randomized onthe plate, with their layout given in Supplementary Figure 7)for genotyping with Affy6.
HapMap data
The raw data (CEL files) for Affy500K for the 270 HapMapsamples were downloaded from the International HapMapproject website (http://www.hapmap.org/downloads/raw_data/affy500k/). The raw data (CEL files) from the Affy6 forthe 270 HapMap samples were obtained from Affymetrix.
Genotype calling and copy number variant callingThe quality of raw data was assessed using the programapt-geno-qc in the Affymetrix Power Tools (APT) beforegenotype calling. Genotype calling was conducted usingapt-probeset-genotype in APT. All the parameters were setto the default values recommended by Affymetrix. In earlierwork, we assessed calling batch effect and found thatuniform and large batch sizes with homogenous samplesshould be used to make genotype calls for GWAS.47 There-fore, for our genotyping data, all raw data of the 24 sampleswere called in one batch. For HapMap data of Affy500K,three batches were used to make genotype calls: each used90 samples from one of the three population groups.
Copy number variant (CNV) were called using theprogram apt-canary in the APT.
Comparing raw dataThe raw intensity data at probe level used for thecomparisons were extracted from the CEL files using theprogram apt-cel-extract in the APT. Thereafter, the pair-wisePearson’s correlation coefficients were calculated usingthe program corr in the statistical tool box for MatLab.
Assessing sources of inconsistencies in genotypesH Hong et al
365
The Pharmacogenomics Journal

Comparing CNV results
The CNV calling results were compared by calculating thepair-wise concordance between the samples using theformula:
Conci;j ¼1N
XNk¼1
nk;nk ¼1ðCNVi
k ¼ CNVjkÞ
0ðCNVik 6¼ CNV
jkÞ
(
where N indicates total CNV regions, CNVki is the copy
number called on CNV region k for sample i, and CNVkj is the
copy number called on CNV region k for sample j.
Comparing genotype calling results
The pair-wise concordances of genotypes between sampleswere calculated using the formula:
Conci;j ¼1N
XNk¼1
nk;nk ¼1ðGi
k ¼ GjkÞ
0ðGik 6¼ G
jkÞ
(
where N indicates total SNPs, Gki is the genotype called on
SNP k for sample i, and Gkj is the genotype called on SNP k for
sample j.
Association analysis
Before association analysis, quality control (QC) of thecalling results was conducted to remove SNPs and samples oflow quality using minor allele frequency, call rates perSNP and per sample, and testing for departure from Hardy–Weinberg equilibrium. In an association analysis, a 2�2contingency table (allelic association) and a 2�3 contin-gency table (genotypic association) were generated for eachSNP and tested for association using w2 test.
Statistical analysis
To evaluate statistical significance of the difference inmissing call rates between all pair-wise comparisons, pairedt-tests were performed to test the hypothesis that twomatched (or paired) samples/SNPs in the genotype callingresults x and y come from distributions with equal means.The difference between arrays or between calling algorithmsis assumed to come from a normal distribution withunknown variance. The significance level of a¼0.05 wasused in all of the tests.
Results
Robustness of genotyping
The experiment that assessed the robustness of genotypingused Affy6. DNA samples of three HapMap subjects andthree NCTR subjects were genotyped, each with fourreplicates. The Birdseed-v1 in APT (1.10.0) was used to makegenotype calls. CNV were determined using the apt-canaryprogram in APT. To assess reproducibility across laboratories,the raw data of the three HapMap subjects from Affymetrixwere included in our comparisons. The results are depictedin Figure 1 (data in Supplementary Table 1).
The QC scores of the 24 CEL files were in the range of88.6–98.3% (Supplementary Figure 1), similar to the Hap-Map data from Affymetrix (88.2–99.1%, SupplementaryFigure 5c) and compatible with Affymetrix guidelines,
indicating that data were of acceptable quality for thecomparative study.
The consistency of log2-scaled intensity data were exam-ined using Pearson’s correlation. Each pair-wise comparison
Figure 1 Genotyping robustness based on raw intensity, genotype,and CNV. The average Pearson’s correlation coefficients of log2-scaled
raw intensity are color coded in red, the average concordance
of genotypes in blue, and the average concordance of CNV in green.
The error bars represent the corresponding standard deviations. Thecircles of the most-left panel are the means (Rs) of correlation
coefficients or concordances of genotypes or CNV (Rs) between
technical replicates (BTR) within each of the six DNA samples, calculated
as Rs ¼ 1nðn�1Þ
Pni;j¼1
Rsi;j where, n¼4, iaj, s ¼ one of the six samples
(N10385, N12248, N12249, N13, N59, and N8, as shown from left to
right in the figure). The up-triangles of the second-left panel are themeans (Rs) of correlation coefficients or concordances of genotypes or
CNV (Rs) between our experimental data and the data from Affymetrix
(BEH) for each of the three HapMap samples that were calculated as
Rs ¼ 1n
Pni¼1
Rsi , where, n ¼ 4 and s¼one of the HapMap samples
(N10385, N12248, and N12249, from left to right). The diamonds of
the third-left panel are the means (R) of correlation coefficients or
concordances of genotypes or CNV (R) between parents (N12248 andN12249) and son (N10385) (BPS) that were calculated as
R ¼ 1nm
Pni¼1
Pmj¼1
Ri;j, where, n¼5 (four replicates from our experiment
and one from Affymetrix for N10385) and m¼10 (four replicates fromour experiment and one from Affymetrix for each of N12248 and
N12249). The down-triangles of the right panel are the means (R) of
correlation coefficients or concordances of genotypes or CNV (R)
between not-related samples (BNS) that were calculated as
R ¼ 1s1nmþ s2pqþ s3rt
ðXs1k¼1
Xn
i¼1
Xmj¼1
Rk;i;j þXs2k¼1
Xp
i¼1
Xq
j¼1Rk;i;j
þXs3k¼1
Xr
i¼1
Xt
j¼1Rk;i;jÞ
where when s1 ¼ 3 (3 NCTR samples), n¼4 (four replicates), and
m¼23 (all other samples); when s2¼1 (N10385), P¼5 (four replicates
from our experiment and one from Affymetrix), and P¼12 (3 NCTRsamples); and when s3¼2 (N12248 and N12249), r¼5, and t¼17
(all other samples except N10385).
Assessing sources of inconsistencies in genotypesH Hong et al
366
The Pharmacogenomics Journal
is summarized in Supplementary Figure 2. The averagecorrelation (Figure 1) between technical replicates (BTR) forfive subjects was 0.9514. One subject (N13) had noticeablylower average correlation (0.9231), with one of its replicatesdetermined to be an outlier (lower quality). For the HapMapsamples, the average correlation between experiments andAffymetrix data (BEH) was 0.9403, slightly lower than thevalue corresponding to BTR (0.9515). The average correla-tion between not-related samples (BNS) was much lower(0.7576). The average correlation between parent and son(BPS) was 0.8456.
Genotype concordances were calculated for all pair-wisecomparisons (Supplementary Figure 2) and averaged forBTR, BEH, BPS, and BNS (Figure 1). The average concordancefor BTR was 0.9886, excluding N13 (0.9799), indicating ahigh repeatability. The average concordance for BEH was0.9883, showing a high reproducibility across laboratories.As expected, the average concordance for BNS (0.6177) waslow, and for BPS (0.7290) moderate.
Except for one replicate of N13 with a significantly lowerheterozygous rate, the call rates and heterozygous rates werevery similar for comparisons between replicates and betweenthese experiments and Affymetrix data (Supplementary Figure3). The lower heterozygous rate for the replicate of N13 isconsistent with its lower average intensity correlation andgenotype concordance. After removal of this replicate, theaverage intensity correlation (0.9568) and genotype concor-dance (0.9899) for N13 were similar to the other subjects.
Technical robustness was also evaluated by calculatingCNV concordances for all pair-wise comparisons (Supple-mentary Figure 4), and averaging them for BTR, BEH, BPS,and BNS (Figure 1). The average concordance for BTR was0.9804, except for N13 (0.9414), indicating a reasonableCNV repeatability. For the HapMap samples, the averageconcordance for BEH was 0.9605, similar to the correspond-ing BTR (0.9784), showing reasonable robustness acrosslaboratories. As expected, the average concordance for BNS(0.8662) was low, and for BPS (0.8978) moderate.
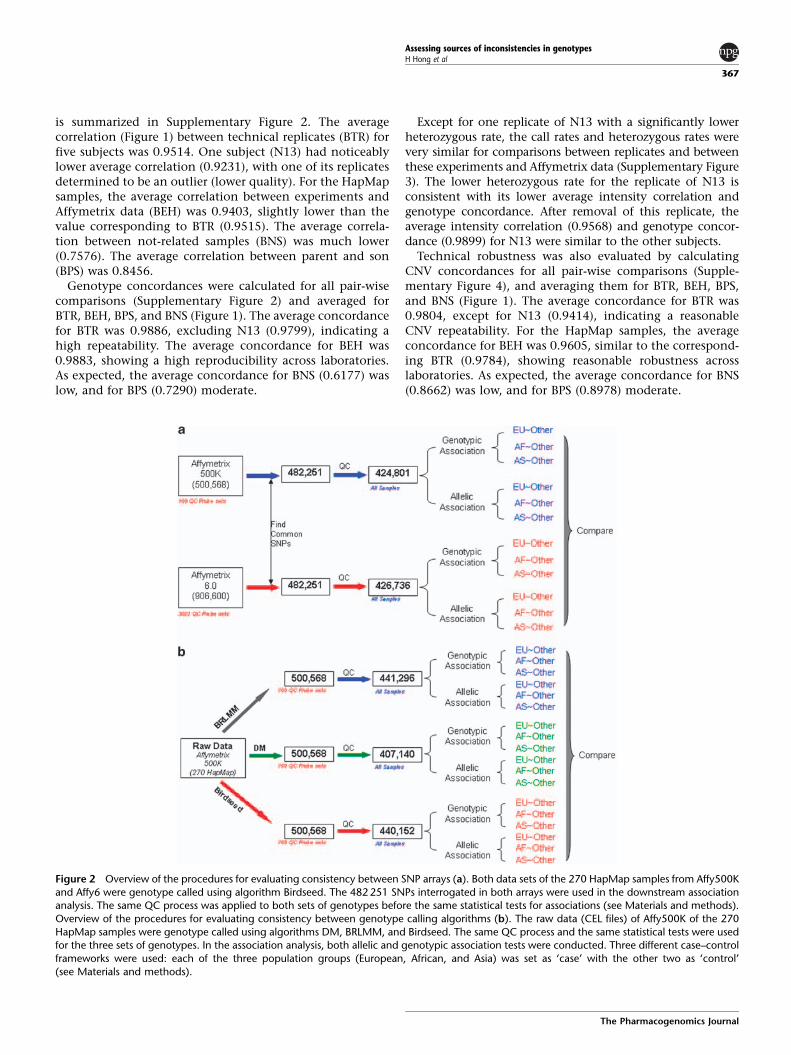
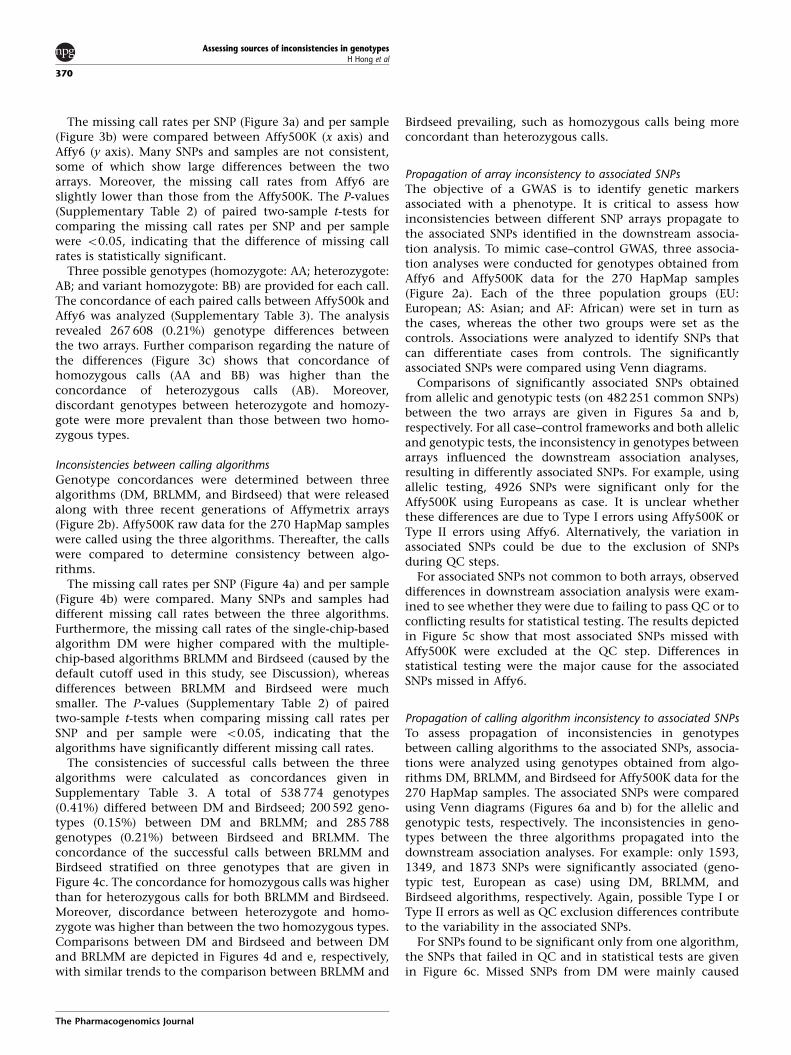
Figure 2 Overview of the procedures for evaluating consistency between SNP arrays (a). Both data sets of the 270 HapMap samples from Affy500K
and Affy6 were genotype called using algorithm Birdseed. The 482 251 SNPs interrogated in both arrays were used in the downstream associationanalysis. The same QC process was applied to both sets of genotypes before the same statistical tests for associations (see Materials and methods).
Overview of the procedures for evaluating consistency between genotype calling algorithms (b). The raw data (CEL files) of Affy500K of the 270
HapMap samples were genotype called using algorithms DM, BRLMM, and Birdseed. The same QC process and the same statistical tests were usedfor the three sets of genotypes. In the association analysis, both allelic and genotypic association tests were conducted. Three different case–control
frameworks were used: each of the three population groups (European, African, and Asia) was set as ‘case’ with the other two as ‘control’
(see Materials and methods).
Assessing sources of inconsistencies in genotypesH Hong et al
367
The Pharmacogenomics Journal
In spite of the apparent overall reproducibility, an outlierwas detected only after replicate measurements werecompleted. The outlier would have not otherwise beendetected, as the array met the guidelines for Affymetrixgenotyping array quality.
Inconsistencies between SNP arrays
To examine whether genotype calls from different SNParrays are consistent, genotypes of SNPs interrogated incommon in both Affy500K and Affy6 were compared usingthe 270 HapMap samples.46
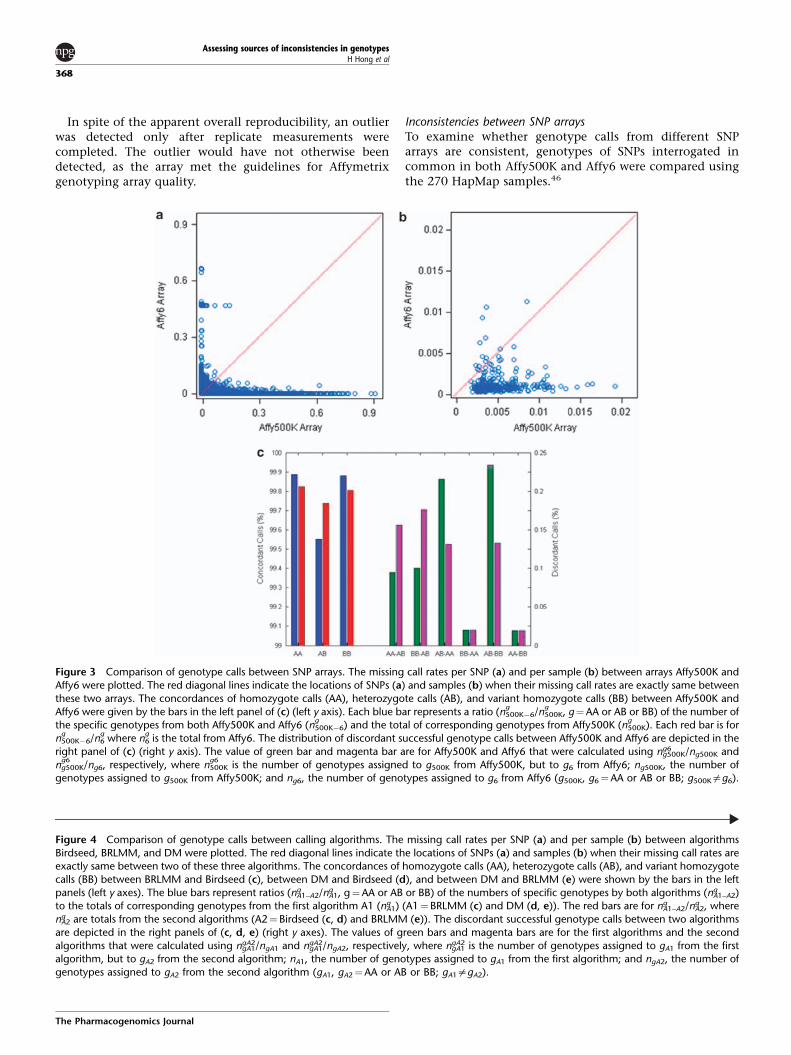
Figure 3 Comparison of genotype calls between SNP arrays. The missing call rates per SNP (a) and per sample (b) between arrays Affy500K and
Affy6 were plotted. The red diagonal lines indicate the locations of SNPs (a) and samples (b) when their missing call rates are exactly same between
these two arrays. The concordances of homozygote calls (AA), heterozygote calls (AB), and variant homozygote calls (BB) between Affy500K and
Affy6 were given by the bars in the left panel of (c) (left y axis). Each blue bar represents a ratio (n500K�6g
/n500Kg
, g¼AA or AB or BB) of the number ofthe specific genotypes from both Affy500K and Affy6 (n500K�6
g) and the total of corresponding genotypes from Affy500K (n500K
g). Each red bar is for
n500K�6g
/n6g
where n6g
is the total from Affy6. The distribution of discordant successful genotype calls between Affy500K and Affy6 are depicted in the
right panel of (c) (right y axis). The value of green bar and magenta bar are for Affy500K and Affy6 that were calculated using ng500Kg6 /ng500K and
ng500Kg6
/ng6, respectively, where n500Kg6
is the number of genotypes assigned to g500K from Affy500K, but to g6 from Affy6; ng500K, the number ofgenotypes assigned to g500K from Affy500K; and ng6, the number of genotypes assigned to g6 from Affy6 (g500K, g6¼AA or AB or BB; g500Kag6).
Figure 4 Comparison of genotype calls between calling algorithms. The missing call rates per SNP (a) and per sample (b) between algorithms
Birdseed, BRLMM, and DM were plotted. The red diagonal lines indicate the locations of SNPs (a) and samples (b) when their missing call rates areexactly same between two of these three algorithms. The concordances of homozygote calls (AA), heterozygote calls (AB), and variant homozygote
calls (BB) between BRLMM and Birdseed (c), between DM and Birdseed (d), and between DM and BRLMM (e) were shown by the bars in the left
panels (left y axes). The blue bars represent ratios (nA1–A2g /nA1
g , g¼AA or AB or BB) of the numbers of specific genotypes by both algorithms (nA1–A2g )
to the totals of corresponding genotypes from the first algorithm A1 (nA1g ) (A1¼BRLMM (c) and DM (d, e)). The red bars are for ng
A1–A2/nA2g , where
nA2g are totals from the second algorithms (A2¼Birdseed (c, d) and BRLMM (e)). The discordant successful genotype calls between two algorithms
are depicted in the right panels of (c, d, e) (right y axes). The values of green bars and magenta bars are for the first algorithms and the second
algorithms that were calculated using ngA1gA2/ngA1 and ngA1
gA2/ngA2, respectively, where ngA1gA2 is the number of genotypes assigned to gA1 from the first
algorithm, but to gA2 from the second algorithm; nA1, the number of genotypes assigned to gA1 from the first algorithm; and ngA2, the number of
genotypes assigned to gA2 from the second algorithm (gA1, gA2¼AA or AB or BB; gA1agA2).
Assessing sources of inconsistencies in genotypesH Hong et al
368
The Pharmacogenomics Journal
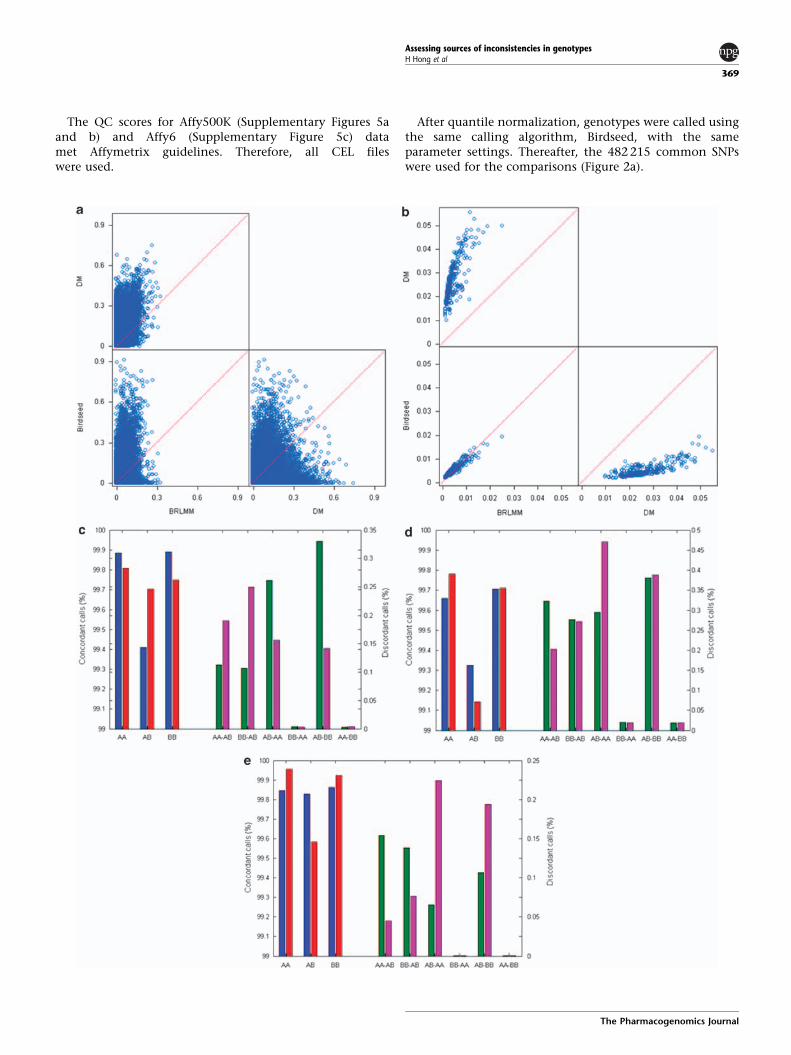
The QC scores for Affy500K (Supplementary Figures 5aand b) and Affy6 (Supplementary Figure 5c) datamet Affymetrix guidelines. Therefore, all CEL fileswere used.
After quantile normalization, genotypes were called usingthe same calling algorithm, Birdseed, with the sameparameter settings. Thereafter, the 482 215 common SNPswere used for the comparisons (Figure 2a).
Assessing sources of inconsistencies in genotypesH Hong et al
369
The Pharmacogenomics Journal
The missing call rates per SNP (Figure 3a) and per sample(Figure 3b) were compared between Affy500K (x axis) andAffy6 (y axis). Many SNPs and samples are not consistent,some of which show large differences between the twoarrays. Moreover, the missing call rates from Affy6 areslightly lower than those from the Affy500K. The P-values(Supplementary Table 2) of paired two-sample t-tests forcomparing the missing call rates per SNP and per samplewere o0.05, indicating that the difference of missing callrates is statistically significant.
Three possible genotypes (homozygote: AA; heterozygote:AB; and variant homozygote: BB) are provided for each call.The concordance of each paired calls between Affy500k andAffy6 was analyzed (Supplementary Table 3). The analysisrevealed 267 608 (0.21%) genotype differences betweenthe two arrays. Further comparison regarding the nature ofthe differences (Figure 3c) shows that concordance ofhomozygous calls (AA and BB) was higher than theconcordance of heterozygous calls (AB). Moreover,discordant genotypes between heterozygote and homozy-gote were more prevalent than those between two homo-zygous types.
Inconsistencies between calling algorithms
Genotype concordances were determined between threealgorithms (DM, BRLMM, and Birdseed) that were releasedalong with three recent generations of Affymetrix arrays(Figure 2b). Affy500K raw data for the 270 HapMap sampleswere called using the three algorithms. Thereafter, the callswere compared to determine consistency between algo-rithms.
The missing call rates per SNP (Figure 4a) and per sample(Figure 4b) were compared. Many SNPs and samples haddifferent missing call rates between the three algorithms.Furthermore, the missing call rates of the single-chip-basedalgorithm DM were higher compared with the multiple-chip-based algorithms BRLMM and Birdseed (caused by thedefault cutoff used in this study, see Discussion), whereasdifferences between BRLMM and Birdseed were muchsmaller. The P-values (Supplementary Table 2) of pairedtwo-sample t-tests when comparing missing call rates perSNP and per sample were o0.05, indicating that thealgorithms have significantly different missing call rates.
The consistencies of successful calls between the threealgorithms were calculated as concordances given inSupplementary Table 3. A total of 538 774 genotypes(0.41%) differed between DM and Birdseed; 200 592 geno-types (0.15%) between DM and BRLMM; and 285 788genotypes (0.21%) between Birdseed and BRLMM. Theconcordance of the successful calls between BRLMM andBirdseed stratified on three genotypes that are given inFigure 4c. The concordance for homozygous calls was higherthan for heterozygous calls for both BRLMM and Birdseed.Moreover, discordance between heterozygote and homo-zygote was higher than between the two homozygous types.Comparisons between DM and Birdseed and between DMand BRLMM are depicted in Figures 4d and e, respectively,with similar trends to the comparison between BRLMM and
Birdseed prevailing, such as homozygous calls being moreconcordant than heterozygous calls.
Propagation of array inconsistency to associated SNPs
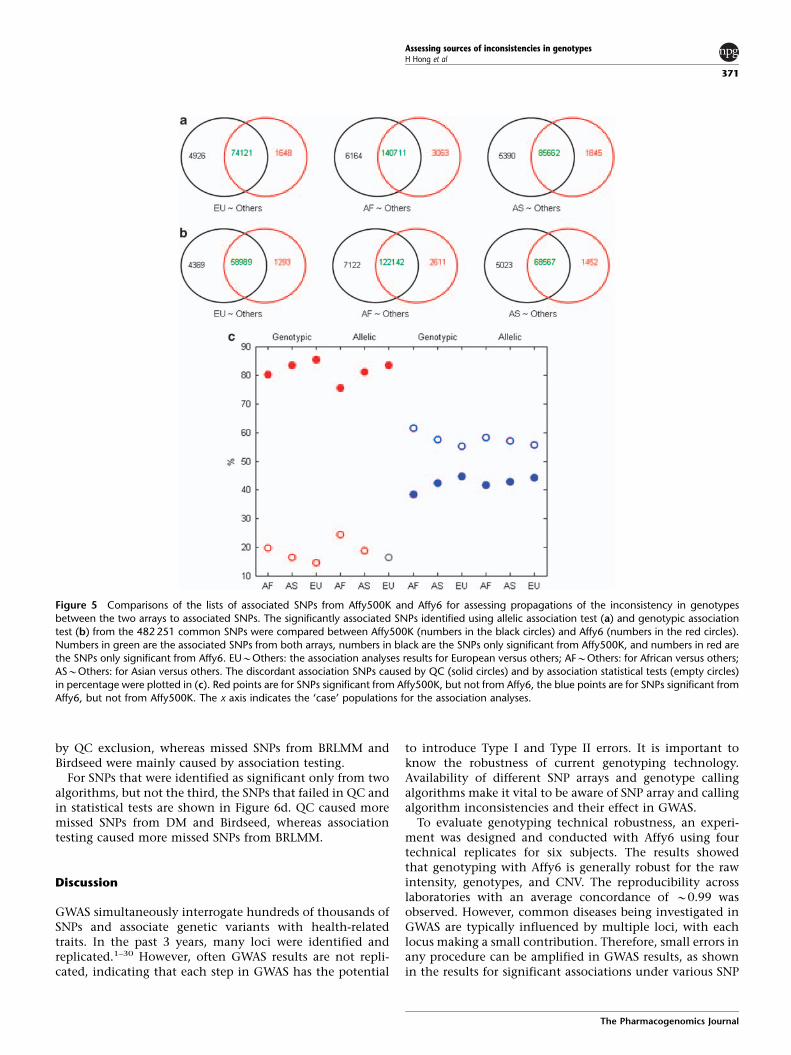
The objective of a GWAS is to identify genetic markersassociated with a phenotype. It is critical to assess howinconsistencies between different SNP arrays propagate tothe associated SNPs identified in the downstream associa-tion analysis. To mimic case–control GWAS, three associa-tion analyses were conducted for genotypes obtained fromAffy6 and Affy500K data for the 270 HapMap samples(Figure 2a). Each of the three population groups (EU:European; AS: Asian; and AF: African) were set in turn asthe cases, whereas the other two groups were set as thecontrols. Associations were analyzed to identify SNPs thatcan differentiate cases from controls. The significantlyassociated SNPs were compared using Venn diagrams.
Comparisons of significantly associated SNPs obtainedfrom allelic and genotypic tests (on 482 251 common SNPs)between the two arrays are given in Figures 5a and b,respectively. For all case–control frameworks and both allelicand genotypic tests, the inconsistency in genotypes betweenarrays influenced the downstream association analyses,resulting in differently associated SNPs. For example, usingallelic testing, 4926 SNPs were significant only for theAffy500K using Europeans as case. It is unclear whetherthese differences are due to Type I errors using Affy500K orType II errors using Affy6. Alternatively, the variation inassociated SNPs could be due to the exclusion of SNPsduring QC steps.
For associated SNPs not common to both arrays, observeddifferences in downstream association analysis were exam-ined to see whether they were due to failing to pass QC or toconflicting results for statistical testing. The results depictedin Figure 5c show that most associated SNPs missed withAffy500K were excluded at the QC step. Differences instatistical testing were the major cause for the associatedSNPs missed in Affy6.
Propagation of calling algorithm inconsistency to associated SNPs
To assess propagation of inconsistencies in genotypesbetween calling algorithms to the associated SNPs, associa-tions were analyzed using genotypes obtained from algo-rithms DM, BRLMM, and Birdseed for Affy500K data for the270 HapMap samples. The associated SNPs were comparedusing Venn diagrams (Figures 6a and b) for the allelic andgenotypic tests, respectively. The inconsistencies in geno-types between the three algorithms propagated into thedownstream association analyses. For example: only 1593,1349, and 1873 SNPs were significantly associated (geno-typic test, European as case) using DM, BRLMM, andBirdseed algorithms, respectively. Again, possible Type I orType II errors as well as QC exclusion differences contributeto the variability in the associated SNPs.
For SNPs found to be significant only from one algorithm,the SNPs that failed in QC and in statistical tests are givenin Figure 6c. Missed SNPs from DM were mainly caused
Assessing sources of inconsistencies in genotypesH Hong et al
370
The Pharmacogenomics Journal
by QC exclusion, whereas missed SNPs from BRLMM andBirdseed were mainly caused by association testing.
For SNPs that were identified as significant only from twoalgorithms, but not the third, the SNPs that failed in QC andin statistical tests are shown in Figure 6d. QC caused moremissed SNPs from DM and Birdseed, whereas associationtesting caused more missed SNPs from BRLMM.
Discussion
GWAS simultaneously interrogate hundreds of thousands ofSNPs and associate genetic variants with health-relatedtraits. In the past 3 years, many loci were identified andreplicated.1–30 However, often GWAS results are not repli-cated, indicating that each step in GWAS has the potential
to introduce Type I and Type II errors. It is important toknow the robustness of current genotyping technology.Availability of different SNP arrays and genotype callingalgorithms make it vital to be aware of SNP array and callingalgorithm inconsistencies and their effect in GWAS.
To evaluate genotyping technical robustness, an experi-ment was designed and conducted with Affy6 using fourtechnical replicates for six subjects. The results showedthat genotyping with Affy6 is generally robust for the rawintensity, genotypes, and CNV. The reproducibility acrosslaboratories with an average concordance of B0.99 wasobserved. However, common diseases being investigated inGWAS are typically influenced by multiple loci, with eachlocus making a small contribution. Therefore, small errors inany procedure can be amplified in GWAS results, as shownin the results for significant associations under various SNP
Figure 5 Comparisons of the lists of associated SNPs from Affy500K and Affy6 for assessing propagations of the inconsistency in genotypes
between the two arrays to associated SNPs. The significantly associated SNPs identified using allelic association test (a) and genotypic association
test (b) from the 482 251 common SNPs were compared between Affy500K (numbers in the black circles) and Affy6 (numbers in the red circles).
Numbers in green are the associated SNPs from both arrays, numbers in black are the SNPs only significant from Affy500K, and numbers in red arethe SNPs only significant from Affy6. EUBOthers: the association analyses results for European versus others; AFBOthers: for African versus others;
ASBOthers: for Asian versus others. The discordant association SNPs caused by QC (solid circles) and by association statistical tests (empty circles)
in percentage were plotted in (c). Red points are for SNPs significant from Affy500K, but not from Affy6, the blue points are for SNPs significant from
Affy6, but not from Affy500K. The x axis indicates the ‘case’ populations for the association analyses.
Assessing sources of inconsistencies in genotypesH Hong et al
371
The Pharmacogenomics Journal

arrays and genotype calling algorithms. The potential forerrors caused by small technical fluctuations of genotypingsuggests that technical replicates can increase the reliabilityof GWAS findings. Furthermore, using technical replicateshelps remove low-quality arrays as shown in this study. If notechnical replicates were used, one replicate of N13 wouldnot be identified as problematic because its QC looksreasonable. But when comparing with the other threetechnical replicates, it is obvious that all measures (intensitycorrelation, concordances of genotypes and CNV, hetero-zygous rate) show that the data from this array causesproblems in genotyping.
This study showed that genotype inconsistency propa-gates to GWAS results. Sources of errors introduced intogenotypes such as experimental design, the type of SNParray, and the genotype calling algorithm have the potentialto generate inconsistent associated SNPs, and hence Type Iand Type II errors. Furthermore, it was observed thatgenotype inconsistency not only propagated to the down-stream association analysis, but was amplified in theassociated SNPs (Supplementary Figure 6).
There were many SNPs (B15%) identified as significantfrom BRLMM and Birdseed, but not from DM (Supplemen-tary Figures 6b and 6c). Most of those SNPs had low call rates
Figure 6 Comparisons of the lists of associated SNPs between calling algorithms DM, BRLMM, and Birdseed for assessing propagations of the
inconsistence in genotypes to association SNPs. The significantly associated SNPs identified using allelic association test (a) and genotypic
association test (b) were compared between algorithms DM (numbers in the black circles), BRLMM (numbers in the blue circles), and Birdseed
(numbers in the red circles). Numbers in brown represent the associated SNPs shared by all three algorithms, numbers in green represent theassociated SNPs shared by only two algorithms, and the numbers in other colors are the associated SNPs identified by only the corresponding
algorithms. EUBOthers: the association analyses results for European versus others; AFBOthers: for African versus others; ASBOthers: for Asian
versus others. The discordant associated SNPs (missed from DM: black; BRLMM: red; Birdseed: blue) caused by QC (solid shapes) and by associationstatistical tests (empty shapes) in percentage were plotted in (c) (SNPs were significant from one algorithm, but not significant from the other two
algorithms) and (d) (SNPs were significant from two algorithms, but not significant from the other one algorithm). The x axis indicates the ‘case’
populations for the association analyses.
Assessing sources of inconsistencies in genotypesH Hong et al
372
The Pharmacogenomics Journal

and were filtered in the QC process and not tested forassociations. If a less stringent cutoff was used in DM, itcould be expected that some of those SNPs would pass thesame QC criterion and the missing rate of associated SNPsfrom DM would be decreased, but could not be completelyeliminated, evidenced by the comparison between BRLMMand Birdseed in which discordant rates of associated SNPswere about three times of the discordant rate of genotypesbetween the two algorithms (Supplementary Figure 6d).
Genotype discordance was found in both missing callsand successful calls. Our study showed that the propagationof discordant genotypes to the associated SNPs wascaused by both sources of discordance (Figures 5 and 6).Our observations suggest that there is room for improve-ments on both call rate and accuracy of calling algorithms.There is a tradeoff in the source of discordance dependingon the chosen cutoff for calling a missing.
An interesting observation was that more associated SNPswere identified in the model using African as case (Figures 5and 6). In the HapMap samples, it is well known that theYoruban is more genetically distinct than the Asian andEuropean. However, discordant rates of associated SNPs forthe African model were lower than Asian and Europeanmodels (Figure 6). Therefore, discordance in genotypesmight be amplified more in the associated SNPs for weakertraits than for stronger traits. Comparing with the popula-tion differences of the HapMap samples used in our study,traits of current GWAS are usually much weaker, and asmaller number of concordant associated SNPs are expected.
Conflict of interest
The authors declare no conflict of interest.
Acknowledgments
HH thanks Dr Williams Slikker for his support on this researchproject. LX thanks NCTR-US FDA for providing the ORISEpostdoctoral research fellowship to participate in the project.
References
1 Klein RJ, Zeiss C, Chew EY, Tsai JY, Sackler RS, Haynes C et al.Complement factor H polymorphism in age-related macular degenera-tion. Science 2003; 308: 385–389.
2 Duerr RH, Taylor KD, Brant SR, Rioux JD, Silverberg MS, Daly MJ et al.A genome-wide association study identifies IL23R as an inflammatorybowel disease gene. Science 2006; 314: 1461–1463.
3 Frayling TM, Timpson NJ, Weedon MN, Zeggini E, Freathy RM,Lindgren CM et al. A common variant in the FTO gene is associatedwith body mass index and predisposes to childhood and adult obesity.Science 2007; 316: 889–894.
4 Saxena R, Voight BF, Lyssenko V, Burtt NP, de Bakker PI, Chen H et al.Genome-wide association analysis identifies loci for type 2 diabetesand triglyceride level. Science 2007; 316: 1331–1336.
5 Zeggini E, Weedon MN, Lindgren CM, Frayling TM, Elliott KS, Lango Het al. Replication of genome-wide association signals in UK samplesreveals risk loci for type 2 diabetes. Science 2007; 316: 1336–1341.
6 Scott LJ, Mohlke KL, Bonnycastle LL, Willer CJ, Li Y, Duren WL et al.A genome-wide association study of type 2 diabetes in Finns detectsmultiple susceptibility variants. Science 2007; 316: 1341–1345.
7 Sladek R, Rocheleau G, Rung J, Dina C, Shen L, Serre D et al. A genome-wide association study identifies novel risk loci for type 2 diabetes.Nature 2007; 445: 881–885.
8 Easton DF, Pooley KA, Dunning AM, Pharoah PDP, Thompson J,Ballinger DG et al. Genome-wide association study identifies novelbreast cancer susceptibility loci. Nature 2007; 447: 1087–1093.
9 Wellcome Trust Case Control Consortium. Genome-wide associationstudy of 14 000 cases of seven common diseases and 3,000 sharedcontrols. Nature 2007; 447: 661–678.
10 Raelson JV, Little RD, Ruether A, Fournier H, Paquin B, Eerdewegh PVet al. Genome-wide association study for Crohn’s disease in the QuebecFounder Population identifies multiple validated disease loci. Proc NatlAcad Sci USA 2007; 104: 14747–14752.
11 Smyth DJ, Cooper JD, Bailey R, Field S, Burren O, Smink LJ et al.A genome-wide association study of nonsynonymous SNPs identifies atype 1 diabetes locus in the interferon-induced helicase (IFIH1) region.Nat Genet 2006; 38: 617–619.
12 Hampe J, Franke A, Rosenstiel P, Till A, Teuber M, Huse K et al.A genome-wide association scan of nonsynonymous SNPs identifies asusceptibility variant for Crohn disease in ATG16L1. Nat Genet 2007;39: 207–211.
13 Rioux JD, Xavier RJ, Taylor KD, Silverberg MS, Goyette P, Huett A et al.Genome-wide association study identifies new susceptibility locifor Crohn disease and implicates autophagy in disease pathogenesis.Nat Genet 2007; 39: 596–604.
14 Gudmundsson J, Sulem P, Manolescu A, Amundadottir LT, Gudbjarts-son D, Helgason A et al. Genome-wide association study identifies asecond breast cancer susceptibility variant at 8q24. Nat Genet 2007; 39:631–637.
15 Yeager M, Orr N, Hayes RB, Jacobs KB, Kraft P, Wacholder S et al.Genome-wide association study of breast cancer identifies a second risklocus at 8q24. Nat Genet 2007; 39: 645–649.
16 Steinthorsdottir V, Thorleifsson G, Reynisdottir I, Benediktsson R,Jonsdottir T, Walters GB et al. A variant in CDKAL1 influences insulinresponse and risk of type 2 diabetes. Nat Genet 2007; 39: 770–775.
17 van Heel DA, Franke L, Hunt KA, Gwilliam R, Zhernakova A, Inouye Met al. A genome-wide association study for celiac disease identifies riskvariants in the region harbouring IL2 and IL21. Nat Genet 2007; 39:827–829.
18 Todd JA, Walker NM, Cooper JD, Smyth DJ, Downes K, Plagnol V et al.Robust associations of four new chromosome regions from genome-wide analysis of type 1 diabetes. Nat Genet 2007; 39: 857–864.
19 Hunter DJ, Kraft P, Jacobs KB, Cox DG, Yeager M, Hankinson SE et al.Genome-wide association study identifies alleles in FGFR2 associatedwith risk of sporadic postmenopausal breast cancer. Nat Genet 2007;39: 870–874.
20 Tomlinson I, Webb E, Carvajal-Carmona L, Broderick P, Kemp Z, Spain Set al. A genome-wide association scan of tag SNPs identifies asusceptibility variant for colorectal cancer at 8q24.21. Nat Genet2007; 39: 984–988.
21 Zanke BW, Greenwood CM, Rangrej J, Kustra R, Tenesa A, FarringtonSM et al. Genome-wide association scan identifies a colorectal cancersusceptibility locus on chromosome 8q24. Nat Genet 2007; 39: 989–994.
22 Buch S, Schafmayer C, Volzke H, Becker C, Franke A, von Eller-EbersteinH et al. A genome-wide association scan identifies the hepaticcholesterol transporter ABCG8 as a susceptibility factor for humangallstone disease. Nat Genet 2007; 39: 995–999.
23 Winkelmann J, Schormair B, Lichtner P, Ripke S, Xiong L, Jalilzadeh Set al. Genome-wide association study of restless legs syndromeidentifies common variants in three genomic regions. Nat Genet2007; 39: 1000–1006.
24 Grupe A, Abraham R, Li Y, Rowland C, Hollingworth P, Morgan A et al.Evidence for novel susceptibility genes for late-onset Alzheimer’s diseasefrom a genome-wide association study of putative functional variants.Hum Mol Genet 2007; 16: 865–873.
25 Cargill M, Schrodi SJ, Chang M, Garcia VE, Brandon R, Callis KP et al.A large-scale genetic association study confirms IL12B and leads to theidentification of IL23R as psoriasis-risk genes. Am J Hum Genet 2007; 80:273–290.
26 Arking DE, Cutler DJ, Brune CW, Teslovich TM, West K, Ikeda M et al.A common genetic variant in the neurexin superfamily member
Assessing sources of inconsistencies in genotypesH Hong et al
373
The Pharmacogenomics Journal
CNTNAP2 increases familial risk of autism. Am J Hum Genet 2008; 82:160–164.
27 Kayser M, Liu F, Janssens AC, Rivadeneira F, Lao O, van Duijn K et al.Three genome-wide association studies and a linkage analysis identifyHERC2 as a human iris color gene. Am J Hum Genet 2008; 82: 411–423.
28 Yang HH, Hu N, Taylor PR, Lee MP. Whole genome-wide associationstudy using Affymetrix SNP Chip: a two-stage sequential selectionmethod to identify genes that increase the risk of developing complexdiseases. Methods Mol Med 2008; 141: 23–35.
29 Gold B, Kirchhoff T, Stefanov S, Lautenberger J, Viale A, Garber J et al.A genome-wide association study provides evidence for a breast cancerrisk at 6q22.33. Proc Natl Acad Sci USA 2008; 105: 4340–4345.
30 Uda M, Galanello R, Sanna S, Lettre G, Sankaran VG, Chen W et al.Genome-wide association study shows BCL11A associated withpersistent fetal hemoglobin and amelioration of the phenotype ofb-thalassemia. Proc Natl Acad Sci USA 2008; 105: 1620–1625.
31 Reich DE, Lander ES. On the allelic spectrum of human disease. TrendsGenet 2001; 17: 502–510.
32 Pearson TA, Manolio TA. How to interpret a genome-wide associationstudy. J Am Med Assoc 2008; 82: 411–423.
33 Dewan A, Liu M, Hartman S, Zhang SS, Liu DT, Zhao C et al. HTRA1promoter polymorphism in wet age-related macular degeneration.Science 2006; 314: 989–992.
34 Price AL, Patterson NJ, Plenge RM, Weinblatt ME, Shadick NA, Reich D.Principal component analysis corrects for stratification in genome-wideassociation studies. Nat Genet 2006; 38: 904–909.
35 Thomas DC, Witte JS. Point: population stratification: a problem forcase-control studies of candidate-gene associations? Cancer EpidemiolBiomarkers Prev 2002; 11: 505–512.
36 Wacholder S, Rothman N, Caporaso N. Counterpoint: bias frompopulation stratification is not a major threat to the validity ofconclusions from epidemiological studies of common polymorphismsand caner. Cancer Epidemiol Biomarkers Prev 2002; 11: 513–520.
37 Cardon LR, Palmer LJ. Population stratification and spurious allelicassociation. Lancet 2003; 36: 598–604.
38 Zheng G, Freidlin B, Gastwirth JL. Robust genomic control forassociation studies. Am J Hum Genet 2006; 78: 350–356.
39 Moskvina V, Craddock N, Holmans P, Owen MJ, O’Donovan MC. Effectsof differential genotyping error rate on the type 1 error probabilityof case-control studies. Hum Hered 2006; 61: 55–64.
40 Benjamini Y, Hochberg Y. Controlling the false discovery rate: apractical and powerful approach to multiple testing. J R Statist Soc B1995; 57: 289–300.
41 Wacholder S, Chanock S, Garcia-Closas M, El Ghormli L, Rothman N.Assessing the probability that a positive report is false: an approach formolecular epidemiology studies. J Natl Cancer Inst 2004; 96: 434–442.
42 McCarthy MI, Abecasis GR, Cardon LR, Goldstein DB, Little J, IoannidisJP et al. Genome-wide association studies for complex traits: consensus,uncertainty and challenges. Nat Rev 2008; 9: 356–369.
43 Di X, Matsuzaki H, Webster TA, Hubbell E, Liu G, Dong S et al. Dynamicmodel based algorithms for screening and genotyping over 100K SNPson oligonucleotide microarrays. Bioinformtics 2005; 21: 1958–1963.
44 See the white paper on BRLMM of Affymetrix: http://www.affymetrix.com/support/technical/whitepapers/brlmm_whitepaper.pdf.
45 http://www.affymetrix.com/products/software/specific/birdseed_algorithm.affx.
46 The International HapMap Consortium. A second generation humanhaplotype map of over 3.1 million SNPs. Nature 2007; 449: 851–862.
47 Hong H, Su Z, Ge W, Shi L, Perkins R, Fang H et al. Assessing batcheffects of genotype calling algorithm BRLMM for the AffymetrixGeneChip Human Mapping 500K Array Set using 270 HapMapsamples. BMC Bioinformatics 2008; 9: S17.
This work is licensed under the CreativeCommons Attribution-NonCommercial-
Share Alike 3.0 License. To view a copy of this license,visit http://creativecommons.org/licenses/by-nc-sa/3.0/
Supplementary Information accompanies the paper on the The Pharmacogenomics Journal website (http://www.nature.com/tpj)
Assessing sources of inconsistencies in genotypesH Hong et al
374
The Pharmacogenomics Journal
Top Related
Copyright © 2022 FDOKUMEN

