


Bahasa
Halaman
Hukum

. . . Published ahead of Print
Assessing Sedentary Behavior with the GENEActiv:Introducing the Sedentary Sphere
Alex V. Rowlands1,2, Tim S. Olds1, Melvyn Hillsdon3, Richard Pulsford3, Tina L. Hurst4,Roger G. Eston2,3, Sjaan R. Gomersall5, Kylie Johnston6, and Joss Langford4
1Health and Use of Time (HUT) Group, Sansom Institute for Health Research, University of South Australia, Adelaide, Australia; 2Exercise for Health and Human Performance Group,
Sansom Institute for Health Research, University of South Australia, Adelaide, Australia; 3Sport and Health Sciences, College of Life and Environmental Sciences, University of Exeter, United
Kingdom; 4GENEActiv, ActivInsights, Cambs, United Kingdom; 5Centre for Research on Exercise, Physical Activity and Health, School of Human Movement Studies, The University of
Queensland, Brisbane, Australia; 6International Centre for Allied Health Evidence, Sansom Institute for Health Research, University of South Australia, Adelaide, Australia
Accepted for Publication: 14 November 2013
Medicine & Science in Sports & Exercise® Published ahead of Print contains articles in unedited manuscript form that have been peer reviewed and accepted for publication. This manuscript will undergo copyediting, page composition, and review of the resulting proof before it is published in its final form. Please note that during the production process errors may be discovered that could affect the content.
Copyright © 2013 American College of Sports Medicine
ACCEPTED
Assessing Sedentary Behavior with the GENEActiv: Introducing the
Sedentary Sphere
Alex V. Rowlands1,2, Tim S. Olds1, Melvyn Hillsdon3, Richard Pulsford3, Tina L. Hurst4, Roger
G. Eston2,3, Sjaan R. Gomersall5, Kylie Johnston6, and Joss Langford4
1Health and Use of Time (HUT) Group, Sansom Institute for Health Research, University of
South Australia, Adelaide, Australia; 2Exercise for Health and Human Performance Group,
Sansom Institute for Health Research, University of South Australia, Adelaide, Australia; 3Sport
and Health Sciences, College of Life and Environmental Sciences, University of Exeter, United
Kingdom; 4GENEActiv, ActivInsights, Cambs, United Kingdom; 5Centre for Research on Exer-
cise, Physical Activity and Health, School of Human Movement Studies, The University of
Queensland, Brisbane, Australia; 6International Centre for Allied Health Evidence, Sansom Insti-
tute for Health Research, University of South Australia, Adelaide, Australia
Conflicts of Interest and Source of Funding: Tina Hurst and Joss Langford are employed by
Activinsights, the manufacturer of the GENEActiv. There are no other conflicts of interest. Hos-
pital in-patient data were part of a larger study funded jointly by the University of South Aus-
tralia (Health Sciences Divisional Research Development Grant) and the Royal Adelaide Hospit-
al Clinical Research Fund.
Running title: Introducing the Sedentary Sphere
Medicine & Science in Sports & Exercise, Publish Ahead of PrintDOI: 10.1249/MSS.0000000000000224
ACCEPTED
Copyright © 2013 by the American College of Sports Medicine. Unauthorized reproduction of this article is prohibited.

Corresponding author:
Dr Alex Rowlands
Senior Research Fellow
School of Health Sciences,
University of South Australia
GPO Box 2471
Adelaide, SA 5001
Australia
Tel: +61 (0) 8830 21207
Fax: +61 (0) 8830 22853
Email: [email protected]
ACCEPTED
Copyright © 2013 by the American College of Sports Medicine. Unauthorized reproduction of this article is prohibited.
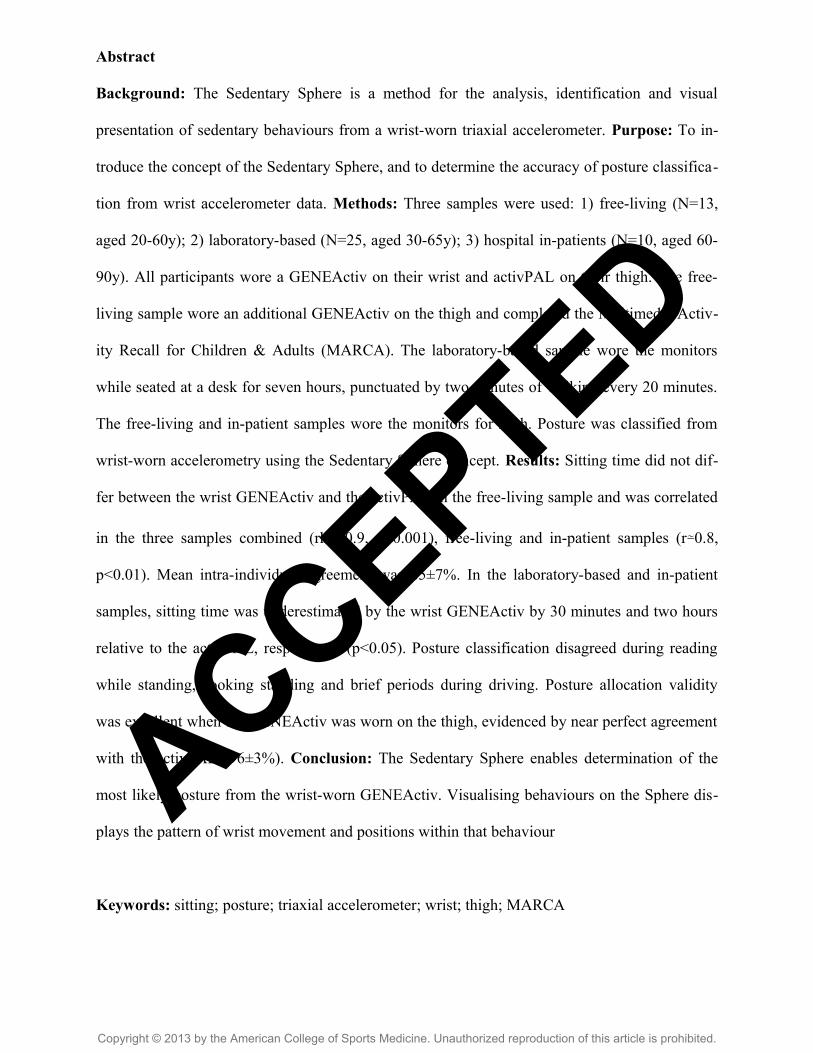
Abstract
Background: The Sedentary Sphere is a method for the analysis, identification and visual
presentation of sedentary behaviours from a wrist-worn triaxial accelerometer. Purpose: To in-
troduce the concept of the Sedentary Sphere, and to determine the accuracy of posture classifica-
tion from wrist accelerometer data. Methods: Three samples were used: 1) free-living (N=13,
aged 20-60y); 2) laboratory-based (N=25, aged 30-65y); 3) hospital in-patients (N=10, aged 60-
90y). All participants wore a GENEActiv on their wrist and activPAL on their thigh. The free-
living sample wore an additional GENEActiv on the thigh and completed the Multimedia Activ-
ity Recall for Children & Adults (MARCA). The laboratory-based sample wore the monitors
while seated at a desk for seven hours, punctuated by two minutes of walking every 20 minutes.
The free-living and in-patient samples wore the monitors for 24 h. Posture was classified from
wrist-worn accelerometry using the Sedentary Sphere concept. Results: Sitting time did not dif-
fer between the wrist GENEActiv and the activPAL in the free-living sample and was correlated
in the three samples combined (rho=0.9, p<0.001), free-living and in-patient samples (r≃0.8,
p<0.01). Mean intra-individual agreement was 85±7%. In the laboratory-based and in-patient
samples, sitting time was underestimated by the wrist GENEActiv by 30 minutes and two hours
relative to the activPAL, respectively (p<0.05). Posture classification disagreed during reading
while standing, cooking standing and brief periods during driving. Posture allocation validity
was excellent when the GENEActiv was worn on the thigh, evidenced by near perfect agreement
with the activPAL (96±3%). Conclusion: The Sedentary Sphere enables determination of the
most likely posture from the wrist-worn GENEActiv. Visualising behaviours on the Sphere dis-
plays the pattern of wrist movement and positions within that behaviour
Keywords: sitting; posture; triaxial accelerometer; wrist; thigh; MARCA
ACCEPTED
Copyright © 2013 by the American College of Sports Medicine. Unauthorized reproduction of this article is prohibited.
Introduction
The majority of most people’s day is spent sedentary, with the proportion of time spent sedentary
increasing as people age (22). This sedentary time has been associated with negative health out-
comes that are not compensated for by the relatively small proportion of time (approximately
5%, 29) that most adults spend in moderate-to-vigorous physical activity (MVPA) (9). However,
time spent sedentary is strongly inversely related to time accumulated in light intensity activity
and it is proposed that the impact of this light intensity activity as a biological stimulus for better
health has been underestimated (9).
The associations between sedentary time and negative health outcomes have led to an increased
interest in accurately assessing sedentary time and, in particular, differentiating it from light in-
tensity activity. Sedentary behaviours are characterised by posture (sitting or reclining) and low
energy expenditure (1-1.5 multiples of resting metabolic rate) (24). Thus, in order to measure
sedentary behaviour, it is necessary to be able to classify posture in addition to estimating energy
expenditure. Accelerometers have been used to estimate sedentary time (e.g. 22), but these clas-
sifications are based on minimal or no movement and thus do not address the posture specifica-
tion. The activPAL inclinometer is worn on the thigh and has become the measurement tool of
choice for sedentary behaviour as it has been shown to be a valid and reliable measure of posture
allocation (sit/lie or stand), sit-to-stand transitions and stepping (15, 21).
When assessing activity patterns, it is often recommended that a monitor be worn for seven days
(23). Compliance in large samples has been poor for hip-worn accelerometers. For example, in
the 2003-2006 US National Health and Nutrition Health Examination Survey (NHANES) only
40-70% of participants (compliance varied by age-group) wore an accelerometer at the hip for 10
h·d-1 for 6 days (12). The current NHANES has moved to using wrist-worn accelerometers in an
effort to increase compliance. Early reports show much better compliance, with 70-80% of parti-
ACCEPTED
Copyright © 2013 by the American College of Sports Medicine. Unauthorized reproduction of this article is prohibited.
cipants wearing the monitors for 21-22 h·d-1 for 6 days (12). Low compliance and decision rules
regarding wear time lead to selection bias and misclassification that disproportionately affect the
precision of estimates of sedentary behaviour and light intensity activity (26). There is further
bias evident in the estimation of sedentary time depending on the time of day that the monitor is
worn (26). This is very pertinent as most studies simply require that a person wear a monitor for
a given amount of time per day, and do not specify when that wear should occur. In short, it does
not matter if a monitor is 100% accurate if people will not wear them for a sufficient time period,
or if bias is introduced due to the characteristics of people who will comply with monitor wear
periods. Further, when sedentary behaviour is the outcome of interest, that wear period should
ideally be 24 h a day. Wrist-worn monitors lead to high compliance (12), thus it is preferable that
a tool for assessing sedentary behaviour and physical activity be worn on the wrist. The GENE-
Activ is a wrist-worn accelerometer that has been shown to be valid and reliable for assessment
of activity intensity (10, 25) and activity type (32, 33), but has not previously been used to classi-
fy sedentary behaviour as defined by posture.
Recently, GENEActiv developed a novel method for the analysis, identification and visual
presentation of data from the wrist-worn GENEActiv – the Sedentary Sphere. When a person is
inactive, gravity provides the primary signal to the wrist-worn monitor. Since the GENEActiv
uses a tri-axial accelerometer, data collected when inactive can be plotted on the surface of a
sphere of radius 1g (9.8 m/s2) with the location on the sphere determined by the wrist and arm
orientation (Figure 1, upper panel). The spatial and temporal distribution of the clusters on the
Sedentary Sphere during specific behaviours provides a method for exploration into classifica-
tion of different types of behaviour. Our application of the Sedentary Sphere for posture classi-
fication follows a very simple premise based on arm elevation. This method involves assump-
tions relating to the most likely posture for a given arm elevation and there will clearly be times
ACCEPTED
Copyright © 2013 by the American College of Sports Medicine. Unauthorized reproduction of this article is prohibited.
when misclassification occurs. The extent of misclassification will likely depend on the popula-
tion under consideration and, depending on the research question and/or population, may be par-
tially compensated for, or outweighed by, the reduced bias due to the increased compliance and
high wear-times possible with a wrist-worn monitor. The GENEActiv can also be worn at the
thigh and posture classified as ‘stand’, ‘lying side’, ‘lying front’ or ‘sitting/lying back’ based on
the relative values of the x, y and z vectors. This provides an alternative method, using the same
tool, for when a higher accuracy of classification of posture is required.
Thus, we aimed to determine whether we could use the Sedentary Sphere to determine posture
(sit/lie or stand) from a wrist-worn accelerometer in three distinct scenarios and to explore the
visual presentation of behaviours on the Sedentary Sphere. We also explored the accuracy of
posture classification from the GENEActiv worn on the thigh.
Methods
We explored the use of the Sedentary Sphere to determine posture in three distinct samples: 1)
free-living; 2) laboratory-based and; 3) hospital in-patient. The free-living sample enabled us to
capture the diverse range of naturally occurring behaviours as and when they happened. The act-
ivPAL was the criterion for posture allocation and use of time was recalled for the entire period
so we had information about what participants did and when. The laboratory-based sample en-
abled the observation of participants during a sitting/walking protocol so their posture allocation
was known at any given time. The agreement attained in this setting provided a comparator for
the agreement attained when the activPAL was used as the criterion without an observation back
up as in the other two samples. The in-patient sample enabled us to test the Sedentary Sphere in a
specific very sedentary context.
ACCEPTED
Copyright © 2013 by the American College of Sports Medicine. Unauthorized reproduction of this article is prohibited.
Sample 1 – free-living
A convenience sample of 13 adults aged 20-60 y (male, N = 8) was recruited from the local area
in Adelaide (South Australia). The University of South Australia Human Research Ethics Com-
mittee granted approval and all participants gave written informed consent.
Height and mass were measured to the nearest 0.1 cm and 0.1 kg, respectively. Each participant
wore a GENEActiv on their non-dominant wrist (left, N=12). An activPAL and GENEActiv
monitor (without straps) were placed together in a waterproof finger-cot, which was secured to
the participant’s right thigh (mid-anterior) using porous hypoallergenic tape. All monitors were
worn continuously for 1-2 days and programmed to collect data for a 24 h period from midnight
to midnight. On the day following accelerometer monitoring participants completed the adult
version of the Multimedia Activity Recall for Children & Adults (MARCA, 13), a computerised
use of time instrument, for the 24 h period of monitor wear.
Sample 2 – laboratory-based
Twenty-five male participants, aged 30-65 y, were recruited from an existing research volunteer
database ‘Exeter Ten-thousand’ (Extend) held by the Clinical Research Facility in Exeter Lab
(UK). Ethics approval was granted by the University of Exeter Research Ethics Committee (ap-
proval number 2013/410) and all participants gave written informed consent. These data were
taken from a larger study investigating the effect of a full day of uninterrupted sitting and inter-
rupted sitting trials on the plasma glucose and insulin responses to both an oral glucose tolerance
test and a mixed test meal.
Height and mass were measured to the nearest 0.1 cm and 0.1 kg, respectively. Each participant
wore a GENEActiv accelerometer on their left wrist and an activPAL on their right thigh (mid-
ACCEPTED
Copyright © 2013 by the American College of Sports Medicine. Unauthorized reproduction of this article is prohibited.
anterior, attached using adhesive strips). Both monitors were worn and programmed to collect
data for the seven hour duration of the trial.
Between 10.00 am and 5.00 pm participants were seated quietly at a desk where they were al-
lowed to work at the computer, watch DVDs, listen to music or read. Newspapers and a com-
puter with a DVD player and internet access were provided. Time spent seated was punctuated
by 2 minute intervals of walking at 3.2 km·h-1 per hour approximately every 20 minutes. Walking
intervals took place on a walking platform (FitWork TM Walkstation, Steelcase Inc., New York)
immediately next to the desk so that transit from sitting to walking was minimal. Following each
walking interval participants resumed their seated position immediately. Participants were ob-
served at all times and the timing of all bouts of sitting and walking recorded.
Sample 3 - hospital in-patients
Ten patients (male, N = 4) with chronic obstructive pulmonary disease (COPD), aged 60-90 y,
who had been admitted to hospital with an exacerbation of COPD symptoms as their primary
diagnosis, were recruited. Ethics approval was granted by the Royal Adelaide Hospital Human
Ethics Committee and the University of South Australia Human Research Ethics Committee and
all patients gave written informed consent. These data were collected as part of a larger study
that aimed to describe the pattern of active and sedentary time in people with chronic obstructive
pulmonary disease (COPD) during, and one month after, an admission to hospital for an acute
exacerbation of their symptoms.
Each participant wore a GENEActiv on their non-dominant wrist (left, N=7). An activPAL was
placed in a waterproof finger-cot which was secured to the participant’s right thigh (mid-anteri-
or) using porous hypoallergenic tape. Both monitors were worn continuously for 1-2 days and
ACCEPTED
Copyright © 2013 by the American College of Sports Medicine. Unauthorized reproduction of this article is prohibited.
programmed to collect data for a 24 h period from midnight to midnight. Data collection com-
menced on the second day of each patient’s hospital admission and monitors were removed be-
fore each patient was discharged from hospital.
Measures
GENEActiv and the Sedentary Sphere
The GENEActiv is a triaxial accelerometry-based activity monitor with a dynamic range of +/- 8
g (Activinsights Ltd, Cambridgeshire, UK). The GENEActiv was configured with a sampling
frequency of 100 Hz, data uploaded and the .bin files converted to 15 s epoch .csv files using
GENEActiv PC software version 2.1. The 15 s epoch files from the wrist-worn and thigh-worn
GENEActivs were imported into custom built spreadsheets in Excel that computed the most
likely posture, activity intensity (10) and sleep for each epoch (available on request from A.
Rowlands). It is important to differentiate sedentary behaviour from sleep, thus sleep was classi-
fied using an algorithm based on the vector magnitude of the three axes, the sum of the standard
deviations from the three axes, and arm elevation. Visualisations of the Sedentary Sphere, both
the 3-dimensional raw data plots (Figure 1, lower panel) and the 2-dimensional Aitoff projec-
tions (which plot the entire surface of a sphere onto a two-dimensional ellipse, Figure 1 middle
panel), were produced in R (available on request from Activinsights).
In our approach, classification of posture from data plotted on the Sedentary Sphere follows a
very simple premise. Data in latitudes at elevations greater than 15 degrees below the horizontal
indicate the wrist is elevated; if activity level is low (below the signal vector magnitude cut-point
for moderate intensity, 10) and the wrist is elevated, this is taken to indicate a sitting or reclining
posture. Data plotted in the lower latitudes, lower than 15 degrees below the horizontal, indicate
ACCEPTED
Copyright © 2013 by the American College of Sports Medicine. Unauthorized reproduction of this article is prohibited.
that the arm is hanging more vertically; this is taken to indicate a standing position. If activity
level is moderate or vigorous, posture is classified as standing irrespective of wrist elevation.
Thus, ‘stand’ corresponds with active behaviours and with behaviours plotted in roughly the
lower third of the Sedentary Sphere, ‘sit/lie’ corresponds with behaviours plotted in roughly the
upper two thirds of the Sedentary Sphere (Figure 1, upper panel).
Visualisations of specific behaviours are obtained by plotting data on the Sedentary Sphere. Peri-
ods of consecutive data points form distinct clusters which can be differentiated by their position
and distribution. The size of each cluster equates to the 50% confidence interval for the consecut-
ive data points within that period. When inactive, the position of the cluster on the Sphere shows
the elevation (latitude) and rotation (longitude) of the wrist-worn monitor. Specific positions of
the wrist are shown on Figure 1 (upper panel) for the GENEActiv worn on the left wrist, with the
acceleration values for the x, y and z axes and monitor orientation shown for four distinct wrist
positions. The changing latitude of the clusters with wrist elevation is clearly illustrated in a plot
of a person lowering and raising weights (Figure 1, middle panel).
Different types of inactive behaviour will have different “signatures” defined by the distribution
of consecutive data-points on the surface of the sphere, e.g. sitting on a train as shown in Figure
1 (lower panel, left). The spatial and temporal distribution of the clusters on the Sedentary
Sphere during specific behaviours provides a method for exploration into classification of differ-
ent types of behaviour. If behaviours include significant levels of acceleration (i.e. they were
active and therefore non-sedentary) the clusters will depart substantially from the surface of the
sphere as there is an acceleration value of greater than 1g, e.g. walking as shown in Figure 1
(lower panel, middle). If behaviours are light intensity, but not inactive (i.e. greater than 1g),
they depart from the surface of the sphere to a lesser extent, e.g. light housework as shown in
Figure 1 (lower panel, right).
ACCEPTED
Copyright © 2013 by the American College of Sports Medicine. Unauthorized reproduction of this article is prohibited.
Assessment of posture from the thigh-worn GENEActiv was based on the relative values of the x
(medio-lateral), y (vertical) and z (antero-posterior) vectors. It is possible to further classify sit-
ting/lying as ‘lying side’, ‘lying front’ or ‘sitting/lying back’ based on values of the z vector, but
these classifications were not used in this study.
activPAL
The activPAL physical activity monitor (PAL technologies Ltd, Glasgow, UK) is a uniaxial ac-
celerometer worn midline on the anterior thigh which detects limb position using an inclinomet-
er. The activPAL samples data at 10 Hz, this data was used to determine posture (sit/lie or up-
right) and step count in 15 s epochs. In order to match 15 s epochs between the GENEActiv and
the activPAL, classification of ‘sit/lie’ or ‘stand’ for a 15 s epoch was based on the posture that
occurred for the majority of the epoch, i.e. the posture that occurred for 8 s or more of that
epoch. The activPAL has been shown to have acceptable validity and reliability as a measure of
posture and step count (15, 21).
MARCA (part 1, 24 h free-living sample, only)
The Multimedia Activity Recall for Children and Adults (MARCA, 13, 28) was used to determ-
ine time periods when specific activities were undertaken to enable the investigation into the ac-
curacy of posture allocation in particular contexts and to plot specified types of behaviour on the
sedentary sphere.
The MARCA is a computerised 24-hour use-of-time recall tool that asks participants to recall
everything they did in the last 24 hours from midnight to midnight, using meal times as anchor
points. Participants can choose from over 500 discrete activities, with the minimum time for an
individual activity being five minutes. Each activity in the MARCA is assigned a MET value
based on an expanded version of the Ainsworth compendium (2, 3), so that energy expenditure
ACCEPTED
Copyright © 2013 by the American College of Sports Medicine. Unauthorized reproduction of this article is prohibited.
and PAL (physical activity level, ratio of total energy expenditure to basal metabolic rate) can be
estimated. The adult version of the MARCA has test-retest reliabilities in adults of 0.920-0.997
for major activity sets such as sleep, physical activity and screen time, and convergent validity
between PAL and accelerometer counts/minute of rho = 0.72 (13). A recent comparison with
doubly-labeled water (11) showed correlations of rho = 0.70 for total daily energy expenditure.
Data analysis
The activPAL served as the criterion measure of sitting time for all three samples. In the laborat-
ory-based sample eight participants were excluded as the timing of sitting and standing bouts
identified by the activPAL did not match the observed bouts, possibly due to irregular postures,
as has been previously observed (7), and one participant was excluded due to an error in match-
ing files. Thus, the final sample size for the laboratory-based sample was 16. Observation data
were not available for the free-living or in-patient samples studied.
Data are reported separately for each study. Examination of variables revealed that total sitting
times from the activPAL and wrist-worn GENEActiv were skewed for the three samples com-
bined and for the laboratory-based sample; all other variables were normally distributed. De-
scriptive statistics (mean, SD) were calculated for all variables. The difference and relationship
between total sitting time, calculated from the wrist-worn GENEActiv and the activPAL, were
examined using paired t-tests and Pearson’s correlation, respectively. For data not normally dis-
tributed, non-parametric equivalents (Spearman’s rank-order correlation and Wilcoxon signed
ranks test) were used. Limits of agreement were examined using Bland and Altman analyses. In-
tra-individual classification agreement across 15 s epochs was reported as percent agreement and
kappa. All analyses were repeated for the thigh-worn GENEActiv, relative to the activPAL, for
ACCEPTED
Copyright © 2013 by the American College of Sports Medicine. Unauthorized reproduction of this article is prohibited.
the free-living sample. Alpha was set at 0.05.
The MARCA use of time data from the free-living sample detailed the activities that each parti-
cipant undertook in 5 min epochs. This enabled the investigation of the type of activities where
posture allocation from the GENEActiv (worn at the wrist or thigh) did not agree with posture al-
location from the activPAL. The MARCA data also allowed the identification of distinct periods
of common behaviours that it is desirable to classify (e.g. sleep, TV viewing, computer use, driv-
ing, office work), where we were confident that the reported activity was temporally matched to
the GENEActiv and activPAL data. This decision was based on concordance between the repor-
ted activity from the MARCA and posture allocation from the activPAL. GENEActiv wrist ac-
celeration data from these periods of time were plotted on the Sedentary Sphere and posture al-
location agreement calculated for these distinct activities. The sample size for the MARCA ana-
lyses was 12 as one of the 13 participants did not complete the MARCA.
Results
The free-living sample was aged 34.5 ± 13.2 y (height: 174.8 ± 7.4 cm; mass: 72.7 ± 9.4 kg;
body mass index (BMI): 23.7± 1.8 kg·m-2), the laboratory sample was aged 39.8 ± 12.4 y (height:
176.3 ± 5.7 cm; mass: 81.9 ± 20.6 kg; BMI: 26.1 ± 4.9 kg·m -2) and the hospital in-patient sample
was aged 75.9 ± 9.7 y. Height, mass and BMI are unavailable for the in-patient sample. Sitting
time, standing time, correlation and agreement statistics by sample are shown in Table 1.
Mean minutes classified as sitting/lying and standing by the wrist-worn GENEActiv did not dif-
fer from activPAL classifications in the free-living sample. However, significantly fewer minutes
sitting and more minutes standing were classified from the wrist-worn GENEActiv data than
from the activPAL data in the laboratory-based sample (≃30 min) and the in-patient sample
ACCEPTED
Copyright © 2013 by the American College of Sports Medicine. Unauthorized reproduction of this article is prohibited.
(≃130 min). Minutes classified as sitting by the wrist-worn GENEActiv were significantly correl-
ated with minutes classified as sitting by the activPAL in the three samples combined [rho =
0.90, p < 0.001, see Figure, Supplemental Digital Content 1, Sitting time estimated by the act-
ivPAL (x axis) and the wrist-worn GENEActiv (y axis) by sample (free-living, laboratory-based
and hospital in-patients)], in the free-living sample (r = 0.79, p < 0.001) and the in-patient
sample (r = 0.78, p < 0.01), but not for the laboratory-based sample (rho = 0.17). The mean bi-
ases for the free-living sample and laboratory-based sample were relatively low, although 95%
limits of agreement were large. The mean bias and limits of agreement were large for the highly
sedentary in-patient sample, Table 1. The root mean squared error was highest for the free-living
sample (63 minutes) and lowest for the laboratory protocol (19 minutes, Table 1).
Intra-individual classification agreement across 15 s epochs was greater than 80% for every par-
ticipant in the free-living sample, 69% of the laboratory-based sample and 90% of the in-patient
sample, and the three sample means were all greater than 80% (Table 1). Kappa scores indicated
moderate to substantial agreement between the activPAL and the wrist-worn GENEActiv for the
free-living sample (77% kappa > 0.6), and fair to moderate agreement for the laboratory-based
(63% kappa > 0.4) and in-patient samples (40%, kappa > 0.4, 70% kappa > 0.3) (31).
Posture classification from the GENEActiv worn at the thigh was more accurate and precise, rel-
ative to the activPAL, than the GENEActiv worn at the wrist (free-living sample only, Table 1).
This was evidenced by a high correlation (r = 0.93, p < 0.001), narrower limits of agreement,
over 89% epoch- by-epoch intra-individual agreement in all participants (mean = 96%), and a
kappa score indicating near perfect agreement in 77% participants (kappa > 0.81) and substantial
agreement in the remaining 23% (kappa > 0.75, 29).
ACCEPTED
Copyright © 2013 by the American College of Sports Medicine. Unauthorized reproduction of this article is prohibited.
Comparison with MARCA data (free-living sample only)
Figure 2 shows a temporogram for a representative participant. The temporogram graphically
displays contemporaneous activPAL posture allocation (top), GENEActiv wrist posture alloca-
tion (second from top), GENEActiv wrist accelerometer vector magnitude (third from top) and
MARCA data (bottom), plotted against time. The vertical bars on the upper two plots show
standing, while absence of a bar indicates sitting or lying. The agreement between posture alloca-
tion from the wrist-worn GENEActiv and the activPAL for this participant was slightly lower
than the mean for the sample (82.4%, mean = 85.3%). The colours on the MARCA plot indicate
the activities that were reported and the height of the bars represents the energy expenditure as-
sociated with the activity; some of these activities are labelled on the plot. Comparison of the top
two posture allocation plots with the MARCA plot (bottom) allows the identification of activities
where the activPAL and wrist-worn GENEActiv agreed or did not agree. For example, around
1730-1800 hours and 2000-2040 hours, indicated with shaded grey vertical bars, the activPAL
classified standing (top: vertical bars) but the GENEActiv classified sitting/lying (second from
top: no vertical bars). From the MARCA (bottom) it can be seen that the activities undertaken
were standing while reading and cooking standing, respectively.
The highest posture allocation agreement between the activPAL and the wrist-worn GENEActiv
was 95.9%. [For the traces for this participant, see Figure, Supplemental Digital Content 2, Tem-
porogram (plot of activities against time, measured by multiple methods) for a participant with
high posture allocation agreement between the GENEActiv and the activPAL (96%). ActivPAL
posture allocation (top), GENEActiv wrist posture allocation (second from top), GENEActiv
wrist accelerometer vector magnitude (g•min, third from top) and MARCA data (energy ex-
penditure in METs (metabolic equivalents) bottom), plotted against time.] The poorest posture
allocation agreement between the activPAL and the wrist-worn GENEactiv was 80% [e.g., see
ACCEPTED
Copyright © 2013 by the American College of Sports Medicine. Unauthorized reproduction of this article is prohibited.
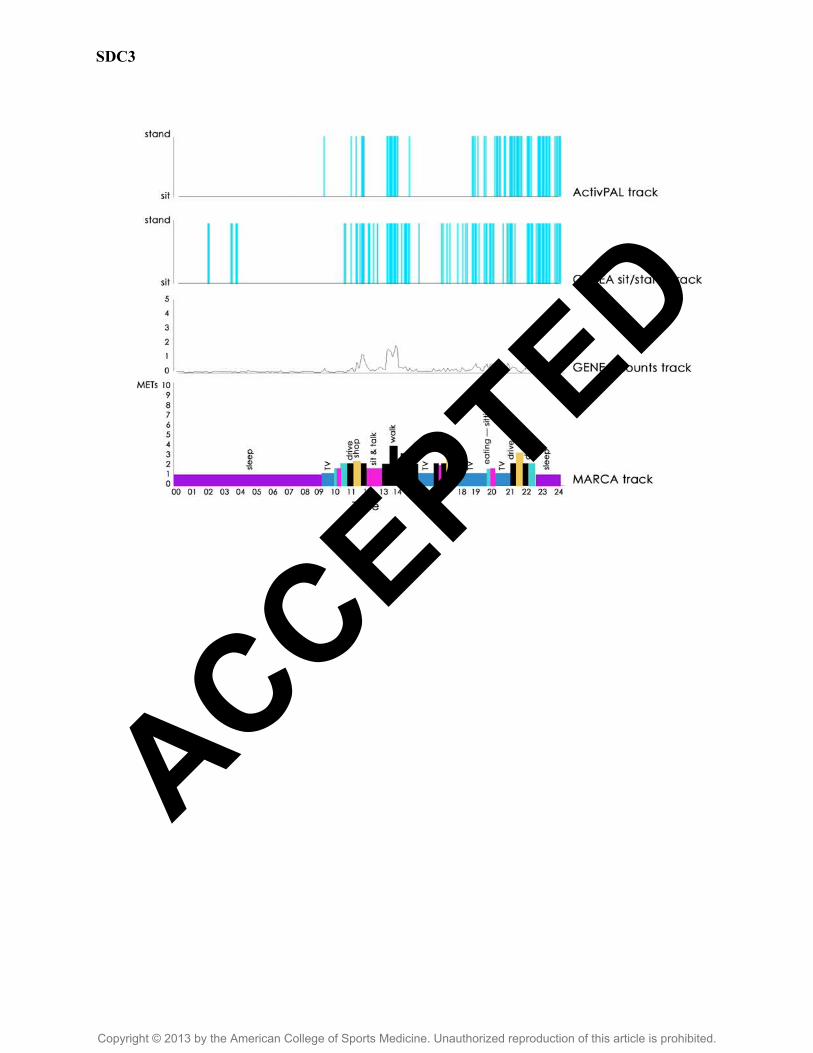
Figure, Supplemental Digital Content 3, Temporogram (plot of activities against time, measured
by multiple methods) for a participant with low posture allocation agreement between the
GENEActiv and the activPAL (80%). ActivPAL posture allocation (top), GENEActiv wrist pos-
ture allocation (second from top), GENEActiv wrist accelerometer vector magnitude (g•min,
third from top) and MARCA data (energy expenditure in METs (metabolic equivalents) bottom),
plotted against time]. Examination of the temporograms for each participant reveals that activit-
ies where the activPAL and wrist-worn GENEActiv sometimes disagreed include reading while
standing, cooking while standing, brief periods during office work (activPAL = standing, GENE-
Activ = sitting/lying) and brief periods during driving (activPAL = sitting/lying, GENEActiv =
standing). Time reported sleeping in the MARCA correlated significantly with time classified as
sleeping from the GENEActiv data (r= 0.70, p < 0.05) and epoch by epoch agreement was high
(89.6 ± 6%, kappa = 0.8 ± 0.4).
Visualisation on the Sedentary Sphere
From the MARCAs collected in the free-living sample we identified participant reports of beha-
viours including sleeping (N = 12), TV viewing (N=7), computer use (N = 5), driving (N = 6)
and office work (N = 3), where we were confident that the activity reported in the MARCA was
temporally matched to the GENEActiv and activPAL data. The mean (SD) percent epoch by
epoch posture allocation agreement from the wrist-worn GENEActiv and activPAL during these
activities was: sleeping 97.6% (4.3); TV 94.3% (5.4); computer 94.9% (4.6); driving 74.9%
(16.1); office work 73.0% (8.9).
Figure 3 shows 2D images of GENEActiv acceleration data plotted on the Sedentary Sphere for
six representative participants for periods of sleep. Periods of time were selected based on repor-
ted sleep in the MARCA and absence of standing from the activPAL data. The greater number
ACCEPTED
Copyright © 2013 by the American College of Sports Medicine. Unauthorized reproduction of this article is prohibited.
and size of clusters on the plots on the right, relative to the plots on the left, indicate a greater
range of movement within a given position and more changes of position (agreement = 99.7%
top, 100% bottom two plots). The plots on the left depict participants who did not move much in
any given position (clusters are very small) and had relatively few position changes (top plot:
shown by few tightly gathered clusters, agreement = 99.8%), or a greater variety of positions
(bottom two plots: shown by multiple, spread out clusters, agreement = 85.9% (middle) and
100% (bottom)). Sixty percent of participants had plots similar to those on the left and 40% had
plots similar to those on the right.
Sedentary Sphere plots for representative participants for TV viewing (left, agreement (top to
bottom) = 95.4%, 88.2%, 100%) and computer use (right agreement (top to bottom) = 99.1%,
94.7%, 98.2%) are shown in Figure 4. As for sleep, periods of time were selected based on the
reported activity (TV viewing or computer use) in the MARCA and absence of standing from the
activPAL data. In general, more positions and greater movement in any given position were seen
for computer use than TV viewing (the clusters were bigger and there were more of them), but
not always (see bottom pair of plots where this observation is reversed). Figure 5 shows plots for
representative participants for office work (left, agreement (top to bottom) = 88%, 69.7%,
66.3%) and driving (right, agreement (top to bottom) = 85.5%, 76.6%, 67.5%). As for sleep, TV
viewing and computer use, periods of time for driving were selected based on MARCA report
and absence of standing from the activPAL data. This was not possible during office work as this
activity could contain sitting and standing. Therefore, office work was selected based on the
MARCA data and observed alignment between MARCA data and other activity measures. Dur-
ing office work 17%, 54% and 63% of the time depicted in the top, middle and bottom plot, re-
spectively, was spent standing. The greater coverage on the Sedentary Sphere indicates the great-
er movement during this activity.
ACCEPTED
Copyright © 2013 by the American College of Sports Medicine. Unauthorized reproduction of this article is prohibited.
Discussion
There were two aims to this paper: the first was to introduce the concept of the Sedentary
Sphere; the second was to determine whether we could use the Sedentary Sphere to determine
posture (sit/lie or stand) from a wrist-worn accelerometer. The assessment of posture considered
in this paper relies on the Sedentary Sphere to provide a framework enabling the most likely pos-
ture to be determined from triaxial acceleration data from the wrist-worn GENEActiv. However,
as detailed earlier, the assessment of posture when inactive is based on wrist elevation only and
thus is a very basic interpretation of the Sedentary Sphere. In order to highlight the potential of
the Sedentary Sphere for more sophisticated analysis, identification and visualisation of triaxial
acceleration data measured at the wrist we have plotted free-living data on the Sphere for specif-
ic behaviours: sleeping, TV viewing, computer work, driving and office work. We believe that
the Sphere potentially provides a paradigm whereby wrist-worn accelerometers are not used
simply because they improve compliance, but also because they offer a richer, more detailed pic-
ture of a person’s behaviours than is possible with waist-worn accelerometers. First we will dis-
cuss results in relation to our preliminary posture allocation algorithm and then move on to the
potential implications of the Sedentary Sphere and future research directions.
Posture allocation
Across the three samples considered, minutes classified as sitting/lying from wrist elevation were
highly correlated with the criterion measure (activPAL), intra-individual epoch-by-epoch agree-
ment was greater than 80% in 85% of participants and group means did not differ in the free-liv-
ing scenario. However, in the laboratory-based sample and in the elderly hospital in-patients sit-
ting time was significantly underestimated by approximately half an hour and two hours, respect-
ively. The bias was zero in the free-living sample, however, the root mean squared error and lim-
ACCEPTED
Copyright © 2013 by the American College of Sports Medicine. Unauthorized reproduction of this article is prohibited.
its of agreement were higher than in the other samples. This suggests the error was random in the
free-living sample with overestimation in some individuals cancelling out underestimation in
others, whereas there tended to be a systematic underestimation of sitting time in the more con-
trolled samples. It is unusual for classification accuracy to be higher in a free-living sample than
a laboratory sample (30), but the threshold used to differentiate standing from sitting/lying (wrist
elevation >15 degrees below horizontal) was set empirically based on free-living data rather than
developed in a controlled laboratory setting. Overall, these results compare well to estimates of
sedentary time from the hip-worn ActiGraph GT3X+ relative to the activPAL; Aguilar-Farías et
al. (1) recently reported epoch by epoch agreement ranging from 73-85% and biases of -4 to 124
minutes with 95% limits of ± 2h in free-living older adults.
It is notable that the activPAL data were classified as standing for 30% of the assessed time in
the free-living sample, whereas only 16% of time was spent standing in the laboratory-based
sample and 8% of time in the in-patient sample. These values compare well to previously repor-
ted values from the activPAL for free-living women aged 40-75 (≃24.2%, 5), overweight and
obese adults aged 20-60 y (≃20%, 19), adults aged 74 ± 5 y (≃ 25%, 14), adults aged 75 ± 8 y at-
tending a day hospital (≃16%, 14) and elderly hospital in-patients (≃5-6%, 14). It is possible that
the accuracy of the total minutes classified as sitting/lying and standing from the wrist accelera-
tion data may be decreased in highly sedentary samples. In the present study, the two samples
with sitting/lying underestimated were constrained in their posture allocation to some extent; the
laboratory-based sample due to the imposed protocol and the in-patient sample due to the context
and the exacerbation in their COPD symptoms that led to them being admitted to hospital. Con-
straints on standing may impact on the degree of elevation and rotation of the wrist during sitting
and lying. For example, during prolonged and/or imposed sitting people may be more likely to
spend time with their arms hanging down over the edge of a chair; this would be misclassified by
ACCEPTED
Copyright © 2013 by the American College of Sports Medicine. Unauthorized reproduction of this article is prohibited.
our algorithm as standing. A moderate or vigorous activity level while seated would also result
in misclassification as standing. Differing levels of validity across samples highlight the import-
ance of developing and cross-validating tools for the assessment of sedentary behaviour and
physical activity in a variety of contexts and in free-living scenarios (12, 30).
Correlations with the activPAL were high for the free-living and in-patient sample. All parti-
cipants in the laboratory-based sample were prescribed equal amounts of sitting and light walk-
ing, thus the low correlation observed in the laboratory-based sample is probably due to the res-
ulting narrow range of values in the data. Despite the relatively high and similar levels of in-
tra-individual agreement in the three samples, the kappa values were quite discrepant (0.65, 0.59
and 0.38 in the free-living, laboratory-based and in-patient samples, respectively). The relatively
low prevalence of standing in the latter two samples may contribute to this discrepancy. Kappa is
affected by the prevalence of the finding under consideration and for rare findings low values of
kappa may not necessarily reflect low rates of overall agreement (31).
The posture allocation algorithm for the thigh-worn GENEActiv resulted in very high accuracy
and precision for estimates of mean total sitting time and for intra-individual epoch-by-epoch
agreement. Thus, the thigh site is a viable alternative when high individual-level accuracy of pos-
ture allocation is required. Examination of the 15 s epoch activPAL and GENEActiv plots indic-
ates that the number of transitions identified at the wrist would be considerably higher than at the
thigh and, if transitions are an outcome measure, use of a thigh monitor (activPAL or GENEAct-
iv) would likely be required. However, it should be noted that with a thigh-worn monitor it is not
possible to obtain the visualisation and analysis of sedentary behaviours possible with a wrist-
worn monitor as only the wrist location provides the richness of data due to different orienta-
tions. That is, most sedentary behaviours are differentiated by upper limb, and not lower limb,
position and movements.
ACCEPTED
Copyright © 2013 by the American College of Sports Medicine. Unauthorized reproduction of this article is prohibited.
The MARCA enables insight into the types of activities where posture allocation from the
GENEActiv and activPAL did not agree. In general, these made sense. For example, standing
reading was classified as sitting by the wrist-worn GENEActiv. It is likely that the arms would
be elevated higher than 15 degrees below the horizontal to hold a book if standing and reading.
Thus, based on the theoretical premise used to allocate posture from the wrist-worn GENEActiv
data, it is not surprising that this activity was misclassified. Similarly, the same reasoning would
explain the misclassification of cooking while standing and suggests that working at a standing
desk or workstation would be misclassified as sitting. Understanding the types of activities that
are likely to be misclassified and the prevalence of these in different populations allows an in-
formed decision to be made as to whether the posture allocation algorithm is appropriate for use
in a given population for a given research question. Systematic misclassification would likely be
evident in populations with a high prevalence of activities that are typically misclassified, e.g.
any activity that requires individuals to have their arms elevated higher than 15 degrees below
the horizontal for prolonged periods while standing. Further research should investigate popula-
tions where systematic misclassification may be evident and whether misclassification can be re-
duced by inclusion of extra features from the Sedentary Sphere in the posture allocation al-
gorithm.
The Sedentary Sphere
Triaxial wrist acceleration data from periods of sleeping, TV viewing, computer use, driving and
office work were plotted on the Sedentary Sphere. In addition to wrist elevation, this provided
information on rotation of the wrist and the range of wrist movement and positions covered for
the behaviour during the time period plotted. This allows examination of individual differences
within and between behaviours. For example, the greater coverage of clusters on the Sedentary
Sphere evident in the plots on the right on Figure 3, relative to the plots on the left, indicates that
ACCEPTED
Copyright © 2013 by the American College of Sports Medicine. Unauthorized reproduction of this article is prohibited.
these participants moved and changed positions more when sleeping. The coverage of the
Sedentary Sphere may provide a marker of sleep quality and/or provide further information on
fidgeting or non-exercise activity thermogenesis (NEAT, 20) within and between sedentary be-
haviours.
The features of different behaviours plotted on the Sedentary Sphere may provide information
that can be used to classify behaviours. The data presented suggest that distinguishing between
similar behaviours such as computer use and TV viewing may not be possible with the features
considered here, however some groups of behaviours may be characterised by distinct clustering
of data points potentially enabling classification of these behaviours. It should be noted that this
preliminary approach did not explore dynamic characteristics, e.g. the movements of points
across the activity space over time or events and clusters of events in relation to each other, or
examine the frequency content of the raw signal; these are avenues for further exploration. Inclu-
sion of dynamic characteristics may be particularly pertinent for the detection of sit-to-stand
transitions. Static and dynamic position data, combined with socio-demographic and time of day
data, are a promising avenue for activity classification through pattern recognition. Thus,
feature(s) can be extracted from the Sedentary Sphere for classification of behaviours, as exem-
plified for posture herein, and/or images from plotted behaviours can be analysed. Notably the
introduction of the Sedentary Sphere extends the analysis problem from a time-series issue to
more of an image analysis problem opening up the possibility of using different tools. This shift
differentiates this approach from other pattern recognition approaches such as Hidden Markov
Models (e.g. 15, 27), Decision Trees (e.g. 4) and Artificial Neural Networks (e.g. 8) and thus of-
fers a complementary visual tool that also has the advantage of focusing on patterns within inact-
ive behaviours – the type of behaviour undertaken for the vast majority of most people’s time
(22).
ACCEPTED
Copyright © 2013 by the American College of Sports Medicine. Unauthorized reproduction of this article is prohibited.
Strengths and limitations
The inclusion of three very diverse samples was a strength of this study. Further, the inclusion of
a free-living sample was very important as laboratory-based validity is typically not replicated
when applied to free-living data (16, 30). Sedentary and light intensity behaviours can be very
diverse and incorporate a wide range of arm and hand positions and/or movements including ges-
ticulation. It would be difficult to capture this diversity of naturally occurring movement during
sedentary and light intensity behaviours in a laboratory setting. Thus, given the use of a wrist-
worn device it was particularly important that a person was not acting out a prescribed protocol
and was able to engage in their normal daily activities.
The inclusion of MARCA time use data in the free-living sample provided context to the beha-
viours undertaken and enabled specific behaviours to be plotted on the Sphere. Further, the time
use data enabled the identification of activities where the activPAL and GENEActiv classifica-
tions did not agree. It should be noted that those activities identified were exemplars where it
was possible to confidently identify the activity from the MARCA data. The MARCA has high
validity for the assessment of physical activity and energy expenditure (11, 13), but the nature of
recalled information and larger epochs relative to the objective measures means that the temporal
alignment between MARCA and monitor data will not be perfect. This precludes the matching of
all posture classification data to an activity. However, the availability of acceleration, posture
and time use data enabled us to align timelines and identify sufficient activities of long enough
duration to address our research questions. The SenseCam, a ‘lifelogging’ lightweight camera
worn via a lanyard around the neck that takes photographs automatically could provide an altern-
ative or complementary measure in future studies (18).
The criterion for posture allocation was the activPAL, this has been shown to be a valid and reli -
able measure of posture (e.g. 15, 21). However, evidence is emerging for misclassification of
ACCEPTED
Copyright © 2013 by the American College of Sports Medicine. Unauthorized reproduction of this article is prohibited.
certain types of postures including irregular sitting styles (5), e.g. sitting on the edge of a chair.
In the laboratory-based sample nearly one third (8/25) of participants were excluded based on
discrepancies between the activPAL posture classification and the observation data. Based on
this, it is likely that misclassification would have been present in the activPAL data in the free-
living and in-patient samples.
Conclusions
The Sedentary Sphere provides a framework that enables the most likely posture to be determ-
ined from triaxial acceleration data from the wrist-worn GENEActiv. This is important as wear
compliance is high for wrist-worn monitors. Using an algorithm based only on wrist elevation,
agreement with posture allocation determined from the activPAL was over 80%. Further re-
search in a variety of populations using the activPAL as a criterion and the MARCA to determ-
ine types of activity where mismatches occur should be used to refine the posture allocation al-
gorithm and consider the inclusion of additional features from the Sedentary Sphere. The Sedent-
ary Sphere framework uses the signal from a wrist-worn triaxial accelerometer when gravity
provides the primary signal to the monitor, i.e. when a person is inactive. Thus, theoretically, this
framework could be applied to the signal from any wrist-worn accelerometer providing gravity
had not been removed from the signal, the hand on which it was fitted is known and the product
containing the accelerometer was consistently worn in the same orientation on the wrist.
This paper has introduced the Sedentary Sphere which enables the analysis, identification and
visualisation of triaxial acceleration data measured at the wrist. While we have focused here on
posture determination, the sedentary sphere concept offers possibilities for identifying specific
activities using pattern recognition. This might be done by a statistical analysis of the location,
ACCEPTED
Copyright © 2013 by the American College of Sports Medicine. Unauthorized reproduction of this article is prohibited.
density and distribution of points on various regions of the sphere, and changes in these charac-
teristics over the duration of an activity, e.g. the movement of clusters over time in relation to
each other and the frequency content of the raw data signal. One possibility would be to use im-
age-recognition software to identify clusters of patterns typical of specific activities, extending
the tools applicable to accelerometer data analysis to image analysis tools as well as time-series
tools, thus complementing current pattern recognition approaches. Further, the focus on sedent-
ary and light intensity behaviours is pertinent given the emerging evidence for the impact of
sedentary behaviour and light intensity activity on health.
Acknowledgements: The authors would like to thank Tom Butler for assistance with data col-
lection and the participants for their involvement with this study. Hospital in-patient data were
part of a larger study funded jointly by the University of South Australia (Health Sciences Divi-
sional Research Development Grant) and the Royal Adelaide Hospital Clinical Research Fund.
Tina Hurst and Joss Langford are employed by Activinsights, the manufacturer of the GENEAct-
iv. There are no other conflicts of interest. The results of the present study do not constitute en-
dorsement by the authors or the American College of Sports Medicine of the products described
in this article.
ACCEPTED
Copyright © 2013 by the American College of Sports Medicine. Unauthorized reproduction of this article is prohibited.
References
1. Aguilar-Farías N, et al. ActiGraph GT3X+ cut-points for identifying sedentary beha-
viour in older adults in free-living environments. J Sci Med Sport (2013), http://dx.-
doi.org/10.1016/j.jsams.2013.07.002
2. Ainsworth BE, Haskell WL, Whitt MC et al. Compendium of physical activities: an
update of activity codes and MET intensities. Med Sci Sports Exerc 2000; 32: S498-
S516.
3. Ainsworth, BE, Haskell, WL, Herrmann, SD et al. Compendium of physical activit-
ies: a second update of codes and MET values. Med Sci Sports Exerc 2011; 43: 1575-
1581.
4. Bao L, Intille S. Activity recognition from user-annotated acceleration data. In: Pro-
ceedings of the International Conference on Pervasive Computing and Communica-
tions. Washington, DC: IEEE Computer Society. 2004; 3001:1–17.
5. Bonomi AG, Goris AH, Yin B, Westerterp KR. Detection of type duration and intens-
ity of physical activity using an accelerometer. Med Sci Sports Exerc. 2009; 41:1770–
7.
6. Craft LL, Zderic TW, Gapstur SM, Vaniterson EH, Thomas DM, Siddique J,
Hamilton MT. Evidence that women meeting physical activity guidelines do not sit
less: an observational inclinometry study. Int J Behav Nutr Phys Act. [Internet] 2012.
Available from http://www.ijbnpa.org/content/9/1/122. DOI: 10.1186/1479-5868-9-
122.
7. De Decker E, De Craemer M, Santos-Lozano A, Van Cauwenberghe E, De
ACCEPTED
Copyright © 2013 by the American College of Sports Medicine. Unauthorized reproduction of this article is prohibited.
Bourdeaudhuij I, Cardon G. Validity of the ActivPALTM and the ActiGraph Monit-
ors in Preschoolers. Med Sci Sports Exerc 2013. DOI:
10.1249/MSS.0b013e318292c575
8. De Vries SI, Garre FG, Engbers LH. Evaluation of neural networks to identify types
of activity using accelerometers. Med Sci Sports Exerc. 2011; 43:101–7.
9. Dunstan DW, Howarda B, Healy GN, Owen N. Too much sitting – A health hazard.
Diabetes Res Clin Pract. 2012; 97: 368–376.
10. Esliger DW, Rowlands AV, Hurst TL, Catt M, Murray P, Eston RG. Validation of the
GENEA accelerometer. Med Sci Sports Exerc. 2011; 43: 1085-1093.
11. Foley L, Maddison R, Rush E, Olds T, Ridley K, Jiang Y. Doubly labeled water val-
idation of a computerized use of time recall in active young people. Metabolism.
2013; 62: 163-169.
12. Freedson PS, John D. Comment on ‘‘Estimating Activity and Sedentary Behavior
from an Accelerometer on the Hip and Wrist’’. Med Sci Sports Exerc. 2013; DOI:
10.1249/MSS.0b013e31827f024d.
13. Gomersall SR, Olds TS, Ridley K. Development and evaluation of an adult use-of-
time instrument with an energy expenditure focus. J Sci Med Sport. 2011; 14: 143-
148.
14. Grant M, Granat MH, Thow MK, Maclaren WM. Analyzing Free-living physical
activity of older adults in different environments using body-worn activity monitors. J
Aging Phys Act. 2010; 18: 171-84.
15. Grant PM, Ryan CG, Tigbe WW, Granat MH. The validation of a novel activity mon-
itor in the measurement of posture and motion during everyday activities. Brit J
ACCEPTED
Copyright © 2013 by the American College of Sports Medicine. Unauthorized reproduction of this article is prohibited.
Sports Med 2006; 40: 992-997.
16. Gyllensten IC, Bonomi AG. Identifying types of physical activity with a single accel-
erometer: evaluating laboratory trained algorithms in daily life. IEEE Trans Biomed
Eng. 2011; 58: 2656-2663.
17. He J, Li H, Tan J. Real-time daily activity classification with wireless sensor net-
works using Hidden Markov Model. Conf Proc IEEE Eng Med Biol Soc. 2007;
3192–5.
18. Kelly P, Doherty AR, Hamilton A, Matthews A, Batterham AM, Nelson M, Foster C,
Cowburn G. Can we use digital life-log images to investigate active and sedentary
travel behaviour? Results from a pilot study. AmJ Prev Med. 2012; 43: 546-550.
19. Kozey-Keadle S, Libertine A, Staudenmayer J, Freedson P. The feasibility of redu-
cing and measuring sedentary time among overweight, non-exercising office workers.
J Obes. 2012. Available from http://www.hindawi.com/journals/jobes/2012/282303/
doi: 10.1155/2012/282303. Epub 2011 Nov 16.
20. Levine JA, Eberhardt NL, Jensen MD. Role of nonexercise activity thermogenesis in
resistance to fat gain in humans. Science 199; 283: 212.
21. Lyden K, Kozey Keadle SL, Staudenmayer JW, Freedson PS. Validity of two wear-
able monitors to estimate breaks from sedentary time. Med Sci Sports Exerc. 2012;
44: 2243-2252.
22. Matthews CM, Chen KY, Freedson PS, Buchowski MS, Beech BM, Pate RR, Troi-
ano RP. Amount of Time Spent in Sedentary Behaviors in the United States, 2003–
2004. Am J Epidemiol. 2008; 167: 875-881.
23. Matthews, CE, Hagströmer M, Pober DM, Bowles HR. Best Practices for Using
ACCEPTED
Copyright © 2013 by the American College of Sports Medicine. Unauthorized reproduction of this article is prohibited.
Physical Activity Monitors in Population-Based Research. Med Sci Sports Exerc
2012; 44: S68–S76, 2012.
24. Owen N, Healy GN, Matthews CE, Dunstan DW. Too much sitting: the population
health science of sedentary behaviour. Exerc Sport Sci Rev. 2010; 38: 105–113.
25. Phillips LRS, Parfitt CG, Rowlands AV. Calibration of the GENEA accelerometer for
assessment of physical activity intensity in children. J Sci Med Sport, 2013; 16: 124-
128.
26. Phillips LRS. The relationship between psychological well-being and physical activ-
ity: The impact of measurement [dissertation], University of Exeter, UK, 2013. 324 p.
27. Pober DM, Staudenmayer J, Raphael C, Freedson PS. Development of novel tech-
niques to classify physical activity mode using accelerometers. Med Sci Sports Exerc.
2006; 37: 1626–34.
28. Ridley K, Old TS, Hill A. The multimedia activity recall for children and adolescents
(MARCA): development and evaluation. Int J Behav Nutr Phys Act. 2006; 3:10
29. Troiano RP, Berrigan D, Dodd KW, Masse LC, Tilert T, McDowell M. Physical
activity in the United States measured by accelerometer. Med Sci Sports Exerc. 2008;
40: 181–188.
30. Van Hees VT, Golubic R, Ekelund U, Brage S. Impact of study design on develop-
ment and evaluation of an activity-type classifier. J Appl Physiol 2013; 114:1042-
1051.
31. Viera AJ, Garrett JM. Understanding interobserver agreement: The Kappa Statistic.
Fam Med 2005; 37: 360-3.
ACCEPTED
Copyright © 2013 by the American College of Sports Medicine. Unauthorized reproduction of this article is prohibited.
32. Zhang S, Murray P, Zilmer R, Eston RG, Catt, M, Rowlands AV. Activity classifica-
tion using the GENEA: Optimum sampling frequency & number of axes. Med Sci
Sports Exerc, 2012; 44: 2228-2234.
33. Zhang S, Rowlands AV, Murray P, Hurst TL. Physical activity classification using
the GENEA wrist-worn accelerometer. Med Sci Sports Exerc, 2012; 44: 742-748.
ACCEPTED
Copyright © 2013 by the American College of Sports Medicine. Unauthorized reproduction of this article is prohibited.
Figure legends
Figure 1. The Sedentary Sphere. Upper panel shows the determination of wrist elevation (latit-
ude) and rotation (longitude) from the Sedentary Sphere (left hand) displayed on a 2-dimensional
Aitoff projection. Specific positions of the wrist are shown for the GENEActiv worn on the left
wrist, with the acceleration values for the x, y and z axes and monitor orientation shown for four
distinct wrist positions (in red). Middle panel: The changing latitude of the clusters with arm el-
evation during the lowering and raising of weights. Lower panel: Raw triaxial acceleration data
plotted on a 3-dimensional sphere for: a sedentary activity (sitting on a train), left; a moderate-to-
vigorous activity (walking), middle; a light intensity activity (light housework), right.
Figure 2. Temporogram (plot of activities against time, measured by multiple methods) for a
representative participant. The agreement between posture allocation from the wrist-worn
GENEActiv and the activPAL was slightly lower than the mean for the sample (82%, mean =
85%). ActivPAL posture allocation (top), GENEActiv wrist posture allocation (second from
top), GENEActiv wrist accelerometer vector magnitude (g·min, third from top) and MARCA
data (energy expenditure in METs (metabolic equivalents) bottom). Grey shaded vertical bars
indicate periods where posture allocation from the wrist-worn GENEActiv and the activPAL did
not agree.
Figure 3. 2D images of GENEActiv acceleration data plotted on the Sedentary Sphere for rep-
resentative participants for sleep for people who moved very little (left, few very small clusters)
and who moved more (right, more larger clusters). Agreement for plots on the left (top to bot-
tom) was 99.8%, 85.9% and 100%. Agreement for plots on the right (top to bottom) was =
99.7%, 100%, 100%.
ACCEPTED
Copyright © 2013 by the American College of Sports Medicine. Unauthorized reproduction of this article is prohibited.
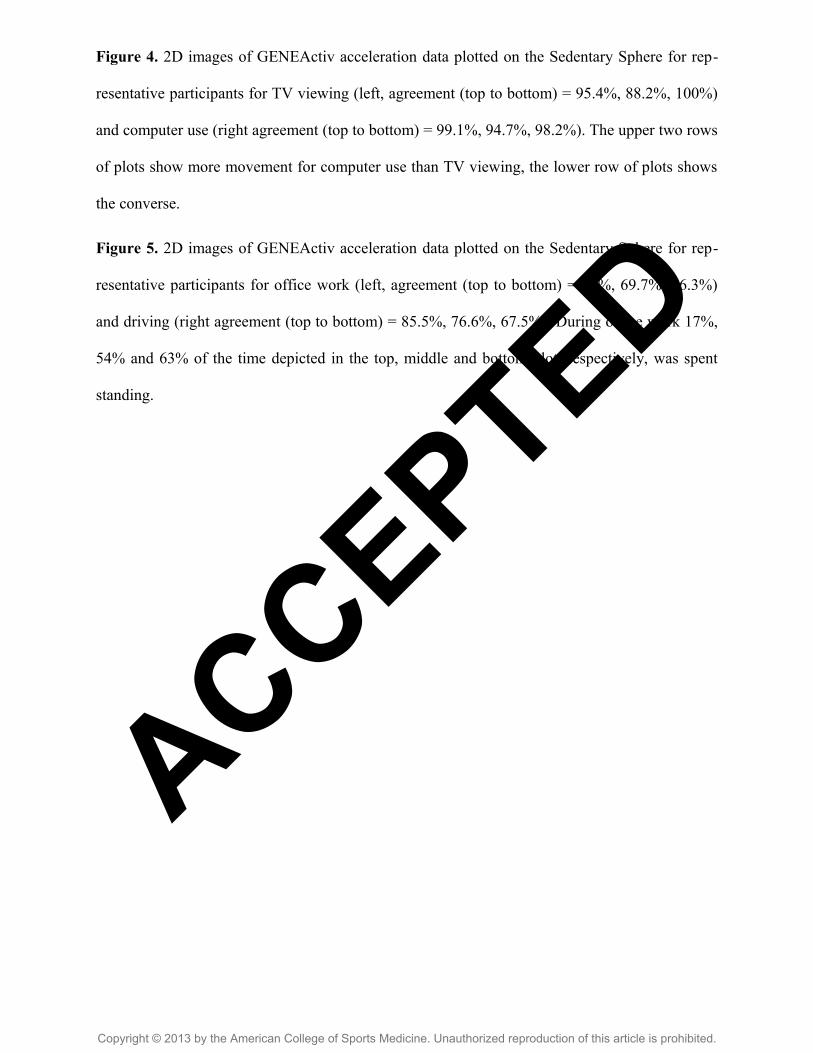
Figure 4. 2D images of GENEActiv acceleration data plotted on the Sedentary Sphere for rep-
resentative participants for TV viewing (left, agreement (top to bottom) = 95.4%, 88.2%, 100%)
and computer use (right agreement (top to bottom) = 99.1%, 94.7%, 98.2%). The upper two rows
of plots show more movement for computer use than TV viewing, the lower row of plots shows
the converse.
Figure 5. 2D images of GENEActiv acceleration data plotted on the Sedentary Sphere for rep-
resentative participants for office work (left, agreement (top to bottom) = 88%, 69.7%, 66.3%)
and driving (right agreement (top to bottom) = 85.5%, 76.6%, 67.5%). During office work 17%,
54% and 63% of the time depicted in the top, middle and bottom plot, respectively, was spent
standing.
ACCEPTED
Copyright © 2013 by the American College of Sports Medicine. Unauthorized reproduction of this article is prohibited.
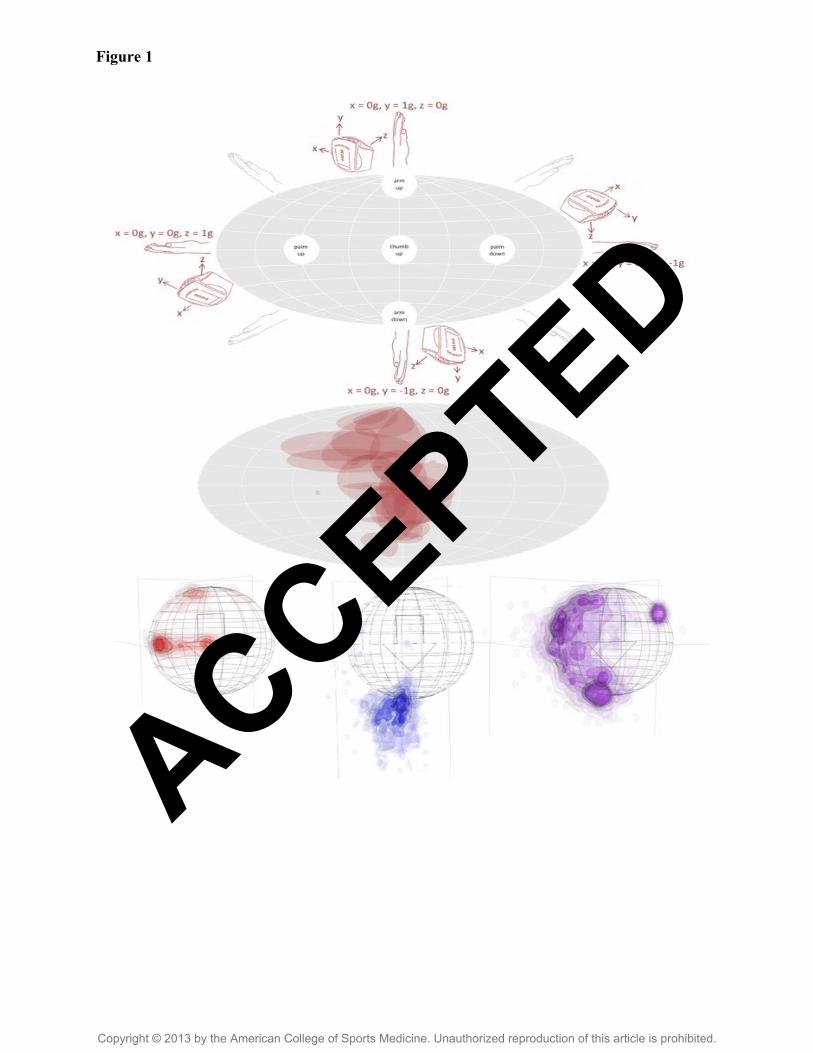
Figure 1
ACCEPTED
Copyright © 2013 by the American College of Sports Medicine. Unauthorized reproduction of this article is prohibited.
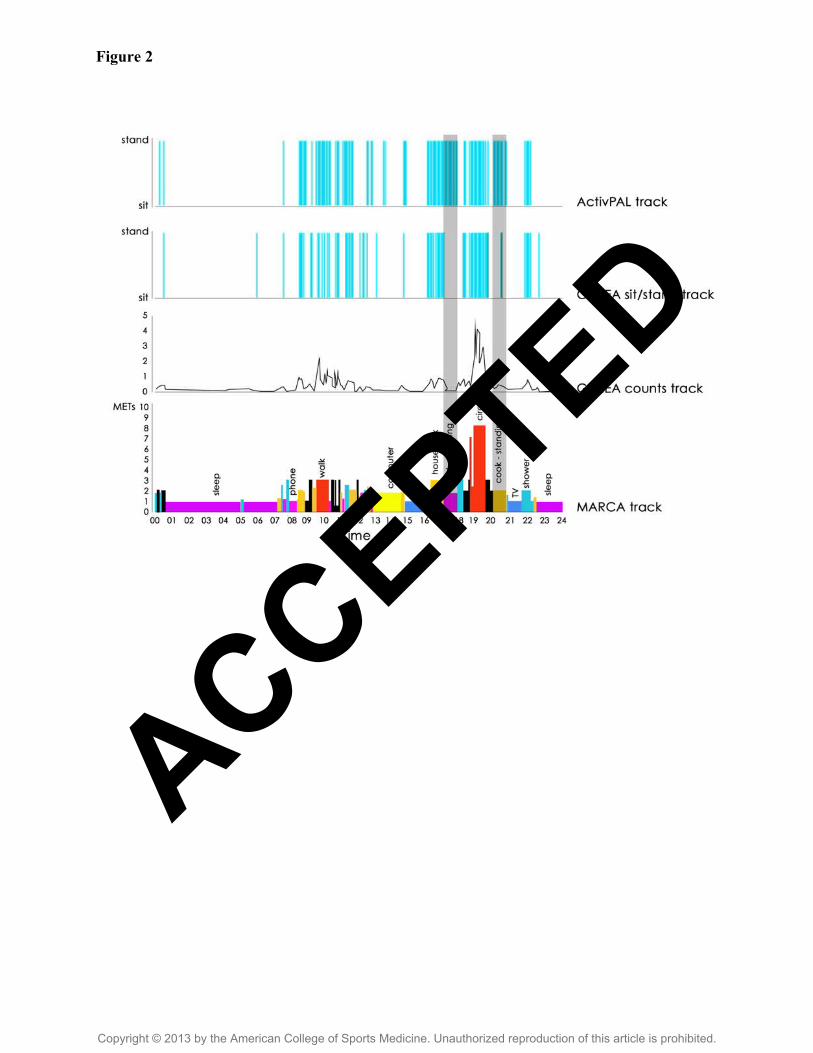
Figure 2
ACCEPTED
Copyright © 2013 by the American College of Sports Medicine. Unauthorized reproduction of this article is prohibited.

Figure 3
ACCEPTED
Copyright © 2013 by the American College of Sports Medicine. Unauthorized reproduction of this article is prohibited.
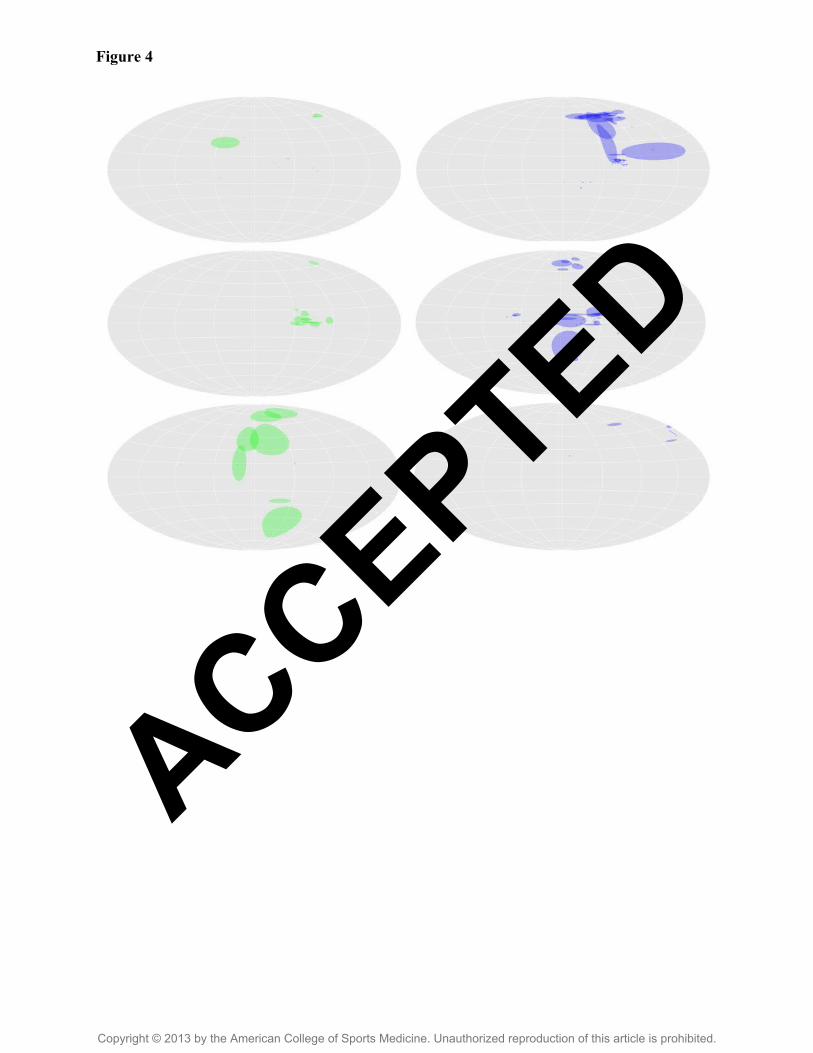
Figure 4
ACCEPTED
Copyright © 2013 by the American College of Sports Medicine. Unauthorized reproduction of this article is prohibited.
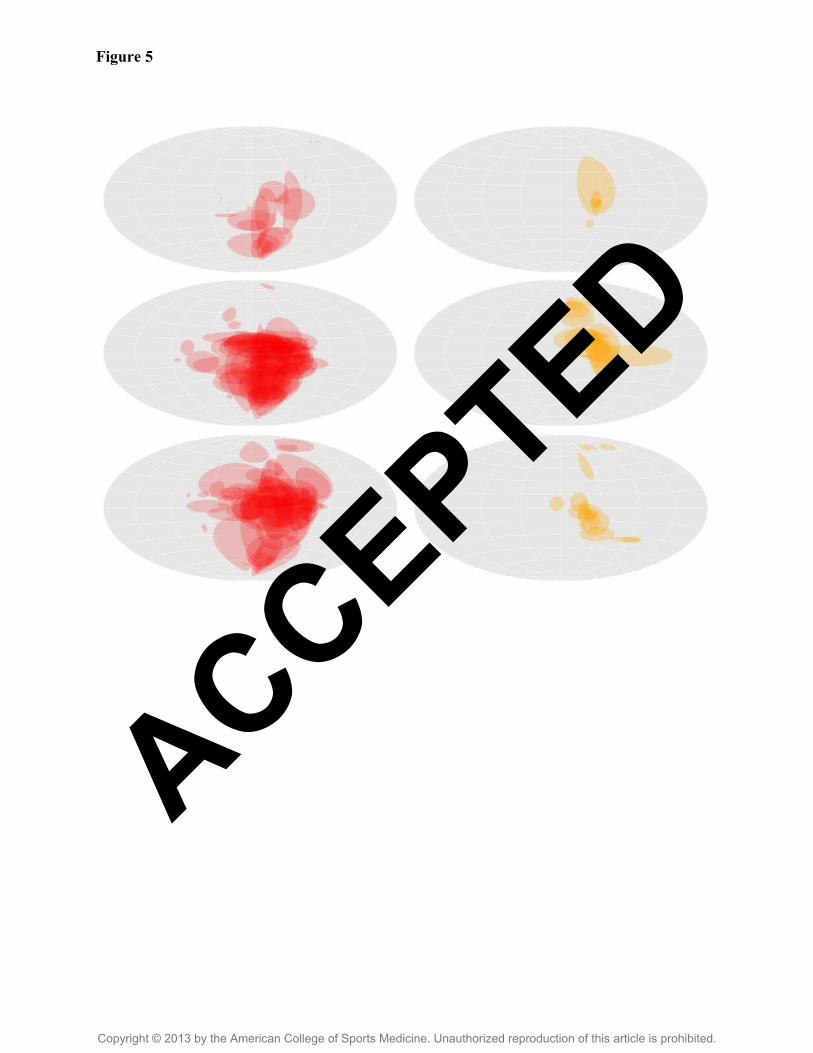
Figure 5
ACCEPTED
Copyright © 2013 by the American College of Sports Medicine. Unauthorized reproduction of this article is prohibited.
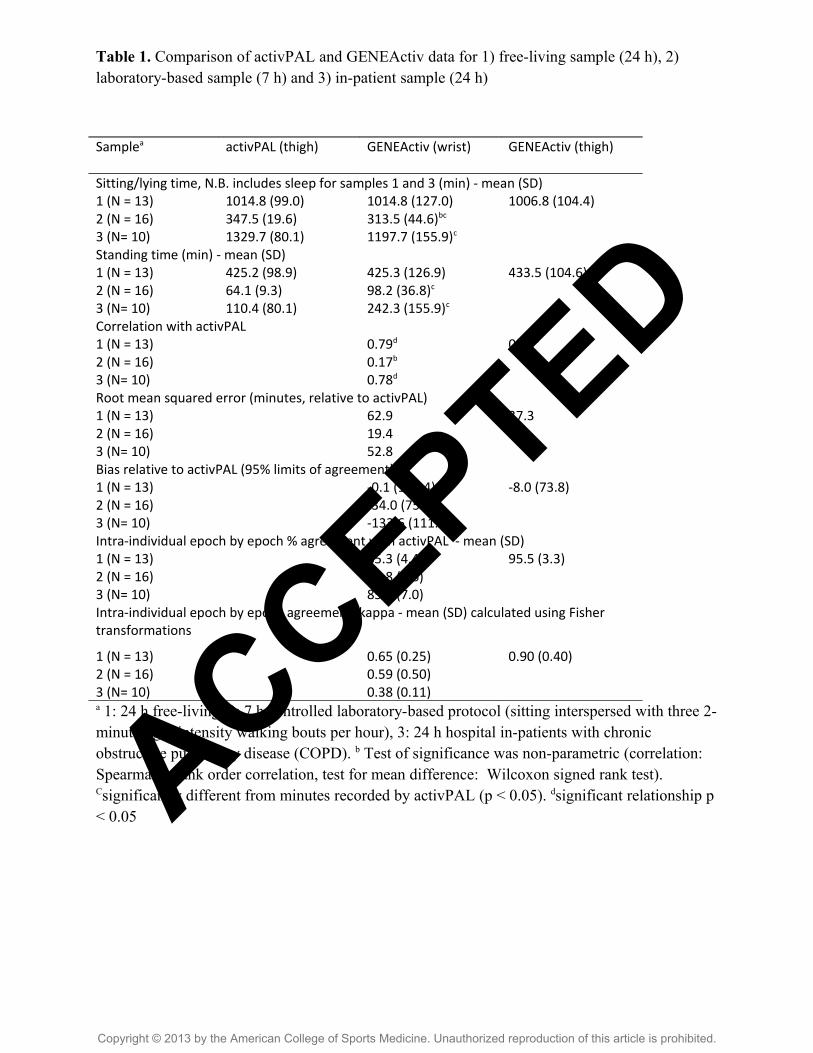
Table 1. Comparison of activPAL and GENEActiv data for 1) free-living sample (24 h), 2) laboratory-based sample (7 h) and 3) in-patient sample (24 h)
Samplea activPAL (thigh) GENEActiv (wrist) GENEActiv (thigh)
Sitting/lying time, N.B. includes sleep for samples 1 and 3 (min) - mean (SD)1 (N = 13) 1014.8 (99.0) 1014.8 (127.0) 1006.8 (104.4)2 (N = 16) 347.5 (19.6) 313.5 (44.6)bc
3 (N= 10) 1329.7 (80.1) 1197.7 (155.9)c
Standing time (min) - mean (SD)1 (N = 13) 425.2 (98.9) 425.3 (126.9) 433.5 (104.6)2 (N = 16) 64.1 (9.3) 98.2 (36.8)c
3 (N= 10) 110.4 (80.1) 242.3 (155.9)c
Correlation with activPAL1 (N = 13) 0.79d 0.93d
2 (N = 16) 0.17b
3 (N= 10) 0.78d
Root mean squared error (minutes, relative to activPAL)1 (N = 13) 62.9 37.32 (N = 16) 19.43 (N= 10) 52.8Bias relative to activPAL (95% limits of agreement)1 (N = 13) -0.1 (151.4) -8.0 (73.8)2 (N = 16) -34.0 (75.2)3 (N= 10) -133.6 (111.9)Intra-individual epoch by epoch % agreement with activPAL - mean (SD)1 (N = 13) 85.3 (4.4) 95.5 (3.3)2 (N = 16) 83.8 (8.6)3 (N= 10) 85.7 (7.0)Intra-individual epoch by epoch agreement, kappa - mean (SD) calculated using Fisher transformations
1 (N = 13) 0.65 (0.25) 0.90 (0.40)2 (N = 16) 0.59 (0.50)3 (N= 10) 0.38 (0.11)a 1: 24 h free-living, 2: 7 h controlled laboratory-based protocol (sitting interspersed with three 2-minute light intensity walking bouts per hour), 3: 24 h hospital in-patients with chronic obstructive pulmonary disease (COPD). b Test of significance was non-parametric (correlation: Spearman’s rank order correlation, test for mean difference: Wilcoxon signed rank test). Csignificantly different from minutes recorded by activPAL (p < 0.05). dsignificant relationship p < 0.05 ACCEPTED
Copyright © 2013 by the American College of Sports Medicine. Unauthorized reproduction of this article is prohibited.
Supplementary online material
SDC1. Sitting time estimated by the activPAL (x axis) and the wrist-worn GENEActiv (y axis)
by sample (free-living, laboratory-based and hospital in-patients).
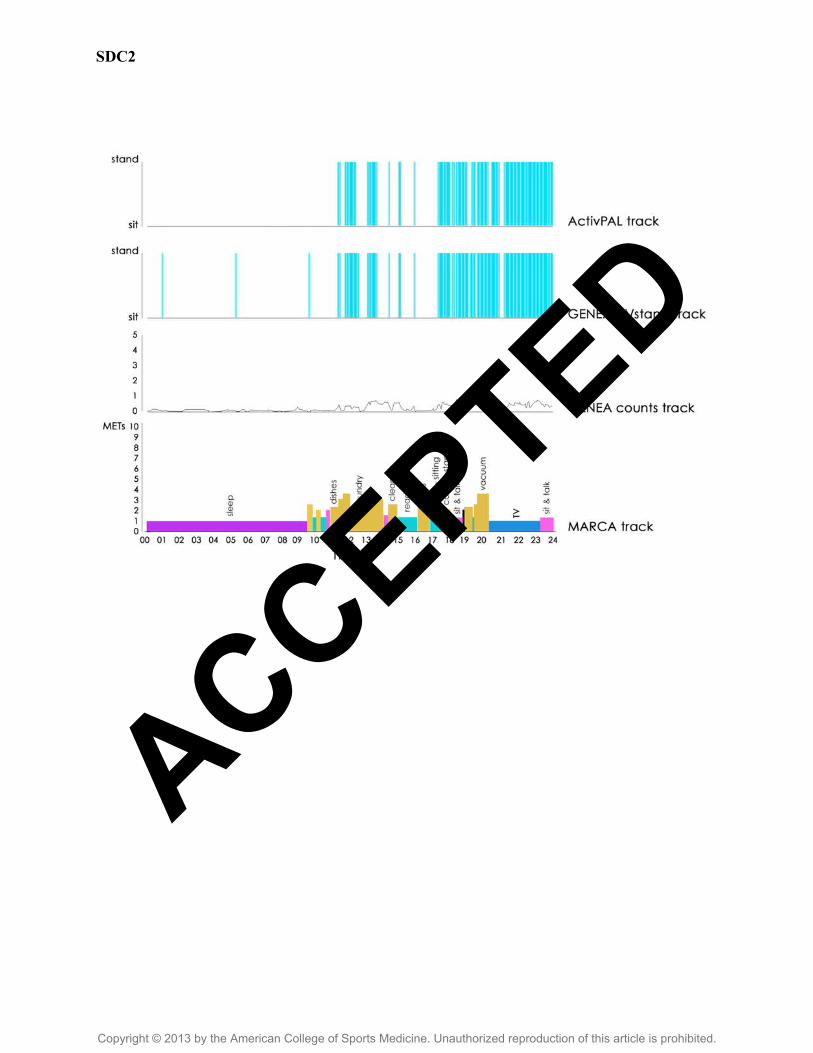
SDC2. Temporogram (plot of activities against time, measured by multiple methods) for a parti-
cipant with high posture allocation agreement between the GENEActiv and the activPAL (96%).
ActivPAL posture allocation (top), GENEActiv wrist posture allocation (second from top),
GENEActiv wrist accelerometer vector magnitude (g·min, third from top) and MARCA data (en-
ergy expenditure in METs (metabolic equivalents) bottom), plotted against time.
SDC3. Temporogram (plot of activities against time, measured by multiple methods) for a parti-
cipant with low posture allocation agreement between the GENEActiv and the activPAL (80%).
ActivPAL posture allocation (top), GENEActiv wrist posture allocation (second from top),
GENEActiv wrist accelerometer vector magnitude (g·min, third from top) and MARCA data (en-
ergy expenditure in METs (metabolic equivalents) bottom), plotted against time.
ACCEPTED
Copyright © 2013 by the American College of Sports Medicine. Unauthorized reproduction of this article is prohibited.

SDC1
ACCEPTED
Copyright © 2013 by the American College of Sports Medicine. Unauthorized reproduction of this article is prohibited.
SDC2
ACCEPTED
Copyright © 2013 by the American College of Sports Medicine. Unauthorized reproduction of this article is prohibited.
SDC3
ACCEPTED
Copyright © 2013 by the American College of Sports Medicine. Unauthorized reproduction of this article is prohibited.
Top Related
Copyright © 2022 FDOKUMEN

