


Bahasa
Halaman
Hukum


Asia Pacific Functional Food Ingredients Market: APAC Industry Analysis and Opportunity Assessment, 2016–2026
©2015 Future Market Insights, All Rights Reserved

Table of Contents (1/11)
©2015 Future Market Insights, All Rights Reserved2
1. Asia Pacific Functional Food Ingredients Market Executive Summary
2. Assumptions & Acronyms Used
3. Research Methodology
4. Market Overview
4.1. Introduction
4.1.1. Market Definition
4.1.2. Market Taxonomy
4.2. Market Dynamics
4.2.1. Drivers
4.2.2. Restraints
4.2.3. Opportunity
4.3. Asia Pacific Functional Food Ingredients Market Forecast, 2014–2026
4.3.1. Market Size (Value) Forecast
4.3.1.1. Y-o-Y Growth Projections
4.3.1.2. Absolute $ Opportunity
4.4. Market Trends
4.5. Key Regulations
4.6. Asia Pacific Market Snapshot (2015)
4.6.1. Market Overview By Ingredient Type
4.6.2. Market Overview By Application
4.6.3. Market Overview By Country
5. Asia Pacific Functional Food Ingredients Market Analysis, By Ingredient Type
5.1. Asia Pacific Functional Food Ingredients Market Analysis & Forecast, 2016–2026
5.1.1. Y-o-Y Growth Comparison, By Ingredient Type
5.1.2. Basis Point Share (BPS) Analysis, By Ingredient Type

Table of Contents (2/11)
©2015 Future Market Insights, All Rights Reserved3
5.2. Market Forecast By Ingredient Type
5.2.1. Vitamins
5.2.1.1. Absolute $ Opportunity
5.2.1.2. Market Value Forecast
5.2.2. Minerals
5.2.3. Prebiotics & Dietary Fibre
5.2.4. Probiotics
5.2.5. Carotenoids
5.2.6. Protein
5.2.7. Omega 3 Fatty Acids
5.3. Market Attractiveness By Ingredient Type
5.4. Market Trends
6. Asia Pacific Functional Food Ingredients Market Analysis, By Application
6.1. Asia Pacific Functional Food Ingredients Market Analysis & Forecast, 2016–2026
6.1.1. Y-o-Y Growth Comparison, By Application
6.1.2. Basis Point Share (BPS) Analysis, By Application
6.2. Market Forecast By Application
6.2.1. Beverages
6.2.1.1. Absolute $ Opportunity
6.2.1.2. Market Value Forecast
6.2.2. Dairy & dairy-based products
6.2.3. Infant Food
6.2.4. Bakery & Confectionery
6.3. Market Attractiveness By Application
6.4. Market Trends

Table of Contents (4/11)
©2015 Future Market Insights, All Rights Reserved4
7. Asia Pacific Functional Food Ingredients Market Analysis, By Country
7.1. Asia Pacific Functional Food Ingredients Market Analysis & Forecast, 2016–2026
7.1.1. Y-o-Y Growth Projections, By Country
7.1.2. Basis Point Share (BPS) Analysis, By Country
7.2. Market Forecast By Country
7.2.1. Singapore Market Value Forecast
7.2.2. India Market Value Forecast
7.2.3. Japan Market Value Forecast
7.2.4. China Market Value Forecast
7.2.5. Thailand Market Value Forecast
7.2.6. Malaysia Market Value Forecast
7.2.7. Indonesia Market Value Forecast
7.3. Regional Key Trends
8. Singapore Functional Food Ingredients Market Analysis
8.1. Singapore Market Forecast
8.1.1. Market Value Forecast By Country
8.1.1.1. Absolute $ Opportunity
8.1.2. Market Value Forecast By Ingredient Type
8.1.2.1. Vitamins
8.1.2.2. Minerals
8.1.2.3. Prebiotics & Dietary Fibre
8.1.2.4. Probiotics
8.1.2.5. Carotenoids
8.1.2.6. Protein
8.1.2.7. Omega 3 Fatty Acids

Table of Contents (5/11)
©2015 Future Market Insights, All Rights Reserved5
8.1.3. Market Value Forecast By Application
8.1.3.1. Beverages
8.1.3.2. Dairy & dairy-based products
8.1.3.3. Infant Food
8.1.3.4. Bakery & Confectionery
8.1.4. Market Attractiveness Analysis
8.1.4.1. By Country
8.1.4.2. By Ingredient Type
8.1.4.3. By Application
9. India Functional Food Ingredients Market Analysis
9.1. India Market Forecast
9.1.1. Market Value Forecast By Country
9.1.1.1. Absolute $ Opportunity
9.1.2. Market Value Forecast By Ingredient Type
9.1.2.1. Vitamins
9.1.2.2. Minerals
9.1.2.3. Prebiotics & Dietary Fibre
9.1.2.4. Probiotics
9.1.2.5. Carotenoids
9.1.2.6. Protein
9.1.2.7. Omega 3 Fatty Acids
9.1.3. Market Value Forecast By Application
9.1.3.1. Beverages
9.1.3.2. Dairy & dairy-based products
9.1.3.3. Infant Food

Table of Contents (6/11)
©2015 Future Market Insights, All Rights Reserved6
9.1.3.4. Bakery & Confectionery
9.1.4. Market Attractiveness Analysis
9.1.4.1. By Country
9.1.4.2. By Ingredient Type
9.1.4.3. By Application
10. Japan Functional Food Ingredients Market Analysis
10.1. Japan Functional Food Ingredients Market Forecast
10.1.1. Market Value Forecast By Country
10.1.1.1. Absolute $ Opportunity
10.1.2. Market Value Forecast By Ingredient Type
10.1.2.1. Vitamins
10.1.2.2. Minerals
10.1.2.3. Prebiotics & Dietary Fibre
10.1.2.4. Probiotics
10.1.2.5. Carotenoids
10.1.2.6. Protein
10.1.2.7. Omega 3 Fatty Acids
10.1.3. Market Value Forecast By Application
10.1.3.1. Beverages
10.1.3.2. Dairy & dairy-based products
10.1.3.3. Infant Food
10.1.3.4. Bakery & Confectionery
10.1.4. Market Attractiveness Analysis
10.1.4.1. By Country
10.1.4.2. By Ingredient Type

Table of Contents (7/11)
©2015 Future Market Insights, All Rights Reserved7
10.1.4.3. By Application
11. China Functional Food Ingredients Market Analysis
11.1. China Functional Food Ingredients Market Forecast
11.1.1. Market Value Forecast By Country/Region
11.1.1.1. Absolute $ Opportunity
11.1.2. Market Value Forecast By Ingredient Type
11.1.2.1. Vitamins
11.1.2.2. Minerals
11.1.2.3. Prebiotics & Dietary Fibre
11.1.2.4. Probiotics
11.1.2.5. Carotenoids
11.1.2.6. Protein
11.1.2.7. Omega 3 Fatty Acids
11.1.3. Market Value Forecast By Application
11.1.3.1. Beverages
11.1.3.2. Dairy & dairy-based products
11.1.3.3. Infant Food
11.1.3.4. Bakery & Confectionery
11.1.4. Market Attractiveness Analysis
11.1.4.1. By Country
11.1.4.2. By Ingredient Type
11.1.4.3. By Application
12. Thailand Functional Food Ingredients Market Analysis
12.1. Thailand Functional Food Ingredients Market Forecast
12.1.1. Market Value Forecast By Country

Table of Contents (8/11)
©2015 Future Market Insights, All Rights Reserved8
12.1.1.1. Absolute $ Opportunity
12.1.2. Market Value Forecast By Ingredient Type
12.1.2.1. Vitamins
12.1.2.2. Minerals
12.1.2.3. Prebiotics & Dietary Fibre
12.1.2.4. Probiotics
12.1.2.5. Carotenoids
12.1.2.6. Protein
12.1.2.7. Omega 3 Fatty Acids
12.1.3. Market Value Forecast By Application
12.1.3.1. Beverages
12.1.3.2. Dairy & dairy-based products
12.1.3.3. Infant Food
12.1.3.4. Bakery & Confectionery
12.1.4. Market Attractiveness Analysis
12.1.4.1. By Country
12.1.4.2. By Ingredient Type
12.1.4.3. By Application
13. Malaysia Functional Food Ingredients Market Analysis
13.1. Malaysia Functional Food Ingredients Market Forecast
13.1.1. Market Value Forecast By Ingredient Type
13.1.1.1. Vitamins
13.1.1.2. Minerals
13.1.1.3. Prebiotics & Dietary Fibre
13.1.1.4. Probiotics

Table of Contents (9/11)
©2015 Future Market Insights, All Rights Reserved9
13.1.1.5. Carotenoids
13.1.1.6. Protein
13.1.1.7. Omega 3 Fatty Acids
13.1.2. Market Value Forecast By Application
13.1.2.1. Beverages
13.1.2.2. Dairy & dairy-based products
13.1.2.3. Infant Food
13.1.2.4. Bakery & Confectionery
13.1.3. Market Attractiveness Analysis
13.1.3.1. By Country
13.1.3.2. By Ingredient Type
13.1.3.3. By Application
14. Indonesia Functional Food Ingredients Market Analysis
14.1. Indonesia Functional Food Ingredients Market Forecast
14.1.1. Market Value Forecast By Country
14.1.1.1. Absolute $ Opportunity
14.1.2. Market Value Forecast By Ingredient Type
14.1.2.1. Vitamins
14.1.2.2. Minerals
14.1.2.3. Prebiotics & Dietary Fibre
14.1.2.4. Probiotics
14.1.2.5. Carotenoids
14.1.2.6. Protein
14.1.2.7. Omega 3 Fatty Acids
14.1.3. Market Value Forecast By Application

Table of Contents (10/11)
©2015 Future Market Insights, All Rights Reserved10
14.1.3.1. Beverages
14.1.3.2. Dairy & dairy-based products
14.1.3.3. Infant Food
14.1.3.4. Bakery & Confectionery
14.1.4. Market Attractiveness Analysis
14.1.4.1. By Country
14.1.4.2. By Ingredient Type
14.1.4.3. By Application
15. Competitive Landscape—By Ingredient
15.1. Competition Dashboard
15.2. Company Profiles
15.2.1. Sciphar Natural Products Co., Ltd.
15.2.1.1. Overview
15.2.1.2. Product Offering
15.2.1.3. Key Strategies
15.2.2. Marathwada Chemical Industries Pvt. Ltd.
15.2.3. FENCHEM BIOTEK LTD.
15.2.4. Arjuna Natural Extracts Ltd.
15.2.5. NEW ASIA INGREDIENTS PTE LTD.
15.2.6. Shandong Yuwang Industrial Co., Ltd.
15.2.7. Supreem Pharmaceuticals Mysore Pvt. Ltd.
15.2.8. Bio Actives Japan Corporation
15.2.9. Global Specialty Ingredients (M) Sdn. Bhd.
15.2.10. Excellent Health Products Co., Ltd.
16. Competitive Landscape—By Product

Table of Contents (11/11)
©2015 Future Market Insights, All Rights Reserved11
16.1. Competition Dashboard
16.2. Company Profiles
16.2.1. Nestlé S.A.
16.2.1.1. Overview
16.2.1.2. Operating Brands
16.2.1.3. Key Strategy
16.2.1.4. Key Developments
16.2.1.5. Key Financials
16.2.2. PepsiCo, Inc.
16.2.3. ConAgra Foods, Inc.
16.2.4. Kellogg Company
16.2.5. Yakult Honsha Co., Ltd.
16.2.6. Danone S.A.
16.2.7. Meiji Holdings Co., Ltd.
16.2.8. The Coca-Cola Co.
16.2.9. Tata Global Beverages Ltd.
16.2.10. General Mills, Inc.

List of Figures
©2015 Future Market Insights, All Rights Reserved12
Figure 1: Asia Pacific Functional Food Ingredients Market Value & Y-o-Y Growth Forecast, 2015–2026
Figure 2: Asia Pacific Functional Food Ingredients Market Absolute $ Opportunity (US$ Mn), 2016–2026
Figure 3: Asia Pacific Functional Food Ingredients Market Value Share and BPS Analysis By Ingredient Type, 2016 & 2026
Figure 4: Asia Pacific Functional Food Ingredients Market Y-o-Y Growth by Ingredient Type, 2016–2026
Figure 5: Asia Pacific Functional Food Ingredients Market Absolute $ Opportunity (US$ Mn), by Vitamins Segment, 2016─2026
Figure 6: Asia Pacific Functional Food Ingredients Market Absolute $ Opportunity (US$ Mn ), by Minerals Segment, 2016─2026
Figure 7: Asia Pacific Functional Food Ingredients Market Absolute $ Opportunity (US$ Mn), by Prebiotics & Dietary Fibre Segment, 2016─2026
Figure 8: Asia Pacific Functional Food Ingredients Market Absolute $ Opportunity (US$ Mn), by Probiotics Segment, 2016─2026
Figure 9: Asia Pacific Functional Food Ingredients Market Absolute $ Opportunity (US$ Mn), by Carotenoids Segment, 2016─2026
Figure 10: Asia Pacific Functional Food Ingredients Market Absolute $ Opportunity (US$ Mn), by Protein Segment, 2016─2026
Figure 11: Asia Pacific Functional Food Ingredients Market Absolute $ Opportunity (US$ Mn), by Omega 3 Fatty Acids Segment, 2016─2026
Figure 12: Asia Pacific Functional Food Ingredients Market Value Share and BPS Analysis By Application, 2016 & 2026
Figure 13: Asia Pacific Functional Food Ingredients Market Y-o-Y Growth by Application, 2016–2026
Figure 14: Asia Pacific Functional Food Ingredients Market Absolute $ Opportunity (US$ Mn), by Beverages Segment, 2016─2026
Figure 15: Asia Pacific Functional Food Ingredients Market Absolute $ Opportunity (US$ Mn ), by Dairy & dairy-based products Segment, 2016─2026
Figure 16: Asia Pacific Functional Food Ingredients Market Absolute $ Opportunity (US$ Mn), by Infant Food Segment, 2016─2026
Figure 17: Asia Pacific Functional Food Ingredients Market Absolute $ Opportunity (US$ Mn ), by Bakery & Confectionery Segment, 2016─2026
Figure 18: Asia Pacific Functional Food Ingredients Market Attractiveness Analysis By Ingredients Type, 2016–2026
Figure 19: Asia Pacific Functional Food Ingredients Market Attractiveness Analysis By Application, 2016–2026
Figure 20: Asia Pacific Functional Food Ingredients Market Value Share and BPS Analysis By Country, 2016 & 2026

List of Figures
©2015 Future Market Insights, All Rights Reserved13
Figure 21: Asia Pacific Functional Food Ingredients Market Y-o-Y Growth by Country, 2016–2026
Figure 22: Asia Pacific Functional Food Ingredients Market Attractiveness Analysis By Country, 2016–2026
Figure 23: Singapore Functional Food Ingredients Market Value (US$ Mn), 2015–2026
Figure 24: Singapore Functional Food Ingredients Market Absolute $ Opportunity (US$ Mn), 2016–2026
Figure 25: Singapore Functional Food Ingredients Market Absolute $ Opportunity (US$ Mn), by Vitamins Segment, 2016─2026
Figure 26: Singapore Functional Food Ingredients Market Absolute $ Opportunity (US$ Mn ), by Minerals Segment, 2016─2026
Figure 27: Singapore Functional Food Ingredients Market Absolute $ Opportunity (US$ Mn), by Prebiotics & Dietary Fibre Segment, 2016─2026
Figure 28: Singapore Functional Food Ingredients Market Absolute $ Opportunity (US$ Mn), by Probiotics Segment, 2016─2026
Figure 29: Singapore Functional Food Ingredients Market Absolute $ Opportunity (US$ Mn), by Carotenoids Segment, 2016─2026
Figure 30: Singapore Functional Food Ingredients Market Absolute $ Opportunity (US$ Mn), by Protein Segment, 2016─2026
Figure 31: Singapore Functional Food Ingredients Market Absolute $ Opportunity (US$ Mn), by Omega 3 Fatty Acids Segment, 2016─2026
Figure 32: Singapore Functional Food Ingredients Market Absolute $ Opportunity (US$ Mn), by Beverages Segment, 2016─2026
Figure 33: Singapore Functional Food Ingredients Market Absolute $ Opportunity (US$ Mn ), by Dairy & dairy-based products Segment, 2016─2026
Figure 34: Singapore Functional Food Ingredients Market Absolute $ Opportunity (US$ Mn), by Infant Food Segment, 2016─2026
Figure 35: Singapore Functional Food Ingredients Market Absolute $ Opportunity (US$ Mn ), by Bakery & Confectionery Segment, 2016─2026
Figure 36: Singapore Functional Food Ingredients Market Attractiveness Analysis By Ingredients Type, 2016–2026
Figure 37: Singapore Functional Food Ingredients Market Attractiveness Analysis By Application, 2016–2026
Figure 38: India Functional Food Ingredients Market Value
Figure 39: India Functional Food Ingredients Market
Figure 40: India Functional Food Ingredients Market Absolute $ Opportunity (US$ Mn), by Vitamins Segment, 2016─2026

List of Figures
©2015 Future Market Insights, All Rights Reserved14
Figure 41: India Functional Food Ingredients Market Absolute $ Opportunity (US$ Mn ), by Minerals Segment, 2016─2026
Figure 42: India Functional Food Ingredients Market Absolute $ Opportunity (US$ Mn), by Prebiotics & Dietary Fibre Segment, 2016─2026
Figure 43: India Functional Food Ingredients Market Absolute $ Opportunity (US$ Mn), by Probiotics Segment, 2016─2026
Figure 44: India Functional Food Ingredients Market Absolute $ Opportunity (US$ Mn), by Carotenoids Segment, 2016─2026
Figure 45: India Functional Food Ingredients Market Absolute $ Opportunity (US$ Mn), by Protein Segment, 2016─2026
Figure 46: India Functional Food Ingredients Market Absolute $ Opportunity (US$ Mn), by Omega 3 Fatty Acids Segment, 2016─2026
Figure 47: India Functional Food Ingredients Market Absolute $ Opportunity (US$ Mn), by Beverages Segment, 2016─2026
Figure 48: India Functional Food Ingredients Market Absolute $ Opportunity (US$ Mn ), by Dairy & dairy-based products Segment, 2016─2026
Figure 49: India Functional Food Ingredients Market Absolute $ Opportunity (US$ Mn), by Infant Food Segment, 2016─2026
Figure 50: India Functional Food Ingredients Market Absolute $ Opportunity (US$ Mn ), by Bakery & Confectionery Segment, 2016─2026
Figure 51: India Functional Food Ingredients Market Attractiveness Analysis By Ingredients Type, 2016–2026
Figure 52: India Functional Food Ingredients Market Attractiveness Analysis By Application, 2016–2026
Figure 53 Japan Functional Food Ingredients Market Value (US$ Mn), 2015–2026
Figure 54: Japan Functional Food Ingredients Market Absolute $ Opportunity (US$ Mn), 2016–2026
Figure 55: Japan Functional Food Ingredients Market Absolute $ Opportunity (US$ Mn), by Vitamins Segment, 2016─2026
Figure 56: Japan Functional Food Ingredients Market Absolute $ Opportunity (US$ Mn ), by Minerals Segment, 2016─2026
Figure 57: Japan Functional Food Ingredients Market Absolute $ Opportunity (US$ Mn), by Prebiotics & Dietary Fibre Segment, 2016─2026
Figure 58: Japan Functional Food Ingredients Market Absolute $ Opportunity (US$ Mn), by Probiotics Segment, 2016─2026
Figure 59: Japan Functional Food Ingredients Market Absolute $ Opportunity (US$ Mn), by Carotenoids Segment, 2016─2026
Figure 60: Japan Functional Food Ingredients Market Absolute $ Opportunity (US$ Mn), by Protein Segment, 2016─2026

List of Figures
©2015 Future Market Insights, All Rights Reserved15
Figure 61: Japan Functional Food Ingredients Market Absolute $ Opportunity (US$ Mn), by Omega 3 Fatty Acids Segment, 2016─2026
Figure 62: Japan Functional Food Ingredients Market Absolute $ Opportunity (US$ Mn), by Beverages Segment, 2016─2026
Figure 63: Japan Functional Food Ingredients Market Absolute $ Opportunity (US$ Mn ), by Dairy & dairy-based products Segment, 2016─2026
Figure 64: Japan Functional Food Ingredients Market Absolute $ Opportunity (US$ Mn), by Infant Food Segment, 2016─2026
Figure 65: Japan Functional Food Ingredients Market Absolute $ Opportunity (US$ Mn ), by Bakery & Confectionery Segment, 2016─2026
Figure 66: Japan Functional Food Ingredients Market
Figure 67: Japan Functional Food Ingredients Market
Figure 68: China Functional Food Ingredients Market Value (US$ Mn), 2015–2026
Figure 69: China Functional Food Ingredients Market Absolute $ Opportunity (US$ Mn), 2016–2026
Figure 70: China Functional Food Ingredients Market Absolute $ Opportunity (US$ Mn), by Vitamins Segment, 2016─2026
Figure 71: China Functional Food Ingredients Market Absolute $ Opportunity (US$ Mn ), by Minerals Segment, 2016─2026
Figure 72: China Functional Food Ingredients Market Absolute $ Opportunity (US$ Mn), by Prebiotics & Dietary Fibre Segment, 2016─2026
Figure 73: China Functional Food Ingredients Market Absolute $ Opportunity (US$ Mn), by Probiotics Segment, 2016─2026
Figure 74: China Functional Food Ingredients Market Absolute $ Opportunity (US$ Mn), by Carotenoids Segment, 2016─2026
Figure 75: China Functional Food Ingredients Market Absolute $ Opportunity (US$ Mn), by Protein Segment, 2016─2026
Figure 76: China Functional Food Ingredients Market Absolute $ Opportunity (US$ Mn), by Omega 3 Fatty Acids Segment, 2016─2026
Figure 77: China Functional Food Ingredients Market Absolute $ Opportunity (US$ Mn), by Beverages Segment, 2016─2026
Figure 78: China Functional Food Ingredients Market Absolute $ Opportunity (US$ Mn ), by Dairy & dairy-based products Segment, 2016─2026
Figure 79: China Functional Food Ingredients Market Absolute $ Opportunity (US$ Mn), by Infant Food Segment, 2016─2026
Figure 80: China Functional Food Ingredients Market Absolute $ Opportunity (US$ Mn ), by Bakery & Confectionery Segment, 2016─2026
List of Figures
©2015 Future Market Insights, All Rights Reserved16
Figure 81: China Functional Food Ingredients Market Attractiveness Analysis By Ingredients Type, 2016–2026
Figure 82: China Functional Food Ingredients Market Attractiveness Analysis By Application, 2016–2026
Figure 83: Thailand Functional Food Ingredients Market Value
Figure 84: Thailand Functional Food Ingredients Market
Figure 85: Thailand Functional Food Ingredients Market Absolute $ Opportunity (US$ Mn), by Vitamins Segment, 2016─2026
Figure 86: Thailand Functional Food Ingredients Market Absolute $ Opportunity (US$ Mn ), by Minerals Segment, 2016─2026
Figure 87: Thailand Functional Food Ingredients Market Absolute $ Opportunity (US$ Mn), by Prebiotics & Dietary Fibre Segment, 2016─2026
Figure 88: Thailand Functional Food Ingredients Market Absolute $ Opportunity (US$ Mn), by Probiotics Segment, 2016─2026
Figure 89: Thailand Functional Food Ingredients Market Absolute $ Opportunity (US$ Mn), by Carotenoids Segment, 2016─2026
Figure 90: Thailand Functional Food Ingredients Market Absolute $ Opportunity (US$ Mn), by Protein Segment, 2016─2026
Figure 91: Thailand Functional Food Ingredients Market Absolute $ Opportunity (US$ Mn), by Omega 3 Fatty Acids Segment, 2016─2026
Figure 92: Thailand Functional Food Ingredients Market Absolute $ Opportunity (US$ Mn), by Beverages Segment, 2016─2026
Figure 93: Thailand Functional Food Ingredients Market Absolute $ Opportunity (US$ Mn ), by Dairy & dairy-based products Segment, 2016─2026
Figure 94: Thailand Functional Food Ingredients Market Absolute $ Opportunity (US$ Mn), by Infant Food Segment, 2016─2026
Figure 95: Thailand Functional Food Ingredients Market Absolute $ Opportunity (US$ Mn ), by Bakery & Confectionery Segment, 2016─2026
Figure 96: Thailand Functional Food Ingredients Market Attractiveness Analysis By Ingredients Type, 2016–2026
Figure 97: Thailand Functional Food Ingredients Market Attractiveness Analysis By Application, 2016–2026
Figure 98: Malaysia Functional Food Ingredients Market Value (US$ Mn), 2015–2026
Figure 99: Malaysia Functional Food Ingredients Market Absolute $ Opportunity (US$ Mn), 2016–2026
Figure 100: Malaysia Functional Food Ingredients Market Absolute $ Opportunity (US$ Mn), by Vitamins Segment, 2016─2026

List of Figures
©2015 Future Market Insights, All Rights Reserved17
Figure 101: Malaysia Functional Food Ingredients Market Absolute $ Opportunity (US$ Mn ), by Minerals Segment, 2016─2026
Figure 102: Malaysia Functional Food Ingredients Market Absolute $ Opportunity (US$ Mn), by Prebiotics & Dietary Fibre Segment, 2016─2026
Figure 103: Malaysia Functional Food Ingredients Market Absolute $ Opportunity (US$ Mn), by Probiotics Segment, 2016─2026
Figure 104: Malaysia Functional Food Ingredients Market Absolute $ Opportunity (US$ Mn), by Carotenoids Segment, 2016─2026
Figure 105: Malaysia Functional Food Ingredients Market Absolute $ Opportunity (US$ Mn), by Protein Segment, 2016─2026
Figure 106: Malaysia Functional Food Ingredients Market Absolute $ Opportunity (US$ Mn), by Omega 3 Fatty Acids Segment, 2016─2026
Figure 107: Malaysia Functional Food Ingredients Market Absolute $ Opportunity (US$ Mn), by Beverages Segment, 2016─2026
Figure 108: Malaysia Functional Food Ingredients Market Absolute $ Opportunity (US$ Mn ), by Dairy & dairy-based products Segment, 2016─2026
Figure 109: Malaysia Functional Food Ingredients Market Absolute $ Opportunity (US$ Mn), by Infant Food Segment, 2016─2026
Figure 110: Malaysia Functional Food Ingredients Market Absolute $ Opportunity (US$ Mn ), by Bakery & Confectionery Segment, 2016─2026
Figure 111: Malaysia Functional Food Ingredients Market Attractiveness Analysis By Ingredients Type, 2016–2026
Figure 112: Malaysia Functional Food Ingredients Market Attractiveness Analysis By Application, 2016–2026
Figure 113: Indonesia Functional Food Ingredients Market Value (US$ Mn), 2015–2026
Figure 114: Indonesia Functional Food Ingredients Market Absolute $ Opportunity (US$ Mn), 2016–2026
Figure 115: Indonesia Functional Food Ingredients Market Absolute $ Opportunity (US$ Mn), by Vitamins Segment, 2016─2026
Figure 116: Indonesia Functional Food Ingredients Market Absolute $ Opportunity (US$ Mn ), by Minerals Segment, 2016─2026
Figure 117: Indonesia Functional Food Ingredients Market Absolute $ Opportunity (US$ Mn), by Prebiotics & Dietary Fibre Segment, 2016─2026
Figure 118: Indonesia Functional Food Ingredients Market Absolute $ Opportunity (US$ Mn), by Probiotics Segment, 2016─2026
Figure 119: Indonesia Functional Food Ingredients Market Absolute $ Opportunity (US$ Mn), by Carotenoids Segment, 2016─2026
Figure 120: Indonesia Functional Food Ingredients Market Absolute $ Opportunity (US$ Mn), by Protein Segment, 2016─2026

List of Figures
©2015 Future Market Insights, All Rights Reserved18
Figure 121: Indonesia Functional Food Ingredients Market Absolute $ Opportunity (US$ Mn), by Omega 3 Fatty Acids Segment, 2016─2026
Figure 122: Indonesia Functional Food Ingredients Market Absolute $ Opportunity (US$ Mn), by Beverages Segment, 2016─2026
Figure 123: Indonesia Functional Food Ingredients Market Absolute $ Opportunity (US$ Mn ), by Dairy & dairy-based products Segment, 2016─2026
Figure 124: Indonesia Functional Food Ingredients Market Absolute $ Opportunity (US$ Mn), by Infant Food Segment, 2016─2026
Figure 125: Indonesia Functional Food Ingredients Market Absolute $ Opportunity (US$ Mn ), by Bakery & Confectionery Segment, 2016─2026
Figure 126: Indonesia Functional Food Ingredients Market Attractiveness Analysis By Ingredients Type, 2016–2026
Figure 127: Indonesia Functional Food Ingredients Market Attractiveness Analysis By Application, 2016–2026

List of Table
©2015 Future Market Insights, All Rights Reserved19
Table 1: Asia Pacific Functional Food Ingredients Market Value (US$ Mn) and Absolute $ Opportunity (US$ Mn) by Ingredient Type,
Table 2: Asia Pacific Functional Food Ingredients Market Value (US$ Mn) and Absolute $ Opportunity (US$ Mn) by Application, 2015–2026
Table 3: Asia Pacific Functional Food Ingredients Market Value (US$ Mn) and Absolute $ Opportunity by Country, 2015–2026
Table 4: Singapore Functional Food Ingredients Market Value (US$ Mn) and absolute $ opportunity (US$ Mn) by Ingredient Type,
Table 5: Singapore Functional Food Ingredients Market Value (US$ Mn) and Absolute $ Opportunity (US$ Mn) by Application, 2015–2026
Table 6: India Functional Food Ingredients Market Value (US$ Mn) and absolute $ opportunity (US$ Mn) by Ingredient Type, 2015–2026
Table 7: India Functional Food Ingredients Market Value (US$ Mn) and Absolute $ Opportunity (US$ Mn) by Application, 2015–2026
Table 8: Japan Functional Food Ingredients Market Value (US$ Mn) and absolute $ opportunity (US$ Mn) by Ingredient Type, 2015–2026
Table 9: Japan Functional Food Ingredients Market Value (US$ Mn) and Absolute $ Opportunity (US$ Mn) by Application, 2015–2026
Table 10: China Functional Food Ingredients Market Value (US$ Mn) and absolute $ opportunity (US$ Mn) by Ingredient Type, 2015–2026
Table 11: China Functional Food Ingredients Market Value (US$ Mn) and Absolute $ Opportunity (US$ Mn) by Application, 2015–2026
Table 12: Thailand Functional Food Ingredients Market Value (US$ Mn) and absolute $ opportunity (US$ Mn) by Ingredient Type,
Table 13: Thailand Functional Food Ingredients Market Value (US$ Mn) and Absolute $ Opportunity (US$ Mn) by Application, 2015–2026
Table 14: Malaysia Functional Food Ingredients Market Value (US$ Mn) and absolute $ opportunity (US$ Mn) by Ingredient Type,
Table 15: Malaysia Functional Food Ingredients Market Value (US$ Mn) and Absolute $ Opportunity (US$ Mn) by Application, 2015–2026
Table 16: Indonesia Functional Food Ingredients Market Value (US$ Mn) and Absolute $ Opportunity (US$ Mn) by Ingredient Type, 2015–2026
Table 17: Indonesia Functional Food Ingredients Market Value (US$ Mn) and Absolute $ Opportunity (US$ Mn) by Application, 2015–2026

Executive Summary
Section 1
©2015 Future Market Insights, All Rights Reserved20

Asia Pacific Functional Food Ingredients Market :Executive Summary (1/3)
• Increasing demand for fortified food products
• Increasing baby boomer population
• Stringent government regulations• Raw material supply chain issues
Dri
vers R
estrain
ts
In this report, the Asia Pacific functional foodingredients market is segmented on the basis ofingredients type, application and region
In terms of ingredients type, the probioticsingredients segment is expected to be valued atUS$ 1,277.4 Mn by 2026, expanding at a CAGR of6.6% over the forecast period (2016–2026)
In terms of application, the dairy and dairy-basedproducts segment is expected to be valued atUS$ 1,473.1 Mn by 2026, expanding at a CAGR of6.4% during the forecast period
By country, Japan is expected to dominate theAsia Pacific functional food ingredients market,accounting for a revenue share of 35.1% by 2026
Increasing Participation in exhibitions:
Various ingredients suppliers operating in the AsiaPacific region are continuously participating inexhibitions in order to showcase their respectiveingredients portfolio and to also enter into newmarkets.
Increasing use of probiotics in dairy anddairy-based products
Companies are increasingly manufacturing foodproducts incorporated with probiotic bacteria.Probiotic dairy products such as yogurts includebacteria strains such as lacidophilus andbifidobacterium.
Overview Market TrendsSegment
Application
• Beverages• Dairy & Dairy Based
Products• Infant Food• Bakery & Confectionery
Ingredients Type
• Vitamins• Minerals• Prebiotics• Probiotics• Carotenoids• Protein• Omega 3 Fatty Acids
Asia Pacific Functional Food Ingredients Market
©2015 Future Market Insights, All Rights Reserved21

8.8%
14.9%
31.7%
19.1%
4.8%
11.8%
8.9%
Asia Pacific Functional Food Ingredients Market : Executive Summary (2/3)
7.9%14.6%
35.1%
19.9%
4.1%
10.7%
7.8%
Singapore India Japan China Thailand Malaysia Indonesia
25.9%
29.2%
24.1%
20.8%
Bakery & Confectionery
Infant Food
Dairy & Dairy Based Products
Beverages
16.6%
16.9%
6.8%
25.3%
4.2%
12.1%
18.1%
Omega 3 Fatty AcidsProteinCarotenoidsProbioticsPrebiotics & Dietary FibreMineralsVitamins
16.0%
16.7%
7.7%
23.6%
5.2%
12.7%
18.1%
Omega 3 Fatty Acids
Protein
Carotenoids
Probiotics
Prebiotics & Dietary Fibre
Minerals
Vitamins
2016 (E) 2026 (F)
By Ingredients TypeBy Ingredients Type By Application
Source: FMI, 2016
Global Natural and Organic Personal Care Products Market Value 2016 and 2024
Segment Share
CAGR (2016–2024) 5.9%
2016(E)
2026 (F)
25.8%
27.7%
24.6%
22.0%
Bakery & Confectionery
Infant Food
Dairy & Dairy Based Products
Beverages
By Application
©2015 Future Market Insights, All Rights Reserved22

Asia Pacific Functional Food Ingredients Market : Executive Summary (3/3)
Overall Market Approach
Target Countries
Differential Strategy
Expansion: Expansion by further extending product lines and manufacturing facilitiesrelated to functional food ingredients in the Asia Pacific region
Advanced Technology : Various ingredient manufacturers in Asia Pacific region areusing advanced technology for producing various functional food ingredients suchOmega 3 fatty acids
Japan: Japan represents the most lucrative market in the region, followed by Chinaand India. Japan accounts for significantly higher market share and is expected towitness substantial revenue growth over the forecast period.
Although China and India currently account for relatively moderate share of the AsiaPacific functional food ingredients market, the markets in these countries areexpected to witness rapid growth over the forecast periodadoption of HCS systemsfor cell analysis in this region
Expansion of production capacity and also investing continuously in R&D in order tocater to evolving demand for functional food ingredients across markets in countriesin Asia Pacific
Launch new food ingredients with multifunctional properties such as capability tocombat various diseases and also to prevent early onset of ageing
©2015 Future Market Insights, All Rights Reserved23

Assumptions & Acronyms Used
Section 2
©2015 Future Market Insights, All Rights Reserved24

Assumptions & Acronyms Used
Market & Forecast :
Yearly change in inflation rate has not been considered whileforecasting market numbers
Product-wise weighted Average Selling Price (ASP) has beenconsidered to deduce market values
Top-down approach has been used to assess market numbers foreach product category
Bottom-up approach has been used to counter-validate theapplication segment types to arrive at the market numbers
Macro-economic indicators, such as the healthcare industryoutlook, healthcare spending, Gross Domestic Product andothers, have been considered to arrive at the estimated marketnumbers
All values for market size are presented in US$ (US Dollar)
All the indicated denominations are in US$ (US Dollar)
Source :
Company annual & financial reports
Magazines, journals and newsletters
Assumptions Acronyms Used
CAGR Compound Annual Growth Rate
Y-o-Y Year-on-Year
GDP Gross Domestic Product
BPS Basis Point Share
FSSAIFood Safety and Standards Authority of India
Mn Million
©2015 Future Market Insights, All Rights Reserved25
Research Methodology
Section 3
©2015 Future Market Insights, All Rights Reserved26

Research Methodology
Systematic Research Approach
In-depth secondary research is used to determine
top industry players, products, applications, overall
market size, industry connotations, identify
distributors and manufactures, etc.
FMI formulates a detailed discussion guide to
interview industry experts
List of industry players (yacht charter service
providers) and industry specialists is developed
FMI conducts interviews with industry expert,
industry participants for data collection and
verification
Data is validated by the triangulation method,
wherein, the secondary and primary data along with
FMIs analysis are consolidated to develop the final
report
The data is scrutinized using the MS-Excel software,
to obtain qualitative and quantitative insights about
the industry
FMI delivers industry insights and information in the
required format (PDF)
Market Profiling
Discussion Guide Formulation
Respondents List Development
Data Analysis
Data Validation
Data Collection
A
C
B
Primary Research
Company Analysis
Desk Research
Identifying Key Opinion Leaders
Questionnaire Design
In-depth Interviews
Market Participants
Key Strengths
Product Portfolio
Key Focus Segments
SOLUTION
Primary Research#
Linkedin Zoominfo Salesforce Onesource
Paid Publications#
Factiva GBI Genios Meltwater
Secondary Research#
Company Websites
Company Annual Reports
White Papers Financial Reports
# includes sources of databases
©2015 Future Market Insights, All Rights Reserved27

Research Methodology
Inputs from regional
manufacturers, sencondary &
primary sources, and
benchmarking method
Excluded regional average profitability margins from estimated data collected from distributors
Estimating approximate annual consumption of end-use sectors in target
geographies
Market Value and Volume Estimates
Inputs from Government Databases, Trade Value and Volume
(Import & Export)
Growth Rate Projection and Forecast Factors
Historical demand trends
Functional food industry growth rate
Financial performance of top five companies
Macro-economic indicators such as GDP and population
Influence of increasing disposable income
©2015 Future Market Insights, All Rights Reserved28

Research Methodology
Secondary Research Primary Research Analysis and Result
Functional food ingredients producers and suppliers annual report and company website
– Product offerings
– Recent developments
– Product launches
– Production technology
– Strategies
Newspapers / Magazines /Journal
– Mergers and acquisitions
– Tie-ups and collaboration
– Production technologies
– New technologies
– Consumer perception
IMF/World Bank/Country Government websites/ ITC
– Macro-economic data points
– Trade (import export) data
Data collection and benchmarking estimates
– Identification of data gaps
– Revisiting primary and secondary sources
Data analysis
– Estimating sales figures for current year
– Mapping impact of selected forecast factors
– Identification of trends and variations in the market
– Mapping market trends on projections
– Market split based on collected data
– Developing forecast
Data triangulation
– Study of parent market and end-user Industry trends
Functional Food Ingredients Manufacturers
– Production capacity, annual production, annual sales
– Financials (approximate – current and historic)
– Approximate market share
– Regional presence
– Frequency of new product launches
– Short- and long-term expansion plans
– Collaborations or tie-ups
– Demand drivers and major challenges
Distributors
– Segment-wise volume sales estimates
– Average purchase price
– Profit margins
– Average sales price
Industry Experts
– Trends
1 2 3
©2015 Future Market Insights, All Rights Reserved29

Market Overview
Section 4
©2015 Future Market Insights, All Rights Reserved30

Asia Pacific Functional Food Ingredients : Market Overview
Functional food ingredients are types of ingredients added to food products to enhance nutritional content and also to enhance medicinal benefits. Major functional food ingredients include omega 3, vitamins, probiotics, proteins, prebiotics and others.
Various functional food ingredients are designed to offer specific health benefit such as omega-3 fatty acids (e.g. DHA) for enhancing heart health and vitamin E for improving and maintaining bone health
Functional food ingredients find application in various products such as beverages, dairy an dairy-based products, infantfood and formulas and bakery and confectionery. Among all application segments, dairy & dairy-based applicationsegment is currently the most dominant, followed by the beverage application segment.
Various food ingredient manufacturers are adopting strategies to cater to regional or domestic requirements ofcustomers. In India for instance, omega-3, which is nonvegetarian-derived product, has been developed from vegetarianvariants such as flaxseed oil and algae.
©2015 Future Market Insights, All Rights Reserved31
Source: FMI, 2016

Asia Pacific Functional Food Ingredients :Taxonomy
Vitamins Minerals Prebiotics &
Dietary Fibre Probiotics Carotenoids Protein Omega 3 Fatty
Acids
Beverages Dairy & Dairy-
based Products Infant Food Bakery &
Confectionery
Singapore India Japan China Thailand Malaysia Indonesia
©2015 Future Market Insights, All Rights Reserved32

Asia Pacific Functional Food Ingredients Market :Demand Side Drivers (1/3)
Various food manufacturers operating in the Asia Pacific functional food ingredientsmarket are developing and introducing value-added food products with functionalingredients such as probiotics and omega-3 in order to cater to growing consumerdemand for food products that offer various health benefits.
In 2011, the total number of functional food product launches increased to 493, which isapproximately double that recorded in 2010
Rising demand for functional/fortified
foods
Increasing consumer awareness regarding personal and family health across various countries in Asia Pacific is expected to fuel demand for functional food across the region, in turn driving overall growth of the APAC functional food ingredients market over the forecast period
For instance, according to the Health and Food Forum, Japan, concerns regarding health andwellness among consumers in Japan aged between the age of 20 and 70 years is increasingsignificantly. Consumer survey results indicate that around 90% of consumers in the countrymake purchasing decisions based on functionality of offered food products.
Increasing consumerawareness related to
health and fitness
©2015 Future Market Insights, All Rights Reserved33
Source: FMI, 2016
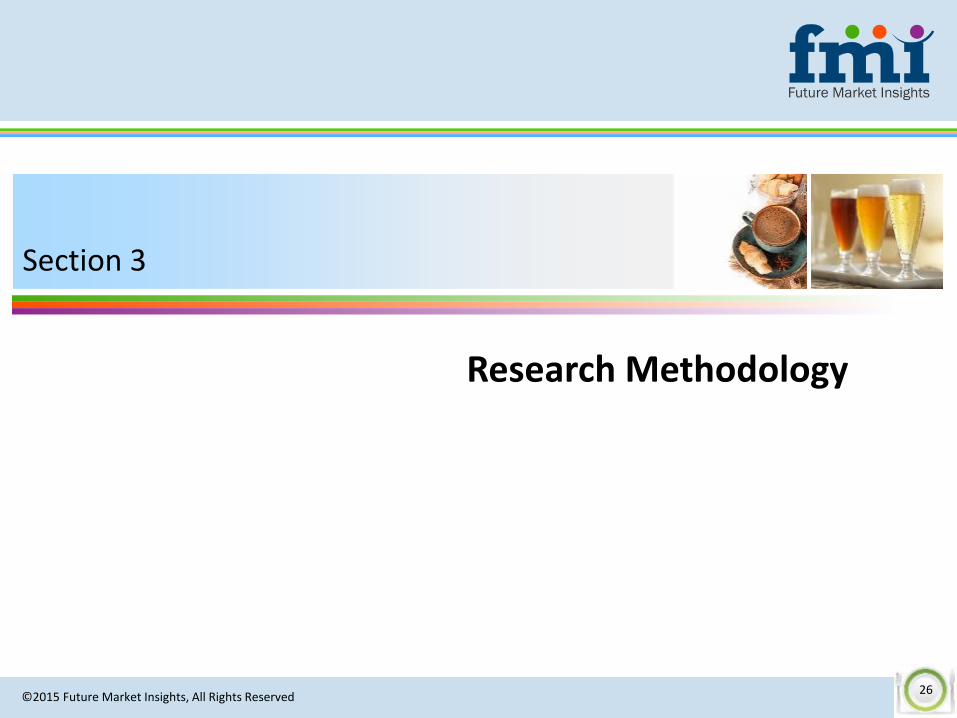
Asia Pacific Functional Food Ingredients Market : Demand Side Drivers (2/3)
One of the major factors driving demand for functional food ingredients in Asia Pacificis changing eating habits of consumers, including rising consumption of processedfoods in developing economies such as India and China due increasing purchasingpower parity
Moreover, growing GDP in emerging markets such as India and China is estimated todrive demand for convenience and processed food products In 2013 for instance, GDPs of China and India were approximately US$ 13,390 Bn and US$
4,990 Bn respectively
Developing economies
Food exhibitions
The APAC market for functional food ingredients is expected to witness significant growth over the forecast period owing to rising demand for functional food products in APAC. In order to strengthen supply channel for raw ingredients, food manufacturers in the region are sourcing functional food ingredients from various ingredient providers in order to meet the evolving and unmet demand for functional food products.
©2015 Future Market Insights, All Rights Reserved34
Source: FMI, 2016

Asia Pacific Functional Food Ingredients Market :Demand Side Drivers (3/3)
Asia Pacific functional food ingredients market is expected to witness robust marketgrowth owing to increasing baby boomer population across various countries such asIndia and China
Growth rate of elderly population (1.9%) was higher than that of the total population inthe world (1.2%) in 2013. According to the United Nations Department of Economicand Social Affairs, 437 million persons in China are projected to be aged above 60 yearsby 2050, and India would have 324 million people above 60 years of age by 2050.Population above 60 years of age is estimated to expand 3.5X that of the totalpopulation from 2025 to 2030.
Increasing baby boomer population
changing lifestyle and increasing
urbanization
The lifestyle of urban population is fast-paced as compared to that of the ruralpopulation, with urban populations being more health conscious. This is a majorfactor resulting in shift in consumption of food products containing functionalingredients owing to the various associated health benefits.
According to the United Nations Department of Economic and Social Affairs (UNDESA), India and China recorded largest rise in urban population in Asia in 2013. Indiais expected to have 404 million urban dwellers, while China is projected to be hometo 292 million urban dwellers by 2050.
©2015 Future Market Insights, All Rights Reserved35
Source: FMI, 2016

Asia Pacific Functional Food Ingredients Market : Supply Side Drivers (1/2)
Various companies operating in the functional food products market are introducingnew products, including functional food ingredients
For instance, Wahaha Group offers various brands for drinking milk products such as RuWa and Shuang Wai , which contain various functional ingredients such as amino acids,vitamins and calcium
Moreover, demand for Asia Pacific functional food ingredients is driven by increasingdemand for healthy convenience food coupled with growing consumer concernsregarding value-added food products. Due to increasing demand for functional foodingredients, technology providers are introducing new technologies in order to enableeasy incorporation of functional ingredients in food products. In 2011 for instance, Cargill, Incorporated launched Vitex AYS stabilizers, which is a
functional food ingredients system that enables dairy food product manufacturers to controlraw material cost with regard to yogurt, without affecting its characteristics. Vitex AYS is acombination of hydrocolloids and starch, which is a cost-effective alternative to gelatin anddoes not affect the texture and flavour of yogurt.
Research and development
Expansion of production facilities
Growing health concerns have resulted in increased demand for functional foodproducts over the last few years, which in turn is driving demand for functional foodingredients. Various drug manufacturing companies are adopting the strategy ofenhancing their market presence by increasing production capacity at existing plants andengaging in new product development.
In 2014, BASF SE expanded its production of omega-3 fatty acid in Asia in order to enhanceits offerings in the nutrition and health segments
©2015 Future Market Insights, All Rights Reserved36
Source: FMI, 2016
Asia Pacific Functional Food Ingredients Market : Restraints (1/1)
Regulatory framework
Raw material supply chain issues
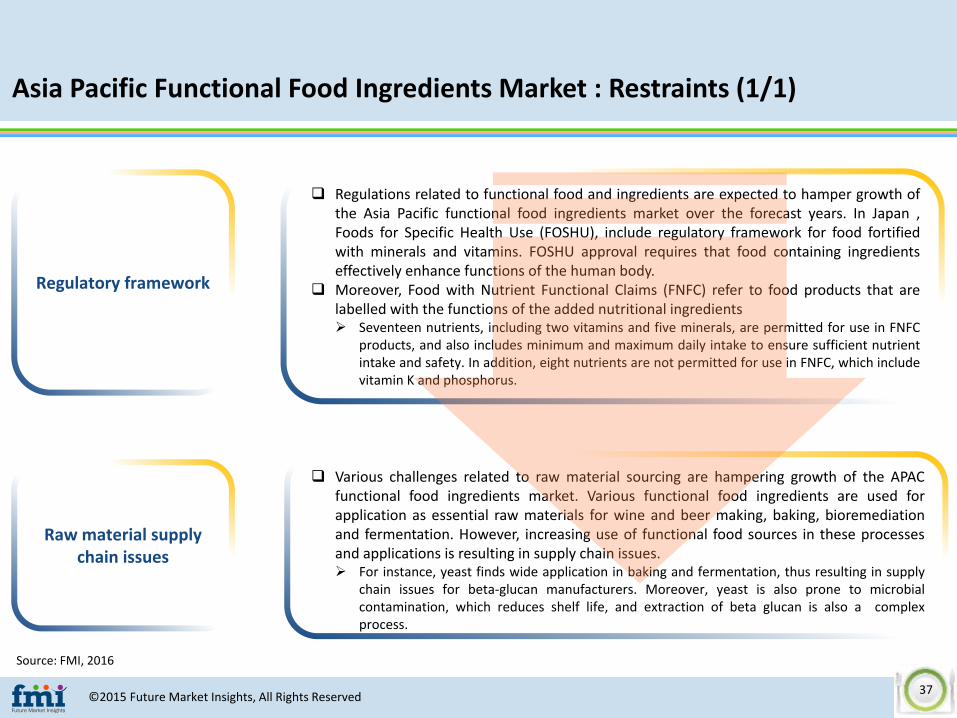
Regulations related to functional food and ingredients are expected to hamper growth ofthe Asia Pacific functional food ingredients market over the forecast years. In Japan ,Foods for Specific Health Use (FOSHU), include regulatory framework for food fortifiedwith minerals and vitamins. FOSHU approval requires that food containing ingredientseffectively enhance functions of the human body.
Moreover, Food with Nutrient Functional Claims (FNFC) refer to food products that arelabelled with the functions of the added nutritional ingredients Seventeen nutrients, including two vitamins and five minerals, are permitted for use in FNFC
products, and also includes minimum and maximum daily intake to ensure sufficient nutrientintake and safety. In addition, eight nutrients are not permitted for use in FNFC, which includevitamin K and phosphorus.
Various challenges related to raw material sourcing are hampering growth of the APACfunctional food ingredients market. Various functional food ingredients are used forapplication as essential raw materials for wine and beer making, baking, bioremediationand fermentation. However, increasing use of functional food sources in these processesand applications is resulting in supply chain issues. For instance, yeast finds wide application in baking and fermentation, thus resulting in supply
chain issues for beta-glucan manufacturers. Moreover, yeast is also prone to microbialcontamination, which reduces shelf life, and extraction of beta glucan is also a complexprocess.
©2015 Future Market Insights, All Rights Reserved37
Source: FMI, 2016

Asia Pacific Functional Food Ingredients Market : Opportunity
Food associations in Asia Pacific
region and increasing number
of health conscious
consumers
ASEAN is ranked the seventh largest economy in APAC, and consumers in the region are moreinclined towards nutritional food products offering various health benefits. Functional foodingredients are considered natural and healthy and also natural alternatives to medicines.
Moreover, various food associations in the Asia Pacific region are indirectly fuelling demand forfunctional food ingredients such as Japan Health Food & Nutrition Food Association, which is agovernment approved health-promoting organization, with the objective of promoting functionalfoods and nutritional supplements and in turn functional food ingredients in Japan.
Expanding food and beverage
industry
Food and beverage manufacturers are developing food products with vitamins and other nutrients inorder to enhance health benefits. These manufacturers are collaborating with ingredient providers inorder to deliver functional food products.
Moreover, increasing demand for functional beverages such as instant beverages including coffee-mix products, which contain a diverse range of functional ingredients, such as calcium,oligosaccharides etc. are encouraging manufacturers to continuously introduce new products themarket.
©2015 Future Market Insights, All Rights Reserved38
Source: FMI, 2016

Asia Pacific Functional Food Ingredients Market & AnalysisAsia Pacific functional food ingredients market is anticipated to increase 0.6X in terms of value during the forecast period
Figure 1: Asia Pacific Functional Food Ingredients Market Value & Y-o-Y Growth Forecast, 2015–2026
Figure 2: Asia Pacific Functional Food Ingredients Market Absolute $ Opportunity (US$ Mn), 2016–2026
Key Takeaways
Figure indicates Asia Pacific functional food ingredients market value & Y-o-Y growth forecast between 2015–2026, and figure indicatesabsolute $ opportunity over 2016–2026
In 2015, the Asia Pacific functional food ingredients market was valued at US$ 2,707.1 Mn and is estimated to reach US$ 2,854.1 Mn by 2016end, reflecting Y-o-Y growth rate of 5.4%
The Asia Pacific market is expected to be valued at US$ 5,043.1 Mn by 2026 end, registering a CAGR of 6.1% over the forecast period
The Asia Pacific functional food ingredients market is estimated to represent absolute $ opportunity of US$ 147.0 Mn in 2016 over 2015 and isexpected to represent incremental $ opportunity of US$ 2,189.0 Mn between 2016 and 2026
2,7
07
.1
2,8
54
.1
3,0
11
.1
3,1
78
.5
3,3
58
.4
3,5
50
.5
3,7
58
.9
3,9
83
.3
4,2
22
.7
4,4
77
.7
4,7
51
.3
5,0
43
.1
5.3%5.4% 5.5% 5.6%
5.7% 5.7%5.9%
6.0% 6.0% 6.0% 6.1% 6.1%
5%
5%
5%
6%
6%
0
1,000
2,000
3,000
4,000
5,000
6,000
2015(A)
2016(E)
2017(F)
2018(F)
2019(F)
2020(F)
2021(F)
2022(F)
2023(F)
2024(F)
2025(F)
2026(F)
Y-o-Y G
row
th R
ate
Rev
enu
e (
US$
Mn
)
2,7
07
.1
3,7
58
.9
5,0
43
.1
+1
47
.0
+1
57
.0
+1
67
.4
+1
79
.9
+1
92
.1
2015 (A) 2016 (E) 2017 (F) 2018 (F) 2019 (F) 2020 (F) 2021 (F) 2026 (F)
US$
Mn
Source: FMI, 2016
©2015 Future Market Insights, All Rights Reserved39

Asia Pacific Functional Food Ingredients Market :Trends
Expansion
Increasing Participation in Exhibitions
Various ingredients providers operating in the Asia Pacific region are continuously participating in various exhibitions in order toshowcase ingredients product portfolio and also to enter into new markets
Global Specialty Ingredients (M) Sdn. Bhd. is participating in food ingredient exhibitions such as India Food Exhibition 2016, at Bangalore, INDIA,Food Ingredients 2016, at New Delhi, INDIA, Pro Food & Pack 2016, at Colombo, Sri Lanka etc. in order to increase consumer awarenessregarding functional food ingredients
One of the most prominent trends in the Asia Pacific functional food ingredients market is companies expanding manufacturing capacityand also setting up new branch offices in Asia Pacific region in order to further strengthen footprint in markets in the region
In 2014, FENCHEM BIOTEK LTD. set up its second branch in Thailand in order to strengthen its presence in the South Asia market
The company also plans to expand its raw material processing capacity by 800 Mts by 2016 end, in order to cater to increasing demand fornatural vitamin E and natural phytosterols from various food manufacturers
©2015 Future Market Insights, All Rights Reserved40
Source: FMI, 2016

Asia Pacific Functional Food Ingredients Market: Regulations
Japan: Functional Food ingredients used in the food products must satisfy the standards for the minimum and maximum daily levelsof twelve vitamins and five minerals. Foods for specified health uses (FOSHU) require pre-marketing approval, and refer to productsthat contains dietary ingredients and promote health.
India : The manufacture, storage, distribution, sale and import of nutraceuticals in India are regulated under the Food Safety andStandards Act (FSSA).
India : According to FSSAI, The presence of commonly used starter culture of lactic acid producing bacteria such as Lactococcus spp.(earlier known as Streptococcus spp.), Lactobacillus spp. and others used in the preparation in curd and related products shall not beconsidered as probiotics, if the probiotic properties have not been substantiated.
China : China has a lengthy and costlyregistration process, with three main entitiesinvolved in policing the industry. The State Foodand Drug Administration (SFDA) is in charge ofdietary supplements and registration. TheMinistry of Health (MOH), oversees the SFDA andthe approval of new novel food ingredients.Finally, the Administration of Quality SupervisionInspection and Quarantine (AQSIQ) controls allthe imports and exports
©2015 Future Market Insights, All Rights Reserved41

Asia Pacific Functional Food Ingredients Market Analysis, By Ingredient Type
Section 5
©2015 Future Market Insights, All Rights Reserved42

Asia Pacific Functional Food Ingredients Market Snapshot By Ingredient Type
Revenue, 2016 (E) (US$ Mn) Revenue, 2026 (F) (US$ Mn)CAGR %(2016–2026)
Market Share %, 2026
Vitamins 457.6 839.0 6.2% 16.6%
Minerals 476.8 852.0 6.0% 16.9%
Prebiotics & Dietary Fibre 220.3 342.5 4.5% 6.8%
Probiotics 673.7 1,277.4 6.6% 25.3%
Carotenoids 147.7 209.7 3.6% 4.2%
Protein 362.3 609.2 5.3% 12.1%
Omega 3 Fatty Acids 515.8 913.3 5.9% 18.1%
US $
62
Mn
US $ 381.4 Mn
US $ 375.2 Mn
US $ 122.2Mn
US $
603.7
Mn
US $
246.9
Mn
US $
397.5
Mnz
Source: FMI, 2016
Vitamins Minerals Prebiotics & Dietary Fibre Probiotics Carotenoids Protein Omega 3 Fatty Acids
©2015 Future Market Insights, All Rights Reserved43
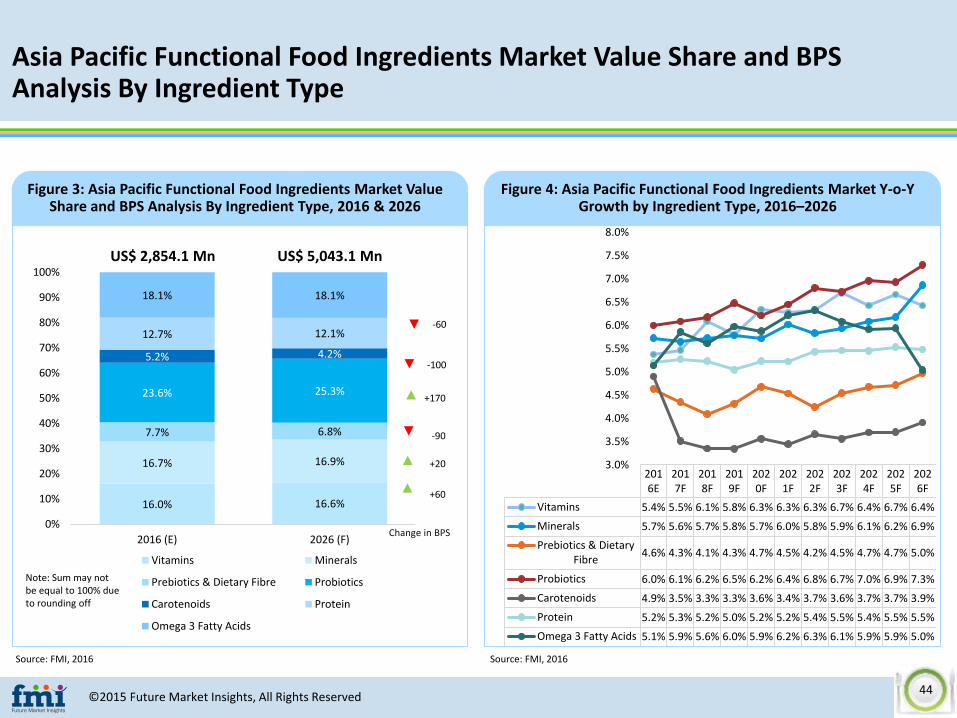
Asia Pacific Functional Food Ingredients Market Value Share and BPS Analysis By Ingredient Type
Figure 3: Asia Pacific Functional Food Ingredients Market Value Share and BPS Analysis By Ingredient Type, 2016 & 2026
Figure 4: Asia Pacific Functional Food Ingredients Market Y-o-Y Growth by Ingredient Type, 2016–2026
16.0% 16.6%
16.7% 16.9%
7.7% 6.8%
23.6% 25.3%
5.2% 4.2%
12.7% 12.1%
18.1% 18.1%
0%
10%
20%
30%
40%
50%
60%
70%
80%
90%
100%
2016 (E) 2026 (F)
Vitamins Minerals
Prebiotics & Dietary Fibre Probiotics
Carotenoids Protein
Omega 3 Fatty Acids
+60
Change in BPS
US$ 2,854.1 Mn US$ 5,043.1 Mn
-60
-100
-90
Note: Sum may not be equal to 100% due to rounding off
+20
+170
Source: FMI, 2016
2016E
2017F
2018F
2019F
2020F
2021F
2022F
2023F
2024F
2025F
2026F
Vitamins 5.4% 5.5% 6.1% 5.8% 6.3% 6.3% 6.3% 6.7% 6.4% 6.7% 6.4%
Minerals 5.7% 5.6% 5.7% 5.8% 5.7% 6.0% 5.8% 5.9% 6.1% 6.2% 6.9%
Prebiotics & DietaryFibre
4.6% 4.3% 4.1% 4.3% 4.7% 4.5% 4.2% 4.5% 4.7% 4.7% 5.0%
Probiotics 6.0% 6.1% 6.2% 6.5% 6.2% 6.4% 6.8% 6.7% 7.0% 6.9% 7.3%
Carotenoids 4.9% 3.5% 3.3% 3.3% 3.6% 3.4% 3.7% 3.6% 3.7% 3.7% 3.9%
Protein 5.2% 5.3% 5.2% 5.0% 5.2% 5.2% 5.4% 5.5% 5.4% 5.5% 5.5%
Omega 3 Fatty Acids 5.1% 5.9% 5.6% 6.0% 5.9% 6.2% 6.3% 6.1% 5.9% 5.9% 5.0%
3.0%
3.5%
4.0%
4.5%
5.0%
5.5%
6.0%
6.5%
7.0%
7.5%
8.0%
Source: FMI, 2016
©2015 Future Market Insights, All Rights Reserved44

Asia Pacific Functional Food Ingredients Market Analysis & Forecast By Ingredient Type
Table 1: Asia Pacific Functional Food Ingredients Market Value (US$ Mn) and Absolute $ Opportunity (US$ Mn) by Ingredient Type, 2015–2026
Ingredient Type 2015 A 2016 E 2017 F 2018 F 2019 F 2020 F 2021 F 2026 FCAGR
(2016–2026)
VitaminsValue 434.3 457.6 482.6 512.0 541.7 576.1 612.2 839.0 6.2%
Opportunity 25.0 23.3 25.0 29.4 29.7 34.3 36.2 50.6
MineralsValue 451.0 476.8 503.7 532.5 563.3 595.5 631.4 852.0 6.0%
Opportunity 23.1 25.8 26.9 28.8 30.8 32.2 35.9 54.7
Prebiotics & Dietary Fibre
Value 210.6 220.3 229.9 239.3 249.6 261.3 273.1 342.5 4.5%
Opportunity 10.6 9.8 9.6 9.4 10.3 11.7 11.8 16.2
ProbioticsValue 635.5 673.7 714.6 758.8 807.9 858.1 913.4 1277.4 6.6%
Opportunity 31.6 38.1 41.0 44.1 49.1 50.1 55.3 86.9
CarotenoidsValue 140.8 147.7 152.8 158.0 163.2 169.0 174.9 209.7 3.6%
Opportunity 7.6 6.9 5.2 5.1 5.3 5.8 5.8 7.9
ProteinValue 344.4 362.3 381.4 401.3 421.5 443.6 466.7 609.2 5.3%
Opportunity 15.8 17.9 19.1 19.9 20.2 22.1 23.2 31.7
Omega 3 Fatty Acids
Value 490.6 515.8 546.0 576.6 611.0 646.9 687.1 913.3 5.9%
Opportunity 22.6 25.2 30.2 30.6 34.4 35.9 40.2 43.8
Total 2,707.1 2,854.1 3,011.1 3,178.5 3,358.4 3,550.5 3,758.9 5,043.1 5.9%
Source: FMI, 2016
©2015 Future Market Insights, All Rights Reserved45

Asia Pacific Functional Food Ingredients Market Analysis & Forecast By Ingredient Type Vitamins segment is expected to witness significant growth in comparison to minerals segment over the forecast period
Figure 5: Asia Pacific Functional Food IngredientsMarket Absolute $ Opportunity (US$ Mn), by Vitamins
Segment, 2016─2026Key Takeaways
Vitamins segment is estimated to be valued at US$ 457.6Mn by 2016 and is expected to reach US$ 839.0 Mn by2026 end, expanding at a CAGR of 6.2% over the forecastperiod
Vitamins segment is estimated to create absolute $opportunity of US$ 23.3 Mn in 2016 over 2015. Thissegment is expected to create incremental $ opportunityof US$ 381.4 Mn between 2016 and 2026.
Vitamins
Minerals
Figure 6: Asia Pacific Functional Food IngredientsMarket Absolute $ Opportunity (US$ Mn ), by Minerals
Segment, 2016─2026Key Takeaways
Minerals segment is estimated to be valued at US$ 476.8Mn by 2016 and is expected to reach US$ 852.0 Mn by2026 end, expanding at a CAGR of 6.0% over the forecastperiod
This segment is estimated to create absolute $opportunity of US$ 25.8 Mn in 2016 over 2015 and isexpected to create incremental $ opportunity of US$375.2 Mn between 2016 and 2026
43
4.3
61
2.2
83
9.0
+2
3.3
+2
5.0
+2
9.4
+2
9.7
+3
4.3
2015(A)
2016(E)
2017(F)
2018(F)
2019(F)
2020(F)
2021(F)
2026(F)
US$
Mn
45
1.0
63
1.4
85
2.0
+2
5.8
+2
6.9
+2
8.8
+3
0.8
+3
2.2
2015(A)
2016(E)
2017(F)
2018(F)
2019(F)
2020(F)
2021(F)
2026(F)
US$
Mn
Source: FMI, 2016
Source: FMI, 2016
©2015 Future Market Insights, All Rights Reserved46

Asia Pacific Functional Food Ingredients Market Analysis & Forecast By Ingredient Type Probiotics segment is expected to exhibit significant growth in comparison to prebiotics & dietary fibre segment over the forecast period
Figure 7: Asia Pacific Functional Food IngredientsMarket Absolute $ Opportunity (US$ Mn), by Prebiotics
& Dietary Fibre Segment, 2016─2026Key Takeaways
Prebiotics & dietary fibre segment is estimated to bevalued at US$ 220.3 Mn by 2016 and is expected to reachUS$ 342.5 Mn by 2026 end, expanding at a CAGR of 4.5%over the forecast period
This segment is estimated to create absolute $opportunity of US$ 9.8 Mn in 2016 over 2015 and isexpected to create incremental $ opportunity of US$122.1 Mn between 2016 and 2026
Prebiotics & Dietary Fibre
Probiotics
Figure 8: Asia Pacific Functional Food IngredientsMarket Absolute $ Opportunity (US$ Mn), by Probiotics
Segment, 2016─2026Key Takeaways
Probiotics segment is estimated to be valued at US$673.7 Mn by 2016 and is expected to reach US$ 1,277.4Mn by 2026 end, expanding at a CAGR of 6.6 % over theforecast period
Probiotics segment is estimated to create absolute $opportunity of US$ 38.1 Mn in 2016 over 2015. Thissegment is expected to create incremental $ opportunityof US$ 603.8 Mn between 2016 and 2026.
21
0.6
27
3.1
34
2.5
+9
.8
+9
.6
+9
.4
+1
0.3
+1
1.7
2015(A)
2016(E)
2017(F)
2018(F)
2019(F)
2020(F)
2021(F)
2026(F)
US$
Mn
63
5.5
91
3.4
1,2
77
.4
+3
8.1
+4
1.0
+4
4.1
+4
9.1
+5
0.1
2015(A)
2016(E)
2017(F)
2018(F)
2019(F)
2020(F)
2021(F)
2026(F)
US$
Mn
Source: FMI, 2016
Source: FMI, 2016
©2015 Future Market Insights, All Rights Reserved47
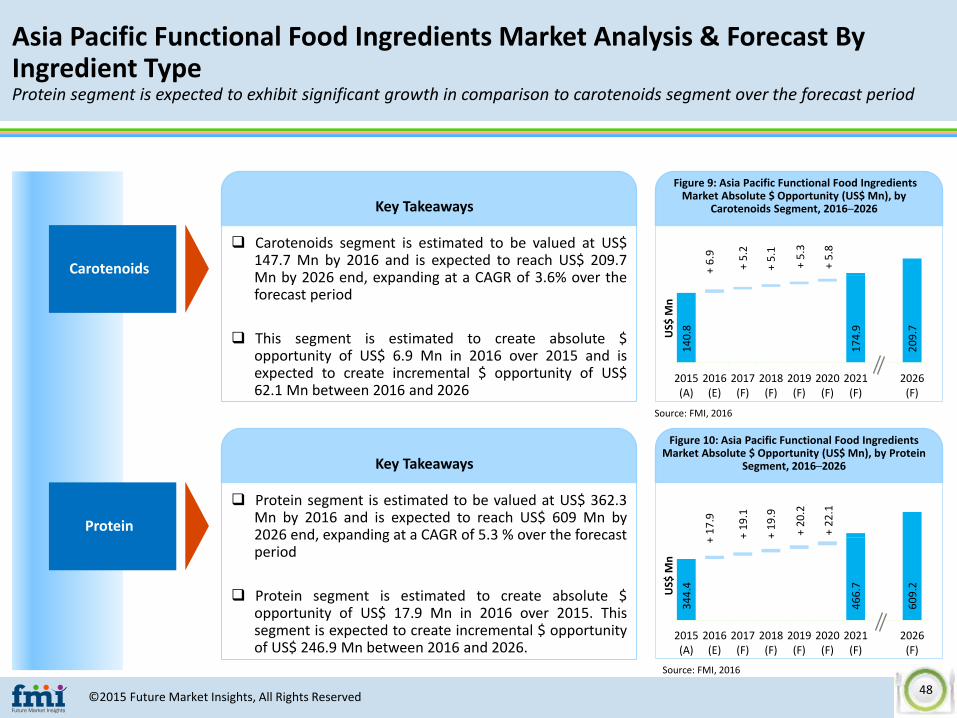
Asia Pacific Functional Food Ingredients Market Analysis & Forecast By Ingredient Type Protein segment is expected to exhibit significant growth in comparison to carotenoids segment over the forecast period
Figure 9: Asia Pacific Functional Food IngredientsMarket Absolute $ Opportunity (US$ Mn), by
Carotenoids Segment, 2016─2026Key Takeaways
Carotenoids segment is estimated to be valued at US$147.7 Mn by 2016 and is expected to reach US$ 209.7Mn by 2026 end, expanding at a CAGR of 3.6% over theforecast period
This segment is estimated to create absolute $opportunity of US$ 6.9 Mn in 2016 over 2015 and isexpected to create incremental $ opportunity of US$62.1 Mn between 2016 and 2026
Carotenoids
Protein
Figure 10: Asia Pacific Functional Food IngredientsMarket Absolute $ Opportunity (US$ Mn), by Protein
Segment, 2016─2026Key Takeaways
Protein segment is estimated to be valued at US$ 362.3Mn by 2016 and is expected to reach US$ 609 Mn by2026 end, expanding at a CAGR of 5.3 % over the forecastperiod
Protein segment is estimated to create absolute $opportunity of US$ 17.9 Mn in 2016 over 2015. Thissegment is expected to create incremental $ opportunityof US$ 246.9 Mn between 2016 and 2026.
14
0.8
17
4.9
20
9.7
+6
.9
+5
.2
+5
.1
+5
.3
+5
.8
2015(A)
2016(E)
2017(F)
2018(F)
2019(F)
2020(F)
2021(F)
2026(F)
US$
Mn
34
4.4
46
6.7
60
9.2
+1
7.9
+1
9.1
+1
9.9
+2
0.2
+2
2.1
2015(A)
2016(E)
2017(F)
2018(F)
2019(F)
2020(F)
2021(F)
2026(F)
US$
Mn
Source: FMI, 2016
Source: FMI, 2016
©2015 Future Market Insights, All Rights Reserved48

Asia Pacific Functional Food Ingredients Market Analysis & Forecast By Ingredient Type Omega 3 fatty acids segment is anticipated to exhibit above average growth over the forecast period
Figure 11: Asia Pacific Functional Food IngredientsMarket Absolute $ Opportunity (US$ Mn), by Omega 3
Fatty Acids Segment, 2016─2026
49
0.6
68
7.1
91
3.3
+2
5.2
+3
0.2
+3
0.6
+3
4.4
+3
5.9
2015(A)
2016(E)
2017(F)
2018(F)
2019(F)
2020(F)
2021(F)
2026(F)
US$
Mn
Key Takeaways
Omega 3 fatty acids segment is estimated to be valued atUS$ 515.8 Mn by 2016 and is expected to reach US$913.3 Mn by 2026 end, expanding at a CAGR of 5.9%over the forecast period
This segment is estimated to create absolute $opportunity of US$ 25.2 Mn in 2016 over 2015 and isexpected to create incremental $ opportunity of US$397.5 Mn between 2016 and 2026
Omega 3 Fatty Acids
Source: FMI, 2016
©2015 Future Market Insights, All Rights Reserved49
Asia Pacific Functional Food Ingredients Market Trends : By Ingredient Type
Vitamins
Minerals
Demand for dairy products, especially fluid milk including both fresh and UHT milks is increasing significantly. Increasing traction of e-Commerce is a majorfactor driving growth of the China functional food and ingredients market. Moreover, China has a substantial elderly population, which includes over 210million persons aged over age 60 years, which offers major unmet opportunity for fortified products that are rich in calcium such as yogurt.
Calcium is a major ingredient in functional food products. Japan is expected to witness increase in demand for calcium ingredients owing to deficiency ofcalcium ingredients in Japanese food products. Apart from calcium, other important functional ingredients used in food products are potassium, magnesiumand phosphorous.
In China, major end users of the milk calcium are pharmaceuticals and dairy industries. However, milk calcium is expected to be mainly used in foodproducts such as chewing gum and candy products over the forecast period.
Increasing level of awareness among end users, rising health concerns and growing ageing population is driving overall vitaminconsumption in the region. Change in lifestyle of middle class population with increasing disposable income are factors also supportingthis trend in countries such as India, Indonesia and China.
The market is witnessing increased demand for vitamin D and vitamin C to promote bone health and reinforce immune system againstcommon cold and cough
Japan is considered the largest market for vitamins, owning to its vast middle-age and elderly population, followed by China. In Thailand,vitamin E consumption is increasing amongst Thai women, owning to its antioxidant properties and ability to slow down the ageingprocess.
©2015 Future Market Insights, All Rights Reserved50

Asia Pacific Functional Food Ingredients Market Trends : By Ingredient Type
Probiotics
Omega 3 Fatty Acids
Omega-3 fatty acid ingredients are sourced primarily from fish oil. Demand for these products is increasing, including for products such as dietarysupplements ,functional foods and pharmaceuticals
Companies developing omega-3 fatty acids are producing omega 3 fatty acids from alternative sources, which are of high quality and rich in DHA. Inaddition, companies are also developing omega 3 fatty acids that are rich oil that contain combination of EPA/DHA.
Biotech company namely Martek Biosciences Corporation, which is a division of Koninklijke DSM N.V., produces DHA (Docosahexaenoic acid) oil from microalgae and alsoarachidonic acid (omega-6 fatty acid) which is primarily used in infant formula. Moreover, Koninklijke DSM N.V. plans to develop EPA/DHA combination oil, produced using afermentation process that can be used as an alternative to fish source-derived omega 3 fatty acids.
Rising health conscious consumers and growing awareness about probiotics are factors expected to fuel demand for probiotics.Companies are increasingly manufacturing foods that incorporate probiotic bacteria, especially dairy-based products. Probiotic dairyproducts such as yogurts containing bacteria strains such as Lacidophilus and Bifidobacterium, contribute significantly to revenue of theprobiotic foods segment.
The most common types of probiotics are Lactic acid bacteria, and include specie from the Lactobacillus, Pediococcus andBifidobacterium genera. Moreover, growing consumer awareness in Asia Pacific region, especially in Japan, about gout and low purinediet is prompting various companies to develop dairy-based products containing probiotics.
In April 2015 for instance, Meiji Holdings Co., Ltd. launched PA-3 yogurt range, which includes probiotics namely Lactobacillus gasseri PA-3 – aprobiotic lactic acid bacteria strain that metabolises purine and prevents formation of uric acid, thus preventing gout disease
©2015 Future Market Insights, All Rights Reserved51

In Japan, demand for prebiotic oligosaccharides is increasing due to rising applications in breakfast cereals, cereal bars, baked goods,baby food and various dairy products. Among all types of oligosaccharides, demand for starch oligosaccharides is highest currently.
The main commercial oligosaccharides used as prebiotic agents includes inulin, isomalto-oligosaccharides, lactulose,Fructooligosaccharides, galacto-oligosaccharides, xylo oligosaccharides and soybean oligosaccharides
GOS (galacto-oligosaccharides) find application in a wide range of food products such as sweeteners, sugar substitutes and bulkingagents. In addition, these are used in a range of product such as bread, ‘sports’ drinks, jams, fermented milk products and confectioneryproducts.
Moreover, other type of prebiotic widely used is lactulose, which is used in a number of food and beverage applications with FOSHU(Foods for Specified Health Use) status
Another prebiotic oligosaccharide namely IMO (isomalto-oligosaccharides) is used in various food applications. In Japan, the volume ofIMOs manufactured is estimated to be approximately three times greater than for either GOS or FOS. In addition, Lactosucrose is a non-digestible trisaccharide used in a range of drinks, confectioneries, and as a table sugar.
Asia Pacific Functional Food Ingredients Market : By Ingredient Type
Prebiotic & Dietary Fiber
©2015 Future Market Insights, All Rights Reserved52

Application of plant-based protein is the major trend being witnessed in the Asia Pacific region. Among plant-based proteins, soyaprotein is the most popular ingredient used to formulate protein enriched foods in order to meet the rising consumer demand forprotein-based functional food products. Soya protein ingredients contain higher proportion of essential amino acids such as lysine andtryptophan as compared to other plant-derived proteins.
Most protein functional foods products are usually formulated with a blend of soya flour or soya protein isolates and corn. By usingeither soya protein concentrates or soya protein isolates, the nutritional value of functional foods can be increased significantly.
Furthermore, soy protein is considered a cost-effective solution, due to which manufacturers are able to reduce production costs perunit of protein when compared to other sources of protein such as dairy, corn and animal-derived
Moreover, ingredient providers are offering soy-based protein ingredients, which are used in a diverse range of applications
Archer Daniels Midland Company offers versatile soya proteins used for diverse applications, which include CLARISOY isolated soya protein rangefor protein fortification of beverage systems and Textura range of protein crisps that can be used in applications such as confectionery, desserts,snacks etc. Although whey still appears to be the dominant protein source in protein-enriched beverages, popularity of blending whey proteinwith other proteins such as soya and casein is increasing among manufacturers.
Asia Pacific Functional Food Ingredients Market Trends : By Ingredient Type
Protein
©2015 Future Market Insights, All Rights Reserved53
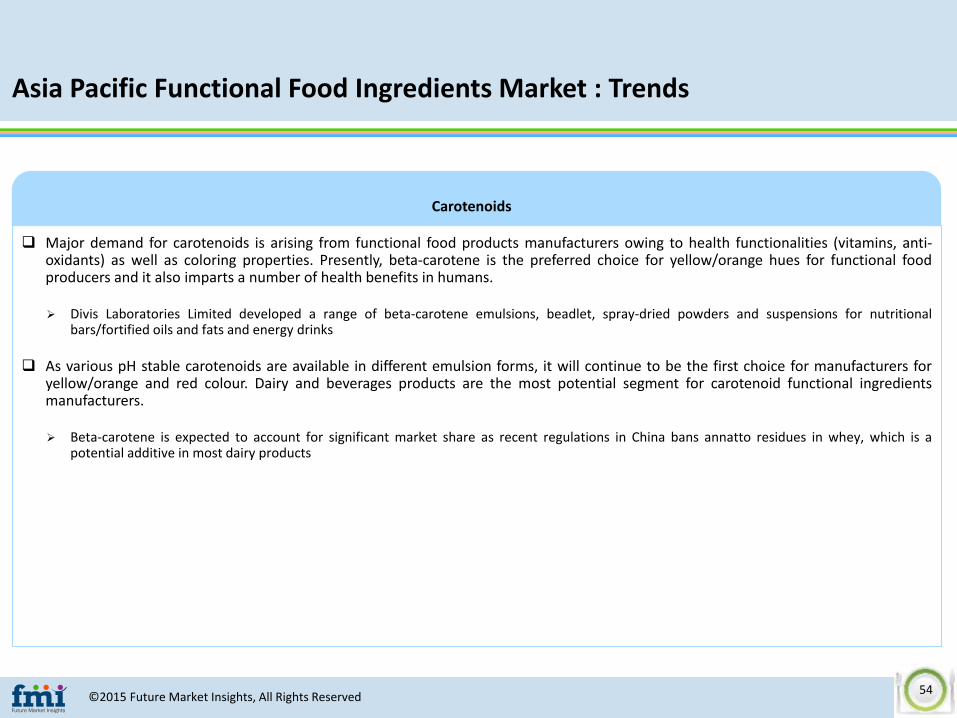
Major demand for carotenoids is arising from functional food products manufacturers owing to health functionalities (vitamins, anti-oxidants) as well as coloring properties. Presently, beta-carotene is the preferred choice for yellow/orange hues for functional foodproducers and it also imparts a number of health benefits in humans.
Divis Laboratories Limited developed a range of beta-carotene emulsions, beadlet, spray-dried powders and suspensions for nutritionalbars/fortified oils and fats and energy drinks
As various pH stable carotenoids are available in different emulsion forms, it will continue to be the first choice for manufacturers foryellow/orange and red colour. Dairy and beverages products are the most potential segment for carotenoid functional ingredientsmanufacturers.
Beta-carotene is expected to account for significant market share as recent regulations in China bans annatto residues in whey, which is apotential additive in most dairy products
Asia Pacific Functional Food Ingredients Market : Trends
Carotenoids
©2015 Future Market Insights, All Rights Reserved54
Asia Pacific Functional Food Ingredients Market Analysis, By Application
Section 6
©2015 Future Market Insights, All Rights Reserved55

Asia Pacific Functional Food Ingredients Market Snapshot By Application
Revenue, 2016 (E) (US$ Mn) Revenue, 2026 (F) (US$ Mn)CAGR %
(2016–2026)Market Share %, 2026
Beverages 735.0 1,304.2 5.9% 25.9%
Dairy & dairy-based products 789.6 1,473.1 6.4% 29.2%
Infant Food702.9 1,215.4 5.6% 24.1%
Bakery & Confectionery 626.6 1,050.4 5.3% 20.8%
US$ 569.2Mn
US$ 683.5 Mn
US$ 512.5Mn
US$ 423.8Mn
Source: FMI, 2016
Beverages Dairy & dairy-based products Bakery & ConfectioneryInfant Food
©2015 Future Market Insights, All Rights Reserved56

Asia Pacific Functional Food Ingredients Market Value Share and BPS Analysis By Application
Figure 12: Asia Pacific Functional Food Ingredients Market Value Share and BPS Analysis By Application, 2016 & 2026
Figure 13: Asia Pacific Functional Food Ingredients Market Y-o-Y Growth by Application, 2016–2026
25.8% 25.9%
27.7% 29.2%
24.6% 24.1%
22.0% 20.8%
0%
10%
20%
30%
40%
50%
60%
70%
80%
90%
100%
2016 (E) 2026 (F)
Beverages Dairy & Dairy Based Products
Infant Food Bakery & Confectionery
+10
Change in BPS
US$ 2,854.1 Mn US$ 5,043.1 Mn
-120
-50
+150
Note: Sum may not be equal to 100% due to rounding off
Source: FMI, 2016
2016E
2017F
2018F
2019F
2020F
2021F
2022F
2023F
2024F
2025F
2026F
Beverages 5.6% 5.7% 5.7% 5.8% 5.8% 6.0% 5.9% 6.0% 6.1% 6.3% 5.8%
Dairy & Dairy BasedProducts
6.0% 6.2% 6.3% 6.2% 6.2% 6.3% 6.5% 6.6% 6.6% 6.7% 6.7%
Infant Food 5.6% 5.6% 5.7% 5.7% 5.5% 5.6% 5.5% 5.5% 5.4% 5.7% 6.1%
Bakery & Confectionery 4.4% 4.2% 4.4% 4.8% 5.3% 5.5% 5.9% 5.8% 5.9% 5.5% 5.8%
3.0%
3.5%
4.0%
4.5%
5.0%
5.5%
6.0%
6.5%
7.0%
Source: FMI, 2016
©2015 Future Market Insights, All Rights Reserved57
Asia Pacific Functional Food Ingredients Market Analysis & Forecast By Application
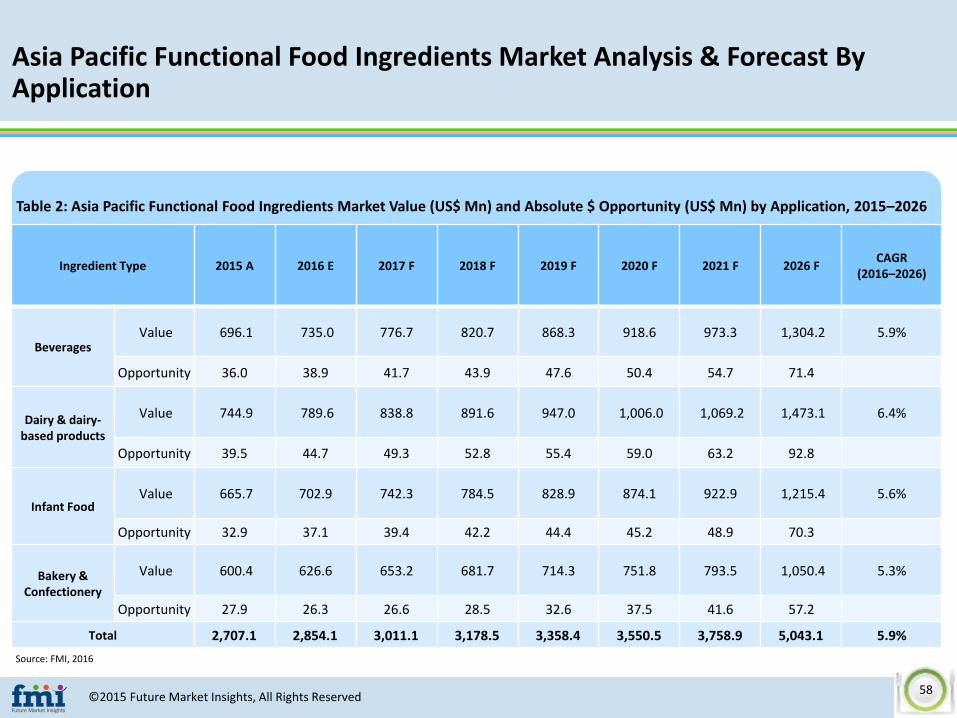
Table 2: Asia Pacific Functional Food Ingredients Market Value (US$ Mn) and Absolute $ Opportunity (US$ Mn) by Application, 2015–2026
Ingredient Type 2015 A 2016 E 2017 F 2018 F 2019 F 2020 F 2021 F 2026 FCAGR
(2016–2026)
BeveragesValue 696.1 735.0 776.7 820.7 868.3 918.6 973.3 1,304.2 5.9%
Opportunity 36.0 38.9 41.7 43.9 47.6 50.4 54.7 71.4
Dairy & dairy-based products
Value 744.9 789.6 838.8 891.6 947.0 1,006.0 1,069.2 1,473.1 6.4%
Opportunity 39.5 44.7 49.3 52.8 55.4 59.0 63.2 92.8
Infant FoodValue 665.7 702.9 742.3 784.5 828.9 874.1 922.9 1,215.4 5.6%
Opportunity 32.9 37.1 39.4 42.2 44.4 45.2 48.9 70.3
Bakery & Confectionery
Value 600.4 626.6 653.2 681.7 714.3 751.8 793.5 1,050.4 5.3%
Opportunity 27.9 26.3 26.6 28.5 32.6 37.5 41.6 57.2
Total 2,707.1 2,854.1 3,011.1 3,178.5 3,358.4 3,550.5 3,758.9 5,043.1 5.9%
Source: FMI, 2016
©2015 Future Market Insights, All Rights Reserved58

Asia Pacific Functional Food Ingredients Market Analysis & Forecast By Application Dairy & dairy-based products segment is expected to exhibit significant growth in comparison to beverages segment over the forecast period
Figure 14: Asia Pacific Functional Food IngredientsMarket Absolute $ Opportunity (US$ Mn), by
Beverages Segment, 2016─2026Key Takeaways
Beverages segment is estimated to be valued at US$735.0 Mn by 2016 and is expected to reach US$ 1,304.2Mn by 2026 end, expanding at a CAGR of 5.9% over theforecast period
Beverages segment is estimated to create absolute $opportunity of US$ 38.9 Mn in 2016 over 2015. Thissegment is expected to create incremental $ opportunityof US$ 569.1 Mn between 2016 and 2026.
Beverages
Dairy & dairy-based products
Figure 15: Asia Pacific Functional Food IngredientsMarket Absolute $ Opportunity (US$ Mn ), by Dairy &
dairy-based products Segment, 2016─2026Key Takeaways
Dairy & dairy-based products segment is estimated to bevalued at US$ 789.6 Mn by 2016 and is expected to reachUS$ 1,473.1 Mn by 2026 end, expanding at a CAGR of6.4% over the forecast period
This segment is estimated to create absolute $opportunity of US$ 44.7 Mn in 2016 over 2015 and isexpected to create incremental $ opportunity of US$683.6 Mn between 2016 and 2026
69
6.1
97
3.3
1,3
04
.2
+3
8.9
+4
1.7
+4
3.9
+4
7.6
+5
0.4
2015(A)
2016(E)
2017(F)
2018(F)
2019(F)
2020(F)
2021(F)
2026(F)
US$
Mn
74
4.9
1,0
69
.2
1,4
73
.1
+4
4.7
+4
9.3
+5
2.8
+5
5.4
+5
9.0
2015(A)
2016(E)
2017(F)
2018(F)
2019(F)
2020(F)
2021(F)
2026(F)
US$
Mn
Source: FMI, 2016
Source: FMI, 2016
©2015 Future Market Insights, All Rights Reserved59

Asia Pacific Functional Food Ingredients Market Analysis & Forecast By Application Infant food segment is expected to exhibit significant growth in comparison to bakery & confectionery segment over the forecast period
Figure 16: Asia Pacific Functional Food IngredientsMarket Absolute $ Opportunity (US$ Mn), by Infant
Food Segment, 2016─2026Key Takeaways
Infant food segment is estimated to be valued at US$702.9 Mn by 2016 and is expected to reach US$ 1,215.4Mn by 2026 end, expanding at a CAGR of 5.6% over theforecast period
Infant food segment is estimated to create absolute $opportunity of US$ 37.1 Mn in 2016 over 2015. Thissegment is expected to create incremental $ opportunityof US$ 512.5 Mn between 2016 and 2026.
Infant Food
Bakery & Confectionery
Figure 17: Asia Pacific Functional Food IngredientsMarket Absolute $ Opportunity (US$ Mn ), by Bakery &
Confectionery Segment, 2016─2026Key Takeaways
Bakery & confectionery segment is estimated to bevalued at US$ 626.6 Mn by 2016 end and is expected toreach US$ 1,050.4 Mn by 2026 end, expanding at a CAGRof 5.3 % over the forecast period
This segment is estimated to create absolute $opportunity of US$ 26.3 Mn in 2016 over 2015 and isexpected to create incremental $ opportunity of US$423.7 Mn between 2016 and 2026
66
5.7
92
2.9
1,2
15
.4
+3
7.1
+3
9.4
+4
2.2
+4
4.4
+4
5.2
2015(A)
2016(E)
2017(F)
2018(F)
2019(F)
2020(F)
2021(F)
2026(F)
US$
Mn
60
0.4
79
3.5
1,0
50
.4
+2
6.3
+2
6.6
+2
8.5
+3
2.6
+3
7.5
2015(A)
2016(E)
2017(F)
2018(F)
2019(F)
2020(F)
2021(F)
2026(F)
US$
Mn
Source: FMI, 2016
Source: FMI, 2016
©2015 Future Market Insights, All Rights Reserved60

Asia Pacific Functional Food Ingredients Market Trends : By Application
Beverages
Dairy & Dairy-based Products
In Asia Pacific region, dairy products that include probiotic ingredients witness maximum number of launches. Among the dairy product segment,spoonable yogurt and yogurt drinks account for highest number of probiotic product launches.
In 2012 approximately 45% of probiotic products launched were in Asia Pacific region
Probiotic yogurt is witnessing strong growth among the various dairy application segments of the functional food ingredients market. Variousmanufacturers are developing dairy products, which contain probiotic cultures such as Lactobacillus and Bifidobacterium bacteria. Moreover, therising trend of development of dairy products such as yogurts fortified with calcium and oligosaccharides is expected to continue over the forecastperiod.
In October 2013, Abbott Laboratories launched calciSure in order to meet the bone health related needs of consumers in Asia, which include blend of nutrients such as calcium,vitamins and magnesium and fructooligosaccharides to enable maintaining of a healthy digestive system
Demand for beverages with functional ingredients in increasing significantly in Asia Pacific region, which include countries such as Indiaand China. Due to growing demand for healthy alternatives, beverage manufacturers are developing new products that target specifichealth conditions such as weight management, stress relief etc.
Asia Pacific functional food ingredients market is expected to exhibit significant growth owing to rising number of product categoriessuch as energy shots, enhanced water and juices
The most upcoming trend in the Asia Pacific region is increasing uptake of functional ingredients in the form of beverage shot, typicallydelivered in a small, single-serve two or three ounce bottle, which is portable and also contains various nutrients in order to perform aspecific function. These energy shots typically contain functional ingredients such as B vitamins meant to provide various health benefits.
In Japan, shots are popular for taking specific nutrients and also by consumers to try out new functional ingredients. Shot products are usuallyplaced at the point-of-purchase to enable quick grab-and-go ease.
©2015 Future Market Insights, All Rights Reserved61

Asia Pacific Functional Food Ingredients Market Trends :By Application
Infant Food
Bakery & Confectionery
Increasing demand for convenience food coupled with increasing introduction of bakery and confectionery products in the region is inturn fuelling demand for functional food ingredients such as Omega 3 fatty acids
Omega 3 ingredients are used in bakery products in order to increase shelf life and also to prevent unpleasant odour in these products.Moreover, these ingredients are also added owing to various associated functionalities such as prevention of diseases such as cancer etc.
For instance, Koninklijke DSM N.V. manufactures marine-based omega 3 ingredient named Meg 3, which is used by Allied Bakeries for Kingsmill50/50 bread in order to improve shelf life and also to prevent odour
Major ingredient usually added to infant food is probiotics, and are primarily added to infant formula due to beneficial effects on thehealth of infants such as reduction of various respiratory issues. Various bacteria usually added to infant food include lactobacillus andbifi dobacterium. The purpose of addition of these bacteria is to strengthen the immune system of infants aged between 1and 3 years.
In February 2015, Nestlé SA and ingredient supplier BioGaia announced the launch of a new toddler formula, which includes patented probioticlactobacillius reutri protectis. This product is primarily sold in emerging markets such as India and China.
©2015 Future Market Insights, All Rights Reserved62

Asia Pacific Functional Food Ingredients Market Attractiveness Analysis By Application & Ingredient Type
Figure 18: Asia Pacific Functional Food Ingredients Market Attractiveness Analysis By Ingredients Type, 2016–2026
Figure 19: Asia Pacific Functional Food Ingredients Market Attractiveness Analysis By Application, 2016–2026
Vitamins
Minerals
Prebiotics & Dietary Fibre
Probiotics
CarotenoidsProtein
Omega 3 Fatty Acids
Low Medium High
Low
Med
ium
Hig
h
Gro
wth
Ind
ex
(20
16–
2026
)
Total Index(Absolute Index + CAGR Index)
Bubble Size represents market
size for 2026 (F)
Beverages
Dairy & Dairy Based
Products
Infant Food
Bakery & Confectionery
Low Medium High
Low
Med
ium
Hig
h
Gro
wth
Ind
ex
(20
16–
2026
)
Total Index(Absolute Index + CAGR Index)
Bubble Size represents market
size for 2026 (F)
Source: FMI, 2016 Source: FMI, 2016
©2015 Future Market Insights, All Rights Reserved63
Asia Pacific Functional Food Ingredients Market Analysis, By Region
Section 7
©2015 Future Market Insights, All Rights Reserved64

Asia Pacific Functional Food Ingredients Market Snapshot
Asia Pacific Functional Food Ingredients Market
Singapore
2016 (E): US$ 252.3
Mn
CAGR: 4.6%
2026 (F): US$ 395.9
Mn
2015 (A): US$ 241.2
Mn
Note: CAGR is calculated from 2016 to 2026
India
2016 (E): US$ 425.3
Mn
CAGR: 5.6%
2026 (F): US$ 736.3
Mn
2015 (A): US$ 403.4
Mn
Japan
2016 (E): US$ 903.6
Mn
CAGR: 6.9%
2026 (F): US$
1,767.6 Mn
2015 (A): US$ 849.8
Mn
China
2016 (E): US$ 544.0
Mn
CAGR: 6.3%
2026 (F): US$
1,002.1 Mn
2015 (A): US$ 515.4
Mn
Thailand
2016 (E): US$ 137.6
Mn
CAGR: 4.2%
2026 (F): US$ 208.3
Mn
2015 (A): US$ 132.1
Mn
Malaysia
2016 (E): US$ 337.9
Mn
CAGR: 4.8%
2026 (F): US$ 538.6
Mn
2015 (A): US$ 323.5
Mn
Indonesia
2016 (E): US$ 253.4
Mn
CAGR: 4.5%
2026 (F): US$ 394.4
Mn
2015 (A): US$ 241.7
Mn
Source: FMI, 2016
©2015 Future Market Insights, All Rights Reserved65

Asia Pacific Functional Food Ingredients Market Value Share and BPS Analysis By Country
Figure 20: Asia Pacific Functional Food Ingredients Market Value Share and BPS Analysis By Country, 2016 & 2026
Figure 21: Asia Pacific Functional Food Ingredients Market Y-o-Y Growth by Country, 2016–2026
14.9% 14.6%
31.7% 35.1%
19.1%19.9%
4.8%4.1%
11.8% 10.7%
8.9% 7.8%
0%
10%
20%
30%
40%
50%
60%
70%
80%
90%
100%
2016 (E) 2026 (F)
Singapore India Japan China
+340
Change in BPS
US$ 2,854.1 Mn US$ 5,043.1 Mn
-110
-110
-70
+80
Note: Sum may not be equal to 100% due to rounding off
-30
Source: FMI, 2016
2016E 2017F 2018F 2019F 2020F 2021F 2022F 2023F 2024F 2025F 2026F
Singapore 4.6% 4.2% 4.5% 4.6% 4.6% 4.7% 4.8% 4.9% 4.9% 4.9% 4.0%
India 5.4% 5.6% 5.3% 5.4% 5.6% 5.6% 6.0% 5.8% 6.0% 5.7% 5.5%
Japan 6.3% 6.6% 6.5% 6.4% 6.5% 7.0% 6.6% 7.0% 6.7% 7.6% 8.4%
China 5.5% 5.8% 5.8% 6.2% 5.8% 6.1% 6.4% 6.0% 6.5% 6.2% 8.0%
Thailand 4.1% 3.3% 4.4% 5.2% 5.3% 4.5% 4.6% 3.9% 5.1% 3.7% 2.4%
Malaysia 4.5% 4.5% 4.6% 5.0% 4.7% 4.9% 5.1% 5.0% 5.2% 5.1% 3.5%
Indonesia 4.8% 4.3% 4.9% 4.3% 5.6% 4.5% 5.3% 5.9% 5.0% 4.5% 1.0%
0.0%
1.0%
2.0%
3.0%
4.0%
5.0%
6.0%
7.0%
8.0%
9.0%
Source: FMI, 2016
©2015 Future Market Insights, All Rights Reserved66

Asia Pacific Functional Food Ingredients Market Analysis & Forecast By Country
Table 3: Asia Pacific Functional Food Ingredients Market Value (US$ Mn) and Absolute $ Opportunity by Country, 2015–2026
Ingredient Type 2015 A 2016 E 2017 F 2018 F 2019 F 2020 F 2021 F 2026 FCAGR
(2016–2026)
SingaporeValue 241.2 252.3 262.9 274.6 287.1 300.4 314.6 395.9 4.6%
Opportunity 9.8 11.1 10.6 11.8 12.5 13.2 14.2 15.3
IndiaValue 403.4 425.3 449.3 473.3 498.7 526.5 555.9 736.3 5.6%
Opportunity 17.7 21.9 24.0 24.0 25.4 27.8 29.4 38.3
JapanValue 849.8 903.6 963.5 1,026.3 1,092.1 1,163.1 1,244.6 1,767.6 6.9%
Opportunity 52.8 53.8 59.9 62.8 65.8 71.0 81.4 136.5
ChinaValue 515.4 544.0 575.7 609.2 647.2 684.4 726.5 1,002.1 6.3%
Opportunity 27.0 28.6 31.7 33.5 38.0 37.3 42.1 74.6
ThailandValue 132.1 137.6 42.1 48.4 156.2 164.4 171.8 208.3 4.2%
Opportunity 4.6 5.5 4.6 6.3 7.7 8.2 7.4 4.9
MalaysiaValue 323.5 337.9 353.2 369.3 387.9 406.2 426.3 538.6 4.8%
Opportunity 15.0 14.4 15.3 16.1 18.6 18.3 20.1 18.3
IndonesiaValue 241.7 253.4 264.4 277.3 289.2 305.5 319.3 394.4 4.5%
Opportunity 9.3 11.7 10.9 12.9 11.9 16.3 13.8 3.8Total 2,707.1 2,854.1 3,011.1 3,178.5 3,358.4 3,550.5 3,758.9 5,043.1 5.9%
Source: FMI, 2016
©2015 Future Market Insights, All Rights Reserved67

Asia Pacific Functional Food Ingredients Market Attractiveness Analysis By Country
Figure 22: Asia Pacific Functional Food Ingredients Market Attractiveness Analysis By Country, 2016–2026
Figure indicates market attractiveness analysis by country for2016–2026
Bubble size represents total incremental opportunity index andY-axis depicts market share index for 2016–2026
Among all countries, Japan is expected to register comparativelyhigher CAGR during the forecast period
Rising demand for functional food products registered as FOSHU isexpected to fuel growth of the functional food ingredients marketin Japan. Additionally, other factors such as increasing demand forfunctional beverages with amino acids is expected to contribute togrowth of the functional food ingredients market in the countryduring the forecast period.
In 2016, Japan is estimated to account for higher value share of31.7% value share of the Asia Pacific functional food ingredientsmarket and is expected to gain significant market share by 2026end
The market in China is projected to register second-highest CAGRof 6.3% in terms of value over the forecast period
Increasing participation of ingredient providers in various
exhibitions to showcase functional ingredients portfolio is expected
to boost demand for functional food ingredients among various
end consumers
Key Takeaways
Singapore
India
JapanChina
ThailandMalaysia
Indonesia
Low Medium High
Low
Med
ium
Hig
h
Gro
wth
Ind
ex
(20
16–
2026
)
Total Index(Absolute Index + CAGR Index)
Bubble Size represents market
size for 2026 (F)
Source: FMI, 2016
©2015 Future Market Insights, All Rights Reserved68

Singapore Functional Food Ingredients Market Analysis
Section 8
©2015 Future Market Insights, All Rights Reserved69

Singapore Functional Food Ingredients MarketSingapore functional food ingredients market is expected to exhibit significant growth during the forecast period
Figure 23: Singapore Functional Food Ingredients Market Value (US$ Mn), 2015–2026
Figure 24: Singapore Functional Food Ingredients Market Absolute $ Opportunity (US$ Mn), 2016–2026
Key Takeaways
The functional food ingredients market in Singapore is estimated to be valued at US$ 252.3 Mn by 2016 and is expected to reach US$395.9 Mn by 2026 end, expanding at a CAGR of 4.6% over the forecast period
The functional food ingredients market in the country is estimated to represent absolute $ opportunity of US$ 11.1 Mn in 2016 over2015, and is expected to represent incremental $ opportunity of US$ 143.6 Mn between 2016 and 2026
24
1.2
25
2.3
26
2.9
27
4.6
28
7.1
30
0.4
31
4.6
39
5.9
0
50
100
150
200
250
300
350
400
450
2015 (A)2016 (E) 2017 (F) 2018 (F) 2019 (F) 2020 (F) 2021 (F) 2026 (F)
Val
ue
(U
S$ M
n)
Value
24
1.2
31
4.6
39
5.9
+1
1.1
+1
0.6
+1
1.8
+1
2.5
+1
3.2
2015 (A) 2016 (E) 2017 (F) 2018 (F) 2019 (F) 2020 (F) 2021 (F) 2026 (F)
US$
Mn
Source: FMI, 2016 Source: FMI, 2016
©2015 Future Market Insights, All Rights Reserved70

Singapore Functional Food Ingredients Market Analysis & Forecast By Ingredient TypeProbiotics segment is expected to remain dominant in terms of value growth over the forecast period, owing to increasing demand for yogurt containing probiotics
Table 4: Singapore Functional Food Ingredients Market Value (US$ Mn) and absolute $ opportunity (US$ Mn) by Ingredient Type, 2015–2026
Ingredient Type 2015 A 2016 E 2017 F 2018 F 2019 F 2020 F 2021 F 2026 FCAGR
(2016–2026)
VitaminsValue 33.9 35.6 37.2 39.0 40.9 43.0 45.1 58.1 5.0%
Opportunity 1.5 1.7 1.6 1.8 1.9 2.0 2.2 2.5
MineralsValue 43.4 45.3 47.3 49.5 51.7 54.2 56.8 71.3 4.6%
Opportunity 1.7 1.9 2.0 2.2 2.2 2.4 2.6 2.7
Prebiotics & Dietary Fibre
Value 19.1 19.8 20.5 21.2 22.0 22.8 23.6 28.1 3.6%
Opportunity 0.6 0.7 0.6 0.7 0.8 0.8 0.9 0.6
ProbioticsValue 60.7 64.0 67.1 70.8 74.8 78.8 82.9 108.5 5.4%
Opportunity 2.8 3.3 3.1 3.7 4.0 4.0 4.2 5.6
CarotenoidsValue 9.5 9.7 10.0 10.3 10.6 10.8 11.0 12.4 2.5%
Opportunity 0.2 0.2 0.3 0.3 0.3 0.2 0.2 0.2
ProteinValue 31.2 32.4 33.7 35.0 36.4 37.9 39.5 48.3 4.1%
Opportunity 1.1 1.2 1.3 1.3 1.4 1.5 1.5 1.6
Omega 3 Fatty Acids
Value 43.5 45.5 47.1 48.9 50.8 53.0 55.7 69.2 4.3%
Opportunity 1.9 2.0 1.6 1.7 1.9 2.2 2.6 2.1 Total 241.2 252.3 262.9 274.6 287.1 300.4 314.6 395.9 4.6%
Source: FMI, 2016
©2015 Future Market Insights, All Rights Reserved71

Singapore Functional Food Ingredients Market Analysis & Forecast By Ingredient Type Vitamins segment is expected to exhibit significant growth in comparison to minerals segment over the forecast period
Figure 25: Singapore Functional Food IngredientsMarket Absolute $ Opportunity (US$ Mn), by Vitamins
Segment, 2016─2026Key Takeaways
Vitamins segment is estimated to be valued at US$ 35.6Mn by 2016 and is expected to reach US$ 58.1 Mn by2026 end, expanding at a CAGR of 5.0% over the forecastperiod
This segment is estimated to create absolute $opportunity of US$ 1.7 Mn in 2016 over 2015 and isexpected to create incremental $ opportunity of US$22.5 Mn between 2016 and 2026
Vitamins
Minerals
Figure 26: Singapore Functional Food IngredientsMarket Absolute $ Opportunity (US$ Mn ), by Minerals
Segment, 2016─2026Key Takeaways
Minerals segment is estimated to be valued at US$ 45.3Mn by 2016 and is expected to reach US$ 71.3 Mn by2026 end, expanding at a CAGR of 4.6% over the forecastperiod
This segment is estimated to create absolute $opportunity of US$ 1.9 Mn in 2016 over 2015 and isexpected to create incremental $ opportunity of US$26.0 Mn between 2016 and 2026
33
.9
45
.1
58
.1
+1
.7
+1
.6
+1
.8
+1
.9
+2
.0
2015(A)
2016(E)
2017(F)
2018(F)
2019(F)
2020(F)
2021(F)
2026(F)
US$
Mn
43
.4
56
.8
71
.3
+1
.9
+2
.0
+2
.2
+2
.2
+2
.4
2015(A)
2016(E)
2017(F)
2018(F)
2019(F)
2020(F)
2021(F)
2026(F)
US$
Mn
Source: FMI, 2016
Source: FMI, 2016
©2015 Future Market Insights, All Rights Reserved72
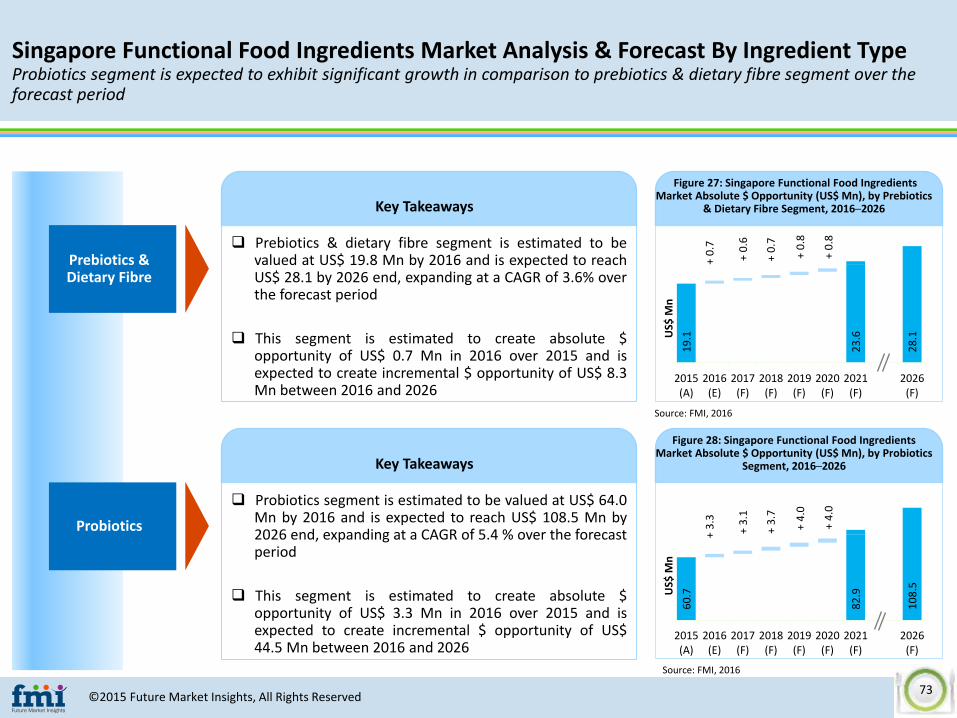
Singapore Functional Food Ingredients Market Analysis & Forecast By Ingredient Type Probiotics segment is expected to exhibit significant growth in comparison to prebiotics & dietary fibre segment over the forecast period
Figure 27: Singapore Functional Food IngredientsMarket Absolute $ Opportunity (US$ Mn), by Prebiotics
& Dietary Fibre Segment, 2016─2026Key Takeaways
Prebiotics & dietary fibre segment is estimated to bevalued at US$ 19.8 Mn by 2016 and is expected to reachUS$ 28.1 by 2026 end, expanding at a CAGR of 3.6% overthe forecast period
This segment is estimated to create absolute $opportunity of US$ 0.7 Mn in 2016 over 2015 and isexpected to create incremental $ opportunity of US$ 8.3Mn between 2016 and 2026
Prebiotics & Dietary Fibre
Probiotics
Figure 28: Singapore Functional Food IngredientsMarket Absolute $ Opportunity (US$ Mn), by Probiotics
Segment, 2016─2026Key Takeaways
Probiotics segment is estimated to be valued at US$ 64.0Mn by 2016 and is expected to reach US$ 108.5 Mn by2026 end, expanding at a CAGR of 5.4 % over the forecastperiod
This segment is estimated to create absolute $opportunity of US$ 3.3 Mn in 2016 over 2015 and isexpected to create incremental $ opportunity of US$44.5 Mn between 2016 and 2026
19
.1
23
.6
28
.1
+0
.7
+0
.6
+0
.7
+0
.8
+0
.8
2015(A)
2016(E)
2017(F)
2018(F)
2019(F)
2020(F)
2021(F)
2026(F)
US$
Mn
60
.7
82
.9
10
8.5
+3
.3
+3
.1
+3
.7
+4
.0
+4
.0
2015(A)
2016(E)
2017(F)
2018(F)
2019(F)
2020(F)
2021(F)
2026(F)
US$
Mn
Source: FMI, 2016
Source: FMI, 2016
©2015 Future Market Insights, All Rights Reserved73

Singapore Functional Food Ingredients Market Analysis & Forecast By Ingredient Type Protein segment is expected to exhibit significant growth in comparison to carotenoids segment over the forecast period
Figure 29: Singapore Functional Food IngredientsMarket Absolute $ Opportunity (US$ Mn), by
Carotenoids Segment, 2016─2026Key Takeaways
Carotenoids segment is estimated to be valued at US$9.7 Mn by 2016 and is expected to reach US$ 12.4 Mn by2026 end, expanding at a CAGR of 2.5% over the forecastperiod
This segment is estimated to create absolute $opportunity of US$ 0.2 Mn in 2016 over 2015 and isexpected to create incremental $ opportunity of US$ 2.7Mn between 2016 and 2026
Carotenoids
Protein
Figure 30: Singapore Functional Food IngredientsMarket Absolute $ Opportunity (US$ Mn), by Protein
Segment, 2016─2026Key Takeaways
Protein segment is estimated to be valued at US$ 32.4Mn by 2016 and is expected to reach US$ 48.3 Mn by2026 end, expanding at a CAGR of 4.1% over the forecastperiod
This segment is estimated to create absolute $opportunity of US$ 1.2 Mn in 2016 over 2015 and isexpected to create incremental $ opportunity of US$15.9 Mn between 2016 and 2026
9.5
11
.0
12
.4
+0
.2
+0
.3
+0
.3
+0
.3
+0
.2
2015(A)
2016(E)
2017(F)
2018(F)
2019(F)
2020(F)
2021(F)
2026(F)
US$
Mn
31
.2
39
.5
48
.3
+1
.2
+1
.3
+1
.3
+1
.4
+1
.5
2015(A)
2016(E)
2017(F)
2018(F)
2019(F)
2020(F)
2021(F)
2026(F)
US$
Mn
Source: FMI, 2016
Source: FMI, 2016
©2015 Future Market Insights, All Rights Reserved74

Singapore Functional Food Ingredients Market Analysis & Forecast By Ingredient Type Omega 3 fatty acids segment is expected to exhibit above average growth over the forecast period
Figure 31: Singapore Functional Food IngredientsMarket Absolute $ Opportunity (US$ Mn), by Omega 3
Fatty Acids Segment, 2016─2026
43
.5
55
.7
69
.2
+2
.0
+1
.6
+1
.7
+1
.9
+2
.2
2015(A)
2016(E)
2017(F)
2018(F)
2019(F)
2020(F)
2021(F)
2026(F)
US$
Mn
Key Takeaways
Omega 3 fatty acids segment is estimated to be valued atUS$ 45.5 Mn by 2016 and is expected to reach US$ 69.2Mn by 2026 end, expanding at a CAGR of 4.3% over theforecast period
This segment is estimated to create absolute $opportunity of US$ 2.0 Mn in 2016 over 2015 and isexpected to create incremental $ opportunity of US$23.7 Mn between 2016 and 2026
Omega 3 Fatty Acids
Source: FMI, 2016
©2015 Future Market Insights, All Rights Reserved75

Singapore Functional Food Ingredients Market Analysis & Forecast By Application
Table 5: Singapore Functional Food Ingredients Market Value (US$ Mn) and Absolute $ Opportunity (US$ Mn) by Application, 2015–2026
Application 2015 A 2016 E 2017 F 2018 F 2019 F 2020 F 2021 F 2026 FCAGR
(2016–2026)
BeveragesValue 65.2 68.2 71.2 74.3 77.8 81.6 85.7 110.2 4.9%
Opportunity 2.7 3.0 3.0 3.2 3.5 3.8 4.1 4.6
Dairy & dairy-based products
Value 75.4 79.5 83.5 88.1 92.7 97.6 102.9 134.8 5.4%
Opportunity 3.7 4.1 4.0 4.6 4.6 4.9 5.3 6.5
Infant FoodValue 57.8 60.3 62.6 64.9 67.6 70.1 72.9 85.6 3.6%
Opportunity 2.3 2.5 2.3 2.4 2.6 2.6 2.8 2.3
Bakery & Confectionery
Value 42.8 44.3 45.6 47.2 49.1 51.0 53.1 65.3 4.0%
Opportunity 1.2 1.5 1.3 1.6 1.8 2.0 2.1 1.9
Total 241.2 252.3 262.9 274.6 287.1 300.4 314.6 395.9 4.6%
©2015 Future Market Insights, All Rights Reserved76

Singapore Functional Food Ingredients Market Analysis & Forecast By Application Dairy & dairy-based products segment is expected to exhibit significant growth in comparison to beverages segment over the forecast period
Figure 32: Singapore Functional Food IngredientsMarket Absolute $ Opportunity (US$ Mn), by
Beverages Segment, 2016─2026Key Takeaways
Beverages segment is estimated to be valued at US$ 68.2Mn by 2016 and is expected to reach US$ 110.2 Mn by2026 end, expanding at a CAGR of 4.9% over the forecastperiod
This segment is estimated to create absolute $opportunity of US$ 3.0 Mn in 2016 over 2015 and isexpected to create incremental $ opportunity of US$42.0 Mn between 2016 and 2026
Beverages
Dairy & dairy-based products
Figure 33: Singapore Functional Food IngredientsMarket Absolute $ Opportunity (US$ Mn ), by Dairy &
dairy-based products Segment, 2016─2026Key Takeaways
Dairy & dairy-based products segment is estimated to bevalued at US$ 79.5 Mn by 2016 and is expected to reachUS$ 134.8 Mn by 2026 end, expanding at a CAGR of 5.4%over the forecast period
This segment is estimated to create absolute $opportunity of US$ 4.1 Mn in 2016 over 2015 and isexpected to create incremental $ opportunity of US$55.3 Mn between 2016 and 2026
65
.2
85
.7
11
0.2
+3
.0
+3
.0
+3
.2
+3
.5
+3
.8
2015(A)
2016(E)
2017(F)
2018(F)
2019(F)
2020(F)
2021(F)
2026(F)
US$
Mn
75
.4
10
2.9
13
4.8
+4
.1
+4
.0
+4
.6
+4
.6
+4
.9
2015(A)
2016(E)
2017(F)
2018(F)
2019(F)
2020(F)
2021(F)
2026(F)
US$
Mn
Source: FMI, 2016
Source: FMI, 2016
©2015 Future Market Insights, All Rights Reserved77

Singapore Functional Food Ingredients Market Analysis & Forecast By Application Bakery & confectionery segment is expected to exhibit significant growth in comparison to infant food segment over the forecast period
Figure 34: Singapore Functional Food IngredientsMarket Absolute $ Opportunity (US$ Mn), by Infant
Food Segment, 2016─2026Key Takeaways
Infant food segment is estimated to be valued at US$60.3 Mn by 2016 and is expected to reach US$ 85.6 Mnby 2026 end, expanding at a CAGR of 3.6% over theforecast period
This segment is estimated to create absolute $opportunity of US$ 2.5 Mn in 2016 over 2015 and isexpected to create incremental $ opportunity of US$25.3 Mn between 2016 and 2026
Infant Food
Bakery & Confectionery
Figure 35: Singapore Functional Food IngredientsMarket Absolute $ Opportunity (US$ Mn ), by Bakery &
Confectionery Segment, 2016─2026Key Takeaways
Bakery & confectionery segment is estimated to bevalued at US$ 44.3 Mn by 2016 and is expected to reachUS$ 65.3 Mn by 2026 end, expanding at a CAGR of 4.0%over the forecast period
This segment is estimated to create absolute $opportunity of US$ 1.5 Mn in 2016 over 2015 and isexpected to create incremental $ opportunity of US$21.0 Mn between 2016 and 2026
57
.8
72
.9
85
.6
+2
.5
+2
.3
+2
.4
+2
.6
+2
.6
2015(A)
2016(E)
2017(F)
2018(F)
2019(F)
2020(F)
2021(F)
2026(F)
US$
Mn
42
.8
53
.1
65
.3
+1
.5
+1
.3
+1
.6
+1
.8
+2
.0
2015(A)
2016(E)
2017(F)
2018(F)
2019(F)
2020(F)
2021(F)
2026(F)
US$
Mn
Source: FMI, 2016
Source: FMI, 2016
©2015 Future Market Insights, All Rights Reserved78

Singapore Functional Food Ingredients Market Attractiveness Analysis By Application & Ingredient Type
Figure 36: Singapore Functional Food Ingredients Market Attractiveness Analysis By Ingredients Type, 2016–2026
Figure 37: Singapore Functional Food Ingredients Market Attractiveness Analysis By Application, 2016–2026
Vitamins
Minerals
Prebiotics & Dietary Fibre
Probiotics
CarotenoidsProtein
Omega 3 Fatty Acids
Low Medium High
Low
Med
ium
Hig
h
Gro
wth
Ind
ex
(20
16–
2026
)
Total Index(Absolute Index + CAGR Index)
Bubble Size represents market
size for 2026 (F)
Beverages
Dairy & Dairy Based Products
Infant Food
Bakery & Confectionery
Low Medium High
Low
Med
ium
Hig
h
Gro
wth
Ind
ex
(20
16–
2026
)
Total Index(Absolute Index + CAGR Index)
Bubble Size represents market
size for 2026 (F)
Source: FMI, 2016 Source: FMI, 2016
©2015 Future Market Insights, All Rights Reserved79

Various ingredients providers are setting up new production plants in Singapore, for production of various ingredients for applicationssuch as nutritional drinks, infant food and sports nutrition products
In November 2012 for instance, Vitablend Asia Pacific Pte Ltd. opened a new state-of-the-art manufacturing plant in Singapore in order to caterto growing customer base in the Asia Pacific region. This company produces antioxidants, nutritional premixes and functional blends primarily forinfant and clinical nutrition at this facility.
Moreover, companies such as CP Kelco, Ingredion Incorporated and Koninklijke DSM N.V. plan to set up a new research centres inSingapore in order to cater to various needs of end user industries
In June 2014 Ingredion Incorporated announced plans for expansion of its Asia Pacific headquarters in Singapore. The new space will include astate-of-the-art research and development centre in order to cater to demand for various ingredient solutions.
Singapore Functional Food Ingredients Market Trends
Singapore
©2015 Future Market Insights, All Rights Reserved80

India Functional Food Ingredients Market Analysis
Section 9
©2015 Future Market Insights, All Rights Reserved81

India Functional Food Ingredients MarketFunctional food ingredients market in India is expected to exhibit significant market growth, owing to rising demand for ready-to-eat-food products with functional ingredients
Figure 38: India Functional Food Ingredients Market Value (US$ Mn), 2015–2026
Figure 39: India Functional Food Ingredients MarketAbsolute $ Opportunity (US$ Mn), 2016–2026
Key Takeaways
The functional food ingredients market in India is estimated to be valued at US$ 425.3 Mn by 2016 and is expected to reach US$ 736.3Mn by 2026 end, expanding at a CAGR of 5.6% over the forecast period
The functional food ingredients market in India is expected to represent absolute $ opportunity of US$ 21.9 Mn in 2016 over 2015 and isexpected to represent incremental $ opportunity of US$ 311.0 Mn between 2016 and 2026
40
3.4
42
5.3
44
9.3
47
3.3
49
8.7
52
6.5
55
5.9
73
6.3
0
100
200
300
400
500
600
700
800
2015 (A)2016 (E) 2017 (F) 2018 (F) 2019 (F) 2020 (F) 2021 (F) 2026 (F)
Val
ue
(U
S$ M
n)
Value
40
3.4
55
5.9
73
6.3
+2
1.9
+2
4.0
+2
4.0
+2
5.4
+2
7.8
2015 (A) 2016 (E) 2017 (F) 2018 (F) 2019 (F) 2020 (F) 2021 (F) 2026 (F)
US$
Mn
Source: FMI, 2016 Source: FMI, 2016
©2015 Future Market Insights, All Rights Reserved82

India Functional Food Ingredients Market Analysis & Forecast By Ingredient TypeProbiotics segment is expected to remain dominant in terms of value over the forecast period, due to increasing application of probiotics in beverages and infant formula
Table 6: India Functional Food Ingredients Market Value (US$ Mn) and absolute $ opportunity (US$ Mn) by Ingredient Type, 2015–2026
Ingredient Type 2015 A 2016 E 2017 F 2018 F 2019 F 2020 F 2021 F 2026 FCAGR
(2016–2026)
VitaminsValue 48.7 51.6 54.6 57.8 61.1 64.9 68.8 93.4 6.1%
Opportunity 2.4 2.9 3.0 3.2 3.3 3.8 3.9 5.6
MineralsValue 64.3 67.6 71.4 75.4 79.3 83.7 88.3 116.7 5.6%
Opportunity 2.6 3.2 3.8 4.1 3.9 4.4 4.6 6.3
Prebiotics & Dietary Fibre
Value 23.9 24.8 25.7 26.6 27.4 28.3 29.3 34.9 3.5%
Opportunity 0.7 1.0 0.8 0.9 0.9 0.9 0.9 1.4
ProbioticsValue 93.6 98.8 105.1 112.0 119.4 128.0 136.9 193.0 6.9%
Opportunity 4.9 5.2 6.2 6.9 7.4 8.6 8.9 12.5
CarotenoidsValue 7.8 8.0 8.3 8.5 8.7 8.9 9.1 10.4 2.6%
Opportunity 0.1 0.2 0.2 0.2 0.2 0.2 0.2 0.3
ProteinValue 44.0 45.9 48.2 50.4 52.6 55.1 57.7 73.5 4.8%
Opportunity 1.5 2.0 2.2 2.2 2.3 2.5 2.6 3.5
Omega 3 Fatty Acids
Value 121.0 128.4 136.1 142.6 150.1 157.5 165.8 214.3 5.3%
Opportunity 5.4 7.4 7.6 6.5 7.5 7.4 8.3 8.8 Total 403.4 425.3 449.3 473.3 498.7 526.5 555.9 736.3 5.6%
Source: FMI, 2016
©2015 Future Market Insights, All Rights Reserved83

India Functional Food Ingredients Market Analysis & Forecast By Ingredient Type Vitamins segment is expected to exhibit significant growth in comparison to minerals segment over the forecast period
Figure 40: India Functional Food Ingredients Market Absolute $ Opportunity (US$ Mn), by Vitamins
Segment, 2016─2026Key Takeaways
Vitamins segment is estimated to be valued at US$ 51.6Mn by 2016 and is expected US$ 93.4 Mn by 2026 end,expanding at a CAGR of 6.1% over the forecast period
This segment is estimated to create absolute $opportunity of US$ 2.9 Mn in 2016 over 2015 and isexpected to create incremental $ opportunity of US$41.8 Mn between 2016 and 2026
Vitamins
Minerals
Figure 41: India Functional Food Ingredients Market Absolute $ Opportunity (US$ Mn ), by Minerals
Segment, 2016─2026Key Takeaways
Minerals segment is estimated to be valued at US$ 67.6Mn by 2016 and is expected to reach US$ 116.7 Mn by2026 end, expanding at a CAGR of 5.6% over the forecastperiod
This segment is estimated to create absolute $opportunity of US$ 3.2 Mn in 2016 over 2015 and isexpected to create incremental $ opportunity of US$49.2 Mn between 2016 and 2026
48
.7
68
.8
93
.4
+2
.9
+3
.0
+3
.2
+3
.3
+3
.8
2015(A)
2016(E)
2017(F)
2018(F)
2019(F)
2020(F)
2021(F)
2026(F)
US$
Mn
64
.3
88
.3
11
6.7
+3
.2
+3
.8
+4
.1
+3
.9
+4
.4
2015(A)
2016(E)
2017(F)
2018(F)
2019(F)
2020(F)
2021(F)
2026(F)
US$
Mn
Source: FMI, 2016
Source: FMI, 2016
©2015 Future Market Insights, All Rights Reserved84

India Functional Food Ingredients Market Analysis & Forecast By Ingredient Type Probiotics segment is expected to exhibit significant market growth in comparison to prebiotics & dietary fibre segment during the forecast period
Figure 42: India Functional Food Ingredients Market Absolute $ Opportunity (US$ Mn), by Prebiotics &
Dietary Fibre Segment, 2016─2026Key Takeaways
Prebiotics & dietary fibre segment is estimated to bevalued at US$ 24.8 Mn in 2016, and expected to reachUS$ 34.9 Mn by 2026 end, expanding at a CAGR of 3.5%over the forecast period
This segment is estimated to create absolute $opportunity of US$ 1.0 Mn in 2016 over 2015 and isexpected to create incremental $ opportunity of US$10.1 Mn between 2016 and 2026
Prebiotics & Dietary Fibre
Probiotics
Figure 43: India Functional Food Ingredients Market Absolute $ Opportunity (US$ Mn), by Probiotics
Segment, 2016─2026Key Takeaways
Probiotics segment is estimated to be valued at US$ 98.8Mn by 2016 and is expected to reach US$ 193.0 Mn by2026 end, expanding at a CAGR of 6.9% over the forecastperiod
This segment is estimated to create absolute $opportunity of US$ 5.2 Mn in 2016 over 2015 and isexpected to create incremental $ opportunity of US$94.2 Mn between 2016 and 2026
23
.9
29
.3
34
.9
+1
.0
+0
.8
+0
.9
+0
.9
+0
.9
2015(A)
2016(E)
2017(F)
2018(F)
2019(F)
2020(F)
2021(F)
2026(F)
US$
Mn
93
.6
13
6.9
19
3.0
+5
.2
+6
.2
+6
.9
+7
.4
+8
.6
2015(A)
2016(E)
2017(F)
2018(F)
2019(F)
2020(F)
2021(F)
2026(F)
US$
Mn
Source: FMI, 2016
Source: FMI, 2016
©2015 Future Market Insights, All Rights Reserved85

India Functional Food Ingredients Market Analysis & Forecast By Ingredient Type Protein segment is expected to exhibit significant growth in comparison to carotenoids segment over the forecast period
Figure 44: India Functional Food Ingredients Market Absolute $ Opportunity (US$ Mn), by Carotenoids
Segment, 2016─2026Key Takeaways
Carotenoids segment is estimated to be valued at US$8.0 Mn by 2016, and is expected to reach US$ 12.4 Mnby 2026 end, expanding at a CAGR of 2.5% over theforecast period
This segment is estimated to create absolute $opportunity of US$ 0.2 Mn in 2016 over 2015 and isexpected to create incremental $ opportunity of US$ 2.7Mn between 2016 and 2026
Carotenoids
Protein
Figure 45: India Functional Food Ingredients Market Absolute $ Opportunity (US$ Mn), by Protein Segment,
2016─2026Key Takeaways
Protein segment is estimated to be valued at US$ 45.9Mn, and expected to reach US$ 73.5 Mn by 2026 end,expanding at a CAGR of 4.8% over the forecast period
This segment is estimated to create absolute $opportunity of US$ 2.0 Mn in 2016 over 2015 and isexpected to create incremental $ opportunity of US$27.5 Mn between 2016 and 2026
7.8
9.1
10
.4
+0
.2
+0
.2
+0
.2
+0
.2
+0
.2
2015(A)
2016(E)
2017(F)
2018(F)
2019(F)
2020(F)
2021(F)
2026(F)
US$
Mn
44
.0
57
.7
73
.5
+2
.0
+2
.2
+2
.2
+2
.3
+2
.5
2015(A)
2016(E)
2017(F)
2018(F)
2019(F)
2020(F)
2021(F)
2026(F)
US$
Mn
Source: FMI, 2016
Source: FMI, 2016
©2015 Future Market Insights, All Rights Reserved86

India Functional Food Ingredients Market Analysis & Forecast By Ingredient Type Omega 3 fatty acids segment is expected to exhibit above average growth in the functional food ingredients market in India over the forecast period
Figure 46: India Functional Food Ingredients Market Absolute $ Opportunity (US$ Mn), by Omega 3 Fatty
Acids Segment, 2016─2026
12
1.0
16
5.8
21
4.3
+7
.4
+7
.6
+6
.5
+7
.5
+7
.4
2015(A)
2016(E)
2017(F)
2018(F)
2019(F)
2020(F)
2021(F)
2026(F)
US$
Mn
Key Takeaways
Omega 3 fatty acids segment is estimated to be valued atUS$ 128.4 Mn by 2016 and is expected to reach US$214.3 Mn by 2026 end, expanding at a CAGR of 5.3%over the forecast period
This segment is estimated to create absolute $opportunity of US$ 7.4 Mn in 2016 over 2015 and isexpected to create incremental $ opportunity of US$85.9 Mn between 2016 and 2026
Omega 3 Fatty Acids
Source: FMI, 2016
©2015 Future Market Insights, All Rights Reserved87

India Functional Food Ingredients Market Analysis & Forecast By Application
Table 7: India Functional Food Ingredients Market Value (US$ Mn) and Absolute $ Opportunity (US$ Mn) by Application, 2015–2026
Application 2015 A 2016 E 2017 F 2018 F 2019 F 2020 F 2021 F 2026 FCAGR
(2016–2026)
BeveragesValue 109.0 115.1 121.7 127.9 135.1 142.8 151.2 205.4 6.0%
Opportunity 4.8 6.1 6.6 6.2 7.2 7.7 8.5 12.0
Dairy & dairy-based products
Value 126.2 134.1 142.8 152.0 161.4 171.4 182.1 250.9 6.5%
Opportunity 6.6 8.0 8.6 9.2 9.4 10.1 10.6 15.8
Infant FoodValue 96.6 101.2 106.5 111.9 117.2 123.1 128.8 157.8 4.5%
Opportunity 4.1 4.5 5.3 5.4 5.3 5.8 5.7 5.4
Bakery & Confectionery
Value 71.6 74.9 78.4 81.5 85.0 89.3 93.9 122.2 5.0%
Opportunity 2.2 3.3 3.5 3.1 3.5 4.2 4.6 5.1
Total 403.4 425.3 449.3 473.3 498.7 526.5 555.9 736.3 5.6%
Source: FMI, 2016
©2015 Future Market Insights, All Rights Reserved88

India Functional Food Ingredients Market Analysis & Forecast By Application Dairy & dairy-based products segment is expected to exhibit significant growth in comparison to beverages segment over the forecast period
Figure 47: India Functional Food Ingredients Market Absolute $ Opportunity (US$ Mn), by Beverages
Segment, 2016─2026Key Takeaways
Beverages segment is estimated to be valued at US$115.1 Mn by 2016 and is expected to reach US$ 205.4Mn by 2026 end, expanding at a CAGR of 6.0% over theforecast period
This segment is estimated to create absolute $opportunity of US$ 6.1 Mn in 2016 over 2015 and isexpected to create incremental $ opportunity of US$90.3 Mn between 2016 and 2026
Beverages
Dairy & dairy-based products
Figure 48: India Functional Food Ingredients Market Absolute $ Opportunity (US$ Mn ), by Dairy & dairy-
based products Segment, 2016─2026Key Takeaways
Dairy & dairy-based products segment is estimated to bevalued at US$ 134.1 Mn by 2016 and is expected to reachUS$ 250.9 Mn by 2026 end, expanding at a CAGR of 6.5%over the forecast period
This segment is estimated to create absolute $opportunity of US$ 8.0 Mn in 2016 over 2015 and isexpected to create incremental $ opportunity of US$116.8 Mn between 2016 and 2026
10
9.0
15
1.2
20
5.4
+6
.1
+6
.6
+6
.2
+7
.2
+7
.7
2015(A)
2016(E)
2017(F)
2018(F)
2019(F)
2020(F)
2021(F)
2026(F)
US$
Mn
12
6.2
18
2.1
25
0.9
+8
.0
+8
.6
+9
.2
+9
.4
+1
0.1
2015(A)
2016(E)
2017(F)
2018(F)
2019(F)
2020(F)
2021(F)
2026(F)
US$
Mn
Source: FMI, 2016
Source: FMI, 2016
©2015 Future Market Insights, All Rights Reserved89

India Functional Food Ingredients Market Analysis & Forecast By Application Bakery & confectionery segment is expected to exhibit significant growth in comparison to infant food segment over the forecast period
Figure 49: India Functional Food Ingredients Market Absolute $ Opportunity (US$ Mn), by Infant Food
Segment, 2016─2026Key Takeaways
Infant food segment is estimated to be valued at US$101.2 Mn in 2016 and is expected to reach US$ 157.8 Mnby 2026 end, expanding at a CAGR of 4.5% over theforecast period
This segment is estimated to create absolute $opportunity of US$ 4.5 Mn in 2016 over 2015. Thissegment is expected to create incremental $ opportunityof US$ 56.7 Mn between 2016 and 2026
Infant Food
Bakery & Confectionery
Figure 50: India Functional Food Ingredients Market Absolute $ Opportunity (US$ Mn ), by Bakery &
Confectionery Segment, 2016─2026Key Takeaways
Bakery & confectionery segment is estimated to bevalued at US$ 74.9 Mn in 2016 and is expected to reachUS$ 122.2 Mn by 2026 end, expanding at a CAGR of 5.0%over the forecast period
This segment is estimated to create absolute $opportunity of US$ 3.3 Mn in 2016 over 2015 and isexpected to create incremental $ opportunity of US$47.3 Mn between 2016 and 2026
96
.6
12
8.8
15
7.8
+4
.5
+5
.3
+5
.4
+5
.3
+5
.8
2015(A)
2016(E)
2017(F)
2018(F)
2019(F)
2020(F)
2021(F)
2026(F)
US$
Mn
71
.6
93
.9
12
2.2
+3
.3
+3
.5
+3
.1
+3
.5
+4
.2
2015(A)
2016(E)
2017(F)
2018(F)
2019(F)
2020(F)
2021(F)
2026(F)
US$
Mn
Source: FMI, 2016
Source: FMI, 2016
©2015 Future Market Insights, All Rights Reserved90

India Functional Food Ingredients Market Attractiveness Analysis By Application & Ingredient Type
Figure 51: India Functional Food Ingredients Market Attractiveness Analysis By Ingredients Type, 2016–2026
Figure 52: India Functional Food Ingredients Market Attractiveness Analysis By Application, 2016–2026
Vitamins
Minerals
Prebiotics & Dietary Fibre
Probiotics
CarotenoidsProtein
Omega 3 Fatty Acids
Low Medium High
Low
Med
ium
Hig
h
Gro
wth
Ind
ex
(20
16–
2026
)
Total Index(Absolute Index + CAGR Index)
Bubble Size represents market
size for 2026 (F)
Beverages
Dairy & Dairy Based Products
Infant Food
Bakery & Confectionery
Low Medium High
Low
Med
ium
Hig
h
Gro
wth
Ind
ex
(20
16–
2026
)
Total Index(Absolute Index + CAGR Index)
Bubble Size represents market
size for 2026 (F)
Source: FMI, 2016 Source: FMI, 2016
©2015 Future Market Insights, All Rights Reserved91

Companies such as Koninklijke DSM N.V., Archer Daniels Midland Company and BASF SE have strong presence in India. Addition of foodingredients such as proteins, omega 3 and omega 6 fatty acids and vitamins is increasing along with rising trend towards healthy foodoptions. Meanwhile, consumers enjoy convenience in ready-to-eat and ready-to-drink fortified products that offer functional healthbenefits above the basic nutritional value of foodstuffs.
Despite low level of consumer awareness compared to other countries, functional food ingredients are anticipated to witness significantdemand in India due to increasing preference of consumers for functional food and beverages
Currently, most popular probiotics products in India are dahi (Indian yogurt) and also probiotic beverages such as buttermilk, fermentedand unfermented milk and flavoured milk. In addition, various types of products that include probiotic ingredients are smoothies andinfant/toddler formula.
Moreover, various companies operating in the Asia Pacific region are incorporating novel technologies in order to enhance usability andstability of ingredients such as microencapsulation technology to enhance shelf life of probiotic ingredients, which are added tofunctional foods to impart various health-related benefits to consumers
India Functional Food Ingredients Market Trends
India
©2015 Future Market Insights, All Rights Reserved92

Japan Functional Food Ingredients Market Analysis
Section 10
©2015 Future Market Insights, All Rights Reserved93

Japan Functional Food Ingredients MarketJapan functional food ingredients market is projected to exhibit significant market growth due to increasing demand for functional foods containing ingredients such as vitamins and amino acids
Figure 53 Japan Functional Food Ingredients Market Value (US$ Mn), 2015–2026
Figure 54: Japan Functional Food Ingredients Market Absolute $ Opportunity (US$ Mn), 2016–2026
Key Takeaways
The functional food ingredients market in Japan is estimated to be valued at US$ 903.6 Mn by 2016 and is expected to reach US$ 1,767.6Mn by 2026 end, expanding at a CAGR of 6.9% over the forecast period
The functional food ingredients market in Japan is estimated to represent absolute $ opportunity of US$ 53.8 Mn in 2016 over 2015 andis expected to represent incremental $ opportunity of US$ 864.0 Mn between 2016 and 2026
84
9.8
90
3.6
96
3.5
1,0
26
.3
1,0
92
.1
1,1
63
.1
1,2
44
.6 1
,76
7.6
0
200
400
600
800
1,000
1,200
1,400
1,600
1,800
2,000
2015 (A)2016 (E) 2017 (F) 2018 (F) 2019 (F) 2020 (F) 2021 (F) 2026 (F)
Val
ue
(U
S$ M
n)
Value
84
9.8
1,2
44
.6
1,7
67
.6
+5
3.8
+5
9.9
+6
2.8
+6
5.8
+7
1.0
2015 (A) 2016 (E) 2017 (F) 2018 (F) 2019 (F) 2020 (F) 2021 (F) 2026 (F)
US$
Mn
Source: FMI, 2016 Source: FMI, 2016
©2015 Future Market Insights, All Rights Reserved94

Japan Functional Food Ingredients Market Analysis & Forecast By Ingredient TypeProbiotics segment is expected to remain dominant during the forecast period in terms of value, attributed to rising awareness among Japanese consumers regarding health benefits associated with probiotic beverages
Table 8: Japan Functional Food Ingredients Market Value (US$ Mn) and absolute $ opportunity (US$ Mn) by Ingredient Type, 2015–2026
Ingredient Type 2015 A 2016 E 2017 F 2018 F 2019 F 2020 F 2021 F 2026 FCAGR
(2016–2026)
VitaminsValue 129.1 137.0 146.2 156.5 166.3 178.3 192.0 279.3 7.4%
9.5 7.9 9.2 10.3 9.8 12.0 13.7 22.9
MineralsValue 153.2 163.5 174.9 186.3 198.8 211.4 226.9 322.1 7.0%
Opportunity 9.8 10.3 11.4 11.4 12.5 12.6 15.6 24.9
Prebiotics & Dietary Fibre
Value 68.4 72.3 76.5 80.3 84.3 88.8 93.7 123.6 5.5%
Opportunity 4.6 3.9 4.3 3.8 4.0 4.5 5.0 7.6
ProbioticsValue 223.0 239.5 257.4 276.3 296.6 318.0 342.3 512.8 7.9%
Opportunity 15.8 16.6 17.8 18.9 20.3 21.4 24.3 44.6
CarotenoidsValue 42.1 44.4 46.0 47.6 49.3 51.7 54.0 69.5 4.6%
Opportunity 2.2 2.3 1.6 1.6 1.8 2.4 2.3 3.9
ProteinValue 93.2 99.1 105.3 111.4 117.2 123.6 131.1 177.6 6.0%
Opportunity 5.6 5.9 6.2 6.1 5.8 6.5 7.5 11.6
Omega 3 Fatty Acids
Value 140.8 147.8 157.3 168.0 179.7 191.3 204.4 282.8 6.7%
Opportunity 5.3 7.0 9.5 10.7 11.7 11.7 13.1 21.0 Total 849.8 903.6 963.5 1,026.3 1,092.1 1,163.1 1,244.6 1,767.6 6.9%
Source: FMI, 2016
©2015 Future Market Insights, All Rights Reserved95

Japan Functional Food Ingredients Market Analysis & Forecast By Ingredient Type Vitamins segment is expected to exhibit significant market growth in comparison to minerals segment during the forecast period
Figure 55: Japan Functional Food Ingredients Market Absolute $ Opportunity (US$ Mn), by Vitamins
Segment, 2016─2026Key Takeaways
Vitamins segment is estimated to be valued at US$ 137.0Mn by 2016 and is expected to reach US$ 279.3 Mn by2026 end, expanding at a CAGR of 7.4% over the forecastperiod
Vitamins segment is estimated to create absolute $opportunity of US$ 7.9 Mn in 2016 over 2015. Thissegment is expected to create incremental $ opportunityof US$ 142.3 Mn between 2016 and 2026
Vitamins
Minerals
Figure 56: Japan Functional Food Ingredients Market Absolute $ Opportunity (US$ Mn ), by Minerals
Segment, 2016─2026Key Takeaways
Minerals segment is estimated to be valued at US$ 163.5Mn by 2016 and is expected to reach US$ 322.1 Mn by2026 end, expanding at a CAGR of 7.0% over the forecastperiod
This segment is estimated to create absolute $opportunity of US$ 10.3 Mn in 2016 over 2015 and isexpected to create incremental $ opportunity of US$158.6 Mn between 2016 and 2026
12
9.1
19
2.0
27
9.3
+7
.9
+9
.2
+1
0.3
+9
.8
+1
2.0
2015(A)
2016(E)
2017(F)
2018(F)
2019(F)
2020(F)
2021(F)
2026(F)
US$
Mn
15
3.2
22
6.9
32
2.1
+1
0.3
+1
1.4
+1
1.4
+1
2.5
+1
2.6
2015(A)
2016(E)
2017(F)
2018(F)
2019(F)
2020(F)
2021(F)
2026(F)
US$
Mn
Source: FMI, 2016
Source: FMI, 2016
©2015 Future Market Insights, All Rights Reserved96

Japan Functional Food Ingredients Market Analysis & Forecast By Ingredient Type Probiotics segment is expected to exhibit significant growth in comparison to prebiotics & dietary fibre segment over the forecast period
Figure 57: Japan Functional Food Ingredients Market Absolute $ Opportunity (US$ Mn), by Prebiotics &
Dietary Fibre Segment, 2016─2026Key Takeaways
Prebiotics & dietary fibre segment is estimated to bevalued at US$ 72.3 Mn by 2016 and is expected to reachUS$ 123.6 Mn by 2026 end, expanding at a CAGR of 5.5%over the forecast period
Prebiotics & dietary fibre segment is estimated to createabsolute $ opportunity of US$ 3.9 Mn in 2016 over 2015.This segment is expected to create incremental $opportunity of US$ 51.3 Mn between 2016 and 2026.
Prebiotics & Dietary Fibre
Probiotics
Figure 58: Japan Functional Food Ingredients Market Absolute $ Opportunity (US$ Mn), by Probiotics
Segment, 2016─2026Key Takeaways
Probiotics segment is estimated to be valued at US$239.5 Mn by 2016 and is expected to reach US$ 512.8Mn by 2026 end, expanding at a CAGR of 7.9 % over theforecast period
This segment is estimated to create absolute $opportunity of US$ 16.6 Mn in 2016 over 2015 and isexpected to create incremental $ opportunity of US$273.2 Mn between 2016 and 2026
68
.4
93
.7
12
3.6
+3
.9
+4
.3
+3
.8
+4
.0
+4
.5
2015(A)
2016(E)
2017(F)
2018(F)
2019(F)
2020(F)
2021(F)
2026(F)
US$
Mn
22
3.0
34
2.3
51
2.8
+1
6.6
+1
7.8
+1
8.9
+2
0.3
+2
1.4
2015(A)
2016(E)
2017(F)
2018(F)
2019(F)
2020(F)
2021(F)
2026(F)
US$
Mn
Source: FMI, 2016
Source: FMI, 2016
©2015 Future Market Insights, All Rights Reserved97

Japan Functional Food Ingredients Market Analysis & Forecast By Ingredient Type Protein segment is expected to exhibit significant growth in comparison to carotenoids segment over the forecast period
Figure 59: Japan Functional Food Ingredients Market Absolute $ Opportunity (US$ Mn), by Carotenoids
Segment, 2016─2026Key Takeaways
Carotenoids segment is estimated to be valued at US$44.4 Mn by 2016 and is expected to reach US$ 69.5 Mnby 2026 end, expanding at a CAGR of 4.6% over theforecast period
Carotenoids segment is estimated to create absolute $opportunity of US$ 2.3 Mn in 2016 over 2015. Thissegment is expected to create incremental $ opportunityof US$ 25.1 Mn between 2016 and 2026.
Carotenoids
Protein
Figure 60: Japan Functional Food Ingredients Market Absolute $ Opportunity (US$ Mn), by Protein Segment,
2016─2026Key Takeaways
Protein segment is estimated to be valued at US$ 99.1Mn by 2016 and is expected to reach US$ 177.6 Mn by2026 end, expanding at a CAGR of 6.0% over the forecastperiod
This segment is estimated to create absolute $opportunity of US$ 5.9 Mn in 2016 over 2015 and isexpected to create incremental $ opportunity of US$78.5 Mn between 2016 and 2026
42
.1
54
.0
69
.5
+2
.3
+1
.6
+1
.6
+1
.8
+2
.4
2015(A)
2016(E)
2017(F)
2018(F)
2019(F)
2020(F)
2021(F)
2026(F)
US$
Mn
93
.2
13
1.1
17
7.6
+5
.9
+6
.2
+6
.1
+5
.8
+6
.5
2015(A)
2016(E)
2017(F)
2018(F)
2019(F)
2020(F)
2021(F)
2026(F)
US$
Mn
Source: FMI, 2016
Source: FMI, 2016
©2015 Future Market Insights, All Rights Reserved98

Japan Functional Food Ingredients Market Analysis & Forecast By Ingredient Type Omega 3 fatty acids segment is anticipated to exhibit above average growth over the forecast period
Figure 61: Japan Functional Food Ingredients Market Absolute $ Opportunity (US$ Mn), by Omega 3 Fatty
Acids Segment, 2016─2026
14
0.8
20
4.4
28
2.8
+7
.0
+9
.5
+1
0.7
+1
1.7
+1
1.7
2015(A)
2016(E)
2017(F)
2018(F)
2019(F)
2020(F)
2021(F)
2026(F)
US$
Mn
Key Takeaways
Omega 3 fatty acids segment is estimated to be valued atUS$ 147.8 Mn by 2016 and is expected to reach US$282.8 Mn by 2026 end, expanding at a CAGR of 6.7%over the forecast period
This segment is estimated to create absolute $opportunity of US$ 7.0 Mn in 2016 over 2015 and isexpected to create incremental $ opportunity of US$135.0 Mn between 2016 and 2026
Omega 3 Fatty Acids
Source: FMI, 2016
©2015 Future Market Insights, All Rights Reserved99

Japan Functional Food Ingredients Market Analysis & Forecast By Application
Table 9: Japan Functional Food Ingredients Market Value (US$ Mn) and Absolute $ Opportunity (US$ Mn) by Application, 2015–2026
Application 2015 A 2016 E 2017 F 2018 F 2019 F 2020 F 2021 F 2026 FCAGR
(2016–2026)
BeveragesValue 230.5 246.8 264.6 282.9 301.9 322.0 345.7 491.2 7.1%
Opportunity 15.4 16.2 17.8 18.3 19.0 20.1 23.7 37.8
Dairy & dairy-based products
Value 263.6 282.2 304.2 326.6 350.4 375.4 403.6 592.5 7.7%
Opportunity 16.5 18.6 22.0 22.4 23.8 24.9 28.2 50.2
Infant FoodValue 203.4 215.1 229.1 243.7 258.4 272.6 289.3 386.9 6.0%
Opportunity 12.2 11.7 14.0 14.6 14.7 14.2 16.7 26.7
Bakery & Confectionery
Value 152.2 159.5 165.7 173.1 181.4 193.1 206.0 297.0 6.4%
Opportunity 8.7 7.3 6.2 7.5 8.2 11.7 12.9 21.7
Total 849.8 903.6 963.5 1,026.3 1,092.1 1,163.1 1,244.6 1,767.6 6.9%
Source: FMI, 2016
©2015 Future Market Insights, All Rights Reserved100

Japan Functional Food Ingredients Market Analysis & Forecast By Application Dairy & dairy-based products segment is expected to exhibit significant growth in comparison to beverages segment over the forecast period
Figure 62: Japan Functional Food Ingredients Market Absolute $ Opportunity (US$ Mn), by Beverages
Segment, 2016─2026Key Takeaways
Beverages segment is estimated to be valued at US$246.8 Mn by 2016 and is expected to reach US$ 491.2Mn by 2026 end, expanding at a CAGR of 7.1% over theforecast period
This segment is estimated to create absolute $opportunity of US$ 16.2 Mn in 2016 over 2015 and isexpected to create incremental $ opportunity of US$244.4 Mn between 2016 and 2026
Beverages
Dairy & dairy-based products
Figure 63: Japan Functional Food Ingredients Market Absolute $ Opportunity (US$ Mn ), by Dairy & dairy-
based products Segment, 2016─2026Key Takeaways
Dairy & dairy-based products segment is estimated to bevalued at US$ 282.2 Mn by 2016 and is expected to reachUS$ 592.5 Mn by 2026 end, expanding at a CAGR of 7.7%over the forecast period
This segment is estimated to create absolute $opportunity of US$ 18.6 Mn in 2016 over 2015 and isexpected to create incremental $ opportunity of US$310.3 Mn between 2016 and 2026
23
0.5
34
5.7
49
1.2
+1
6.2
+1
7.8
+1
8.3
+1
9.0
+2
0.1
2015(A)
2016(E)
2017(F)
2018(F)
2019(F)
2020(F)
2021(F)
2026(F)
US$
Mn
26
3.6
40
3.6
59
2.5
+1
8.6
+2
2.0
+2
2.4
+2
3.8
+2
4.9
2015(A)
2016(E)
2017(F)
2018(F)
2019(F)
2020(F)
2021(F)
2026(F)
US$
Mn
Source: FMI, 2016
Source: FMI, 2016
©2015 Future Market Insights, All Rights Reserved101

Japan Functional Food Ingredients Market Analysis & Forecast By Application Bakery & confectionery segment is expected to exhibit significant growth in comparison to infant food segment over the forecast period
Figure 64: Japan Functional Food Ingredients Market Absolute $ Opportunity (US$ Mn), by Infant Food
Segment, 2016─2026Key Takeaways
Infant food segment is estimated to be valued at US$215.1 Mn by 2016 and is expected to reach US$ 386.9Mn by 2026 end, expanding at a CAGR of 6.0% over theforecast period
Infant food segment is estimated to create absolute $opportunity of US$ 11.7 Mn in 2016 over 2015. Thissegment is expected to create incremental $ opportunityof US$ 171.8 Mn between 2016 and 2026.
Infant Food
Bakery & Confectionery
Figure 65: Japan Functional Food Ingredients Market Absolute $ Opportunity (US$ Mn ), by Bakery &
Confectionery Segment, 2016─2026Key Takeaways
Bakery & confectionery segment is estimated to bevalued at US$ 159.5 Mn by 2016 and is expected to reachUS$ 297.0 Mn by 2026 end, expanding at a CAGR of 6.4%over the forecast period
This segment is estimated to create absolute $opportunity of US$ 7.3 Mn in 2016 over 2015 and isexpected to create incremental $ opportunity of US$137.5 Mn between 2016 and 2026
20
3.4
28
9.3
38
6.9
+1
1.7
+1
4.0
+1
4.6
+1
4.7
+1
4.2
2015(A)
2016(E)
2017(F)
2018(F)
2019(F)
2020(F)
2021(F)
2026(F)
US$
Mn
15
2.2
20
6.0
29
7.0
+7
.3
+6
.2
+7
.5
+8
.2
+1
1.7
2015(A)
2016(E)
2017(F)
2018(F)
2019(F)
2020(F)
2021(F)
2026(F)
US$
Mn
Source: FMI, 2016
Source: FMI, 2016
©2015 Future Market Insights, All Rights Reserved102

Japan Functional Food Ingredients Market Attractiveness Analysis By Application & Ingredient Type
Figure 66: Japan Functional Food Ingredients Market Attractiveness Analysis By Ingredients Type, 2016–2026
Figure 67: Japan Functional Food Ingredients Market Attractiveness Analysis By Application, 2016–2026
Vitamins
Minerals
Prebiotics & Dietary Fibre Probiotics
Carotenoids
Protein
Omega 3 Fatty Acids
-
0.90
1.80
0.00 1.00 2.00 3.00 4.00 5.00
Low Medium High
Low
Med
ium
Hig
h
Gro
wth
Ind
ex
(20
16–
2026
)
Total Index(Absolute Index + CAGR Index)
Bubble Size represents market
size for 2026 (F)
BeveragesDairy & Dairy Based
Products
Infant Food
Bakery & Confectionery
Low Medium High
Low
Med
ium
Hig
h
Gro
wth
Ind
ex
(20
16–
2026
)
Total Index(Absolute Index + CAGR Index)
Bubble Size represents market
size for 2026 (F)
Source: FMI, 2016 Source: FMI, 2016
©2015 Future Market Insights, All Rights Reserved103

Demand for functional food products containing functional ingredients that are registered as FOSHU is significantly high. Demand forfunctional beverages and chewing gums that contain vitamins and amino acids is comparatively higher in the market in Japan.
In the confectionery segment, the fastest-growing sub-segment is cereal bars. Various functional cereal bars that have positive effects onhealth are being continuously introduced into the Japanese market. Functional snack bars containing dietary fibre, vitamin C and aminoacids are some popular ingredients among consumers in the country.
Moreover, food products such as beverages and dairy products containing probiotic ingredients have positive effects on the humandigestive system. Probiotic beverages and yogurts are widely available and considered as healthy snacks among Japanese consumers.
Moreover, calcium-enriched products are high in demand in Japan as these enhance bone strength and are especially preferred bymiddle-aged female consumers. Various other functional ingredients such as calcium, polyphenols and oligosaccharides are increasinglygaining traction among various end user industries.
Japan Functional Food Ingredients Market Trends
Japan
©2015 Future Market Insights, All Rights Reserved104

China Functional Food Ingredients Market Analysis
Section 11
©2015 Future Market Insights, All Rights Reserved105

China Functional Food Ingredients MarketIncreasing application of functional food ingredients in food products to develop new food products with various health benefits is expected to drive growth of the functional food ingredients market in China
Figure 68: China Functional Food Ingredients Market Value (US$ Mn), 2015–2026
Figure 69: China Functional Food Ingredients Market Absolute $ Opportunity (US$ Mn), 2016–2026
Key Takeaways
The functional food ingredients market in China is estimated to be valued at US$ 544.0 Mn by 2016 and is expected to reach US$ 1002.1Mn by 2026 end, expanding at a CAGR of 6.3% over the forecast period
The functional food ingredients market in China is estimated to represent absolute $ opportunity of US$ 28.6 Mn in 2016 over 2015 andexpected to represent incremental $ opportunity of US$ 458.1 Mn between 2016 and 2026
51
5.4
54
4.0
57
5.7
60
9.2
64
7.2
68
4.4
72
6.5
1,0
02
.1
0
200
400
600
800
1,000
1,200
2015 (A)2016 (E) 2017 (F) 2018 (F) 2019 (F) 2020 (F) 2021 (F) 2026 (F)
Val
ue
(U
S$ M
n)
Value
51
5.4
72
6.5
1,0
02
.1
+2
8.6
+3
1.7
+3
3.5
+3
8.0
+3
7.3
2015 (A) 2016 (E) 2017 (F) 2018 (F) 2019 (F) 2020 (F) 2021 (F) 2026 (F)
US$
Mn
Source: FMI, 2016 Source: FMI, 2016
©2015 Future Market Insights, All Rights Reserved106

China Functional Food Ingredients Market Analysis & Forecast By Ingredient TypeIn terms of value, vitamins segment is expected to remain dominant during the forecast period, attributed to various health benefits such as antioxidant properties associated with consumption of vitamin ingredients
Table 10: China Functional Food Ingredients Market Value (US$ Mn) and absolute $ opportunity (US$ Mn) by Ingredient Type, 2015–2026
Ingredient Type 2015 A 2016 E 2017 F 2018 F 2019 F 2020 F 2021 F 2026 FCAGR
(2016–2026)
VitaminsValue 79.1 82.8 86.9 92.9 99.3 105.9 112.8 160.5 6.8%
Opportunity 5.8 3.7 4.0 6.0 6.4 6.6 6.9 13.0
MineralsValue 108.3 115.2 121.9 129.5 137.8 146.2 155.6 218.0 6.6%
Opportunity 5.8 6.8 6.7 7.6 8.3 8.4 9.4 18.1
Prebiotics & Dietary Fibre
Value 51.4 53.7 56.4 58.9 62.2 65.6 68.9 90.2 5.3%
Opportunity 2.6 2.3 2.7 2.6 3.2 3.4 3.3 5.8
ProbioticsValue 144.8 152.4 161.5 170.3 181.4 191.0 202.4 280.4 6.3%
Opportunity 3.1 7.6 9.1 8.8 11.0 9.6 11.4 20.6
CarotenoidsValue 32.4 34.9 36.7 38.3 39.8 41.2 42.8 52.4 4.1%
Opportunity 3.1 2.6 1.8 1.6 1.5 1.4 1.6 2.7
ProteinValue 67.5 71.3 76.1 81.2 86.9 92.5 98.9 140.5 7.0%
Opportunity 4.0 3.8 4.8 5.1 5.7 5.6 6.4 10.8
Omega 3 Fatty Acids
Value 31.9 33.6 36.2 38.0 39.7 42.0 45.1 60.0 6.0%
Opportunity 2.6 1.7 2.6 1.8 1.8 2.3 3.1 3.5 Total 515.4 544.0 575.7 609.2 647.2 684.4 726.5 1,002.1 6.3%
Source: FMI, 2016
©2015 Future Market Insights, All Rights Reserved107

China Functional Food Ingredients Market Analysis & Forecast By Ingredient Type Vitamins segment is expected to exhibit significant growth in comparison to minerals segment during the forecast period
Figure 70: China Functional Food Ingredients Market Absolute $ Opportunity (US$ Mn), by Vitamins
Segment, 2016─2026Key Takeaways
Vitamins segment is estimated to be valued at US$ 82.8Mn by 2016 and is expected to reach US$ 160.5 Mn by2026 end, expanding at a CAGR of 6.8% over the forecastperiod
Vitamins segment is estimated to create absolute $opportunity of US$ 3.7 Mn in 2016 over 2015. Thissegment is expected to create incremental $ opportunityof US$ 77.7 Mn between 2016 and 2026.
Vitamins
Minerals
Figure 71: China Functional Food Ingredients Market Absolute $ Opportunity (US$ Mn ), by Minerals
Segment, 2016─2026Key Takeaways
Minerals segment is estimated to be valued at US$ 115.2Mn by 2016 and is expected to reach US$ 218.0 Mn by2026 end, expanding at a CAGR of 6.6% over the forecastperiod
This segment is estimated to create absolute $opportunity of US$ 6.8 Mn in 2016 over 2015 and isexpected to create incremental $ opportunity of US$102.9 Mn between 2016 and 2026
79
.1
11
2.8
16
0.5
+3
.7
+4
.0
+6
.0
+6
.4
+6
.6
2015(A)
2016(E)
2017(F)
2018(F)
2019(F)
2020(F)
2021(F)
2026(F)
US$
Mn
10
8.3
15
5.6
21
8.0
+6
.8
+6
.7
+7
.6
+8
.3
+8
.4
2015(A)
2016(E)
2017(F)
2018(F)
2019(F)
2020(F)
2021(F)
2026(F)
US$
Mn
Source: FMI, 2016
Source: FMI, 2016
©2015 Future Market Insights, All Rights Reserved108

China Functional Food Ingredients Market Analysis & Forecast By Ingredient Type Probiotics segment is expected to exhibit significant growth in comparison to prebiotics & dietary fibre segments over the forecast period
Figure 72: China Functional Food Ingredients Market Absolute $ Opportunity (US$ Mn), by Prebiotics &
Dietary Fibre Segment, 2016─2026Key Takeaways
Prebiotics & dietary fibre segment is estimated to bevalued at US$ 53.7 Mn by 2016 and is expected to reachUS$ 90.2 Mn by 2026 end, expanding at a CAGR of 5.3%over the forecast period
This segment is estimated to create absolute $opportunity of US$ 2.3 Mn in 2016 over 2015 and isexpected to create incremental $ opportunity of US$36.5 Mn between 2016 and 2026
Prebiotics & Dietary Fibre
Probiotics
Figure 73: China Functional Food Ingredients Market Absolute $ Opportunity (US$ Mn), by Probiotics
Segment, 2016─2026Key Takeaways
Probiotics segment is estimated to be valued at US$152.4 Mn by 2016 and is expected to reach US$ 280.4Mn by 2026 end, expanding at a CAGR of 6.3% over theforecast period
Probiotics segment is estimated to create absolute $opportunity of US$ 7.6 Mn in 2016 over 2015. Thissegment is expected to create incremental $ opportunityof US$ 127.9 Mn between 2016 and 2026.
51
.4
68
.9
90
.2
+2
.3
+2
.7
+2
.6
+3
.2
+3
.4
2015(A)
2016(E)
2017(F)
2018(F)
2019(F)
2020(F)
2021(F)
2026(F)
US$
Mn
14
4.8
20
2.4
28
0.4
+7
.6
+9
.1
+8
.8
+1
1.0
+9
.6
2015(A)
2016(E)
2017(F)
2018(F)
2019(F)
2020(F)
2021(F)
2026(F)
US$
Mn
Source: FMI, 2016
Source: FMI, 2016
©2015 Future Market Insights, All Rights Reserved109

China Functional Food Ingredients Market Analysis & Forecast By Ingredient Type Protein segment is expected to exhibit significant growth in comparison to carotenoids segment over the forecast period
Figure 74: China Functional Food Ingredients Market Absolute $ Opportunity (US$ Mn), by Carotenoids
Segment, 2016─2026Key Takeaways
Carotenoids segment is estimated to be valued at US$34.9 Mn by 2016 and is expected to reach US$ 52.4 Mnby 2026 end, expanding at a CAGR of 4.1% over theforecast period
This segment is estimated to create absolute $opportunity of US$ 2.6 Mn in 2016 over 2015 and isexpected to create incremental $ opportunity of US$17.5 Mn between 2016 and 2026
Carotenoids
Protein
Figure 75: China Functional Food Ingredients Market Absolute $ Opportunity (US$ Mn), by Protein Segment,
2016─2026Key Takeaways
Protein segment is estimated to be valued at US$ 71.3Mn by 2016 and is expected to reach US$ 140.5 Mn by2026 end, expanding at a CAGR of 7.0% over the forecastperiod
Protein segment is estimated to create absolute $opportunity of US$ 3.8 Mn in 2016 over 2015. Thissegment is expected to create incremental $ opportunityof US$ 69.2 Mn between 2016 and 2026.
32
.4
42
.8
52
.4
+2
.6
+1
.8
+1
.6
+1
.5
+1
.4
2015(A)
2016(E)
2017(F)
2018(F)
2019(F)
2020(F)
2021(F)
2026(F)
US$
Mn
67
.5
98
.9
14
0.5
+3
.8
+4
.8
+5
.1
+5
.7
+5
.6
2015(A)
2016(E)
2017(F)
2018(F)
2019(F)
2020(F)
2021(F)
2026(F)
US$
Mn
Source: FMI, 2016
Source: FMI, 2016
©2015 Future Market Insights, All Rights Reserved110

China Functional Food Ingredients Market Analysis & Forecast By Ingredient Type Omega 3 fatty acids segment is anticipated to exhibit above average growth over the forecast period
Figure 76: China Functional Food Ingredients Market Absolute $ Opportunity (US$ Mn), by Omega 3 Fatty
Acids Segment, 2016─2026
31
.9
45
.1
60
.0
+1
.7
+2
.6
+1
.8
+1
.8
+2
.3
2015(A)
2016(E)
2017(F)
2018(F)
2019(F)
2020(F)
2021(F)
2026(F)
US$
Mn
Key Takeaways
Omega 3 fatty acids segment is estimated to be valued atUS$ 33.6 Mn by 2016 and is expected to reach US$ 60.0Mn by 2026 end, expanding at a CAGR of 6.0% over theforecast period
This segment is estimated to create absolute $opportunity of US$ 1.7 Mn in 2016 over 2015 and isexpected to create incremental $ opportunity of US$26.4 Mn between 2016 and 2026
Omega 3 Fatty Acids
Source: FMI, 2016
©2015 Future Market Insights, All Rights Reserved111
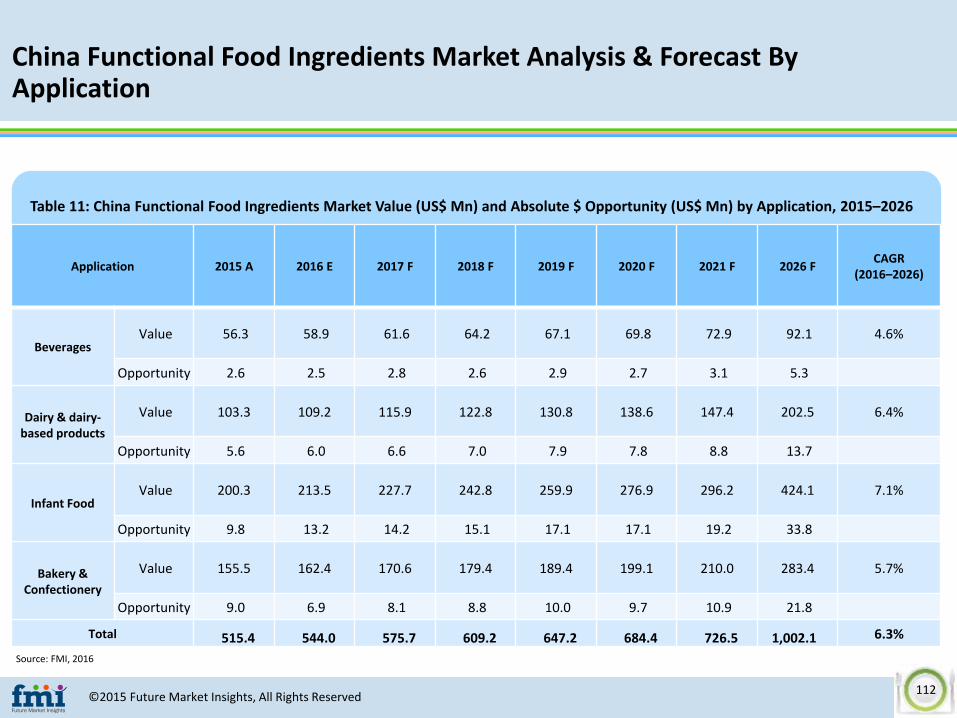
China Functional Food Ingredients Market Analysis & Forecast By Application
Table 11: China Functional Food Ingredients Market Value (US$ Mn) and Absolute $ Opportunity (US$ Mn) by Application, 2015–2026
Application 2015 A 2016 E 2017 F 2018 F 2019 F 2020 F 2021 F 2026 FCAGR
(2016–2026)
BeveragesValue 56.3 58.9 61.6 64.2 67.1 69.8 72.9 92.1 4.6%
Opportunity 2.6 2.5 2.8 2.6 2.9 2.7 3.1 5.3
Dairy & dairy-based products
Value 103.3 109.2 115.9 122.8 130.8 138.6 147.4 202.5 6.4%
Opportunity 5.6 6.0 6.6 7.0 7.9 7.8 8.8 13.7
Infant FoodValue 200.3 213.5 227.7 242.8 259.9 276.9 296.2 424.1 7.1%
Opportunity 9.8 13.2 14.2 15.1 17.1 17.1 19.2 33.8
Bakery & Confectionery
Value 155.5 162.4 170.6 179.4 189.4 199.1 210.0 283.4 5.7%
Opportunity 9.0 6.9 8.1 8.8 10.0 9.7 10.9 21.8
Total 515.4 544.0 575.7 609.2 647.2 684.4 726.5 1,002.1 6.3%
Source: FMI, 2016
©2015 Future Market Insights, All Rights Reserved112

China Functional Food Ingredients Market Analysis & Forecast By Application Dairy & dairy-based products segment is expected to exhibit significant growth in comparison to beverages segment over the forecast period
Figure 77: China Functional Food Ingredients Market Absolute $ Opportunity (US$ Mn), by Beverages
Segment, 2016─2026Key Takeaways
Beverages segment is estimated to be valued at US$ 58.9Mn by 2016 and is expected to reach US$ 92.1 Mn by2026 end, expanding at a CAGR of 4.6% over the forecastperiod
Beverages segment is estimated to create absolute $opportunity of US$ 2.5 Mn in 2016 over 2015. Thissegment is expected to create incremental $ opportunityof US$ 33.2 Mn between 2016 and 2026.
Beverages
Dairy & dairy-based products
Figure 78: China Functional Food Ingredients Market Absolute $ Opportunity (US$ Mn ), by Dairy & dairy-
based products Segment, 2016─2026Key Takeaways
Dairy & dairy-based products segment is estimated to bevalued at US$ 109.2 Mn by 2016 and is expected to reachUS$ 202.5 Mn by 2026 end, expanding at a CAGR of 6.4%over the forecast period
This segment is estimated to create absolute $opportunity of US$ 6.0 Mn in 2016 over 2015 and isexpected to create incremental $ opportunity of US$93.3 Mn between 2016 and 2026
56
.3
72
.9
92
.1
+2
.5
+2
.8
+2
.6
+2
.9
+2
.7
2015(A)
2016(E)
2017(F)
2018(F)
2019(F)
2020(F)
2021(F)
2026(F)
US$
Mn
10
3.3
14
7.4
20
2.5
+6
.0
+6
.6
+7
.0
+7
.9
+7
.8
2015(A)
2016(E)
2017(F)
2018(F)
2019(F)
2020(F)
2021(F)
2026(F)
US$
Mn
Source: FMI, 2016
Source: FMI, 2016
©2015 Future Market Insights, All Rights Reserved113

China Functional Food Ingredients Market Analysis & Forecast By Application Infant food segment is expected to exhibit significant growth in comparison to bakery & confectionery segment over the forecast period
Figure 79: China Functional Food Ingredients Market Absolute $ Opportunity (US$ Mn), by Infant Food
Segment, 2016─2026Key Takeaways
Infant food segment is estimated to be valued at US$213.5 Mn by 2016 and is expected to reach US$ 424.1Mn by 2026 end, expanding at a CAGR of 7.1% over theforecast period
Infant food segment is estimated to create absolute $opportunity of US$ 13.2 Mn in 2016 over 2015. Thissegment is expected to create incremental $ opportunityof US$ 210.6 Mn between 2016 and 2026.
Infant Food
Bakery & Confectionery
Figure 80: China Functional Food Ingredients Market Absolute $ Opportunity (US$ Mn ), by Bakery &
Confectionery Segment, 2016─2026Key Takeaways
Bakery & confectionery segment is estimated to bevalued at US$ 162.4 Mn by 2016 and is expected to reachUS$ 283.4 Mn by 2026 end, expanding at a CAGR of 5.7%over the forecast period
This segment is estimated to create absolute $opportunity of US$ 6.9 Mn in 2016 over 2015 and isexpected to create incremental $ opportunity of US$121.0 Mn between 2016 and 2026
20
0.3
29
6.2
42
4.1
+1
3.2
+1
4.2
+1
5.1
+1
7.1
+1
7.1
2015(A)
2016(E)
2017(F)
2018(F)
2019(F)
2020(F)
2021(F)
2026(F)
US$
Mn
15
5.5
21
0.0
28
3.4
+6
.9
+8
.1
+8
.8
+1
0.0
+9
.7
2015(A)
2016(E)
2017(F)
2018(F)
2019(F)
2020(F)
2021(F)
2026(F)
US$
Mn
Source: FMI, 2016
Source: FMI, 2016
©2015 Future Market Insights, All Rights Reserved114

China Functional Food Ingredients Market Attractiveness Analysis By Application & Ingredient Type
Figure 81: China Functional Food Ingredients Market Attractiveness Analysis By Ingredients Type, 2016–2026
Figure 82: China Functional Food Ingredients Market Attractiveness Analysis By Application, 2016–2026
Vitamins
Minerals
Prebiotics & Dietary Fibre
Probiotics
Carotenoids
Protein
Omega 3 Fatty Acids
Low Medium High
Low
Med
ium
Hig
h
Gro
wth
In
de
x (2
01
6–2
02
6)
Total Index(Absolute Index + CAGR Index)
Bubble Size represents market
size for 2026 (F)
Beverages
Dairy & Dairy Based Products
Infant Food
Bakery & Confectioner
y
(0.10)
0.10
0.30
0.50
0.70
0.90
1.10
1.30
1.50
0.00 0.50 1.00 1.50 2.00 2.50 3.00 3.50 4.00
Low Medium High
Low
Med
ium
Hig
h
Gro
wth
Ind
ex
(20
16–2
026)
Total Index(Absolute Index + CAGR Index)
Bubble Size represents market
size for 2026 (F)
Source: FMI, 2016 Source: FMI, 2016
©2015 Future Market Insights, All Rights Reserved115

China Functional Food Ingredients Market Trends
China
Consumption of food products that contain bacteria such as probiotics is relatively high in China. Various functional ingredients are trending infood products, which include carotenoids, fatty acids, probiotics, prebiotics, plant sterols and soy proteins.
In 2012, the most popular functional food ingredients used by various functional food manufacturers included food acids, calcium and vitamin Ein milk formulas, probiotics in flavoured milk drinks and yogurt
Various companies operating in China are introducing new products such as functional food ingredients in order to enhance health benefits offood products
The Menhniu Dairy Industry introduced product called Yiyoute, which contains GOS (galactooligosaccharide), minerals, vitamins and wheyprotein powder, which enable building immunity and increasing calcium intake. In 2011, this product won the Innovation Award at the 2 SIALChina food show.
In addition, various events are organised in China in order to enable showcasing of various ingredients such as health ingredients,nutraceuticals and functional food
©2015 Future Market Insights, All Rights Reserved116

Thailand Functional Food Ingredients Market Analysis
Section 12
©2015 Future Market Insights, All Rights Reserved117

Thailand Functional Food Ingredients MarketIncreasing consumer preferences for food products with various health benefits is expected to fuel growth of the functional food ingredients market in Thailand
Figure 83: Thailand Functional Food Ingredients Market Value (US$ Mn), 2015–2026
Figure 84: Thailand Functional Food Ingredients Market Absolute $ Opportunity (US$ Mn), 2016–2026
Key Takeaways
The functional food ingredients market in Thailand is estimated to be valued at US$ 137.6 Mn by 2016 and is expected to reach US$208.3 Mn by 2026 end, expanding at a CAGR of 4.2% over the forecast period
The functional food ingredients market in the country is estimated to represent absolute $ opportunity of US$ 5.5 Mn in 2016 over 2015and is expected to represent incremental $ opportunity of US$ 70.7 Mn between 2016 and 2026
13
2.1
13
7.6
14
2.1
14
8.4
15
6.2
16
4.4
17
1.8
20
8.3
0
50
100
150
200
250
2015 (A) 2016 (E) 2017 (F) 2018 (F) 2019 (F) 2020 (F) 2021 (F) 2026 (F)
Val
ue
(U
S$ M
n)
Value
13
2.1
17
1.8
20
8.3
+5
.5
+4
.6
+6
.3
+7
.7
+8
.2
2015 (A) 2016 (E) 2017 (F) 2018 (F) 2019 (F) 2020 (F) 2021 (F) 2026 (F)
US$
Mn
Source: FMI, 2016 Source: FMI, 2016
©2015 Future Market Insights, All Rights Reserved118

Thailand Functional Food Ingredients Market Analysis & Forecast By Ingredient TypeIn terms of value, vitamins segment is expected to remain dominant during the forecast period
Table 12: Thailand Functional Food Ingredients Market Value (US$ Mn) and absolute $ opportunity (US$ Mn) by Ingredient Type,2015–2026
Ingredient Type 2015 A 2016 E 2017 F 2018 F 2019 F 2020 F 2021 F 2026 FCAGR
(2016–2026)
VitaminsValue 37.0 38.6 40.4 42.4 44.5 47.0 49.7 64.2 5.2%
Opportunity 1.3 1.6 1.7 2.0 2.2 2.5 2.6 2.6
MineralsValue 31.7 33.1 34.3 36.0 38.1 40.3 42.1 51.2 4.4%
Opportunity 1.0 1.5 1.2 1.7 2.1 2.2 1.9 1.3
Prebiotics & Dietary Fibre
Value 10.4 10.7 10.8 11.0 11.4 11.8 12.1 13.4 2.3%
Opportunity 0.2 0.3 0.1 0.3 0.4 0.4 0.2 0.1
ProbioticsValue 21.5 22.6 23.1 24.2 25.6 27.1 28.4 34.0 4.1%
Opportunity 1.1 1.1 0.4 1.1 1.4 1.5 1.3 0.4
CarotenoidsValue 3.9 4.1 4.1 4.2 4.3 4.4 4.4 4.9 1.8%
Opportunity 0.1 0.1 0.0 0.1 0.1 0.1 0.0 0.1
ProteinValue 19.7 20.6 21.2 22.0 23.0 24.1 25.0 28.8 3.4%
Opportunity 0.6 0.9 0.6 0.8 1.0 1.1 0.9 0.2
Omega 3 Fatty Acids
Value 7.8 7.8 8.3 8.6 9.1 9.6 10.1 11.8 4.2%
Opportunity 0.2 (0.0) 0.4 0.4 0.5 0.5 0.4 0.2 Total 132.1 137.6 142.1 148.4 156.2 164.4 171.8 208.3 4.2%
Source: FMI, 2016
©2015 Future Market Insights, All Rights Reserved119

Thailand Functional Food Ingredients Market Analysis & Forecast By Ingredient TypeVitamins segment is expected to exhibit significant growth in comparison to minerals segment over the forecast period
Figure 85: Thailand Functional Food IngredientsMarket Absolute $ Opportunity (US$ Mn), by Vitamins
Segment, 2016─2026Key Takeaways
Vitamins segment is estimated to be valued at US$ 38.6Mn by 2016 and is expected to reach US$ 64.2 Mn by2026 end, expanding at a CAGR of 5.2% over the forecastperiod
This segment is estimated to create absolute $opportunity of US$ 1.6 Mn in 2016 over 2015 and isexpected to create incremental $ opportunity of US$25.5 Mn between 2016 and 2026
Vitamins
Minerals
Figure 86: Thailand Functional Food Ingredients Market Absolute $ Opportunity (US$ Mn ), by Minerals
Segment, 2016─2026Key Takeaways
Minerals segment is estimated to be valued at US$ 33.1Mn by 2016 and is expected to reach US$ 51.2 Mn by2026 end, expanding at a CAGR of 4.4% over the forecastperiod
Minerals segment is estimated to create absolute $opportunity of US$ 1.5 Mn in 2016 over 2015. Thissegment is expected to create incremental $ opportunityof US$ 18.1 Mn between 2016 and 2026.
37
.0
49
.7
64
.2
+1
.6
+1
.7
+2
.0
+2
.2
+2
.5
2015(A)
2016(E)
2017(F)
2018(F)
2019(F)
2020(F)
2021(F)
2026(F)
US$
Mn
31
.7
42
.1
51
.2
+1
.5
+1
.2
+1
.7
+2
.1
+2
.2
2015(A)
2016(E)
2017(F)
2018(F)
2019(F)
2020(F)
2021(F)
2026(F)
US$
Mn
Source: FMI, 2016
Source: FMI, 2016
©2015 Future Market Insights, All Rights Reserved120

Thailand Functional Food Ingredients Market Analysis & Forecast By Ingredient Type Probiotics segment is expected to exhibit significant growth in comparison to prebiotics & dietary fibre over the forecast period
Figure 87: Thailand Functional Food IngredientsMarket Absolute $ Opportunity (US$ Mn), by Prebiotics
& Dietary Fibre Segment, 2016─2026Key Takeaways
Prebiotics & dietary fibre segment is estimated to bevalued at US$ 10.7 Mn by 2016 and is expected to reachUS$ 13.4 Mn by 2026 end, expanding at a CAGR of 2.3%over the forecast period
This segment is estimated to create absolute $opportunity of US$ 0.3 Mn in 2016 over 2015 and isexpected to create incremental $ opportunity of US$ 2.8Mn between 2016 and 2026
Prebiotics & Dietary Fibre
Probiotics
Figure 88: Thailand Functional Food Ingredients Market Absolute $ Opportunity (US$ Mn), by Probiotics
Segment, 2016─2026Key Takeaways
Probiotics segment is estimated to be valued at US$ 22.6Mn by 2016 and is expected to reach US$ 34.0 Mn by2026 end, expanding at a CAGR of 4.1% over the forecastperiod
Probiotics segment is estimated to create absolute $opportunity of US$ 1.1 Mn in 2016 over 2015. Thissegment is expected to create incremental $ opportunityof US$ 11.3 Mn between 2016 and 2026.
10
.4
12
.1
13
.4
+0
.3
+0
.1
+0
.3
+0
.4
+0
.4
2015(A)
2016(E)
2017(F)
2018(F)
2019(F)
2020(F)
2021(F)
2026(F)
US$
Mn
21
.5
28
.4
34
.0
+1
.1
+0
.4
+1
.1
+1
.4
+1
.5
2015(A)
2016(E)
2017(F)
2018(F)
2019(F)
2020(F)
2021(F)
2026(F)
US$
Mn
Source: FMI, 2016
Source: FMI, 2016
©2015 Future Market Insights, All Rights Reserved121

Thailand Functional Food Ingredients Market Analysis & Forecast By Ingredient TypeProtein segment is expected to exhibit significant growth in comparison to carotenoids segment over the forecast period
Figure 89: Thailand Functional Food IngredientsMarket Absolute $ Opportunity (US$ Mn), by
Carotenoids Segment, 2016─2026Key Takeaways
Carotenoids segment is estimated to be valued at US$4.1 Mn by 2016 and expected to reach US$ 4.9 Mn by2026 end, expanding at a CAGR of 1.8% over the forecastperiod
This segment is estimated to create absolute $opportunity of US$ 0.1 Mn in 2016 over 2015 and isexpected to create incremental $ opportunity of US$ 0.8Mn between 2016 and 2026
Carotenoids
Protein
Figure 90: Thailand Functional Food Ingredients Market Absolute $ Opportunity (US$ Mn), by Protein Segment,
2016─2026Key Takeaways
Protein segment is estimated to be valued at US$ 20.6Mn by 2016 and is expected to reach US$ 28.8 Mn by2026 end, expanding at a CAGR of 3.4% over the forecastperiod
Protein segment is estimated to create absolute $opportunity of US$ 0.9 Mn in 2016 over 2015. Thissegment is expected to create incremental $ opportunityof US$ 8.2 Mn between 2016 and 2026.
3.9
4.4
4.9
+0
.1
+0
.0
+0
.1
+0
.1
+0
.1
2015(A)
2016(E)
2017(F)
2018(F)
2019(F)
2020(F)
2021(F)
2026(F)
US$
Mn
19
.7
25
.0
28
.8
+0
.9
+0
.6
+0
.8
+1
.0
+1
.1
2015(A)
2016(E)
2017(F)
2018(F)
2019(F)
2020(F)
2021(F)
2026(F)
US$
Mn
Source: FMI, 2016
Source: FMI, 2016
©2015 Future Market Insights, All Rights Reserved122

Thailand Functional Food Ingredients Market Analysis & Forecast By Ingredient Type Omega 3 fatty acids segment is anticipated to exhibit above average growth over the forecast period
Figure 91: Thailand Functional Food Ingredients Market Absolute $ Opportunity (US$ Mn), by Omega 3 Fatty
Acids Segment, 2016─2026
7.8
10
.1
11
.8
+(0
.0)
+0
.4
+0
.4
+0
.5
+0
.5
2015(A)
2016(E)
2017(F)
2018(F)
2019(F)
2020(F)
2021(F)
2026(F)
US$
Mn
Key Takeaways
Omega 3 fatty acids segment is estimated to be valued atUS$ 7.8 Mn by 2016 and is expected to reach US$ 11.8Mn by 2026 end, expanding at a CAGR of 4.2% over theforecast period
This segment is expected to create incremental $opportunity of US$ 4.0 Mn between 2016 and 2026
Omega 3 Fatty Acids
Source: FMI, 2016
©2015 Future Market Insights, All Rights Reserved123

Thailand Functional Food Ingredients Market Analysis & Forecast By Application
Table 13: Thailand Functional Food Ingredients Market Value (US$ Mn) and Absolute $ Opportunity (US$ Mn) by Application, 2015–2026
Application 2015 A 2016 E 2017 F 2018 F 2019 F 2020 F 2021 F 2026 FCAGR
(2016–2026)
BeveragesValue 42.4 44.1 45.7 47.8 50.1 52.5 55.0 66.9 4.3%
Opportunity 1.6 1.7 1.6 2.0 2.3 2.5 2.5 1.9
Dairy & dairy-based products
Value 22.4 23.4 24.0 25.0 26.0 27.1 27.8 32.8 3.4%
Opportunity 0.7 1.0 0.6 0.9 1.1 1.1 0.6 1.1
Infant FoodValue 11.8 12.2 12.5 12.8 13.3 13.8 14.2 16.4 3.0%
Opportunity 0.3 0.4 0.3 0.3 0.4 0.5 0.4 0.4
Bakery & Confectionery
Value 55.5 57.9 59.9 62.9 66.8 70.9 74.8 92.2 4.8%
Opportunity 2.0 2.4 2.0 3.0 3.9 4.1 3.9 1.4
Total 132.1 137.6 142.1 148.4 156.2 164.4 171.8 208.3 4.2%
Source: FMI, 2016
©2015 Future Market Insights, All Rights Reserved124

Thailand Functional Food Ingredients Market Analysis & Forecast By Application Beverages segment is expected to exhibit significant growth in comparison to dairy & dairy products segment over the forecast period
Figure 92: Thailand Functional Food IngredientsMarket Absolute $ Opportunity (US$ Mn), by
Beverages Segment, 2016─2026Key Takeaways
Beverages segment is estimated to be valued at US$ 44.1Mn by 2016 and is expected to reach US$ 66.9 Mn by2026 end, expanding at a CAGR of 4.3% over the forecastperiod
This segment is estimated to create absolute $opportunity of US$ 1.7 Mn in 2016 over 2015 and isexpected to create incremental $ opportunity of US$22.8 Mn between 2016 and 2026
Beverages
Dairy & dairy-based products
Figure 93: Thailand Functional Food Ingredients Market Absolute $ Opportunity (US$ Mn ), by Dairy & dairy-
based products Segment, 2016─2026Key Takeaways
Dairy & dairy-based products segment is estimated to bevalued at US$ 23.4 Mn by 2016 and is expected to reachUS$ 32.8 Mn by 2026 end, expanding at a CAGR of 3.4%over the forecast period
This segment is estimated to create absolute $opportunity of US$ 1.0 Mn in 2016 over 2015 and isexpected to create incremental $ opportunity of US$ 9.4Mn between 2016 and 2026
42
.4
55
.0
66
.9
+1
.7
+1
.6
+2
.0
+2
.3
+2
.5
2015(A)
2016(E)
2017(F)
2018(F)
2019(F)
2020(F)
2021(F)
2026(F)
US$
Mn
22
.4
27
.8
32
.8
+1
.0
+0
.6
+0
.9
+1
.1
+1
.1
2015(A)
2016(E)
2017(F)
2018(F)
2019(F)
2020(F)
2021(F)
2026(F)
US$
Mn
Source: FMI, 2016
Source: FMI, 2016
©2015 Future Market Insights, All Rights Reserved125

Thailand Functional Food Ingredients Market Analysis & Forecast By Application Bakery & confectionery segment is expected to exhibit significant market growth in comparison to infant food segment over the forecast period
Figure 94: Thailand Functional Food IngredientsMarket Absolute $ Opportunity (US$ Mn), by InfantFood Segment, 2016─2026Key Takeaways
Infant food segment is estimated to be valued at US$12.2 Mn by 2016 and is expected to reach US$ 16.4 Mnby 2026 end, expanding at a CAGR of 3.0% over theforecast period
This segment is estimated to create absolute $opportunity of US$ 0.4 Mn in 2016 over 2015 and isexpected to create incremental $ opportunity of US$ 4.2Mn between 2016 and 2026
Infant Food
Bakery & Confectionery
Figure 95: Thailand Functional Food Ingredients Market Absolute $ Opportunity (US$ Mn ), by Bakery &
Confectionery Segment, 2016─2026Key Takeaways
Bakery & confectionery segment is estimated to bevalued at US$ 57.9 Mn by 2016 and is expected to reachUS$ 92.2 Mn by 2026 end, expanding at a CAGR of 4.8%over the forecast period
Bakery & confectionery segment is estimated to createabsolute $ opportunity of US$ 2.4 Mn in 2016 over 2015.This segment is expected to create incremental $opportunity of US$ 34.3 Mn between 2016 and 2026.
11
.8
14
.2
16
.4
+0
.4
+0
.3
+0
.3
+0
.4
+0
.5
2015(A)
2016(E)
2017(F)
2018(F)
2019(F)
2020(F)
2021(F)
2026(F)
US$
Mn
55
.5
74
.8
92
.2
+2
.4
+2
.0
+3
.0
+3
.9
+4
.1
2015(A)
2016(E)
2017(F)
2018(F)
2019(F)
2020(F)
2021(F)
2026(F)
US$
Mn
Source: FMI, 2016
Source: FMI, 2016
©2015 Future Market Insights, All Rights Reserved126

Thailand Functional Food Ingredients Market Trends
Thailand
Demand for convenience and fast food, snack foods and dairy products is significantly high due to rising trend towards convenienceamong consumers, who prefer to prepare food easily, coupled with rapidly changing lifestyle. Thai consumers prefer food productsthat offer multi-features and benefits such as added nutrients and intense flavours, which in turn is driving increasing intake offunctional food ingredients through various food products.
Demand in Thailand for food products with functional ingredients such as those fortified with fiber, calcium, vitamins, iron and foodproducts with natural ingredients
Increasing application of new types of functional ingredients in various dietary supplements in Thailand that offer various healthbenefits
©2015 Future Market Insights, All Rights Reserved127

Thailand Functional Food Ingredients Market Attractiveness Analysis By Application & Ingredient Type
Figure 96: Thailand Functional Food Ingredients Market Attractiveness Analysis By Ingredients Type, 2016–2026
Figure 97: Thailand Functional Food Ingredients Market Attractiveness Analysis By Application, 2016–2026
Vitamins
Minerals
Prebiotics & Dietary Fibre
Probiotics
Carotenoids
Protein
Omega 3 Fatty Acids
Low Medium High
Low
Med
ium
Hig
h
Gro
wth
Ind
ex
(20
16–
2026
)
Total Index(Absolute Index + CAGR Index)
Bubble Size represents market
size for 2026 (F)
Beverages
Dairy & Dairy Based Products
Infant Food
Bakery & Confectionery
Low Medium High
Low
Med
ium
Hig
h
Gro
wth
Ind
ex
(20
16–
2026
)
Total Index(Absolute Index + CAGR Index)
Bubble Size represents market
size for 2026 (F)
Source: FMI, 2016 Source: FMI, 2016
©2015 Future Market Insights, All Rights Reserved128
Malaysia Functional Food Ingredients Market Analysis
Section 13
©2015 Future Market Insights, All Rights Reserved129

Malaysia Functional Food Ingredients MarketVarious initiatives taken by the government such as health campaigns and welfare program are expected to drive demand for functional food ingredients in Malaysia
Figure 98: Malaysia Functional Food Ingredients Market Value (US$ Mn), 2015–2026
Figure 99: Malaysia Functional Food Ingredients Market Absolute $ Opportunity (US$ Mn), 2016–2026
Key Takeaways
The functional food ingredients market in Malaysia is estimated to be valued at US$ 337.9 Mn by 2016 and is expected to reach US$538.6 Mn by 2026 end, expanding at a CAGR of 4.8% over the forecast period
The functional food ingredients market in the country is estimated to represent absolute $ opportunity of US$ 14.4 Mn in 2016 over2015 and is expected to represent incremental $ opportunity of US$ 200.7 Mn between 2016 and 2026
32
3.5
33
7.9
35
3.2
36
9.3
38
7.9
40
6.2
42
6.3
53
8.6
0
100
200
300
400
500
600
2015 (A)2016 (E) 2017 (F) 2018 (F) 2019 (F) 2020 (F) 2021 (F) 2026 (F)
Val
ue
(U
S$ M
n)
Value
32
3.5
42
6.3
53
8.6
+1
4.4
+1
5.3
+1
6.1
+1
8.6
+1
8.3
2015 (A) 2016 (E) 2017 (F) 2018 (F) 2019 (F) 2020 (F) 2021 (F) 2026 (F)
US$
Mn
Source: FMI, 2016 Source: FMI, 2016
©2015 Future Market Insights, All Rights Reserved130

Malaysia Functional Food Ingredients Market Analysis & Forecast By Ingredient TypeProbiotics segment is expected to remain dominant in terms of value over the forecast period
Table 14: Malaysia Functional Food Ingredients Market Value (US$ Mn) and absolute $ opportunity (US$ Mn) by Ingredient Type,2015–2026
Ingredient Type 2015 A 2016 E 2017 F 2018 F 2019 F 2020 F 2021 F 2026 FCAGR
(2016–2026)
VitaminsValue 38.5 40.4 42.2 44.0 46.1 48.2 50.4 63.3 4.6%
Opportunity 1.5 1.9 1.7 1.8 2.1 2.1 2.3 2.3
MineralsValue 25.9 26.9 27.8 28.7 29.8 30.8 31.9 37.9 3.5%
Opportunity 1.2 1.1 0.9 0.9 1.1 1.0 1.1 1.0
Prebiotics & Dietary Fibre
Value 23.0 23.9 24.6 25.1 25.8 26.6 27.4 31.8 2.9%
Opportunity 1.4 1.0 0.6 0.5 0.7 0.8 0.9 0.6
ProbioticsValue 48.7 50.9 53.3 55.8 58.6 61.4 64.5 82.2 4.9%
Opportunity 2.4 2.3 2.3 2.5 2.9 2.8 3.1 3.2
CarotenoidsValue 35.5 36.7 37.6 38.5 39.6 40.6 41.7 46.9 2.5%
Opportunity 1.6 1.1 0.9 0.9 1.1 1.0 1.1 0.5
ProteinValue 57.5 60.0 62.9 65.7 68.7 71.6 74.7 92.6 4.4%
Opportunity 2.0 2.5 2.9 2.8 3.0 2.9 3.2 3.2
Omega 3 Fatty Acids
Value 94.5 99.0 105.0 111.6 119.4 127.1 135.6 183.9 6.4%
Opportunity 5.0 4.6 5.9 6.6 7.8 7.7 8.5 7.5 Total 323.5 337.9 353.2 369.3 387.9 406.2 426.3 538.6 4.8%
Source: FMI, 2016
©2015 Future Market Insights, All Rights Reserved131

Malaysia Functional Food Ingredients Market Analysis & Forecast By Ingredient Type Vitamins segment is expected to exhibit significant market growth in comparison to minerals segment over the forecast period
Figure 100: Malaysia Functional Food IngredientsMarket Absolute $ Opportunity (US$ Mn), by Vitamins
Segment, 2016─2026Key Takeaways
Vitamins segment is estimated to be valued at US$ 40.4Mn by 2016 and is expected to reach US$ 63.3 Mn by2026 end, expanding at CAGR of 4.6% over the forecastperiod
This segment is estimated to create absolute $opportunity of US$ 1.9 Mn in 2016 over 2015 and isexpected to create incremental $ opportunity of US$22.9 Mn between 2016 and 2026
Vitamins
Minerals
Figure 101: Malaysia Functional Food IngredientsMarket Absolute $ Opportunity (US$ Mn ), by Minerals
Segment, 2016─2026Key Takeaways
Minerals segment is estimated to be valued at US$ 26.9Mn by 2016 and is expected to reach US$ 37.9 Mn by2026 end, expanding at a CAGR of 3.5% over the forecastperiod
Minerals segment is estimated to create absolute $opportunity of US$ 1.1 Mn in 2016 over 2015. Thissegment is expected to create incremental $ opportunityof US$ 10.9 Mn between 2016 and 2026.
38
.5
50
.4
63
.3
+1
.9
+1
.7
+1
.8
+2
.1
+2
.1
2015(A)
2016(E)
2017(F)
2018(F)
2019(F)
2020(F)
2021(F)
2026(F)
US$
Mn
25
.9
31
.9
37
.9
+1
.1
+0
.9
+0
.9
+1
.1
+1
.0
2015(A)
2016(E)
2017(F)
2018(F)
2019(F)
2020(F)
2021(F)
2026(F)
US$
Mn
Source: FMI, 2016
Source: FMI, 2016
©2015 Future Market Insights, All Rights Reserved132

Malaysia Functional Food Ingredients Market Analysis & Forecast By Ingredient TypeProbiotics segment is expected to exhibit significant market growth in comparison to prebiotics & dietary fibre segment during the forecast period
Figure 102: Malaysia Functional Food IngredientsMarket Absolute $ Opportunity (US$ Mn), by Prebiotics
& Dietary Fibre Segment, 2016─2026Key Takeaways
Prebiotics & dietary fibre segment is estimated to bevalued at US$ 23.9 Mn by 2016 and is expected to reachUS$ 31.8 Mn by 2026 end, expanding at a CAGR of 2.9%over the forecast period
This segment is estimated to create absolute $opportunity of US$ 1.0 Mn in 2016 over 2015 and isexpected to create incremental $ opportunity of US$ 7.9Mn between 2016 and 2026
Prebiotics & Dietary Fibre
Probiotics
Figure 103: Malaysia Functional Food IngredientsMarket Absolute $ Opportunity (US$ Mn), by Probiotics
Segment, 2016─2026Key Takeaways
Probiotics segment is estimated to be valued at US$ 50.9Mn by 2016 and is expected to reach US$ 82.2 Mn by2026 end, expanding at a CAGR 4.9% over the forecastperiod
Probiotics segment is estimated to create absolute $opportunity of US$ 2.3 Mn in 2016 over 2015. Thissegment is expected to create incremental $ opportunityof US$ 31.3 Mn between 2016 and 2026.
23
.0
27
.4
31
.8
+1
.0
+0
.6
+0
.5
+0
.7
+0
.8
2015(A)
2016(E)
2017(F)
2018(F)
2019(F)
2020(F)
2021(F)
2026(F)
US$
Mn
48
.7
64
.5
82
.2
+2
.3
+2
.3
+2
.5
+2
.9
+2
.8
2015(A)
2016(E)
2017(F)
2018(F)
2019(F)
2020(F)
2021(F)
2026(F)
US$
Mn
Source: FMI, 2016
Source: FMI, 2016
©2015 Future Market Insights, All Rights Reserved133

Malaysia Functional Food Ingredients Market Analysis & Forecast By Ingredient Type Protein segment is expected to exhibit significant market growth in comparison to carotenoids segment during the forecast period
Figure 104: Malaysia Functional Food IngredientsMarket Absolute $ Opportunity (US$ Mn), by
Carotenoids Segment, 2016─2026Key Takeaways
Carotenoids segment is estimated to be valued at US$36.7 Mn by 2016 and is expected to reach US$ 46.9 Mnby 2026 end, expanding at a CAGR of 2.5% over theforecast period
This segment is estimated to create absolute $opportunity of US$ 1.1 Mn in 2016 over 2015 and isexpected to create incremental $ opportunity of US$10.2 Mn between 2016 and 2026
Carotenoids
Protein
Figure 105: Malaysia Functional Food IngredientsMarket Absolute $ Opportunity (US$ Mn), by Protein
Segment, 2016─2026Key Takeaways
Protein segment is estimated to be valued at US$ 60.0Mn by 2016 and is expected to reach US$ 92.6 Mn by2026 end, expanding at a CAGR of 4.4% over the forecastperiod
Protein segment is estimated to create absolute $opportunity of US$ 2.5 Mn in 2016 over 2015. Thissegment is expected to create incremental $ opportunityof US$ 32.6 Mn between 2016 and 2026
35
.5
41
.7
46
.9
+1
.1
+0
.9
+0
.9
+1
.1
+1
.0
2015(A)
2016(E)
2017(F)
2018(F)
2019(F)
2020(F)
2021(F)
2026(F)
US$
Mn
57
.5
74
.7
92
.6
+2
.5
+2
.9
+2
.8
+3
.0
+2
.9
2015(A)
2016(E)
2017(F)
2018(F)
2019(F)
2020(F)
2021(F)
2026(F)
US$
Mn
Source: FMI, 2016
Source: FMI, 2016
©2015 Future Market Insights, All Rights Reserved134

Malaysia Functional Food Ingredients Market Analysis & Forecast By Ingredient TypeOmega 3 fatty acids segment is anticipated to exhibit above average growth over the forecast period
Figure 106: Malaysia Functional Food IngredientsMarket Absolute $ Opportunity (US$ Mn), by Omega 3
Fatty Acids Segment, 2016─2026
94
.5
13
5.6
18
3.9
+4
.6
+5
.9
+6
.6
+7
.8
+7
.7
2015(A)
2016(E)
2017(F)
2018(F)
2019(F)
2020(F)
2021(F)
2026(F)
US$
Mn
Key Takeaways
Omega 3 fatty acids segment is estimated to be valued atUS$ 99.0 Mn by 2016 and is expected to reach US$ 183.9Mn by 2026 end, expanding at a CAGR of 6.4% over theforecast period
Omega 3 fatty acids segment is estimated to createabsolute $ opportunity of US$ 4.6 Mn in 2016 over 2015.This segment is expected to create incremental $opportunity of US$ 84.8 Mn between 2016 and 2026.
Omega 3 Fatty Acids
Source: FMI, 2016
©2015 Future Market Insights, All Rights Reserved135

Malaysia Functional Food Ingredients Market Analysis & Forecast By Application
Table 15: Malaysia Functional Food Ingredients Market Value (US$ Mn) and Absolute $ Opportunity (US$ Mn) by Application, 2015–2026
Application 2015 A 2016 E 2017 F 2018 F 2019 F 2020 F 2021 F 2026 FCAGR
(2016–2026)
BeveragesValue 123.2 129.0 135.4 143.2 151.9 160.5 169.1 221.3 5.5%
Opportunity 5.9 5.8 6.5 7.7 8.8 8.6 8.6 8.6
Dairy & dairy-based products
Value 64.4 67.0 69.6 72.7 76.0 79.3 82.8 102.1 4.3%
Opportunity 2.7 2.7 2.5 3.1 3.3 3.3 3.5 3.1
Infant FoodValue 45.2 47.2 48.7 50.6 52.6 54.0 55.5 65.4 3.3%
Opportunity 2.0 2.0 1.6 1.9 2.0 1.4 1.5 1.4
Bakery & Confectionery
Value 90.8 94.8 99.5 102.9 107.4 112.4 118.8 149.7 4.7%
Opportunity 4.4 4.0 4.7 3.4 4.5 5.0 6.4 5.2
Total 323.5 337.9 353.2 369.3 387.9 406.2 426.3 538.6 4.8%
Source: FMI, 2016
©2015 Future Market Insights, All Rights Reserved136

Malaysia Functional Food Ingredients Market Analysis & Forecast By Application Beverages segment is expected to exhibit significant market growth in comparison to Dairy & dairy-based products segment over the forecast period
Figure 107: Malaysia Functional Food IngredientsMarket Absolute $ Opportunity (US$ Mn), by
Beverages Segment, 2016─2026Key Takeaways
Beverages segment is estimated to be valued at US$129.0 Mn by 2016 and is expected to reach US$ 221.3Mn by 2026 end, expanding at a CAGR of 5.5% over theforecast period
This segment is estimated to create absolute $opportunity of US$ 5.8 Mn in 2016 over 2015 and isexpected to create incremental $ opportunity of US$92.4 Mn between 2016 and 2026
Beverages
Dairy & dairy-based products
Figure 108: Malaysia Functional Food IngredientsMarket Absolute $ Opportunity (US$ Mn ), by Dairy &
dairy-based products Segment, 2016─2026Key Takeaways
Dairy & dairy-based products segment is estimated to bevalued at US$ 67.0 Mn by 2016 and is expected to reachUS$ 102.1 Mn by 2026 end, expanding at a CAGR of 4.3%over the forecast period
This segment is estimated to create absolute $opportunity of US$ 2.7 Mn in 2016 over 2015 and isexpected to create incremental $ opportunity of US$35.1 Mn between 2016 and 2026
12
3.2
16
9.1
22
1.3
+5
.8
+6
.5
+7
.7
+8
.8
+8
.6
2015(A)
2016(E)
2017(F)
2018(F)
2019(F)
2020(F)
2021(F)
2026(F)
US$
Mn
64
.4
82
.8
10
2.1
+2
.7
+2
.5
+3
.1
+3
.3
+3
.3
2015(A)
2016(E)
2017(F)
2018(F)
2019(F)
2020(F)
2021(F)
2026(F)
US$
Mn
Source: FMI, 2016
Source: FMI, 2016
©2015 Future Market Insights, All Rights Reserved137

Malaysia Functional Food Ingredients Market Analysis & Forecast By Application Bakery & confectionery segment is expected to exhibit significant growth in comparison to infant food segment over the forecast period
Figure 109: Malaysia Functional Food IngredientsMarket Absolute $ Opportunity (US$ Mn), by Infant
Food Segment, 2016─2026Key Takeaways
Infant food segment is estimated to be valued at US$47.2 Mn by 2016 and is expected to reach US$ 65.4 Mnby 2026 end, expanding at a CAGR of 3.3% over theforecast period
Infant food segment is estimated to create absolute $opportunity of US$ 2.0 Mn in 2016 over 2015. Thissegment is expected to create incremental $ opportunityof US$ 18.3 Mn between 2016 and 2026.
Infant Food
Bakery & Confectionery
Figure 110: Malaysia Functional Food IngredientsMarket Absolute $ Opportunity (US$ Mn ), by Bakery &
Confectionery Segment, 2016─2026Key Takeaways
Bakery & confectionery segment is estimated to bevalued at US$ 94.8 Mn by 2016 and is expected to reachUS$ 149.7 Mn by 2026 end, expanding at a CAGR of 4.7%over the forecast period
This segment is estimated to create absolute $opportunity of US$ 4.0 Mn in 2016 over 2015 and isexpected to create incremental $ opportunity of US$55.0 Mn between 2016 and 2026
45
.2
55
.5
65
.4
+2
.0
+1
.6
+1
.9
+2
.0
+1
.4
2015(A)
2016(E)
2017(F)
2018(F)
2019(F)
2020(F)
2021(F)
2026(F)
US$
Mn
90
.8
11
8.8
14
9.7
+4
.0
+4
.7
+3
.4
+4
.5
+5
.0
2015(A)
2016(E)
2017(F)
2018(F)
2019(F)
2020(F)
2021(F)
2026(F)
US$
Mn
Source: FMI, 2016
Source: FMI, 2016
©2015 Future Market Insights, All Rights Reserved138

Malaysia Functional Food Ingredients Market Trends
Malaysia
Rapidly growing fast food industry coupled with modern lifestyle resulting in changing food habits of consumers in Malaysia and alsoleading to onset diseases such as diabetes, heart disease etc. In response to this, the government of Malaysia has undertakeninitiatives to strengthen consumer awareness towards healthy lifestyle and also various manufacturers have increased production offoods, which include functional ingredients. This in turn has resulted into increased usage of functional ingredients in food products.
Demand for functional ingredients such as omega 3, probiotics, calcium, vitamin E and fibre is increasing significantly in Malaysia.Among these ingredients, omega 3 and dietary fibre segments are expected to contribute significant market shares over the forecastperiod.
In Malaysia, the government of Malaysia has undertaken various initiatives such as health campaigns, welfare programmes etc. inorder to promote awareness among consumers regarding food products containing functional ingredients. Moreover, all food, drinkand food ingredients imported or manufactured locally are required to comply with Malaysian food regulations.
©2015 Future Market Insights, All Rights Reserved139

Vitamins
Minerals
Prebiotics & Dietary Fibre
Probiotics
CarotenoidsProtein
Omega 3 Fatty Acids
Low Medium High
Low
Med
ium
Hig
h
Gro
wth
Ind
ex
(20
16–
2026
)
Total Index(Absolute Index + CAGR Index)
Bubble Size represents market
size for 2026 (F)
Malaysia Functional Food Ingredients Market Attractiveness Analysis By Ingredients Type, Application
Figure 111: Malaysia Functional Food Ingredients Market Attractiveness Analysis By Ingredients Type, 2016–2026
Figure 112: Malaysia Functional Food Ingredients Market Attractiveness Analysis By Application, 2016–2026
Beverages
Dairy & Dairy Based Products
Infant Food Bakery & Confectionery
Low Medium High
Low
Med
ium
Hig
h
Gro
wth
Ind
ex
(20
16–
2026
)
Total Index(Absolute Index + CAGR Index)
Bubble Size represents market
size for 2026 (F)
Source: FMI, 2016 Source: FMI, 2016
©2015 Future Market Insights, All Rights Reserved140

Indonesia Functional Food Ingredients Market Analysis
Section 14
©2015 Future Market Insights, All Rights Reserved141

Indonesia Functional Food Ingredients MarketTradeshows organised across Indonesia to promote functional food ingredients is expected to fuel demand for such ingredients among various end-user industries
Figure 113: Indonesia Functional Food Ingredients Market Value (US$ Mn), 2015–2026
Figure 114: Indonesia Functional Food Ingredients Market Absolute $ Opportunity (US$ Mn), 2016–2026
Key Takeaways
The functional food ingredients market in Indonesia is estimated to be valued at US$ 253.4 Mn by 2016 and is expected to reach US$394.4 Mn by 2026 end, expanding at a CAGR of 4.5% over the forecast period
The functional food ingredients market in the country is estimated to represent absolute $ opportunity of US$ 11.7 Mn in 2016 over2015 and is expected to represent incremental $ opportunity of US$ 140.9 Mn between 2016 and 2026
24
1.7
25
3.4
26
4.4
27
7.3
28
9.2
30
5.5
31
9.3
39
4.4
0
50
100
150
200
250
300
350
400
450
2015 (A)2016 (E) 2017 (F) 2018 (F) 2019 (F) 2020 (F) 2021 (F) 2026 (F)
Val
ue
(U
S$ M
n)
Value
24
1.7
31
9.3
39
4.4
+1
1.7
+1
0.9
+1
2.9
+1
1.9
+1
6.3
2015 (A) 2016 (E) 2017 (F) 2018 (F) 2019 (F) 2020 (F) 2021 (F) 2026 (F)
US$
Mn
Source: FMI, 2016 Source: FMI, 2016
©2015 Future Market Insights, All Rights Reserved142
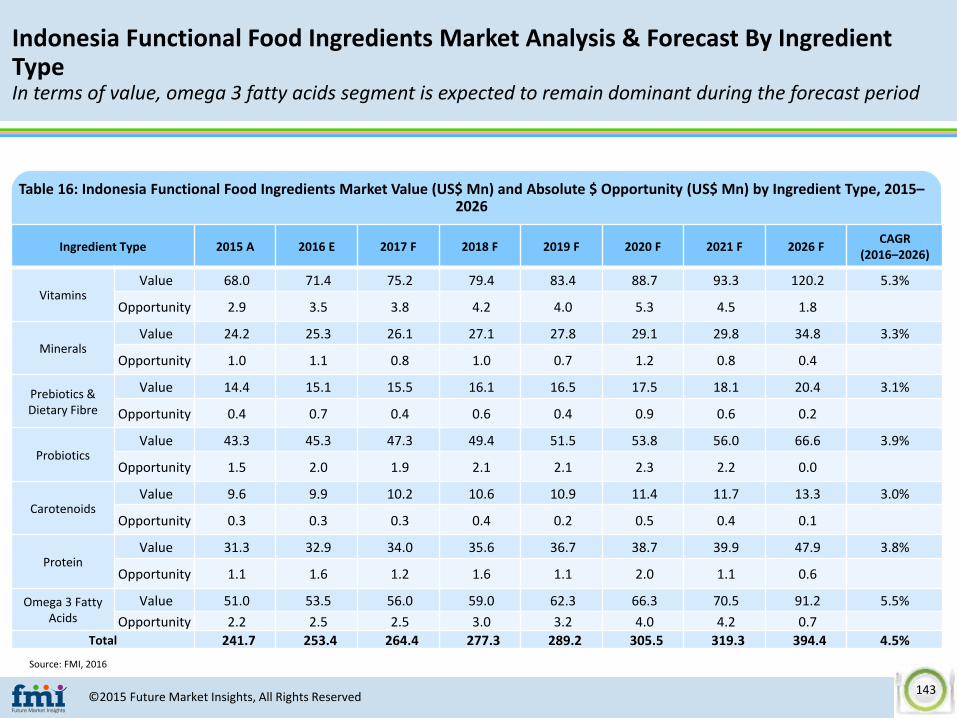
Indonesia Functional Food Ingredients Market Analysis & Forecast By Ingredient TypeIn terms of value, omega 3 fatty acids segment is expected to remain dominant during the forecast period
Table 16: Indonesia Functional Food Ingredients Market Value (US$ Mn) and Absolute $ Opportunity (US$ Mn) by Ingredient Type, 2015–2026
Ingredient Type 2015 A 2016 E 2017 F 2018 F 2019 F 2020 F 2021 F 2026 FCAGR
(2016–2026)
VitaminsValue 68.0 71.4 75.2 79.4 83.4 88.7 93.3 120.2 5.3%
Opportunity 2.9 3.5 3.8 4.2 4.0 5.3 4.5 1.8
MineralsValue 24.2 25.3 26.1 27.1 27.8 29.1 29.8 34.8 3.3%
Opportunity 1.0 1.1 0.8 1.0 0.7 1.2 0.8 0.4
Prebiotics & Dietary Fibre
Value 14.4 15.1 15.5 16.1 16.5 17.5 18.1 20.4 3.1%
Opportunity 0.4 0.7 0.4 0.6 0.4 0.9 0.6 0.2
ProbioticsValue 43.3 45.3 47.3 49.4 51.5 53.8 56.0 66.6 3.9%
Opportunity 1.5 2.0 1.9 2.1 2.1 2.3 2.2 0.0
CarotenoidsValue 9.6 9.9 10.2 10.6 10.9 11.4 11.7 13.3 3.0%
Opportunity 0.3 0.3 0.3 0.4 0.2 0.5 0.4 0.1
ProteinValue 31.3 32.9 34.0 35.6 36.7 38.7 39.9 47.9 3.8%
Opportunity 1.1 1.6 1.2 1.6 1.1 2.0 1.1 0.6
Omega 3 Fatty Acids
Value 51.0 53.5 56.0 59.0 62.3 66.3 70.5 91.2 5.5%
Opportunity 2.2 2.5 2.5 3.0 3.2 4.0 4.2 0.7 Total 241.7 253.4 264.4 277.3 289.2 305.5 319.3 394.4 4.5%
Source: FMI, 2016
©2015 Future Market Insights, All Rights Reserved143

Indonesia Functional Food Ingredients Market Analysis & Forecast By Ingredient Type Vitamins segment is expected to exhibit significant growth in comparison to minerals segment over the forecast period
Figure 115: Indonesia Functional Food IngredientsMarket Absolute $ Opportunity (US$ Mn), by Vitamins
Segment, 2016─2026Key Takeaways
Vitamins segment is estimated to be valued at US$ 71.4Mn by 2016 and is expected to reach US$ 120.2 Mn by2026 end, expanding at a CAGR of 5.3% over the forecastperiod
Vitamins segment is estimated to create absolute $opportunity of US$ 3.5 Mn in 2016 over 2015. Thissegment is expected to create incremental $ opportunityof US$ 48.7 Mn between 2016 and 2026.
Vitamins
Minerals
Figure 116: Indonesia Functional Food IngredientsMarket Absolute $ Opportunity (US$ Mn ), by Minerals
Segment, 2016─2026Key Takeaways
Minerals segment is estimated to be valued at US$ 25.3Mn by 2016 and is expected to reach US$ 34.8 Mn by2026 end, expanding at a CAGR of 3.3% over the forecastperiod
This segment is estimated to create absolute $opportunity of US$ 1.1 Mn in 2016 over 2015 and isexpected to create incremental $ opportunity of US$ 9.6Mn between 2016 and 2026
68
.0
93
.3
12
0.2
+3
.5
+3
.8
+4
.2
+4
.0
+5
.3
2015(A)
2016(E)
2017(F)
2018(F)
2019(F)
2020(F)
2021(F)
2026(F)
US$
Mn
24
.2
29
.8
34
.8
+1
.1
+0
.8
+1
.0
+0
.7
+1
.2
2015(A)
2016(E)
2017(F)
2018(F)
2019(F)
2020(F)
2021(F)
2026(F)
US$
Mn
Source: FMI, 2016
Source: FMI, 2016
©2015 Future Market Insights, All Rights Reserved144

Indonesia Functional Food Ingredients Market Analysis & Forecast By Ingredient Type Probiotics segment is expected to exhibit significant growth in comparison to prebiotics & dietary fibre segment over the forecast period
Figure 117: Indonesia Functional Food IngredientsMarket Absolute $ Opportunity (US$ Mn), by Prebiotics
& Dietary Fibre Segment, 2016─2026Key Takeaways
Prebiotics & dietary fibre segment is estimated to bevalued at US$ 15.1 Mn by 2016 and is expected to reachUS$ 20.4 Mn by 2026 end, expanding at a CAGR of 3.1%over the forecast period
This segment is estimated to create absolute $opportunity of US$ 0.7 Mn in 2016 over 2015 and isexpected to create incremental $ opportunity of US$ 5.3Mn between 2016 and 2026
Prebiotics & Dietary Fibre
Probiotics
Figure 118: Indonesia Functional Food IngredientsMarket Absolute $ Opportunity (US$ Mn), by Probiotics
Segment, 2016─2026Key Takeaways
Probiotics segment is estimated to be valued at US$ 45.3Mn by 2016 and is expected to reach US$ 66.6 Mn by2026 end, expanding at a CAGR of 3.9% over the forecastperiod
Probiotics segment is estimated to create absolute $opportunity of US$ 2.0 Mn in 2016 over 2015. Thissegment is expected to create incremental $ opportunityof US$ 21.3 Mn between 2016 and 2026.
14
.4
18
.1
20
.4
+0
.7
+0
.4
+0
.6
+0
.4
+0
.9
2015(A)
2016(E)
2017(F)
2018(F)
2019(F)
2020(F)
2021(F)
2026(F)
US$
Mn
43
.3
56
.0
66
.6
+2
.0
+1
.9
+2
.1
+2
.1
+2
.3
2015(A)
2016(E)
2017(F)
2018(F)
2019(F)
2020(F)
2021(F)
2026(F)
US$
Mn
Source: FMI, 2016
Source: FMI, 2016
©2015 Future Market Insights, All Rights Reserved145

Indonesia Functional Food Ingredients Market Analysis & Forecast By Ingredient Type Protein segment is expected to exhibit significant growth in comparison to carotenoids segment over the forecast period
Figure 119: Indonesia Functional Food IngredientsMarket Absolute $ Opportunity (US$ Mn), by
Carotenoids Segment, 2016─2026Key Takeaways
Carotenoids segment is estimated to be valued at US$9.9 Mn by 2016 and is expected to reach US$ 13.3 Mn by2026 end, expanding at a CAGR of 3.0% over the forecastperiod
Carotenoids segment is estimated to create absolute $opportunity of US$ 0.3 Mn in 2016 over 2015. Thissegment is expected to create incremental $ opportunityof US$ 3.4 Mn between 2016 and 2026.
Carotenoids
Protein
Figure 120: Indonesia Functional Food IngredientsMarket Absolute $ Opportunity (US$ Mn), by Protein
Segment, 2016─2026Key Takeaways
Protein segment is estimated to be valued at US$ 32.9Mn by 2016 and is expected to reach US$ 47.9 Mn by2026 end, expanding at a CAGR of 3.8% over the forecastperiod
Protein segment is estimated to create absolute $opportunity of US$ 1.6 Mn in 2016 over 2015. Thissegment is expected to create incremental $ opportunityof US$ 15.0 Mn between 2016 and 2026.
9.6
11
.7
13
.3
+0
.3
+0
.3
+0
.4
+0
.2
+0
.5
2015(A)
2016(E)
2017(F)
2018(F)
2019(F)
2020(F)
2021(F)
2026(F)
US$
Mn
31
.3
39
.9
47
.9
+1
.6
+1
.2
+1
.6
+1
.1
+2
.0
2015(A)
2016(E)
2017(F)
2018(F)
2019(F)
2020(F)
2021(F)
2026(F)
US$
Mn
Source: FMI, 2016
Source: FMI, 2016
©2015 Future Market Insights, All Rights Reserved146

Indonesia Functional Food Ingredients Market Analysis & Forecast By Ingredient Type Omega 3 fatty acids segment is anticipated to exhibit above average growth over the forecast period
Figure 121: Indonesia Functional Food IngredientsMarket Absolute $ Opportunity (US$ Mn), by Omega 3
Fatty Acids Segment, 2016─2026
51
.0
70
.5
91
.2
+2
.5
+2
.5
+3
.0
+3
.2
+4
.0
2015(A)
2016(E)
2017(F)
2018(F)
2019(F)
2020(F)
2021(F)
2026(F)
US$
Mn
Key Takeaways
Omega 3 fatty acids segment is estimated to be valued atUS$ 53.5 Mn by 2016 and is expected to reach US$ 91.2Mn by 2026 end, expanding at a CAGR of 5.5% over theforecast period
This segment is estimated to create absolute $opportunity of US$ 2.5 Mn in 2016 over 2015 and isexpected to create incremental $ opportunity of US$37.7 Mn between 2016 and 2026
Omega 3 Fatty Acids
Source: FMI, 2016
©2015 Future Market Insights, All Rights Reserved147

Indonesia Functional Food Ingredients Market Analysis & Forecast By Application
Table 17: Indonesia Functional Food Ingredients Market Value (US$ Mn) and Absolute $ Opportunity (US$ Mn) by Application, 2015–2026
Application 2015 A 2016 E 2017 F 2018 F 2019 F 2020 F 2021 F 2026 FCAGR
(2016–2026)
BeveragesValue 69.6 73.1 76.6 80.5 84.4 89.4 93.7 117.1 4.8%
Opportunity 3.0 3.5 3.5 3.9 3.9 5.0 4.3 1.2
Dairy & dairy-based products
Value 89.6 94.0 98.9 104.5 109.7 116.5 122.5 157.5 5.3%
Opportunity 3.6 4.4 4.9 5.5 5.2 6.8 6.1 2.3
Infant FoodValue 50.6 53.5 55.3 57.7 59.9 63.5 66.1 79.2 4.0%
Opportunity 2.3 2.9 1.8 2.4 2.2 3.7 2.6 0.3
Bakery & Confectionery
Value 32.0 32.9 33.6 34.7 35.3 36.0 36.9 40.6 2.1%
Opportunity 0.5 0.9 0.7 1.0 0.6 0.8 0.9 0.0
Total 241.7 253.4 264.4 277.3 289.2 305.5 319.3 394.4 4.5%
Source: FMI, 2016
©2015 Future Market Insights, All Rights Reserved148

Indonesia Functional Food Ingredients Market Analysis & Forecast By Application Dairy & dairy products segment is expected to exhibit significant growth in comparison to beverages segment over the forecast period
Figure 122: Indonesia Functional Food IngredientsMarket Absolute $ Opportunity (US$ Mn), by
Beverages Segment, 2016─2026Key Takeaways
Beverages segment is estimated to be valued at US$ 73.1Mn by 2016 and is expected to reach US$ 117.1 Mn by2026 end, expanding at a CAGR of 4.8% over the forecastperiod
Beverages segment is estimated to create absolute $opportunity of US$ 3.5 Mn in 2016 over 2015. Thissegment is expected to create incremental $ opportunityof US$ 44.1 Mn between 2016 and 2026.
Beverages
Dairy & dairy-based products
Figure 123: Indonesia Functional Food IngredientsMarket Absolute $ Opportunity (US$ Mn ), by Dairy &
dairy-based products Segment, 2016─2026Key Takeaways
Dairy & dairy-based products segment is estimated to bevalued at US$ 94.0 Mn by 2016 and is expected to reachUS$ 157.5 Mn by 2026 end, expanding at a CAGR of 5.3%over the forecast period
This segment is estimated to create absolute $opportunity of US$ 4.4 Mn in 2016 over 2015 and isexpected to create incremental $ opportunity of US$63.4 Mn between 2016 and 2026
69
.6
93
.7
11
7.1
+3
.5
+3
.5
+3
.9
+3
.9
+5
.0
2015(A)
2016(E)
2017(F)
2018(F)
2019(F)
2020(F)
2021(F)
2026(F)
US$
Mn
89
.6
12
2.5
15
7.5
+4
.4
+4
.9
+5
.5
+5
.2
+6
.8
2015(A)
2016(E)
2017(F)
2018(F)
2019(F)
2020(F)
2021(F)
2026(F)
US$
Mn
Source: FMI, 2016
Source: FMI, 2016
©2015 Future Market Insights, All Rights Reserved149

Indonesia Functional Food Ingredients Market Analysis & Forecast By Application Infant food segment is expected to exhibit significant growth in comparison to bakery & confectionery segment over the forecast period
Figure 124: Indonesia Functional Food IngredientsMarket Absolute $ Opportunity (US$ Mn), by InfantFood Segment, 2016─2026Key Takeaways
Infant food segment is estimated to be valued at US$53.5 Mn by 2016 and is expected to reach US$ 79.2 Mnby 2026 end, expanding at a CAGR of 4.0% over theforecast period
Infant food segment is estimated to create absolute $opportunity of US$ 2.9 Mn in 2016 over 2015. Thissegment is expected to create incremental $ opportunityof US$ 25.7 Mn between 2016 and 2026.
Infant Food
Bakery & Confectionery
Figure 125: Indonesia Functional Food IngredientsMarket Absolute $ Opportunity (US$ Mn ), by Bakery &
Confectionery Segment, 2016─2026Key Takeaways
Bakery & confectionery segment is estimated to bevalued at US$ 32.9 Mn by 2016 and is expected to reachUS$ 40.6 Mn by 2026 end, expanding at a CAGR of 2.1 %over the forecast period
This segment is estimated to create absolute $opportunity of US$ 0.9 Mn in 2016 over 2015 and isexpected to create incremental $ opportunity of US$ 7.7Mn between 2016 and 2026
50
.6
66
.1
79
.2
+2
.9
+1
.8
+2
.4
+2
.2
+3
.7
2015(A)
2016(E)
2017(F)
2018(F)
2019(F)
2020(F)
2021(F)
2026(F)
US$
Mn
32
.0
36
.9
40
.6
+0
.9
+0
.7
+1
.0
+0
.6
+0
.8
2015(A)
2016(E)
2017(F)
2018(F)
2019(F)
2020(F)
2021(F)
2026(F)
US$
Mn
Source: FMI, 2016
Source: FMI, 2016
©2015 Future Market Insights, All Rights Reserved150

Indonesia Functional Food Ingredients Market Trends
Indonesia
Various exhibitions are organized across the country in order to showcase various food and beverage ingredients and also to expandpresence in various untapped markets
Food Ingredients Asia is an international trade show that facilitates various companies such as BASF SE, Archer Daniels MidlandCompany, Koninklijke DSM N.V etc. to showcase their functional food products and also source the latest information regardingfunctional ingredients used for bakery, beverage and dairy-based products
In September 2016, Food Ingredients Asia is scheduled to be organized in which over 650 leading food and beverage ingredientsupplier are expected to participate and showcase their latest additions related to functional food ingredients in Jakarta, Indonesia
©2015 Future Market Insights, All Rights Reserved151

Vitamins
Minerals
Prebiotics & Dietary Fibre
Probiotics
CarotenoidsProtein
Omega 3 Fatty Acids
Low Medium High
Low
Med
ium
Hig
h
Gro
wth
Ind
ex
(20
16–
2026
)
Total Index(Absolute Index + CAGR Index)
Bubble Size represents market
size for 2026 (F)
Indonesia Functional Food Ingredients Market Attractiveness Analysis By Application & Ingredient Type
Figure 126: Indonesia Functional Food Ingredients Market Attractiveness Analysis By Ingredients Type, 2016–2026
Figure 127: Indonesia Functional Food Ingredients Market Attractiveness Analysis By Application, 2016–2026
Beverages
Dairy & Dairy Based Products
Infant Food
Bakery & Confectionery
Low Medium High
Low
Med
ium
Hig
h
Gro
wth
Ind
ex
(20
16–
2026
)
Total Index(Absolute Index + CAGR Index)
Bubble Size represents market
size for 2026 (F)
Source: FMI, 2016 Source: FMI, 2016
©2015 Future Market Insights, All Rights Reserved152
Competitive Landscape – By Ingredient
Section 15
©2015 Future Market Insights, All Rights Reserved153

Functional Food Market: Competition Dashboard (1/2)
Key PlayersSciphar Natural Products
Co., Ltd Marathwada Chemical
Industries Pvt. Ltd.NEW ASIA INGREDIENTS
PTE LTDFENCHEM BIOTEK
LTD.Arjuna Natural Extracts
Ltd.
Country Shaani, China Aurangabad, IndiaAng Mo Kio Avenue,
SingaporeNanjung, China Alwaye, India
Established 2006 1962 1997 1995 1992
Employees 200-300 500 N.A. 300 ~300
ProductsProbiotics, Prebiotic &
Dietary Fibre, Protein and Carotenoids
Vitamins Protein Vitamins, Protein Omega-3
Application Beverage, Dairy and Bakery Beverage Beverage and DairyBeverage, Dairy and
BakeryInfant Food
Major Presence
China China China China China
India India India India India
Japan Japan Japan Japan Japan
Malaysia Malaysia Malaysia Malaysia Malaysia
Indonesia Indonesia Indonesia Indonesia Indonesia
Singapore Singapore Singapore Singapore Singapore
Thailand Thailand Thailand Thailand Thailand
High Medium LowSource: FMI, 2016
©2015 Future Market Insights, All Rights Reserved154
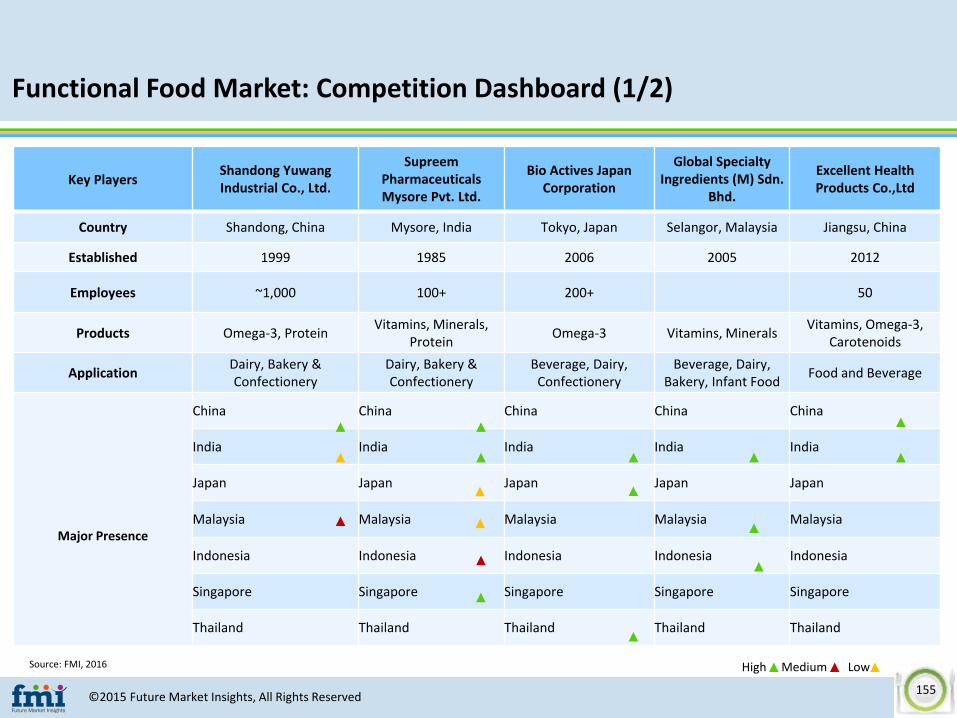
Functional Food Market: Competition Dashboard (1/2)
Key PlayersShandong Yuwang Industrial Co., Ltd.
Supreem Pharmaceuticals Mysore Pvt. Ltd.
Bio Actives Japan Corporation
Global Specialty Ingredients (M) Sdn.
Bhd.
Excellent Health Products Co.,Ltd
Country Shandong, China Mysore, India Tokyo, Japan Selangor, Malaysia Jiangsu, China
Established 1999 1985 2006 2005 2012
Employees ~1,000 100+ 200+ 50
Products Omega-3, ProteinVitamins, Minerals,
ProteinOmega-3 Vitamins, Minerals
Vitamins, Omega-3, Carotenoids
ApplicationDairy, Bakery & Confectionery
Dairy, Bakery & Confectionery
Beverage, Dairy, Confectionery
Beverage, Dairy, Bakery, Infant Food
Food and Beverage
Major Presence
China China China China China
India India India India India
Japan Japan Japan Japan Japan
Malaysia Malaysia Malaysia Malaysia Malaysia
Indonesia Indonesia Indonesia Indonesia Indonesia
Singapore Singapore Singapore Singapore Singapore
Thailand Thailand Thailand Thailand Thailand
Source: FMI, 2016 High Medium Low
©2015 Future Market Insights, All Rights Reserved155
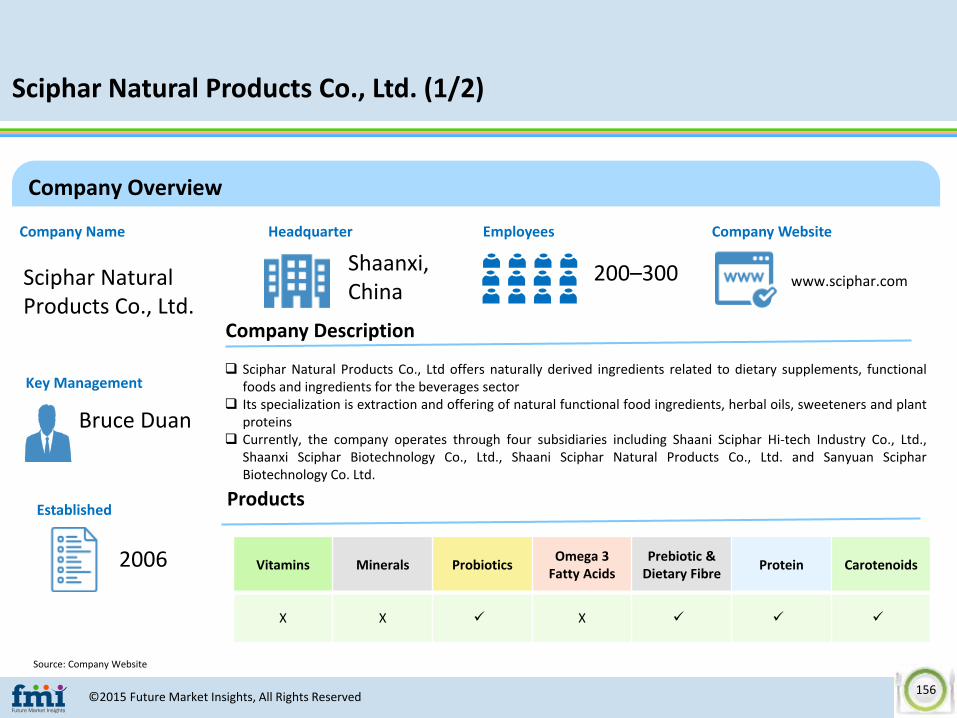
Sciphar Natural Products Co., Ltd. (1/2)
Source: Company Website
Company Overview
Headquarter
Shaanxi, China
Employees
200–300
Key Management
Bruce Duan
Established
2006
Sciphar Natural Products Co., Ltd offers naturally derived ingredients related to dietary supplements, functionalfoods and ingredients for the beverages sector
Its specialization is extraction and offering of natural functional food ingredients, herbal oils, sweeteners and plantproteins
Currently, the company operates through four subsidiaries including Shaani Sciphar Hi-tech Industry Co., Ltd.,Shaanxi Sciphar Biotechnology Co., Ltd., Shaani Sciphar Natural Products Co., Ltd. and Sanyuan ScipharBiotechnology Co. Ltd.
Company Description
Company Website
www.sciphar.com
Products
Sciphar Natural Products Co., Ltd.
Company Name
Vitamins Minerals ProbioticsOmega 3
Fatty AcidsPrebiotic &
Dietary FibreProtein Carotenoids
X X X
©2015 Future Market Insights, All Rights Reserved156
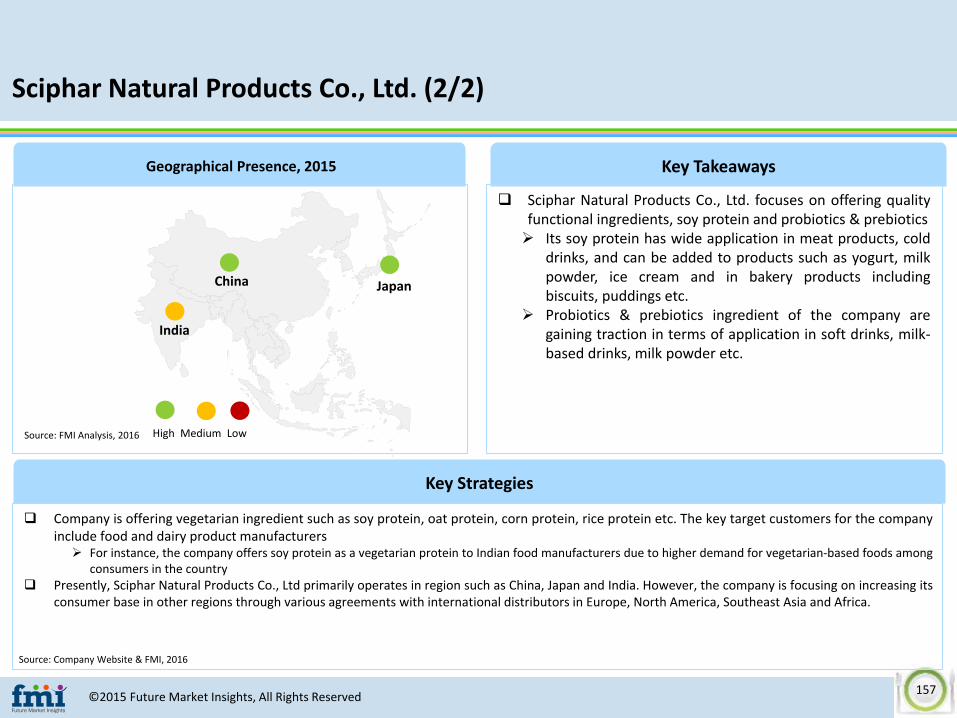
Sciphar Natural Products Co., Ltd. (2/2)
Source: Company Website & FMI, 2016
Geographical Presence, 2015 Key Takeaways
Key Strategies
Source: FMI Analysis, 2016
Sciphar Natural Products Co., Ltd. focuses on offering qualityfunctional ingredients, soy protein and probiotics & prebiotics Its soy protein has wide application in meat products, cold
drinks, and can be added to products such as yogurt, milkpowder, ice cream and in bakery products includingbiscuits, puddings etc.
Probiotics & prebiotics ingredient of the company aregaining traction in terms of application in soft drinks, milk-based drinks, milk powder etc.
Company is offering vegetarian ingredient such as soy protein, oat protein, corn protein, rice protein etc. The key target customers for the companyinclude food and dairy product manufacturers For instance, the company offers soy protein as a vegetarian protein to Indian food manufacturers due to higher demand for vegetarian-based foods among
consumers in the country Presently, Sciphar Natural Products Co., Ltd primarily operates in region such as China, Japan and India. However, the company is focusing on increasing its
consumer base in other regions through various agreements with international distributors in Europe, North America, Southeast Asia and Africa.
China Japan
High Medium Low
India
©2015 Future Market Insights, All Rights Reserved157

Marathwada Chemical Industries Pvt. Ltd. (1/2)
Source: Company Website
Headquarter
Aurangabad, India
Employees
500
Key Management
Mr. Madhusudan Rathi
Established
1962
The group operates through three business segments including Marathwada Chemical industries Pvt. Ltd.,Matrix Fine Sciences Pvt. Ltd. and Clean Science and Technology Private Limited
Matrix Fine Science Pvt. Ltd. operates in the nutraceutical business, offering food and feed ingredients, bio-fuels and vitamins
Matrix Fine Science Pvt. Ltd. specializes in extraction of vitamin E (Natural Tocopherol) and primarily caters toneed of food, pharma, nutraceuctical and cosmetics industry
Company Description
Company Website
www.matrixfinesciences.com
Products
Marathwada Chemical Industries Pvt. Ltd.
Company Name
Vitamins Minerals ProbioticsOmega 3
Fatty Acids
Prebiotic & Dietary
FibreProtein Carotenoids
X X X X X X
Company Overview
©2015 Future Market Insights, All Rights Reserved158
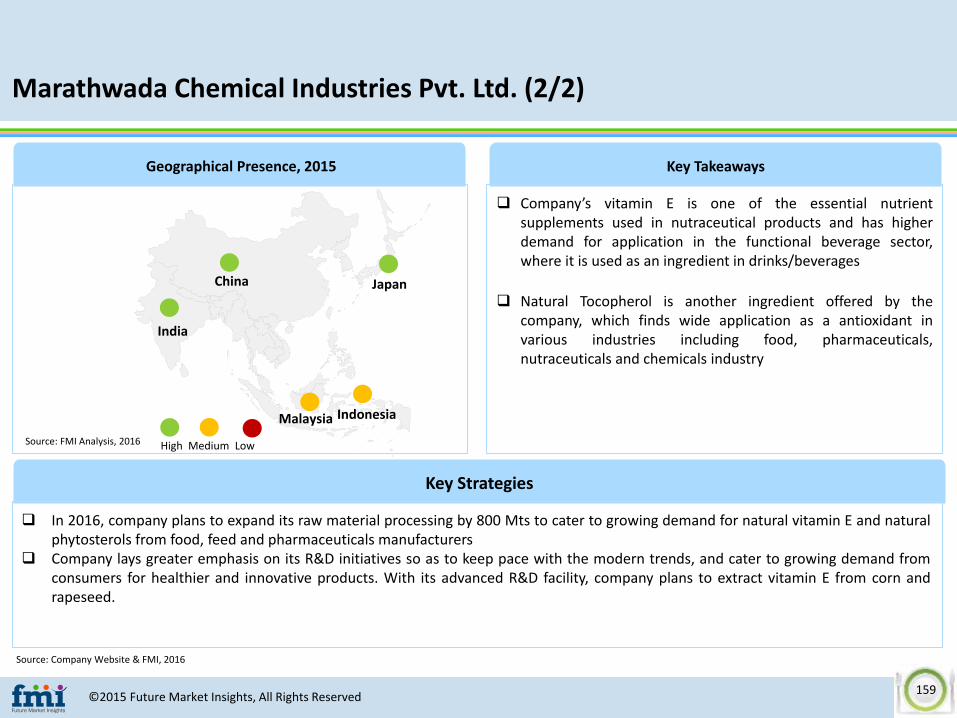
Marathwada Chemical Industries Pvt. Ltd. (2/2)
Source: Company Website & FMI, 2016
Geographical Presence, 2015 Key Takeaways
Key Strategies
High Medium Low
Company’s vitamin E is one of the essential nutrientsupplements used in nutraceutical products and has higherdemand for application in the functional beverage sector,where it is used as an ingredient in drinks/beverages
Natural Tocopherol is another ingredient offered by thecompany, which finds wide application as a antioxidant invarious industries including food, pharmaceuticals,nutraceuticals and chemicals industry
In 2016, company plans to expand its raw material processing by 800 Mts to cater to growing demand for natural vitamin E and naturalphytosterols from food, feed and pharmaceuticals manufacturers
Company lays greater emphasis on its R&D initiatives so as to keep pace with the modern trends, and cater to growing demand fromconsumers for healthier and innovative products. With its advanced R&D facility, company plans to extract vitamin E from corn andrapeseed.
Source: FMI Analysis, 2016
China Japan
India
Malaysia Indonesia
©2015 Future Market Insights, All Rights Reserved159

FENCHEM BIOTEK LTD. (1/2)
Source: Company Website
Headquarter
Nanjung, China
Employees
300
Key Management
Mr. Xiaogang Feng
Established
1995
FENCHEM BIOTEK LTD. is a global manufacturer of specialty ingredients and product solutions. Its businesssegments include nutritional & health, food & beverage, cosmetics & personal care, feed & pet food, API &agrochem and coating & constructions
Company’s business operations include extraction of raw materials, manufacture of products, offering oftailor-made solutions and solution-based services on a global level
FENCHEM BIOTEK LTD. offers vitamin D, vitamin E, vitamin H and vitamin B under its business segment ofnutrition & health
Company Description
Company Website
www.fenchem.com
Products
FENCHEM BIOTEK LTD.
Company Name
Vitamins Minerals ProbioticsOmega 3
Fatty Acids
Prebiotic & Dietary
FibreProtein Carotenoids
X X X X X
Company Overview
©2015 Future Market Insights, All Rights Reserved160

FENCHEM BIOTEK LTD. (2/2)
Source: Company Website & FMI, 2016
Geographical Presence, 2015 Key Takeaways
Key Strategies
The company focuses on development of innovativeingredients, tailor-made solutions and specific health relatedsupplements, which it offers through its nutrition & healthbusiness segment Vitamins, antioxidants, amino acids, herbal extracts and
joint health are some key products of Fenchem, whichdelivers health benefits to consumers
Majority of revenue contribution in FENCHEM BIOTEK LTD.business comes from the company’s nutrition & healthsegment, followed by feed & pet food
In 2014, FENCHEM BIOTEK LTD. set up its second sales office in the Southeast Asian region in Thailand, in order to strengthen itspresence in market in this region. Expansion of its business in Thailand has also enabled the company to further develop its businessrelationships and logistic support in Asia market.
In 2014, company launched two new Vitamin E based products, which find wide application in the food and supplements industry dl-alpha tocopheryl acetate 75% powder and d-alpha tocopheryl acetate 950IU powder are the two new products launched in
its product portfolio of vitamins. Intake of these products helps to prevent diseases such as cancer, strokes, cataracts,cardiovascular diseases and also from problems related to ageing.
High Medium LowSource: FMI Analysis, 2016
China
Thailand
Malaysia
©2015 Future Market Insights, All Rights Reserved161

Arjuna Natural Extracts Ltd. (1/2)
Source: Company Website
Headquarter
Alwaye,India
Employees
~300
Key Management
Kunjachan Puthussery Joseph
Established
1992
Arjuna Natural Extracts Ltd. is a manufacturer and exporter of nutraceutical and pharmaceutical products,which include Omega 3, herbal extracts, essential oils and dietary supplements. In India, Arjuna is one of theleading manufacturers of concentrated Omega 3 fatty acids extracted from fish oil.
Company has customer base in over 40 countries. In order to satisfy its global level customers, company alsomeet various global regulations related to production process and product specific market regulations for itsnutraceutical products.
Arjuna Natural Extracts Ltd. offers two forms of Omega-3 fatty acids such as Omega-3 Oil and Omega-3Powder
Company Description
Company Website
www.arjunanatural.com
Products
Arjuna Natural Extracts Ltd.
Company Name
Vitamins Minerals ProbioticsOmega 3
Fatty Acids
Prebiotic & Dietary
FibreProtein Carotenoids
X X X X X X
Company Overview
©2015 Future Market Insights, All Rights Reserved162

Arjuna Natural Extracts Ltd. (2/2)
Source: Company Website & FMI, 2016
Geographical Presence, 2015 Key Takeaways
Key Strategies
High Medium LowSource: FMI Analysis, 2016
Omega-3 oil of the company witnesses greater demandamong supplement retailers due to its high quality of fattyacids
Omega-3 powder is one of the exclusive products of thecompany, which also finds significant demand among infantfood and food supplement manufacturers
Arjuna Natural Extracts Ltd. focuses on innovation and development of new products to compete with global level players and iscurrently into tie-ups with universities in the U.S., Japan and Australia for research initiatives
Moreover, the company uses indigenous technology in its manufacturing process of Omega 3 fatty acids
India
Japan
©2015 Future Market Insights, All Rights Reserved163

NEW ASIA INGREDIENTS PTE LTD. (1/2)
Source: Company Website
Headquarter
Ang Mo Kio Avenue, Singapore
Employees
N.A.
Key Management
N.A.
Established
1997
NEW ASIA INGREDIENTS PTE LTD. is one of the leading food ingredient companies in Singapore offering awide spectrum of products such as soy protein, functional food gum and food flavours, which are mostlysupplied in Asia Pacific region
NEW ASIA INGREDIENTS PTE LTD. is a recognized brand in the food ingredient market in Singapore, and apartfrom offering food ingredients, the company focuses offers clients services as a food technology consultantand also provided technical consultation to food manufacturers
Company Description
Company Website
www.newasia.com
Products
NEW ASIA INGREDIENTS PTE LTD.
Company Name
Vitamins Minerals ProbioticsOmega 3
Fatty Acids
Prebiotic & Dietary
FibreProtein Carotenoids
X X X X X X
Company Overview
©2015 Future Market Insights, All Rights Reserved164

NEW ASIA INGREDIENTS PTE LTD. (2/2)
Source: Company Website & FMI, 2016
Geographical Presence, 2015 Key Takeaways
Key Strategies
High Medium LowSource: FMI Analysis, 2016
NEW ASIA INGREDIENTS PTE LTD. produces two varieties ofsoy protein for food manufacturing sector. These include:
Isolated Soy Protein, which is available in two brands:NEWPRO and NEWSOY Series, and Soy ProteinConcentrate, which is available under brand nameNEWCON and NEWSOY Series
Majority of its soy protein ingredients find application inbeverage, dairy-based products, meat processing,nutritional supplements and health care products
The company offers ingredients that are popular with vegetarian consumers. Moreover, the company is focused on offering products cost-effectivelyto consumers
For instance, NEW ASIA INGREDIENTS PTE LTD. launched NEWSOY 460 ingredient as a soy protein ingredient, which has been developed as a meatreplacer for manufacturing veggie food products and also for application where meat textural functional ingredient is required
Apart from this, soy protein is also cost-effective as compared to meat-based products, which ultimately minimizes the production cost of functionalfood products
China
Singapore Malaysia
Indonesia
Thailand
©2015 Future Market Insights, All Rights Reserved165

Shandong Yuwang Industrial Co., Ltd. (1/2)
Source: Company Website
Headquarter
Shandong, China
Employees
~1000
Key Management
Liu Xiqian
Established
1999
Shandong Yuwang Industrial Co., Ltd. is part of a group of companies, which operates through four differentindustries: soybean processing, bio-pharmaceuticals, fine chemicals and advanced carbon/ceramic materials
The company currently has nine factories, one research station, one technology centre, two engineeringresearch centres and 20 sales subsidiaries
Company is one of the leading player in the soy protein market, and currently has capacity of producing100,000 tonnes of isolated soya protein
Company Description
Company Website
www.yuwangcn.com
Products
Shandong Yuwang Industrial Co., Ltd.
Company Name
Vitamins Minerals ProbioticsOmega 3
Fatty Acids
Prebiotic & Dietary
FibreProtein Carotenoids
X X X X X
Company Overview
©2015 Future Market Insights, All Rights Reserved166

Shandong Yuwang Industrial Co., Ltd. (2/2)
Source: Company Website & FMI, 2016
Geographical Presence, 2015 Key Takeaways
Key Strategies
High Medium LowSource: FMI Analysis, 2016
Shandong Yuwang Industrial Co., Ltd. has divided its soyprotein products in four different categories, which furthercomprises 15 types of products Demand for company’s soy protein products is higher than
that for functional food and nutritional products Principal applications of its soy protein brands is in dairy,
bakery, confectionery, beverage, frozen foods, vegetarianfood and meat-based products
Company is focused towards product development and product innovation. Yuwang offers gel type soy protein-based ingredient, whichis widely accepted by domestic as well as international customers due to its unique quality of retaining water and comprehensiveupgrade of its soya oil
In terms of both value and volume, Shandong Yuwang Industrial Co., Ltd. is ranked first in the China soya protein industry. Reasonbehind its higher revenue share in the Chinese market is due to its advanced R&D systems, tailored solutions, specialized post-doctoralworking station and provincial technology centre for soy protein products.
China
Malaysia
India
©2015 Future Market Insights, All Rights Reserved167

Supreem Pharmaceuticals Mysore Pvt. Ltd. (1/2)
Source: Company Website
Headquarter
Mysore, India
Employees
100+
Key Management
Mr. S N Rao
Established
1985
Supreem Pharmaceuticals Mysore Pvt. Ltd. is one of the leading manufacturers of vitamins, minerals andnutraceuticals products, and has expertise of over 30 years in processing and stabilizing of vitamins,pharmaceuticals, herbal extracts & formulations, food supplements and minerals
Company supplies over 92 products to pharmaceutical and food industries and operates its business in morethan 20 countries worldwide
Continuous participation of Supreem in international exhibitions is creating good brand recognition in thenutraceutical industry of India
Company Description
Company Website
www.supreempharma.in
Products
Supreem Pharmaceuticals Mysore Pvt. Ltd.
Company Name
Vitamins Minerals ProbioticsOmega 3
Fatty Acids
Prebiotic & Dietary
FibreProtein Carotenoids
X X X X
Company Overview
©2015 Future Market Insights, All Rights Reserved168
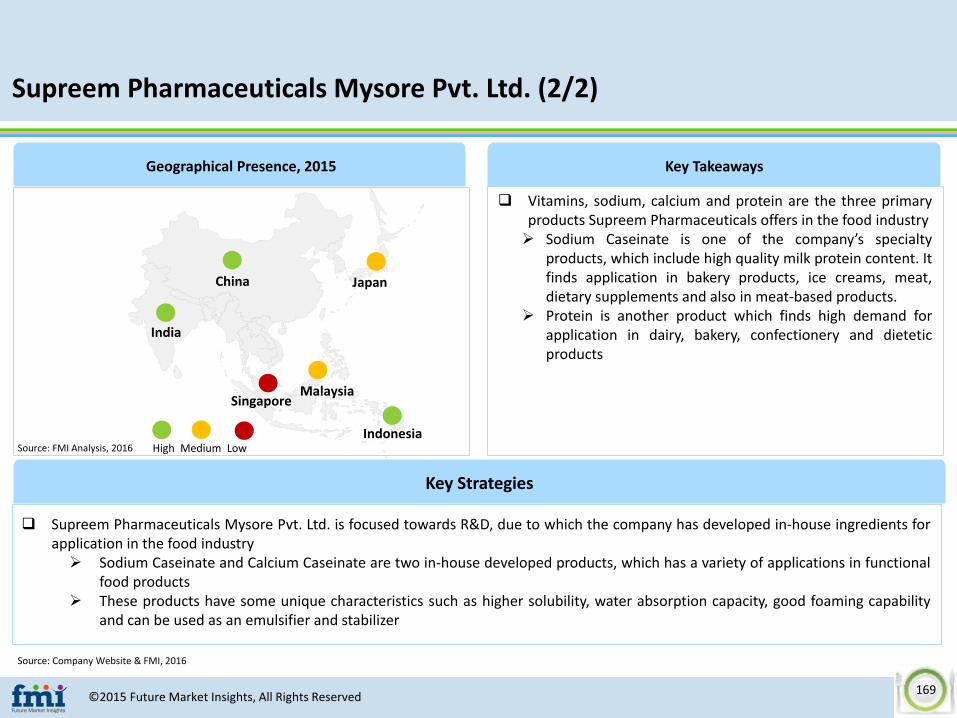
Supreem Pharmaceuticals Mysore Pvt. Ltd. (2/2)
Source: Company Website & FMI, 2016
Geographical Presence, 2015 Key Takeaways
Key Strategies
High Medium LowSource: FMI Analysis, 2016
Vitamins, sodium, calcium and protein are the three primaryproducts Supreem Pharmaceuticals offers in the food industry Sodium Caseinate is one of the company’s specialty
products, which include high quality milk protein content. Itfinds application in bakery products, ice creams, meat,dietary supplements and also in meat-based products.
Protein is another product which finds high demand forapplication in dairy, bakery, confectionery and dieteticproducts
Supreem Pharmaceuticals Mysore Pvt. Ltd. is focused towards R&D, due to which the company has developed in-house ingredients forapplication in the food industry Sodium Caseinate and Calcium Caseinate are two in-house developed products, which has a variety of applications in functional
food products These products have some unique characteristics such as higher solubility, water absorption capacity, good foaming capability
and can be used as an emulsifier and stabilizer
China
Malaysia
India
Japan
Singapore
Indonesia
©2015 Future Market Insights, All Rights Reserved169
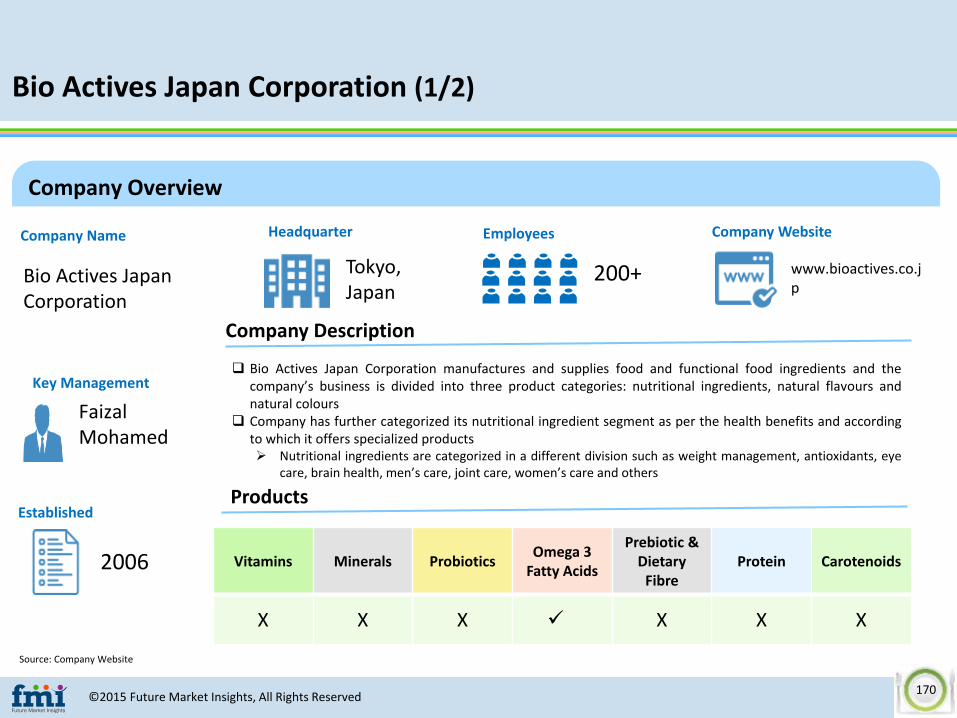
Bio Actives Japan Corporation (1/2)
Source: Company Website
Headquarter
Tokyo, Japan
Employees
200+
Key Management
Faizal Mohamed
Established
2006
Bio Actives Japan Corporation manufactures and supplies food and functional food ingredients and thecompany’s business is divided into three product categories: nutritional ingredients, natural flavours andnatural colours
Company has further categorized its nutritional ingredient segment as per the health benefits and accordingto which it offers specialized products Nutritional ingredients are categorized in a different division such as weight management, antioxidants, eye
care, brain health, men’s care, joint care, women’s care and others
Company Description
Company Website
www.bioactives.co.jp
Products
Bio Actives Japan Corporation
Company Name
Vitamins Minerals ProbioticsOmega 3
Fatty Acids
Prebiotic & Dietary
FibreProtein Carotenoids
X X X X X X
Company Overview
©2015 Future Market Insights, All Rights Reserved170

Bio Actives Japan Corporation (2/2)
Source: Company Website & FMI, 2016
Geographical Presence, 2015 Key Takeaways
Key Strategies
High Medium LowSource: FMI Analysis, 2016
Bio Actives Japan Corporation offers its products at regionaland global levels, including food and beverages, dairy,confectionery and supplement industry
Omega-3 fatty acids of the company witnesses greater demandfrom Europe and U.S. based companies. The company offersbreakfast cereals, edible oils, beverages etc.
Bio Actives Japan Corporation is focused towards its client base in the food and beverages industry. Omega-3 fatty acid of the company isonly available in powdered form, and provides various health benefits.
Company was awarded by the Department of Scientific and Industrial Research (DSIR), Government of India, for its contribution indevelopment of natural active ingredient.
India
Japan
Thailand
©2015 Future Market Insights, All Rights Reserved171
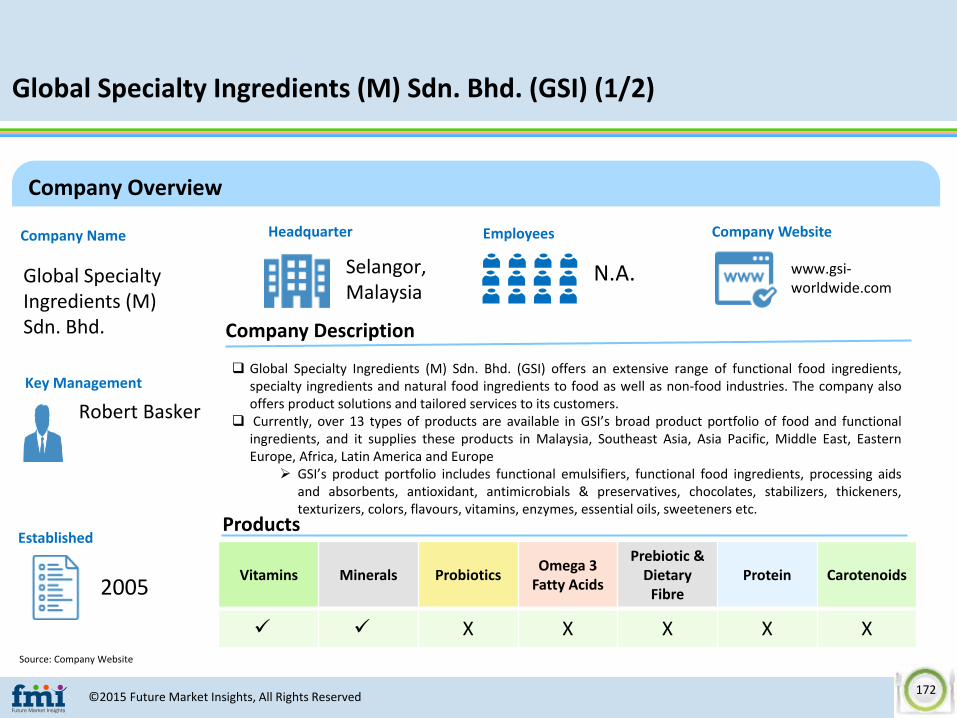
Global Specialty Ingredients (M) Sdn. Bhd. (GSI) (1/2)
Source: Company Website
Headquarter
Selangor, Malaysia
Employees
N.A.
Key Management
Robert Basker
Established
2005
Global Specialty Ingredients (M) Sdn. Bhd. (GSI) offers an extensive range of functional food ingredients,specialty ingredients and natural food ingredients to food as well as non-food industries. The company alsooffers product solutions and tailored services to its customers.
Currently, over 13 types of products are available in GSI’s broad product portfolio of food and functionalingredients, and it supplies these products in Malaysia, Southeast Asia, Asia Pacific, Middle East, EasternEurope, Africa, Latin America and Europe
GSI’s product portfolio includes functional emulsifiers, functional food ingredients, processing aidsand absorbents, antioxidant, antimicrobials & preservatives, chocolates, stabilizers, thickeners,texturizers, colors, flavours, vitamins, enzymes, essential oils, sweeteners etc.
Company Description
Company Website
www.gsi-worldwide.com
Products
Global Specialty Ingredients (M) Sdn. Bhd.
Company Name
Vitamins Minerals ProbioticsOmega 3
Fatty Acids
Prebiotic & Dietary
FibreProtein Carotenoids
X X X X X
Company Overview
©2015 Future Market Insights, All Rights Reserved172
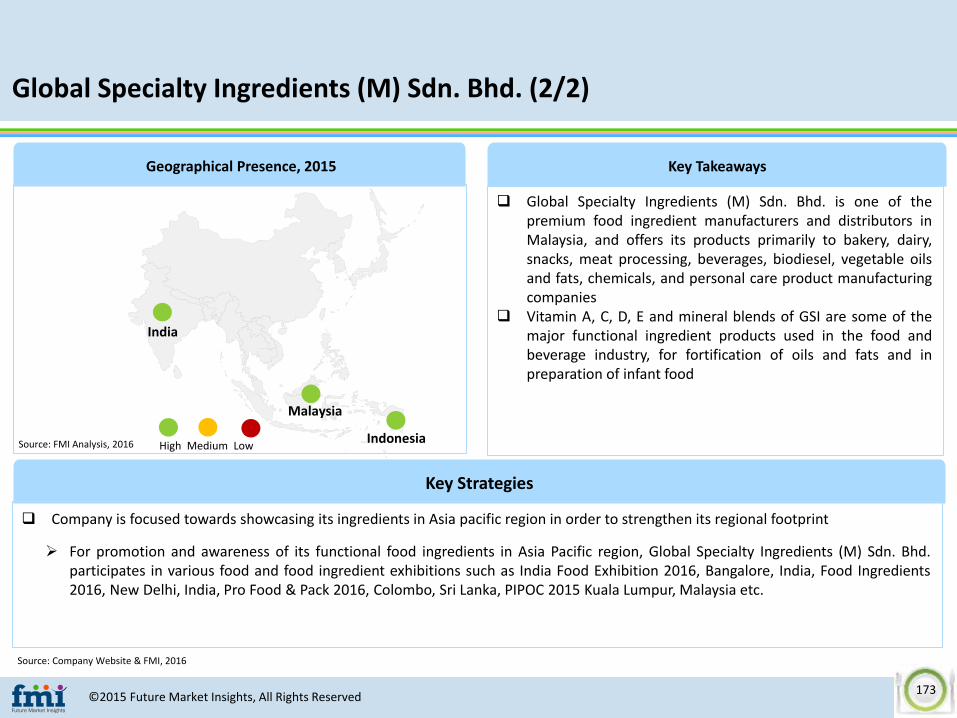
Global Specialty Ingredients (M) Sdn. Bhd. (2/2)
Source: Company Website & FMI, 2016
Geographical Presence, 2015 Key Takeaways
Key Strategies
High Medium LowSource: FMI Analysis, 2016
Global Specialty Ingredients (M) Sdn. Bhd. is one of thepremium food ingredient manufacturers and distributors inMalaysia, and offers its products primarily to bakery, dairy,snacks, meat processing, beverages, biodiesel, vegetable oilsand fats, chemicals, and personal care product manufacturingcompanies
Vitamin A, C, D, E and mineral blends of GSI are some of themajor functional ingredient products used in the food andbeverage industry, for fortification of oils and fats and inpreparation of infant food
Company is focused towards showcasing its ingredients in Asia pacific region in order to strengthen its regional footprint
For promotion and awareness of its functional food ingredients in Asia Pacific region, Global Specialty Ingredients (M) Sdn. Bhd.participates in various food and food ingredient exhibitions such as India Food Exhibition 2016, Bangalore, India, Food Ingredients2016, New Delhi, India, Pro Food & Pack 2016, Colombo, Sri Lanka, PIPOC 2015 Kuala Lumpur, Malaysia etc.
Malaysia
India
Indonesia
©2015 Future Market Insights, All Rights Reserved173

Excellent Health Products Co., Ltd. (EHP) (1/2)
Source: Company Website
Headquarter
Jiangsu, China
Employees
~50
Key Management
Victor Wan
Established
2012
Excellent Health Products Co., Ltd (EHP) offers a broad spectrum of raw ingredients required innutritional supplements, pharmaceuticals industry and dietary supplements. Company also offersspecialized services related to research in health-based food products.
EHP exports over 90% of its products to foreign markets, and only 10% of its products are offered inthe Chinese market. Company exports its products to the Americas, Africa, Eastern Europe, WesternEurope, the Middle East, and Asia and Oceania region.
Company Description
Company Website
www.sino-excellent.com
Products
Excellent Health Products Co., Ltd.
Company Name
Vitamins Minerals ProbioticsOmega 3
Fatty Acids
Prebiotic & Dietary
FibreProtein Carotenoids
X X X X
Company Overview
©2015 Future Market Insights, All Rights Reserved174

Excellent Health Products Co., Ltd. (2/2)
Source: Company Website & FMI, 2016
Geographical Presence, 2015 Key Takeaways
Key Strategies
High Medium LowSource: FMI Analysis, 2016
Excellent Health Products Co., Ltd has wide product portfolio ofraw materials and products related to nutraceuticals, herbalextracts, biological products and dietary supplement products In its functional food ingredient range product range, EHP
offers 28 different varieties of vitamins, 7 varieties of naturalcarotenoids and Omega-3 fatty acids
Vitamins of EHP find application in the food industry, dietarysupplements, pharmaceutical and cosmetics. O
Company is primarily focused towards development and innovation of new products, as currently the company is emphasizing oningredients required in supplements, which is especially related to health care Carotenoids, Vitamin C and Omega-3 fatty acids are the three main ingredients on which currently EHP is focusing, as these
products witness higher demand for application in functional food product due to increasing health conscious consumers The reason behind greater emphasis on these ingredients is because of increasing ageing population in developing economies as
intake of these ingredients provide health benefits such as improving eyesight, minimizing risk of cataract, prevention of heart-related issues, cholesterol and other cardiovascular diseases
China
India
©2015 Future Market Insights, All Rights Reserved175

Competitive Landscape – By Product
Section 16
©2015 Future Market Insights, All Rights Reserved176

Competition Dashboard (1/2)
Key Players Nestlé S.A. PepsiCo, Inc. ConAgra Foods, Inc. Kellogg Company Yakult Honsha Co.,
Ltd.
Headquarter Vevey, Switzerland New York, U.S. Chicago, U.S. Michigan, U.S. Tokyo, Japan
Employees 3,35,000 2,63,000 33,000+ 29,790 2,872
Established 1905 1965 1971 1922 1955
Revenue US$ 928, 47.1 Mn US$ 63,056.0 Mn US$ 15,832 Mn US$ 13,525 Mn US$ 3075.6 Mn
Product TypeBeverages, Dairy
Products, Infant FoodFood & Beverages Food Food
Beverage & Dairy Products
Brands
Meritene, Boost, Modulen, Vitaflo,
Nesfluid, Isosource, Optisource
Quaker Oats, Gatorade, Tropicana
Aleia Side Meals, Ranch Style Beans,
Hunt’s, Sundrop Oils, Health choice Meals
Raisin Bran, All-Bran, Smart Start, Raisin
Wheat, Optivita
Yakult Ace, Chosei Tonyu
Kokusandaizu Shiyo, Yakult Nyusankin Soy, Gyutto Kenko, Pretio
Presence
North America North America North America North America North America
Latin America Latin America Latin America Latin America Latin America
Europe Europe Europe Europe Europe
Asia Pacific Asia Pacific Asia Pacific Asia Pacific Asia Pacific
Middle East & Africa Middle East & Africa Middle East & Africa Middle East & Africa
High Medium LowSource: FMI, 2016
©2015 Future Market Insights, All Rights Reserved177

Competition Dashboard (2/2)
Key Players Danone SAMeiji Holdings Co.,
Ltd.The Coca-Cola Co.
Tata Global Beverages Ltd.
General Mills, Inc.
Headquarter Paris, France Tokyo, Japan Georgia, U.S. Kolkata, India Minneapolis, U.S.
Employees 99,781 16,456 1,23,000 3,000 42,000
Established 1919 2009 1919 1962 1866
Revenue US$ 24,317.2 Mn US$ 9,705 Mn US$ 44,294 Mn US$ 1,275.3 Mn US$ 17,630 Mn
Product Type Dairy Products Dairy Products Beverage BeverageFood & Dairy
Products
Brands
Danonino, Oikos, Prostokvashino, Activia, Actimel
Meiji Probio Yogurt, Meiji Probio Yogurt
Drink
Powergrade, Fuze, Core Power,
Vitaminwater
Tata Water Plus, Tetley, Tata Gluco
Plus
Cheerios, Yoplait, Nature Valley
Presence
North America North America North America North America North America
Latin America Latin America Latin America Latin America
Europe Europe Europe Europe Europe
Asia Pacific Asia Pacific Asia Pacific Asia Pacific Asia Pacific
Middle East & Africa Middle East & Africa Middle East & Africa Middle East & Africa
Source: FMI, 2016 High Medium Low
©2015 Future Market Insights, All Rights Reserved178
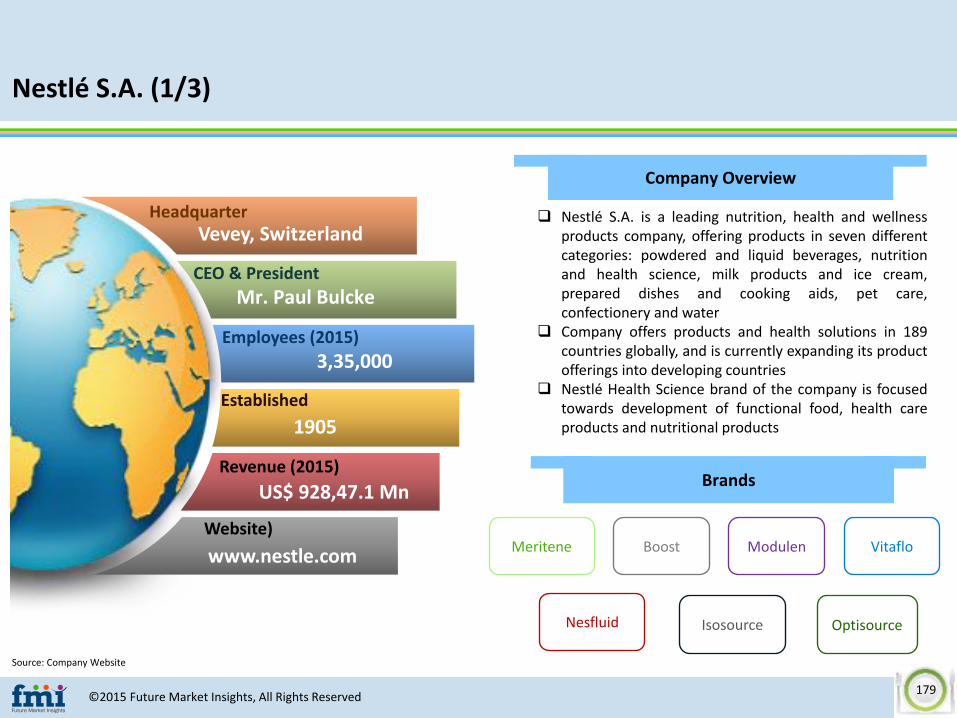
Nestlé S.A. (1/3)
Company Overview
Source: Company Website
Headquarter
Employees (2015)
CEO & President
Revenue (2015)
Vevey, Switzerland
www.nestle.com
1905
3,35,000
Mr. Paul Bulcke
Brands
Meritene ModulenBoost
Nesfluid Isosource
Nestlé S.A. is a leading nutrition, health and wellnessproducts company, offering products in seven differentcategories: powdered and liquid beverages, nutritionand health science, milk products and ice cream,prepared dishes and cooking aids, pet care,confectionery and water
Company offers products and health solutions in 189countries globally, and is currently expanding its productofferings into developing countries
Nestlé Health Science brand of the company is focusedtowards development of functional food, health careproducts and nutritional products
Website)
Established
US$ 928,47.1 Mn
Vitaflo
Optisource
©2015 Future Market Insights, All Rights Reserved179

Nestlé S.A. (2/3)
Key Developments
In 2015, Nestlé Malaysia launched Nestlé Omega Plus ready–to- drink UHT milk. This product is enriched with omega,aciticol, calcium and plant sterol and cholesterol levels inthe human body and alleviate risk of coronary heartdiseases.
In 2011, the company launched Nestlé ACTIPLUS yogurt forIndian consumers, developed from probiotics ingredient,which support healthy digestion and prevents constipation
Source: Company Website
Geographic Presence, 2015
High, Medium, Low
Key Strategy
Nestlé S.A. is inclined towards innovation in product development and primarily focuses on functional food products that are rich invitamins and minerals
In 2015, the company launched BOOST Calorie Smart – a next generation nutrition drink enriched with 25 vitamins and added minerals, andenriched with extra calcium and vitamin D, which helps to maintain bone health. This product was specially launched to target adults to helpthem to meet daily nutritional intake.
Company is focused towards manufacturing value-added food products in order to cater to the evolving demand for food productsthat include functional ingredients
In 2010, the company announced plans to invest US$ 500 Mn in its new business venture “Nestlé Health Science”. This business venture istotally focused towards development of those food products, ingredients and supplements, which help to prevent consumers fromcardiovascular diseases, cholesterol, obesity, diabetes, blood pressure and Alzheimer disease.
North America
Latin America
Middle East & Africa
Europe
Asia Pacific
©2015 Future Market Insights, All Rights Reserved180

Nestlé S.A. (3/3)
11 19.2 7 8.1
6.77
12.22
4.33 4.54
0
2
4
6
8
10
12
14
0
5
10
15
20
25
2012 (A) 2013 (A) 2014 (A) 2015 (A)
Operating Margin (%) Net Margin (%)
Operating and Net Margin, 2012–2015 (%)
Source: Company Website
Source: Company Website
Source: Company Website
Key Ratios (Based on Latest Filings)
December2012
December2013
December2014
December2015
Revenue (US$ Mn) 101,487.2 97,919.1 104,259.4 92,847.1
Operating Income (US$ Mn)
15,314.8 13,852.6 12,376.3 12,975.7
Net Income (US$ Mn) 11,664.2 10,616.3 16,406.4 9,480.7
Operating Margin % 15.1 14.1 11.9 14.0
Gross Margin % 47.6 47.9 48.2 49.6
Tax Rate % 25.6 26.1 32.7 28.0
Net Margin % 11.4 10.8 15.7 10.2
Return on Invested Capital %
13.1 11.9 16.7 10.7
Asset Turnover (Average)
0.7 0.7 0.7 0.6
21.6%
16.8%16.4%14.2%
13.0%
10.0%
8.0%Powdered & Liquid Beverages
Nutrition & Health Science
Milk Products & Ice cream
Prepared Dishes & Cooking Aid
Petcare
Confectionery
Water
Business segment
©2015 Future Market Insights, All Rights Reserved181

PepsiCo, Inc. (1/3)
Company Overview
Source: Company Website
Headquarter
Employees (2015)
CEO & President
Revenue (2015)
New York, U.S.
www.pepsico.com
1965
2,63,000
Ms. Indra K Nooyi
Brands
Quaker Oats Gatorade
PepsiCo. Inc. manufactures and markets foods, snacksand beverages under the following brands: Frito-Lay,Quaker Oats, Tropicana, Gatorade, Pepsi, Mountain Dewand many others
Quaker Oats, Gatorade and Tropicana are some of itsbrands which offer functional food products withvarious health benefits
Company offers breakfast cereals and snacks under itsbrand Quaker Oats and sports drinks and food productsunder brand The Gatorade Company, Inc.
Website)
Established
US$ 63,056 Mn
Tropicana
©2015 Future Market Insights, All Rights Reserved182

PepsiCo, Inc. (2/3)
Key Developments
In 2015, PepsiCo Inc. opened its first manufacturing plant ofQuaker Oats in China and offers a variety of productsincluding Quaker cereal powder drink, instant oats, mealsetc.
In 2015, the company launched fruit and vegetable juiceunder its new essentials range, which is enriched withvitamins and minerals and extra vitamin C and zinc.Tropicana Essential helps in maintaining a healthy immunesystem.
Source: Company Website
Geographic Presence, 2015
High, Medium, Low
Key Strategy
The company is focused on research & development and product innovation, and on setting up innovation centres with advancedtechnologies and equipment to drive revenue growth
In 2015, the company invested US$ 715 Mn in R&D to expand its product portfolio for food, drinks and snacks and launched various newproducts under its brand Quaker grains (Quaker Oats), fruits and vegetable juice (Tropicana), sports nutrition (Gatorade) and juices andsmoothies (Naked Juice) to cater to changing needs of health conscious consumers
In 2012, PepsiCo, Inc. opened its most integrated R&D centre in China to leverage new untapped opportunities with regard to food andbeverages, and also to accelerate its growth in markets in China and other Asian countries
North America
Latin America
Middle East & Africa
Europe
Asia Pacific
©2015 Future Market Insights, All Rights Reserved183

PepsiCo, Inc. (3/3)
13.9 14.6 14.4 13.2
9.4
10.1
9.7
8.6
7.5
8
8.5
9
9.5
10
10.5
12.5
13
13.5
14
14.5
15
2012 (A) 2013 (A) 2014 (A) 2015 (A)
Operating Margin (%) Net Margin (%)
Operating and Net Margin, 2012–2015 (%)
Source: Company Website
Source: Company Website
Source: Company Website
Key Ratios (Based on Latest Filings)
December2012
December2013
December2014
December2015
Revenue (US$ Mn) 65,492 66,415 66,683 63,056
Operating Income (US$ Mn)
9,112 9,705 9,581 8,353
Net Income (US$ Mn) 6,178 6,740 6,513 5,452
Operating Margin % 13.9 14.6 14.4 13.2
Gross Margin % 52.2 53.0 53.7 55.0
Tax Rate % 25.1 23.6 25.1 26.0
Net Margin % 9.4 10.1 9.7 8.6
Return on Invested Capital %
13.8 14.0 14.2 13.3
Asset Turnover (Average)
0.8 0.8 0.9 0.9
53.0%47.0%
Food
Beverages
Business segment
©2015 Future Market Insights, All Rights Reserved184

ConAgra Foods, Inc. (1/3)
Company Overview
Source: Company Website
Headquarter
Employees (2015)
CEO & President
Revenue (2015)
Chicago, U.S.
www.conagrafoods.com
1971
33,000+
Mr. Sean Connolly
Brands
Health choice Meals
Hunt’sRanch Style
Beans
Sundrop Oils
Aleia Side Meals
ConAgro Foods, Inc. offers processed and packaged foodproducts and operates in both the consumer as well asthe commercial food segment
Company offers a wide range of products includingfrozen food, snacks, heart health food, dietary food,nutritional bars, frozen meals and nutritional as well ashealthy living food
Currently, the company is emphasizing on nutrition andhealth food, and a vast majority of new productslaunched by the company over the past fie years fallunder the health and nutrition category
Website)
Established
US$ 15,832 Mn
©2015 Future Market Insights, All Rights Reserved185
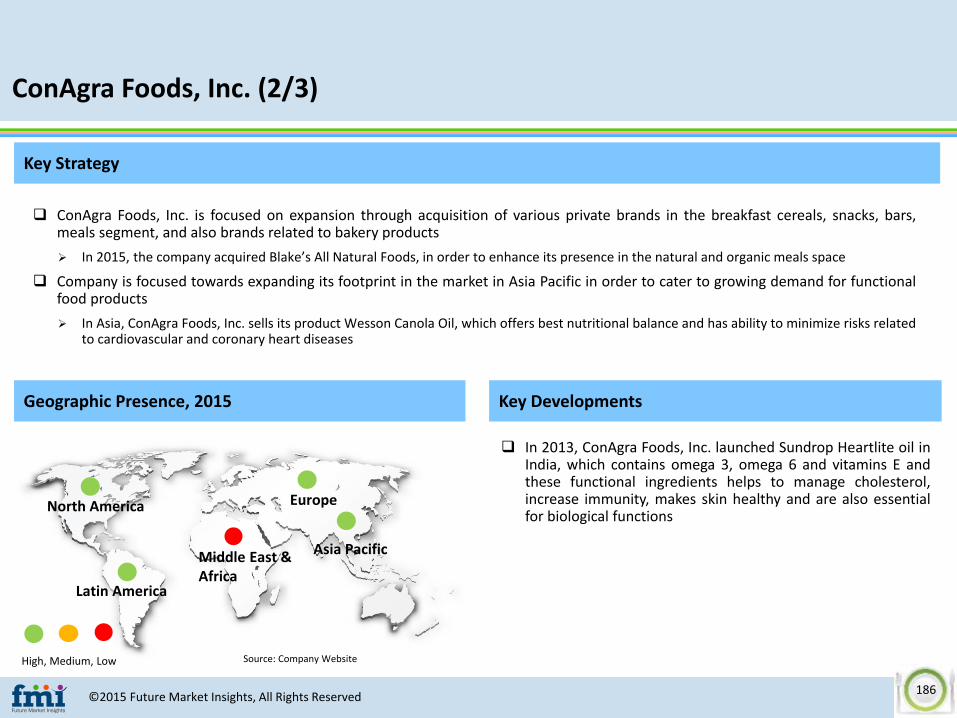
ConAgra Foods, Inc. (2/3)
Key Developments
In 2013, ConAgra Foods, Inc. launched Sundrop Heartlite oil inIndia, which contains omega 3, omega 6 and vitamins E andthese functional ingredients helps to manage cholesterol,increase immunity, makes skin healthy and are also essentialfor biological functions
Source: Company Website
Geographic Presence, 2015
High, Medium, Low
Key Strategy
ConAgra Foods, Inc. is focused on expansion through acquisition of various private brands in the breakfast cereals, snacks, bars,meals segment, and also brands related to bakery products
In 2015, the company acquired Blake’s All Natural Foods, in order to enhance its presence in the natural and organic meals space
Company is focused towards expanding its footprint in the market in Asia Pacific in order to cater to growing demand for functionalfood products
In Asia, ConAgra Foods, Inc. sells its product Wesson Canola Oil, which offers best nutritional balance and has ability to minimize risks relatedto cardiovascular and coronary heart diseases
North America
Latin America
Middle East & Africa
Europe
Asia Pacific
©2015 Future Market Insights, All Rights Reserved186
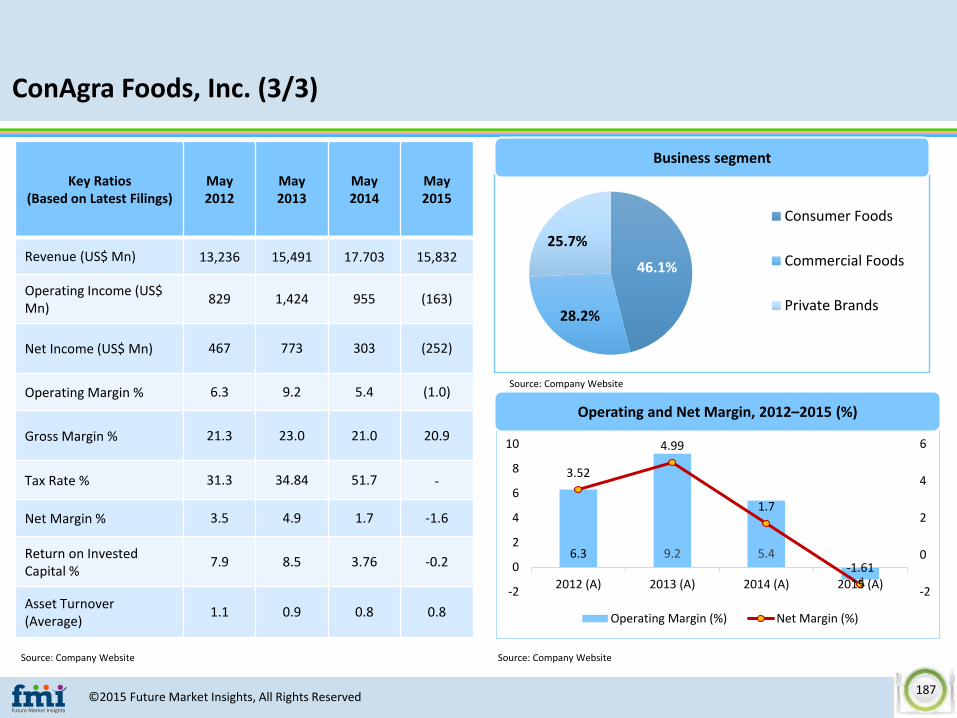
ConAgra Foods, Inc. (3/3)
6.3 9.2 5.4
-1
3.52
4.99
1.7
-1.61
-2
0
2
4
6
-2
0
2
4
6
8
10
2012 (A) 2013 (A) 2014 (A) 2015 (A)
Operating Margin (%) Net Margin (%)
Operating and Net Margin, 2012–2015 (%)
Source: Company Website
Source: Company Website
Source: Company Website
Key Ratios (Based on Latest Filings)
May2012
May2013
May2014
May2015
Revenue (US$ Mn) 13,236 15,491 17.703 15,832
Operating Income (US$ Mn)
829 1,424 955 (163)
Net Income (US$ Mn) 467 773 303 (252)
Operating Margin % 6.3 9.2 5.4 (1.0)
Gross Margin % 21.3 23.0 21.0 20.9
Tax Rate % 31.3 34.84 51.7 -
Net Margin % 3.5 4.9 1.7 -1.6
Return on Invested Capital %
7.9 8.5 3.76 -0.2
Asset Turnover (Average)
1.1 0.9 0.8 0.8
46.1%
28.2%
25.7%
Consumer Foods
Commercial Foods
Private Brands
Business segment
©2015 Future Market Insights, All Rights Reserved187
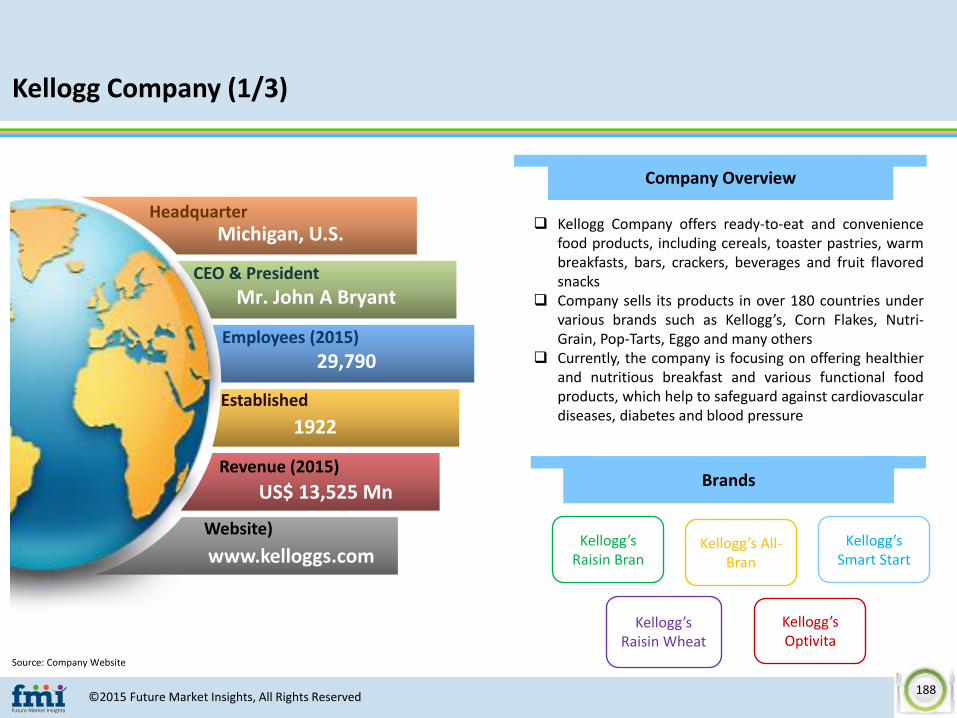
Kellogg Company (1/3)
Company Overview
Source: Company Website
Headquarter
Employees (2015)
CEO & President
Revenue (2015)
Michigan, U.S.
www.kelloggs.com
1922
29,790
Mr. John A Bryant
Brands
Kellogg’s Raisin Bran
Kellogg’s Optivita
Kellogg’s Smart Start
Kellogg’s Raisin Wheat
Kellogg Company offers ready-to-eat and conveniencefood products, including cereals, toaster pastries, warmbreakfasts, bars, crackers, beverages and fruit flavoredsnacks
Company sells its products in over 180 countries undervarious brands such as Kellogg’s, Corn Flakes, Nutri-Grain, Pop-Tarts, Eggo and many others
Currently, the company is focusing on offering healthierand nutritious breakfast and various functional foodproducts, which help to safeguard against cardiovasculardiseases, diabetes and blood pressure
Website)
Established
US$ 13,525 Mn
Kellogg’s All-Bran
©2015 Future Market Insights, All Rights Reserved188
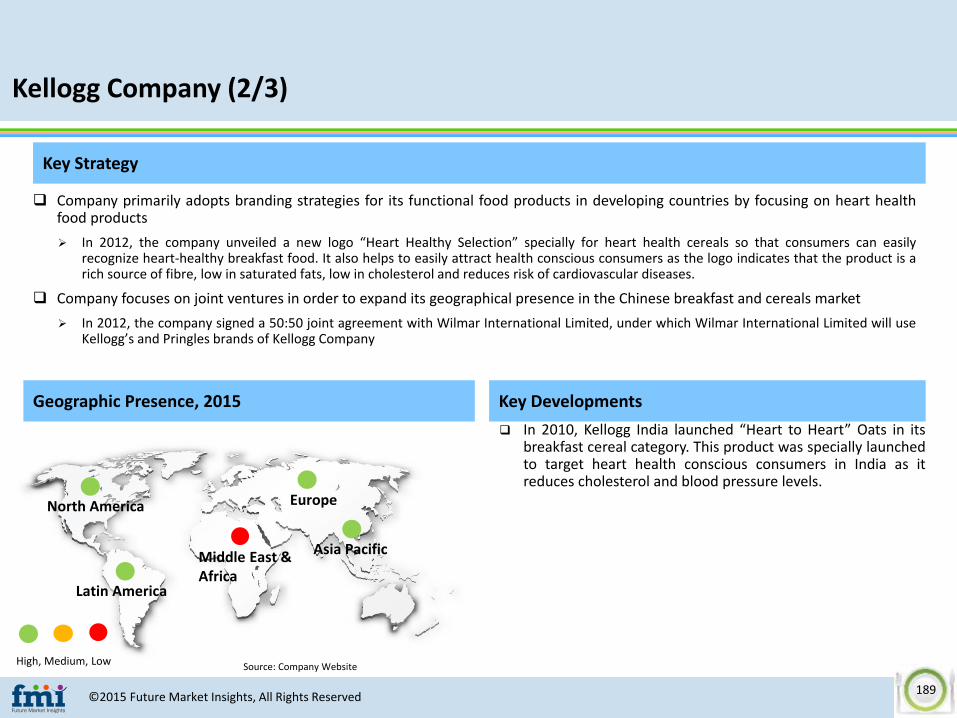
Kellogg Company (2/3)
Key Developments
In 2010, Kellogg India launched “Heart to Heart” Oats in itsbreakfast cereal category. This product was specially launchedto target heart health conscious consumers in India as itreduces cholesterol and blood pressure levels.
Source: Company Website
Geographic Presence, 2015
High, Medium, Low
Key Strategy
Company primarily adopts branding strategies for its functional food products in developing countries by focusing on heart healthfood products
In 2012, the company unveiled a new logo “Heart Healthy Selection” specially for heart health cereals so that consumers can easilyrecognize heart-healthy breakfast food. It also helps to easily attract health conscious consumers as the logo indicates that the product is arich source of fibre, low in saturated fats, low in cholesterol and reduces risk of cardiovascular diseases.
Company focuses on joint ventures in order to expand its geographical presence in the Chinese breakfast and cereals market
In 2012, the company signed a 50:50 joint agreement with Wilmar International Limited, under which Wilmar International Limited will useKellogg’s and Pringles brands of Kellogg Company
North America
Latin America
Middle East & Africa
Europe
Asia Pacific
©2015 Future Market Insights, All Rights Reserved189

Kellogg Company (3/3)
11 19.2 7 8.1
6.77
12.22
4.33 4.54
0
2
4
6
8
10
12
14
0
2
4
6
8
10
12
14
16
18
20
2012 (A) 2013 (A) 2014 (A) 2015 (A)
Operating Margin (%) Net Margin (%)
Operating and Net Margin, 2012–2015 (%)
Source: Company Website Source: Company Website
Key Ratios (Based on Latest Filings)
December2012
December2013
December2014
December2015
Revenue (US$ Mn) 14,197 14,792 14,580 13,525
Operating Income (US$ Mn)
1,562 2,837 1,024 1,091
Net Income (US$ Mn) 961 1,807 632 614
Operating Margin % 11.0 19.2 7.0 8.1
Gross Margin % 38.3 41.3 34.7 34.6
Tax Rate % 27.4 30.3 22.5 20.5
Net Margin % 6.7 12.2 4.3 4.5
Return on Invested Capital %
12.7 18.5 7.5 7.9
Asset Turnover (Average)
1.0 0.9 0.9 0.8
©2015 Future Market Insights, All Rights Reserved190

Yakult Honsha Co., Ltd. (1/3)
Company Overview
Source: Company Website
Headquarter
Employees (2015)
CEO & President
Revenue (2015)
Tokyo, Japan
www.yakult.co.jp
1955
2,872
Mr. Sumiya Hori
Brands
Yakult AceYakult
Nyusankin Soy
Chosei TonyuKokusandaizu
Shiyo
Gyutto Kenko
Pretio
Yakult Honsha Co., Ltd. operates through three differentbusiness sectors: food and beverage products,cosmetics and pharmaceuticals
Company offers functional food products in its food andbeverage product segment, which includes dairyproducts, noodles, juices and soft drinks, and serves 33countries globally
Yakult Honsha Co., Ltd. is the pioneer in probiotics andits ingredients find wide application in dairy productsand also in products that enable maintenance of health
Website)
Established
US$ 3,075.6 Mn
©2015 Future Market Insights, All Rights Reserved191

Yakult Honsha Co., Ltd. (2/3)
Key Developments
In 2015, company set up its production plant of dairyproducts in China to leverage the untapped opportunitiesarising from increasing awareness regarding personal healthand benefits probiotics offer.
In 2014, Yakult Honsha Co., Ltd. launched its secondmanufacturing plant for producing fermented milk productsin Indonesia to expand its business in the country
Source: Company Website
Geographic Presence, 2015
High, Medium, Low
Key Strategy
The company lays strong emphasis on R&D initiatives, especially on research related to probiotics and its uses
In 2015, Yakult Honsha Co., Ltd. launched ferment milk highly enriched with Lactobacillus casei, which helps to reduce risk of diseasesrelated to constipation and digestion
Yakult Honsha Co., Ltd. is planning to enter into the market in Southeast Asia and Middle East and to expand its consumer base inother countries of the world
By the end of 2016, the company plans to start production and sales in Myanmar, with sales offices in Dubai, as these countries representsignificantly high market potential, and also have been achieved considerable economic growth in the recent past
North America
Latin America
Europe
Asia Pacific
©2015 Future Market Insights, All Rights Reserved192

Yakult Honsha Co., Ltd. (3/3)
6.7 7.2 9.1 9.5
4.2
5.1
6.4
6.8
0
1
2
3
4
5
6
7
8
0
1
2
3
4
5
6
7
8
9
10
2012 (A) 2013 (A) 2014 (A) 2015 (A)
Operating Margin (%) Net Margin (%)
Source: Company Website Source: Company Website
Key Ratios (Based on Latest Filings)
March2012
March 2013
March 2014
March 2015
Revenue (US$ Mn) 3,798.5 3,386.5 3,407.1 3,075.6
Operating Income (US$ Mn)
252.9 244.7 311.4 291.6
Net Income (US$ Mn) 211.2 206.1 263.2 255.1
Operating Margin % 6.7 7.2 9.1 9.5
Gross Margin % 54.4 53.8 55.4 55.2
Tax Rate % 3.0 30.4 31.4 32.3
Net Margin % 4.2 5.1 6.4 6.8
Return on Invested Capital %
4.2 4.9 5.9 5.6
Asset Turnover (Average)
0.8 0.8 0.7 0.6
Operating and Net Margin, 2012–2015 (%)
©2015 Future Market Insights, All Rights Reserved193

Danone SA (1/3)
Company Overview
Source: Company Website
Headquarter
Employees (2015)
CEO & President
Revenue (2015)
Paris, France
www.danone.com
1919
99,781
Mr. Emmanuel Faber
Brands
Activia
OikosDanonino
Prostokvashino
Danone SA operates in the food processing sector andoffers products through divisions such as Fresh DairyProducts, Waters, Early Life Nutrition and MedicalNutrition
Company is operating its business across 120 countriesand consumers in European and Asian markets are themajor source of its sales revenue
Through its fresh dairy product segment, Danaone SAoffers probiotic drinks and functional ingredient-basedproducts including milk, yogurt, cream, infant food andvarious other dairy products. The company realizesaround 50% of its total revenues from its fresh dairyproduct segment.
Website)
Established
US$ 24,317.2 Mn
Actimel
©2015 Future Market Insights, All Rights Reserved194
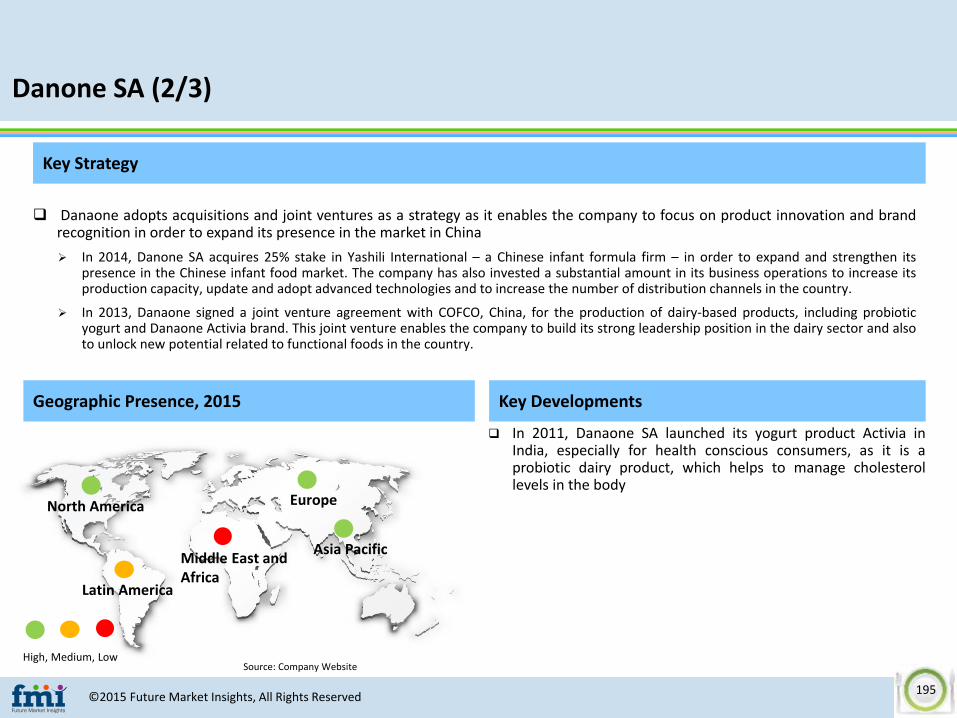
Danone SA (2/3)
Key Developments
In 2011, Danaone SA launched its yogurt product Activia inIndia, especially for health conscious consumers, as it is aprobiotic dairy product, which helps to manage cholesterollevels in the body
Source: Company Website
Geographic Presence, 2015
High, Medium, Low
Key Strategy
Danaone adopts acquisitions and joint ventures as a strategy as it enables the company to focus on product innovation and brandrecognition in order to expand its presence in the market in China
In 2014, Danone SA acquires 25% stake in Yashili International – a Chinese infant formula firm – in order to expand and strengthen itspresence in the Chinese infant food market. The company has also invested a substantial amount in its business operations to increase itsproduction capacity, update and adopt advanced technologies and to increase the number of distribution channels in the country.
In 2013, Danaone signed a joint venture agreement with COFCO, China, for the production of dairy-based products, including probioticyogurt and Danaone Activia brand. This joint venture enables the company to build its strong leadership position in the dairy sector and alsoto unlock new potential related to functional foods in the country.
North America
Latin America
Europe
Asia PacificMiddle East and Africa
©2015 Future Market Insights, All Rights Reserved195

Danone SA (3/3)
13.2 10 10.2 9.9
8.01
6.6
5.2 5.7
0
2
4
6
8
10
0
2
4
6
8
10
12
14
2012 (A) 2013 (A) 2014 (A) 2015 (A)
Operating Margin (%) Net Margin (%)
Operating and Net Margin, 2012–2015 (%)
Source: Company Website
Source: Company Website
Source: Company Website
49.3%
22.3%
21.3%
7.1% Fresh dairy products
Waters
Early life nutrition
Medical nutrition
Business segment
Key Ratios (Based on Latest Filings)
December2012
December2013
December2014
December2015
Revenue (US$ Mn) 27,834.7 27,296.2 29,076.4 24,317.2
Operating Income (US$ Mn)
3,663.9 2,727.31 2,957.9 2,397.8
Net Income (US$ Mn) 2,230 1,822.4 1,538.8 1,390.9
Operating Margin % 13.2 10.0 10.2 9.9
Gross Margin % 50.1 48.5 47.7 50.0
Tax Rate % 29.1 32.3 32.5 32.5
Net Margin % 8.01 6.6 5.2 5.7
Return on Invested Capital %
13.7 13.5 6.2 6.4
Asset Turnover (Average)
0.7 0.7 0.6 0.7
©2015 Future Market Insights, All Rights Reserved196

Meiji Holdings Co., Ltd. (1/3)
Company Overview
Source: Company Website
Headquarter
Employees (2015)
CEO & President
Revenue (2015)
Tokyo, Japan
www.meiji.com
2009
16,456
Mr. Masahiko Matsuo
Brands
Meiji Probio Yogurt Drink
Meiji Probio Yogurt
Meiji Holdings Co., Ltd. offers food and pharmaceuticalproducts. In its group, the company operates twocompanies: Meiji Co., Ltd. (Food Business) and MeijiSeika Pharma Co., Ltd., (Pharmaceutical Business).
Through its food segment, the company offers dairy,milk, ice cream, yogurt, confectionery, beverage andhealth food products
Majority of the company’s food products are sold inmarkets in Asia Pacific and the U.S. Over 85% of itsrevenue comes from its food segment business.
Website)
Established
US$ 9,705 Mn
©2015 Future Market Insights, All Rights Reserved197

Meiji Holdings Co., Ltd. (2/3)
Key Developments
In 2011, Meiji Holdings Co., Ltd. Set up its dairy manufacturingplant in the high potential dairy market of China to offer milk,yogurt and other dairy-based products, and to enhanceconsumer base
Source: Company Website
Geographic Presence, 2015
High, Medium, Low
Key Strategy
Meiji Holdings Co., Ltd. focuses on broadening its product portfolio of dairy products to meet the robust demand for functional foodproducts from the Asia Pacific market
In 2015, the company launched two new functional yogurts containing lactobacillus: Meiji Probio Yogurt PA-3 and Meiji Probio Yogurt PA-3Drink. These products were specially launched to target consumers who are more concerned towards purine intake.
North America Europe
Asia PacificMiddle East and Africa
©2015 Future Market Insights, All Rights Reserved198

Meiji Holdings Co., Ltd. (3/3)
1.8 2.3 3.2 4.4
0.6
1.41.6
2.6
0
0.5
1
1.5
2
2.5
3
0
1
2
3
4
5
2012 (A) 2013 (A) 2014 (A) 2015 (A)
Operating Margin (%) Net Margin (%)
Operating and Net Margin, 2012–2015 (%)
Source: Company Website
Source: Company Website
Source: Company Website
87.8%
12.2%Food Segment
PharmaceuticalSegment
Business segmentKey Ratios (Based on Latest Filings)
March2012
March2013
March2014
March2015
Revenue (US$ Mn) 13,481.2 11,952.1 11,165.8 9,705.0
Operating Income (US$ Mn)
245.4 274.3 354.9 430.8
Net Income (US$ Mn) 85.6 178.7 184.7 263.0
Operating Margin % 1.8 2.3 3.2 4.4
Gross Margin % 33.4 34.0 34.3 34.7
Tax Rate % 51.6 33.1 43.6 35.3
Net Margin % 0.6 1.4 1.6 2.6
Return on Invested Capital %
1.6 3.4 3.8 5.6
Asset Turnover (Average)
1.5 1.4 1.4 1.4
©2015 Future Market Insights, All Rights Reserved199

The Coca-Cola Co. (1/3)
Company Overview
Source: Company Website
Headquarter
Employees (2015)
CEO & President
Revenue (2015)
Georgia, U.S.
www.coca-colacompany.com
1919
123,000
Mr. Muhtar Kent
Brands
Core Power
Powergrade
The Coca-Cola Co. is one of the leading beveragecompanies, offering a robust product portfolio of over500 brands in global markets
Currently, the company serves beverages in more than200 countries and its beverages are available in differentvarieties such as reduced calorie value, low or no-calorieoptions
Brands of beverages include Diet Coke, Sprite, Coca-ColaZero, Minute Maid, Georgia etc., and in its functionalbeverage product portfolio, the company offers brandssuch as Powergrade, Corepower, Vitamin water,Oadwalla and Fuze
Website)
Established
US$ 44,294 Mn
Fuze
Vitaminwater
©2015 Future Market Insights, All Rights Reserved200
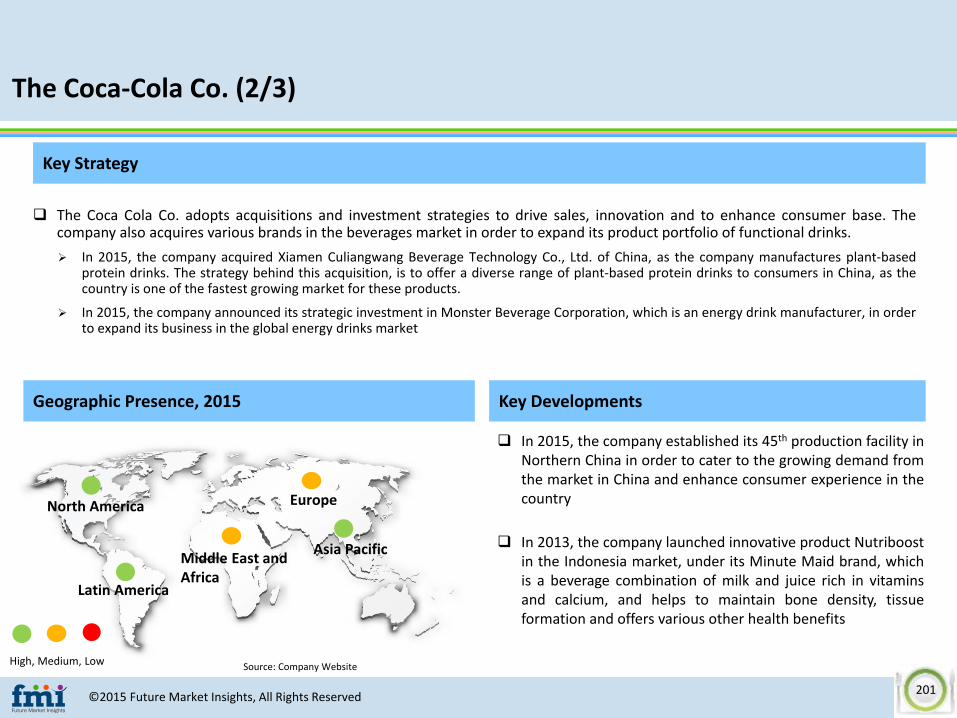
The Coca-Cola Co. (2/3)
Key Developments
In 2015, the company established its 45th production facility inNorthern China in order to cater to the growing demand fromthe market in China and enhance consumer experience in thecountry
In 2013, the company launched innovative product Nutriboostin the Indonesia market, under its Minute Maid brand, whichis a beverage combination of milk and juice rich in vitaminsand calcium, and helps to maintain bone density, tissueformation and offers various other health benefits
Source: Company Website
Geographic Presence, 2015
High, Medium, Low
Key Strategy
The Coca Cola Co. adopts acquisitions and investment strategies to drive sales, innovation and to enhance consumer base. Thecompany also acquires various brands in the beverages market in order to expand its product portfolio of functional drinks.
In 2015, the company acquired Xiamen Culiangwang Beverage Technology Co., Ltd. of China, as the company manufactures plant-basedprotein drinks. The strategy behind this acquisition, is to offer a diverse range of plant-based protein drinks to consumers in China, as thecountry is one of the fastest growing market for these products.
In 2015, the company announced its strategic investment in Monster Beverage Corporation, which is an energy drink manufacturer, in orderto expand its business in the global energy drinks market
North America Europe
Asia PacificMiddle East and Africa
Latin America
©2015 Future Market Insights, All Rights Reserved201

The Coca-Cola Co. (3/3)
22.4 21.8 21.1 19.7
18.718.3
15.4
16.6
0
2
4
6
8
10
12
14
16
18
20
18
18.5
19
19.5
20
20.5
21
21.5
22
22.5
23
2012 (A) 2013 (A) 2014 (A) 2015 (A)
Operating Margin (%) Net Margin (%)
Source: Company Website Source: Company Website
Operating and Net Margin, 2012–2015 (%)Key Ratios
(Based on Latest Filings)
December
2012December
2013December
2014December
2015
Revenue (US$ Mn) 48,017 46,854 45,998 44,294
Operating Income (US$ Mn)
10,779 10,228 9,708 8,728
Net Income (US$ Mn) 9,019 8,584 7,098 7,351
Operating Margin % 22.4 21.8 21.1 19.7
Gross Margin % 60.3 60.7 61.1 60.5
Tax Rate % 23.0 24.8 23.6 23.3
Net Margin % 18.7 18.3 15.4 16.6
Return on Invested Capital %
4.2 12.5 9.8 10.6
Asset Turnover (Average)
0.5 0.5 0.5 0.4
©2015 Future Market Insights, All Rights Reserved202

Tata Global Beverages Ltd. (1/3)
Company Overview
Source: Company Website
Headquarter
Employees (2015)
CEO & President
Revenue (2015)
Kolkata, India
www.tataglobalbeverages.com
1962
3,000
Mr. Ajoy Kumar Misra
Brands
Tata Gluco Plus
Tata Water Plus
Tata Global Beverages Ltd. operates through threebeverage segments: tea, coffee and water. Currently, itsproduct portfolio comprises Tata Tea, Tetley, Vitax,Himalaya, Grand Coffee and other international brandsof tea and coffee.
Company has brand presence in 40 countries andmajority of company’s revenue is generated frommarkets in Europe and Asia Pacific
Tata Global Beverages Ltd. is a leading tea company inthe world, and its tea business accounts 45% of its totalrevenue
Website)
Established
US$ 1,275.3 Mn
Tetley
©2015 Future Market Insights, All Rights Reserved203

Tata Global Beverages Ltd. (2/3)
Key Developments
In April 2016, Tata Global Beverages Ltd. brand launched threefunctional tea products: Tetley Super Green Tea Heart forhealthy heart, Tetley Super Green Tea Detox for detoxingsupplement selenium and Tetley Super Green Tea Beauty forhealthy complexion
In 2012, the company formed a 50:50 joint venture withPepsiCo India to launch nutrient water- Tata Water Plus. Theproduct is available in two different variants including Zincand Chromium, and offers health benefits such asstrengthening immune system and improving overall health.
Source: Company Website
Geographic Presence, 2015
High, Medium, Low
Key Strategy
In order to cater to increasing demand for beverages enriched with vitamin and nutrients, the company launched fortified drinks,following in-depth research and use of advanced technological for research
In 2013, Tata Global Beverages Ltd., through a joint venture with Tornante Company, launched innovative fortified drink – Activate – whichis based on cap-dosing technology
North America Europe
Asia PacificMiddle East and Africa
©2015 Future Market Insights, All Rights Reserved204

Tata Global Beverages Ltd. (3/3)
7.3 9 9.1 6.2
5.3 5
6.2
3.1
0
1
2
3
4
5
6
7
0
2
4
6
8
10
2012 (A) 2013 (A) 2014 (A) 2015 (A)
Operating Margin (%) Net Margin (%)
Operating and Net Margin, 2012–2015 (%)
Source: Company Website
Source: Company Website
Source: Company Website
74.0%
25.0%
1.0%
Tea
Coffee
Other
Business segmentKey Ratios (Based on Latest Filings)
December
2012December
2013December
2014December
2015
Revenue (US$ Mn) 1,291.4 1,344.9 1,292.5 1,275.3
Operating Income (US$ Mn)
94 121.6 118 79.6
Net Income (US$ Mn) 68.3 68.2 80.2 39.5
Operating Margin % 7.3 9.0 9.1 6.2
Gross Margin % 45.7 50.9 51.0 51.4
Tax Rate % 24.7 25.7 26.1 43.1
Net Margin % 5.3 5.0 6.2 3.1
Return on Invested Capital %
8.3 7.9 9.0 4.3
Asset Turnover (Average)
0.83 0.86 0.83 0.82
©2015 Future Market Insights, All Rights Reserved205

General Mills, Inc. (1/3)
Company Overview
Source: Company Website
Headquarter
Employees (2015)
CEO & President
Revenue (2015)
Minneapolis, U.S.
www.generalmills.com
1866
42,000
Mr. Kendall J Powell
Brands
Nature Valley
Cheerios
General Mills, Inc. operates in the business ofmanufacturing and marketing of consumer food productsand sells its products in over 100 countries globally
Product portfolio of the company includes meals, cereals,snacks, baking products, yogurt and many others
Company offers an extensive range of functional foodproducts, targeting consumes seeking preventivemeasures related to cardiovascular diseases, cognitivefunction, healthy cholesterol levels, weight managementetc.
Website)
Established
US$ 17,630 Mn
Yoplait
©2015 Future Market Insights, All Rights Reserved206

General Mills, Inc. (2/3)
Key Developments
In 2015, General Mills, Inc. launched its brand Yoplait Yogurtin China, as yogurt is one of the most preferred dairy productsamong Chinese consumers due to various health benefits
In 2014, Cheerios launched two new breakfast cerealproducts: Cheerios Protein Oats & Honey and CheeriosProtein Honey & Cinnamon. These products are enriched withvitamins, minerals and proteins, which helps to maintainhealthy cholesterol levels and reduce risk of heart diseases.
Source: Company Website
Geographic Presence, 2015
High, Medium, Low
Key Strategy
General Mills, Inc. offers new and innovative product, targeting middle-class consumers in emerging market of China, India andIndonesia
In 2014, the company established its innovation centre in China, which focuses on development of high-quality products including yogurt,premium ice cream, snacks, cereals, convenient meals and many other products
In 2014, the company announced plans to expand its business into various other cities in China to consistently meet demand for associatedproducts among consumers in the country
North America Europe
Asia Pacific
Latin America
©2015 Future Market Insights, All Rights Reserved207

General Mills, Inc. (3/3)
15.4 16 16.5 11.8
9.410.4 10.1
6.9
0
2
4
6
8
10
12
0
5
10
15
20
2012 (A) 2013 (A) 2014 (A) 2015 (A)
Operating Margin (%) Net Margin (%)
Operating and Net Margin, 2012–2015 (%)
Source: Company Website
Source: Company Website
Source: Company Website
19.2%
16.7%15.9%
15.7%
10.6%
10.6%
5.3% 4.4% 1.5% Snacks
Yogurt
Convenient Sales
Cereal
Dough
Baking mies and ingredients
Vegetables
Super-premium ice cream
Other
Business segmentKey Ratios
(Based on Latest Filings)May2012
May 2013
May 2014
May 2015
Revenue (US$ Mn) 16,658 17,774 17,909 17,630
Operating Income (US$ Mn)
2,562 2,852 2,957 2,077
Net Income (US$ Mn) 1,567 1,855 1,824 1,221
Operating Margin % 15.4 16.0 16.5 11.8
Gross Margin % 36.3 36.1 35.6 33.7
Tax Rate % 32.1 29.2 33.2 33.3
Net Margin % 9.4 10.4 10.1 6.9
Return on Invested Capital %
13.3 14.6 13.5 9.6
Asset Turnover (Average)
0.84 0.81 0.78 0.78
©2015 Future Market Insights, All Rights Reserved208

To know more about us, please visit our website:
www.futuremarketinsights.com
For sales queries or new topics email us on:
For other queries contact:
Hari. T (Sr. Manager - Global Business Development)
Future Market Insights: 3rd Floor,207 Regent Street, London W1B 3HH
T: +44 20 7692 8790 | D: +44 20 3287 4268Email: [email protected]
©2015 Future Market Insights, All Rights Reserved209
Top Related
Copyright © 2022 FDOKUMEN

