


![[Presentation Title] - United Benefit Advisors](https://static.fdokumen.com/doc/165x107/631fddf59353b08ff5016551/presentation-title-united-benefit-advisors.jpg)


Bahasa
Halaman
Hukum

Food and Chemical Toxicology 50 (2012) S710–S723
Contents lists available at ScienceDirect
Food and Chemical Toxicology
journal homepage: www.elsevier .com/locate/ foodchemtox
Application of the BRAFO tiered approach for benefit–risk assessment to casestudies on dietary interventions
Hans Verhagen a,h, Rikke Andersen b, Jean-Michel Antoine c, Paul Finglas d, Jeljer Hoekstra a,Alwine Kardinaal e, Hervé Nordmann f, Gülden Pekcan g, Kristina Pentieva h, Tom A. Sanders i,Henk van den Berg j, Henk van Kranen a, Alessandro Chiodini k,⇑a National Institute for Public Health and the Environment (RIVM), 3720 Bilthoven, The Netherlandsb Technical University of Denmark, Department of Nutrition, Mørkhøj Bygade 19, 2860 Soborg, Denmarkc Danone, Route Départementale 128, 91767 Palaiseau Cedex, Franced Institute of Food Research, Norwich Research Park, Colney, NR4 7UA, Norwic, UKe Nutrition and Food Research Institute (TNO), Utrechtseweg 48, P.O. Box 360, Zeist, The Netherlandsf Ajinomoto Europe, En Crochet 1, Apples, Switzerlandg Hacettepe University, Department of Nutrition and Dietetics, School of Health Technology, Sihhiye 06100, Ankara, Turkeyh University of Ulster, Cromore Road, Coleraine BT52 1SA, UKi King’s College London, Franklin-Wilkins Building, 150 Stamford St, SE1 London, UKj Netherlands Nutrition Centre, Eisenhowerlaan, 108, 2508 Den Haag, The Netherlandsk ILSI Europe, Avenue E. Mounier 83, Box 6, 1200 Brussels, Belgium
a r t i c l e i n f o
Article history:Received 12 February 2011Accepted 23 June 2011Available online 7 July 2011
Keywords:BRAFOBenefit–risk assessmentTiered approachDietary interventionsFolic acidSAFA
0278-6915/$ - see front matter � 2011 ILSI Europe. Pdoi:10.1016/j.fct.2011.06.068
⇑ Corresponding author. Address: ILSI Europe a.i.sBox 6 1200 Brussels, Belgium. Tel.: +32 (0) 27710014
E-mail address: [email protected].
a b s t r a c t
The respective examples, described in this paper, illustrate how the BRAFO-tiered approach, on benefit–risk assessment, can be tested on a wide range of case studies. Various results were provided, rangingfrom a quick stop as the result of non-genuine benefit–risk questions to continuation through the tiersinto deterministic/probabilistic calculations. The paper illustrates the assessment of benefits and risksassociated with dietary interventions. The BRAFO tiered approach is tested with five case studies. In eachinstance, the benefit–risk approach is tested on the basis of existing evaluations for the individual effectsdone by others; no new risk or benefit evaluations were made. The following case studies were thor-oughly analysed: an example of food fortification, folic acid fortification of flour, macronutrient replace-ment/food substitution; the isocaloric replacement of saturated fatty acids with carbohydrates; thereplacement of saturated fatty acids with monounsaturated fatty acids; the replacement of sugar-sweet-ened beverages containing mono- and disaccharides with low calorie sweeteners and an example of addi-tion of specific ingredients to food: chlorination of drinking water.
� 2011 ILSI Europe. Published by Elsevier Ltd. All rights reserved.
1. Introduction
Benefit–risk analysis is the comparison of the risk of a situationto its related benefits and comprises a constellation of methods,drawn from many disciplines, and addresses the question ofwhether a risk is acceptable. Over the past years the benefit–riskanalysis in relation to foods and food ingredients has gained muchattention, in Europe but also worldwide. The debate focuses mainlyon how and when to conduct such analysis. So on the one handfood contains necessary and beneficial ingredients, whereas onthe other hand it can also contain potentially adverse ingredients.The issue is that the beneficial and adverse potential can be in the
ublished by Elsevier Ltd. All rights
.b.l., Avenue E. Mounier 83,; fax: +32 (0) 27620044.
same food or even in the same ingredient. The approaches and pol-icies followed and measures taken to guarantee food safety maylead to suboptimal/too low levels or absence of ingredients fromthe perspective of benefits. Not allowing food benefits to occur inorder to guarantee food safety is a risk management decisionequally well as accepting some risk in order to achieve more ben-efits. Any choice is a choice.
As such, benefit–risk assessment (BRA) is a new area in the areaof food and nutrition. It envisages comparing both risks and bene-fits of foods and food ingredients in one currency, thereby allowingfor a qualitative and quantitative comparison of adverse and ben-eficial effects. The benefit–risk assessment can then be reportedinto policy makers to allow them to make a benefit–risk manage-ment decision.
This scientific area has only very recently been entered. Nowthat health risks are essentially under control, the next step can
reserved.
H. Verhagen et al. / Food and Chemical Toxicology 50 (2012) S710–S723 S711
be made: balancing benefits and risks into an overall assessment.BRA can be done on a qualitative basis. By adding value to benefitsand risks more informed policy decisions could be made. Quantita-tive BRA can be done on an incidence basis, or by applying weight-ing factors to the incidences such as by using QALY’s (QualityAdjusted Life Year) or DALY’s (Disability Adjusted Life Year) or evenEuro’s. In Europe, several projects are exploring this new area suchas EFSA (European Food Safety Authority) (http://www.efsa.euro-pa.eu/EFSA/efsa_locale-1178620753812_1178620819696.htm),BRAFO (http://europe.ilsi.org/activities/ecprojects/BRAFO/), QALI-BRA (http://www.qalibra.eu/), and BEPRARIBEAN (http://en.opas-net.org/w/Bepraribean).
The aim of the European Funded Project BRAFO (Benefit RiskAnalysis of Foods) project is to develop a framework that allowsquantitative comparison of human health risks and benefits offoods and food compounds based on a common scale of measure-ment. This will be based on the evaluation of changes using a sys-tem that allows weighting of data quality and severity of effect,with quantification by e.g. QALY or DALY-like methodology. Theframework will take into account how risks/benefits interrelatebut will also consider how these relate to the same and differentsub-populations, including those defined by genetic polymor-phisms. It is intended that the methodology developed is suffi-ciently transparent to serve as a reference for the harmonizationof the evaluation methods used within the European Union (EU)and more widely in international evaluation.
The objectives of Work Package 5 (WP5) are to:
� Describe in qualitative and quantitative terms the beneficialeffects of dietary interventions.� Describe in qualitative and quantitative terms the adverse
effects of dietary intervention across intake levels, taking intoaccount subgroups, severity of effects, and probability of effects.� Identify key components and their potential for causing adverse
effects.� Assess the relationship between dietary intervention and the
alteration of the nutritional properties of the food.� Apply and adapt those evaluative methods and common core
elements as developed by WP3 to undertake qualitative andquantitative comparison of benefits and risks based on a com-mon scale of units.� Provide guidance for WP8 by identifying key messages that
need to be further communicated to stakeholders and riskmanagers.
The work of WP5 consists of an assessment of the number andkind of people that will perceive beneficial and adverse effectsacross actual intake levels, including a description of the severityand the probability of the effects occurring when consuming foodsubject to dietary interventions. Five examples will be addressedin this work package:
� Addition of folic acid to flour/bread.� Replacement of saturated fatty acids by mono-unsaturated fatty
acid.� Replacement of saturated fatty acids by carbohydrate
(isocalorically).� Replacement of mono- and disaccharides by low calorie
sweeteners.� Addition of chlorine to water.
In this work package the already described BRAFO tiered ap-proach was tested on the above mentioned case studies. In each in-stance, the benefit–risk approach is tested on the basis of existingevaluations for the individual effects done by others; no new riskor benefit evaluations were made.
2. Case study: folic acid
2.1. Introduction
Folate is the generic name for a number of compounds having asimilar activity as folic acid (pteroylglutamic acid – PGA). Folic acidis a synthetic folate compound used in food supplements and infood fortification because of its stability, and becomes biologicallyactive after reduction, whereas dietary folate is already in its re-duced form. Folates play an important role in the transfer of C1-groups (i.e. methyl-, methylene- and formyl-groups), maintainingthe methylation balance, such as in the biosynthesis of DNA andRNA bases, in amino acid metabolism and epigenetic processes likeDNA and histone methylation (http://www.efsa.europa.eu/EFSA/efsa_locale-1178620753812_1178633962601.htm).
2.2. Pre assessment and problem formulation
Folic acid/folate have been associated with a large variety of po-sitive and negative health effects. The most well known of theseare the well-established prevention of neural tube defects (NTD)and the masking of vitamin B12 deficiency, but there are manymore (potential) health effects of folic acid. Because of its provenrole in the prevention of the incidence of neural tube defects, inmany countries flour and flour products are fortified with folicacid, either on a mandatory or on a voluntary basis. In this casestudy the benefits and risks of fortification of bread with folic acidwill be described in the light of the BRAFO project.
The potential benefits are:
� A reduced incidence of neural tube defects affecting the nextgeneration.� A reduced incidence of megaloblastic anaemia due to folate
deficiency affecting the population at large.� A reduced incidence of stroke in people without a history of the
disease.� A reduced incidence in colorectal cancer.
The potential risks are:
� An increased incidence of neurological damage due to maskingof vitamin B12 deficiency affecting elderly persons and strictvegetarians.� An increase in the incidence of colorectal cancer in people with
pre-existing polyps by accelerated progression to colorectalcancer (excessive amounts of folate only).
Table 1 summarises the most relevant health effects associatedwith folic acid/folate.
As concerns potential benefits and risks, three health effectswith a convincing level of evidence were identified (Hoekstraet al., 2008): (1) the effect of folic acid on the prenatal developmentof NTD (Czeizel and Dudas, 1992), (2) the prevention of megalob-lastic anemia caused by folate deficiency (Streiff, 1970) and (3)the masking of hematological symptoms of vitamin B12 deficiencyby folic acid (Dickinson, 1995). Upon the paper by Hoekstra et al.(2008), with regard to the prevention of NTD’s the evidence fromecological studies summarised in a recent review by Heseker etal. (2009) indicated that not all NTD’s can be prevented by increas-ing the intake of folic acid, thereby adjustments for the beneficialeffects should be accounted for.
The discussions about a possible association between high dosefolic acid supplementation and (colorectal) cancer risk are stillongoing (Helman, 2010). In 2009 the most recent reports ofEuropean Food Safety Authority (EFSA) Scientific Cooperation
Table 1Application of tiers 1 and 2 of the BRAFO methodology to the case study on folic acid.
Tier 1 Tier 2
Health effect Change Qualityofevidence
Populationaffected
Health impact(beneficial/adverse/none)
References to the quality of evidence Effectseverity(w = 0–1)
Number ofindividualsa
Neural tube defects Decrease High Next generation Beneficial EFSA (2006a,b), Hoekstra et al. (2008), Wanget al. (2007), Marti-Carvajal et al. (2009),Heseker et al. (2009)
0.59 �83
Megaloblastic anaemia dueto folate deficiency
Decrease High Total population Beneficial EFSA (2006a,b), Hoekstra et al. (2008), Wanget al. (2007), Marti-Carvajal et al. (2009)
0.01 �2425
Neurological effects due tomasking of vitamin B12
deficienciesc
Increase Low Elderly >65 y(also strictvegetarians)
Adverse EFSA (2006), Hoekstra et al. (2008), Wang et al.(2007), Marti-Carvajal et al. (2009)
0.064 +53
Change in incidencecolorectal cancer
Change(cancercases)
Moderate Total population Adverse EFSA (2006a,b), Hoekstra et al. (2008), Wanget al. (2007), Marti-Carvajal et al. (2009)
0.32 �405b
Stroke Decrease Moderate Only peoplewithout a historyof disease
Beneficial (Notcalculated)
a Data for The Netherlands; based on Hoekstra et al. (2008).b Net effect of increases and decreases in colorectal cancer, no effects on accelerated progression of polyps at this concentration of 70 lg/100 g flour.c Low relates to the neurologic effects not to the well established masking of vitamin B12 deficiency.
Table 2The most relevant effects associated with folic acid/folate in terms of number of individuals affected, severity of effects, life years with disease, life years lost and DALY’s.
Tiers 3–4
Health effect Effect severity(w = 0–1)
Number ofindividualsa,c
Years lived with disease, per affected person(YLD)
Change inDALYs
Neural tube defects 0.59 83 32 �5474Megaloblastic anaemia due to folate deficiency 0.01 2425 1 �24Neurological effects due to masking of vitamin B12
deficiencies0.064 53 16 +53
Changed incidence of colorectal cancer 0.32 405b (Intake-dependent) �2217b
Decrease in incidence of stroke 0.61–0.89d Not calculated Not calculated
Overall change �7662
a Data for The Netherlands; based on Hoekstra et al. (2008).b Net effect of increases and decreases in colorectal cancer.c Positive numbers are representing benefits i.e. DALY’s prevented/gained, whereas negative numbers correspond to an adverse effect i.e. DALY’s lost.d Range based on two meta-analyses, RR = 0.61 from Wang et al. (2007) and a RR = .089 from Lee et al. (2010).
S712 H. Verhagen et al. / Food and Chemical Toxicology 50 (2012) S710–S723
Working Group (2009) and the UK Scientific Advisory Committeeon Nutrition (2009) concluded that there is still uncertainty aboutthis association (ESCO, 2009; SACN, 2009). However, it should benoted that two other publications are strengthening the concernthat high doses of folic acid may accelerate the progression of(colorectal) cancer. The first is an ecological study from Chile(Hirsch et al., 2009) with weaker but similar findings to the resultsreported before in the USA and Canada (Mason et al., 2007) and thesecond is a Scandinavian intervention study with cancer incidenceand mortality as outcome measures upon treatment with folic acidand vitamin B12 (Ebbing et al., 2009).
Further to Hoekstra et al. (2008), it is now well established thatin general folic acid decreases plasma homocysteine levels, leadingto hypothesis that a high plasma homocysteine level is associatedwith cardiovascular disease. However, in contrast to earlier expec-tations, it has been shown that folic acid decreases the risk ofstroke only in people without a history of the disease (Wanget al., 2007; Lee et al., 2010) whereas it is ineffective for preventionof all cardiovascular events (including stroke) in patients at risk orwith established cardiovascular disease (Marti-Carvajal et al.,2009). In addition, there is some evidence that, folic acid mightincrease homocysteine in elderly with low vitamin B12 status,thereby increasing their risk on cognitive impairment (Selhubet al., 2007, 2009; Miller et al., 2009). For practical reasons (seebelow) the stroke data are not included in the calculations. In addi-tion, frequently other effects of folic acid are described or proposedin literature, albeit that these have not been proven yet. Since,
these are not sufficiently substantiated by science these will notbe considered in this paper.
2.3. Reference and alternative scenario
For the problem formulation a reference and an alternative sce-nario as well as target population are formulated as follows:
Reference scenario: No fortification.
Alternative scenario: Fortification of bread with folic acid at70 lg/100 g.Target population: European population at large.
2.4. BRAFO tiered approach
A recent in-depth benefit–risk assessment of folic acid fortifica-tion was used as a starting point for testing the BRAFO tieredapproach: Hoekstra et al. (2008) evaluated the effects of fortificationof flour for making bread was across several levels of fortification(from no fortification, and 70, 140, 280 and 420 lg folic acid per100 g of bread). This detailed study is based on incidences in the pop-ulation of the Netherlands, which has a relatively small population(ca. 16.5 million), albeit that this does not have any consequencesfor the BRAFO tiered approach. Only the absolute size of the popula-tion health effects may differ, unlike the relative public healtheffects.
H. Verhagen et al. / Food and Chemical Toxicology 50 (2012) S710–S723 S713
We did not update the recent data on stroke, colorectal cancer,and NTD’s (Heseker et al., 2009) in the models of Hoekstra et al.(2008), because the aim of this WP is to test the BRAFO tiered ap-proach instead of having the most recent literature updates athand. For the actual benefit–risk calculations we used the originalresults as presented in Tables 4 and 5, and we speculated howincorporation of this new data would alter the outcome. As com-pared to Hoekstra et al. (2008), the beneficial NTD effect shouldbe considered slightly weaker because less cases can be preventedby folic acid fortification, but another beneficial effect, preventionof stroke in a subpopulation (see above) should be added. Further-more the strength of the evidence is increased for the adverse ef-fect, increase in colorectal cancer incidence for high doses of folicacid, but the size of the effect is still as uncertain as in Hoekstraet al. (2008). Therefore it seems rather unlikely that incorporationof these new data would alter the overall conclusions for the rug-gedness of the BRAFO tiered approach. The overall uncertaintyabout the evidence per se and the size of the colorectal cancer ef-fect still dominates the outcome.
In tier 1, it is concluded that the alternative scenario versus thereference scenario involves potential health benefits as well as po-tential health risks. Hence this case is a genuine benefit–risk ques-tion (tier 1 passed).
In tier 2, a qualitative evaluation of benefits and risks is made.With respect to severity of effects, there is large variation rangingfrom w = 0.01 (megaloblastic anaemia) to w = 0.59 (neural tube de-fects). There are health effects that rank high in severity (neuraltube defects, colorectal cancer), moderate (neurological effectsdue to masking of vitamin B12 deficiency) and low (megaloblasticanaemia). The number of individuals affected varies over 1–2 or-ders of magnitude (from n = 53 to n = 2425; data for The Nether-lands). On the basis of this evaluation, it is concluded that thereis a significant variation with respect to the number of individualsaffected as well as the severity of effects. As a consequence no def-inite answer can be given whether or not the alternative scenariodominates the reference scenario or vice versa. Hence this casequalifies for tiers 3 and 4 (see Table 2).
In tiers 3 and 4, the number of people perceiving benefits of pre-vention of neural tube defects is in the same order of magnitude asthe number of individuals perceiving the adverse effects in termsof neurological effects due to masking of vitamin B12 deficiency.As concerns (colorectal) cancer, at the presented low dose of forti-fication (70 lg/100 g of bread), the overall incidence for colorectalcancer is a decrease, whereas at this dose levels also a reduction inthe number of cases with neural tube defects and megaloblasticanaemia is seen. The adverse effect at this dose level (increase inneurological disorders due to undiagnosed vitamin B12 deficiency)affects about the same number of persons as the number of casesof neural tube defects prevented. The number of life years with dis-ease as well as the severity-weighting factor for neural tube defectsand colorectal cancer are the largest. Since both are reduced inincidence at this level of fortification, the overall DALY value indi-cates a significant overall change at a modest (minus) 7000 DALY’sprevented (compared to a yearly loss of ca. 4.5 million DALY’s inthe Netherlands).
2.5. Conclusions
The overall effect of fortification of bread with folic acid at70 lg/100 g is a significant benefit (>7000 DALYs), versus an ad-verse effect of 53 DALYs (data for the Netherlands), viz. the nethealth benefit outweighs the net health risk by about two ordersof magnitude. Hence the benefit–risk evaluation can actually stopat tier 3. In this evaluation it must be emphasized that there arelarge uncertainties in the actual estimates but that the overall eval-uation points into a direction of net health benefits associated with
fortification: the alternative scenario dominates the reference sce-nario. This example illustrates the BRAFO tiered-approach to beapplicable down to tiers 3/4.
Whereas the benefit–risk evaluation can stop at tier 3, it is arisk-management decision whether or not to implement such anevaluation. It must be a policy decision to weigh the adverse effectsof neurological disorders in elderly persons (and strict vegetarians)and the high-dose related (colorectal) cancer risk versus the bene-fits in the other population groups. Moreover, there can be otherways of increasing the intake of folic acid intake in target groupslike females of child-bearing age (e.g.). In the Netherlands, the min-ister of Health has recently decided for another approach to pre-vent neural tube defects by folic acid: educating the target groupof young females to take folic acid in the form of a food supplement(Netherlands Ministry of Health, Welfare and Sport, 2010). Itshould however also be noted that this approach was not success-ful in the UK (SACN, 2009).
3. Case studies: saturated fat versus mono-unsaturated fat andversus carbohydrates
3.1. Introduction
Diet-related diseases are major causes of morbidity and mortal-ity in both developed and developing countries. Cardiovascular dis-ease (CVD) is the major contributor to the global burden of disease(GBD) among the non-communicable diseases (WHO/FAO, 2003;WHO, 2004). The prevalence of heart disease has been linked tothe adoption of a sedentary lifestyle and the increased dietarydependence on saturated fats from animal sources and the intakeof refined foods. The relationship between dietary fats and CVD,especially coronary heart disease, has been extensively investi-gated with strong and consistent associations both from animaland human studies (Kris-Etherton, 1999; Kris-Etherton et al.,2001; Mann et al., 2007). The increase in the quantity and qualityof the fats in the diet is an important feature in the diets of devel-oping countries. Prospective studies examined the correlations be-tween saturated fat intake and risk of coronary heart disease(CHD), and some studies have found a positive or a weak positiveassociation. A major problem has been that the methodology tomeasure saturated fatty acids intakes has often depended on unre-liable methods of dietary assessment.
Coronary heart disease (CHD) is the leading cause of death inEurope. The underlying pathology involves atherosclerosis, whichdevelops over a long-time period without symptoms, but clinicalevents usually occur as a consequence of thrombosis triggered bythe rupture of an atherosclerotic plaque. Elevated blood pressureand raised serum cholesterol are regarded as the major reversiblerisk factors for developing the disease. Large variations in plasmatotal and Low-Density Lipoprotein (LDL) cholesterol concentra-tions between populations and this are related to population riskof CHD. Keys and Willis (1966) in the Seven Countries Study esti-mated that two-thirds of the variation in median serum cholesterolconcentrations between countries in Europe could be explained bydifferences in Saturated Fatty Acid (SAFA) and cholesterol intake.This led to a series of systematic studies demonstrating that satu-rated fatty acids C12–C16, but not C18, raised serum cholesterol(Keys and Willis, 1966). Studies within-populations have demon-strated a strong relationship between total serum cholesterol andrisk of cardiovascular disease (Lewington et al., 2007). The absoluterisk of cardiovascular disease associated with serum cholesterolappears to have no threshold but the absolute risk increases mark-edly with age. Risk is amplified by cigarette smoking, high bloodpressure and the presence of type 2 diabetes. While total choles-terol concentration is positively associated with increased risk,High Density Lipoprotein (HDL) cholesterol concentration is inver-
S714 H. Verhagen et al. / Food and Chemical Toxicology 50 (2012) S710–S723
sely associated with risk. Observational studies within populationsindicate that the ratio of total/HDL cholesterol is twice as informa-tive of individual risk than total cholesterol (Lewington et al.,2007). In contrast to between population studies, only a relativelysmall proportion of the variation in total and LDL cholesterol canbe explained by differences in SAFA and cholesterol intake withinpopulations.
Carbohydrates and fats are the principal energy source in thediets of most people and have a special role to play in energymetabolism and homoeostasis. The joint WHO/FAO Expert Con-sultation recommended that total carbohydrate should provide55–75% total energy and that free sugars should provide less than10%. Recommended intake of fruits and vegetables was 400 ormore g per day, excluding tubers. Precise amounts of Non-starchPolysaccharides (NSPs) or dietary fibre were not recommended.However, it was considered that appropriate intakes of fruits,vegetables, legumes and regular consumption of wholegrain cere-als would provide in excess of 20 g/day of NSP and over 25 g oftotal dietary fibre (WHO/FAO, 2003). Current dietary guidelinesin general also recommend a diet that contains 15–30% (or630%) of energy as fat and 610% of total energy as saturated fattyacids (WHO/FAO, 2003; Kris-Etherton et al., 2001). The classicstudies of Keys and Willis (1966) have shown that saturated fattyacids (i.e. those with a carbon chain length of C12:0 to C16:0)raise total and low-density lipoprotein (LDL) cholesterol levels.
SAFA intake increase plasma total and LDL cholesterol levels bydecreasing LDL receptor-mediated catabolism (Mensink and Katan,1992; Mensink et al., 2003). The saturated fatty acids myristic andpalmitic acids have the greatest effect and are abundant in diets richin dairy products and meat (WHO/FAO, 2003). However, the evi-dence is not consistent in this respect. The techniques used to mea-sure platelet function are not associated with increased risk of CHD.
Therefore, the general consensus for some years for the pre-vention of coronary heart disease, has been that dietary intakeof SAFA should be reduced. Lowering habitual intakes of SAFAs,requires substitution by other macronutrients to maintain energybalance, such as carbohydrates (Jakobsen et al., 2009) and (poly)unsaturated fatty acids. In the context of the BRAFO project, it isrelevant to perform a benefit–risk assessment of replacing 5% ofdietary energy from SAFA with 5% of dietary energy frommono-unsaturated fatty acids and with 5% from carbohydrates,both in an isocaloric situation. All the health effects are associatedwith the risk of CVD.
Carbohydrates (CHO) as a group have not been intensively inves-tigated in epidemiological studies of diet and cancer. There is a mod-erately large amount of data on the possible association betweendietary fibre and the risk for colorectal cancer; the results of studieshave varied and no firm conclusion can be drawn, but the available
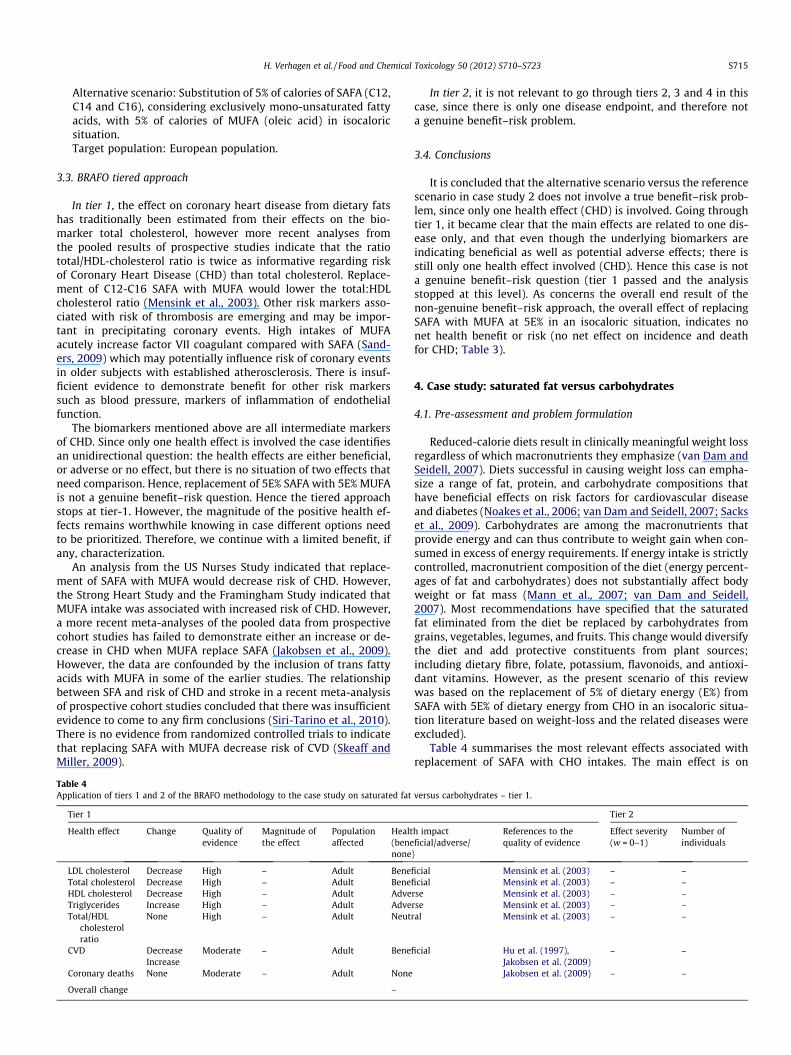
Table 3Application of Tiers 1 and 2 of the BRAFO methodology to the case study on saturated fat
Tier 1
Health effect Change Effect severity(w = 0–1)
Effect severity(w = 0–1)
Populationaffected
H(bn
Total and LDLcholesterol
Decrease – – Adult B
Total:HDLcholesterol
Decrease – – Adult B
Total:HDLcholesterol andCHD risk
Decrease – – Adult B
Factor VIIc pro-coagulant activity
Increase – – Adult A
CHD incidence andmortality
No effect – – Adult N
Overall change –
data suggest that high intakes of dietary fibre, provided by foods nat-urally rich in fibre as opposed to that added to the diet, possibly re-duce the risk for colorectal cancer. Neither of these achieves the levelof convincing or probable as required for the formulation of dietaryguidelines as defined by WHO and World Cancer Research Fund(WCRF) and this is also reflected in Table 3.
3.2. Pre-assessment and problem formulation
A recent meta-analysis indicates that the estimates from be-tween countries may have exaggerated the effect of SAFA on serumcholesterol. A meta-analysis (Mensink et al., 2003), however, con-firms the raising effects on C12–C16 fatty acids on total and LDLcholesterol and showed that the major dietary MUFA (oleic acid)when substituted for SFA lowers total cholesterol and LDL choles-terol and the ratio of total/HDL cholesterol; no effect on the ratiowas noted when stearic acid (18:0) was replaced by Monounsatu-rated Fatty Acids (MUFA). Current dietary guidelines recommendlimiting the intake of SAFA to no more than 10% of the total energyintake (Elmadfa and Kornsteiner, 2009). However, there is no con-sensus as to how the energy derived from SAFA should bereplaced and dietary reference values for MUFA are estimated bydifference from total fat energy less SAFA, trans fatty acids (FA)and polyunsaturated fatty acid intake. The replacement of 5% ofdietary energy from SAFA with 5% of dietary energy from MUFAin an isocaloric situation is considered.
The potential benefits, all resulting in a slowing of the progres-sion of atherosclerosis are:
� A decrease in total cholesterol.� A decrease in LDL-cholesterol.� A decrease in total:HDL cholesterol ratio.
The potential risks are:
� An increase in pro-coagulant activity.� Potentially increase risk of thrombosis in those individuals with
established atherosclerosis.
The established non-existing effects are:
� A decrease in blood pressure.� A decrease in risk of coronary heart disease.
The reference and alternative scenario are described below:
Reference scenario: Current situation a high and a low level ofintake of SAFA.
versus mono-unsaturated fat.
Tier 2
ealth impacteneficial/adverse/
one)
References to thequality of evidence
Effect severity(w = 0–1)
Number ofindividuals
eneficial Jakobsen et al. (2009) – –
eneficial Jakobsen et al. (2009) – –
eneficial Mensink et al. (2003) – –
dverse Sanders (2009) –
one Lewington et al.(2007)
– –
H. Verhagen et al. / Food and Chemical Toxicology 50 (2012) S710–S723 S715
Alternative scenario: Substitution of 5% of calories of SAFA (C12,C14 and C16), considering exclusively mono-unsaturated fattyacids, with 5% of calories of MUFA (oleic acid) in isocaloricsituation.Target population: European population.
3.3. BRAFO tiered approach
In tier 1, the effect on coronary heart disease from dietary fatshas traditionally been estimated from their effects on the bio-marker total cholesterol, however more recent analyses fromthe pooled results of prospective studies indicate that the ratiototal/HDL-cholesterol ratio is twice as informative regarding riskof Coronary Heart Disease (CHD) than total cholesterol. Replace-ment of C12-C16 SAFA with MUFA would lower the total:HDLcholesterol ratio (Mensink et al., 2003). Other risk markers asso-ciated with risk of thrombosis are emerging and may be impor-tant in precipitating coronary events. High intakes of MUFAacutely increase factor VII coagulant compared with SAFA (Sand-ers, 2009) which may potentially influence risk of coronary eventsin older subjects with established atherosclerosis. There is insuf-ficient evidence to demonstrate benefit for other risk markerssuch as blood pressure, markers of inflammation of endothelialfunction.
The biomarkers mentioned above are all intermediate markersof CHD. Since only one health effect is involved the case identifiesan unidirectional question: the health effects are either beneficial,or adverse or no effect, but there is no situation of two effects thatneed comparison. Hence, replacement of 5E% SAFA with 5E% MUFAis not a genuine benefit–risk question. Hence the tiered approachstops at tier-1. However, the magnitude of the positive health ef-fects remains worthwhile knowing in case different options needto be prioritized. Therefore, we continue with a limited benefit, ifany, characterization.
An analysis from the US Nurses Study indicated that replace-ment of SAFA with MUFA would decrease risk of CHD. However,the Strong Heart Study and the Framingham Study indicated thatMUFA intake was associated with increased risk of CHD. However,a more recent meta-analyses of the pooled data from prospectivecohort studies has failed to demonstrate either an increase or de-crease in CHD when MUFA replace SAFA (Jakobsen et al., 2009).However, the data are confounded by the inclusion of trans fattyacids with MUFA in some of the earlier studies. The relationshipbetween SFA and risk of CHD and stroke in a recent meta-analysisof prospective cohort studies concluded that there was insufficientevidence to come to any firm conclusions (Siri-Tarino et al., 2010).There is no evidence from randomized controlled trials to indicatethat replacing SAFA with MUFA decrease risk of CVD (Skeaff andMiller, 2009).
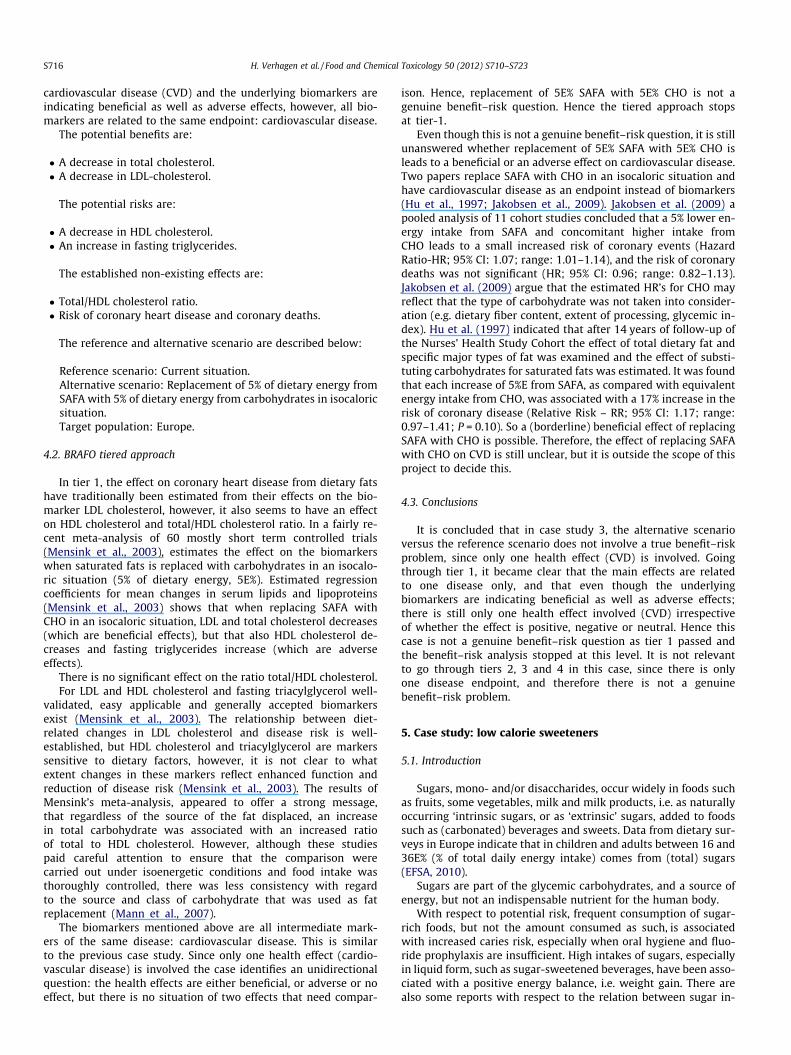
Table 4Application of tiers 1 and 2 of the BRAFO methodology to the case study on saturated fat
Tier 1
Health effect Change Quality ofevidence
Magnitude ofthe effect
Populationaffected
Healt(benenone
LDL cholesterol Decrease High – Adult BeneTotal cholesterol Decrease High – Adult BeneHDL cholesterol Decrease High – Adult AdveTriglycerides Increase High – Adult AdveTotal/HDL
cholesterolratio
None High – Adult Neutr
CVD DecreaseIncrease
Moderate – Adult Bene
Coronary deaths None Moderate – Adult None
Overall change –
In tier 2, it is not relevant to go through tiers 2, 3 and 4 in thiscase, since there is only one disease endpoint, and therefore nota genuine benefit–risk problem.
3.4. Conclusions
It is concluded that the alternative scenario versus the referencescenario in case study 2 does not involve a true benefit–risk prob-lem, since only one health effect (CHD) is involved. Going throughtier 1, it became clear that the main effects are related to one dis-ease only, and that even though the underlying biomarkers areindicating beneficial as well as potential adverse effects; there isstill only one health effect involved (CHD). Hence this case is nota genuine benefit–risk question (tier 1 passed and the analysisstopped at this level). As concerns the overall end result of thenon-genuine benefit–risk approach, the overall effect of replacingSAFA with MUFA at 5E% in an isocaloric situation, indicates nonet health benefit or risk (no net effect on incidence and deathfor CHD; Table 3).
4. Case study: saturated fat versus carbohydrates
4.1. Pre-assessment and problem formulation
Reduced-calorie diets result in clinically meaningful weight lossregardless of which macronutrients they emphasize (van Dam andSeidell, 2007). Diets successful in causing weight loss can empha-size a range of fat, protein, and carbohydrate compositions thathave beneficial effects on risk factors for cardiovascular diseaseand diabetes (Noakes et al., 2006; van Dam and Seidell, 2007; Sackset al., 2009). Carbohydrates are among the macronutrients thatprovide energy and can thus contribute to weight gain when con-sumed in excess of energy requirements. If energy intake is strictlycontrolled, macronutrient composition of the diet (energy percent-ages of fat and carbohydrates) does not substantially affect bodyweight or fat mass (Mann et al., 2007; van Dam and Seidell,2007). Most recommendations have specified that the saturatedfat eliminated from the diet be replaced by carbohydrates fromgrains, vegetables, legumes, and fruits. This change would diversifythe diet and add protective constituents from plant sources;including dietary fibre, folate, potassium, flavonoids, and antioxi-dant vitamins. However, as the present scenario of this reviewwas based on the replacement of 5% of dietary energy (E%) fromSAFA with 5E% of dietary energy from CHO in an isocaloric situa-tion literature based on weight-loss and the related diseases wereexcluded).
Table 4 summarises the most relevant effects associated withreplacement of SAFA with CHO intakes. The main effect is on
versus carbohydrates – tier 1.
Tier 2
h impactficial/adverse/
)
References to thequality of evidence
Effect severity(w = 0–1)
Number ofindividuals
ficial Mensink et al. (2003) – –ficial Mensink et al. (2003) – –rse Mensink et al. (2003) – –rse Mensink et al. (2003) – –al Mensink et al. (2003) – –
ficial Hu et al. (1997),Jakobsen et al. (2009)
– –
Jakobsen et al. (2009) – –
S716 H. Verhagen et al. / Food and Chemical Toxicology 50 (2012) S710–S723
cardiovascular disease (CVD) and the underlying biomarkers areindicating beneficial as well as adverse effects, however, all bio-markers are related to the same endpoint: cardiovascular disease.
The potential benefits are:
� A decrease in total cholesterol.� A decrease in LDL-cholesterol.
The potential risks are:
� A decrease in HDL cholesterol.� An increase in fasting triglycerides.
The established non-existing effects are:
� Total/HDL cholesterol ratio.� Risk of coronary heart disease and coronary deaths.
The reference and alternative scenario are described below:
Reference scenario: Current situation.Alternative scenario: Replacement of 5% of dietary energy fromSAFA with 5% of dietary energy from carbohydrates in isocaloricsituation.Target population: Europe.
4.2. BRAFO tiered approach
In tier 1, the effect on coronary heart disease from dietary fatshave traditionally been estimated from their effects on the bio-marker LDL cholesterol, however, it also seems to have an effecton HDL cholesterol and total/HDL cholesterol ratio. In a fairly re-cent meta-analysis of 60 mostly short term controlled trials(Mensink et al., 2003), estimates the effect on the biomarkerswhen saturated fats is replaced with carbohydrates in an isocalo-ric situation (5% of dietary energy, 5E%). Estimated regressioncoefficients for mean changes in serum lipids and lipoproteins(Mensink et al., 2003) shows that when replacing SAFA withCHO in an isocaloric situation, LDL and total cholesterol decreases(which are beneficial effects), but that also HDL cholesterol de-creases and fasting triglycerides increase (which are adverseeffects).
There is no significant effect on the ratio total/HDL cholesterol.For LDL and HDL cholesterol and fasting triacylglycerol well-
validated, easy applicable and generally accepted biomarkersexist (Mensink et al., 2003). The relationship between diet-related changes in LDL cholesterol and disease risk is well-established, but HDL cholesterol and triacylglycerol are markerssensitive to dietary factors, however, it is not clear to whatextent changes in these markers reflect enhanced function andreduction of disease risk (Mensink et al., 2003). The results ofMensink’s meta-analysis, appeared to offer a strong message,that regardless of the source of the fat displaced, an increasein total carbohydrate was associated with an increased ratioof total to HDL cholesterol. However, although these studiespaid careful attention to ensure that the comparison werecarried out under isoenergetic conditions and food intake wasthoroughly controlled, there was less consistency with regardto the source and class of carbohydrate that was used as fatreplacement (Mann et al., 2007).
The biomarkers mentioned above are all intermediate mark-ers of the same disease: cardiovascular disease. This is similarto the previous case study. Since only one health effect (cardio-vascular disease) is involved the case identifies an unidirectionalquestion: the health effects are either beneficial, or adverse or noeffect, but there is no situation of two effects that need compar-
ison. Hence, replacement of 5E% SAFA with 5E% CHO is not agenuine benefit–risk question. Hence the tiered approach stopsat tier-1.
Even though this is not a genuine benefit–risk question, it is stillunanswered whether replacement of 5E% SAFA with 5E% CHO isleads to a beneficial or an adverse effect on cardiovascular disease.Two papers replace SAFA with CHO in an isocaloric situation andhave cardiovascular disease as an endpoint instead of biomarkers(Hu et al., 1997; Jakobsen et al., 2009). Jakobsen et al. (2009) apooled analysis of 11 cohort studies concluded that a 5% lower en-ergy intake from SAFA and concomitant higher intake fromCHO leads to a small increased risk of coronary events (HazardRatio-HR; 95% CI: 1.07; range: 1.01–1.14), and the risk of coronarydeaths was not significant (HR; 95% CI: 0.96; range: 0.82–1.13).Jakobsen et al. (2009) argue that the estimated HR’s for CHO mayreflect that the type of carbohydrate was not taken into consider-ation (e.g. dietary fiber content, extent of processing, glycemic in-dex). Hu et al. (1997) indicated that after 14 years of follow-up ofthe Nurses’ Health Study Cohort the effect of total dietary fat andspecific major types of fat was examined and the effect of substi-tuting carbohydrates for saturated fats was estimated. It was foundthat each increase of 5%E from SAFA, as compared with equivalentenergy intake from CHO, was associated with a 17% increase in therisk of coronary disease (Relative Risk – RR; 95% CI: 1.17; range:0.97–1.41; P = 0.10). So a (borderline) beneficial effect of replacingSAFA with CHO is possible. Therefore, the effect of replacing SAFAwith CHO on CVD is still unclear, but it is outside the scope of thisproject to decide this.
4.3. Conclusions
It is concluded that in case study 3, the alternative scenarioversus the reference scenario does not involve a true benefit–riskproblem, since only one health effect (CVD) is involved. Goingthrough tier 1, it became clear that the main effects are relatedto one disease only, and that even though the underlyingbiomarkers are indicating beneficial as well as adverse effects;there is still only one health effect involved (CVD) irrespectiveof whether the effect is positive, negative or neutral. Hence thiscase is not a genuine benefit–risk question as tier 1 passed andthe benefit–risk analysis stopped at this level. It is not relevantto go through tiers 2, 3 and 4 in this case, since there is onlyone disease endpoint, and therefore there is not a genuinebenefit–risk problem.
5. Case study: low calorie sweeteners
5.1. Introduction
Sugars, mono- and/or disaccharides, occur widely in foods suchas fruits, some vegetables, milk and milk products, i.e. as naturallyoccurring ‘intrinsic sugars, or as ‘extrinsic’ sugars, added to foodssuch as (carbonated) beverages and sweets. Data from dietary sur-veys in Europe indicate that in children and adults between 16 and36E% (% of total daily energy intake) comes from (total) sugars(EFSA, 2010).
Sugars are part of the glycemic carbohydrates, and a source ofenergy, but not an indispensable nutrient for the human body.
With respect to potential risk, frequent consumption of sugar-rich foods, but not the amount consumed as such, is associatedwith increased caries risk, especially when oral hygiene and fluo-ride prophylaxis are insufficient. High intakes of sugars, especiallyin liquid form, such as sugar-sweetened beverages, have been asso-ciated with a positive energy balance, i.e. weight gain. There arealso some reports with respect to the relation between sugar in-

Table 5Application of tiers 1 and 2 of the BRAFO methodology to the case study on low calorie sweeteners.
Tier 1 Tier 2
Health effect Change Qualityofevidence
Magnitudeof theeffect
Populationaffected
Health impact(beneficial/adverse/none)
References to the quality of evidence Effectseverity(w = 0–1)
Number ofindividualsa
Energy intakea Decrease High – Totalpopulation
Beneficial Bellisle et al. (2007), de la Hunty et al.(2006)
– –
Body weight/balancea
Decrease/helpsto maintainenergy balance
Moderate – Children/adults
Beneficial Bellisle et al. (2007), de la Hunty et al.(2006),Gibson (2008) Olson et al. (2009),Van Baak et al. (2009)
– –
Caries Decrease Moderate – Children/adults
Beneficial Anderson et al. (2009), Burt et al. (2001),Moyniham (2004), Van Loveren (2009)
– –
Cancer None High – Totalpopulation
Neutral Bosetti et al. (2007), Butchko et al.(2002), EFSA (2009a,b), Gallus et al.(2007)
– –
Diabetes/metabolicsyndrome
None Low – Middleaged andelderly
Beneficial Dhingra et al. (2004); Schulze et al.(2004)
– –
Cardiovasculardisease
None Low – Middleaged andelderly
Beneficial EFSA (2010) – –
Gout Decrease Low – Adults Beneficial Choi and Curhan (2008) – –
Overall change Beneficial
a Mainly based upon studies with aspartame; no (little) data available for other low-calorie sweeteners.
H. Verhagen et al. / Food and Chemical Toxicology 50 (2012) S710–S723 S717
take and the risk of diabetes, cardiovascular disease, cancer, andgout.
Since the World Health Organization (WHO) Report on Diet,Physical Activity and Health of 2004, the food industry is heavilyengaged in finding solutions to manufacture less dense food. Thereport is suggesting reducing free sugar intake from present 14–15% to 10% of calorie intake. This could be possible if substitutionof free sugar in liquids would be massively recommended andadvertised.
The intakes of low calorie sweeteners have been submitted to aprevious systematic review, which evaluated all published data upto 1997 (Renwick et al., 2003). At that time it was clear that theaverage intakes of all intense sweeteners were below the relevantAcceptable Daily Intake (ADI) values. The intakes by the highestconsumers of sweeteners other than cyclamate were also well be-low their ADI values. The highest estimated intakes of cyclamateby diabetics and children were close to or slightly above the ADI.
Sugar substitutes are increasingly being used as a source ofsweetness in low-calorie and sugar-free foods and beverages.Low calorie sweeteners, such as aspartame, acesulfame K, cycla-mates, saccharin and sucralose are typically used in table topsweeteners and beverages. Because of their intense sweetness onlysmall amounts are needed. The European (EU) Commission, on thebasis of thorough safety evaluations, approves sweeteners permit-ted in the EU for food use. All approved low calorie sweetenershave undergone extensive safety testing, and have acceptable dailyintakes (ADIs) established. Intake of these sweeteners is monitoredin the EU and shows that the average and 95th percentile intakesare below ADI values (Renwick et al., 2003), only for children in-takes close, or above the ADI were observed for cyclamate in chil-dren (Mortensen, 2006). In a more recent risk benefit assessmentin Norway on the substitution of all sugar sweetened by diet bev-erages, the intake of acesulfame K was estimated to approach theADI for small children (Husoy et al., 2008).
5.2. Pre-assessment and problem formulation
In this case study the benefits and risks of replacing sugarsweetened beverages (including tea, coffee, and tabletop sugars)by intensely sweetened beverages will be described. For the pur-pose of this BRAFO case study only the low calorie sweetenersare considered.
The potential benefits are:
� Decreased energy intake.� Maintenance/loss of body weight.� Decreased caries risk.� Decreased risk of diabetes/metabolic syndrome.� Decreased risk of cardiovascular disease.� Decreased risk of gout.
The potential risks are:
� Increased risk of cancer.
5.2.1. Energy intakeDe la Hunty et al. (2006) performed a meta-analysis of studies
that examined the effectiveness of substituting sugar with aspar-tame, or combination of aspartame with other intense sweeteners,on energy intake. Only randomized controlled trial, which mea-sured energy intake for at least 24 h were included in the analysis.Most of the studies included were short term (maximum 10 wk),small size (most trials 10–30 participants; one trial with 163 par-ticipants), but with variable designs (+/� energy restriction), andincluded different low calorie sweetened foods. On average a 10%reduction in energy intake, i.e. 0.93 MJ/day, was estimated, as com-pared to control (baseline diet or sucrose intake), but not withwater as the control. Compensation could be calculated for somestudies and was on average 32% (range 1–111%), for studies usingsoft drinks as the only vehicle, on average 15.5%, i.e. lower for theliquid as compared to the solid foods. No data are available for theother low calorie sweeteners.
5.2.2. Body weight/weight balanceSugar consumption, especially in liquid form, such as in sugar-
sweetened beverages, has been related with weight gain and over-weight. Due to methodological weaknesses in the various studies,conflicting results from (few) longer term trials, etc., the evidenceis, however, currently insufficient to draw conclusions (Gibson,2008; Olson and Heitmann, 2009). In most studies the focus is onsugar intake as such, and only limited data are available with re-spect to the effect of substitution of sugars by low calorie sweeten-ers. These studies on the effect of sugar substitution, mostly byaspartame, were reviewed by de la Hunty et al. (2006). In a
S718 H. Verhagen et al. / Food and Chemical Toxicology 50 (2012) S710–S723
meta-analysis of data from 16 Randomised Controlled Trials (RCT)they estimated the effect of sugar substitution by aspartame onbody weight. On average a weight reduction of ca. 0.2 SD was cal-culated, corresponding to a weight loss of 0.2 kg/wk for a 75 kgperson. A comparative evaluation of other low calorie sweetenersis hampered by a lack of data.
5.2.3. Diabetes and metabolic syndromeA beneficial effect of sugar replacement by low calorie sweeten-
ers on diabetes risk might be anticipated, though an effect on en-ergy balance/body weight, but data are currently insufficient todraw conclusions. In the Nurses Health Study the consumption ofmore than one standard serving per day of sugar sweetened bever-ages (SSB) was found to be associated with an increased risk fordiabetes type 2 [relative ratio (RR) 1.83 (95% CI 1.42–2.36)], ascompared to those consuming less than one serving per month(Schulze et al., 2004). In the Framingham Offspring Study (Dhingraet al., 2004) an increased prevalence of metabolic syndrome wasfound to be associated with a greater intake of soft drinks (1/d ormore) (95% CI 1.28–2.56). However, this effect was about similarfor regular and diet soft drinks (ca. 50% higher prevalence at in-takes >1 drink per day. (RR 1.80 (95% CI 1.45–2.25).
Also in the Atherosclerosis Risk in Communities (ARIC) study(Lutsey et al., 2009) the consumption of sweetened beveragesand diet soda was associated with a higher risk for metabolic syn-drome. After adjustment for behavioural characteristics such assmoking and physical activity, this effect was only significant fordiet soda (RR = 1.34 (95% CI: 1.24–1.44), but not for sweetenedbeverages (RR = 1.09 (95% CI: 0.99–1.19). As consumption of dietsoda in this cohort was higher among diabetics than among non-diabetics reverse causality or residual confounding might, accord-ing to the authors, explain this finding, and further research istherefore warranted.
5.2.4. CariesThe most recent review of the evidence (Anderson et al., 2009)
concludes that the balance of studies does not demonstrate a rela-tionship of sugar quantity, but a moderately significant relation-ship of sugar frequency to dental caries. Evidence for a relationbetween sugar intake from sweetened beverages and dental cariesis limited. Moynihan and Petersen (2004) review a number of stud-ies in children in which the frequency of consumption of sugarcontaining beverages was associated with risk of dental caries.There is no direct evidence that replacing sugar by low caloriesweeteners will lower risk of dental caries. However, low caloriesweeteners are not substrates for oral micro-organisms and arethus classified as non-cariogenic (van Loveren, 2009). In summary,replacing sugars in beverages and in table-top use by low caloriesweeteners is considered to have a beneficial health impact as re-lates to caries risk.
5.2.5. Cardiovascular diseaseHigh intake of (added) sugars might result in increased serum
triglycerides and LDL-cholesterol concentrations, especially withfructose. These effects are, however, likely modulated by other fac-tors, such as body weight, dietary fatty acid composition and fibreintake (EFSA, 2009a,b). A beneficial effect of sugar replacement bylow calorie sweeteners on CVD risk might be anticipated, throughan effect on energy balance/body weight, but data are currentlyinsufficient to draw further conclusions.
5.2.6. GoutProspective data from the Health Professionals Follow-up Study
show a strong association between the consumption of sugar-sweetened soft drinks and an increased risk of gout in men (Choiand Curhan, 2008). Consumption of diet soft drinks was not asso-
ciated with risk of gout. Because this single study is not yet sup-ported by further data, the evidence is considered insufficient todraw conclusions.
5.2.7. CancerRecent studies consistently show that the average and 95th per-
centile intakes of all sweeteners by adults are below the corre-sponding ADI values. Recent studies have focused on children(Food Standards Agency, 2003; Garnier-Sagne et al., 2001; Ilbacket al., 2003; Devitt et al., 2004; Food Standards Australia New Zea-land, 2004) because of their higher potential intakes of low caloriesweeteners. The studies reported have used a variety of conserva-tive assumptions, and therefore do not provide definitive data, butsimply confirm that these groups may have higher than average in-takes. The only sub-group analyses that have indicated that the95th percentile intake of a sweetener may exceed the ADI are forcyclamate in children, particularly those with diabetes.
The role of sweeteners on cancer risk has been widely debatedover the last few decades. To provide additional information onsaccharin and other sweeteners (mainly aspartame), data havebeen studied from a large and integrated network of case–controlstudies conducted in Italy between 1991 and 2004 (Gallus et al.,2007; Bosetti et al., 2009).
These studies conclude that there is no association betweensaccharin, aspartame and other sweeteners, and the risk of severalcommon neoplasms (e.g. cancer of the oral cavity and pharynx,oesophagus, colon, rectum, larynx, breast, ovary, prostate, kidney,endometrium).
The NIH-AARP and Health Study was based on a large cohort ofmore than 500,000 subjects, including 2106 hematopoietic cancersand 376 brain cancer cases, and found no association with aspar-tame-containing beverages (Lim et al., 2006).
5.3. Reference and alternative scenario
For the problem formulation a reference and an alternative sce-nario as well as target population are formulated as follows:
Reference scenario: Sugar sweetened beverages containingdisaccharides (Soft drinks and also coffee, tea, tabletop).Alternative scenario: Substitution with intensely sweetenedbeverages.Target population: Europe.
5.4. BRAFO tiered approach
In tier 1, it is concluded that the alternative scenario versus thereference scenario involves potential health benefits as well as po-tential health risks. Hence this case is a genuine benefit–risk ques-tion (tier 1 passed).
In tier 2, with respect to potential risks, only for cyclamate andacesulfame K intakes might approach, or exceed the ADI in chil-dren with a high consumption (‘heavy users’) of beverages andfoods sweetened with these compounds. So, in general, no associ-ated risk can be anticipated in replacing sugars by low caloriesweeteners in sweetened beverages. Recent animal studies(Soffritti et al., 2005, 2006, 2007) implying a relationship betweenaspartame and lymphoma have been dismissed by EFSA and aninternational panel of experts (Magnusson et al., 2007) becausemethodological insufficiencies (EFSA, 2006a,b, 2009a,b). Hence,on the basis of exposure below ADI levels and in essence theabsence of adverse health effects, it is concluded that only benefits,and no associated risks are anticipated for substitution of sugars inbeverages by low calorie sweeteners. Therefore it is decided to stopthe evaluation in this case study after tier 2. For quantitative
H. Verhagen et al. / Food and Chemical Toxicology 50 (2012) S710–S723 S719
estimates of the potential health benefit available data are cur-rently too limited, and (in part) contradictory.
5.5. Conclusions
Low calorie sweeteners are constantly at the forefront of riskassessment debate. The very latest in these is the risk assessmentactivity of EFSA (EFSA, 2011). As default, low calorie sweetenersare safe to use at the levels and in the food categories they havenbeen assigned to by the European Directive 96/45/EEC. Cyclamateis the most critical one because in exposed sub-populations, con-sumption could be close to ADI (i.e. diabetic young children). It hasto be considered that the ADI is not a toxic threshold and that itcan be over passed during certain periods in life. With more encour-agement to use products containing low calorie sweeteners it isimportant to regularly measure exposure in order to detect early en-ough major changes in consumption patterns. In this respect newmethodologies, which are more accurate and less expensive, willhave to be encouraged and used (Nordmann et al., 2006).
Substitution of sugar-sweetened beverages (soft drink, andcoffee, tea, tabletop) by low calorie sweetened beverages mightbe helpful in maintaining a ‘healthy’ energy balance and theprevention of overweight, and consequently have a beneficialeffect on chronic disease risk and caries incidence. However, theevidence from epidemiological studies with respect to the effecton weight balance, and subsequent effects on disease prevention,is currently inconclusive for estimation of potential benefits.Most data are available for aspartame (Renwick and Nordmann,2007) for which analysis of data from randomized controlledintervention studies has shown a significant effect on weight.Very little specific data is available, for the other low caloriesweeteners.
6. Case study: water chlorination
6.1. Introduction
Hydration has recently been identified by EFSA as ‘‘a waterintake which balances losses and thereby assures adequate hydra-tion of body tissues is essential for health and life’’ (http://www.efsa.europa.eu/en/efsajournal/doc/1459.pdf). Adequate hydrationcan be achieved by adequate intake of water but optimal hydrationis not quantifiable yet, as there is no available index to assess it.Therefore the hydration aspect is within the scope of this test casebut cannot be taken into account. However, water can be contam-inated by chemicals and by micro-organisms. Chemical contamina-tion was not included in the scope of this case study focused onchlorination of drinking water and potentially associated benefitsand risks.
Water chlorination is a traditional process used to clean drink-able water used for decades. William Cumberland Cruikshankused it in 1800 for the first time, and William J.L. Lyster devel-oped in the following decade for the US army a bag technique,using calcium hypo-chloride. Chlorine in water generates hydro-chloric acid and hypo-chlorous acid, which dissociates intohydrogen and hypo-chloride ions, a potent disinfectant. A well-known drawback is that chlorine can react with organic com-pounds found in water and generates carcinogenic compoundssuch as Tri-Halo-Methanes.
6.2. Pre assessment and problem formulation
The first step of the BRAFO proposed methodology is pre-assessment and problem formulation. The issue of drinking watersafety has been already mentioned in the Bible when St Paul was
warning Timothy not to drink water in the city of Ephesus, butto drink alcoholic drinks instead. It is still possible to see the waterdistribution system in Ephesus and to understand the risk of po-tential contamination of the local drinking water. Still today, distri-bution of potable water and collection of waste water in moderncities are both running side by side in tubes with a significant levelof leakage, and contamination can occur at different points of thetap water adduction system. Once there is a contamination some-where, it is practically impossible to clean every part of the distri-bution system including all temporary dead ends and the endfaucet. The only practical way to control microbial contaminationis to use a permanent disinfection procedure e.g. the classical chlo-rination treatment.
According to the WHO, benefit of disinfection outweighs risksof cancer due to water chlorination (Le Chevallier and Au, 2004),however there is no published comparison supporting that state-ment. Chlorination controls microbial contamination, which isthe major risk of a drinking water distribution system. Chlorina-tion has no effect on other water contaminants, such aschemicals.
The potential benefits of chlorination of tap water are:
� A reduced incidence of water borne diseases affecting the wholepopulation.� A safe distribution system delivering drinkable tap water at
home.
The potential risks of chlorination of tap water are:
� An increased incidence of bladder and of rectal cancer.� An increased incidence of stillbirth and abortion in child bearing
age women.� A reduced water intake due to the taste of residual chloride in
water.
Assessment of the benefits of chlorination of tap water is noteasy for three different reasons. First, the main source of informa-tion is historical epidemiology, and except for only one case re-port, there is no real well conducted intervention study todemonstrate the benefit of water disinfection. The second reasonis that water contamination is persistent because a first contam-ination of a distribution system will increase the risk of new out-break as it is nearly impossible to perfectly clean a distributionsystem after a first contamination. This makes each water distri-bution network ‘‘unique’’ with a specific risk of waterbornedisease. That risk needs to be re-evaluated after every contamina-tion taking into account the specificity of the pathogenic contam-inant. On the other hand the longer the distribution system isclean the lower the risk of endogenous out-breaks. The third rea-son is that no disinfection system can protect against accidentalcontamination nor against resistant pathogen(s). The quantifica-tion of that risk was not possible within this assessment (EPA,2006).
Assessment of the risks of chlorination of tap water. Thereare two bottlenecks: the first one is the level of chlorination by-products, which correlated with the amount of organic materialin water and the concentration of chloride (Boorman, 1999) anddepends on the hygienic conditions of the distribution systemand cannot be extrapolated from one case study to another. Again,there is no standard value and one has to rely on available localepidemiological data. The second problem was to allocate a properassessment of the weight of spontaneous abortion, which is notexpressed in weighting factors or in DALYs in the literature. There-fore this is not indicated in the Table 6, which summarises themost relevant health effects associated with chlorination of drink-ing water.
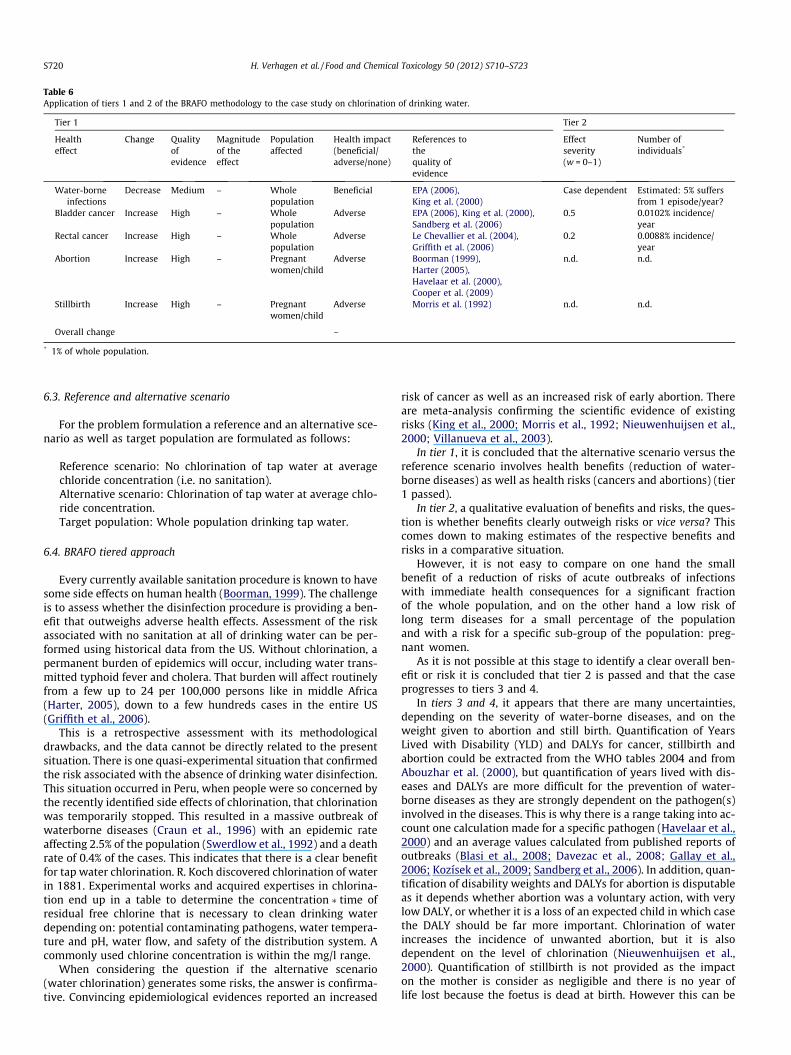
Table 6Application of tiers 1 and 2 of the BRAFO methodology to the case study on chlorination of drinking water.
Tier 1 Tier 2
Healtheffect
Change Qualityofevidence
Magnitudeof theeffect
Populationaffected
Health impact(beneficial/adverse/none)
References tothequality ofevidence
Effectseverity(w = 0–1)
Number ofindividuals*
Water-borneinfections
Decrease Medium – Wholepopulation
Beneficial EPA (2006),King et al. (2000)
Case dependent Estimated: 5% suffersfrom 1 episode/year?
Bladder cancer Increase High – Wholepopulation
Adverse EPA (2006), King et al. (2000),Sandberg et al. (2006)
0.5 0.0102% incidence/year
Rectal cancer Increase High – Wholepopulation
Adverse Le Chevallier et al. (2004),Griffith et al. (2006)
0.2 0.0088% incidence/year
Abortion Increase High – Pregnantwomen/child
Adverse Boorman (1999),Harter (2005),Havelaar et al. (2000),Cooper et al. (2009)
n.d. n.d.
Stillbirth Increase High – Pregnantwomen/child
Adverse Morris et al. (1992) n.d. n.d.
Overall change –
* 1% of whole population.
S720 H. Verhagen et al. / Food and Chemical Toxicology 50 (2012) S710–S723
6.3. Reference and alternative scenario
For the problem formulation a reference and an alternative sce-nario as well as target population are formulated as follows:
Reference scenario: No chlorination of tap water at averagechloride concentration (i.e. no sanitation).Alternative scenario: Chlorination of tap water at average chlo-ride concentration.Target population: Whole population drinking tap water.
6.4. BRAFO tiered approach
Every currently available sanitation procedure is known to havesome side effects on human health (Boorman, 1999). The challengeis to assess whether the disinfection procedure is providing a ben-efit that outweighs adverse health effects. Assessment of the riskassociated with no sanitation at all of drinking water can be per-formed using historical data from the US. Without chlorination, apermanent burden of epidemics will occur, including water trans-mitted typhoid fever and cholera. That burden will affect routinelyfrom a few up to 24 per 100,000 persons like in middle Africa(Harter, 2005), down to a few hundreds cases in the entire US(Griffith et al., 2006).
This is a retrospective assessment with its methodologicaldrawbacks, and the data cannot be directly related to the presentsituation. There is one quasi-experimental situation that confirmedthe risk associated with the absence of drinking water disinfection.This situation occurred in Peru, when people were so concerned bythe recently identified side effects of chlorination, that chlorinationwas temporarily stopped. This resulted in a massive outbreak ofwaterborne diseases (Craun et al., 1996) with an epidemic rateaffecting 2.5% of the population (Swerdlow et al., 1992) and a deathrate of 0.4% of the cases. This indicates that there is a clear benefitfor tap water chlorination. R. Koch discovered chlorination of waterin 1881. Experimental works and acquired expertises in chlorina-tion end up in a table to determine the concentration � time ofresidual free chlorine that is necessary to clean drinking waterdepending on: potential contaminating pathogens, water tempera-ture and pH, water flow, and safety of the distribution system. Acommonly used chlorine concentration is within the mg/l range.
When considering the question if the alternative scenario(water chlorination) generates some risks, the answer is confirma-tive. Convincing epidemiological evidences reported an increased
risk of cancer as well as an increased risk of early abortion. Thereare meta-analysis confirming the scientific evidence of existingrisks (King et al., 2000; Morris et al., 1992; Nieuwenhuijsen et al.,2000; Villanueva et al., 2003).
In tier 1, it is concluded that the alternative scenario versus thereference scenario involves health benefits (reduction of water-borne diseases) as well as health risks (cancers and abortions) (tier1 passed).
In tier 2, a qualitative evaluation of benefits and risks, the ques-tion is whether benefits clearly outweigh risks or vice versa? Thiscomes down to making estimates of the respective benefits andrisks in a comparative situation.
However, it is not easy to compare on one hand the smallbenefit of a reduction of risks of acute outbreaks of infectionswith immediate health consequences for a significant fractionof the whole population, and on the other hand a low risk oflong term diseases for a small percentage of the populationand with a risk for a specific sub-group of the population: preg-nant women.
As it is not possible at this stage to identify a clear overall ben-efit or risk it is concluded that tier 2 is passed and that the caseprogresses to tiers 3 and 4.
In tiers 3 and 4, it appears that there are many uncertainties,depending on the severity of water-borne diseases, and on theweight given to abortion and still birth. Quantification of YearsLived with Disability (YLD) and DALYs for cancer, stillbirth andabortion could be extracted from the WHO tables 2004 and fromAbouzhar et al. (2000), but quantification of years lived with dis-eases and DALYs are more difficult for the prevention of water-borne diseases as they are strongly dependent on the pathogen(s)involved in the diseases. This is why there is a range taking into ac-count one calculation made for a specific pathogen (Havelaar et al.,2000) and an average values calculated from published reports ofoutbreaks (Blasi et al., 2008; Davezac et al., 2008; Gallay et al.,2006; Kozísek et al., 2009; Sandberg et al., 2006). In addition, quan-tification of disability weights and DALYs for abortion is disputableas it depends whether abortion was a voluntary action, with verylow DALY, or whether it is a loss of an expected child in which casethe DALY should be far more important. Chlorination of waterincreases the incidence of unwanted abortion, but it is alsodependent on the level of chlorination (Nieuwenhuijsen et al.,2000). Quantification of stillbirth is not provided as the impacton the mother is consider as negligible and there is no year oflife lost because the foetus is dead at birth. However this can be

H. Verhagen et al. / Food and Chemical Toxicology 50 (2012) S710–S723 S721
also calculated as a whole lost life, like for unwanted abortion(Abouzhar et al., 2000).
Therefore a realistic benefit–risk assessment in tiers 3 and 4 willrequire a case-by-case analysis taking into account the local data,including the quality of the distribution system, the local potentialpathogens, and the level of chlorination, and the weight of a babylife. Another limitation of the exercise was that many factors arenot taken into account because of lack of data:
� Risk of increasing resistance of pathogens to cleaning proce-dures (Cooper and Hanlon, 2009; Berry et al., 2006).� Risk due to other contaminants of the distribution systems,
including the rising burden of drugs and chemicals in watersupply (Emmanuel et al., 2009).� Benefit of increased water intake due to availability of potable
tap water, and improved hydration; and vice versa the risk ofreduced water intake due to the disagreement of taste of thechlorinated water.
As such there are so many uncertainties in scenario’s and dis-ease estimates that this essentially renders a quantitative bene-fit–risk comparison impossible.
6.5. Conclusions
The rationale of BRAFO tiered approach also works in this testcase, but it was not possible to compare benefits (mainly expressedas absence or reduction of risks) with risks of water chlorination.The balance is not obvious and it will trigger more precise evalua-tion of local scenario’s and ethical consideration of adjustingweights for stillbirth and abortion.
7. Overall discussion
The objectives of WP5 have been met. As such we have beenable to (1) describe in qualitative and quantitative terms the ben-eficial effects of dietary interventions, to (2) describe in qualitativeand quantitative terms the adverse effects of dietary interventionacross intake levels, taking into account subgroups, severity of ef-fects, and probability of effects, to (3) identify key components andtheir potential for causing adverse effects, (4) assess the relation-ship between dietary intervention and the alteration of the nutri-tional properties of the food, (5) apply and adapt thoseevaluative methods and common core elements as developed byWP3 to undertake qualitative and quantitative comparison of ben-efits and risks based on a common scale of units.
The work of WP5 consisted of an assessment of the number andkind of people that will perceive beneficial and adverse effectsacross actual intake levels, including a description of the severityand the probability of the effects occurring when consuming foodsubject to dietary interventions. Five examples were addressed inthis work package:
� Addition of folic acid to flour/bread.� Replacement of saturated fatty acids by mono-unsaturated fatty
acid.� Replacement of saturated fatty acids by carbohydrate
(isocalorically).� Replacement of mono- and disaccharides by low calorie
sweeteners.� Addition of chlorine to water.
Across these different cases we have found that the BRAFOtiered approach worked well. We have identified two early stopsin the tiered approach because the benefit–risk question was nota genuine one (replacement of saturated fatty acids by mono-
unsaturated fatty acid and by carbohydrate (isocalorically). Wehave come across one test case in which the tiered approachstopped after tier 2 (replacement of mono- and disaccharides bylow calorie sweeteners). The two other test cases progressed untiltiers 3/4, where in one case a quantitative evaluation was possible(addition of folic acid to flour/bread), whereas in the other test case(addition of chlorine to water) the lack of data did not allow forquantitative calculations.
This work package along with the other work packages van pro-vide guidance for WP8 by identifying key messages that need to befurther communicated to stakeholders and risk managers.
Conflict of Interest
For those experts affiliated with academic institutions, theCommission of the European Communities covered, through ILSIEurope, the travel and accommodation costs related to their partic-ipation in the BRAFO project. R.A., P.F., A.K., G.P., K.P., T.S., H.B andH.K. received an honorarium for writing this paper. None of theauthors declared any interest that may conflict with the provisionof their solely scientific input to this manuscript.
Acknowledgements
The authors would like to thank Dr. Theo de Kok (University ofMaastricht) for contributing to the development of the present pa-per. This study has been carried out with financial support of theCommission of the European Communities, Priority 5 Food Qualityand Safety, within the Sixth Framework Programme (Contract No:031731 BRAFO: Benefit Risk Analysis of Foods). This manuscriptdoes not necessarily reflect the views of the Commission and inno way anticipates the future policy in this area. The preparationof this manuscript was coordinated by ILSI Europe.
ILSI Europe would like to thank all the contributors to the BRA-FO Scientific Supported Action. Overall, we would like to thank theILSI Europe Risk Assessment of Chemicals in Food Task Force mem-bers and the BRAFO Steering Committee members for their supportand guidance. Finally we would like to thank the European Com-mission for the financial support. As a co-ordinator of the ScientificSupport Action, ILSI Europe would like to express its profoundgratefulness to all of them.
References
Abouzahr, C., Vaughan, J.P., 2000. Assessing the burden of sexual and reproductiveill-health: questions regarding the use of disability-adjusted life years. WorldHealth Organization 78, 5.
Anderson, C.A., Curzon, M.E., Van, L.C., Tatsi, C., Duggal, M.S., 2009. Sucrose anddental caries: a review of the evidence. Obes. Rev. 10 (Suppl. 1), 41–54.
Bellisle, F., Drewnowski, A., 2007. Intense sweeteners, energy intake, and the controlof body weight. Eur. J. Clin. Nutr. 61, 691–700.
Berry, D., Xi, C., Raskin, L., 2006. Microbial ecology of drinking water distributionsystems. Curr. Opin. Biotechnol. 17, 297–302.
Blasi, M.F., Carere, M., Pompa, M.G., Rizzuto, E., Funari, E., 2008. Water-relateddiseases outbreaks reported in Italy. J. Water Health 6, 423–432.
Boorman, G.A., 1999. Drinking water disinfection by-products: review and approachto toxicity evaluation. Environ. Health Perspect. 107, 207–217.
Bosetti, C., Gallus, S., Talmini, R., Montella, M., Franceschi, S., Negri, E., La Vecchia, C.,2009. Artificial sweeteners and the risk of gastric, pancreatic and endometrialcancers in Italy. Cancer Epidemiol. Biomarkers Prev. 18 (8), 2232–2238.
Burt, B.A., Pai, S., 2001. Sugar consumption and caries risk: a systematic review. J.Dent. Educ. 65 (10), 1017–1023.
Butchko, H.H., Stargel, W.W., Comer, C.P., Mayhew, D.A., Benninger, C., Blackburn,G.L., de Sonneville, L.M., Geha, R.S., Hertelendy, Z., Koestner, A., Leon, A.S., Liepa,G.U., McMartin, K.E., Mendenhall, C.L., Munro, I.C., Novotny, E.J., Renwick, A.G.,Schiffman, S.S., Schomer, D.L., Shaywitz, B.A., Spiers, P.A., Tephly, T.R., Thomas,J.A., Trefz, F.K., 2002. Aspartame: review of safety. Regul. Toxicol. Pharmacol. 35,S1–S93.
Choi, H.K., Curhan, G., 2008. Soft drinks fructose consumption and the risk of gout inmen: prospective cohort study. Brit. Med. J. 336 (7639), 309–312.
Cooper, I.R., Hanlon, G.W., 2009. Resistance of Legionella pneumophila serotype 1biofilms to chlorine-based disinfection. J. Hosp. Infect. 74, 152–159.
S722 H. Verhagen et al. / Food and Chemical Toxicology 50 (2012) S710–S723
Craun, G.F., Bull, R.J., Clark, R.M., Doull, J., Grabow, W., Marsh, G.M., Okun, D.A., Regli,S., Sobsey, M.D., Symons, J.M., 1996. In: Water Quality in Latin America:Balancing the Microbial and Chemical Risks in Drinking Water Disinfection.Regional Symposium on Water Quality, Argentina, 1994. International LifeSciences Institute, Washington, DC.
Czeizel, A.E., Dudas, I., 1992. Prevention of first occurrence of neural tube defectsby periconceptional vitamin supplementation. N. Engl. J. Med. 327, 1832–1835.
Davezac, H., Grandguillot, G., Robin, A., Saout, C., 2008. La qualité de l’eau potable enFrance 2005. Dossier 070905. <http://www.eaufrance.fr/IMG/pdf/bilanqualite_05_06.pdf>.
de la Hunty, A., Gibson, S., Ashwell, M., 2006. A review of the effectiveness ofaspartame in helping with weight control. Nutr. Bull. 31, 115–128.
Devitt, L., Daneman, D., Buccino, J., 2004. Assessment of intakes of artificialsweeteners in children with type 1 diabetes mellitus. Can. J. Diabetes 28, 142–146.
Dhingra, R., Gona, P., Nam, B.H., D’Agostino, R.B., Wilson, P.W., Benjamin, E.J.,O’Donnell, C.J., 2004. Soft drink consumption and risk of developingcardiometabolic risk factors and the metabolic syndrome in middle-agedadults in the community. Am. J. Med. 120, 1054–1062.
Dickinson, C.J., 1995. No reliable evidence that folate is harmful in B-12 deficiency.Brit. Med. J. 311, 949.
Ebbing, M., Bønaa, K.H., Nygård, O., Arnesen, E., Ueland, P.M., Nordrehaug, J.E.,Rasmussen, K., Njølstad, I., Refsum, H., Nilsen, D.W., Tverdal, A., Meyer, K.,Vollset, S.E., 2009. Cancer incidence and mortality after treatment with folicacid and vitamin B12. JAMA 302, 2119–2126.
EFSA, 2006. Opinion of the scientific panel on food additives, flavourings, processingaids and materials in contact with food (AFC) on a request from the commissionrelated to a new long-term carcinogenicity study on aspartame. EFSA J. 356, 1–44. <http://www.aspartame.info/pdfs/EFSA%20Summary.pdf>.
EFSA, 2006. Scientific Panel On Dietetic Products, Nutrition And Allergies (NDA) andscientific committee on food (SCF). Tolerable upper intake levels for vitaminsand minerals. <http://www.efsa.europa.eu/cs/BlobServer/Scientific_Document/upper_level_opinions_full-part33,0.pdf?ssbinary=true>.
EFSA, 2009a. Opinion on a request from the european commission related to the2nd ERF carcinogenicity study on aspartame. EFSA J. 945, 1–18. <http://www.efsa.europa.eu/en/efsajournal/doc/945.pdf>.
EFSA, 2009b. Updated opinion on a request from the european commission relatedto the 2nd ERF carcinogenicity study on aspartame, taking into considerationstudy data submitted by the Ramazzini foundation in February 2009. EFSA J.1015, 1–18.
EFSA, 2010. Outcome of the public consultation on the draft opinion of the scientificpanel on dietetic products, nutrition, and allergies (NDA) on dietary referencevalues for carbohydrates and dietary fibre. EFSA J. 8(5), 1508. <http://www.efsa.europa.eu/en/efsajournal/doc/1508.pdf>.
EFSA, 2011. Statement on two recent scientific articles on the safety of artificialsweeteners. EFSA J 9(2), 1996. <http://www.efsa.europa.eu/en/efsajournal/doc/1996.pdf>.
Elmadfa, I., Kornsteiner, M., 2009. Fats and fatty acid requirements for adults. Ann.Nutr. Metab. 55, 56–75.
Emmanuel, E., Pierre, M.G., Perrodin, Y., 2009. Groundwater contamination bymicrobiological and chemical substances released from hospital wastewater:health risk assessment for drinking water consumers. Environ. Int. 35, 718–726.
EPA, 2006. Health risks from microbial growth and biofilms in drinking waterdistribution systems. Drinking water distribution systems: assessing andreducing risks. Committee on Public Water Supply Distribution Systems:Assessing and Reducing Risks, National Research Council. National AcademiesPress, New York.
ESCO, 2009. <http://www.efsa.europa.eu/en/colloquiareports/colloquiariskbenefit.htm>.
Food Standards Agency UK, 2003. Diary survey of the intake of intense sweetenersby young children from soft drinks. No. 36/03 Month 2003.
Food Standards Australia New Zealand, 2004. Consumption of intense sweeteners inAustralia and New Zealand: Benchmark Survey 2003. Evaluation Report SeriesNo. 8. ISBN 0 642 34598 8. Intake of intense sweeteners 337.
Gallay, A., De Valk, H., Cournot, M., Ladeuil, B., Hemery, C., Castor, C., Bon, F.,Mégraud, F., Le Cann, P., Desenclos, J.C., 2006. A large multi-pathogenwaterborne community outbreak linked to faecal contamination of agroundwater system, France. Clin. Microbiol. Infect. 12, 561–570.
Gallus, S., Scotti, L., Negri, E., Talamini, R., Franceschi, S., Montella, M., Giacosa, A.,Dal Maso, L., La Vecchia, C., 2007. Artificial sweeteners and cancer risk in anetwork of case–control studies. Ann. Oncol. 18, 40–44.
Garnier-Sagne, I., Leblanc, J.C., Verger, P., 2001. Calculation of the intake of threeintense sweeteners in young insulin-dependent diabetics. Food Chem. Toxicol.39, 745–749.
Gibson, S., 2008. Sugar-sweetened soft drinks and obesity: a systematic review ofthe evidence from observational studies and interventions. Nutr. Res. Rev. 21(2), 134–147.
Griffith, D.C., Kelly-Hope, L.A., Miller, M.A., 2006. Review of reported choleraoutbreaks worldwide, 1995–2005. Am. J. Trop. Med. Hyg. 75, 973–977.
Harter, P., 2005. Cholera cases. wwworldmapper.org. N� 231. <http://www.worldmapper.org/display.php?selected=231>.
Havelaar, A.H., De Hollander, A.E., Teunis, P.F., Evers, E.G., Van Kranen, H.J.,Versteegh, J.F., Van Koten, J.E., Slob, W., 2000. Balancing the risks and benefits ofdrinking water disinfection: disability adjusted life-years on the scale. Environ.Health Perspect. 108, 315–321.
Helman, A., 2010. Can folate supplements be dangerous? Arb. Cilin. Nutr. Upd. Part2 327, 1–5.
Heseker, H.B., Mason, J.B., Selhub, J., Rosenberg, I.H., Jacques, P.F., 2009. Not all casesof neural-tube defect can be prevented by increasing the intake of folic acid. Br.J. Nutr. 102, 173–180.
Hirsch, S., Sanchez, H., Albala, C., de la Maza, M.P., Barrera, G., Leiva, L., Bunout, D.,2009. Colon cancer in Chile before and after the start of the flour fortificationprogram with folic acid. Eur. J. Gastroenterol. Hepatol. 21, 436–439.
Hoekstra, J., Verkaik-Kloosterman, J., Rompelberg, C., van Kranen, H., Zeilmaker,M., Verhagen, H., de Jong, N., 2008. Integrated risk-benefit analyses: methoddevelopment with folic acid as example. Food Chem. Toxicol. 46 (3), 893–909.
Hu, F.B., Stampfer, M.J., Manson, J.E., Rimm, E., Colditz, G.A., Rosner, B.A., Hennekens,C.H., Willett, W.C., 1997. Dietary fat intake and the risk of coronary heartdisease in women. N. Engl. J. Med. 337, 1491–1499.
Husoy, T., Mangschou, B., Fotland, T.O., 2008. Reducing added sugar intake in Norwayby replacing sugar sweetened beverages with beverages containing intensesweeteners – a risk benefit assessment. Food Chem. Toxicol. 46, 3099–3105.
Ilback, N.G., Alzin, M., Jahrl, S., Enghardt-Barbieri, H., Busk, L., 2003. Estimatedintake of the artificial sweeteners acesulfame-K, aspartame, cyclamate andsaccharin in a group of Swedish diabetics. Food Addit. Contam. 20, 99–114.
Jakobsen, M.U., O’Reilly, E.J., Heitmann, B.L., Pereira, M.A., Balter, K., Fraser, G.E.,Goldbourt, U., Hallmans, G., Knekt, P., Liu, S., Pietinen, P., Spiegelman, D.,Stevens, J., Virtamo, J., Willett, W.C., Ascherio, A., 2009. Major types of dietaryfat and risk of coronary heart disease: a pooled analysis of 11 cohort studies.Am. J. Clin. Nutr. 89, 1425–1432.
Keys, A.N., Willis, P.R., 1966. Serum cholesterol response to changes in dietarylipids. Am. J. Clin. Nutr. 19, 175–181.
King, W.D., Dodds, L., Allen, A.C., 2000. Relation between stillbirth and specificchlorination by-products in public water supplies. Environ. Health Perspect.108, 883–886.
Kozísek, F., Jeligová, H., Dvoráková, A., 2009. Waterborne disease outbreaks in theCzech Republic 1995–2005. Epidemiol. Mikrobiol. Imunol. 58, 124–131.
Kris-Etherton, P.M., 1999. AHA science advisory: monounsaturated fatty acids andrisk of cardiovascular disease. J. Nutr. 129, 2280–2284.
Kris-Etherton, P., Daniels, S.R., Eckel, R.H., 2001. Summary of the ScientificConference on Dietary Fatty Acids and Cardiovascular Health: ConferenceSummary from the Nutrition Committee of the American Heart AssociationCirculation 103, 1034–1039.
Le Chevallier, M.W., Au, K.K., 2004. ‘‘Water Treatment and Pathogen Control –Process efficiency in Achieving Safe Drinking Water’’ for the WHO. IWAPublishing, London.
Lee, M., Hong, K., Chang, S., Saver, J.L., 2010. Efficacy of homocysteine-loweringtherapy with folic acid in stroke prevention, a meta-analysis. Stroke 41.
Lewington, S., Whitlock, G., Clarke, R., Sherliker, P., Emberson, J., Halsey, J., Qizilbash,N., Peto, R., Collins, R., 2007. Blood cholesterol and vascular mortality by age,sex, and blood pressure: a meta-analysis of individual data from 61 prospectivestudies with 55,000 vascular deaths. Lancet 370, 1829–1839.
Lim, U., Subar, A.F., Mouw, T., Hartge, P., Morton, L.M., Stolzenberg-Solomon, R.,Campbell, D., Hollenbeck, A.R., Schatzin, A., 2006. Consumption of aspartame-containing beverages and incidence of hematopoietic and brain malignancies.Cancer Epidemiol. Biomarkers Prev. 15, 1654–1659.
Lutsey, P.L., Steffen, L.M., Stevens, J., 2009. Dietary intake and the development ofthe metabolic syndrome; the atherosclerosis risk in communities study.Circulation 117, 754–761.
Magnusson, B.A., Burdock, G.A., Doull, J., Kroes, R.M., Marsh, G.M., Pariza, M.W.,Spencer, P.S., Waddell, W.J., Walker, R., Williams, G.M., 2007. Aspartame: asafety evaluation based on current use levels, regulations and toxicological andepidemiological studies. Crit. Rev. Toxicol. 37 (8), 629–727.
Mann, J., Cummings, J.H., Englyst, H.N., Key, T., Liu, S., Riccardi, G., Summerbell, C.,Uauy, R., van Dam, R.M., Venn, B., Vorster, H.H., Wiseman, M., 2007. FAO/WHOScientific Update on carbohydrates in human nutrition: conclusions. Eur. J. Clin.Nutr. 61, S132–S137.
Marti-Carvajal, A.J., Sola, I., Lathyris, D., Salanti, G., 2009. Benefit of B vitamins forreducing cardiovascular events. Cochrane Database of Systematic Reviews 4,CD006612.
Mason, J.B., Dickstein, A., Jacques, P.F., Haggarty, P., Selhub, J., Dallal, G., Rosenberg,I.H., 2007. A temporal association between folic acid fortification and anincrease of colorectal cancer rates may be illuminating important biologicalprinciples: a hypothesis. Cancer Epidemiol. Biomarkers Prev. 16, 1325–1329.
Mensink, R.P., Katan, M.B., 1992. Effect of dietary fatty acids on serum lipids andlipoproteins. a meta-analysis of 27 trials. Arterioscler. Thromb. Vasc. Biol. 12,911–919.
Mensink, R.P., Zock, P.L., Kester, A.D., Katan, M.B., 2003. Effects of dietary fatty acidsand carbohydrates on the ratio of serum total to HDL cholesterol and on serumlipids and apolipoproteins: a meta-analysis of 60 controlled trials. Am. J. Clin.Nutr. 77, 1146–1155.
Miller, J.W., Garrod, M.G., Allen, L.H., Haan, M.N., Green, R., 2009. Metabolicevidence of vitamin B12 deficiency, including high homocysteine andmethylmalonic acid and low holotranscobalamin, is more pronounced inolder adults with elevated plasma folate. Am. J. Clin. Nutr. 90 (6), 1586–1592.
Morris, R.D., Audet, A.M., Angelillo, I.F., Chalmers, T.C., Mosteller, F., 1992.Chlorination, chlorination by-products, and cancer: a meta-analysis. Am. J.Public Health 82, 955–963.
Mortensen, A., 2006. Sweeteners permitted in the European Union: safety aspects.Scand. J. Food Nutr. 50, 104–116.
H. Verhagen et al. / Food and Chemical Toxicology 50 (2012) S710–S723 S723
Moynihan, P., Petersen, P.E., 2004. Diet, nutrition and the prevention of dentaldiseases, Public Health Nutr. 7(1A), 201–226.
Netherlands Ministry of fitness, Welfare and Sport, 2010, Voedingsbeleid; Briefminister over adviezen van de Gezondheidsraad over microvoedingsstoffen.<http://static.ikregeer.nl/pdf/KST139652.pdf>.
Nieuwenhuijsen, M.J., Toledano, M.B., Eaton, N.E., Fawell, J., Elliott, P., 2000.Chlorination disinfection byproducts in water and their associationwith adverse reproductive outcomes: a review. Occup. Environ. Med. 57, 73–85.
Noakes, M., Foster, P.R., Keogh, J.B., James, A.P., Mamo, J.C., Clifton, P.M., 2006.Comparison of isocaloric very low carbohydrate/high saturated fat and highcarbohydrate/low saturated fat diets on body composition and cardiovascularrisk. Nutr. Metab. 3 (7), 1–13.
Nordmann, H., Haldemann, Y., Sardi, M., Bartels, H.A., Schumann, P., Bottex, B., 2006.Intake assessment of a food additive based on food consumption data providedby retailer’s fidelity card. Toxicol. Lett. 164 (1), s48–s49.
Olson, N.J., Heitmann, B.L., 2009. Intake of calorically sweetened beverages andobesity. Obesity Rev. 10, 68–75.
Renwick, A.G., Barlow, S.M., Hertz-Picciotto, I., Boobis, A.R., Dybing, E., Edler, L.,Eisenbrand, G., Greig, J.B., Kleiner, J., Lambe, J., Müller, D.J.G., Smith, M.R., Tritscher,A., Tuijtelaars, S., van den Brandt, P.A., Walker, R., Kroes, R., 2003. Riskcharacterization of chemicals in food and diet. Food Chem. Toxicol. 41, 1211–1271.
Renwick, A.G., Nordmann, H., 2007. First European conference on aspartame:putting safety and benefits into perspective. Synopsis of presentations andconclusions. Food Chem. Toxicol. 45, 1308–1313.
Sacks, F.M., Bray, G.A., Carey, V.J., Smith, S.R., Ryan, D.H., Anton, S.D., McManus, K.,Champagne, C.M., Bishop, L.M., Laranjo, N., Lebof, M.S., Rood, J.C., de Jonge, L.,Greenway, F.L., Loria, C.M., Obarzanek, E., Williamson, D.A., 2009. Comparison ofweight-loss diets with different compositions of fat, protein, and carbohydrates.N. Engl. J. Med. 360 (9), 859–873.
Sandberg, M., Nygård, K., Meldal, H., Valle, P.S., Kruse, H., Skjerve, E., 2006. Incidencetrend and risk factors for Campylobacter infections in humans in Norway. BMCPublish Health 6, 179–185.
Sanders, T.A., 2009. Fat and fatty acid intake and metabolic effects in the humanbody. Ann. Nutr. Metab. 55, 162–172.
Schulze, M.B., Manson, J.E., Ludwig, D.S., Colditz, G.A., Stampfer, M.J., Willett, W.C.,Hu, F.B., 2004. Sugar-sweetened beverages, weight gain, and incidence of type 2diabetes in young and middle-aged women. J. Am. Med. Assoc. 292, 927–934.
Scientific Advisory Committee on Nutrition (SACN), 2009. Folic acid and colorectalcancer risk: Review of recommendation for mandatory folic acid fortification.<http://www.sacn.gov.uk/pdfs/summary_of_sacn_report_to_cmo_19_october_2009.pdf>.
Selhub, J., Morris, M.S., Jacques, P.F., 2007. In vitamin B12 deficiency, higher serumfolate is associated with increased total homocysteine and methylmalonic acidconcentrations. Proc. Natl. Acad. Sci. USA 104 (50), 19995–20000.
Selhub, J., Morris, M.S., Jacques, P.F., Rosenberg, I.H., 2009. Folate-vitamin B12interaction in relation to cognitive impairment, anemia, and biochemicalindicators of vitamin B-12 deficiency. Am. J. Clin. Nutr. 89 (2), 702S–706S.Available from: <http://www.ajcn.org/content/89/2/702S.full>.
Siri-Tarino, P.W., Sun, Q., Hu, F.B., Krauss, R.M., 2010. Meta-analysis of prospectivecohort studies evaluating the association of saturated fat with cardiovasculardisease. Am. J. Clin. Nutr. 91 (3), 535–546.
Skeaff, C.M., Miller, J., 2009. Dietary fat and coronary heart disease: summary ofevidence from prospective cohort and randomised controlled trials. Ann. Nutr.Metab. 55, 173–201.
Soffritti, M., Belpoggi, F., Degli Esposti, D., Lambertini, L., 2005. Aspartame induceslymphomas and leukaemias in rats. Eur. J. Oncol. 10, 107–116.
Soffritti, M., Belpoggi, F., Degli Esposti, D., Lambertini, L., Tibaldi, E., Rigano, A., 2006.First experimental demonstration of the multipotential carcinogenic effects ofaspartame administered in the feed to Sprague–Dawley rats. Environ. HealthPerspect. 114, 379–385.
Soffritti, M., Belpoggi, F., Tibaldi, E., Esposti, D.D., Lauriola, M., 2007. Lifetimeexposure to low doses of aspartame beginning during prenatal life increasescancer effect in rats. Environ. Health Perspect. 115, 1293–1297.
Streiff, R.R., 1970. Folate deficiency and oral contraceptives. J. Am. Med. Assoc. 214,105.
Swerdlow, D.L., Mintz, E.D., Rodriguez, M., Tejada, E., Ocampo, C., Espejo, L., Greene,K.D., Saldana, W., Seminario, L., Tauxe, R.V., Wells, J.G., Bean, N.H., Ries, A.A.,Pollack, M., Vertiz, B., Blake, P.A., 1992. Waterborne transmission of epidemiccholera in Trujillo, Peru: lessons for a continent at risk. Lancet 340, 28–33.
Van Baak, M.A., Astrup, A., 2009. Consumption of sugars and body weight. ObesityRev. 10, 9–23.
van Dam, R.M., Seidell, J.C., 2007. Carbohydrate intake and obesity. Eur. J. Clin. Nutr.61 (Suppl. 1), S75–S99.
Van Loveren, C., 2009. Oral and dental health. Prevention of dental caries, erosion,gingivitis and periodontitis. ILSI Europe Concise Monograph Series, ILSI Europe,1–32.
Villanueva, C.M., Fernandez, F., Malats, N., Grimalt, J.O., Kogevinas, M., 2003. Meta-analysis of studies on individual consumption of chlorinated drinking water andbladder cancer. J. Epidemiol. Community Health 57, 166–173.
Wang, X., Qin, X., Demirtas, H., Li, J., Mao, G., Yong Huo, Y., Sun, N., Liu, L., Xu, X.,2007. Efficacy of folic acid supplementation in stroke prevention: a meta-analysis. The Lancet 369 (9576), 1876–1882.
WHO, 2004. Food and Health in Europe, WHO, Geneva.WHO/FAO, 2003. Diet, nutrition and the prevention of chronic diseases. Report of a
joint WHO/FAO Expert consultation, WHO Technical Report Series 916, WHO,Geneva.
Top Related
Copyright © 2022 FDOKUMEN

