


Bahasa
Halaman
Hukum


ZEBRA and the stylized Zebra head are trademarks of Zebra Technologies Corp., registered in many jurisdictions worldwide. All other trademarks are the property of their respective owners. ©2022 Zebra Technologies Corp. and/or its affiliates.
NA and Corporate Headquarters+1 847 634 6700
Asia-Pacific Headquarters+65 6858 0722
EMEA Headquarters+44 1628 556000
Latin America Headquarters+1 754 900 4050
zebra.com
Annual Report 2021
Zebra Technologies 2
02
1 Annual R
eport
Zebra Annual Report 2021.indd 1-3Zebra Annual Report 2021.indd 1-3 3/24/22 5:40 PM3/24/22 5:40 PM

To Our Investors,In 2021, we celebrated the 30th anniversary of our initial public stock offering. Since the offering we
have significantly outperformed the broader markets and transformed Zebra into a key strategic partner
with 94% of the Fortune 100, providing enterprises with solutions that digitize and automate their
operations. We continue to be excited about our opportunity to help our customers meet their mission-
critical needs in an increasingly on-demand economy.
Optimizing Workflows for the On-Demand EconomyOver the past year, we have continued to make strong progress in advancing our Enterprise Asset
Intelligence vision of enabling every asset and worker to be visible, connected, and fully optimized.
As a trusted strategic partner, we help transform end-to-end workflows in a variety of end markets
including retail & ecommerce, transportation & logistics, manufacturing, healthcare, government, public
safety, and hospitality. We empower the workforce on the front line to do their jobs more efficiently by
navigating constant change in near-real time, utilizing insights driven by advanced software capabilities
such as prescriptive analytics and intelligent automation.
Our served markets total approximately $30 billion and are supported by megatrends including the
on-demand economy, asset visibility, mobility & cloud computing, and automation. These trends have
become increasingly important to our enterprise customers, and we remain well positioned to meet their needs with our comprehensive
solutions in our core, adjacent, and expansion markets. Our core, which includes enterprise mobile computing, data capture, and thermal
printing, remains vibrant – we have the broadest and deepest offering among the competition and believe that our continued focus and
investment will advance our leadership position. Near-adjacencies, including RFID and smart supplies, provide ample opportunity to expand and
have an even higher growth profile than our core.
Beyond our core and near adjacencies are rapid-growth and margin-rich expansion market opportunities. In mid-2021, we launched several
fixed industrial scanning and machine vision smart cameras while acquiring Adaptive Vision to advance our offering. Soon after, we acquired
Fetch Robotics to give us the broadest portfolio of autonomous mobile robots in the industry. We are also building a compelling software suite
that optimizes retail execution and demand planning with Reflexis workforce & task management, Zebra Prescriptive Analytics, Workforce
Connect, SmartCount, and recently acquired antuit.ai to extend our reach into demand forecasting. We are early on our journey in these exciting
expansion categories and continue to invest in them as cornerstones of our growth strategy.
Exceptional 2021 Financial ResultsWe achieved record financial results in 2021 as customers prioritized their spending on our solutions. For the year we realized:
• 26% net sales growth with broad-based demand across our regions and vertical end markets;
• 250 basis point adjusted EBITDA margin* expansion through profitable sales growth and operating expense leverage;
• 44% growth in non-GAAP diluted earnings per share*; and
• Free cash flow* of greater than $1 billion.
As we enter 2022, we continue to see very strong demand across our business with a robust order backlog and pipeline of opportunities. That
said, our teams have been aggressively working to mitigate the unprecedented industry-wide supply chain challenges that are expected to
impact our growth in the near term by securing new sources of supply, utilizing alternative modalities of transportation, and expediting
customer shipments.**
Our Commitment to Drive Innovation through Inclusion, Diversity and Sustainability We believe that a diverse workforce and an inclusive culture foster our innovation and differentiate us as an employer of choice. We continue
to build on our industry-leading offerings by investing in our people who are instrumental in driving our innovation and sustainable, profitable
growth. We recently set formal workplace diversity goals and have continued to expand our inclusion and diversity efforts by establishing our
Inclusion Champions program and launching additional inclusion networks and learning resources.
As a responsible corporate citizen, we are committed to a sustainable business model that benefits our stakeholders. We continue to focus on
driving progress across our priorities of human capital management, climate, resource conservation, and governance.
I would like to thank our employees and partners for their extraordinary efforts to serve customers and deliver record 2021 results in a supply-
constrained environment through the pandemic. We are optimistic that we are now seeing the peak of these challenges, and we are working
diligently to minimize these impacts. Our primary focus continues to be the health and safety of our people and those on the front line.
Sincerely,
Anders Gustafsson
*For a reconciliation of these non-GAAP measures to similar GAAP measures, please refer to Zebra’s 4Q21 earnings press release located at investors.zebra.com.
**Such forward-looking statements are based on current expectations and assumptions that are subject to risks and uncertainties that may cause actual results
to differ materially.
Board of Directors
Michael A. Smith1,2,3
Chair of the Zebra BoardChairman and Chief Executive OfficerFireVision, LLC
Anders GustafssonChief Executive Officer Zebra Technologies Corporation
Linda M. Connly1
Expert PartnerBain & Company
Nelda J. Connors1
Founder, Chairwoman and CEOPine Grove Holdings, LLC
Chirantan J. Desai2
Chief Operating Officer ServiceNow
Richard L. Keyser 2,3
Retired Chairman W. W. Grainger, Inc.
Ross W. Manire 1,3
President and Chief Executive Officer (Retired) ExteNet Systems, Inc.
Frank B. Modruson 1, 3
President of Modruson & Associates, LLC and Chief Information Officer (Retired) Accenture
Janice M. Roberts 2
Partner Benhamou Global Ventures
1 - Member of Audit Committee 2 - Member of Compensation Committee 3 - Member of Nominating and Governance Committee
Executive Officers
Anders GustafssonChief Executive Officer
Nathan A. WintersChief Financial Officer
William J. BurnsChief Product and Solutions Officer
Michael ChoChief Strategy Officer
Joachim HeelChief Revenue Officer
Cristen L. Kogl Chief Legal Officer,General Counsel andCorporate Secretary
Jeffrey F. SchmitzChief Human Resources and Marketing Officer
Stephen E. Williams Chief of Global Operations and Services
Colleen M. O’SullivanSVP, Chief Accounting and Treasury Officer
Stockholder Information
Global Corporate HeadquartersZebra Technologies CorporationThree Overlook PointLincolnshire, Illinois 60069U. S. A. Phone: +1 847 634-6700Fax +1 847 913-8766
Annual MeetingZebra’s Annual Meeting of Stockholders will be held on May 12, 2022, at 10:30 a.m. Central Time
Independent AuditorsErnst & Young LLP Chicago, Illinois
Investor RelationsInvestors are invited to learn more about Zebra Technologies Corporation by accessing the company’s website at investors.zebra.com, by sending an email to [email protected] or by calling +1 847 518-6432.
Transfer Agent and Registrar Computershare P.O. Box 505000 Louisville, KY 40233-5000
Overnight Delivery: Computershare 462 South 4th Street, Suite 1600Louisville, KY 40202
Telephone: +1 800 522-6645 or +1 201 680-6578
TDD for hearing impaired: +1 800 231-5469 or +1 201 680-6610
Website: www.computershare.com/investor
Form 10-K The Zebra Technologies Corporation Form 10-K Report filed with the Securities and Exchange Commission is incorporated in this annual report. Our Code of Ethics for Senior Financial Officers is available for download on the Company’s Investor Relations website at investors.zebra.com under the Governance tab, within the Governance Documents section. Please contact the Investor Relations Department at the Corporate Headquarters for additional copies of the Form 10-K, or visit our website to view an online version of the Form 10-K, or the Code of Ethics for Senior Financial Officers.
Equal Employment Opportunities/ Affirmative Action It is the policy of Zebra Technologies Corporation to provide equal opportunities and affirmative action in all areas of its employment practices without regard to race, color, religion, national origin, sex, age, ancestry, citizenship, disability, veteran status, marital status, sexual orientation or any other reason prohibited by law.
Zebra Annual Report 2021.indd 4-6Zebra Annual Report 2021.indd 4-6 3/24/22 5:40 PM3/24/22 5:40 PM

UNITED STATESSECURITIES AND EXCHANGE COMMISSION
Washington, D.C. 20549
FORM 10-K
☒ ANNUAL REPORT PURSUANT TO SECTION 13 OR 15(d) OF THE SECURITIES EXCHANGE ACT OF 1934
For the fiscal year ended December 31, 2021
OR
☐ TRANSITION REPORT PURSUANT TO SECTION 13 OR 15(d) OF THE SECURITIES EXCHANGE ACT OF 1934
For the transition period from to
COMMISSION FILE NUMBER 000-19406
Zebra Technologies Corporation
(Exact name of registrant as specified in its charter)
Delaware 36-2675536(State or other jurisdiction ofincorporation or organization)
(I.R.S. EmployerIdentification No.)
3 Overlook Point, Lincolnshire, IL 60069 (Address of principal executive offices) (Zip Code)
Registrant’s telephone number, including area code: (847) 634-6700
Securities registered pursuant to Section 12(b) of the Act:
Title of each class Trading Symbol(s) Name of exchange on which registeredClass A Common Stock, par value $.01 per share ZBRA The NASDAQ Stock Market, LLC
Securities registered pursuant to Section 12(g) of the Act: None
Indicate by check mark if the registrant is a well-known seasoned issuer, as defined in Rule 405 of the Securities Act. Yes ☒ No ☐
Indicate by check mark if the registrant is not required to file reports pursuant to Section 13 or Section 15(d) of the Exchange Act. Yes ☐ No ☒
Indicate by check mark whether the registrant (1) has filed all reports required to be filed by Section 13 or 15(d) of the Securities Exchange Act of 1934 during the preceding 12 months (or for such shorter period that the registrant was required to file such reports), and (2) has been subject to such filing requirements for the past 90 days. Yes ☒ No ☐
Indicate by check mark whether the registrant has submitted electronically every Interactive Data File required to be submitted pursuant to Rule 405 of Regulation S-T (§ 232.405 of this chapter) during the preceding 12 months (or for such shorter period that the registrant was required to submit such files). Yes ☒ No ☐

Indicate by check mark whether the registrant is a large accelerated filer, an accelerated filer, a non-accelerated filer, a smaller reporting company, or an emerging growth company. See the definitions of “large accelerated filer”, “accelerated filer”, “smaller reporting company”, and “emerging growth company” in Rule 12b-2 of the Exchange Act (Check one):
Large accelerated filer ☒ Accelerated filer ☐ Non-accelerated filer ☐ Smaller reporting company ☐
Emerging growth company ☐
If an emerging growth company, indicate by check mark if the registrant has elected not to use the extended transition period for complying with any new or revised financial accounting standards provided pursuant to Section 13(a) of the Exchange Act. ☐
Indicate by check mark whether the registrant has filed a report on and attestation to its management’s assessment of the effectiveness of its internal control over financial reporting under Section 404(b) of the Sarbanes-Oxley Act (15 U.S.C. 7262(b)) by the registered public accounting firm that prepared or issued its audit report. ☒
Indicate by check mark whether the registrant is a shell company (as defined in Rule 12b-2 of the Securities Act). Yes ☐ No ☒
The aggregate market value of the shares of Class A Common Stock held by non-affiliates of the registrant, computed by reference to the closing price of such stock as of the last business day of the registrant’s most recently completed second quarter, July 3, 2021, was $28.6 billion.
As of February 3, 2022, there were 53,079,740 shares of Class A Common Stock, par value $.01 per share, outstanding.
Documents Incorporated by ReferenceCertain sections of the Registrant’s definitive proxy statement for its Annual Meeting of Stockholders to be held on May
12, 2022, are incorporated by reference into Part III of this report, as indicated herein. The definitive proxy statement shall be filed with the Securities and Exchange Commission within 120 days after the end of the fiscal year to which this report relates.

ZEBRA TECHNOLOGIES CORPORATION AND SUBSIDIARIESYEAR ENDED DECEMBER 31, 2021
TABLE OF CONTENTS
PAGE
PART IItem 1.
Business 4
Item 1A. Risk Factors 13
Item 1B. Unresolved Staff Comments 22
Item 2. Properties 22
Item 3. Legal Proceedings 23
Item 4. Mine Safety Disclosures 23
PART IIItem 5.
Market for Registrant’s Common Equity, Related Stockholder Matters and Issuer Purchases of Equity Securities 24
Item 6. [Reserved] 26
Item 7. Management’s Discussion and Analysis of Financial Condition and Results of Operations 27
Overview 27Results of Operations 30Liquidity and Capital Resources 34Critical Accounting Estimates 36New Accounting Pronouncements 37Non-GAAP Measures 37
Item 7A. Quantitative and Qualitative Disclosures About Market Risk 38
Item 8. Financial Statements and Supplementary Data 39
Report of Independent Registered Public Accounting Firm 40Consolidated Balance Sheets 42Consolidated Statements of Operations 43Consolidated Statements of Comprehensive Income 44Consolidated Statements of Stockholders’ Equity 45Consolidated Statements of Cash Flows 46Notes to Consolidated Financial Statements 47
Note 1: Description of Business and Basis of Presentation 47Note 2: Significant Accounting Policies 47Note 3: Revenues 51Note 4: Inventories 53Note 5: Business Acquisitions 53Note 6: Goodwill and Other Intangibles 58Note 7: Property, Plant and Equipment 59Note 8: Investments 59Note 9: Exit and Restructuring Costs 60Note 10: Fair Value Measurements 60Note 11: Derivative Instruments 61Note 12: Long-Term Debt 63Note 13: Leases 64Note 14: Accrued Liabilities, Commitments and Contingencies 66Note 15: Share-Based Compensation 67Note 16: Income Taxes 71Note 17: Earnings Per Share 74
2

Note 18: Accumulated Other Comprehensive Income (Loss) 74Note 19: Accounts Receivables Factoring 75Note 20: Segment Information & Geographic Data 76
Item 9. Changes in and Disagreements with Accountants on Accounting and Financial Disclosure 79
Item 9A. Controls and Procedures 79
Item 9B. Other Information 81
Item 9C. Disclosure Regarding Foreign Jurisdictions that Prevent Inspections 81
PART IIIItem 10.
Directors, Executive Officers and Corporate Governance 82
Item 11. Executive Compensation 82
Item 12. Security Ownership of Certain Beneficial Owners and Management and Related Stockholder Matters 82
Item 13. Certain Relationships and Related Transactions, and Director Independence 82
Item 14. Principal Accounting Fees and Services 82
PART IVItem 15.
Exhibits and Financial Statement Schedules 83
Item 16. Form 10-K Summary 86
Signatures 87
3

PART I
References in this document to “the Company,” “we,” “us,” or “our” refer to Zebra Technologies Corporation and its subsidiaries, unless the context specifically indicates otherwise.
Safe HarborForward-looking statements contained in this filing are subject to the safe harbor created by the Private Securities Litigation Reform Act of 1995 and are highly dependent upon a variety of important factors, which could cause actual results to differ materially from those expressed or implied in such forward-looking statements. When used in this document and documents referenced, the words “anticipate,” “believe,” “intend,” “estimate,” “will,” and “expect” and similar expressions as they relate to the Company or its management are intended to identify such forward-looking statements but are not the exclusive means of identifying these statements. The forward-looking statements include, but are not limited to, the Company’s financial outlook for the first quarter and full year of 2022. These forward-looking statements are based on current expectations, forecasts and assumptions, and are subject to the risks and uncertainties inherent in the Company’s industry, market conditions, general domestic and international economic conditions, and other factors. These factors include:
• Market acceptance of the Company’s products, services and solution offerings and competitors’ offerings and the potential effects of emerging technologies and changes in customer requirements,
• The effect of global market conditions, including the North America; Europe, Middle East, and Africa (“EMEA”); Latin America; and Asia-Pacific regions in which we do business,
• The impact of changes in foreign exchange rates, customs duties and trade policies due to the large percentage of our sales and operations being outside the United States (“U.S.”),
• Our ability to control manufacturing and operating costs,• Risks related to the manufacturing of the Company’s products and conducting business operations in non-U.S.
countries, including the risk of depending on key suppliers who are also in non-U.S. countries,• The Company’s ability to purchase sufficient materials, parts, and components as well as our ability to provide
services and software to meet customer demand, particularly in light of global economic conditions,• The availability of credit and the volatility of capital markets, which may affect our suppliers, customers, and
ourselves,• Success of integrating acquisitions,• Our ability to attract, retain, develop, and motivate key personnel,• Interest rate and financial market conditions,• Access to cash and cash equivalents held outside the U.S.,• The effect of natural disasters, man-made disasters, public health issues (including pandemics), and cybersecurity
incidents on our business,• The impact of changes in foreign and domestic governmental policies, laws, or regulations,• The outcome of litigation in which the Company may be involved, particularly litigation or claims related to
infringement of third-party intellectual property rights, and• The outcome of any future tax matters or tax law changes.
We encourage readers of this report to review Item 1A, “Risk Factors,” in this report for further discussion of issues that could affect the Company’s future results. We undertake no obligation, other than as may be required by law, to publicly update or revise any forward-looking statements, whether as a result of new information, future events, changed circumstances, or any other reason after the date of this report. Item 1. BusinessThe CompanyWe are a global leader providing Enterprise Asset Intelligence (“EAI”) solutions in the Automatic Identification and Data Capture (“AIDC”) industry. The AIDC market consists of mobile computing, data capture, radio frequency identification devices (“RFID”), barcode printing, and other workflow automation products and services. The Company’s solutions are proven to help our customers and end-users digitize and automate their workflows to achieve their critical business objectives, including improved productivity and operational efficiency, optimized regulatory compliance, and better customer experiences.
We design, manufacture, and sell a broad range of AIDC products, including: mobile computers, barcode scanners and imagers, RFID readers, specialty printers for barcode labeling and personal identification, real-time location systems (“RTLS”), related accessories and supplies, such as labels and other consumables, and related software applications. We also provide a full range of services, including maintenance, technical support, repair, managed and professional services, as well as cloud-based software subscriptions and robotics automation solutions. End-users of our products, solutions and services include those in the retail and e-commerce, manufacturing, transportation and logistics, healthcare, public sector, and other industries. We provide
4

our products, solutions and services globally through a direct sales force and extensive network of over 10,000 channel partners, operating in approximately 180 countries, with 128 facilities and approximately 9,800 employees worldwide.
Through continual innovation of our technologies, we are leading an evolution of the traditional AIDC market into EAI, which encompasses solutions that sense key operational information such as packages moving through a supply chain, equipment in a factory, workers and robots in a warehouse, shoppers in a store, and patients in a hospital. Data from enterprise assets, including status, condition, location, utilization, and preferences, is then analyzed to provide prioritized actionable insights. Finally, with the benefits of cloud computing and connectivity, these insights and directives can be delivered to the right user at the right time to drive the best next action. As a result, our solutions enable enterprises to “sense, analyze, and act” more effectively throughout their workflows.
The evolution of the AIDC market to transform workflows is being driven by strong underlying secular trends in technology, which include the internet of things (“IoT”), cloud-based data analytics, intelligent automation, mobility, computer vision, as well as artificial intelligence and machine learning. The IoT enables the real-time exchange of an increasingly broad set of information among a proliferation of smart, connected devices. Cloud computing and expanded data analytics are allowing enterprises to make better business decisions through improved timeliness and increased visibility into workflows. While traditional AIDC solutions sporadically capture limited amounts of data and populate static enterprise systems, newer solutions that can leverage artificial intelligence through machine learning can analyze real-time data from many sources to generate actionable insights. The continued rapid growth of mobile devices and application software are also significantly expanding mobile computing use cases throughout enterprises and supply chains. With these expanded capabilities, end-users can consume and act upon dynamic enterprise data and information anytime and anywhere. Additionally, computer vision (including machine vision) technology, which enables the automatic extraction and understanding of useful information from a digital image or video, provides a key element in many of our solutions.
AcquisitionsAntuit: On October 7, 2021, the Company acquired Antuit Holdings Pte. Ltd. (“Antuit”) for $145 million in cash, net of cash acquired. Antuit is a provider of demand-sensing and pricing optimization software solutions for retail and consumer products companies. Through this acquisition, the Company expands its portfolio of software solution offerings to customers in these industries by combining Antuit’s platform with its existing software solutions and EVM products. The operating results of Antuit are included in the EVM segment.
Fetch: On August 9, 2021, the Company acquired Fetch Robotics, Inc. (“Fetch”) for total purchase consideration of $301 million, which consisted of $290 million in cash paid, net of cash acquired, and the fair value of the Company’s existing minority ownership interest in Fetch of $11 million, as remeasured upon acquisition. Fetch is a provider of autonomous mobile robot solutions for customers who operate in the manufacturing, distribution, and fulfillment industries, enabling customers to optimize workflows through robotic automation. Through this acquisition, the Company intends to expand its automation solution offerings within these industries. The operating results of Fetch are included within the EVM segment.
Adaptive Vision: On May 17, 2021, the Company acquired Adaptive Vision Sp. z o.o. (“Adaptive Vision”) for $18 million in cash, net of cash acquired. Adaptive Vision is a provider of graphical machine vision software with applications in the manufacturing industry, as well as a provider of libraries and other offerings for machine vision developers. The operating results of Adaptive Vision are included within the EVM segment.
Reflexis: On September 1, 2020, the Company acquired Reflexis Systems, Inc. (“Reflexis”) for $547 million in cash, net of cash acquired. Reflexis is a provider of task and workforce management, execution, and communication software solutions for customers in the retail, food service, hospitality, and banking industries. Through this acquisition, the Company intends to enhance its solution offerings to customers in those industries by combining Reflexis’ platform with its existing software solutions and EVM products. The operating results of Reflexis are included within the EVM segment.
Cortexica: On November 5, 2019, the Company acquired Cortexica Vision Systems Limited (“Cortexica”) for $7 million in cash. Cortexica is a provider of computer vision-based artificial intelligence solutions primarily serving the retail industry. The operating results of Cortexica are included within the EVM segment.
Profitect: On May 31, 2019, the Company acquired Profitect, Inc. (“Profitect”) for total purchase consideration of $79 million, which consisted of $75 million in cash paid, net of cash acquired, and the fair value of the Company’s existing minority ownership interest in Profitect of $4 million, as remeasured upon acquisition. Profitect is a provider of prescriptive analytics software primarily serving the retail industry. Through this acquisition, the Company enhanced its existing software solutions within the retail industry by combining Profitect’s platform with its existing software solutions and EVM products. The operating results of Profitect are included within the EVM segment.
5

Temptime: On February 21, 2019, the Company acquired Temptime Corporation (“Temptime”) for $180 million in cash, net of cash acquired. Temptime is a developer and manufacturer of temperature-monitoring labels and devices. Through this acquisition, the Company expanded its product offerings within the healthcare industry, with possible future applications in other industries involving temperature-sensitive products. The operating results of Temptime are included within the AIT segment.
See Note 5, Business Acquisitions in the Notes to Consolidated Financial Statements for additional details.
Operations and TechnologiesOur operations consist of two reportable segments that provide complementary offerings to our customers: Asset Intelligence & Tracking (“AIT”), which includes barcode and card printing, supplies, services, and location solutions; and Enterprise Visibility & Mobility (“EVM”), which includes mobile computing, data capture, RFID, fixed industrial scanning and machine vision, services and workflow optimization solutions.
Asset Intelligence & TrackingBarcode and Card Printing: We design, manufacture, and sell printers, which produce high-quality labels, wristbands, tickets, receipts, and plastic cards on demand. Our customers use our printers in a wide range of applications, including routing and tracking, patient safety, transaction processing, personal identification, and product authentication. These applications require high levels of data accuracy, speed, and reliability. They also include specialty printing for receipts and tickets for improved customer service and productivity gains.
Our printers use thermal printing technology, which creates images by heating certain pixels of an electrical printhead to selectively image a ribbon or heat-sensitive substrate. Our printers integrate company-designed mechanisms, electrical systems, and firmware that supports serial, parallel, Ethernet, USB, Bluetooth, or 802.11 wireless communications with appropriate security protocols. Enclosures of metal or high-impact plastic help ensure durability of our printers. Printing instructions can be received as a proprietary language such as Zebra Programming Language II, as a print driver-provided image, or as user-defined Extensible Markup Language. These features make our printers easy to integrate into most computer systems.
We also provide dye-sublimination thermal card printers that produce high quality images and are used for secure, reliable personal identification (e.g. state identification cards, drivers’ licenses, and healthcare identification cards), access control (e.g. employee or student building access), and financial transactions (e.g. credit, debit and ATM cards). Additionally, we provide RFID printers that encode data into passive RFID transponders embedded in a label or card. We offer a wide range of accessories and options for our printers, including vehicle mounts and battery chargers.
Supplies: We produce and sell stock and customized thermal labels, receipts, ribbons, plastic cards, and RFID tags suitable for use with our printers, as well as wristbands for use in laser printers. We support our printing products, resellers, and end-users with an extensive line of superior quality, high-performance supplies optimized to a particular end-user’s needs, such as chemical or abrasion resistance, extreme temperature environments, exceptional image quality, or long life. We promote the use of supplies with our printing equipment. Our supplies business also includes temperature-monitoring labels primarily used in vaccine distribution, which incorporate chemical indicators designed to change color upon exceeding predefined time and/or temperature thresholds.
Services: We provide a full range of maintenance, technical support, and repair services. We also provide managed and professional services, including those which help customers manage their devices and related software applications. Our offerings include cloud-based subscriptions and multiple service levels. They are typically contracted through multi-year service agreements. We provide our services directly and through our global network of partners.
Location Solutions: The Company offers a range of RTLS and services that generate precise, on-demand information about the physical location and status of high-valued assets, equipment, and people. These solutions incorporate active and passive RFID technologies, beacons, and other tracking technologies to enable users to locate, track, manage, and optimize the utilization of enterprise assets and personnel. We provide substantially all elements of the location solution, including tags, sensors, exciters, middleware software, and application software. Our location solutions are deployed primarily in manufacturing, aerospace, transportation and logistics, sports, and healthcare industries.
Enterprise Visibility & MobilityMobile Computing: We design, manufacture, and sell rugged and enterprise-grade mobile computing products and accessories in a variety of specialized form factors and designs to meet a wide array of enterprise applications. Purpose-built devices ensure reliable operations for targeted use cases, surviving years of rough handling and harsh environments. Industrial applications include inventory management in warehouses and distribution centers; field mobility applications include field service, post and
6

parcel, and direct store delivery; and retail and customer facing applications include e-commerce, omnichannel, mobile point of sale, inventory look-up, staff collaboration, and analytics. Our mobile computing products primarily incorporate the Android™ operating system and support local-area and wide-area voice and data communications. Our products are also offered with software tools and services that enable secure data transmission while also supporting application development, device configuration, and field support to facilitate seamless, rapid deployment and maximum customer return on investment. Our products often incorporate barcode scanning, global position system and RFID features, and other sensory capabilities. Additionally, specialized features, such as advanced data capture technologies, data analytics technologies, voice and video collaboration tools, and advanced battery technologies, enable our customers to work more efficiently and better serve their own customers.
Data Capture, RFID, Fixed Industrial Scanning, and Machine Vision: We design, manufacture, and sell barcode scanners, RFID readers, industrial machine vision cameras, and fixed industrial scanners. Our portfolio of scanners includes laser scanning and imager products in a variety of form factors, including fixed, handheld, and embedded original equipment manufacturer (“OEM”) modules. Our scanners incorporate a range of technologies including area imagers, linear imagers, and lasers, as well as read linear and two-dimensional barcodes. They are used in a broad range of applications, ranging from supermarket checkouts to industrial warehouse optimization to patient management in hospitals. The design of these products reflects the diverse needs of these markets, with different ergonomics, multiple communication protocols, and varying levels of ruggedness. Our RFID products include fixed readers, RFID enabled mobile computers, and RFID sleds that utilize passive ultra-high frequency to provide high-speed, non-line of sight data capture from hundreds or thousands of RFID tags in near real-time. Using the Electronic Product Code (“EPC”) standard, end-users across multiple industries use our RFID technology to track high-value assets, monitor shipments, and drive increased retail sales through improved inventory accuracy. We also offer mobile computers that support high frequency near-field communications and low frequency radio technologies. In 2021, we introduced fixed industrial scanning and machine vision solutions. Our fixed industrial scanning products automatically track and trace items that move from production through distribution. Our industrial machine vision cameras extend scanning capabilities to help provide quality inspection on product lines. We also provide related software and accessories for these products.
Services: We provide a full range of maintenance, technical support, and repair services. We also provide managed and professional services that, among other things, help customers design, test, and deploy our solutions as well as manage their mobility devices, software applications and workflows. Our offerings include cloud-based subscriptions with multiple service levels, which are typically contracted through multi-year service agreements. We provide our services directly and through our global network of partners.
Workflow optimization solutions: We provide a portfolio of solutions that help our customers improve the agility and productivity of key operational workflows by analyzing and acting on data in real time. Our primary focus is on frontline workers in Zebra’s core customer segments, including retail, transportation and logistics, warehouse and distribution, and healthcare. Our workflow optimization solutions include:
• Software-based solutions, which include workforce management, workflow execution and task management, demand-sensing, price optimization, prescriptive analytics, as well as communication and collaboration-based solutions. Such solutions are typically delivered through cloud-based software subscriptions and leverage big data, artificial intelligence, and mobile and web applications to provide customers with real-time visibility and actionable insights about their business. By analyzing labor, inventory, transactional and real-time situational data, these solutions are able to forecast demand, prescribe actions, schedule workers, and enhance collaboration. Our software-based solutions are available with multiple service levels, and are often contracted through multi-year service agreements;
• Retail solutions, which include a range of physical inventory management solutions, including solutions for full store physical inventories, cycle counts, and analytics; and
• Robotic automation solutions, which include software-powered autonomous robots that enable customers to orchestrate workflows alongside frontline workers, improving productivity and operational efficiency. Our robotic automation solutions are available in a variety of form factors to accommodate many use cases.
Our Competitive Strengths The following are core competitive strengths that we believe enable us to differentiate ourselves from our competitors:
An industry leader focused on improving enterprise workflowsWe are focused on the key technology solutions of EAI that drive improved enterprise workflows, including mobile computing, barcode and card printing, data capture, RFID, fixed industrial scanning, machine vision, and workflow optimization solutions, along with related software, services, and accessories. Our leadership position enables us to work with and support customers globally, in a variety of industries, who are focused on implementing leading-edge solutions.
7

High entry and switching barriersOn a global basis, we have long-standing relationships with end-users and with our extensive network of channel partners. We believe these customer relationships and our strong partner network are critical to our success and would be difficult for a new market entrant to replicate. We believe a significant portion of our products and solutions are deployed with specialized product performance and software application requirements, which could result in high switching costs.
Commitment to innovation and deep industry-specific expertiseOver time, we have developed and delivered improved, targeted end-to-end solutions for our customers. We remain committed to leveraging our technology portfolio and expertise in the industries that we service to continue to develop innovative solutions that meet the key needs of our customers.
Highly diversified business mixWe are highly diversified across business segments, end markets, geographies, and customers. Additionally, we have strong recurring business in services, supplies, and software driven by an extensive global installed base of purpose-built products and solutions.
Global reach and brandWe sell to customers directly and through our network of channel partners around the world. This global presence gives us the capability to supply our customers with products, solutions, and services no matter the location of their operations. In addition, we believe we have strong brand recognition with a reputation in the industry as a trusted and strategic partner, known for delivering high quality products that are reliable and durable.
Scale advantagesWe believe the size and scope of our operations, including market leadership, product and solution development investment, portfolio breadth, and global distribution, give us advantages over our competitors. We believe we have the largest installed base of products compared to other companies in our industry. These characteristics enable us to compete successfully, achieve economies of scale, and develop industry-leading solutions.
Our Business Strategies Leverage our market leadership position and innovation to profitably grow our core businessWe expect to drive revenue growth by continuing to outpace our competition in our core businesses, including mobile computing, data capture, barcode printing, and services. We expect to achieve this by leveraging our broad portfolio of solutions and product innovation and continuing to be a strategic partner to end customers. We also expect to drive growth by capitalizing on technology transitions occurring in the industry, including the transition to the Android™ operating system in mobile computing and transitions in data capture to newer technologies involving 2D and 3D imaging and RFID. This includes increased focus on market segments and geographies that offer share-gain opportunities. In addition, we plan to leverage our market-leading installed base to accelerate growth in attach-oriented offerings, including services, supplies, accessories, and software applications. Our global channel partner network is vital to helping us achieve these goals. As such, we will ensure that we provide the necessary value and support for our partners to be successful.
Advance our Enterprise Asset Intelligence visionOur EAI vision is for every asset and front-line worker to be connected, visible, and fully optimized. We believe that secular technology trends, particularly in IoT, cloud computing, intelligent automation, and mobility, advance our vision and are transforming our customers’ businesses and our industry, providing us with significant new opportunities to create value for our customers and for the Company. We expect to capitalize on these trends, and in particular the proliferation of smart connected sensors and devices in our core market segments, by providing end-to-end solutions that integrate these sensors and devices with cloud-based workflows and analytics applications. We plan to continue investing in the development of technologies that will enable intelligent automation solutions, providing increased visibility into the enterprise, real-time, actionable information, and improved customer experiences. Our solutions will also increasingly include advanced features, functions, and user experiences to drive additional competitive differentiation and elevate our role as a solutions provider.
Increase our opportunity for growth through expansion in adjacent market segmentsWe plan to drive growth through expansion, organically and inorganically, in adjacent market segments that are synergistic with our core markets. We will focus specifically on segments where our products and solutions, workflow expertise, and customer and industry relationships will enable us to provide significant value to end-users.
Enhance financial strength and flexibilityWhile maintaining our strong balance sheet, we intend to continue to improve profitability and cash flow generation through operational execution and increased productivity derived from continuous business process improvement, cost management, and focus on working capital efficiency.
8

Sustainable business model Zebra’s foundational ESG priorities of human capital management, resource conservation, and climate align with our strategic focus and corporate values. Initiatives within these priorities are advanced by our cross-functional Sustainability Council, with executive sponsorship and board oversight. Our approach helps to ensure that our business is sustainable over the long term for the benefit of our primary stakeholder groups, including employees, customers, partners, and investors. We are driving a high-performance, inclusive and diverse culture, striving to consistently be the employer of choice in the communities where we work and live. We also focus on waste reduction, circular economy product innovation with certified refurbished devices, eco-packaging and sustainable product design. Additionally, we are committed to science-based targets on carbon emission reductions in Zebra’s operations and throughout our value chain.
CompetitionWe operate in a highly competitive environment. The need for companies to improve productivity and implement their strategies, as well as the secular trends around IoT, cloud computing, intelligent automation, and mobility, are some of the factors that are creating growth opportunities for established and new competitors.
Key competitive factors include the breadth and quality of products, solutions and services, as well as pricing, design, performance, durability, geographic availability, warranty coverage, brand recognition, relationships with customers and channel partners, and company reputation. We believe we compete effectively with respect to these factors.
Mobile Computing: Competitors in mobile computing and related services include companies that have historically served enterprises with ruggedized devices. For some applications, we compete with companies that provide tablets and smart phones. Competitors include: Datalogic, Honeywell, and Panasonic.
Data Capture, RFID, Fixed Industrial Scanning, and Machine Vision: Competitors that provide a broad portfolio of barcode scanning products and related services that are suitable for most global market applications include Datalogic and Honeywell. We also compete against smaller companies that focus on limited product subsets or specific regions, including Newland and Impinj. Competitors in our fixed industrial scanning and machine vision business include Cognex, SICK, and Keyence.
Barcode and Card Printing: We consider our direct competition in printing to be producers of on-demand thermal transfer and direct thermal label fixed and mobile printing systems and RFID printers/encoders. We also compete with companies engaged in the design, manufacture, and marketing of printing systems that use technologies such as ink-jet, direct marking and laser printing, as well as card printers based on ink-jet, thermal transfer, embossing, film-based systems, encoders, laser engraving, and large-scale dye sublimation printers. In addition, service bureaus, which provide centralized services, compete for end-user business and provide an alternative to our card printing solutions. Competitors include: Fargo Electronics (a unit of HID Global), Honeywell, Sato, Toshiba TEC, TSC, Brother, and Dymo.
Supplies: The supplies industry is highly fragmented with competition comprised of numerous companies of various sizes around the world.
Location Solutions: We compete with a diverse group of companies marketing location solutions that are primarily based on active RFID technologies. Competitors include: Cisco, Impinj, and Stanley Healthcare.
Workflow optimization solutions: We compete with a diverse and varied group of companies across our solution offerings worldwide. Competitors range from providers of software-based solutions serving customers in the retail industry to providers of autonomous mobile robot solutions serving customers in the manufacturing, distribution, and fulfillment industries.
CustomersEnd-users of our products, solutions and services are diversified across a wide variety of industries. We have three customers, who are distributors of the Company’s products and solutions, that individually accounted for more than 10% of our Net sales during the past three years. No other customer accounted for more than 10% of our Net sales during these years. See Note 20, Segment Information & Geographic Data in the Notes to Consolidated Financial Statements for further information.
Our Net sales to significant customers as a percentage of the Company’s total Net sales were as follows:
9

Year Ended December 31, 2021 2020 2019Customer A 22.3 % 20.7 % 16.6 %Customer B 13.6 % 13.9 % 13.7 %Customer C 12.6 % 17.7 % 18.3 %
Sales and MarketingSales: We sell our products and services primarily through distributors (two-tier distribution), value added resellers (“VARs”), independent software vendors (“ISVs”), direct marketers, and OEMs, and our software solutions primarily through our direct sales force. We also sell our products and services directly to a select number of customers through our direct sales force. Distributors purchase our products and sell to VARs, ISVs and others, thereby increasing the distribution of our products globally. VARs, ISVs, OEMs, and systems integrators provide end users with a variety of hardware, accessories, software applications, and services. VARs and ISVs typically customize solutions for specific end-user applications using their industry, systems, and applications expertise. Some OEMs resell Zebra-manufactured products and solutions under their own brands as part of their own product offerings. Because these sales channels provide specific software, configuration, installation, integration, and support services to end-users within various industry segments, these relationships are highly valued and allow our products to reach end users in a wide array of industries around the world. We believe that the breadth of our distributor and channel partner network is a competitive differentiator and enhances our ability to compete. Finally, we experience some seasonality in sales, depending upon the geographic region and industry served.
Marketing: Our marketing function aligns closely with sales and product management functions to market our products and to deliver and promote solutions that address the needs of our customers and partners. Our marketing organization includes regional and channel marketing teams that interface closely with customers, partners, and sellers. Our marketing organization also includes teams that support global strategies and communications, including portfolio marketing, digital marketing, marketing operations and communications, and strategic marketing functions.
Manufacturing and OutsourcingFinal assembly of our hardware products is performed by third-parties, including electronics manufacturing services companies (“EMSs”) and joint design manufacturers (“JDMs”). Our products are currently produced in facilities primarily located in the Asia-Pacific region, including China, Taiwan, Vietnam, and Malaysia, as well as Mexico and Brazil. In 2020, we completed our efforts to diversify our product sourcing footprint by establishing production in Taiwan, Vietnam, and Malaysia and reducing reliance on Chinese-based manufacturing. The EMSs and JDMs produce our products to our design specifications. We maintain control over portions of the supply chain, including supplier selection and price negotiations for key components. The manufacturers generally purchase all the components and subassemblies used in the production of our products. Our products are shipped to regional distribution centers, operated by third party logistics providers or the Company. A portion of products are reconfigured at the distribution centers through firmware downloads, packaging, and customer specific customization before they are shipped to customers. In addition, certain products are manufactured in accordance with procurement regulations and various international trade agreements and remain eligible for sale to the U.S. government.
Production facilities for our supplies products are located in the U.S. and Western Europe. We also supplement our in-house supplies production capabilities with third-party manufacturers, principally located in Asia-Pacific.
Repair services for our products are performed by either our own operations or through third-parties, with repair service hubs located in each of the regions in which we serve our customers.
Research and DevelopmentThe Company devotes significant resources to developing innovative solutions for our target markets and ensuring that our products, solutions, and services maintain high levels of reliability and provide value to end-users. Research and development expenditures for the years ended 2021, 2020, and 2019 were $567 million, $453 million, and $447 million, or 10.1%, 10.2% and 10.0% of Net sales, respectively. Worldwide, we have employed approximately 2,800 engineers and innovation and design experts, who along with contractors, are focused on strengthening and broadening our extensive portfolio of products and solutions.
Intellectual PropertyWe rely on a combination of trade secrets, patents, trademarks, copyrights, and contractual rights to establish and protect our innovations, and hold a large portfolio of intellectual property rights in the U.S. and other countries. As of December 31, 2021, the Company owned approximately 2,300 trademark registrations and trademark applications, and approximately 6,000 patents and patent applications, worldwide.
10

We believe that our intellectual property will continue to provide us with a competitive advantage in our core product areas as well as provide leverage for future technologies. Our success depends more upon our extensive know-how, deep understanding of end-user processes and work-flows, innovative culture, technical leadership and marketing and sales abilities. Although we do not rely only on patents or other intellectual property rights to protect or establish our market position, we will enforce our intellectual property rights when and where appropriate.
Human Capital The Company is committed to attracting, developing, and retaining talent to enable our strategic vision. This commitment directly shapes our approach to fostering a culture of inclusion and diversity and ensuring employees can reach their potential.
We believe that our strong Company culture is a key enabler of our success. The values of accountability, integrity, teamwork, agility, and innovation are central to our culture and how we operate and work together. We take proactive steps to ensure that this culture continues to permeate throughout our organization. Employee engagement within the Company is consistently high with the most recent measures scoring above relevant benchmarks for technology companies. We consider our relations with our employees to be very good. In addition, we believe our compensation structure aligns with our stockholders’ long-term interests by balancing profitability and growth, as well as current market practices, and reflects the Company’s commitment to pay for performance.
In 2021, the Company conducted an employee survey focused on return to office initiatives, and created a new hybrid work model in response to employee feedback. In addition, we implemented new programs and resources to foster employee well-being.
As recognition of the Company’s strong culture and commitment to its employees, the Company was named a top workplace by a number of organizations in 2021, including Forbes, Newsweek, Chicago Tribune, ComputerWorld and Long Island Press among others.
As of December 31, 2021, the Company had approximately 9,800 employees globally, with a majority in sales and technical roles. Our employees work in 55 countries with a majority of our employees located outside of the U.S. Some portions of our business, primarily in Europe, China, and India, are subject to labor laws that differ significantly from those in the U.S. In Europe, for example, it is common for a works council to represent employees when discussing matters such as compensation, benefits, restructurings and layoffs.
Talent Development We are a Company built on great minds, with unique points of view that come together to build something remarkable. We believe that empowered team members enable us to advance our strategic priorities.
As a result, we provide ample employee development opportunities, starting with our robust onboarding process. Our Zebra Education Network online learning platform offers a wide variety of learning and development resources such as formal learning courses, cross-functional development experiences, as well as tools for mentoring and career shadowing. We also offer annual training and certification programs. Additionally, on an annual basis, we conduct a comprehensive talent review to assess our leadership pipeline and align on the skills we need to proactively develop employees for the future. This annual exercise is complemented by quarterly sessions with management to ensure we make progress on our critical talent development efforts throughout the year.
Inclusion and DiversityWe are fostering a diverse workforce where employees are encouraged to bring their best selves to work, and where all are seen, heard, valued, and respected. We believe a diverse workforce and inclusive culture fosters innovation at the Company. We believe that to realize our inclusion and diversity vision, all employees should be engaged in promoting and actively driving inclusion and diversity. In 2020, we expanded our Inclusion & Diversity program, after formalizing the program in 2018, and launched our Inclusion & Diversity Advisory Council, comprised of Executive Leadership Team members and others from across the organization to oversee our strategy and champion our efforts. In 2021, we continued to expand our inclusion and diversity efforts by launching our Inclusion Champions program, which is comprised of employees who help to support key inclusion and diversity objectives and act as role models for inclusive behaviors. We also introduced formal inclusion and diversity goals for all people leaders and strongly encouraged all employees to create inclusion and diversity goals.
The Company is also fostering inclusion and diversity through the following mechanisms:
• Inclusion Networks: We have a number of employee-led inclusion groups including the Women’s Inclusion Network (WIN), the LGBTQ+ group called ZEAL (Zebra Equality Alliance), the Veterans group called VETZ, the Hispanic Inclusion Network called UNIDOZ, Zebras of African Descent (ZAD), a group advocating for inclusion and
11

accessibility for people of all abilities called ZoAA (Zebras of All Abilities), Asians and Allies (A2Z), and EDGE (Empowering Dynamic Generational Employees) which is geared towards our Millennial and Gen Z early career professionals. Each group is sponsored by one or more members of our Executive Leadership Team. We have collaborated with some of our inclusion groups to offer structured mentorship programs to focus on developing diverse talent.
• Imbedding Inclusive Behaviors: We provide a variety of training including unconscious bias awareness for all employees, interviewing bias awareness training for hiring managers, and a mandatory Inclusive Leadership workshop for all people leaders. Additionally, our Inclusion Networks host a wide variety of events focused on increasing cultural competency. In 2021, we also launched additional diversity and inclusion learning tools and resources, including discussion forums and on-demand learning geared specifically on allyship.
• External Outreach: The Company has set aspirational program goals, striving to increase the representation of women and ethnic racial minority groups across the entire organization, including in leadership roles (director level and above). To support these goals, we create a diverse slate of candidates wherever possible, with additional emphasis on our director level roles and above. We have established talent acquisition partnerships with organizations such as Catalyst, Society of Women Engineers (SWE), National Society of Black Engineers (NSBE), Disability IN, Hispanic Alliance for Career Enhancement (HACE), Hiring our Heroes (HOH), Out in STEM (oSTEM), as well as Historically Black Colleges and Universities to enhance our recruitment efforts and deepen our partnerships with diverse talent.
Regulatory Matters
Wireless Regulatory MattersOur business is subject to certain wireless regulatory matters. The use of wireless voice, data, and video communications systems requires radio spectrum, which is regulated by government agencies throughout the world. In the U.S., the Federal Communications Commission (“FCC”) and the National Telecommunications and Information Administration (“NTIA”) regulate spectrum use by non-federal entities and federal entities, respectively. Similarly, countries around the world have one or more regulatory bodies that define and implement the rules for use of the radio spectrum, pursuant to their respective national laws and international coordination under the International Telecommunications Union. We manufacture and market products in spectrum bands already made available by regulatory bodies, these include voice and data infrastructure, mobile radios, and portable or hand-held devices. Consequently, our results of operations could be positively or negatively affected by the rules and regulations adopted from time-to-time by the FCC, NTIA, or regulatory agencies in other countries. Our products operate both on the licensed and unlicensed spectrum. The availability of additional radio spectrum may provide new business opportunities, and consequently, the loss of available radio spectrum may result in the loss of business opportunities. Regulatory changes in current spectrum bands may also provide opportunities or may require modifications to some products so they can continue to be manufactured and marketed.
Other Regulatory MattersSome of our operations use substances regulated under various federal, state, local, and international laws governing the environment and worker health and safety, including those governing the discharge of pollutants into the ground, air and water, the management and disposal of hazardous substances and wastes and the cleanup of contaminated sites. Certain products are subject to various federal, state, local, and international laws governing chemical substances in electronic products. During 2021, compliance with U.S. federal, state and local, and foreign laws regulating the discharge of materials into the environment, or otherwise relating to the protection of the environment did not have a material effect on our business or results of operations.
Available InformationOur website address is www.zebra.com. The information on our website is not, and shall not be deemed to be, a part of this Annual Report on Form 10-K or incorporated into any other filings we make with the Securities and Exchange Commission (“SEC”). Our annual report on Form 10-K, quarterly reports on Form 10-Q, current reports on Form 8-K, and any amendments to those reports, are made available free of charge on the Investor Relations page of our website as soon as reasonably practicable after we electronically file them with or furnish them to the SEC.
12

Item 1A. Risk Factors
Investors should carefully consider the risks, uncertainties, and other factors described below, as well as other disclosures in this report, including Management’s Discussion and Analysis of Financial Condition and Results of Operations, because they could have a material adverse effect on our business, financial condition, operating results, cash flows, and growth prospects. These risks are not the only risks we face. Our business operations could also be affected by additional factors that are not presently known to us or that we currently consider to be immaterial. No priority or significance is intended by, nor should be attached to, the order in which the risk factors appear.
General Business and Industry Risks
The Company is vulnerable to the potential difficulties associated with the increase in the complexity of our business. We have grown rapidly over the last several years through acquisition and worldwide growth. This growth has caused increased complexities in the business. We believe our future success depends in part on our ability to manage our growth and increased complexities of our business. The following factors could present difficulties to us:
• Managing our distribution channel partners and end-user customers;• Managing our contract manufacturing and supply chain;• Manufacturing an increased number of products;• Developing and managing custom solutions offerings;• Managing parties to whom we have outsourced portions of our business operations;• Managing administrative and operational burdens;• Managing stakeholder interests including customer, investor and employee social responsibility matters;• Maintaining and improving information technology infrastructure to support growth;• Managing the integration of acquisitions;• Managing logistical problems common to complex, expansive operations;• Managing our international operations; and• Attracting, developing and retaining individuals with the requisite technical expertise to develop new technologies and
introduce new products and solutions.
Inability to consummate future acquisitions at appropriate prices could negatively impact our growth rate and stock price. Our ability to expand revenues, earnings, and cash flow depends in part upon our ability to identify and successfully acquire and integrate businesses at appropriate prices and to realize anticipated synergies. Acquisitions can be difficult to identify and consummate due to competition among prospective buyers and the need to satisfy applicable closing conditions and obtain antitrust and other regulatory approval on acceptable terms.
The Company could encounter difficulties in any acquisition it undertakes, including unanticipated integration problems and business disruption. Acquisitions could also dilute stockholder value and adversely affect operating results. We may acquire or make investments in other businesses, technologies, services, products, or solutions. An acquisition may present business issues which are new to us. The process of integrating any acquired business, technology, service, product, or solution into our operations may result in unforeseen operating difficulties and expenditures. Integration of an acquired company also may consume considerable management time and attention, which could otherwise be available for ongoing operations and the further development of our existing business. These and other factors may result in benefits of an acquisition not being fully realized.
Acquisitions also may involve a number of risks, including, but not limited to:
• Difficulties and uncertainties in retaining the customers, distributors, vendors, or other business relationships from the acquired entities;
• The loss of key employees of acquired entities;• Disruptions in our business due to difficulties integrating and reorganizing operations, products, technologies and
personnel;• The ability of acquired entities to fulfill their customers’ obligations;• The inheritance of known, and the discovery of unknown, issues or liabilities;• Pre-closing and post-closing acquisition-related earnings charges could adversely impact operating results and cash
flows in any given period, and the impact may be substantially different from period to period;• The failure of acquired entities to meet or exceed expected operating results or cash flows could result in impairment
of goodwill or intangible assets acquired;• The ability to implement internal controls and accounting systems necessary to be compliant with requirements
applicable to public companies subject to SEC reporting, which could result in misstated financial reports; and
13

• Future acquisitions could result in changes such as potentially dilutive issuances of equity securities, the incurrence of debt and contingent liabilities, and goodwill impairment charges.
The Company may not be able to continue to develop products or solutions to address user needs effectively in an industry characterized by ongoing change. To be successful, we must adapt to rapidly changing technological and application needs by continually improving our products and solutions, as well as introducing new products, solutions, and services, to address user demands.
The Company’s industry is characterized by:
• Evolving industry standards;• Frequent new product, solution, and service introductions;• Evolving distribution channels;• Increasing demand for customized product and software solutions;• Changing customer demands; and• Changing security protocols.
Future success will depend on our ability to effectively and economically adapt in this evolving environment. We could incur substantial costs if we must modify our business to adapt to these changes, and may even be unable to adapt to these changes.
The Company participates in a competitive industry, which may become more competitive. Competitors may be able to respond more quickly to new or emerging technology and changes in customer requirements. The markets that we serve are rapidly evolving and highly competitive. Some of our products, solutions and services are in direct competition with similar or alternative products, solutions and services provided by our competitors. In addition, we often compete with local competitors that may have a substantial advantage in attracting customers in their countries due to more established branding in that country, greater knowledge with respect to the tastes and preferences of customers residing in that country or their focus on a single market. Because of the potential for consolidation in any market, such competitors may become larger, and increased size could permit them to operate in wider geographic areas. To remain competitive, we believe we must continue to effectively and economically:
• Identify and evolve with customer needs, emerging technologies, and industry trends;• Monitor disruptive technologies and business models;• Innovate, develop and timely commercialize new technologies, solutions, and services;• Competitively price our products, solutions and services;• Offer superior customer service;• Provide products and solutions of high quality and reliability; • Provide dependable and efficient distribution networks; and• Attract, retain and develop employees with technical expertise and an understanding of our industry and customer
needs.
We cannot assure that we will be able to compete successfully against current or future competitors or technologies. Current or future competitors are likely to continue to develop and introduce new and enhanced products, solutions and services that could cause a decline in market acceptance of our products, solutions or services, or result in the loss of major customers. Increased competition in our industry may result in price reductions, lower gross profit margins, and loss of market share, and could require increased spending on research and development, sales and marketing, and customer support. In addition, we may not be able to effectively anticipate and react to new entrants in the marketplace competing with our products, solutions or services. Further, as we expand into markets beyond our core products, we may face well established competitors, placing us at a disadvantage in a new competitive landscape. Some competitors may make strategic acquisitions or establish cooperative relationships with suppliers or companies that produce complementary products and solutions, which may create additional pressures on our competitive position in the marketplace. An inability to compete successfully could have an adverse effect on our business and results of operations.
Operational Risks
The Company has substantial operations and sells a significant portion of our products, solutions and services outside of the U.S. and purchases important components, including final products, from suppliers located outside the U.S., many of whom with operations concentrated in China. Shipments to non-U.S. customers are expected to continue to account for a material portion of Net sales. We also expect to continue the use of third-party contract manufacturing services with non-U.S. production and assembly operations for our products.
14

Risks associated with operations, sales, and purchases outside the United States include:
• Fluctuating foreign currency rates could restrict sales, increase costs of purchasing, and affect collection of receivables outside of the U.S.;
• Volatility in foreign credit markets may affect the financial well-being of our customers and suppliers; • Violations of anti-corruption laws, including the Foreign Corrupt Practices Act and the U.K. Bribery Act, could result
in large fines and penalties;• Adverse changes in, or uncertainty of, local business laws or practices, including the following:
• Imposition of burdensome tariffs, quotas, taxes, trade barriers, or capital flow restrictions;• Restrictions on the export or import of technology may reduce or eliminate the ability to sell in, or purchase
from, certain markets;• Political and economic instability may reduce demand for our products or put our non-U.S. assets at risk;• Limited intellectual property protection in certain countries may limit recourse against infringement on our
products or may cause us to refrain from selling in certain geographic territories;• Staffing may be difficult including higher than anticipated turnover;• A government-controlled exchange rate and limitations on the convertibility of currencies, including the
Chinese Yuan;• Transportation delays and customs related delays may affect production and distribution of our products; • Geopolitical uncertainty or turmoil could negatively affect our operations or those of our customers or
suppliers;• Effectively managing and overseeing operations that are distant and remote from corporate headquarters; and• Integration and enforcement of laws varies significantly among jurisdictions and may change over time.
Third parties may allege that the Company or our suppliers infringe upon their intellectual property rights. Periodically, third parties claim that we or our suppliers infringe upon their intellectual property rights. As we continue to expand our business and incorporate new technologies into our products and solutions, these types of claims may increase. Any of these claims, with or without merit, could result in costly litigation and divert the attention of key personnel. To the extent a violation of a third party’s patent or other intellectual property right is established, we may be prevented from operating our business as planned and we may be required to pay costly judgments or settlements, enter into costly licensing arrangements or use a non-infringing method to accomplish our business objectives, any of which could have a negative impact on our operating margins. See Item 3, Legal Proceedings for additional information regarding current patent litigation.
The inability to protect intellectual property could harm our reputation, and our competitive position may be materially damaged. Our intellectual property is valuable and provides us with certain competitive advantages. We use copyrights, patents, trademarks, trade secrets, and contracts to protect these proprietary rights. Despite these precautions, third parties may be able to copy or reproduce aspects of our intellectual property and our products or, without authorization, to misappropriate and use information we regard as trade secrets. Additionally, the intellectual property rights we obtain may not be sufficient to provide us with a competitive advantage and may be successfully challenged, invalidated, circumvented, or infringed. In any infringement litigation that the Company may undertake to protect our intellectual property, any award of monetary damages may be unlikely or very difficult to obtain, and any such award we may receive may not be commercially valuable. Furthermore, efforts to enforce or protect our proprietary rights may be ineffective and could result in the invalidation or narrowing of the scope of our intellectual property and may cause us to incur substantial litigation costs. Because of the substantial amount of discovery required in connection with intellectual property litigation, there is a risk that some of the Company’s confidential information could be compromised by disclosure during this type of litigation. Some aspects of our business and services also rely on technologies, software, and content developed by or licensed from third parties, and we may not be able to maintain our relationships with such third parties or enter into similar relationships in the future on reasonable terms or at all.
We currently use third-party and/or open source operating systems and associated application ecosystems in certain of our products and solutions. Such parties ceasing continued development of the operating systems or restricting our access to such operating systems could adversely impact our business and financial results. We are dependent on third-parties’ continued development of operating systems, software application ecosystem infrastructures, and such third-parties’ approval of our implementations of their operating systems and associated applications. If such parties cease to continue development or support of such operating systems or restrict our access to such operating systems, we would be required to change our strategy for such devices. Our financial results could be negatively impacted by a resulting shift away from the operating systems we currently use and the associated applications ecosystem could be costly and difficult. A strategy shift could increase the burden of development on the Company and potentially create a gap in our portfolio for a period of time, which could competitively disadvantage us.
Cybersecurity incidents could disrupt business operations. We rely on information technology systems throughout the Company to keep financial records, process orders, manage inventory, coordinate shipments to distributors and customers, maintain confidential and proprietary information, and other technical activities, and operate other critical functions such as internet connectivity, network communications, and email. The Company stores confidential and proprietary information
15

through cloud-based services that are hosted by third parties where we have less influence over security protocols. In addition, our customers may use certain of our products and solutions to transmit and/or process personal data and other sensitive information. Like many companies, we continually strive to meet industry information security standards relevant to our business. We periodically perform vulnerability assessments, remediate vulnerabilities, review log/access, perform system maintenance, manage network perimeter protection, implement and manage disaster recovery testing, and provide periodic educational sessions to our employees to foster awareness of schemes to access sensitive information. Despite our implementation of a variety of security controls and measures, as well as those of our third-party vendors, there is no assurance that such actions will be sufficient to prevent a cybersecurity incident. Further, as cybercrime and threats continue to rapidly evolve and become increasingly more difficult to detect and defend against, our current security controls and measures may not be effective in preventing cybersecurity incidents and we may not have the capabilities to detect certain vulnerabilities. A cybersecurity incident could include an attempt to gain unauthorized access to digital systems for purposes of misappropriating assets or sensitive information, corrupting data, or causing operational disruption. Phishing and other types of attempts to obtain unauthorized information or access are often sophisticated and difficult to detect or defeat.
Cybersecurity incidents can take a variety of forms including, unintentional events as well as deliberate attacks by individuals, groups and sophisticated organizations, such as state sponsored organizations or nation-state actors. Further, certain of our third party vendors have limited access to our employee and customer data and may use this data in unauthorized ways. Any such cybersecurity incident or misuse of our employees’ or customers’ data may lead to a material disruption of our core business systems, the loss or corruption of confidential business information, and/or the disclosure of personal data that in each case could result in an adverse business impact as well as possible damage to our brand. This could also lead to a public disclosure or theft of private intellectual property and a possible loss of customer confidence.
While we have experienced and expect to continue to experience these types of threats and incidents, there have been no material incidents incurred to-date at the Company. If our core business operations, or that of one of our third-party service providers, were to be breached, this could affect the confidentiality, integrity, and availability of our systems and data. Any failure on the part of us or our third-party service providers to maintain the security of data we are required to protect, including via the penetration of our network security and the misappropriation of confidential and proprietary information, could result in: business disruption; damage to our reputation; financial obligations to third parties; fines, penalties, regulatory proceedings; private litigation with potentially large costs; deterioration in our suppliers’, distributors’, and customers’ confidence in us; as well as other competitive disadvantages. Such failures to maintain the security of data could have a material adverse effect on our business, financial condition, and results of operations. While we continue to perform security due diligence, there is always the possibility of a significant breach.
Any threats or security breaches to our systems may negatively impact our customers. Our products and solutions that are deployed in customer environments also have the possibility of being breached, which could result in disclosure of a customer’s confidential information, or disrupt the availability of the customer’s data and systems. Further, our customers may fail to adopt adequate security controls and measures, or may fail to timely update their products and solutions to install or enable security patches, which may result in a security breach. The market perception of the effectiveness of our products and our reputation could also be harmed as a result of any actual or perceived security breach that occurs in our network or in the network of a customer of our products, regardless of whether the breach is attributable to our products, the systems of other vendors or to actions of malicious parties. It is possible that such a breach, or a perceived breach, could result in delays in, or loss of market acceptance of, our products, solutions or services; diversion of our resources; injury to our reputation; theft or misuse of our intellectual property or other assets; increased service and warranty expenses; and payment of damages. To date, we have had no material incidents related to the security of our products or solutions. Further, strategic customers may negotiate specific controls and we may incur additional costs to comply with such customer-specific controls. Although we maintain insurance related to cybersecurity risks, there can be no assurance that our insurance will cover the particular cyber incident at issue or that such coverage will be sufficient.
We may incur liabilities as a result of product failures due to actual or apparent design or manufacturing defects. We have been subject to product liability claims, and may continue to be subject to such claims, including claims for property or economic damages or personal injury, where damages arose, and may continue to arise, from our products as a result of actual or apparent design or manufacturing defects. In addition, such design or manufacturing defects may occur not only in our own designed products, but also in components provided by third-party suppliers. We seek to limit such risk through insurance protection as well as product design, manufacturing quality control processes, product testing and contractual indemnification from suppliers. Although there have been no material claims to-date at the Company, due to the growing size of the Company’s installed product base and growing number of applications in which our products can be used, an actual or alleged design or manufacturing defect could result in product recalls, injury to our reputation, and customer service costs or legal costs that could have material adverse effects on our financial results.
Defects or errors in the Company’s software products could harm our reputation, result in significant cost to us, and impair our ability to market such products. Our software may contain undetected errors, defects, or bugs. Although we have not suffered significant harm from any errors, defects, or bugs to date, we may discover significant errors, defects, or bugs in the future that we may not be able to correct or correct in a timely manner. Any future errors, defects, or bugs found in our software
16

products and related services may result in delays in, or loss of market acceptance of, our products, solutions or services; diversion of resources; injury to reputation; increased service and warranty expenses; and payment of damages; which could have a material adverse effect on our financial results.
Our business success depends on our ability to attract, retain, develop and motivate key personnel. Our business and results of operations could be adversely affected by increased competition for highly skilled employees, higher employee turnover, or increased compensation and benefit costs. The future success of the Company is substantially dependent on the continued services and contributions of key personnel, including senior management and other highly skilled employees. The experience, industry knowledge, and skill sets of our employees materially benefit our operations and performance, and the ability to attract, retain, develop, and motivate highly skilled employees is important to our long-term success. Skilled employees in our industry are in high demand and competition for their experience and skill sets is intense. The incentives and benefits we have available to attract, retain, and motivate employees may become less effective as employees seek new or different opportunities based on factors such as compensation, benefits, mobility, and flexibility that are different from what we offer. Although we strive to be an employer of choice, we may not be able to continue to successfully attract, retain, develop, or motivate key personnel in the future. Any disruption in the services of key personnel may have a material adverse effect on our business and results of operations.
A natural disaster, widespread public health issue, civil unrest, or man-made disaster may cause supply disruptions that could adversely affect our business and results of operations. Natural disasters or widespread public health issues, including pandemics, may occur in the future and the Company is not able to predict to what extent or duration any such disruptions will have on our ability to maintain ordinary business operations. The Company’s operations and facilities are subject to catastrophic loss due to fire, flood, terrorism, or other natural or man-made disasters. If any of our facilities were to experience a catastrophic loss, it could disrupt our operations, delay production, shipments and revenue, and result in large expenses to repair or replace the facility. Following an interruption to our business, the Company could require substantial recovery time, experience significant expenditures to resume operations, and lose significant sales. If such a disruption were to occur, we could breach agreements, our reputation could be harmed, and our business and operating results could be adversely affected. The consequences of a natural disaster or widespread public health issue may have a material adverse effect on our business and results of operations.
The effects of the COVID-19 pandemic have and may continue to adversely affect our business, financial results, and results of operations. The coronavirus (“COVID-19”) pandemic has been, and continues to be, complex and rapidly evolving, and has impacted our business, most recently, primarily related to supply chain disruption (including higher fulfillment costs and component shortages) and labor constraints. The duration and extent of the impact of the COVID-19 pandemic on our business, operations and financial results depends on factors that cannot be accurately predicted at this time, such as the severity and transmission rate of COVID-19, the emergence of new variants of the virus, the extent and effectiveness of containment actions, the extent to which vaccines and/or other medical treatments are developed and made available to and accepted by the public, and the impact of these and other factors on our stakeholders.
The U.S. federal, state, and local governments as well as non-U.S. governments, to varying degrees, have imposed, and continue to impose, several protocols and regulations restricting activities of individuals in an effort to limit the spread of COVID-19. Over the course of the pandemic we have implemented a number of measures in an effort to protect the health and well-being of our employees, customers and suppliers, including having the majority of office workers work remotely during the height of the pandemic and gradually returning to offices as restrictions are lifted, limiting employee travel, and implementing more strenuous health and safety measures for hosting and attending in-person industry events. As governments ease their restrictions, we have been allowing, and will continue to allow, our employees to come back to work in our offices in a controlled approach, with modified business practices, including implementing social distancing protocols consistent with government regulations, vaccine verification, health screening, office capacity restrictions and tracking and tracing protocols where applicable, provision of personal protective equipment, increasing air exchange/ventilation and extensively and frequently disinfecting our workspaces. However, there is no guarantee that such protocols will be successful in preventing the spread of COVID-19 amongst our employees, and even as employees return to our offices, we may be prevented from conducting business activities at full capacity for an indefinite period of time. The extent and duration of ongoing workplace restrictions and limitations, particularly in sites with significant headcount, could adversely impact our operations and our ability to execute on strategic imperatives for our business. Moreover, vaccine and testing mandates have been announced in jurisdictions in which our businesses operate. As a company under U.S. Occupational Safety and Health Administration (“OSHA”) jurisdiction, we must comply with OSHA COVID-19 mandates, such as the Emergency Temporary Standard (“ETS”) that was announced on November 5, 2021, but currently remains in flux and under review by the courts as to final implementation and compliance. Our implementation of these mandates, and any future mandates, may result in employee attrition, including attrition of critically skilled labor, and may cause difficulty in attracting and retaining talent necessary for our business operations and securing future labor needs, which could have a material adverse effect on our business, financial condition, and results of operations. The potential negative effects to our operations, including reductions in production levels,
17

research and development activities, and increased efforts to mitigate the impact of COVID-19, may adversely affect our ability to deliver our products, solutions and services.
Further, the conditions caused by COVID-19 have affected, and may continue to affect, the overall demand environment for our products, solutions and services. The level of demand for certain product components has resulted in, and may continue to result in, lengthened lead times and higher input costs, including freight. This has impacted, and may continue to impact, our ability to meet customer demand as well as profitability. An inability to meet customer demand may also adversely affect our customers’ ability or willingness to purchase our products, solutions or services. Additionally, our financial results may be adversely impacted by challenges in the macroeconomic environment, including market inflation, as a result of global supply chain shortages.
If COVID-19 or its variants become more prevalent in the locations where our customers, suppliers, or we conduct business, we may experience more pronounced disruptions in our operations. If we are not able to respond to and manage the impact of such events effectively, our business and results of operations in future periods may be adversely affected. Moreover, the impacts of the COVID-19 pandemic may exacerbate other pre-existing risks, such as global economic conditions, political, regulatory, social, financial, operational and cybersecurity as well as similar risks relating to our suppliers and customers, any of which could have a material adverse effect on our business.
We are exposed to risks under large, multi-year system and solutions and services contracts that may negatively impact our business. We enter into large, multi-year system and solutions and services contracts with our customers that expose us to risks, including among others: (i) technological risks, especially when contracts involve new technology; (ii) financial risks, including the accuracy of estimates inherent in projecting costs associated with large, long-term contracts and the related impact on operating results; and (iii) cybersecurity risks, especially in solutions or managed services contracts with customers that process personal data. Recovery of front-loaded costs incurred on long-term managed services and software-based solutions contracts with customers is dependent on the continued viability of such customers. The insolvency of customers could result in a loss of anticipated future revenue attributable to that program or product, which could have an adverse impact on our profitability.
We enter into fixed-price contracts that could subject us to losses in the event we fail to properly estimate our costs. If our initial cost estimates are incorrect, we can lose money on these contracts. Because many of these contracts involve new technologies and applications and require the Company to engage subcontractors and can last multiple years, unforeseen events, such as technological difficulties, fluctuations in the price of raw materials, problems with our subcontractors or suppliers, and other cost overruns, can result in the contract pricing becoming less favorable or even unprofitable to us and have an adverse impact on our financial results. In addition, a significant increase in inflation rates could have an adverse impact on the profitability of longer-term contracts.
We utilize the services of subcontractors to perform under many of our contracts, and the inability of our subcontractors to perform in a timely and compliant manner could negatively impact our performance obligations as the prime contractor. We engage subcontractors on many of our contracts and our use of subcontractors has and may continue to increase as we expand our global solutions and services business. Our subcontractors may further subcontract performance and may supply third-party products and software. We may have disputes with our subcontractors, including disputes regarding the quality and timeliness of work performed by a subcontractor and the functionality, warranty and indemnities of products, software, and services supplied by a subcontractor. We are not always successful in passing along customer requirements to our subcontractors, and thus in some cases may be required to absorb contractual risks from our customers without corresponding back-to-back coverage from our subcontractors. Our subcontractors may not be able to acquire or maintain the quality of the materials, components, subsystems, and services they supply, or secure preferred warranty and indemnity coverage from their suppliers, which might result in greater product returns, service problems, warranty claims and costs, and regulatory compliance issues and could harm our business, financial condition, and results of operations.
We have outsourced portions of certain business operations such as repair, distribution, engineering services, and information technology services and may outsource additional business operations, which limits our control over these business operations and exposes us to additional risk as a result of the actions of our outsource partners. We are not able to directly control certain business operations that we outsource. Our outsource partners may not prioritize our business over that of their other customers and they may not meet our desired level of service, cost reductions, or other metrics. In some cases, our outsource partners’ actions may result in our being found to be in violation of laws or regulations, such as import or export regulations. As many of our outsource partners operate outside of the U.S., our outsourcing activity exposes us to information security vulnerabilities and increases our global risks. In addition, we are exposed to the financial viability of our outsource partners. Once a business activity is outsourced, we may be contractually prohibited from, or may not practically be able to, bring such activity back within the Company or move it to another outsource partner. The actions of our outsource partners could result in reputational damage to us and could negatively impact our financial results. Further, we have from time-to-time, and in certain instances will continue to, transition our outsourced operations to new service providers and/or to different geographies. Such transition activities between new or existing outsource partners or across different geographies, as well as insourcing activities, could
18

result in additional cost, time and management attention in order to effectively manage the transition, which could negatively impact our financial results.
Failure of our suppliers, subcontractors, distributors, resellers, and representatives to use acceptable legal or ethical business practices could negatively impact our business. It is our policy to require suppliers, subcontractors, distributors, resellers, and third-party sales representatives (“TPSRs”) to operate in compliance with applicable laws, rules, and regulations, including those regarding working conditions, employment practices, environmental compliance, anti-corruption, and trademark and copyright licensing. However, we do not control their labor and other business practices. If one of our suppliers, subcontractors, distributors, resellers, or TPSRs violates labor or other laws or implements labor or other business practices that are regarded as unethical, the shipment of finished products to us could be interrupted, orders could be canceled, relationships could be terminated, and our reputation could be damaged. If one of our suppliers or subcontractors fails to procure necessary license rights to trademarks, copyrights, or patents, legal action could be taken against us that could impact the salability of the Company’s products and solutions, and expose us to financial obligations to a third-party. Any of these events could have a negative impact on our sales and results of operations.
We rely on third-party dealers, distributors, and resellers to sell many of our products, services and solutions, and their failure to effectively bring our products, services and solutions to market may negatively affect our results of operation and financial results. In addition to our own sales force, we offer our products, services and solutions through a variety of third-party dealers, distributors, and resellers who may also market other products, services and solutions that compete with ours. Failure of one or more of our third-party dealers, distributors, or resellers to effectively promote our offerings could affect our ability to bring products, services and solutions to market and have a negative impact on our results of operations. Any changes to our channel program may cause some of our third-party dealers, distributors, or resellers to exit the program due to modifications to the program structure, which may reduce our ability to bring products and solutions to market and could have a negative impact on our results of operations.
Some of these third-parties are smaller and more likely to be impacted by a significant decrease in available credit that could result from a weakness in the financial markets. If credit pressures or other financial difficulties result in insolvency for third-party dealers, distributors, or resellers and we are unable to successfully transition end-customers to purchase our products and solutions from other third-parties or from us directly, it may cause, and in some cases, has caused, a negative impact on our financial results.
Final assembly of certain of our products is performed by third-party electronics manufacturers. We may be dependent on these third-party electronics manufacturers as a sole-source of supply for the manufacture of such products. A failure by such manufacturers to provide manufacturing services to us as we require, or any disruption in such manufacturing services up to and including a catastrophic shut-down, may adversely affect our business results. Because we rely on these third-party electronics manufacturers to manufacture our products, we may incur increased business continuity risks. We are not able to exercise direct control over the assembly or related operations of certain of our products. If these third-party manufacturers experience business difficulties or fail to meet our manufacturing needs, then we may be unable to satisfy customer product demands, lose sales, and be unable to maintain customer relationships. Longer production lead times may result in shortages of certain products and inadequate inventories during periods of unanticipated higher demand. Without such third parties continuing to manufacture our products, we may have no other means of final assembly of certain of our products until we are able to secure the manufacturing capability at another facility or develop an alternative manufacturing facility. This transition could be costly and time consuming. We have taken actions to diversify, and may take additional actions to diversify in the future, our product sourcing footprint. Such actions have, and may again, result in additional costs.
Our future operating results depend on our ability to purchase a sufficient amount of materials, parts, and components, as well as services and software to meet the demands of customers. We source some of our components from sole source suppliers. Any disruption to our suppliers or significant increase in the price of supplies, inclusive of transportation costs, could have a negative impact on our results of operations. Our ability to meet customers’ demands depends, in part, on our ability to obtain in a timely manner an adequate delivery of quality materials, parts, and components, as well as services and software from our suppliers. In addition, certain supplies are available only from a single source or limited sources and we may not be able to diversify sources in a timely manner. If demand for our products, solutions or services increases from our current expectations or if suppliers are unable or unwilling to meet our demand for other reasons, including as a result of natural disasters, public health issues, severe weather conditions, or financial issues, we could experience an interruption in supplies or a significant increase in the price of supplies that could have a negative impact on our business. We have experienced shortages in the past that have negatively impacted our results of operations and may experience such shortages in the future. At times we have and may continue to execute multi-year purchase commitments with suppliers that contain minimum spend thresholds, which we are obligated to fulfill even if customer demand declines. In addition, volatility in customer demand, product availability, and costs to transport products, may result in increased operating input costs. Also, credit constraints at our suppliers could cause us to accelerate payment of accounts payable by us, impacting our cash flow.
19

In addition, our current contracts with certain suppliers may be canceled or not extended by such suppliers and, therefore, not afford us with sufficient protection against a reduction or interruption in supplies. Moreover, in the event any of these suppliers breach their contracts with us, our legal remedies associated with such a breach may be insufficient to compensate us for any damages it may suffer.
Financial and Market Risks
The impact of changes in customs duties and trade policies in the United States and corresponding actions by other countries in which the Company does business could adversely affect our financial performance. The Company currently imports a significant percentage of our products into the U.S., and an increase in customs duties with respect to these imports could negatively impact the Company’s financial performance. Although the Company has taken actions to diversify its product sourcing footprint, these efforts may not be sufficient to mitigate negative impacts on the Company’s financial performance resulting from an increase in customs duties.
Taxing authority challenges may lead to tax payments exceeding current reserves. We are subject to, and may become subject to, ongoing tax examinations in various jurisdictions. As a result, we may record incremental tax expense based on expected outcomes of such matters. In addition, we may adjust previously reported tax reserves based on expected results of these examinations. Such adjustments could result in an increase or decrease to the Company’s effective tax rate and cash flows. Future changes in tax law in various jurisdictions around the world and income tax holidays could have a material impact on our effective tax rate, foreign rate differential, future income tax expense, and cash flows.
Forecasting our estimated annual effective tax rate is complex and subject to uncertainty, and there may be material differences between our forecasted and actual tax rates. Forecasts of our income tax position and effective tax rate are complex, subject to uncertainty and periodic updates because our income tax position for each year combines the effects of a mix of profits earned and losses incurred by us in various tax jurisdictions with a broad range of income tax rates, as well as changes in the valuation of deferred tax assets and liabilities, the impact of various accounting rules and changes to these rules, the results of examinations by various tax authorities, and the impact of any acquisition, business combination, disposition or other reorganization, or financing transaction.
As a multinational corporation, we conduct our business in many countries and are subject to taxation in many jurisdictions. The taxation of our business is subject to the application of multiple, and sometimes conflicting, tax laws and regulations, as well as multinational tax conventions. Many countries have recently adopted, or are considering the adoption of, revisions to their respective tax laws based on the on-going reports issued by the Organization for Economic Co-operation and Development (“OECD”)/G20 Base Erosion and Profit Shifting (“BEPS”) Project, which could materially impact our tax liability due to our organizational structure and significant operations outside of the U.S. Our effective tax rate is highly dependent upon the geographic distribution of our worldwide earnings or losses resulting from our structure and operating model, the tax regulations and tax holidays in each geographic region, and the availability of tax credits and carry-forwards. The application of tax laws and regulations is subject to legal and factual interpretation, judgment, and uncertainty. Tax laws themselves are subject to change as a result of changes in fiscal policy, changes in legislation, and the evolution of regulations and court rulings. Consequently, taxing authorities may impose tax assessments or judgments against us that could materially impact our tax liability and/or our effective income tax rate.
Economic conditions and financial market disruptions may adversely affect our business and results of operations. Adverse economic conditions or reduced information technology spending may negatively impact our business. General disruption of financial markets and a related general economic downturn could adversely affect our business and financial condition through a reduction in demand for our products, solutions or services by our customers. If a slowdown were severe enough, it could require further impairment testing and write-downs of goodwill and other intangible assets. Cost reduction actions may be necessary and might lead to restructuring charges. A tightening of financial credit could adversely affect our customers, suppliers, outsourced manufacturers, and channel partners (e.g., distributors and resellers) from obtaining adequate credit for the financing of significant purchases. An economic downturn could also result in a decrease in or cancellation of orders for our products, solutions and services; negatively impacting the ability to collect accounts receivable on a timely basis; result in additional reserves for uncollectible accounts receivable; and require additional reserves for inventory obsolescence. Higher volatility and fluctuations in foreign exchange rates for the U.S. Dollar against currencies such as the Euro, British Pound Sterling and Czech Koruna could negatively impact product sales, margins, and cash flows.
It is important that we are able to obtain many different types of insurance, and if we are not able to obtain insurance or exhaust our coverage, we may be forced to retain the risk. We have many types of insurance coverage and are also self-insured for some risks and obligations. Our third-party insurance coverage varies from time to time in both type and amount depending on availability, cost and our decisions with respect to risk retention. Economic conditions and uncertainties in global markets may adversely affect the cost and other terms upon which we are able to obtain third-party insurance. In addition, our third-party insurance policies are subject to deductibles, policy limits, and exclusions that result in our retention of a level of risk on a self-insurance basis. Further, certain types of coverages may be difficult or expensive to obtain. We self-insure against certain
20

business risks and expenses where we believe we can adequately self-insure against the anticipated exposure and risk or where insurance is either not deemed cost-effective or is not available. If the amount of our third-party insurance coverage is not available or adequate to cover all claims or liabilities, or to the extent we have elected to self-insure, we may be forced to bear substantial costs from an accident, incident, or claim. Losses not covered by insurance could be substantial and unpredictable and could adversely affect our financial condition and results of operations.
Our indebtedness could adversely affect our business. Our indebtedness could have important consequences, including the following:
• We may experience difficulty in satisfying our obligations with respect to our existing indebtedness or future indebtedness;
• Our ability to obtain additional financing for working capital, capital expenditures, acquisitions, or general corporate purposes may be impaired;
• We may be at a competitive disadvantage with reduced flexibility in planning for, or responding to, changing conditions in the industry, including increased competition; and
• We may be more vulnerable to economic downturns and adverse developments in the business.
We expect to fund our expenses and to pay the principal and interest on our indebtedness from cash flow from operations. Our ability to meet our expenses and to pay principal and interest on our indebtedness when due depends on our future performance and ability to collect cash from our customers, which will be affected by financial, business, economic, and other factors. We will not be able to control many of these factors, such as economic conditions in the markets where we operate and pressure from competitors.
If our business does not generate sufficient cash flows from operations or if future borrowings are not available to us in an amount sufficient to enable us to pay our indebtedness or to fund our other liquidity needs, we may need to refinance all or a portion of our indebtedness on or before the maturity thereof, sell assets, reduce or delay capital investments, or seek to raise additional capital, any of which could have a material adverse effect on our operations. In addition, we may not be able to effect any of these actions, if necessary, on commercially reasonable terms or at all. Our ability to restructure or refinance our indebtedness will depend on the condition of the capital and debt markets and our financial condition at such time. Any refinancing of our indebtedness could be at higher interest rates and may require us to comply with more onerous covenants, which could further restrict business operations. The terms of anticipated or future debt instruments may limit or prevent us from taking any of these actions. In addition, any failure to make scheduled payments of interest and/or principal on outstanding indebtedness would likely result in a reduction of our credit rating, which could harm our ability to access additional capital on commercially reasonable terms or at all. Our inability to generate sufficient cash flow to satisfy our debt service obligations, or to refinance or restructure our obligations on commercially reasonable terms or at all, would have an adverse effect, which could be material, on our business, financial condition and results of operations, as well as on our ability to satisfy the obligations in respect of our indebtedness.
Our use of derivative financial instruments to reduce interest rate risk may result in added volatility in our operating results. We do not hold or issue derivative financial instruments for trading purposes. However, we do utilize derivative financial instruments to reduce interest rate risk associated with our indebtedness. To manage variable interest rate risk, we entered into forward interest rate swap agreements, which will effectively convert a portion of our indebtedness into a fixed rate loan. Under generally accepted accounting principles, changes in the fair values of the swap contracts are reflected in our Consolidated Statements of Operations as a component of “Interest expense, net” if not hedged. The associated impact on our quarterly operating results is directly related to changes in prevailing interest rates. If interest rates increase, we would have a non-cash gain on the swaps, and vice versa in the event of a decrease in interest rates. Consequently, these swaps may introduce additional volatility to our operating results.
Legal and Regulatory Risks
We could be adversely impacted by changes in accounting standards and subjective assumptions, estimates, and judgments by management related to complex accounting matters. Generally accepted accounting principles and related accounting pronouncements, implementation guidelines, and interpretations with regard to a wide range of matters that are relevant to our businesses, including, but not limited to, revenue recognition, business acquisition purchase price allocations, impairment of goodwill and other intangible assets, inventories, tax matters, and litigation and other contingent liabilities are highly complex and involve many subjective assumptions, estimates, and judgments. Changes in these rules or their interpretation or changes in underlying assumptions, estimates, or judgments could significantly change our reported or expected financial performance or financial condition. New accounting guidance may also require systems and other changes that could increase our operating costs and/or change our financial statements.
Laws and regulations relating to the handling of personal data may result in increased costs, legal claims, or fines against the Company. As part of our operations, the Company collects, uses, stores, and transfers personal data of third parties, employees and limited customer data in and across various jurisdictions. Laws and regulations relating to the handling of such personal
21

data may result in increased costs, legal claims, or fines against the Company. Existing laws and emerging regulations may be inconsistent across jurisdictions and are subject to evolving and differing (sometimes conflicting) interpretations. Government officials, regulators and privacy advocates are increasingly scrutinizing how companies collect, process, use, store, share and transmit personal data, which may result in new interpretations of existing laws that impact our business. Compliance with these laws may require us to, among other things, make changes in services, business practices, or internal systems that may result in increased costs, lower revenue, reduced efficiency, or greater difficulty in competing with foreign-based firms. Further, there is no assurance that we will be able to meet additional requirements that may be imposed on the transfer of personal data without incurring expenses. We may experience reluctance or refusal by customers to purchase or continue to use our services due to concerns regarding their data protection obligations. Our actual or perceived failure to comply with applicable laws and regulations or other obligations to which we may be subject, or to protect personal data from unauthorized access, use, or other processing, may subject the Company to enforcement actions and regulatory investigations, claims, legal proceedings or other actions, reputational harm and loss of goodwill, any of which could have a material adverse effect on our operations, financial performance, and business.
The unfavorable outcome of any pending or future litigation, arbitration, or administrative action could have a material adverse effect on our financial condition or results of operations. From time to time we are a party to litigation, arbitration, or administrative actions. Our financial results and reputation could be negatively impacted by unfavorable outcomes to any pending or future litigation or administrative actions, including those related to the Foreign Corrupt Practices Act, the U.K. Bribery Act, or other anti-corruption laws. There can be no assurances as to the favorable outcome of any litigation or administrative proceedings. In addition, it can be very costly to defend litigation or administrative proceedings and these costs could negatively impact our financial results.
Honeywell has filed patent litigation lawsuits against Zebra in multiple jurisdictions, including the International Trade Commission and Federal District Court in the Western District of Texas in the United States, as well as foreign courts in the United Kingdom, Germany and China. The remedies sought in these lawsuits include damages and injunctive relief. There can be no guarantee that the outcome of this litigation will not have a negative impact to our business or results of operations. For additional information, see Item 3, Legal Proceedings.
We are subject to a wide range of product regulatory and safety, consumer, worker safety, and environmental laws. Our operations and the products we manufacture and/or sell are subject to a wide range of product regulatory and safety, consumer, worker safety, and environmental laws and regulations. Compliance with such existing or future laws and regulations could subject us to future costs or liabilities, impact our production capabilities, constrict our ability to sell, expand or acquire facilities, restrict what products, solutions and services we can offer, and generally impact our financial performance. Some of these laws are environmental and relate to the use, disposal, remediation, emission and discharge of, and exposure to hazardous substances. These laws often impose liability and can require parties to fund remedial studies or actions regardless of fault. We continue to incur disposal costs and have ongoing remediation obligations. Environmental laws have tended to become more stringent over time and any new obligations under these laws could have a negative impact on our operations or financial performance.
Laws focused on the energy efficiency of electronic products and accessories; recycling of both electronic products and packaging; reducing or eliminating certain hazardous substances in electronic products; and the transportation of batteries continue to expand significantly. Laws pertaining to accessibility features of electronic products, standardization of connectors and power supplies, the transportation of lithium-ion batteries, and other aspects are also proliferating. There are also demanding and rapidly changing laws around the globe related to issues such as product safety, radio interference, radio frequency radiation exposure, medical related functionality, and consumer and social mandates pertaining to use of wireless or electronic equipment. These laws, and changes to these laws, could have a substantial impact on whether we can offer certain products, solutions, and services, and on what capabilities and characteristics our products, solutions or services can or must include.
These laws impact our products and negatively affect our ability to manufacture and sell products competitively. We expect these trends to continue. In addition, we anticipate that we will see increased demand to meet voluntary criteria related to reduction or elimination of certain constituents from products, increasing energy efficiency, and providing additional accessibility.
Item 1B. Unresolved Staff Comments
None. Item 2. Properties
Our corporate headquarters are located in Lincolnshire, Illinois; a northern suburb of Chicago. We also operate manufacturing, repair, distribution and warehousing, administrative, research, and sales facilities in other U.S. and international locations.
22

As of December 31, 2021, the Company owned three laboratory and warehouse facilities located in the U.S., U.K., and Canada.
As of December 31, 2021, the Company had a total of 125 leased facilities with locations spread globally; 38 of which are located in the U.S. and 87 of which are located in other countries. See Note 13, Leases in the Notes to Consolidated Financial Statements for further details related to the Company’s lease arrangements.
We generally consider the productive capacity of our facilities to be adequate and sufficient for our requirements. The extent of utilization of each manufacturing facility varies throughout the year.
Item 3. Legal Proceedings
On September 29-30, 2021, Honeywell filed patent litigation lawsuits against Zebra in multiple jurisdictions, including the International Trade Commission and Federal District Court in the Western District of Texas in the United States, as well as foreign courts in the United Kingdom, Germany and China. Honeywell has made substantially similar allegations of patent infringement in all cases filed. The technology addressed in the various actions generally includes aspects of data capture, barcode reading, and scanning. The allegedly infringing Zebra products identified in the actions are described as barcode scanners, mobile computers with barcode scanning capabilities, scan engines, and components thereof. The remedies sought in these lawsuits include damages and injunctive relief. The same Zebra products and technology are implicated in all of the lawsuits. The cases are in their earliest stages and Zebra intends to vigorously defend against these infringement allegations.
See Note 14, Accrued Liabilities, Commitments and Contingencies in the Notes to Consolidated Financial Statements for discussion of certain other matters. Item 4. Mine Safety Disclosures
Not applicable.
23

PART II
Item 5. Market for Registrant’s Common Equity, Related Stockholder Matters and Issuer Purchases of Equity Securities
Stock InformationOur Class A Common Stock is traded on the NASDAQ Stock Market, LLC under the symbol “ZBRA”.
As of February 3, 2022, the last reported price for the Company’s Class A Common Stock was $508.30 per share, and there were 94 registered stockholders of record for Zebra’s Class A Common Stock. The number of beneficial owners is substantially greater than the number of stockholders of record because a large portion of our Class A common stock is transacted through banks and brokers.
Dividend PolicySince our initial public offering in 1991, we have not declared any cash dividends or distributions on our capital stock. We currently do not anticipate paying any cash dividends in the foreseeable future.
Treasury SharesThe following table sets forth information with respect to repurchases of the Company’s common stock for the three months ended December 31, 2021.
Period
Total Number of Shares
PurchasedAverage Price Paid per Share
Total Number of Shares Purchased as Part of Publicly Announced Plans or Programs (1)
Approximate Dollar Value of Shares that May Yet Be Purchased Under the Plans or Programs (in millions) (1)
October 3, 2021 - October 30, 2021 13,671 $ 494.74 13,671 $ 721 October 31, 2021 - November 27, 2021 — — — 721 November 28, 2021 - December 31, 2021 43,055 580.61 43,055 696
Total 56,726 $ 559.91 56,726 $ 696
(1) On July 30, 2019, the Company announced that its Board of Directors authorized a share repurchase program for up to an aggregate amount of $1 billion of its outstanding shares of common stock. Repurchases may be effected from time to time through open market purchases, including pursuant to a pre-set trading plan meeting the requirements of Rule 10b5-1(c) of the Securities Exchange Act of 1934. The program does not have a stated expiration date.
24

Stock Performance GraphThe following graph compares the cumulative total stockholder return, calculated on a dividend-reinvested basis, in Zebra Technologies Corporation Class A Common Stock, the S&P 500 Index, and the S&P 500 Information Technology Index for the five years ended December 31, 2021. The comparison assumes that $100 was invested in each of the Company’s Class A Common Stock, the S&P 500 Index, and the S&P 500 Information Technology Index as of the market close on December 31, 2016. Note that historic stock price performance is not necessarily indicative of future stock price performance.
Value at each year-end of $100 initial investment made on December 31, 201612/16 12/17 12/18 12/19 12/20 12/21
Zebra Technologies Corporation $ 100.00 $ 121.04 $ 185.67 $ 297.85 $ 448.15 $ 694.03 S&P 500 $ 100.00 $ 121.83 $ 116.49 $ 153.17 $ 181.35 $ 233.41 S&P 500 Information Technology $ 100.00 $ 138.83 $ 138.43 $ 208.05 $ 299.37 $ 402.73
25

Item 6. [Reserved]
26

Item 7. Management’s Discussion and Analysis of Financial Condition and Results of Operations
This section generally discusses fiscal 2021 and 2020 items and year-over-year comparisons between 2021 and 2020. Discussions of 2019 items and year-over-year comparisons between 2020 and 2019 are not included herein. Refer to “Management’s Discussion and Analysis of Financial Condition and Results of Operations” in Part II, Item 7 of the Company’s Annual Report on Form 10-K for the fiscal year ended December 31, 2020 for that discussion.
Overview
Zebra Technologies Corporation and its subsidiaries (“Zebra” or the “Company”) is a global leader respected for innovative Enterprise Asset Intelligence (“EAI”) solutions in the automatic identification and data capture solutions industry. We design, manufacture, and sell a broad range of products and solutions, including cloud-based subscriptions, that capture and move data. These products and solutions include mobile computers; barcode scanners and imagers; radio frequency identification device (“RFID”) readers; specialty printers for barcode labeling and personal identification; real-time location systems (“RTLS”); related accessories and supplies, such as self-adhesive labels and other consumables; and related software applications. We also provide a full range of services, including maintenance, technical support, repair, managed and professional services, as well as various workflow optimization solutions, including cloud-based software subscriptions and robotic automation solutions. End-users of our products, solutions and services include those in the retail and e-commerce, manufacturing, transportation and logistics, healthcare, public sector, and other industries within the following regions: North America; Europe, Middle East, and Africa (“EMEA”); Asia-Pacific; and Latin America. We provide our products, solutions, and services in approximately 180 countries, with 128 facilities and approximately 9,800 employees worldwide.
Our customers have traditionally benefited from proven solutions that increase productivity and improve asset efficiency and utilization. The Company is poised to drive, and capitalize on, the evolution of the data capture industry into the broader EAI industry, supported by technology trends including the Internet of Things (“IoT”), ubiquitous mobility, automation, cloud computing, and the increasingly on-demand global economy. EAI solutions offer additional benefits to our customers including real-time, data-driven insights that improve operational visibility and drive workflow optimization.
The Company’s operations consist of two reportable segments that provide complementary offerings to our customers: Asset Intelligence & Tracking (“AIT”) and Enterprise Visibility & Mobility (“EVM”).
• The AIT segment is an industry leader in barcode printing and asset tracking technologies. Its major product lines include barcode and card printers, supplies, including temperature-monitoring labels, services, and location solutions.
• The EVM segment is an industry leader in automatic information and data capture solutions. Its major product lines include mobile computing, data capture, RFID, fixed industrial scanning and machine vision, services, and workflow optimization solutions. Our workflow optimization solutions include cloud-based software subscriptions, retail solutions, and robotic automation solutions.
In the first quarter of 2021, the retail solutions product line, which provides a range of physical inventory management solutions with application in the retail industry, including solutions for full store physical inventories, cycle counts and analytics, moved from our AIT segment into our EVM segment contemporaneous with a change in our organizational structure and management of the business. We have reported our results reflecting this change, including historical periods, on a comparable basis. This change did not have an impact to the Consolidated Financial Statements.
Beginning in the first quarter of 2022, we will move the location solutions product line from our AIT segment into our EVM segment contemporaneously with a change in our organizational structure and management of the business. We will begin reporting our results reflecting this change in the first quarter of 2022 and will present historical periods on a comparable basis. This change will not have an impact to the Consolidated Financial Statements and is immaterial to our current and historical reportable segment results.
Recent Developments
COVID-19 Outbreak The global coronavirus (“COVID-19”) pandemic continues to be complex and rapidly evolving. Governmental agencies, to varying degrees, have imposed, and continue to impose, several protocols and regulations restricting activities of individuals in an effort to limit the spread of COVID-19. We have implemented a number of measures in an effort to protect our employees’ health and well-being over the course of the pandemic tailored to address the local impacts, including having the majority of office workers work remotely during the height of the pandemic and gradually returning to offices as restrictions are lifted,
27

limiting employee travel, and implementing more strenuous health and safety measures for hosting and attending in-person industry events. Throughout the pandemic, distribution centers and repair centers have remained open at varying capacity levels to ensure continued support to our customers, many of whom provide essential goods and services to communities. As governments ease their restrictions, we have been allowing, and will continue to allow, our employees to come back to work in our offices in a controlled approach, with modified business practices, including masking and social distancing protocols consistent with government regulations, vaccine verification, health screening, office capacity restrictions and tracking and tracing protocols where applicable, provision of personal protective equipment, increasing air exchange/ventilation and extensively and frequently disinfecting our workspaces.
The negative impacts to Net sales from the pandemic, including declines in customer demand and impacts of operational closures within our supply chain, were most pronounced in the first half of 2020 and lessened later in 2020 as the global economic recovery took shape. While the ultimate duration of the pandemic and timing of recovery in each region remains highly uncertain, the Company’s 2021 sales and profitability, particularly in the first half of the year, have benefited from pent-up demand from customers who we believe had delayed purchases in 2020 due to the pandemic, as well as the resulting acceleration of the underlying trend to digitize and automate workflows. The level of demand for certain product components has resulted in lengthened lead times and higher input costs in 2021, including freight, which have become more significant during the second half of 2021 and, in some cases, have impacted our ability to meet customer demand. The Company expects input costs to remain elevated for some period of time, which we believe will be partially mitigated through higher pricing where permitted by market conditions. The availability of certain component parts has and may continue to negatively impact our ability to meet forecasted customer demand as suppliers of necessary parts allocate supply among their customers, including the Company.
AcquisitionsAntuit: On October 7, 2021, the Company acquired Antuit Holdings Pte. Ltd. (“Antuit”) for $145 million in cash, net of cash acquired. Antuit is a provider of demand-sensing and pricing optimization software solutions for retail and consumer products companies. Through this acquisition, the Company expands its portfolio of software solution offerings to customers in these industries by combining Antuit’s platform with its existing software solutions and EVM products. The operating results of Antuit are included in the EVM segment.
Fetch: On August 9, 2021, the Company acquired Fetch Robotics, Inc. (“Fetch”) for total purchase consideration of $301 million, which consisted of $290 million in cash paid, net of cash acquired, and the fair value of the Company’s existing minority ownership interest in Fetch of $11 million, as remeasured upon acquisition. Fetch is a provider of autonomous mobile robot solutions for customers who operate in the manufacturing, distribution, and fulfillment industries, enabling customers to optimize workflows through robotic automation. Through this acquisition, the Company intends to expand its automation solution offerings within these industries. The operating results of Fetch are included within the EVM segment.
Adaptive Vision: On May 17, 2021, the Company acquired Adaptive Vision Sp. z o.o. (“Adaptive Vision”) for $18 million in cash, net of cash acquired. Adaptive Vision is a provider of graphical machine vision software with applications in the manufacturing industry, as well as a provider of libraries and other offerings for machine vision developers. The operating results of Adaptive Vision are included within the EVM segment.
Reflexis: On September 1, 2020, the Company acquired Reflexis Systems, Inc. (“Reflexis”) for $547 million in cash, net of cash acquired. Reflexis is a provider of task and workforce management, execution, and communication solutions for customers in the retail, food service, hospitality, and banking industries. Through this acquisition, the Company intends to enhance its solution offerings to customers in those industries by combining Reflexis’ platform with its existing software solutions and EVM products. The operating results of Reflexis are included within the EVM segment.
Cortexica: On November 5, 2019, the Company acquired Cortexica Vision Systems Limited (“Cortexica”) for $7 million in cash. Cortexica is a provider of computer vision-based artificial intelligence solutions primarily serving the retail industry. The operating results of Cortexica are included within the EVM segment.
Profitect: On May 31, 2019, the Company acquired Profitect, Inc. (“Profitect”) for total purchase consideration of $79 million, which consisted of $75 million in cash paid, net of cash acquired, and the fair value of the Company’s existing minority ownership interest in Profitect of $4 million, as remeasured upon acquisition. Profitect is a provider of prescriptive analytics primarily serving the retail industry. Through this acquisition, the Company intends to enhance its solution offerings to customers in the retail industry by combining Profitect’s platform with its existing software solutions and EVM products. The operating results of Profitect are included within the EVM segment.
Temptime: On February 21, 2019, the Company acquired Temptime Corporation (“Temptime”) for $180 million in cash, net of cash acquired. Temptime is a developer and manufacturer of temperature-monitoring labels and devices. Through this
28

acquisition, the Company expanded its product offerings within the healthcare industry, with possible future applications in other industries involving temperature-sensitive products. The operating results of Temptime are included within the AIT segment.
Restructuring ProgramsIn the fourth quarter of 2021, the Company committed to organizational design changes intended to better meet its strategic objectives and improve cost efficiency (referred to as the “2021 Productivity Plan”), principally within the EMEA and North America regions. Exit and restructuring charges associated with the 2021 Productivity Plan, which primarily related to employee benefits and severance, were $7 million during the year ended December 31, 2021. Estimated remaining costs under the 2021 Productivity Plan, which is expected to be completed by 2022, are expected to be up to $3 million.
In the fourth quarter of 2019, the Company committed to certain organizational changes designed to generate operational efficiencies (referred to as the “2019 Productivity Plan”), principally in the North America and EMEA regions. The 2019 Productivity Plan was completed in 2020. Exit and restructuring charges associated with the 2019 Productivity Plan, which primarily related to employee severance and benefits, were $11 million and $8 million during the years ended December 31, 2020 and 2019, respectively.
Product Sourcing Diversification Initiative In 2020, the Company completed its initiative to diversify its product sourcing footprint to include sourcing products from Taiwan, Vietnam, and Malaysia, thereby reducing its reliance on Chinese-based manufacturing and the impacts of related customs duties (“tariffs”) on U.S imports from China. In conjunction with this initiative, the Company incurred total one-time costs of $23 million, including $18 million and $5 million during the years ended December 31, 2020 and December 31, 2019, respectively, which are primarily reflected within Operating expenses on the Consolidated Statements of Operations. The Company also made $8 million of incremental equipment purchases during the year ended December 31, 2020.
29

Results of Operations: Year Ended 2021 versus 2020 and Year Ended 2020 versus 2019
Consolidated Results of Operations (amounts in millions, except percentages)
Year Ended December 31, PercentChange
2021 vs 2020
PercentChange
2020 vs 2019 2021 2020 2019Net sales:
Tangible products $ 4,845 $ 3,813 $ 3,907 27.1 % (2.4) %Services and software 782 635 578 23.1 % 9.9 %
Total Net sales 5,627 4,448 4,485 26.5 % (0.8) %Gross profit 2,628 2,003 2,100 31.2 % (4.6) %
Gross margin 46.7 % 45.0 % 46.8 % 170 bps (180) bpsOperating expenses 1,649 1,352 1,408 22.0 % (4.0) %Operating income $ 979 $ 651 $ 692 50.4 % (5.9) %
Net sales to customers by geographic region were as follows (amounts in millions, except percentages):
Year Ended December 31, PercentChange
2021 vs 2020
PercentChange
2020 vs 2019 2021 2020 2019North America $ 2,819 $ 2,319 $ 2,261 21.6 % 2.6 %EMEA 1,976 1,495 1,462 32.2 % 2.3 %Asia-Pacific 543 439 518 23.7 % (15.3) %Latin America 289 195 244 48.2 % (20.1) %
Total Net sales $ 5,627 $ 4,448 $ 4,485 26.5 % (0.8) %
Operating expenses are summarized below (amounts in millions, except percentages):
Year Ended December 31, As a Percentage of Net sales 2021 2020 2019 2021 2020 2019Selling and marketing $ 587 $ 483 $ 503 10.4 % 10.9 % 11.2 %Research and development 567 453 447 10.1 % 10.2 % 10.0 %General and administrative 348 304 323 6.2 % 6.8 % 7.2 %Amortization of intangible assets 115 78 103 NM NM NMAcquisition and integration costs 25 23 22 NM NM NMExit and restructuring costs 7 11 10 NM NM NM
Total Operating expenses $ 1,649 $ 1,352 $ 1,408 29.3 % 30.4 % 31.4 %
Consolidated Organic Net sales growth:Year Ended December 31,
2021 2020Reported GAAP Consolidated Net sales growth 26.5 % (0.8) %Adjustments:
Impact of foreign currency translations (1) (2.1) % 0.6 %Impact of acquisitions (2) (1.2) % (0.7) %
Consolidated Organic Net sales growth (3) 23.2 % (0.9) %
(1) Operating results reported in U.S. Dollars are affected by foreign currency exchange rate fluctuations. Foreign currency translation impact represents the difference in results that are attributable to fluctuations in the currency exchange rates used to convert the results for businesses where the functional currency is not the U.S. Dollar. This impact is calculated by translating the current period results at the currency exchange rates used in the comparable prior year period, inclusive of the Company’s foreign currency hedging program.
30

(2) For purposes of computing Organic Net sales growth, amounts directly attributable to business acquisitions are excluded for twelve months following their respective acquisitions.
(3) Consolidated Organic Net sales growth is a non-GAAP financial measure. See the Non-GAAP Measures section at the end of this item.
2021 compared to 2020 Total Net sales increased $1,179 million or 26.5% compared to the prior year primarily due to broad-based customer demand to digitize and automate their businesses. Net sales growth across both of our segments and all of our regions included pent-up demand from customers who we believe had delayed purchases in fiscal 2020 due to the COVID-19 pandemic. In addition, Net sales for the prior year included the negative impacts of supply chain disruptions within our EVM segment resulting from the temporary closure of a key distribution center supplying the Americas late in the first quarter. Excluding the effects of favorable currency changes and acquisitions, the increase in Consolidated Organic Net sales was 23.2%.
Gross margin increased to 46.7% for the current year compared to 45.0% in the prior year. Gross margins were higher than the prior year primarily due to favorable business mix and volume leverage, higher support service margins, favorable currency changes, the mitigation of Chinese import tariffs as of the fourth quarter of 2020, partial recovery of Chinese import tariffs in the current year, and contributions from our recent higher margin EVM acquisitions. These benefits were partially offset by higher premium freight costs.
Operating expenses for the years ended December 31, 2021 and 2020 were $1,649 million and $1,352 million, or 29.3% and 30.4% of Net sales, respectively. The increase in Operating expenses over the prior year was primarily due to higher employee compensation costs associated with higher incentive-based compensation related to improved financial performance in the current year, as well as prior year temporary salary reductions that began late in the second quarter; the inclusion of operating expenses and amortization of intangible assets associated with recently acquired businesses; and increased investment in research and development program projects, principally within our EVM segment. The prior year included costs associated with the diversification of the Company’s product sourcing footprint.
Operating income was $979 million for the current year compared to $651 million for the prior year. The increase was due to higher Gross profit, which was partially offset by higher Operating expenses.
Net income increased 66.1% compared to the prior year due to higher Operating income and favorability in Other expenses, net, partially offset by higher income tax expense detailed as follows:
• Other expenses, net was $11 million for the current year, compared to $91 million in the prior year primarily due to lower interest expense and lower foreign exchange losses in the current year. The current year interest expense benefited from a $13 million gain on interest rate swaps compared to a $46 million loss in the prior year, lower average outstanding debt levels, and lower interest rates.
• The Company’s effective tax rates for the years ended December 31, 2021 and December 31, 2020 were 13.5% and 10.0%, respectively. The increase in the effective tax rate compared to the prior year was primarily due to increases in pre-tax income in jurisdictions with higher tax rates, partially offset by a higher foreign-derived intangible income deduction, higher share-based compensation deductions, and the benefit of the enacted U.K. corporate tax rate increase from 19% to 25% on the Company’s deferred tax assets.
Diluted earnings per share increased to $15.52 as compared to $9.35 in the prior year primarily due to higher Net income.
Results of Operations by Segment
The following commentary should be read in conjunction with the financial results of each operating business segment as detailed in Note 20, Segment Information & Geographic Data in the Notes to Consolidated Financial Statements. To the extent applicable, segment results exclude purchase accounting adjustments, amortization of intangible assets, acquisition and integration costs, impairment of goodwill and other intangibles, exit and restructuring costs, and product sourcing diversification costs.
31

Asset Intelligence & Tracking Segment (“AIT”)(amounts in millions, except percentages)
Year Ended December 31, PercentChange
2021 vs 2020
PercentChange
2020 vs 2019 2021 2020 2019Net sales:
Tangible products $ 1,577 $ 1,298 $ 1,347 21.5 % (3.6) %Services and software 110 94 100 17.0 % (6.0) %
Total Net sales 1,687 1,392 1,447 21.2 % (3.8) %Gross profit 769 658 720 16.9 % (8.6) %
Gross margin 45.6 % 47.3 % 49.8 % (170) bps (250) bpsOperating expenses 395 340 369 16.2 % (7.9) %Operating income $ 374 $ 318 $ 351 17.6 % (9.4) %
AIT Organic Net sales growth:December 31,
2021 2020AIT Reported GAAP Net sales growth 21.2 % (3.8) %Adjustments:
Impact of foreign currency translations (1) (1.9) % 0.4 %Impact of acquisition (2) — % (0.5) %
AIT Organic Net sales growth (3) 19.3 % (3.9) %
(1) Operating results reported in U.S. Dollars are affected by foreign currency exchange rate fluctuations. Foreign currency translation impact represents the difference in results that are attributable to fluctuations in the currency exchange rates used to convert the results for businesses where the functional currency is not the U.S. Dollar. This impact is calculated by translating the current period results at the currency exchange rates used in the comparable prior year period, inclusive of the Company’s foreign currency hedging program.
(2) For purposes of computing AIT Organic Net sales growth, amounts directly attributable to the Temptime acquisition are excluded for twelve months following its acquisition date.
(3) AIT Organic Net sales growth is a non-GAAP financial measure. See the Non-GAAP Measures section at the end of this item.
2021 compared to 2020 Total Net sales for AIT increased $295 million or 21.2% compared to the prior year primarily due to higher sales of printing products (contributing the vast majority of the total increase) and supplies reflecting broad-based customer demand across all of our regions, inclusive of pent-up demand from customers who we believe had delayed purchases in fiscal 2020 due to the COVID-19 pandemic, as well as favorable currency changes. Excluding the impact of foreign currency changes, AIT Organic Net sales growth was 19.3%.
Gross margin decreased to 45.6% in the current year compared to 47.3% for the prior year, primarily due to higher premium freight costs, partially offset by favorable business mix and volume leverage, favorable currency changes, partial recovery of Chinese import tariffs in the current year, and the mitigation of Chinese import tariffs as of the fourth quarter of 2020.
Operating income increased 17.6% in the current year compared to the prior year. The increase was due to higher Gross profit, which was partially offset by higher Operating expenses.
32

Enterprise Visibility & Mobility Segment (“EVM”)(amounts in millions, except percentages)
Year Ended December 31, PercentChange
2021 vs 2020
PercentChange
2020 vs 2019 2021 2020 2019Net sales:
Tangible products $ 3,268 $ 2,515 $ 2,560 29.9 % (1.8) %Services and software 678 548 478 23.7 % 14.6 %
Total Net sales 3,946 3,063 3,038 28.8 % 0.8 %Gross profit 1,865 1,358 1,387 37.3 % (2.1) %
Gross margin 47.3 % 44.3 % 45.7 % 300 bps (140) bpsOperating expenses 1,107 888 900 24.7 % (1.3) %Operating income $ 758 $ 470 $ 487 61.3 % (3.5) %
EVM Organic Net sales growth:December 31,
2021 2020EVM Reported GAAP Net sales growth 28.8 % 0.8 %Adjustments:
Impact of foreign currency translations (1) (1.9) % 0.7 %Impact of acquisitions (2) (1.9) % (1.0) %
EVM Organic Net sales growth (3) 25.0 % 0.5 %
(1) Operating results reported in U.S. Dollars are affected by foreign currency exchange rate fluctuations. Foreign currency translation impact represents the difference in results that are attributable to fluctuations in the currency exchange rates used to convert the results for businesses where the functional currency is not the U.S. Dollar. This impact is calculated by translating the current period results at the currency exchange rates used in the comparable prior year period, inclusive of the Company’s foreign currency hedging program.
(2) For purposes of computing EVM Organic Net sales growth, amounts directly attributable to the acquisitions of Antuit, Fetch, Adaptive Vision, Reflexis, Cortexica, and Profitect are excluded for twelve months following their respective acquisitions.
(3) EVM Organic Net sales growth is a non-GAAP financial measure. See the Non-GAAP Measures section at the end of this item.
2021 compared to 2020 Total Net sales for EVM increased $883 million or 28.8% compared to the prior year primarily due to broad-based customer demand resulting in higher sales of mobile computing products (contributing the vast majority of the total increase) and support services across all regions, as well as higher sales of data capture products across most regions. In addition, our recent acquisitions contributed to the growth of Services and software sales in the current year. Excluding the impacts of foreign currency changes and acquisitions, EVM Organic Net sales growth was 25.0%.
Gross margin increased to 47.3% in the current year compared to 44.3% in the prior year, primarily due to favorable business mix and volume leverage, higher support service margins, favorable currency changes, the mitigation of Chinese import tariffs as of the fourth quarter of 2020, and contributions from our higher margin acquisitions. These benefits were partially offset by higher premium freight costs.
Operating income for the current year increased 61.3% compared to the prior year period. The increase was due to higher Gross profit, which was partially offset by higher Operating expenses.
33

Liquidity and Capital Resources
The primary factors that influence our liquidity include the amount and timing of our revenues, cash collections from our customers, cash payments to our suppliers, capital expenditures, repatriation of foreign cash, acquisitions, and share repurchases. Management believes that our existing capital resources, inclusive of available borrowing capacity on debt and other financing facilities and funds generated from operations, are sufficient to meet anticipated capital requirements and service our indebtedness. The following table summarizes our cash flow activities for the years indicated (in millions):
Year Ended December 31, $ Change 2021 vs 2020
$ Change 2020 vs 2019 2021 2020 2019
Cash flow provided by (used in):Operating activities $ 1,069 $ 962 $ 685 $ 107 $ 277 Investing activities (546) (641) (335) 95 (306) Financing activities (371) (157) (365) (214) 208 Effect of exchange rates on cash balances — (2) 1 2 (3)
Net increase (decrease) in cash and cash equivalents, including restricted cash $ 152 $ 162 $ (14) $ (10) $ 176
2021 vs. 2020 The change in our cash and cash equivalents balance during the current year is reflective of the following:
• The increase in cash provided by operating activities compared to the prior year was primarily due to higher operating income, lower inventory levels, and lower employee incentive compensation payments. These benefits were partially offset by higher accounts receivable balances reflecting the timing of customer transactions within the period, higher income tax payments, as well as reduced benefits from our accounts receivable factoring programs.
• The decrease in cash used in investing activities compared to the prior year was primarily due to lower cash paid for acquisitions. The current year includes cash payments for the acquisitions of Antuit, Fetch, and Adaptive Vision, whereas the prior year includes a cash payment for the acquisition of Reflexis.
• The increase in net cash used in financing activities during the current year was primarily due to higher net debt repayments, as well as higher payments related to share-based compensation plans in the current year, which were partially offset by lower share repurchases. The prior year included a net source of cash associated with the timing of factored receivables servicing activities.
Company DebtThe following table shows the carrying value of the Company’s debt (in millions):
December 31,2021 2020
Term Loan A $ 888 $ 917 2020 Term Loan — 100 Receivables Financing Facilities 108 235
Total debt $ 996 $ 1,252 Less: Debt issuance costs (3) (5) Less: Unamortized discounts (2) (2) Less: Current portion of debt (69) (364)
Total long-term debt $ 922 $ 881
Term Loan AThe principal on Term Loan A is due in quarterly installments, with the next quarterly installment due in March 2022 and the majority due upon the August 9, 2024 maturity date. The Company may make prepayments, in whole or in part, without premium or penalty, and would be required to prepay certain outstanding amounts in the event of certain circumstances or transactions. As of December 31, 2021, the Term Loan A interest rate was 1.35%. Interest payments are made monthly and are subject to variable rates plus an applicable margin.
2020 Term Loan
34

In September 2020, the Company entered into a new $200 million term loan (“2020 Term Loan”), with the proceeds used to partly fund the acquisition of Reflexis. The Company repaid $100 million of principal during the fourth quarter of 2020 and the remaining $100 million of principal in the first quarter of 2021.
Receivables Financing FacilitiesThe Company has two Receivables Financing Facilities with financial institutions that have a combined total borrowing limit of up to $280 million. As collateral, the Company pledges perfected first-priority security interests in its U.S. domestically originated accounts receivable. The Company has accounted for transactions under its Receivables Financing Facilities as secured borrowings. The Company’s first Receivables Financing Facility allows for borrowings of up to $180 million and matures on March 19, 2024. The Company’s second Receivable Financing Facility allows for borrowings of up to $100 million and matures on May 16, 2022.
###December 31, 2021###$643 million###two###December 31, 2021###$108 million###December 31, 2021###0.99%###
Revolving Credit FacilityThe Company has a Revolving Credit Facility that is available for working capital and other general business purposes, including letters of credit. As of December 31, 2021###$7 million###$1 billion###$993 million. ### borrowings were outstanding under the Revolving Credit Facility as of December 31, 2021 or December 31, 2020.
See Note 12, Long-Term Debt in the Notes to Consolidated Financial Statements for further details related to the Company’s debt instruments.
Receivables FactoringThe Company currently has two Receivables Factoring arrangements, pursuant to which certain receivables are sold to banks without recourse in exchange for cash. One arrangement allows for the factoring of up to $25 million of uncollected receivables originated from the EMEA region. The second arrangement allows for the factoring of up to €150 million of uncollected receivables originated from the EMEA and Asia-Pacific regions. Transactions under the Receivables Factoring arrangements are accounted for as sales under Accounting Standards Codification 860, Transfers and Servicing of Financial Assets, with the sold receivables removed from the Company’s balance sheet. Under these Receivables Factoring arrangements, the Company does not maintain any beneficial interest in the receivables sold. The banks’ purchase of eligible receivables is subject to a maximum amount of uncollected receivables. The Company services the receivables on behalf of the banks, but otherwise maintains no significant continuing involvement with respect to the receivables. Sale proceeds that are representative of the fair value of factored receivables, less a factoring fee, are reflected in Net cash provided by operating activities on the Consolidated Statements of Cash Flows, while sale proceeds in excess of the fair value of factored receivables are reflected in Net cash used in financing activities on the Consolidated Statements of Cash Flows.
As of December 31, 2021 and 2020 there were a total of $24 million and $70 million, respectively, of uncollected receivables that had been sold and removed from the Company’s Consolidated Balance Sheets.
As servicer of sold receivables, the Company had $141 million and $142 million of obligations that were not yet remitted to banks as of December 31, 2021 and 2020, respectively. These obligations are included within Accrued liabilities on the Consolidated Balance Sheets, with changes in such obligations reflected within Net cash used in financing activities on the Consolidated Statements of Cash Flows.
See Note 19, Accounts Receivable Factoring in the Notes to Consolidated Financial Statements for further details.
Share RepurchasesOn July 30, 2019, the Company announced that its Board of Directors authorized a share repurchase program for up to an aggregate amount of $1 billion of its outstanding shares of common stock. The share repurchase program does not have a stated expiration date. The level of the Company’s repurchases depends on a number of factors, including its financial condition, capital requirements, cash flows, results of operations, future business prospects and other factors its management may deem relevant. The timing, volume, and nature of repurchases are subject to market conditions, applicable securities laws and other factors and may be amended, suspended or discontinued at any time. Repurchases may be effected from time to time through open market purchases, including pursuant to a pre-set trading plan meeting the requirements of Rule 10b5-1(c) of the Securities Exchange Act of 1934. During the year ended December 31, 2021, the Company repurchased 109,115 shares of common stock for $57 million. Comparatively, during the year ended December 31, 2020, the Company repurchased 948,740 shares of common stock for $200 million. As of December 31, 2021, approximately $696 million of common stock remained authorized for repurchase under the program. Subsequent to year end, the Company has repurchased 339,142 shares of common stock for $173 million through February 3, 2022.
35

Future Cash RequirementsWe believe that our cash and cash equivalents, which totaled $332 million as of December 31, 2021, along with anticipated cash generation from operations and available borrowing capacity on debt and other financing facilities, will be sufficient to fund the Company’s cash requirements during the next 12 months and thereafter based on our current business plans.
Included in the Company’s Cash and cash equivalents are amounts held by foreign subsidiaries, which was $39 million and $37 million as of December 31, 2021 and 2020, respectively. We do not expect that Cash and cash equivalents held by foreign subsidiaries will need to be repatriated in order to fund the Company’s U.S. operations based on current cash requirements.
Our cash requirements during the next 12 months and thereafter include payments to satisfy the following obligations:
• Purchase obligations — We generally procure inventories and other goods and services through purchase orders at levels to satisfy our operational needs for 12 months or less. We have a limited number of multi-year inventory and service-related purchase commitments which contain minimum purchase requirements and are non-cancellable. As of December 31, 2021, these commitments were approximately $360 million relating to the next five years, excluding amounts already reflected within Accounts payable or Accrued expenses on the Consolidated Balance Sheet. See Note 14, Accrued Liabilities, Commitments and Contingencies in the Notes to Consolidated Financial Statements for additional details.
• Debt obligations — We expect to make total payments of approximately $101 million associated with the Company’s debt facilities in 2022. This expected use of cash is based on the Company’s current borrowings and applicable interest rates and margins as of December 31, 2021, and includes principal and interest payments along with expected cash settlements associated with the Company’s interest rate swaps. In the ordinary course of business, the Company may decide to borrow additional amounts or repay principal earlier than contractually owed, which would affect future cash payments. See Note 12, Long-Term Debt in the Notes to Consolidated Financial Statements for further details related to the Company’s debt facilities.
• Leases obligations — We lease certain manufacturing facilities, distribution centers, sales and administrative offices, equipment, and vehicles. As of December 31, 2021, the Company’s fixed lease commitments totaled $215 million, of which $47 million is payable in 2022. See Note 13, Leases in the Notes to Consolidated Financial Statements for further details related to the Company’s lease arrangements.
In addition to the expected cash requirements described above, the Company may use cash to fund strategic acquisitions, investments, or repurchase common stock under its share repurchase program. We also expect to spend approximately $65 million to $75 million on capital expenditures in 2022.
Critical Accounting Estimates
Management prepared the consolidated financial statements of the Company under accounting principles generally accepted in the U.S. The application of these principles requires the use of estimates which affect the amounts reported in our consolidated financial statements. While we believe that our estimates are reasonable based upon available information, actual results may substantially differ from those estimates. Note 2, Significant Accounting Policies in the Notes to Consolidated Financial Statements provides additional discussion of these items along with other significant accounting policies of the Company. The accounting estimates described below have been identified by Management as those that are most critical to our financial statements, as they require management to make significant judgments and assumptions about inherently uncertain and complex matters.
Income Taxes We estimate a provision or benefit for income taxes and amounts to be settled or recovered in several tax jurisdictions globally. Our estimates are complex and involve significant judgments and interpretations of regulations. Resolution of income tax treatments in individual jurisdictions may not be known for several years after completion of a given year. We are also required to evaluate the realizability of our deferred tax assets on an ongoing basis, which requires estimation of our ability to generate future taxable income. In particular, our income tax provision or benefit is dependent on our ability to forecast future taxable income in the U.S., U.K., Singapore, and other jurisdictions. Significant judgments included in our forecasts include projecting future sales volumes and pricing, costs to manufacture and procure products and to deliver services and solutions, among other factors. There were no significant changes in estimates to our income tax provision during the current year.
AcquisitionsWe account for acquired businesses using the acquisition method of accounting. This method requires that the purchase price be allocated to the identifiable assets acquired and liabilities assumed at their estimated fair values. The excess of the purchase
36

price over the identifiable assets acquired and liabilities assumed is recorded as goodwill. The estimates used to determine the fair values of long-lived intangible assets can be complex and require judgment. We generally value intangible assets using income-based valuation methodologies, such as the excess earnings method, which require a number of critical estimates that include, but are not limited to, future expected cash flows from revenues and operating activities, and the determination of discount rates.
Goodwill ImpairmentGoodwill impairment testing consists of comparing the estimated fair value of each of our reporting units to its carrying value. Fair value determinations require judgment and are sensitive to changes in underlying assumptions, estimates, as well as market factors. We estimate the fair value of reporting units using both income and market-based valuation approaches. The income approach requires management to estimate a number of factors for each reporting unit, including projected future operating results and cash flows, and the determination of discount rates. The market approach estimates fair value using comparable marketplace fair value data from a comparable industry group. Estimating the fair value of reporting units also requires that we make a number of assumptions and estimates regarding our long-term growth and cash flow expectations, as well as overall industry and economic conditions. These estimates and assumptions include, but are not limited to, projections of revenue and income growth rates, capital investments, competitive and customer trends, appropriate peer group selection, market-based discount rates and other market factors. Our annual quantitative impairment test, most recently completed in the fourth quarter of 2021, continues to indicate that the fair values of each of our reporting units significantly exceed their respective carrying values.
Revenue RecognitionWe recognize revenues when we transfer control of promised goods, solutions or services to our customers in an amount that reflects the consideration we expect to receive. The consideration that we expect to receive is estimated by reflecting reductions to our transaction price for product returns, rebates, and other incentives. These estimates are developed using the expected value that the Company anticipates receiving and are based on recent trends observed in similar transactions. Additionally, many of our contracts with customers contain multiple performance obligations, including various hardware, software, and/or services. For such contracts that contain multiple performance obligations, we allocate the estimated total transaction price to each performance obligation based on relative standalone selling prices (“SSP”). The determination of SSP is established at a regional level. SSP is based on observable prices in recent standalone transactions for the same or similar offerings, to the extent available, which is often applicable to tangible products and software licenses. Alternatively, in the absence of recent observable prices, the Company generally applies the expected cost-plus margin approach to professional services, repair and maintenance services, and solution offerings. There were no changes to our estimation processes for consideration received or SSP that materially affected revenues during the year.
New Accounting Pronouncements
See Note 2, Significant Accounting Policies in the Notes to Consolidated Financial Statements regarding recent accounting pronouncements.
Non-GAAP Measures
The Company has provided reconciliations of the supplemental non-GAAP financial measures, as defined under the rules of the Securities and Exchange Commission, presented herein to the most directly comparable financial measures calculated and presented in accordance with GAAP.
These supplemental non-GAAP financial measures – Consolidated Organic Net sales growth, AIT Organic Net sales growth, and EVM Organic Net sales growth – are presented because our management evaluates our financial results both including and excluding the effects of business acquisitions and foreign currency translation, as applicable. Management believes that the supplemental non-GAAP financial measures presented provide additional perspective and insights when analyzing the core operating performance of our business from period to period and trends in our historical operating results. These supplemental non-GAAP financial measures should not be considered superior to, as a substitute for, or as an alternative to, and should be considered in conjunction with the GAAP financial measures presented.
37

Item 7A. Quantitative and Qualitative Disclosures About Market Risk
Market risk is the sensitivity of income to changes in interest rates, commodity prices, and foreign currency changes. Zebra is primarily exposed to the following types of market risk: interest rate and foreign currency.
Interest Rate Risk
We are exposed to interest rate volatility with regard to existing debt issuances. Our exposures include the London Inter-bank Offered Rate (“LIBOR”) and the Secured Overnight Financing Rate (“SOFR”). We use interest rate derivative contracts, including interest rate swaps, to mitigate the majority of the Company’s exposure from interest rate changes on existing debt and future debt issuances, thereby reducing the volatility of our financing costs and, based on current and projected market conditions, achieve a desired proportion of fixed versus floating-rate debt. Generally, under these interest rate swaps, we agree with a counterparty to exchange floating-rate for fixed-rate interest amounts with an agreed upon notional amount.
The United Kingdom’s Financial Conduct Authority, which regulates LIBOR, announced in 2017 the phase out of LIBOR. We continue to closely monitor the phase out of LIBOR to assess any impacts to our debt and interest rate swap contracts. We have already taken actions to amend certain contracts to incorporate a SOFR benchmark rate, and we expect other key contracts will be amended to incorporate a SOFR benchmark rate before the LIBOR phase out is completed. As of December 31, 2021, our remaining contracts containing exposure to LIBOR pertain only to LIBOR tenors that will be phased out by June 30, 2023.
As of December 31, 2021, we had approximately $1.0 billion of debt outstanding under our debt facilities, which bears interest determined by reference to a variable rate index. A one percentage point increase or decrease in interest rates would increase or decrease annual interest expense by approximately $2 million. This exposure includes the impact of associated forward interest rate swaps outstanding as of December 31, 2021. Refer to Note 11, Derivative Instruments in the Notes to Consolidated Financial Statements for further discussion of these risk mitigation activities. Exposure to variable interest may increase or decrease, to the extent that the Company’s borrowings under its debt facilities increase or decrease, respectively.
Foreign Exchange Risk
We provide products, solutions and services in approximately 180 countries throughout the world and, therefore, at times are exposed to risk based on movements in foreign exchange rates. In some instances, we invoice customers in their local currency and have a resulting foreign currency denominated revenue transaction and accounts receivable. We also purchase certain raw materials and other items in foreign currencies. We manage these risks using derivative financial instruments, including foreign currency exchange contracts. See Note 11, Derivative Instruments in the Notes to Consolidated Financial Statements for further discussions of hedging activities.
The currencies that we are primarily exposed to fluctuations in foreign currency exchange rates are the Euro, British Pound Sterling, and Czech Koruna. A one percentage point increase or decrease in exchange rates relative to the U.S. Dollar would increase or decrease our pre-tax income by approximately $2 million. This amount is inclusive of the impact of associated derivative contracts.
38

Item 8. Financial Statements and Supplementary Data
INDEX TO CONSOLIDATED FINANCIAL STATEMENTS
PageFinancial Statements
Report of Independent Registered Public Accounting Firm (PCAOB ID: 42) 40Consolidated Balance Sheets as of December 31, 2021 and 2020 42Consolidated Statements of Operations for the years ended December 31, 2021, 2020, and 2019 43Consolidated Statements of Comprehensive Income for the years ended December 31, 2021, 2020, and 2019 44Consolidated Statements of Stockholders’ Equity for the years ended December 31, 2021, 2020, and 2019 45Consolidated Statements of Cash Flows for the years ended December 31, 2021, 2020, and 2019 46Notes to Consolidated Financial Statements 47
39

Report of Independent Registered Public Accounting Firm
To the Shareholders and the Board of Directors of Zebra Technologies Corporation
Opinion on the Financial Statements
We have audited the accompanying consolidated balance sheets of Zebra Technologies Corporation and subsidiaries (the Company) as of December 31, 2021 and 2020, the related consolidated statements of operations, comprehensive income, stockholders’ equity, and cash flows for each of the three years in the period ended December 31, 2021, and the related notes and financial statement schedule listed in the Index at Item 15 (collectively referred to as the “consolidated financial statements”). In our opinion, the consolidated financial statements present fairly, in all material respects, the financial position of the Company at December 31, 2021 and 2020, and the results of its operations and its cash flows for each of the three years in the period ended December 31, 2021, in conformity with U.S. generally accepted accounting principles.
We also have audited, in accordance with the standards of the Public Company Accounting Oversight Board (United States) (PCAOB), the Company's internal control over financial reporting as of December 31, 2021, based on criteria established in Internal Control-Integrated Framework issued by the Committee of Sponsoring Organizations of the Treadway Commission (2013 framework) and our report dated February 10, 2022 expressed an unqualified opinion thereon.
Basis for Opinion
These financial statements are the responsibility of the Company’s management. Our responsibility is to express an opinion on the Company’s financial statements based on our audits. We are a public accounting firm registered with the PCAOB and are required to be independent with respect to the Company in accordance with the U.S. federal securities laws and the applicable rules and regulations of the Securities and Exchange Commission and the PCAOB.
We conducted our audits in accordance with the standards of the PCAOB. Those standards require that we plan and perform the audit to obtain reasonable assurance about whether the financial statements are free of material misstatement, whether due to error or fraud. Our audits included performing procedures to assess the risks of material misstatement of the financial statements, whether due to error or fraud, and performing procedures that respond to those risks. Such procedures included examining, on a test basis, evidence regarding the amounts and disclosures in the financial statements. Our audits also included evaluating the accounting principles used and significant estimates made by management, as well as evaluating the overall presentation of the financial statements. We believe that our audits provide a reasonable basis for our opinion.
Critical Audit Matter
The critical audit matter communicated below is a matter arising from the current period audit of the financial statements that was communicated or required to be communicated to the audit committee and that: (1) relates to accounts or disclosures that are material to the financial statements and (2) involved our especially challenging, subjective or complex judgments. The communication of the critical audit matter does not alter in any way our opinion on the consolidated financial statements, taken as a whole, and we are not, by communicating the critical audit matter below, providing a separate opinion on the critical audit matter or on the account or disclosure to which it relates.
Accounting for Income Taxes
Description of the Matter
As discussed in Note 16 of the financial statements, the Company earns a significant amount of its operating income across multiple jurisdictions and the Company’s organizational structure and transactional flows are designed to reflect strategic and operational business imperatives that change over time. As the Company operates in a multinational tax environment and incurs income tax obligations in a number of jurisdictions, complexities and uncertainties can arise in the application of complex tax regulations to the Company’s multinational operations.
Auditing the application of taxation legislation to the Company’s affairs is inherently complex, highly specialized and requires judgment. These factors impact the Company’s estimation of tax exposures, valuation allowances and income tax provisions.
40

How We Addressed the Matter in Our Audit
We obtained an understanding, evaluated the design and tested the operating effectiveness of controls over the Company’s identification of and accounting for the tax impact of changes in the business or significant changes in tax laws. This included controls over the Company’s evaluation of tax law changes, the evaluation of cross-jurisdictional transactions and the Company’s tax technical assessment over those changes and/or transactions.
We involved our tax professionals in the Company’s significant operating jurisdictions to assist in the evaluation of the Company’s tax obligations. We evaluated the Company’s transactional flows to assess whether they aligned with the Company’s strategic and operational shifts. We made inquiries of management and inspected internally and externally prepared documentation to understand current disputes and uncertain tax positions. We assessed the completeness of the tax matters identified and evaluated the Company’s assessment regarding the related status, potential exposure and risk of loss. We assessed the consistency of assumptions used in estimating provisions for key tax exposures and evaluated the adequacy of the Company’s disclosures of tax and ongoing tax matters.
/s/ Ernst & Young LLP
We have served as the Company’s auditor since 2005.
Chicago, IllinoisFebruary 10, 2022
41

ZEBRA TECHNOLOGIES CORPORATION AND SUBSIDIARIESCONSOLIDATED BALANCE SHEETS
(In millions, except share data)
December 31,2021 2020
AssetsCurrent assets:
Cash and cash equivalents $ 332 $ 168 Accounts receivable, net of allowances for doubtful accounts of $1 million each as of December 31, 2021 and 2020 752 508 Inventories, net 491 511 Income tax receivable 8 16 Prepaid expenses and other current assets 106 70
Total Current assets 1,689 1,273 Property, plant and equipment, net 272 274 Right-of-use lease assets 131 135 Goodwill 3,265 2,988 Other intangibles, net 469 402 Deferred income taxes 192 139 Other long-term assets 197 164 Total Assets $ 6,215 $ 5,375 Liabilities and Stockholders' EquityCurrent liabilities:
Current portion of long-term debt $ 69 $ 364 Accounts payable 700 601 Accrued liabilities 639 559 Deferred revenue 380 308 Income taxes payable 12 19
Total Current liabilities 1,800 1,851 Long-term debt 922 881 Long-term lease liabilities 121 129 Deferred income taxes 6 — Long-term deferred revenue 315 273 Other long-term liabilities 67 97 Total Liabilities 3,231 3,231 Stockholders’ Equity:
Preferred stock, $.01 par value; authorized 10,000,000 shares; none issued — — Class A common stock, $.01 par value; authorized 150,000,000 shares; issued 72,151,857 shares 1 1 Additional paid-in capital 462 395 Treasury stock at cost, 18,736,582 and 18,689,775 shares as of December 31, 2021 and 2020, respectively (1,023) (919) Retained earnings 3,573 2,736 Accumulated other comprehensive loss (29) (69)
Total Stockholders’ Equity 2,984 2,144 Total Liabilities and Stockholders’ Equity $ 6,215 $ 5,375
See accompanying Notes to Consolidated Financial Statements.
42

ZEBRA TECHNOLOGIES CORPORATION AND SUBSIDIARIESCONSOLIDATED STATEMENTS OF OPERATIONS
(In millions, except per share data)
Year Ended December 31,2021 2020 2019
Net salesTangible products $ 4,845 $ 3,813 $ 3,907 Services and software 782 635 578
Total Net sales 5,627 4,448 4,485 Cost of sales:
Tangible products 2,590 2,065 2,006 Services and software 409 380 379
Total Cost of sales 2,999 2,445 2,385 Gross profit 2,628 2,003 2,100 Operating expenses:
Selling and marketing 587 483 503 Research and development 567 453 447 General and administrative 348 304 323 Amortization of intangible assets 115 78 103 Acquisition and integration costs 25 23 22 Exit and restructuring costs 7 11 10
Total Operating expenses 1,649 1,352 1,408 Operating income 979 651 692 Other expenses:
Foreign exchange loss (5) (18) (6) Interest expense, net (5) (76) (89) Other (expense) income, net (1) 3 1
Total Other expenses, net (11) (91) (94) Income before income tax 968 560 598 Income tax expense 131 56 54 Net income $ 837 $ 504 $ 544 Basic earnings per share $ 15.66 $ 9.43 $ 10.08 Diluted earnings per share $ 15.52 $ 9.35 $ 9.97
See accompanying Notes to Consolidated Financial Statements.
43

ZEBRA TECHNOLOGIES CORPORATION AND SUBSIDIARIESCONSOLIDATED STATEMENTS OF COMPREHENSIVE INCOME
(In millions)
Year Ended December 31, 2021 2020 2019Net income $ 837 $ 504 $ 544 Other comprehensive income (loss), net of tax:
Changes in unrealized gains and losses on anticipated sales hedging transactions 46 (30) (10) Foreign currency translation adjustment (6) 5 1
Comprehensive income $ 877 $ 479 $ 535
See accompanying Notes to Consolidated Financial Statements.
44

ZEBRA TECHNOLOGIES CORPORATION AND SUBSIDIARIESCONSOLIDATED STATEMENTS OF STOCKHOLDERS’ EQUITY
(In millions, except share data)
Class A Common
Stock Shares
Class ACommon
Stock Value
AdditionalPaid-inCapital
TreasuryStock
RetainedEarnings
AccumulatedOther
Comprehensive Loss Total
Balance at December 31, 2018 53,871,184 $ 1 $ 294 $ (613) $ 1,688 $ (35) $ 1,335 Issuances of treasury shares related to share-based compensation plans, net of forfeitures 594,399 — (3) 14 — — 11 Shares withheld to fund withholding tax obligations related to share-based compensation plans (224,765) — — (43) — — (43) Share-based compensation — — 48 — — — 48 Repurchase of common stock (237,886) — — (47) — — (47) Net income — — — — 544 — 544 Changes in unrealized gains and losses on anticipated sales hedging transactions (net of income taxes) — — — — — (10) (10) Foreign currency translation adjustment — — — — — 1 1 Balance at December 31, 2019 54,002,932 $ 1 $ 339 $ (689) $ 2,232 $ (44) $ 1,839 Issuances of treasury shares related to share-based compensation plans, net of forfeitures 557,599 — 5 7 — — 12 Shares withheld to fund withholding tax obligations related to share-based compensation plans (149,709) — — (37) — — (37) Share-based compensation — — 51 — — — 51 Repurchase of common stock (948,740) — — (200) — — (200) Net income — — — — 504 — 504
Changes in unrealized gains and losses on anticipated sales hedging transactions (net of income taxes) — — — — — (30) (30) Foreign currency translation adjustment — — — — — 5 5 Balance at December 31, 2020 53,462,082 $ 1 $ 395 $ (919) $ 2,736 $ (69) $ 2,144 Issuances of treasury shares related to share-based compensation plans, net of forfeitures 150,097 — (9) (4) — — (13) Shares withheld to fund withholding tax obligations related to share-based compensation plans (87,789) — — (43) — — (43) Share-based compensation — — 76 — — — 76 Repurchase of common stock (109,115) — — (57) — — (57) Net income — — — — 837 — 837 Changes in unrealized gains and losses on anticipated sales hedging transactions (net of income taxes) — — — — — 46 46 Foreign currency translation adjustment — — — — — (6) (6) Balance at December 31, 2021 53,415,275 $ 1 $ 462 $ (1,023) $ 3,573 $ (29) $ 2,984
See accompanying Notes to Consolidated Financial Statements.
45

ZEBRA TECHNOLOGIES CORPORATION AND SUBSIDIARIESCONSOLIDATED STATEMENTS OF CASH FLOWS
(In millions)
Year Ended December 31,2021 2020 2019
Cash flows from operating activities:Net income $ 837 $ 504 $ 544 Adjustments to reconcile net income to net cash provided by operating activities:
Depreciation and amortization 187 146 175 Amortization of debt issuance costs and discounts 2 3 6 Share-based compensation 76 51 48 Deferred income taxes (69) (40) (42) Unrealized (gain) loss on forward interest rate swaps (30) 33 19 Other, net (1) 1 (2) Changes in operating assets and liabilities:
Accounts receivable, net (239) 130 (96) Inventories, net 18 (42) 51 Other assets (23) 11 (20) Accounts payable 96 47 (5) Accrued liabilities 110 16 (18) Deferred revenue 113 103 71 Income taxes 1 (5) (31) Other operating activities (9) 4 (15)
Net cash provided by operating activities 1,069 962 685 Cash flows from investing activities:
Acquisition of businesses, net of cash acquired (452) (548) (262) Purchases of property, plant and equipment (59) (67) (61) Proceeds from the sale of long-term investments — 6 10 Purchases of short-term investments (1) — — Purchases of long-term investments (34) (32) (22)
Net cash used in investing activities (546) (641) (335) Cash flows from financing activities:
Proceeds from issuance of long-term debt 46 302 637 Payments of long term-debt (303) (342) (949) Payments of debt extinguishment costs — — (1) Payments of debt issuance costs and discounts — (1) (6) Payments for repurchases of common stock (57) (200) (47) Net payments related to share-based compensation plans (56) (25) (32) Change in unremitted cash collections from servicing factored receivables (1) 109 33
Net cash used in financing activities (371) (157) (365) Effect of exchange rate changes on cash and cash equivalents, including restricted cash — (2) 1 Net increase (decrease) in cash and cash equivalents, including restricted cash 152 162 (14) Cash and cash equivalents, including restricted cash, at beginning of period 192 30 44 Cash and cash equivalents, including restricted cash, at end of period $ 344 $ 192 $ 30
Less restricted cash, included in Prepaid expenses and other current assets (12) (24) — Cash and cash equivalents at end of period $ 332 $ 168 $ 30 Supplemental disclosures of cash flow information:Income taxes paid $ 199 $ 107 $ 140 Interest paid $ 32 $ 38 $ 63
See accompanying Notes to Consolidated Financial Statements.
46

ZEBRA TECHNOLOGIES CORPORATION AND SUBSIDIARIES
NOTES TO CONSOLIDATED FINANCIAL STATEMENTS
Note 1 Description of Business and Basis of Presentation
Zebra Technologies Corporation and its subsidiaries (“Zebra” or the “Company”) is a global leader providing innovative Enterprise Asset Intelligence (“EAI”) solutions in the automatic identification and data capture solutions industry. We design, manufacture, and sell a broad range of products and solutions, including cloud-based subscriptions, that capture and move data. We also provide a full range of services, including maintenance, technical support, repair, managed and professional services. End-users of our products, solutions and services include those in retail and e-commerce, manufacturing, transportation and logistics, healthcare, public sector, and other industries around the world. We provide our products, solutions and services globally through a direct sales force and an extensive network of channel partners.
Effective January 1, 2021, the retail solutions product line, which provides a range of physical inventory management solutions with application in the retail industry, including solutions for full store physical inventories, cycle counts and analytics, moved from our Asset Intelligence & Tracking (“AIT”) segment into our Enterprise Visibility & Mobility (“EVM”) segment contemporaneous with a change in our organizational structure and management of the business. Prior period results have been reclassified to conform to the current period’s presentation. This change did not have an impact on the Consolidated Financial Statements. See Note 20, Segment Information & Geographic Data for additional information related to each segment’s results.
Note 2 Significant Accounting Policies
Principles of ConsolidationThese accompanying consolidated financial statements were prepared in accordance with accounting principles generally accepted in the United States and include the accounts of Zebra and its wholly owned subsidiaries. All significant intercompany accounts and transactions have been eliminated in consolidation.
Fiscal CalendarThe Company’s fiscal year is a 52-week period ending on December 31. Interim fiscal quarters end on a Saturday and generally include 13 weeks of operating activity. During the 2021 fiscal year, the Company’s quarter end dates were April 3, July 3, October 2 and December 31.
Use of EstimatesThese consolidated financial statements were prepared using estimates and assumptions that affect the reported amounts of assets and liabilities and disclosure of contingent assets and liabilities as of the date of the consolidated financial statements and the reported amounts of revenues and expenses during the reporting period. Examples of accounting estimates include: cash flow projections and other valuation assumptions included in business acquisition purchase price allocations as well as annual goodwill impairment testing; the measurement of variable consideration and allocation of transaction price to performance obligations in revenue transactions; inventory valuation; useful lives of our tangible and intangible assets; and the recognition and measurement of income tax assets and liabilities. The Company bases its estimates on historical experience and on various other assumptions that the Company believes to be reasonable under the circumstances. Actual results could differ from those estimates.
Cash and Cash EquivalentsCash consists primarily of deposits with banks. In addition, the Company considers highly liquid short-duration term deposits with banks, as well as other highly liquid short-term investments with original maturities of less than three months, to be cash equivalents. Cash equivalents are readily convertible to known amounts of cash and are so near their maturity that they present insignificant risk of a change in value because of changes in interest rates.
Accounts Receivable and Allowance for Doubtful AccountsAccounts receivable consist primarily of amounts due to us from our customers in the normal course of business. Collateral on trade accounts receivable is generally not required. The Company maintains an allowance for doubtful accounts for estimated uncollectible accounts receivable that is based on expected credit losses. Expected credit losses are estimated based on a number of factors, including historical loss experience, the durations of outstanding trade receivables, and expectations of the future economic environment. Accounts are written off against the allowance account when they are determined to be no longer collectible.
47

InventoriesInventories are stated at the lower of a moving-average cost (which approximates cost on a first-in, first-out basis) and net realizable value. Manufactured inventory cost includes materials, labor, and manufacturing overhead. Purchased inventory cost also includes internal purchasing overhead costs. Raw material inventories largely consist of supplies used in repair operations.
Provisions are made to reduce excess and obsolete inventories to their estimated net realizable values. Inventory provisions are based on forecasted demand, experience with specific customers, the age and nature of the inventory, and the ability to redistribute inventory to other programs or to rework into other consumable inventory.
Property, Plant and Equipment Property, plant and equipment is stated at cost less accumulated depreciation. Depreciation is computed primarily using the straight-line method over the estimated useful lives of the various classes of property, plant and equipment, which are thirty years for buildings and range from three to ten years for all other asset categories. Leasehold improvements are amortized using the straight-line method over the shorter of the lease term or ten years.
LeasesThe Company recognizes right-of-use (“ROU”) assets and lease liabilities for its lease commitments with terms greater than one year. Contractual options to extend or terminate lease agreements are reflected in the lease term when they are reasonably certain to be exercised.
The initial measurements of new ROU assets and lease liabilities are based on the present value of future lease payments over the lease term as of the commencement date. In determining future lease payments, the Company has elected not to separate lease and non-lease components. As the Company’s lease arrangements do not provide an implicit interest rate, we apply the Company’s incremental borrowing rate based on the information available at the commencement date in determining the present value of future lease payments. Relevant information used in determining the Company’s incremental borrowing rate includes the duration of the lease, transaction currency of the lease, and the Company’s credit risk relative to risk-free market rates.
The Company’s ROU assets also include any initial direct costs incurred and exclude lease incentives. The Company’s lease agreements do not contain any significant residual value guarantees or restrictive covenants.
All leases of the Company are classified as operating leases, with lease expense being recognized on a straight-line basis.
Income Taxes The Company accounts for income taxes under the liability method in accordance with Accounting Standards Codification (“ASC”) 740 Topic, Income Taxes. Accordingly, deferred income taxes are provided for the future tax consequences attributable to differences between the carrying amounts of assets and liabilities for financial reporting and income tax purposes. Deferred tax assets and liabilities are measured using tax rates in effect for the year in which those temporary differences are expected to be recovered or settled. A valuation allowance is established when necessary to reduce deferred tax assets to the amount that is more likely than not to be realized. The Company recognizes the benefit of tax positions when it is more likely than not to be sustained on its technical merits. The Company recognizes interest and penalties related to income tax matters as part of income tax expense. The Company has elected consolidated tax filings in certain of its jurisdictions which may allow the group to offset one member’s income with losses of other members in the current period and on a carryover basis. The income tax effects of non-inventory intra-entity asset transfers are recognized in the period in which the transfer occurs. The Company classifies its balance sheet accounts by applying jurisdictional netting principles for locations where consolidated tax filing elections are in place.
U.S. tax law contains the Global Intangible Low-Taxed Income (“GILTI”), Base Erosion Anti-Avoidance Tax (“BEAT”), and Deduction for Foreign-Derived Intangible Income (“FDII”) provisions, which relate to the taxation of certain foreign income. The Company recognizes its GILTI, BEAT, and FDII inclusions, when applicable, within income tax expense in the year included in its U.S. tax return.
GoodwillGoodwill is not amortized, rather it is tested annually for impairment, or more frequently if an event occurs or circumstances change that would more likely than not reduce the fair value of a reporting unit below its carrying value. Our annual impairment testing consists of comparing the estimated fair value of each reporting unit to its carrying value. If the carrying value of a reporting unit exceeds its estimated fair value, goodwill would be considered to be impaired and reduced to its implied fair value. We estimate the fair value of reporting units with valuation techniques, including both the income and market approaches. The income approach requires management to estimate a number of factors for each reporting unit, including
48

projected future operating and cash flow results, economic projections, and discount rates. The market approach estimates fair value using comparable marketplace fair value data from within a comparable industry group.
We most recently performed our annual goodwill impairment testing in the fourth quarter of 2021 using a quantitative approach which did not result in any impairments. See Note 6, Goodwill and Other Intangibles for additional information.
Other Intangible AssetsOther intangible assets consist primarily of technology and patent rights, customer and other relationships, and trade names. These assets, which are generally acquired through business combinations, are recorded at fair value upon acquisition and amortized on a straight-line basis over the asset’s useful life which typically range from two to ten years.
Impairment of Long-Lived Assets and Long-Lived Assets to be Disposed of The Company accounts for long-lived assets in accordance with the provisions of ASC Topic 360, Property, Plant and Equipment, which requires that long-lived assets and certain identifiable intangibles be reviewed for impairment whenever events or changes in circumstances indicate that the carrying amount of an asset may not be recoverable. Recoverability of assets to be held and used is measured by a comparison of the carrying amount of an asset to the sum of the undiscounted cash flows expected to result from the use and the eventual disposition of the asset. If such assets are impaired, the impairment to be recognized is the excess of the carrying amount over the fair value. Assets to be disposed of are reported at the lower of the carrying amount or fair value less costs to sell.
Investments in SecuritiesThe Company’s investments primarily include equity securities that are accounted for at cost, adjusted for impairment losses or changes resulting from observable price changes in orderly transactions for the identical or similar investment of the same issuer. These investments are primarily in venture capital backed technology companies where the Company's ownership interest is less than 20% and the Company does not have the ability to exercise significant influence. See Note 8, Investments for additional information.
Revenue Recognition Revenues are primarily comprised of sales of hardware, supplies, services, solutions and software offerings. We recognize revenues when we transfer control of promised goods or services to our customers in an amount that reflects the consideration to which we expect to receive, which includes estimates of variable consideration, in exchange for those goods or services. We are typically the principal in all elements of our transactions and record Net sales and Cost of sales on a gross basis. Substantially all revenues for tangible products, supplies and perpetual or term software licenses are recognized at a point in time, which is generally upon shipment, when control and the risks and rewards of ownership have transferred to the customer, and the Company has a contractual right to payment. Revenues for our service offerings are recognized over time. Our service offerings include repair and maintenance service contracts, as well as professional services such as installation, integration and provisioning that typically occur in the early stages of a project. The average life of repair and maintenance service contracts is approximately three years. Professional service arrangements range in duration from a day to several weeks or months. Revenues for solutions, including Company-hosted software license and maintenance agreements, are typically recognized over time.
The Company elects to exclude from the transaction price sales and other taxes assessed by a governmental authority and collected by the Company from a customer. The Company also considers shipping and handling activities as part of its fulfillment costs and not as a separate performance obligation. See Note 3, Revenues for additional information.
Research and Development CostsResearch and development (“R&D”) costs include:
• Salaries, benefits, and other R&D personnel related costs;• Consulting and other outside services used in the R&D process;• Engineering supplies;• Engineering related information systems costs; and• Allocation of building and related costs.
R&D costs are expensed as incurred, including those associated with developing and maintaining software within our customer offerings. The Company typically applies a dynamic and iterative approach to developing customer product and software offerings as well as ongoing software feature and functionality enhancement releases, and accordingly, such costs do not meet capitalization criteria.
Advertising
49

Advertising costs are expensed as incurred. These costs totaled $35 million, $25 million, and $19 million for the years ended 2021, 2020 and 2019, respectively.
WarrantiesIn general, the Company provides warranty coverage of one year on mobile computers, printers and batteries. Advanced data capture products are warrantied from one to five years, depending on the product. Thermal printheads are warrantied for six months and battery-based products, such as location tags, are covered by a 90-day warranty. A provision for warranty expense is adjusted quarterly based on historical and expected warranty experience.
ContingenciesThe Company establishes a liability for loss contingencies when the loss is both probable and estimable. In addition, for some matters for which a loss is probable or reasonably possible, a reliable estimate of the amount of loss or range of loss is not possible, and we may be unable to estimate the possible loss or range of losses that could potentially result from the application of non-monetary remedies.
Fair Value of Financial InstrumentsFair value is the price that would be received to sell an asset or paid to transfer a liability in an orderly transaction between market participants at the measurement date. Our financial assets and liabilities that are accounted for at fair value generally include our employee deferred compensation plan investments, foreign currency forwards, and interest rate swaps. In accordance with ASC Topic 815, Derivatives and Hedging (“ASC 815”), we recognize derivative instruments and hedging activities as either assets or liabilities on the Consolidated Balance Sheets and measure them at fair value. Accounting for the gains and losses on our derivatives resulting from changes in fair value is dependent on the use of the derivative and whether it is designated and qualifies for hedge accounting.
The Company utilizes foreign currency forwards to hedge certain foreign currency exposures. We use broker quotations or market transactions, in either the listed or over-the-counter markets, to value our foreign currency exchange contracts. The Company also has interest rate swaps to hedge a portion of the variability in future cash flows on debt. We use relevant observable market inputs at quoted intervals, such as forward yield curves and the Company’s own credit risk, to value our interest rate swaps. See Note 11, Derivative Instruments for additional information on the Company’s derivatives and hedging activities.
The Company’s securities held for its deferred compensation plans are measured at fair value using quoted prices in active markets for identical assets. If active markets for identical assets are not available to determine fair value, then we use quoted prices for similar assets or inputs that are observable either directly or indirectly.
The carrying amounts of cash and cash equivalents, receivables and accounts payable approximate fair value due to the short-term nature of those financial instruments. See Note 10, Fair Value Measurements for information related to financial assets and liabilities carried at fair value.
Share-Based CompensationThe Company has share-based compensation plans and an employee stock purchase plan under which shares of Class A Common Stock are available for future grant and purchase. The Company recognizes compensation costs over the vesting period which is typically three years, net of estimated forfeitures. Compensation costs associated with awards with graded vesting terms are recognized on a straight-line basis. See Note 15, Share-Based Compensation for additional information.
Foreign Currency TranslationThe balance sheet accounts of the Company’s subsidiaries that have not designated the U.S. Dollar as its functional currency are translated into U.S. Dollars using the period-end exchange rate, and statement of earnings items are translated using the average exchange rate for the period. The resulting translation gains or losses are recorded in Stockholders’ equity as a cumulative translation adjustment, which is a component of AOCI within the Consolidated Balance Sheets.
AcquisitionsWe account for acquired businesses using the acquisition method of accounting. This method requires that the purchase price be allocated to the identifiable assets acquired and liabilities assumed, generally measured at their estimated fair values. The excess of the purchase price over the identifiable assets acquired and liabilities assumed is recorded as goodwill.
The estimates used to determine the fair values of long-lived assets, such as intangible assets, can be complex and require judgment. Critical estimates in valuing certain intangible assets include, but are not limited to, future expected cash flows from revenues and operating activities and the determination of discount rates. Management’s estimates of fair value are based on estimates and assumptions utilized as part of the purchase price allocation process and are believed to be reasonable; however
50

elements of these estimates and assumptions are inherently uncertain and subject to refinement during the measurement period, which is up to one year after the acquisition date.
Recently Adopted Accounting PronouncementsIn October 2021, the Financial Accounting Standards Board (“FASB”) issued Accounting Standard Update 2021-08, Business Combinations (Topic 805): Accounting for Contract Assets and Contract Liabilities from Contracts with Customers (“ASU 2021-08”). ASU 2021-08 requires contract assets and contract liabilities acquired in a business acquisition to be recognized and measured in accordance with ASC 606, Revenues from Contracts with Customers, which we generally expect will result in the recognition and measurement of contract assets and contract liabilities in a manner that is consistent with the acquiree. Prior to the adoption of ASU 2021-08, the Company measured contract assets and contract liabilities acquired in business acquisitions at fair value. The Company early adopted ASU 2021-08 in the fourth quarter of 2021, with applicability to the accounting for our 2021 business acquisitions and any future business acquisitions. The application of ASU 2021-08 did not have a significant effect on the recognition and measurement of acquired assets and liabilities associated with our 2021 acquisitions.
In March 2020, the FASB issued Accounting Standards Update ASU 2020-04, Reference Rate Reform (Topic 848) - Facilitation of the Effects of Reference Rate Reform on Financial Reporting (“ASU 2020-04”). Subject to meeting certain criteria, ASU 2020-04 provides optional expedients and exceptions to applying contract modification accounting under existing generally accepted accounting principles for contracts that are modified to address the phase out of the London Inter-bank Offered Rate (“LIBOR”). The Company amended certain contracts in the fourth quarter of 2021 to replace LIBOR with alternative reference rates, primarily the Secured Overnight Financing Rate. We adopted and applied ASU 2020-04 in the accounting for those amendments, which did not have a material impact on the consolidated financial statements. We anticipate negotiating similar amendments to other contracts that include LIBOR tenors that are expected to be phased out by June 30, 2023, and do not expect those amendments to have a material impact on the consolidated financial statements.
Note 3 Revenues
The Company recognizes revenue to depict the transfer of goods or services to a customer at an amount that reflects the consideration which it expects to receive for providing those goods or services. To determine total expected consideration, the Company estimates elements of variable consideration, which primarily include product rights of return, rebates, and other incentives. These estimates are developed using the expected value method and are reviewed and updated, as necessary, at each reporting period. Revenues, inclusive of variable consideration, are recognized to the extent it is probable that a significant reversal in cumulative revenues recognized will not occur in future periods.
We enter into contracts that may include various combinations of tangible products, services, solutions and software offerings, which are generally capable of being distinct and accounted for as separate performance obligations. We evaluate whether two or more contracts should be combined and accounted for as a single contract and whether the combined or single contract has more than one performance obligation. This evaluation requires judgment, and the decision to combine a group of contracts or separate the combined or single contract into multiple distinct performance obligations may impact the amount of revenue recorded in a reporting period. We deem performance obligations to be distinct if the customer can benefit from the product or service on its own or together with readily available resources (“capable of being distinct”) and if the transfer of products, solutions or services is separately identifiable from other promises in the contract (“distinct within the context of the contract”).
For contract arrangements that include multiple performance obligations, we allocate the total transaction price to each performance obligation in an amount based on the estimated relative standalone selling prices for each performance obligation. In general, standalone selling prices are observable for tangible products and software licenses, while standalone selling prices for professional services, repair and maintenance services, and solutions are developed primarily with an expected cost-plus margin approach. Regional pricing, marketing strategies and business practices are evaluated to derive estimated standalone selling prices.
The Company recognizes revenue for each performance obligation upon transfer of control of the promised goods or services. Control is deemed to have been transferred when the customer has the ability to direct the use of and has obtained substantially all of the remaining benefits from the goods and services. The determination of whether control transfers at a point in time or over time requires judgment and includes our consideration of the following: 1) whether the customer simultaneously receives and consumes the benefits provided as the Company performs its promises; 2) whether the Company’s performance creates or enhances an asset that is under control of the customer; and 3) whether the Company’s performance does not create an asset with an alternative use to the Company, while the Company has an enforceable right to payment for its performance completed to date.
51

Revenues for products are generally recognized upon shipment, whereas revenues for services and solutions offerings are generally recognized over time by using an output or time-based method, assuming all other criteria for revenue recognition have been met. Revenues for software are recognized either upon delivery or over time using a time-based method, depending upon how control is transferred to the customer. In cases where a bundle of products, services, solutions and/or software are delivered to the customer, judgment is required to select the method of progress which best reflects the transfer of control.
Disaggregation of RevenueThe following table presents our Net sales disaggregated by product category for each of our segments, AIT and EVM, for the years ended December 31, 2021, 2020 and 2019 (in millions):
Year Ended December 31, 2021
SegmentTangible Products
Services and Software Total
AIT $ 1,577 $ 110 $ 1,687 EVM 3,268 678 3,946
Corporate, eliminations (1) — (6) (6) Total $ 4,845 $ 782 $ 5,627
Year Ended December 31, 2020
SegmentTangible Products
Services and Software Total
AIT $ 1,298 $ 94 $ 1,392 EVM 2,515 548 3,063
Corporate, eliminations (1) — (7) (7) Total $ 3,813 $ 635 $ 4,448
Year Ended December 31, 2019
SegmentTangible Products
Services and Software Total
AIT $ 1,347 $ 100 $ 1,447 EVM 2,560 478 3,038 Total $ 3,907 $ 578 $ 4,485
(1) Amounts included in Corporate, eliminations consist of purchase accounting adjustments.
In addition, refer to Note 20, Segment Information & Geographic Data for Net sales to customers by geographic region.
Performance ObligationsThe Company’s remaining performance obligations primarily relate to repair and support services, as well as solutions offerings. The aggregated transaction price allocated to remaining performance obligations for arrangements with an original term exceeding one year was $1,033 million and $974 million, inclusive of deferred revenue, as of December 31, 2021 and 2020, respectively. On average, remaining performance obligations as of December 31, 2021 and 2020 are expected to be recognized over a period of approximately two years.
Contract BalancesProgress on satisfying performance obligations under contracts with customers related to billed revenues is reflected on the Consolidated Balance Sheets in Accounts receivable, net. Progress on satisfying performance obligations under contracts with customers related to unbilled revenues (“contract assets”) is reflected on the Consolidated Balance Sheets as Prepaid expenses and other current assets for revenues expected to be billed within the next twelve months, and Other long-term assets for revenues expected to be billed thereafter. The total contract asset balances were $10 million each as of December 31, 2021 and 2020. These contract assets result from timing differences between the billing and satisfying performance obligations, as well as the impact from the allocation of the transaction price among performance obligations for contracts that include multiple performance obligations. Contract assets are evaluated for impairment and no impairment losses have been recognized during the years ended December 31, 2021, 2020 and 2019.
Deferred revenue on the Consolidated Balance Sheets consists of payments and billings in advance of our performance. The combined short-term and long-term deferred revenue balances were $695 million and $581 million as of December 31, 2021
52

and 2020, respectively. The Company recognized $319 million, $256 million and $219 million in revenue that was previously included in the beginning balance of deferred revenue during the years ended December 31, 2021, 2020 and 2019, respectively.
Our payment terms vary by the type and location of our customer and the products, solutions or services offered. The time between invoicing and when payment is due is not significant. In instances where the timing of revenue recognition differs from the timing of invoicing, we have determined that our contracts do not include a significant financing component.
Costs to Obtain a ContractOur incremental direct costs of obtaining a contract, which consist of sales commissions and incremental fringe benefits, are deferred and amortized over the weighted-average contract term. The incremental costs to obtain a contract are derived at a portfolio level and amortized on a straight-line basis. The total ending balance of deferred commission costs, which are recorded in Prepaid expenses and other current assets or Other long-term assets on the Consolidated Balance Sheets, depending on the timing of expected amortization, was $28 million and $23 million as of December 31, 2021 and 2020, respectively. Amortization of deferred commission costs, which is recorded in Selling and Marketing expense on the Consolidated Statements of Operations, was $18 million, $14 million and $11 million during the years ended December 31, 2021, 2020 and 2019, respectively. Incremental costs of obtaining a contract are expensed as incurred if the amortization period would otherwise be one year or less.
Note 4 Inventories
The components of Inventories, net are as follows (in millions):
December 31,2021
December 31,2020
Raw materials $ 196 $ 117 Work in process 3 4 Finished goods 292 390
Total Inventories, net $ 491 $ 511
Note 5 Business Acquisitions
AntuitOn October 7, 2021, the Company acquired Antuit Holdings Pte. Ltd. (“Antuit”), a provider of demand-sensing and pricing optimization software solutions for retail and consumer products companies. Through this acquisition, the Company intends to enhance its solution offerings to customers in these industries by combining Antuit’s platform with its existing software solutions and EVM products.
The acquisition was accounted for under the acquisition method of accounting for business combinations. The Company’s cash purchase consideration was $145 million in cash paid, net of Antuit’s cash on-hand.
The Company utilized estimated fair values as of the acquisition date to allocate the total purchase consideration to the identifiable assets acquired and liabilities assumed. The fair value of the net assets acquired was based on several estimates and assumptions, as well as customary valuation techniques, primarily the excess earnings method for technology and patent intangible assets. While we believe these estimates provide a reasonable basis to record the net assets acquired, the purchase price allocation is considered preliminary and subject to adjustment during the measurement period, which is up to one year from the acquisition date. The primary fair value estimates still considered preliminary as of December 31, 2021 include intangible assets and income tax-related items.
The preliminary purchase price allocation to assets acquired and liabilities assumed was as follows (in millions):
Identifiable intangible assets $ 47 Accounts receivable 9 Other assets acquired 4 Deferred tax liabilities (11) Other liabilities assumed (9)
Net assets acquired $ 40 Goodwill on acquisition 105
Total purchase price $ 145
53

The $105 million of goodwill, which is non-deductible for tax purposes, has been allocated to the EVM segment and principally relates to the planned expansion of Antuit’s portfolio and integration with the Company’s existing solution offerings as well as expansion into current and new markets, industries and product offerings.
The preliminary purchase price allocation to identifiable intangible assets acquired was as follows:Fair Value (in
millions)Useful Life (in
years)Technology and patents $ 39 8Customer and other relationships 7 2Trade names 1 2
Total identifiable intangible assets $ 47
In connection with the acquisition of Antuit, the Company also granted share-based compensation awards in the form of stock and cash-settled restricted stock units with an approximate fair value of $5 million. The total fair value of the awards is attributable to post-acquisition service and will generally be expensed over a three-year service period.
The Company has not included unaudited pro forma results, as if Antuit had been acquired as of January 1, 2020, as doing so would not yield materially different results.
FetchOn August 9, 2021, the Company acquired Fetch Robotics, Inc. (“Fetch”), a provider of autonomous mobile robot solutions for customers who operate in the manufacturing, distribution, and fulfillment industries, enabling customers to optimize workflows through robotic automation. Through this acquisition, the Company intends to expand its automation solution offerings within these industries.
The acquisition was accounted for under the acquisition method of accounting for business combinations. The total purchase consideration was $301 million, which consisted of $290 million in cash paid, net of Fetch’s cash on-hand, and the fair value of the Company’s existing ownership interest in Fetch of $11 million, as remeasured upon acquisition. This remeasurement resulted in a $1 million gain reflected in Other (expense) income, net on the Consolidated Statements of Operations.
The Company utilized estimated fair values as of the acquisition date to allocate the total purchase consideration to the identifiable assets acquired and liabilities assumed. The fair value of the net assets acquired was based on several estimates and assumptions, as well as customary valuation techniques, primarily the excess earnings method for technology and patent intangible assets. While we believe these estimates provide a reasonable basis to record the net assets acquired, the purchase price allocation is considered preliminary and subject to adjustment during the measurement period, which is up to one year from the acquisition date. The primary fair value estimates still considered preliminary as of December 31, 2021 include intangible assets and income tax-related items.
The preliminary purchase price allocation to assets acquired and liabilities assumed was as follows (in millions):
Identifiable intangible assets $ 114 Right-of-use lease asset 11 Inventories 6 Deferred tax assets 6 Other assets acquired 5 Lease liability (11) Other liabilities assumed (4)
Net assets acquired $ 127 Goodwill on acquisition 174
Total purchase price $ 301
The $174 million of goodwill, which is non-deductible for tax purposes, has been allocated to the EVM segment and principally relates to the planned geographic expansion and integration of Fetch into the Company’s manufacturing and warehouse automation offerings.
54

During the fourth quarter of 2021, the Company recorded measurement period adjustments relating to facts and circumstances existing as of the acquisition date, which are included in the preliminary purchase price allocation above. The primary measurement period adjustment was related to the realizability of income tax net operating losses, resulting in a $33 million increase in net deferred tax assets and a corresponding decrease in goodwill.
The preliminary purchase price allocation to identifiable intangible assets acquired was as follows:Fair Value (in
millions)Useful Life (in
years)Technology and patents $ 100 7Customer and other relationships 5 2Trade names 9 5
Total identifiable intangible assets $ 114
In connection with the acquisition of Fetch, the Company granted share-based compensation awards, principally as a replacement for unvested Fetch stock options, in the form of stock-settled restricted stock units. The total fair value of approximately $23 million is attributable to post-acquisition service and will generally be expensed over a three-year service period.
The Company has not included unaudited pro forma results, as if Fetch had been acquired as of January 1, 2020, as doing so would not yield materially different results.
Adaptive VisionOn May 17, 2021, the Company acquired Adaptive Vision Sp. z o.o. (“Adaptive Vision”), a provider of graphical machine vision software with applications in the manufacturing industry, as well as a provider of libraries and other offerings for machine vision developers. The acquisition was accounted for under the acquisition method of accounting for business combinations. The Company’s cash purchase consideration of $18 million, net of cash on-hand, was primarily allocated to technology-related intangible assets of $13 million and associated deferred tax liabilities, and goodwill of $7 million. The technology-related intangible assets have an estimated useful life of eight years. The goodwill, which will be non-deductible for tax purposes, has been allocated to the EVM segment and principally relates to the planned expansion of the Adaptive Vision technologies into new product offerings and markets. The Company has not included unaudited pro forma results, as if Adaptive Vision had been acquired as of January 1, 2020, as doing so would not yield materially different results.
ReflexisOn September 1, 2020, the Company acquired Reflexis Systems, Inc. (“Reflexis”), a provider of task and workforce management, execution, and communication solutions for customers in the retail, food service, hospitality, and banking industries. Through its acquisition of Reflexis, the Company enhanced its solution offerings to customers in these industries by combining Reflexis’ platform with its existing software solutions and its EVM product offerings.
The Reflexis acquisition was accounted for under the acquisition method of accounting for business combinations. The Company’s final cash purchase consideration was $547 million, net of Reflexis’ cash on-hand and including resolution of contractual matters that resulted in escrow proceeds of $1 million being received by the Company in 2021.
The acquisition of Reflexis was funded, in part, by the issuance of a new term loan (the “2020 Term Loan”) in the amount of $200 million. The acquisition of Reflexis was otherwise funded using the Company’s cash on hand and borrowing under the Company’s existing Revolving Credit Facility. See additional details related to the Company’s debt arrangements in Note 12, Long-Term Debt.
In connection with its acquisition of Reflexis, and in exchange for the cancellation of unvested Reflexis stock options, the Company granted replacement share-based compensation awards to certain Reflexis employees in the form of Zebra incentive stock options. The total fair value of approximately $9 million is primarily attributable to post-acquisition service and expensed over the remaining service period. See Note 15, Share-Based Compensation for additional details related to these options.
The Company utilized estimated fair values as of the acquisition date to allocate the total purchase consideration to the identifiable assets acquired and liabilities assumed. The fair value of the net assets acquired was based on several estimates and assumptions, as well as customary valuation techniques, primarily the excess earnings method for technology and patent intangible assets, as well as exit cost methodologies for liabilities such as deferred revenues.
55

The purchase price allocation to assets acquired and liabilities assumed was as follows (in millions):
Identifiable intangible assets $ 213 Accounts receivable 20 Property, plant and equipment 10 Other assets acquired 17 Deferred revenue (16) Deferred tax liabilities (39) Other liabilities assumed (14)
Net assets acquired $ 191 Goodwill on acquisition 356
Total purchase consideration $ 547
The $356 million of goodwill, which is non-deductible for tax purposes, has been allocated to the EVM segment and principally relates to the planned integration of Reflexis’ solution offerings with the Company’s existing solution offerings as well as expansion in current and new markets, industries and product offerings.
In 2021, the Company finalized the purchase price allocation and recorded measurement period adjustments consisting of a $9 million increase to the trade name intangible asset and a $2 million increase to deferred tax liabilities resulting in a $7 million reduction of goodwill.
The purchase price allocation to identifiable intangible assets acquired was:Fair Value (in
millions)Useful Life (in
years)Technology and patents $ 160 8Customer and other relationships 43 2Trade names 10 8Total identifiable intangible assets $ 213
CortexicaOn November 5, 2019, the Company acquired Cortexica Vision Systems Limited (“Cortexica”), a provider of computer vision-based artificial intelligence solutions primarily for the retail industry. The purchase consideration of $7 million was primarily allocated to technology-related intangible assets of $4 million and goodwill of $4 million based on the fair values of identifiable assets acquired and liabilities assumed. The goodwill, which will be non-deductible for tax purposes, has been allocated to the EVM segment and principally relates to the Company’s expansion of the Cortexica technologies into new markets, industries, and product offerings.
ProfitectOn May 31, 2019, the Company acquired Profitect, Inc. (“Profitect”), a provider of prescriptive analytics primarily for the retail industry. In acquiring Profitect, the Company enhanced its existing software solutions within the retail industry, with possible future applications in other industries, markets and product offerings.
The Profitect acquisition was accounted for under the acquisition method of accounting for business combinations. The total purchase consideration was $79 million, which consisted of $75 million in cash paid, net of cash on-hand, and the fair value of the Company’s existing ownership interest in Profitect of $4 million, as remeasured upon acquisition. This remeasurement resulted in a $4 million gain reflected within Other (expense) income, net on the Consolidated Statements of Operations in 2019.
The purchase consideration was allocated to the assets acquired and liabilities assumed based on their fair values as of the acquisition date. The fair value of intangible assets was derived utilizing a number of estimates and assumptions as well as customary valuation procedures and techniques, principally the excess earnings methodology for technology and patent intangible assets.
The purchase price allocation to assets acquired and liabilities assumed was as follows (in millions):
56

Identifiable intangible assets $ 35 Other assets acquired 4 Deferred tax liabilities (4) Other liabilities assumed (10)
Net Assets Acquired $ 25 Goodwill on acquisition 54 Total purchase consideration $ 79
The $54 million of goodwill, which is non-deductible for tax purposes, has been allocated to the EVM segment and principally relates to the Company’s expansion of the Profitect software offerings and technologies into current and new markets, industries and product offerings.
The purchase price allocation to identifiable intangible assets acquired was:
Fair Value (in millions)
Useful Life (in years)
Technology and patents $ 33 8Customer and other relationships 2 1Total identifiable intangible assets $ 35
TemptimeOn February 21, 2019, the Company acquired Temptime Corporation (“Temptime”), a developer and manufacturer of temperature-monitoring labels and devices.
The Temptime acquisition was accounted for under the acquisition method of accounting for business combinations. The Company paid $180 million in cash, net of cash on-hand, to acquire Temptime.
The purchase consideration was allocated to the assets acquired and liabilities assumed based on their fair values as of the acquisition date. The fair value of intangible assets was derived utilizing a number of estimates and assumptions as well as customary valuation procedures and techniques, including the excess earnings and relief from royalties methodologies.
The purchase price allocation to assets acquired and liabilities assumed was as follows (in millions):
Inventory $ 14 Property, plant and equipment 10 Identifiable intangible assets 106 Other assets acquired 11 Deferred tax liabilities (23) Other liabilities assumed (12)
Net Assets Acquired $ 106 Goodwill on acquisition 74 Total purchase consideration $ 180
The $74 million of goodwill, which is non-deductible for tax purposes, has been allocated to the AIT segment and principally relates to the Company’s expansion of its product offerings and technologies into current and new markets and industries.
The purchase price allocation to identifiable intangible assets acquired was:
Fair Value (in millions)
Useful Life (in years)
Customer and other relationships $ 79 8Technology and patents 25 8Trade names 2 3Total identifiable intangible assets $ 106
57

The operating results of each acquired company have been included in the Company’s Consolidated Balance Sheets and Statements of Operations beginning on their respective acquisition dates.
Acquisition and integration costsThe Company incurred approximately $25 million of acquisition-related costs in 2021, primarily related to third-party transaction and advisory fees associated with our business acquisitions, as well as transaction bonuses paid to existing Antuit option holders. These costs are included within Acquisition and integration costs on the Consolidated Statements of Operations.
The Company incurred approximately $23 million of acquisition-related costs during 2020, which primarily consisted of payments to settle certain existing Reflexis share-based compensation awards whose vesting was accelerated at the discretion of Reflexis contemporaneously with the acquisition. Those payments, as well as $9 million of other acquisition-related costs primarily related to third-party transaction and advisory fees associated with our business acquisitions, are included within Acquisition and integration costs on the Consolidated Statements of Operations.
The Company incurred approximately $22 million of acquisition-related costs during 2019, which primarily consisted of payments to settle certain existing Profitect share-based compensation awards whose vesting was accelerated at the discretion of Profitect contemporaneously with the acquisition. Those payments, as well as $9 million of other acquisition-related costs primarily related to third-party transaction and advisory fees associated with our business acquisitions, are included within Acquisition and integration costs on the Consolidated Statements of Operations.
Note 6 Goodwill and Other Intangibles
GoodwillChanges in the net carrying value of goodwill by segment were as follows (in millions):
AIT EVM TotalGoodwill as of December 31, 2019 $ 227 $ 2,395 $ 2,622
Reflexis acquisition — 364 364 Temptime purchase price allocation adjustments 1 — 1 Foreign exchange impact — 1 1
Goodwill as of December 31, 2020 $ 228 $ 2,760 $ 2,988 Retail Solutions move to EVM segment, effective January 1, 2021 (59) 59 — Antuit acquisition — 105 105 Fetch acquisition — 174 174 Adaptive Vision acquisition — 7 7 Reflexis purchase price allocation adjustments — (7) (7) Reflexis purchase price reduction — (1) (1) Foreign exchange impact — (1) (1)
Goodwill as of December 31, 2021 $ 169 $ 3,096 $ 3,265
See Note 5, Business Acquisitions for further details related to the Company’s acquisitions and purchase price allocation adjustments.
The Company’s goodwill balance consists of four reporting units. The Company completed its annual goodwill impairment testing during the fourth quarter of 2021 utilizing a quantitative approach. The estimated fair value of each reporting unit continues to significantly exceed its carrying value. However, there is risk of future impairment to the extent that an individual reporting unit’s performance does not meet projections. Additionally, if our current assumptions and estimates, including projected revenues and income growth rates, terminal growth rates, competitive and consumer trends, market-based discount rates, and other market factors are not met, or if other valuation factors outside of our control change unfavorably, the estimated fair value of our reporting units could be adversely affected, leading to a potential impairment in the future.
No events occurred during the fiscal years ended 2021, 2020, or 2019 that indicated it was more likely than not that our goodwill was impaired.
58
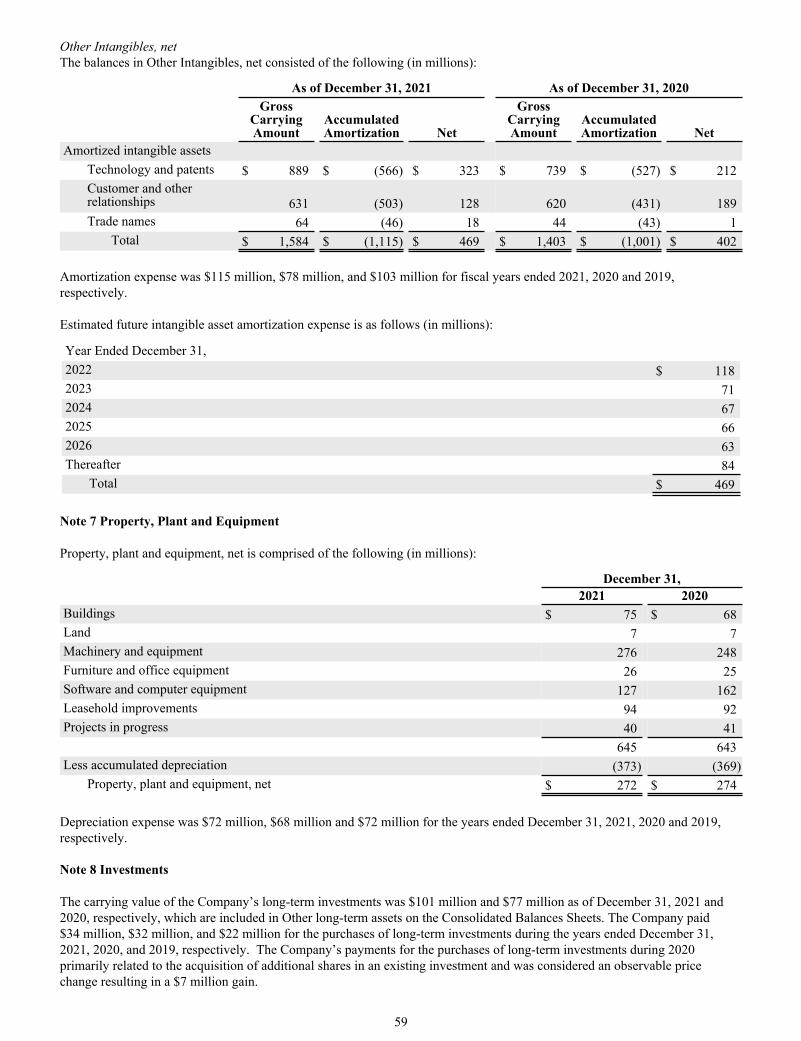
Other Intangibles, netThe balances in Other Intangibles, net consisted of the following (in millions):
As of December 31, 2021 As of December 31, 2020
Gross Carrying Amount
AccumulatedAmortization Net
Gross Carrying Amount
AccumulatedAmortization Net
Amortized intangible assetsTechnology and patents $ 889 $ (566) $ 323 $ 739 $ (527) $ 212 Customer and other relationships 631 (503) 128 620 (431) 189 Trade names 64 (46) 18 44 (43) 1
Total $ 1,584 $ (1,115) $ 469 $ 1,403 $ (1,001) $ 402 Amortization expense was $115 million, $78 million, and $103 million for fiscal years ended 2021, 2020 and 2019, respectively.
Estimated future intangible asset amortization expense is as follows (in millions):
Year Ended December 31,2022 $ 118 2023 71 2024 67 2025 66 2026 63 Thereafter 84
Total $ 469
Note 7 Property, Plant and Equipment
Property, plant and equipment, net is comprised of the following (in millions):
December 31, 2021 2020Buildings $ 75 $ 68 Land 7 7 Machinery and equipment 276 248 Furniture and office equipment 26 25 Software and computer equipment 127 162 Leasehold improvements 94 92 Projects in progress 40 41
645 643 Less accumulated depreciation (373) (369)
Property, plant and equipment, net $ 272 $ 274
Depreciation expense was $72 million, $68 million and $72 million for the years ended December 31, 2021, 2020 and 2019, respectively.
Note 8 Investments
The carrying value of the Company’s long-term investments was $101 million and $77 million as of December 31, 2021 and 2020, respectively, which are included in Other long-term assets on the Consolidated Balances Sheets. The Company paid $34 million, $32 million, and $22 million for the purchases of long-term investments during the years ended December 31, 2021, 2020, and 2019, respectively. The Company’s payments for the purchases of long-term investments during 2020 primarily related to the acquisition of additional shares in an existing investment and was considered an observable price change resulting in a $7 million gain.
59

The Company also received cash proceeds of $6 million and $10 million related to the sale of a long-term investments during the years ended December 31, 2020 and 2019, respectively.
Net gains related to the Company’s long-term investments, which are included within Other (expense) income, net on the Consolidated Statements of Operations, were $2 million, $5 million, and $3 million during the years ended December 31, 2021, 2020, and 2019, respectively.
Note 9 Exit and Restructuring Costs
In the fourth quarter of 2021, the Company committed to organizational design changes intended to better meet its strategic objectives and improve cost efficiency (referred to as the “2021 Productivity Plan”), principally within the Europe, Middle East, and Africa (“EMEA”) and North America regions. Exit and restructuring charges associated with the 2021 Productivity Plan, which primarily related to employee benefits and severance, were $7 million during the year ended December 31, 2021. Estimated remaining costs under the 2021 Productivity Plan, which is expected to be completed by 2022, are expected to be up to $3 million.
In the fourth quarter of 2019, the Company committed to certain organizational changes designed to generate operational efficiencies (referred to as the “2019 Productivity Plan”), principally in the North America and EMEA regions. The 2019 Productivity Plan was completed in 2020. Exit and restructuring charges associated with the 2019 Productivity Plan, which primarily related to employee severance and benefits, were $11 million and $8 million during the years ended December 31, 2020 and 2019, respectively.
Note 10 Fair Value Measurements
Financial assets and liabilities are measured using inputs from three levels of the fair value hierarchy in accordance with ASC Topic 820, Fair Value Measurements. Fair value is defined as the price that would be received to sell an asset or paid to transfer a liability in an orderly transaction between market participants at the measurement date. It establishes a fair value hierarchy that prioritizes observable and unobservable inputs used to measure fair value into the following three broad levels:
• Level 1: Quoted prices in active markets that are accessible at the measurement date for identical assets or liabilities. The fair value hierarchy gives the highest priority to Level 1 inputs (e.g. U.S. Treasuries and money market funds).
• Level 2: Observable prices that are based on inputs not quoted in active markets but corroborated by market data.
• Level 3: Unobservable inputs are used when little or no market data is available. The fair value hierarchy gives the lowest priority to Level 3 inputs.
In determining fair value, the Company utilizes valuation techniques that maximize the use of observable inputs to the extent possible. In addition, the Company considers counterparty credit risk in the assessment of fair value.
The Company’s financial assets and liabilities carried at fair value as of December 31, 2021, are classified below (in millions):
Level 1 Level 2 Level 3 Total Assets:
Foreign exchange contracts (1) $ — $ 23 $ — $ 23 Money market investments related to the deferred compensation plan 37 — — 37
Total Assets at fair value $ 37 $ 23 $ — $ 60 Liabilities:
Forward interest rate swap contracts (2) $ — $ 16 $ — $ 16 Liabilities related to the deferred compensation plan 37 — — 37
Total Liabilities at fair value $ 37 $ 16 $ — $ 53
60

The Company’s financial assets and liabilities carried at fair value as of December 31, 2020, are classified below (in millions):
Level 1 Level 2 Level 3 Total Assets:
Money market investments related to the deferred compensation plan $ 30 $ — $ — $ 30
Total Assets at fair value $ 30 $ — $ — $ 30 Liabilities:
Foreign exchange contracts (1) $ 3 $ 34 $ — $ 37 Forward interest rate swap contracts (2) — 46 — 46
Liabilities related to the deferred compensation plan 30 — — 30 Total Liabilities at fair value $ 33 $ 80 $ — $ 113
(1) The fair value of the foreign exchange contracts is calculated as follows:• Fair value of regular forward contracts associated with forecasted sales hedges is calculated using the period-end
exchange rate adjusted for current forward points.• Fair value of hedges against net assets is calculated at the period-end exchange rate adjusted for current forward points
unless the hedge has been traded but not settled at year end (Level 2). If this is the case, the fair value is calculated at the rate at which the hedge is being settled (Level 1).
(2) The fair value of forward interest rate swaps is based upon a valuation model that uses relevant observable market inputs at the quoted intervals, such as forward yield curves, and is adjusted for the Company’s credit risk and the interest rate swap terms.
Note 11 Derivative Instruments
In the normal course of business, the Company is exposed to global market risks, including the effects of changes in foreign currency exchange rates and interest rates. The Company uses derivative instruments to manage its exposure to such risks and may elect to designate certain derivatives as hedging instruments under ASC Topic 815, Derivatives and Hedging (“ASC 815”). The Company formally documents all relationships between designated hedging instruments and hedged items as well as its risk management objectives and strategies for undertaking hedge transactions. The Company does not hold or issue derivatives for trading or speculative purposes.
In accordance with ASC 815, the Company recognizes derivative instruments as either assets or liabilities on the Consolidated Balance Sheets and measures them at fair value. The following table presents the fair value of its derivative instruments (in millions):
Asset (Liability)Fair Values as of December 31,
Balance Sheets Classification 2021 2020Derivative instruments designated as hedges: Foreign exchange contracts Prepaid expenses and other current
assets $ 23 $ — Foreign exchange contracts Accrued liabilities — (34) Total derivative instruments designated as hedges $ 23 $ (34)
Derivative instruments not designated as hedges: Foreign exchange contracts Accrued liabilities $ — $ (3) Forward interest rate swaps Accrued liabilities (15) (17) Forward interest rate swaps Other long-term liabilities (1) (29) Total derivative instruments not designated as hedges $ (16) $ (49)
Total net derivative asset (liability) $ 7 $ (83)
61

The following table presents the net gains (losses) from changes in fair values of derivatives that are not designated as hedges (in millions):
Gain (Loss) Recognized in IncomeStatements of
Operations Classification
Year Ended December 31,2021 2020 2019
Derivative instruments not designated as hedges: Foreign exchange contracts Foreign exchange loss $ 7 $ (12) $ (3) Forward interest rate swaps Interest expense, net 13 (46) (19)
Total gain (loss) recognized in income $ 20 $ (58) $ (22)
Activities related to derivative instruments are reflected within Net cash provided by operating activities on the Consolidated Statements of Cash Flows.
Credit and Market Risk ManagementFinancial instruments, including derivatives, expose the Company to counterparty credit risk of nonperformance and to market risk related to currency exchange rate and interest rate fluctuations. The Company manages its exposure to counterparty credit risk by establishing minimum credit standards, diversifying its counterparties, and monitoring its concentrations of credit. The Company’s counterparties are commercial banks with expertise in derivative financial instruments. The Company evaluates the impact of market risk on the fair value and cash flows of its derivative and other financial instruments by considering reasonably possible changes in interest rates and currency exchange rates. The Company continually monitors the creditworthiness of the customers to which it grants credit terms in the normal course of business. The terms and conditions of the Company’s credit policies are designed to mitigate concentrations of credit risk.
The Company’s master netting and other similar arrangements with the respective counterparties allow for net settlement under certain conditions, which are designed to reduce credit risk by permitting net settlement with the same counterparty. We present the assets and liabilities of our derivative financial instruments, for which we have net settlement agreements in place, on a net basis on the Consolidated Balance Sheets. If the derivative financial instruments had been presented gross on the Consolidated Balance Sheets, the asset and liability positions would have increased by $1 million as of December 31, 2021 and would have been unchanged as of December 31, 2020.
Foreign Currency Exchange Risk ManagementThe Company conducts business on a multinational basis in a variety of foreign currencies. Exposure to market risk for changes in foreign currency exchange rates arises primarily from Euro-denominated external revenues, cross-border financing activities between subsidiaries, and foreign currency denominated monetary assets and liabilities. The Company manages its objective of preserving the economic value of non-functional currency denominated cash flows by initially hedging transaction exposures with natural offsets to the fullest extent possible and, once these opportunities have been exhausted, through foreign exchange forward and option contracts, as deemed appropriate.
The Company manages the exchange rate risk of anticipated Euro-denominated sales using forward contracts, which typically mature within twelve months of execution. The Company designates these derivative contracts as cash flow hedges. Unrealized gains and losses on these contracts are deferred in Accumulated other comprehensive income (loss) (“AOCI”) on the Consolidated Balance Sheets until the contract is settled and the hedged sale is realized. The realized gain or loss is then recorded as an adjustment to Net sales on the Consolidated Statements of Operations. Realized amounts reclassified to Net sales were $2 million and $6 million of losses for the years ended December 31, 2021 and 2020, respectively, and $42 million of gains for the year ended December 31, 2019. As of December 31, 2021 and 2020, the notional amounts of the Company’s foreign exchange cash flow hedges were €675 million and €585 million, respectively. The Company has reviewed its cash flow hedges for effectiveness and determined that they are highly effective.
The Company uses forward contracts, which are not designated as hedging instruments, to manage its exposures related to net assets denominated in foreign currencies. These forward contracts typically mature within one month after execution. Monetary gains and losses on these forward contracts are recorded in income and are generally offset by the transaction gains and losses related to their net asset positions. The notional values and the net fair values of these outstanding contracts were as follows (in millions):
62

December 31, 2021 2020Notional balance of outstanding contracts:
British Pound/U.S. Dollar £ 13 £ 10 Euro/U.S. Dollar € 142 € 123 Euro/Czech Koruna € 16 € — Japanese Yen/U.S. Dollar ¥ — ¥ 354 Singapore Dollar/U.S. Dollar S$ 16 S$ 12 Mexican Peso/U.S. Dollar Mex$ 64 Mex$ 36 Polish Zloty/U.S. Dollar zł 103 zł —
Net fair value of liabilities of outstanding contracts $ — $ 3
Interest Rate Risk ManagementThe Company’s debt consists of borrowings under a term loan (“Term Loan A”), Revolving Credit Facility, and Receivables Financing Facilities, which bear interest at variable rates plus applicable margins. As a result, the Company is exposed to market risk associated with the variable interest rate payments on these borrowings. See Note 12, Long-Term Debt for further details related to these borrowings.
The Company manages its exposure to changes in interest rates by utilizing interest rate swaps to hedge this exposure and to achieve a desired proportion of fixed versus floating-rate debt, based on current and projected market conditions.
The Company has entered into long-term forward interest rate swap agreements with a total notional amount of $800 million to lock into a fixed LIBOR interest rate base for its debt facilities subject to monthly interest payments. Under the terms of the agreements, $800 million in variable-rate debt will be swapped for a fixed interest rate. The Company has made, and will continue to make, monthly net settlements on its interest rate swaps through August 2024, coinciding with the maturities of Term Loan A and the Revolving Credit Facility. These interest rate swaps are not designated as hedges and changes in fair value are recognized immediately as Interest expense, net on the Consolidated Statements of Operations.
Note 12 Long-Term Debt
The following table shows the carrying value of the Company’s debt (in millions):
December 31,2021 2020
Term Loan A $ 888 $ 917 2020 Term Loan — 100 Receivables Financing Facilities 108 235
Total debt $ 996 $ 1,252 Less: Debt issuance costs (3) (5) Less: Unamortized discounts (2) (2) Less: Current portion of debt (69) (364)
Total long-term debt $ 922 $ 881
As of December 31, 2021, the future maturities of debt are as follows (in millions):
2022 $ 69 2023 82 2024 845 Total future maturities of debt $ 996
All borrowings as of December 31, 2021 were denominated in U.S. Dollars.
The estimated fair value of the Company’s debt approximated $1.0 billion and $1.3 billion as of December 31, 2021 and 2020, respectively. These fair value amounts, developed based on inputs classified as Level 2 within the fair value hierarchy,
63

represent the estimated value at which the Company’s lenders could trade its debt within the financial markets and do not represent the settlement value of these liabilities to the Company. The fair value of debt will continue to vary each period based on a number of factors, including fluctuations in market interest rates as well as changes to the Company’s credit ratings.
Term Loan AThe principal on Term Loan A is due in quarterly installments, with the next quarterly installment due in March 2022 and the majority due upon the August 9, 2024 maturity date. The Company may make prepayments, in whole or in part, without premium or penalty, and would be required to prepay certain outstanding amounts in the event of certain circumstances or transactions. As of December 31, 2021, the Term Loan A interest rate was 1.35%. Interest payments are made monthly and are subject to variable rates plus an applicable margin.
2020 Term LoanIn September 2020, the Company entered into a new $200 million term loan (“2020 Term Loan”), with the proceeds used to partly fund the acquisition of Reflexis. The Company repaid $100 million of principal during the fourth quarter of 2020 and the remaining $100 million of principal in the first quarter of 2021.
Receivables Financing FacilitiesThe Company has two Receivables Financing Facilities with financial institutions that have a combined total borrowing limit of up to $280 million. As collateral, the Company pledges perfected first-priority security interests in its U.S. domestically originated accounts receivable. The Company has accounted for transactions under its Receivables Financing Facilities as secured borrowings. The Company’s first Receivables Financing Facility allows for borrowings of up to $180 million and matures on March 19, 2024. The Company’s second Receivable Financing Facility allows for borrowings of up to $100 million and matures on May 16, 2022.
###December 31, 2021###$643 million###two###December 31, 2021###$108 million had been borrowed, of which $13 million was classified as current. Borrowings under the Receivables Financing Facilities bear interest at a variable rate plus an applicable margin. As of December 31, 2021###0.99%###
Revolving Credit FacilityThe Company has a Revolving Credit Facility that is available for working capital and other general business purposes, including letters of credit. As of December 31, 2021###$7 million###$1 billion###$993 million. No borrowings were outstanding under the Revolving Credit Facility as of December 31, 2021 or December 31, 2020. Upon borrowing, interest payments are made monthly and are subject to variable rates plus an applicable margin. The Revolving Credit Facility matures on August 9, 2024.
In 2019, the Company entered into its second amendment to the Amended and Restated Credit Agreement (“Amendment No. 2”), which increased the Company’s borrowing under Term Loan A from $608 million to $1 billion and increased the Company’s borrowing capacity under the Revolving Credit Facility from $800 million to $1 billion. Additionally, a payment of $445 million was made to fully pay off a previously outstanding term loan.
The refinancing of the Company’s long-term credit facilities during 2019 resulted in non-cash accelerated amortization of debt discount and debt issuance costs of $4 million and one-time charges of $3 million, which included certain third party fees and the accelerated amortization of losses on terminated interest rate swaps released from AOCI. These items are included in Interest Expense, net on the Consolidated Statements of Operations. Additionally, issuance costs of $6 million incurred related to this debt refinancing were capitalized and are amortized over the remaining term of Term Loan A and the Revolving Credit Facility.
Each of the Company’s borrowing arrangements described above include terms and conditions that limit the incurrence of additional borrowings and require that certain financial ratios be maintained at designated levels. As of December 31, 2021, the Company was in compliance with all debt covenants.
The Company uses interest rate swaps to manage the interest rate risk associated with its debt. See Note 11, Derivative Instruments for further information. Note 13 Leases
The Company leases various manufacturing and repair facilities, distribution centers, research facilities, sales and administrative offices, equipment, and vehicles. All leases are classified as operating leases with remaining terms of up to 11 years, with certain leases containing renewal options and termination options.
64

The Company records ROU assets and lease liabilities on the Consolidated Balance Sheets associated with the fixed lease and non-lease payments of leases with terms greater than one year.
The following table presents activities associated with our leases (in millions):
December 31,2021 2020 2019
Fixed lease expenses $ 39 $ 35 $ 37 Variable lease expenses 37 34 29
Total lease expenses $ 76 $ 69 $ 66
Cash paid for leases $ 76 $ 69 $ 67
ROU assets obtained in exchange for lease obligations $ 32 $ 55 $ 42 Reductions of ROU assets and lease liabilities — (3) (16)
Net non-cash increases to ROU assets and lease liabilities $ 32 $ 52 $ 26
Variable lease expenses incurred were not included in the measurement of the Company’s ROU assets and lease liabilities. These expenses consisted primarily of distribution center service costs that were based on product distribution volumes, as well as non-fixed common area maintenance, real estate taxes, and other operating costs associated with various facility leases. Expenses related to short term leases were not significant.
Cash payments for leases are included within Net cash provided by operating activities on the Consolidated Statements of Cash Flows.
ROU assets obtained in exchange for lease obligations primarily include new lease arrangements entered into by the Company. ROU assets obtained in exchange for lease obligations also include contract modifications that extend lease terms and/or provide us additional rights, changes in assessments that render it reasonably certain that lease renewal options will be exercised based on facts and circumstances that arose during the period, as well as lease arrangements obtained through acquisitions.
Reductions of the Company’s ROU assets and lease liabilities generally relate to modifications to lease agreements that result in a reduction to future minimum lease payments, as well as changes in assessments that render it no longer reasonably certain that lease renewal options will be exercised based on facts and circumstances that arose during the period. The Company’s reduction of ROU assets and lease liabilities during 2021 and 2020 were not significant, whereas the 2019 reduction was primarily related to a modification to a distribution center lease agreement that resulted in a reduction to fixed future minimum lease payments.
The weighted average remaining term of the Company’s leases was approximately 6 years each as of December 31, 2021, 2020 and 2019. The weighted average discount rate used to measure the ROU assets and lease liabilities was approximately 5% as of December 31, 2021 and 2020, and 6% as of December 31, 2019.
65

Future minimum lease payments under non-cancellable leases as of December 31, 2021 were as follows (in millions):
2022 $ 40 2023 36 2024 30 2025 24 2026 18 Thereafter 27
Total future minimum lease payments $ 175 Less: Interest (21)
Present value of lease liabilities $ 154
Reported as of December 31, 2021:Current portion of lease liabilities $ 33 Long-term lease liabilities 121
Present value of lease liabilities $ 154
The current portion of lease liabilities is included within Accrued liabilities on the Consolidated Balance Sheets.
As of December 31, 2021, the Company had future fixed payments of approximately $40 million related to a new distribution center lease agreement that had not yet commenced. This new lease agreement is expected to commence in 2022 and has a 5 year term.
Revenues earned from lease arrangements under which the Company is a lessor during the years ended December 31, 2021, 2020 and 2019 were not significant.
Note 14 Accrued Liabilities, Commitments and Contingencies
Accrued LiabilitiesThe components of Accrued liabilities are as follows (in millions):
December 31,2021 2020
Accrued payroll and benefits $ 96 $ 87 Accrued incentive compensation 155 65 Accrued warranty 26 24 Customer reserves 51 56 Current portion of lease liabilities 33 30 Unremitted cash collections due to banks on factored accounts receivable 141 142 Forward contract liabilities — 37 Short-term interest rate swaps 15 17 Accrued freight and duty 45 21 Other accrued expenses 77 80 Accrued liabilities $ 639 $ 559
The following table is a summary of the Company’s accrued warranty obligations (in millions):
Year Ended December 31,Warranty Reserve 2021 2020 2019Balance at the beginning of the year $ 24 $ 21 $ 22 Warranty expense 33 30 25 Warranties fulfilled (31) (27) (26)
Balance at the end of the year $ 26 $ 24 $ 21
66

CommitmentsIn the fourth quarter of 2021, we entered into certain multi-year inventory and service-related purchase commitments which contain minimum purchase requirements and are non-cancellable. Long-term commitments under these contracts are as follows (in millions):
2022 $ 97 2023 109 2024 107 2025 23 2026 24 Thereafter —
Total $ 360
ContingenciesThe Company is subject to a variety of investigations, claims, suits, and other legal proceedings that arise from time to time in the ordinary course of business, including but not limited to, intellectual property, employment, tort, and breach of contract matters. The Company currently believes that the outcomes of such proceedings, individually and in the aggregate, will not have a material adverse impact on its business, cash flows, financial position, or results of operations. Any legal proceedings are subject to inherent uncertainties, and the Company’s view of these matters and their potential effects may change in the future.
In 2020, the Company received approval of its exclusion request of customs duties that had been paid on certain products under Section 301 of the U.S. Trade Act of 1974 from September 1, 2019 through September 1, 2020 and commenced a process to request recovery of previously assessed amounts. Recoveries are recognized when the Company has completed all regulatory filing requirements and determined that receipt of amounts is virtually certain. Recoveries totaling $12 million were recorded in the fourth quarter of 2020, of which $4 million related to our AIT segment and $8 million related to our EVM segment. Recoveries totaling $19 million were recorded during the year ended December 31, 2021, of which $10 million related to our AIT segment and $9 million related to our EVM segment. Both the initially incurred costs and related recoveries were included within Cost of sales for Tangible products on the Consolidated Statements of Operations. The Company believes that it has recovered substantially all of the import duties that it expects to receive on previously paid amounts. The final amounts and the timings of any additional recoveries remain uncertain and, therefore, the Company has not recorded any amounts related to potential future recoveries in its financial statements as of December 31, 2021.
Note 15 Share-Based Compensation
In May 2018, the Company’s stockholders approved the Zebra Technologies 2018 Long-Term Incentive Plan (“2018 Plan”). The 2018 Plan superseded and replaced the Zebra Technologies Corporation 2015 Long-Term Incentive Plan (“2015 Plan”) on the approval date, except that the 2015 Plan, as well as the Zebra Technologies Corporation 2011 Long-Term Incentive Plan that was previously superseded by the 2015 Plan, remain in effect with respect to outstanding stock appreciation rights that were granted under those plans until such awards have been exercised, forfeited, cancelled, expired or otherwise terminated in accordance with their terms. Awards available under the 2018 Plan include stock-settled awards, including stock-settled restricted stock units, stock-settled performance stock units, restricted stock awards, performance share awards, stock appreciation rights, incentive stock options, and non-qualified stock options. Awards available under the 2018 Plan also include cash-settled awards, including cash-settled stock appreciation rights, cash-settled restricted stock units, and cash-settled performance stock units. No awards remain available for future grants under the 2015 Plan or previous plans.
The Company uses treasury shares as its source for issuing shares under the share-based compensation programs. As of December 31, 2021, the Company had 3,148,831 shares of Class A Common stock remaining available to be issued under the 2018 Plan.
The compensation expense from the Company’s share-based compensation plans and associated income tax benefit, excluding the effects of excess tax benefits or shortfalls, were included in the Consolidated Statements of Operations as follows (in millions):
67

Year Ended December 31,Compensation costs and related income tax benefit 2021 2020 2019Cost of sales $ 8 $ 6 $ 4 Selling and marketing 26 16 17 Research and development 28 16 16 General and administration 31 21 23 Total compensation expense $ 93 $ 59 $ 60 Income tax benefit $ 14 $ 9 $ 9
As of December 31, 2021, total unearned compensation costs related to the Company’s share-based compensation plans was $105 million, which will be recognized over the weighted average remaining service period of approximately 1.4 years.
The majority of the Company’s share-based compensation awards are generally issued as part of its employee and non-employee director incentive program during the second quarter of each fiscal year. The Company also issues awards associated with business acquisitions or other off-cycle events.
Stock-Settled Restricted Stock Units (“stock-settled RSUs”) and Stock-Settled Performance Share Units (“stock-settled PSUs”)The Company began issuing stock-settled RSUs and stock-settled PSUs in the second quarter of 2021. Stock-settled RSUs and stock-settled PSUs each typically vest over a three-year service period, with stock-settled RSUs vesting ratably in three annual installments and stock-settled PSUs vesting at the end of the three-year period. Vesting for each participant is subject to restrictions, such as continuous employment, except in certain cases as set forth in each stock agreement. Upon vesting, stock-settled RSUs and stock-settled PSUs are converted into shares of Class A Common Stock that are released to participants.
Compensation cost for the Company’s stock-settled RSUs and stock-settled PSUs is expensed over each participant’s required service period. Compensation cost is calculated as the fair market value of the Company’s Class A Common Stock on the grant date multiplied by the number of units granted, net of estimated forfeitures. The fair value of PSUs also includes assumptions around achievement of certain Company-wide financial performance goals.
Restricted Stock Awards (“RSAs”) and Performance Share Awards (“PSAs”)Prior to 2021, the Company’s restricted stock grants consisted of time-vested RSAs and PSAs as part of the Company’s annual incentive program. These awards are considered participating securities. The outstanding RSAs and PSAs are included as part of the Company’s Class A Common Stock outstanding. The RSAs and PSAs vest at each vesting date, subject to restrictions such as continuous employment, except in certain cases as set forth in each stock agreement. Upon vesting, RSAs and PSAs are released to holders and are no longer subject to restrictions.
Compensation cost for the Company’s RSAs and PSAs is expensed over each participant’s required service period. Compensation cost is calculated as the fair market value of the Company’s Class A Common Stock on the grant date multiplied by the number of units granted, net of estimated forfeitures. The fair value of PSAs also includes assumptions around achievement of certain Company-wide financial performance goals. The total required service period is typically three years.
The Company also issues Class A Common Stock to non-employee directors. The number of shares granted to each non-employee director is determined by dividing the value of the annual grant by the price of a share of the Company’s Class A Common Stock. New directors in any fiscal year earn a prorated amount. During fiscal 2021, there were 2,877 shares granted to non-employee directors compared to 6,314 and 7,371 during fiscal 2020 and 2019, respectively. The shares vest immediately on the grant date.
A summary of the Company’s restricted and performance stock-settled awards for the years ended December 31, 2021, 2020 and 2019 is as follows:
68

Year Ended December 31, 2021RSUs PSUs RSAs PSAs
Units
Weighted-Average
Grant Date Fair
Value Units
Weighted-Average
Grant Date Fair
Value Shares
Weighted-Average
Grant Date Fair
Value Shares
Weighted-Average
Grant Date Fair
ValueOutstanding at beginning of year — $ — — $ — 318,565 $ 228.08 126,022 $ 199.77 Granted 134,419 518.39 38,393 482.42 6,005 486.02 — — Released (674) 489.16 — — (159,702) 212.33 (49,236) 160.11 Forfeited (3,736) 509.58 (702) 482.42 (10,546) 239.78 (2,754) 236.18 Outstanding at end of year 130,009 $ 518.80 37,691 $ 482.42 154,322 $ 253.54 74,032 $ 225.34
Year Ended December 31, 2020RSAs PSAs
Shares
Weighted-Average Grant Date Fair
Value Shares
Weighted-Average Grant Date Fair
ValueOutstanding at beginning of year 434,641 $ 151.52 170,749 $ 144.47 Granted 178,150 265.06 98,820 239.79 Released (275,318) 133.43 (131,943) 160.18 Forfeited (18,908) 199.04 (11,604) 194.23 Outstanding at end of year 318,565 $ 228.08 126,022 $ 199.77
Year Ended December 31, 2019RSAs PSAs
Shares
Weighted-Average Grant Date Fair
Value Shares
Weighted-Average Grant Date Fair
ValueOutstanding at beginning of year 657,724 $ 93.45 259,727 $ 86.41 Granted 170,502 204.26 150,224 206.04 Released (372,075) 73.71 (231,513) 120.86 Forfeited (21,510) 141.29 (7,689) 102.42 Outstanding at end of year 434,641 $ 151.52 170,749 $ 144.47
Stock Appreciation Rights (“SARs”)SARs were previously granted primarily as part of the Company’s annual share-based compensation incentive program. Beginning in 2021, the Company no longer included SARs in its annual share based compensation award issuances and did not issue any SARs during the year ended December 31, 2021. The total fair value of SARs granted during the years ended December 31, 2020 and 2019 was $6 million and $5 million, respectively, which were estimated on the respective dates of grant using a binomial model.
69

A summary of the Company’s SARs is as follows:
2021 2020 2019
SARs SARs
Weighted-Average
Grant Date Exercise
Price SARs
Weighted-Average
Grant Date Exercise
Price SARs
Weighted-Average
Grant Date Exercise
PriceOutstanding at beginning of year 638,124 $ 113.98 896,923 $ 89.05 1,261,185 $ 75.71 Granted — — 69,742 253.62 70,141 205.12 Exercised (159,035) 89.87 (295,770) 67.96 (395,015) 66.82 Forfeited (4,938) 213.80 (31,193) 149.09 (39,388) 92.72 Expired — — (1,578) 166.52 — — Outstanding at end of year 474,151 $ 121.05 638,124 $ 113.98 896,923 $ 89.05 Exercisable at end of year 383,273 $ 97.29 417,856 $ 81.88 489,357 $ 70.37
The following table summarizes information about SARs outstanding as of December 31, 2021:
Outstanding ExercisableAggregate intrinsic value (in millions) $ 225 $ 191 Weighted-average remaining contractual life (in years) 3.6 3.3
The intrinsic value of SARs exercised during fiscal 2021, 2020 and 2019 was $69 million, $60 million and $58 million, respectively. The total fair value of SARs vested during fiscal 2021, 2020 and 2019 was $5 million, $8 million and $9 million, respectively.
Reflexis Replacement OptionsIn connection with the Company’s September 2020 acquisition of Reflexis, the Company assumed the 2016 Stock Incentive Plan of Reflexis Systems, Inc. (the “Reflexis Plan”) and replaced certain unvested options under the Reflexis Plan with Zebra incentive stock options (“Reflexis Replacement Options”). Upon exercise of Reflexis Replacement Options, the Company receives cash proceeds equal to the exercise price and issues whole shares of Class A Common Stock to participants. The total grant-date fair value of options granted during the year ended December 31, 2020 was $9 million, which was estimated using a Black-Scholes valuation model.
A summary of the Reflexis Replacement Options outstanding is as follows: 2021 2020
Reflexis Replacement Options Options
Weighted-Average
Exercise Price Options
Weighted-Average
Exercise PriceOutstanding at beginning of year 34,424 $ 58.09 — $ — Granted — — 38,228 57.82 Exercised (9,318) 59.68 (3,408) 55.79 Forfeited (1,529) 63.01 (396) 52.14 Outstanding at end of year 23,577 $ 57.06 34,424 $ 58.09 Exercisable at end of year 18,232 $ 54.50 6,716 $ 56.77
The following table summarizes information related to the Reflexis Replacement Options outstanding as of December 31, 2021:
Outstanding ExercisableAggregate intrinsic value (in millions) $ 13 $ 10 Weighted-average remaining contractual life (in years) 6.3 5.9
The intrinsic value of Reflexis Replacement Options exercised during fiscal 2021 and 2020 was $4 million and $1 million, respectively. The total fair value of Reflexis Replacement Options vested during fiscal 2021 and 2020 was $5 million and $2 million, respectively.
70
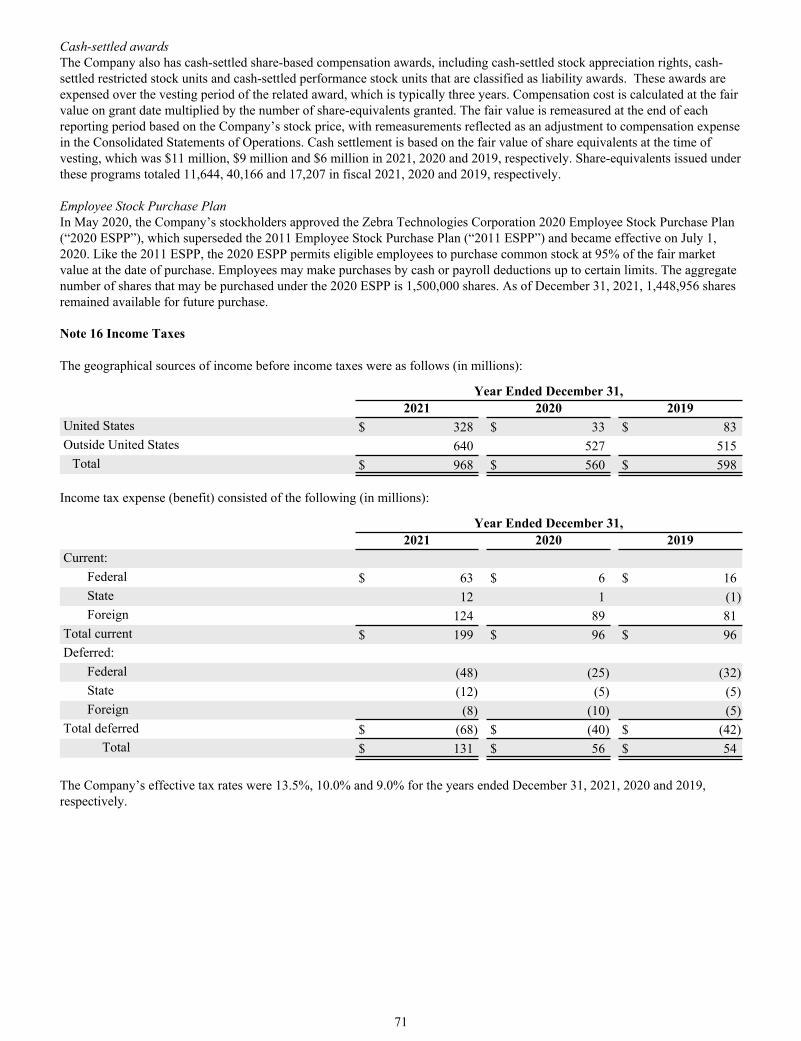
Cash-settled awardsThe Company also has cash-settled share-based compensation awards, including cash-settled stock appreciation rights, cash-settled restricted stock units and cash-settled performance stock units that are classified as liability awards. These awards are expensed over the vesting period of the related award, which is typically three years. Compensation cost is calculated at the fair value on grant date multiplied by the number of share-equivalents granted. The fair value is remeasured at the end of each reporting period based on the Company’s stock price, with remeasurements reflected as an adjustment to compensation expense in the Consolidated Statements of Operations. Cash settlement is based on the fair value of share equivalents at the time of vesting, which was $11 million, $9 million and $6 million in 2021, 2020 and 2019, respectively. Share-equivalents issued under these programs totaled 11,644, 40,166 and 17,207 in fiscal 2021, 2020 and 2019, respectively.
Employee Stock Purchase PlanIn May 2020, the Company’s stockholders approved the Zebra Technologies Corporation 2020 Employee Stock Purchase Plan (“2020 ESPP”), which superseded the 2011 Employee Stock Purchase Plan (“2011 ESPP”) and became effective on July 1, 2020. Like the 2011 ESPP, the 2020 ESPP permits eligible employees to purchase common stock at 95% of the fair market value at the date of purchase. Employees may make purchases by cash or payroll deductions up to certain limits. The aggregate number of shares that may be purchased under the 2020 ESPP is 1,500,000 shares. As of December 31, 2021, 1,448,956 shares remained available for future purchase.
Note 16 Income Taxes
The geographical sources of income before income taxes were as follows (in millions):
Year Ended December 31, 2021 2020 2019United States $ 328 $ 33 $ 83 Outside United States 640 527 515
Total $ 968 $ 560 $ 598
Income tax expense (benefit) consisted of the following (in millions):
Year Ended December 31, 2021 2020 2019Current:
Federal $ 63 $ 6 $ 16 State 12 1 (1) Foreign 124 89 81
Total current $ 199 $ 96 $ 96 Deferred:
Federal (48) (25) (32) State (12) (5) (5) Foreign (8) (10) (5)
Total deferred $ (68) $ (40) $ (42) Total $ 131 $ 56 $ 54
The Company’s effective tax rates were 13.5%, 10.0% and 9.0% for the years ended December 31, 2021, 2020 and 2019, respectively.
71

A reconciliation of the U.S. federal statutory income tax rate to our actual income tax rate is provided below:
Year Ended December 31,2021 2020 2019
Provision computed at statutory rate 21.0 % 21.0 % 21.0 %Remeasurement of deferred taxes (1.0) (0.6) 0.2 Change in valuation allowance (0.1) 0.1 (1.7) U.S. impact of Enterprise acquisition 0.3 0.3 1.0 Change in contingent income tax reserves (0.2) (0.4) (3.3) Foreign earnings subject to U.S. taxation (2.0) 1.5 1.8 Foreign rate differential (1.7) (5.5) (0.7) State income tax, net of federal tax benefit 0.3 0.4 (0.2) Tax credits (2.0) (2.9) (2.3) Equity compensation deductions (2.4) (3.2) (4.0) Return to provision and other true ups (0.9) (2.5) (2.0) Permanent differences and other 2.2 1.8 (0.8) Provision for income taxes 13.5 % 10.0 % 9.0 %
For the years ended December 31, 2021 and 2020, the Company’s effective tax rate was lower than the federal statutory rate of 21% primarily due to lower tax rates in foreign jurisdictions, the generation of tax credits and the favorable impacts of share-based compensation benefits.
For the year ended December 31, 2019, the Company’s effective tax rate was lower than the federal statutory rate of 21% primarily due to the favorable impacts of share-based compensation benefits, lapses of the statute of limitations on uncertain tax positions, and the generation of tax credits. These benefits were partially offset by the impacts of foreign earnings and deemed royalties taxed in the U.S.
The Company evaluated the provisions of the American Rescue Plan Act, signed into law on March 11, 2021; the Consolidated Appropriations Act of 2021, signed into law on December 27, 2020; and the Coronavirus Aid, Relief and Economic Security Act, signed into law on March 27, 2020. The provisions of these laws did not have a significant impact to our effective tax rate in either the current or prior year. Management continues to monitor guidance regarding these laws and developments related to other coronavirus tax relief throughout the world for potential impacts.
The Company earns a significant amount of its operating income outside of the U.S that is taxed at rates different than the U.S. federal statutory rate. The Company’s principal foreign jurisdictions that provide sources of operating income are the U.K. and Singapore. During the second quarter of 2021, the U.K. government enacted a change in law that increases the corporate tax rate from 19% to 25%, with such rate change becoming effective in April 2023. Upon enactment, we remeasured our deferred tax assets to reflect the 25% statutory rate to the extent such tax benefits are expected to be realized in the future at the amended statutory rate. In addition, the Company has received an incentivized tax rate from the Singapore Economic Development Board, which reduces the income tax rate in that jurisdiction effective for calendar years 2019 to 2023. The Company has committed to making additional investments in Singapore over the period 2019 to 2022. However, should the Company not make these investments in accordance with the agreement, any incentive benefit would have to be repaid to the Singapore tax authorities.
72

Tax effects of temporary differences that resulted in deferred tax assets and liabilities are as follows (in millions):
December 31, 2021 2020Deferred tax assets:
Capitalized research expenditures $ 14 $ 18 Deferred revenue 85 38 Tax credits 37 36 Net operating loss carryforwards 438 406 Other accruals 39 32 Inventory items 15 17 Sales return/rebate reserve 61 46 Share-based compensation expense 12 9 Unrealized gains and losses on securities and investments — 19 Valuation allowance (422) (413)
Total deferred tax assets $ 279 $ 208 Deferred tax liabilities:
Depreciation and amortization 84 67 Unrealized gains and losses on securities and investments 5 — Undistributed earnings 4 2
Total deferred tax liabilities $ 93 $ 69 Net deferred tax assets $ 186 $ 139
The Company’s valuation allowance primarily relates to Luxembourg reorganization activities in 2019, which had resulted in the realization of deferred tax liabilities and a corresponding increase in valuation allowances related to depreciation and amortization. The Company’s valuation allowance also consists of certain net operating loss (“NOL”) and credit carryforwards for which the Company believes it is more likely than not that a tax benefit will not be realized. With respect to all other deferred tax assets, the Company believes it is more likely than not that the results of future operations will generate sufficient taxable income to realize a tax benefit. There were no significant adjustments to the Company’s valuation allowance during the year ended December 31, 2021.
As of December 31, 2021, the Company had approximately $438 million (tax effected) of “NOLs” and $37 million of credit carryforwards. Approximately $186 million of NOLs will expire beginning in 2022 through 2040, and $30 million of credits will expire beginning in 2022 through 2037, with the remaining amounts of NOLs and credit carryforwards having no expiration dates.
The Company is subject to the GILTI, BEAT and FDII provisions, for which we recorded an income tax benefit of $20 million for the year ended December 31, 2021, and an income tax expense of $8 million and $12 million for the years ended December 31, 2020 and 2019, respectively. These impacts are included in the calculation of the Company’s effective tax rate.
The Company is not permanently reinvested with respect to its U.S. directly-owned foreign subsidiaries. The Company is subject to U.S. income tax on substantially all foreign earnings under GILTI, while any remaining foreign earnings are eligible for a dividends received deduction. As a result, future repatriation of earnings will not be subject to additional U.S. federal income tax but may be subject to currency translation gains or losses. Where required, the Company has recorded a deferred tax liability for foreign withholding taxes on current earnings. Additionally, gains and losses on any future taxable dispositions of U.S.-owned foreign affiliates continue to be subject to U.S. income tax.
The Company has not recognized deferred tax liabilities in the U.S. with respect to its outside basis differences in its directly-owned foreign affiliates. It is not practicable to determine the amount of unrecognized deferred tax liabilities on these indefinitely reinvested earnings.
73

Unrecognized tax benefitsA reconciliation of the beginning and ending amount of unrecognized tax benefits is as follows (in millions):
Year ended December 31,2021 2020
Balance at beginning of year $ 8 $ 10 Settlements for tax positions — (1) Lapse of statutes (1) (1) Balance at end of year $ 7 $ 8
As of December 31, 2021 and December 31, 2020, there were $7 million and $8 million, respectively, of unrecognized tax benefits that, if recognized, would affect the annual effective tax rate. The Company is currently undergoing U.S. federal income tax audits for tax years 2017 and 2018. Additionally, fiscal years 2009 through 2021 remain open to examination by multiple foreign and U.S. state taxing jurisdictions.
As of December 31, 2021, no significant uncertain tax positions are expected to be settled within the next twelve months. Due to uncertainties in any tax audit or litigation outcome, the Company’s estimates of the ultimate settlements of uncertain tax positions may change and the actual tax benefits may differ significantly from estimates.
The Company recognized no net tax expense associated with interest and penalties related to income tax matters during the year ended December 31, 2021. The Company recognized a net tax benefit of $2 million and a net tax expense of $6 million for interest and penalties during the years ended December 31, 2020 and 2019, respectively. The net benefit or expense associated with interest and penalties was reflected within Income tax expense on the Consolidated Statements of Operations. The Company has included $6 million of estimated interest and penalty obligations within Other long-term liabilities on the Consolidated Balance Sheets each as of December 31, 2021 and 2020.
Note 17 Earnings Per Share
Basic net earnings per share is calculated by dividing net income by the weighted average number of common shares outstanding for the period. Diluted earnings per share is computed by dividing net income by the weighted average number of shares assuming dilution. Dilutive common shares outstanding is computed using the Treasury Stock method and, in periods of income, reflects the additional shares that would be outstanding if dilutive share-based compensation awards were converted into common shares during the period.
Earnings per share (in millions, except share data):
Year Ended December 31, 2021 2020 2019Basic:Net income $ 837 $ 504 $ 544 Weighted-average shares outstanding 53,446,399 53,441,375 53,991,249 Basic earnings per share $ 15.66 $ 9.43 $ 10.08
Diluted:Net income $ 837 $ 504 $ 544 Weighted-average shares outstanding 53,446,399 53,441,375 53,991,249 Dilutive shares 456,031 471,870 603,168 Diluted weighted-average shares outstanding 53,902,430 53,913,245 54,594,417 Diluted earnings per share $ 15.52 $ 9.35 $ 9.97
Anti-dilutive share-based compensation awards are excluded from diluted earnings per share calculations. There were 8,000, 46,128, and 47,240 shares that were anti-dilutive for the years ended December 31, 2021, 2020, and 2019, respectively.
Note 18 Accumulated Other Comprehensive Income (Loss)
Stockholders’ equity includes certain items classified as AOCI, including:
74

• Unrealized gain (loss) on anticipated sales hedging transactions relates to derivative instruments used to hedge the exposure related to currency exchange rates for forecasted Euro sales. These hedges are designated as cash flow hedges, and the Company defers income statement recognition of gains and losses until the hedged transaction occurs See Note 11, Derivative Instruments for more details.
• Unrealized gain (loss) on forward interest rate swap hedging transactions relates to certain interest rate swaps that the Company previously entered into as part of its strategy to mitigate interest rate risk exposure associated with its variable rate debt. These particular interest rate swaps, which were designated as cash flow hedges, were terminated prior to 2019, with remaining losses being reclassified into Interest expense, net on the Consolidated Statements of Operations in 2019.
• Foreign currency translation adjustments relate to the Company’s non-U.S. subsidiary companies that have designated a functional currency other than the U.S. Dollar. The Company is required to translate the subsidiary functional currency financial statements to U.S. Dollars using a combination of historical, period end, and average foreign exchange rates. This combination of rates creates the foreign currency translation adjustment component of AOCI.
The changes in each component of AOCI during the three years ended December 31, 2021, 2020 and 2019 were as follows (in millions):
Unrealized gain (loss) on sales hedging
Unrealized gain (loss) on
forward interest rate
swaps
Foreign currency
translation adjustments Total
Balance at December 31, 2018 $ 12 $ — $ (47) $ (35) Other comprehensive income before reclassifications 30 — 1 31 Amounts reclassified from AOCI(1) (42) 2 — (40) Tax effect 2 (2) — —
Other comprehensive income (loss), net of tax (10) — 1 (9) Balance at December 31, 2019 2 — (46) (44)
Other comprehensive (loss) income before reclassifications (43) — 5 (38) Amounts reclassified from AOCI(1) 6 — — 6 Tax effect 7 — — 7
Other comprehensive income (loss), net of tax (30) — 5 (25) Balance at December 31, 2020 (28) — (41) (69)
Other comprehensive income (loss) before reclassifications 55 — (6) 49 Amounts reclassified from AOCI(1) 2 — — 2 Tax effect (11) — — (11)
Other comprehensive income (loss), net of tax 46 — (6) 40 Balance at December 31, 2021 $ 18 $ — $ (47) $ (29)
(1) See Note 11, Derivative Instruments regarding timing of reclassifications to operating results.
Note 19 Accounts Receivable Factoring
The Company has Receivables Factoring arrangements, pursuant to which certain receivables are sold to banks without recourse in exchange for cash. Transactions under the Receivables Factoring arrangements are accounted for as sales under ASC 860, Transfers and Servicing of Financial Assets, with the sold receivables removed from the Company’s balance sheet. Under these Receivables Factoring arrangements, the Company does not maintain any beneficial interest in the receivables sold. The banks’ purchase of eligible receivables is subject to a maximum amount of uncollected receivables. The Company services the receivables on behalf of the banks, but otherwise maintains no significant continuing involvement with respect to the receivables. Sale proceeds that are representative of the fair value of factored receivables, less a factoring fee, are reflected in Net cash provided by operating activities on the Consolidated Statements of Cash Flows, while sale proceeds in excess of the fair value of factored receivables are reflected in Net cash used in financing activities on the Consolidated Statements of Cash Flows.
75

During the second quarter of 2021, one of the Company’s Receivables Factoring arrangements that was no longer actively utilized expired. The Company currently has two remaining active Receivables Factoring arrangements. One arrangement allows for the factoring of up to $25 million of uncollected receivables originated from the EMEA region. The second arrangement allows for the factoring of up to €150 million of uncollected receivables originated from the EMEA and Asia-Pacific regions. With respect to the second arrangement, the Company is required to maintain a portion of sales proceeds as deposits in a restricted cash account that is released to the Company as it satisfies its obligations as servicer of sold receivables, which totaled $12 million and $24 million as of December 31, 2021 and December 31, 2020, respectively, and is classified within Prepaid expenses and other current assets on the Consolidated Balance Sheets.
During the years ended December 31, 2021, 2020 and 2019, the Company received cash proceeds of $1,504 million, $1,291 million and $409 million, respectively, from the sales of accounts receivables under its factoring arrangements. As of December 31, 2021 and 2020, there were a total of $24 million and $70 million, respectively, of uncollected receivables that had been sold and removed from the Company’s Consolidated Balance Sheets.
As servicer of sold receivables, the Company had $141 million and $142 million of obligations that were not yet remitted to banks as of December 31, 2021 and 2020, respectively. These obligations are included within Accrued liabilities on the Consolidated Balance Sheets, with changes in such obligations reflected within Net cash used in financing activities on the Consolidated Statements of Cash Flows.
Fees incurred in connection with these arrangements were not significant.
Note 20 Segment Information & Geographic Data
Segment resultsThe Company’s operations consist of two reportable segments: Asset Intelligence & Tracking (“AIT”) and Enterprise Visibility & Mobility (“EVM”). The reportable segments have been identified based on the financial data utilized by the Company’s Chief Executive Officer (the chief operating decision maker or “CODM”) to assess segment performance and allocate resources among the Company’s segments. The CODM reviews adjusted operating income to assess segment profitability. To the extent applicable, segment operating income excludes business acquisition purchase accounting adjustments, amortization of intangible assets, acquisition and integration costs, impairment of goodwill and other intangibles, exit and restructuring costs, and product sourcing diversification costs. Segment assets are not reviewed by the Company’s CODM and therefore are not disclosed below.
Effective January 1, 2021, retail solutions product line, which provides a range of physical inventory management solutions with application in the retail industry, including solutions for full store physical inventories, cycle counts and analytics, moved from our AIT segment into our EVM segment contemporaneous with a change in our organizational structure and management of the business. Prior period results have been revised to conform to the current segment presentation. This change did not have an impact on the Consolidated Financial Statements.
Financial information by segment is presented as follows (in millions):
Year Ended December 31, 2021 2020 2019Net sales:
AIT $ 1,687 $ 1,392 $ 1,447 EVM 3,946 3,063 3,038 Total segment Net sales 5,633 4,455 4,485 Corporate, eliminations(1) (6) (7) —
Total Net sales $ 5,627 $ 4,448 $ 4,485 Operating income:
AIT(2) $ 374 $ 318 $ 351 EVM(2) 758 470 487 Total segment operating income 1,132 788 838 Corporate, eliminations(1) (153) (137) (146)
Total Operating income $ 979 $ 651 $ 692
76

(1) To the extent applicable, amounts included in Corporate, eliminations consist of business acquisition purchase accounting adjustments, amortization of intangible assets, acquisition and integration costs, impairment of goodwill and other intangibles, exit and restructuring costs, and product sourcing diversification costs.
(2) AIT and EVM segment operating income includes depreciation and share-based compensation expense. The amounts of depreciation and share-based compensation expense attributable to AIT and EVM are proportionate to each segment’s Net sales.
Sales to significant customersThe Company has three customers, who are distributors of the Company’s products and solutions, that individually accounted for more than 10% of total Company Net sales during the years ended December 31, 2021, 2020 and 2019. The approximate percentage of our segment and Company total Net sales to these customers were as follows:
Year Ended December 31, 2021 2020 2019
AIT EVM Total AIT EVM Total AIT EVM TotalCustomer A 7.3 % 15.0 % 22.3 % 6.5 % 14.2 % 20.7 % 6.1 % 10.5 % 16.6 %Customer B 5.1 % 8.5 % 13.6 % 4.9 % 9.0 % 13.9 % 4.7 % 9.0 % 13.7 %Customer C 3.1 % 9.5 % 12.6 % 4.8 % 12.9 % 17.7 % 5.3 % 13.0 % 18.3 %
These customers accounted for 22.7%, 13.4%, and 14.8%, respectively, of accounts receivable as of December 31, 2021, and 20.4%, 6.7% and 13.6%, respectively, of accounts receivable as of December 31, 2020. No other customer accounted for more than 10% of total Net sales during the years ended December 31, 2021, 2020 or 2019, or more than 10% of outstanding accounts receivables as of December 31, 2021 or 2020.
Geographic dataInformation regarding the Company’s operations by geographic area is contained in the following tables. Net sales amounts are attributed to geographic area based on customer location. We manage our business based on regions rather than by individual countries.
Net sales by region were as follows (in millions): Year Ended December 31, 2021 2020 2019North America $ 2,819 $ 2,319 $ 2,261 EMEA 1,976 1,495 1,462 Asia-Pacific 543 439 518 Latin America 289 195 244
Total Net sales $ 5,627 $ 4,448 $ 4,485
The United States and Germany were the only countries that accounted for more than 10% of the Company’s net sales in 2021, 2020, and 2019. Net sales during these years were as follows (in millions):
Year Ended December 31,
2021 2020 2019United States $ 2,784 $ 2,291 $ 2,243 Germany 901 595 523 Other 1,942 1,562 1,719
Total Net sales $ 5,627 $ 4,448 $ 4,485
77

Geographic data for long-lived assets is as follows (in millions): Year Ended December 31, 2021 2020 2019North America $ 290 $ 289 $ 280 EMEA 68 68 39 Asia-Pacific 39 45 40 Latin America 6 7 7
Total long-lived assets $ 403 $ 409 $ 366
Long-lived assets are defined by the Company as property, plant and equipment and ROU assets. Primarily all of the Company’s long-lived assets in the North America region are located in the United States.
78

Item 9. Changes in and Disagreements with Accountants on Accounting and Financial Disclosure
None. Item 9A. Controls and Procedures
Evaluation of Disclosure Controls and Procedures We conducted an evaluation of the effectiveness of the design and operation of our disclosure controls and procedures (as defined in Rules 13a-15(e) and 15d-15(e) under the Securities Exchange Act of 1934 (the “Exchange Act”)) as of the end of the period covered by this Form 10-K. The evaluation was conducted under the supervision of our Disclosure Committee, and with the participation of management, including our Chief Executive Officer and Chief Financial Officer. Based on that evaluation, our Chief Executive Officer and Chief Financial Officer have concluded that our disclosure controls and procedures were effective to provide reasonable assurance that (i) the information required to be disclosed by us in this Form 10-K was recorded, processed, summarized and reported within the time periods specified in the SEC’s rules and forms, and (ii) information required to be disclosed by us in our reports that we file or furnish under the Exchange Act is accumulated and communicated to our management, including our principal executive and principal financial officers, or persons performing similar functions, as appropriate to allow timely decisions regarding required disclosure.
Management’s Report on Internal Control over Financial ReportingOur management is responsible for establishing and maintaining adequate internal control over financial reporting as defined in Rules 13a-15(f) and 15d-15(f) under the Exchange Act to provide reasonable assurance regarding the reliability of our financial reporting and the preparation of financial statements for external purposes in accordance with generally accepted accounting principles. Our management assessed the effectiveness of our internal control over financial reporting as of December 31, 2021. In making this assessment, our management used the criteria set forth by the Committee of Sponsoring Organizations of the Treadway Commission in Internal Control-Integrated Framework as released in 2013. Based on this assessment and those criteria, our management believes that, as of December 31, 2021, our internal control over financial reporting is effective.
Our independent registered public accounting firm, Ernst & Young LLP, has issued an attestation report on Zebra’s internal control over financial reporting. Ernst & Young LLP’s report is included in the latter portion of this Item 9A.
Changes in Internal Control over Financial Reporting There were no changes in the Company’s internal control over financial reporting during the fourth quarter of 2021, which were identified in connection with management’s evaluation required by paragraph (d) of Rules 13a-15 and 15d-15 under the Exchange Act, that have materially affected, or are reasonably likely to materially affect, the Company’s internal control over financial reporting. Inherent Limitations on the Effectiveness of ControlsOur management, including our Chief Executive Officer and Chief Financial Officer, does not expect that our disclosure controls and procedures or our internal controls will prevent or detect all errors and all fraud. A control system, no matter how well conceived and operated, can provide only reasonable, not absolute, assurance that the objectives of the control system are met. Further, the design of a control system must reflect the fact that there are resource constraints, and the benefits of controls must be considered relative to their costs. Because of the inherent limitations in all control systems, no evaluation of controls can provide absolute assurance that misstatements due to error or fraud will not occur or that all control issues and instances of fraud, if any, within Zebra have been prevented or detected. These inherent limitations include the realities that judgments in decision-making can be faulty and that breakdowns can occur because of simple error or mistake. Controls can also be circumvented by the individual acts of some persons, by collusion of two or more people, or by management override of the controls. The design of any system of controls is based in part on certain assumptions about the likelihood of future events, and there can be no assurance that any design will succeed in achieving its stated goals under all potential future conditions. Projections of any evaluation of controls effectiveness to future periods are subject to risks. Over time, controls may become inadequate because of changes in conditions or deterioration in the degree of compliance with policies or procedures.
79

Report of Independent Registered Public Accounting Firm
To the Shareholders and the Board of Directors of Zebra Technologies Corporation
Opinion on Internal Control over Financial Reporting
We have audited Zebra Technologies Corporation and subsidiaries internal control over financial reporting as of December 31, 2021, based on criteria established in Internal Control-Integrated Framework issued by the Committee of Sponsoring Organizations of the Treadway Commission (2013 framework) (the COSO criteria). In our opinion, Zebra Technologies Corporation (the Company) maintained, in all material respects, effective internal control over financial reporting as of December 31, 2021, based on the COSO criteria.
We also have audited, in accordance with the standards of the Public Company Accounting Oversight Board (United States) (PCAOB), the consolidated balance sheets of the Zebra Technologies Corporation as of December 31, 2021 and 2020, the related consolidated statements of operations, comprehensive income, stockholders’ equity, and cash flows, for each of the three years in the period ended December 31, 2021, and the related notes, and our report dated February 10, 2022 expressed an unqualified opinion thereon.
Basis for Opinion
The Company’s management is responsible for maintaining effective internal control over financial reporting and for its assessment of the effectiveness of internal control over financial reporting included in the accompanying Management’s Report on Internal Control over Financial Reporting. Our responsibility is to express an opinion on the Company’s internal control over financial reporting based on our audit. We are a public accounting firm registered with the PCAOB and are required to be independent with respect to the Company in accordance with the U.S. federal securities laws and the applicable rules and regulations of the Securities and Exchange Commission and the PCAOB.
We conducted our audit in accordance with the standards of the PCAOB. Those standards require that we plan and perform the audit to obtain reasonable assurance about whether effective internal control over financial reporting was maintained in all material respects.
Our audit included obtaining an understanding of internal control over financial reporting, assessing the risk that a material weakness exists, testing and evaluating the design and operating effectiveness of internal control based on the assessed risk, and performing such other procedures as we considered necessary in the circumstances. We believe that our audit provides a reasonable basis for our opinion.
Definition and Limitations of Internal Control Over Financial Reporting
A company’s internal control over financial reporting is a process designed to provide reasonable assurance regarding the reliability of financial reporting and the preparation of financial statements for external purposes in accordance with generally accepted accounting principles. A company’s internal control over financial reporting includes those policies and procedures that (1) pertain to the maintenance of records that, in reasonable detail, accurately and fairly reflect the transactions and dispositions of the assets of the company; (2) provide reasonable assurance that transactions are recorded as necessary to permit preparation of financial statements in accordance with generally accepted accounting principles, and that receipts and expenditures of the company are being made only in accordance with authorizations of management and directors of the company; and (3) provide reasonable assurance regarding prevention or timely detection of unauthorized acquisition, use, or disposition of the company’s assets that could have a material effect on the financial statements.
Because of its inherent limitations, internal control over financial reporting may not prevent or detect misstatements. Also, projections of any evaluation of effectiveness to future periods are subject to the risk that controls may become inadequate because of changes in conditions, or that the degree of compliance with the policies or procedures may deteriorate.
/s/Ernst & Young LLP
Chicago, Illinois
February 10, 2022
80

Item 9B. Other Information
Not applicable.
Item 9C. Disclosure Regarding Foreign Jurisdictions that Prevent Inspections
Not applicable.
81

PART III Item 10. Directors, Executive Officers and Corporate GovernanceWe have adopted a Code of Ethics for Senior Financial Officers (“Code of Ethics”) that applies to Zebra’s Chief Executive Officer, Chief Financial Officer and Chief Accounting Officer. The Code of Ethics is posted on the Investor Relations – Governance Documents page of Zebra’s Internet web site, www.zebra.com under “Investors-Governance-Governance Documents”, and is available for download. Any waiver from the Code of Ethics and any amendment to the Code of Ethics will be disclosed on such page of Zebra’s web site.
All other information in response to this item is incorporated by reference from the Proxy Statement sections entitled “Corporate Governance,” “Election of Directors,” “Committees of the Board,” “Executive Officers,” and “Delinquent Section 16(a) Reports.” Item 11. Executive CompensationThe information in response to this item is incorporated by reference from the Proxy Statement sections entitled “Compensation Discussion and Analysis,” “Executive Compensation,” “Director Compensation,” “Executive Compensation – Compensation Committee Interlocks and Insider Participation” and “Compensation Committee Report.” Item 12. Security Ownership of Certain Beneficial Owners and Management and Related
Stockholder MattersThe information in response to this item is incorporated by reference from the Proxy Statement sections entitled “Ownership of our Common Stock” and “Executive Compensation – Equity Compensation Plan Information.” Item 13. Certain Relationships and Related Transactions, and Director IndependenceThe information in response to this item is incorporated by reference from the Proxy Statement sections entitled “Corporate Governance – Related Party Transactions,” “Corporate Governance – Director Independence,” “Election of Directors,” and “Committees of the Board.” Item 14. Principal Accounting Fees and ServicesThe information in response to this item is incorporated by reference from the Proxy Statement section entitled “Fees of Independent Auditors.”
82

PART IV
Item 15. Exhibits and Financial Statement Schedules
Index to Consolidated Financial Statements
PAGEReport of Independent Registered Public Accounting Firm (PCAOB ID: 42) 40Consolidated Balance Sheets as of December 31, 2021 and 2020 42Consolidated Statements of Operations for the years ended December 31, 2021, 2020, and 2019 43Consolidated Statements of Comprehensive Income for the years ended December 31, 2021, 2020, and 2019 44Consolidated Statements of Stockholders’ Equity for the years ended December 31, 2021, 2020, and 2019 45Consolidated Statements of Cash Flows for the years ended December 31, 2021, 2020, and 2019 46Notes to Consolidated Financial Statements 47
Index to Financial Statement Schedules
Schedules are omitted because the information is not required or because the information required is included in theNotes to Consolidated Financial Statements.
Index to Exhibits
Incorporated by Reference
Exhibit Number Exhibit Description Form
Exhibit Number
Filing Date or Period End Date
Filed or Furnished Within
3.1(i) Restated Certificate of Incorporation of the Company. 8-K 3.1(i) August 6, 20123.1(ii) Amended and Restated By-laws of Zebra Technologies
Corporation, as amended as of August 6, 20218-K 3.1 August 10, 2021
4.1 Specimen stock certificate representing Class A Common Stock.
10-K 4.1 December 31, 2017
4.2 Description of Securities Registered Under Section 12 of the Securities Exchange Act
10-K 4.2 December 31, 2019
10.1 Employee Agreement between Nathan Winters and the Company Dated January 11, 2021. +
10-K 10.1 December 31, 2020
10.2 Form of indemnification agreement between Zebra Technologies Corporation and each director and executive officer.
10-K 10.6 December 31, 2016
10.3 2011 Long-Term Incentive Plan (Amended and Restated as of May 15, 2014). +
10-Q 10.1 June 28, 2014
10.4 2015 Long-Term Incentive Plan. + 10-K 10.11 December 31, 2017
10.5 2018 Long-Term Incentive Plan. + S-8 4.1 June 1, 201810.6 2005 Executive Deferred Compensation Plan, as amended and
restated as of January 1, 2022. + X
10.7 Amended and Restated Employment Agreement between Zebra Technologies Corporation and Anders Gustafsson dated as of May 6, 2010. +
10-Q 10.10 April 3, 2010
10.8 Letter Agreement between Zebra Technologies Corporation and Anders Gustafsson dated as of May 6, 2010. +
10-Q 10.11 April 3, 2010
10.9 Form of 2012 time-vested stock appreciation rights agreement for employees other than CEO. +
10-Q 10.1 June 30, 2012
10.10 Form of 2013-16 time-vested stock appreciation rights agreement for employees other than CEO. +
10-Q 10.1 March 30, 2013
10.11 Form of 2017 time-vested stock appreciation rights agreement for employees other than CEO. +
10-Q 10.1 April 1, 2017
83

10.12 Form of 2018 stock appreciation rights agreement for employees other than the CEO. +
10-Q 10.2 June 30, 2018
10.13 Form of 2019 stock appreciation rights agreement for employees other than the CEO. +
10-Q 10.2 June 29, 2019
10.14 Form of 2020 stock appreciation rights agreement for employees other than the CEO. +
10-Q 10.2 June 27, 2020
10.15 Form of 2021 stock settled stock appreciation rights agreement for employees other than the CEO. +
10-Q 10.3 July 3, 2021
10.16 Form of 2013-16 time-vested stock appreciation rights agreement for CEO. +
10-Q 10.4 March 30, 2013
10.17 Form of 2017 time-vested stock appreciation rights agreement for CEO. +
10-Q 10.2 April 1, 2017
10.18 Form of 2018 stock appreciation rights agreement for CEO. + 10-Q 10.5 June 30, 201810.19 Form of 2019 stock appreciation rights agreement for CEO. + 10-Q 10.5 June 29, 201910.20 Form of 2020 stock appreciation rights agreement for CEO. + 10-Q 10.5 June 27, 202010.21 Form of 2012 time-vested stock appreciation rights agreement
for non-employee directors. +10-Q 10.7 June 30, 2012
10.22 Form of 2019 time-vested restricted stock agreement for employees other than the CEO. +
10-Q 10.3 June 29, 2019
10.23 Form of 2020 time-vested restricted stock agreement for employees other than the CEO. +
10-Q 10.3 June 27, 2020
10.24 Form of 2021 time-restricted stock unit agreement for employees other than the CEO. +
10-Q 10.2 July 3, 2021
10.25 Form of 2019 performance-vested restricted stock agreement for employees other than CEO. +
10-Q 10.1 June 29, 2019
10.26 Form of 2020 performance-vested restricted stock agreement for employees other than CEO. +
10-Q 10.1 June 27, 2020
10.27 Form of 2021 performance-vested restricted stock unit agreement for employees other than the CEO. +
10-Q 10.1 July 3, 2021
10.28 Form of 2019 time-vested restricted stock agreement for CEO. +
10-Q 10.6 June 29, 2019
10.29 Form of 2020 time-vested restricted stock agreement for CEO. +
10-Q 10.6 June 27, 2020
10.30 Form of 2021 time-vested restricted stock agreement for CEO. +
10-Q 10.5 July 3, 2021
10.31 Form of 2019 performance-vested restricted stock agreement for CEO. +
10-Q 10.4 June 29, 2019
10.32 Form of 2020 performance-vested restricted stock agreement for CEO. +
10-Q 10.4 June 27, 2020
10.33 Form of 2021 performance-vested restricted stock agreement for CEO. +
10-Q 10.4 July 3, 2021
10.34 Amended and Restated Credit Agreement, dated July 26, 2017 (originally dated as of October 27, 2014), by and among Zebra, the lenders and issuing banks party thereto, JPMorgan Chase Bank, N.A., and Morgan Stanley Senior Funding, Inc.
10-Q 10.1 July 1, 2017
10.35 Amendment No. 1, dated May 31, 2018, to the Amended and Restated Credit Agreement of July 26, 2017 (originally dated as of October 27, 2014), by and among Zebra, the lenders and issuing banks party thereto, JPMorgan Chase Bank, N.A., and Morgan Stanley Senior Funding, Inc.
10-Q 10.7 June 30, 2018
10.36 Amendment No. 2, dated August 9, 2019, to the Amended and Restated Credit Agreement of July 26, 2017 (originally dated as of October 27, 2014 and amended by Amendment No. 1 dated May 31, 2018), by and among, Zebra, the lenders party thereto, JPMorgan Chase Bank, N.A.
10-Q 10.1 September 28, 2019
84

10.37 Conformed Amended and Restated Credit Agreement, dated July 26, 2017 (originally dated as of October 27, 2014 and amended by Amendment No. 1 dated May 31, 2018 and Amendment No. 2 dated August 9, 2019), by and among Zebra, the lenders party thereto, JPMorgan Chase Bank, N.A.
10-Q 10.2 September 28, 2019
10.38 364-Day Credit Agreement dated September 1, 2020, by and among, Zebra, the lenders party thereto, and JPMorgan Chase Bank, N.A.
10-Q 10 September 26, 2020
10.39 Office Lease dated November 14, 2013 between Griffin Capital Corporation (as assignee from Northwestern Mutual Life Insurance Company) and Zebra Technologies Corporation.
10-K 10.34 December 31, 2017
10.40 First Amendment to Lease dated June 6, 2014 between Griffin Capital Corporation (as assignee from Northwestern Mutual Life Insurance Company) and Zebra Technologies Corporation.
10-K 10.35 December 31, 2017
10.41 Receivables Purchase Agreement dated as of December 1, 2017 among Zebra Technologies International, LLC, as the Originator, and Zebra Technologies RSC, LLC, as Buyer.
10-K 10.36 December 31, 2017
10.42 Receivables Financing Agreement, dated as of December 1, 2017, by and among Zebra Technologies RSC, LLC, the lenders from time to time party thereto, PNC Bank, National Association, Zebra Technologies, LLC, and PNC Capital Markets, LLC.
10-K 10.37 December 31, 2017
10.43 Second Amendment to Receivables Financing Agreement, dated as of March 19, 2021 by and among Zebra Technologies RSC, LLC, the lenders from time to time party thereto, PNC Bank, National Association, Zebra Technologies, LLC, and PNC Capital Markets, LLC
10-Q 10 April 3, 2021
10.44 Master Accounts Receivable Purchase Agreement dated December 19, 2018 among Zebra Technologies Europe Limited, Zebra Technologies Corporation, and MUFG Bank, Ltd.
10-K 10.43 December 31, 2018
10.45 Master Framework Agreement dated April 29, 2020 among Zebra Technologies Europe Limited, Zebra Technologies Asia Pacific PTE.LTD., Zebra Technologies Corporation, Ester Finance Titrisation, Credit Agricole Corporate & Investment Bank and Credit Agricole Leasing & Factoring
10-Q 10.7 June 27, 2020
10.46 First Deed of Amendment relating to the Master Framework Agreement dated April 29, 2020 among Zebra Technologies Europe Limited, Zebra Technologies Asia Pacific PTE.LTD., Zebra Technologies Corporation, Ester Finance Titrisation, Credit Agricole Corporate & Investment Bank and Credit Agricole Leasing & Factoring
10-K 10.50 December 31, 2020
10.47 English Receivables Purchase Agreement dated April 29, 2020 Zebra Technologies Europe Limited, Zebra Technologies Corporation, Credit Agricole Corporate & Investment Bank, Credit Agricole Leasing & Factoring, and Ester Finance Titrisation
10-Q 10.8 June 27, 2020
10.48 Singapore Receivables Purchase Agreement dated April 29, 2020 Zebra Technologies Asia Pacific PTE.LTD., Zebra Technologies Corporation, Credit Agricole Corporate & Investment Bank, Credit Agricole Leasing & Factoring, and Ester Finance Titrisation
10-Q 10.9 June 27, 2020
21.1 Subsidiaries of the Company. X23.1 Consent of Ernst & Young LLP, independent registered
public accounting firm. X
31.1 Rule 13a-14(a)/15d-14(a) Certification of Principal Executive Officer. X
31.2 Rule 13a-14(a)/15d-14(a) Certification of Principal Financial Officer. X
85

32.1 Certification of Principal Executive Officer Pursuant to 18 U.S.C Section 1350, as Adopted Pursuant to Section 906 of the Sarbanes-Oxley Act of 2002.
X
32.2 Certification of Principal Financial Officer Pursuant to 18 U.S.C Section 1350, as Adopted Pursuant to Section 906 of the Sarbanes-Oxley Act of 2002.
X
101 The following financial information from Zebra Technologies Corporation Annual Report on Form 10-K, for the year ended December 31, 2021, formatted in Inline XBRL: (i) the Consolidated Balance Sheets; (ii) the Consolidated Statements of Operations; (iii) the Consolidated Statements of Comprehensive Income; (iv) the Consolidated Statements of Stockholders’ Equity; (v) the Consolidated Statements of Cash Flows; and (vi) Notes to Consolidated Financial Statements. The instance document does not appear in the interactive data file because Inline XBRL tags are embedded in the iXBRL document.
104 The cover page from the Company’s Annual Report on Form 10-K for the year ended December 31, 2021, formatted in Inline XBRL (included in Exhibit 101).
+ Management contract or compensatory plan or arrangement required to be filed as an exhibit to this Annual Report on Form 10-K.
Item 16. Form 10-K Summary
None.
86

SIGNATURES
Pursuant to the requirements of Section 13 or 15(d) of the Securities Exchange Act of 1934, the Registrant has duly caused this report to be signed on its behalf by the undersigned, thereunto duly authorized, on the 10th day of February 2022.
ZEBRA TECHNOLOGIES CORPORATIONBy: /s/ Anders Gustafsson
Anders GustafssonChief Executive Officer
Pursuant to the requirements of the Securities Exchange Act of 1934, this report has been signed below by the following persons in the capacities and on the dates indicated.
Signature Title Date/s/ Anders Gustafsson
Anders GustafssonChief Executive Officer and Director(Principal Executive Officer)
February 10, 2022
/s/ Nathan WintersNathan Winters
Chief Financial Officer(Principal Financial Officer)
February 10, 2022
/s/ Colleen M. O’SullivanColleen M. O’Sullivan
Senior Vice President, Chief Accounting and Treasury Officer(Principal Accounting Officer)
February 10, 2022
/s/ Michael A. SmithMichael A. Smith
Director and Chairman of the Board ofDirectors
February 10, 2022
/s/ Linda M. ConnlyLinda M. Connly
Director February 10, 2022
/s/ Ross W. ManireRoss W. Manire
Director February 10, 2022
/s/ Richard L. KeyserRichard L. Keyser
Director February 10, 2022
/s/ Janice M. RobertsJanice M. Roberts
Director February 10, 2022
/s/ Chirantan J. DesaiChirantan J. Desai
Director February 10, 2022
/s/ Frank B. ModrusonFrank B. Modruson
Director February 10, 2022
/s/ Nelda J. Connors Nelda J. Connors
Director February 10, 2022
87

To Our Investors,In 2021, we celebrated the 30th anniversary of our initial public stock offering. Since the offering we
have significantly outperformed the broader markets and transformed Zebra into a key strategic partner
with 94% of the Fortune 100, providing enterprises with solutions that digitize and automate their
operations. We continue to be excited about our opportunity to help our customers meet their mission-
critical needs in an increasingly on-demand economy.
Optimizing Workflows for the On-Demand EconomyOver the past year, we have continued to make strong progress in advancing our Enterprise Asset
Intelligence vision of enabling every asset and worker to be visible, connected, and fully optimized.
As a trusted strategic partner, we help transform end-to-end workflows in a variety of end markets
including retail & ecommerce, transportation & logistics, manufacturing, healthcare, government, public
safety, and hospitality. We empower the workforce on the front line to do their jobs more efficiently by
navigating constant change in near-real time, utilizing insights driven by advanced software capabilities
such as prescriptive analytics and intelligent automation.
Our served markets total approximately $30 billion and are supported by megatrends including the
on-demand economy, asset visibility, mobility & cloud computing, and automation. These trends have
become increasingly important to our enterprise customers, and we remain well positioned to meet their needs with our comprehensive
solutions in our core, adjacent, and expansion markets. Our core, which includes enterprise mobile computing, data capture, and thermal
printing, remains vibrant – we have the broadest and deepest offering among the competition and believe that our continued focus and
investment will advance our leadership position. Near-adjacencies, including RFID and smart supplies, provide ample opportunity to expand and
have an even higher growth profile than our core.
Beyond our core and near adjacencies are rapid-growth and margin-rich expansion market opportunities. In mid-2021, we launched several
fixed industrial scanning and machine vision smart cameras while acquiring Adaptive Vision to advance our offering. Soon after, we acquired
Fetch Robotics to give us the broadest portfolio of autonomous mobile robots in the industry. We are also building a compelling software suite
that optimizes retail execution and demand planning with Reflexis workforce & task management, Zebra Prescriptive Analytics, Workforce
Connect, SmartCount, and recently acquired antuit.ai to extend our reach into demand forecasting. We are early on our journey in these exciting
expansion categories and continue to invest in them as cornerstones of our growth strategy.
Exceptional 2021 Financial ResultsWe achieved record financial results in 2021 as customers prioritized their spending on our solutions. For the year we realized:
• 26% net sales growth with broad-based demand across our regions and vertical end markets;
• 250 basis point adjusted EBITDA margin* expansion through profitable sales growth and operating expense leverage;
• 44% growth in non-GAAP diluted earnings per share*; and
• Free cash flow* of greater than $1 billion.
As we enter 2022, we continue to see very strong demand across our business with a robust order backlog and pipeline of opportunities. That
said, our teams have been aggressively working to mitigate the unprecedented industry-wide supply chain challenges that are expected to
impact our growth in the near term by securing new sources of supply, utilizing alternative modalities of transportation, and expediting
customer shipments.**
Our Commitment to Drive Innovation through Inclusion, Diversity and Sustainability We believe that a diverse workforce and an inclusive culture foster our innovation and differentiate us as an employer of choice. We continue
to build on our industry-leading offerings by investing in our people who are instrumental in driving our innovation and sustainable, profitable
growth. We recently set formal workplace diversity goals and have continued to expand our inclusion and diversity efforts by establishing our
Inclusion Champions program and launching additional inclusion networks and learning resources.
As a responsible corporate citizen, we are committed to a sustainable business model that benefits our stakeholders. We continue to focus on
driving progress across our priorities of human capital management, climate, resource conservation, and governance.
I would like to thank our employees and partners for their extraordinary efforts to serve customers and deliver record 2021 results in a supply-
constrained environment through the pandemic. We are optimistic that we are now seeing the peak of these challenges, and we are working
diligently to minimize these impacts. Our primary focus continues to be the health and safety of our people and those on the front line.
Sincerely,
Anders Gustafsson
*For a reconciliation of these non-GAAP measures to similar GAAP measures, please refer to Zebra’s 4Q21 earnings press release located at investors.zebra.com.
**Such forward-looking statements are based on current expectations and assumptions that are subject to risks and uncertainties that may cause actual results
to differ materially.
Board of Directors
Michael A. Smith1,2,3
Chair of the Zebra BoardChairman and Chief Executive OfficerFireVision, LLC
Anders GustafssonChief Executive Officer Zebra Technologies Corporation
Linda M. Connly1
Expert PartnerBain & Company
Nelda J. Connors1
Founder, Chairwoman and CEOPine Grove Holdings, LLC
Chirantan J. Desai2
Chief Operating Officer ServiceNow
Richard L. Keyser 2,3
Retired Chairman W. W. Grainger, Inc.
Ross W. Manire 1,3
President and Chief Executive Officer (Retired) ExteNet Systems, Inc.
Frank B. Modruson 1, 3
President of Modruson & Associates, LLC and Chief Information Officer (Retired) Accenture
Janice M. Roberts 2
Partner Benhamou Global Ventures
1 - Member of Audit Committee 2 - Member of Compensation Committee 3 - Member of Nominating and Governance Committee
Executive Officers
Anders GustafssonChief Executive Officer
Nathan A. WintersChief Financial Officer
William J. BurnsChief Product and Solutions Officer
Michael ChoChief Strategy Officer
Joachim HeelChief Revenue Officer
Cristen L. Kogl Chief Legal Officer,General Counsel andCorporate Secretary
Jeffrey F. SchmitzChief Human Resources and Marketing Officer
Stephen E. Williams Chief of Global Operations and Services
Colleen M. O’SullivanSVP, Chief Accounting and Treasury Officer
Stockholder Information
Global Corporate HeadquartersZebra Technologies CorporationThree Overlook PointLincolnshire, Illinois 60069U. S. A. Phone: +1 847 634-6700Fax +1 847 913-8766
Annual MeetingZebra’s Annual Meeting of Stockholders will be held on May 12, 2022, at 10:30 a.m. Central Time
Independent AuditorsErnst & Young LLP Chicago, Illinois
Investor RelationsInvestors are invited to learn more about Zebra Technologies Corporation by accessing the company’s website at investors.zebra.com, by sending an email to [email protected] or by calling +1 847 518-6432.
Transfer Agent and Registrar Computershare P.O. Box 505000 Louisville, KY 40233-5000
Overnight Delivery: Computershare 462 South 4th Street, Suite 1600Louisville, KY 40202
Telephone: +1 800 522-6645 or +1 201 680-6578
TDD for hearing impaired: +1 800 231-5469 or +1 201 680-6610
Website: www.computershare.com/investor
Form 10-K The Zebra Technologies Corporation Form 10-K Report filed with the Securities and Exchange Commission is incorporated in this annual report. Our Code of Ethics for Senior Financial Officers is available for download on the Company’s Investor Relations website at investors.zebra.com under the Governance tab, within the Governance Documents section. Please contact the Investor Relations Department at the Corporate Headquarters for additional copies of the Form 10-K, or visit our website to view an online version of the Form 10-K, or the Code of Ethics for Senior Financial Officers.
Equal Employment Opportunities/ Affirmative Action It is the policy of Zebra Technologies Corporation to provide equal opportunities and affirmative action in all areas of its employment practices without regard to race, color, religion, national origin, sex, age, ancestry, citizenship, disability, veteran status, marital status, sexual orientation or any other reason prohibited by law.
Zebra Annual Report 2021.indd 4-6Zebra Annual Report 2021.indd 4-6 3/24/22 5:40 PM3/24/22 5:40 PM

ZEBRA and the stylized Zebra head are trademarks of Zebra Technologies Corp., registered in many jurisdictions worldwide. All other trademarks are the property of their respective owners. ©2022 Zebra Technologies Corp. and/or its affiliates.
NA and Corporate Headquarters+1 847 634 6700
Asia-Pacific Headquarters+65 6858 0722
EMEA Headquarters+44 1628 556000
Latin America Headquarters+1 754 900 4050
zebra.com
Annual Report 2021
Zebra Technologies 2
02
1 Annual R
eport
Zebra Annual Report 2021.indd 1-3Zebra Annual Report 2021.indd 1-3 3/24/22 5:40 PM3/24/22 5:40 PM
Top Related
Copyright © 2022 FDOKUMEN

