


Bahasa
Halaman
Hukum


EN EN
ANNEX 1
{SWD(2017)220 final}
{SWD(2017)222 final}
EUROPEAN COMMISSION
Brussels, 29.5.2017
SWD(2017) 221 final
COMMISSION STAFF WORKING DOCUMENT
INTERIM EVALUATION
of
HORIZON 2020
{SWD(2017) 220 final}
{SWD(2017) 222 final}

EN EN

1
A. PROCEDURAL INFORMATION ............................................................................. 5
B. STAKEHOLDER CONSULTATION RESULTS...................................................... 8
B.1. Overview of respondents ................................................................................... 8
B.2. Relevance ........................................................................................................ 11
B.3. Effectiveness ................................................................................................... 25
B.4. Efficiency and use of resources ....................................................................... 36
B.5. Coherence ........................................................................................................ 44
B.6. EU added value ............................................................................................... 47
B.7. Areas for future consideration ......................................................................... 49
B.8. Position Papers ................................................................................................ 51
C. METHODS AND ANALYTICAL MODELS USED .............................................. 63
C.1. Main data sources ............................................................................................ 63
C.2. Overall limitations of the interim evaluation .................................................. 64
C.3. Monitoring data ............................................................................................... 65
C.4. The economic impact and the European added value of the programme ....... 66
C.5. Analysis of participation and publication networks, including
interdisciplinarity............................................................................................. 67
C.6. Stakeholder consultation ................................................................................. 69
C.7. Estimation of the costs of writing proposals ................................................... 69
C.8. Text mining on the relevance of the programme ............................................ 71
D. MONITORING DATA ON HORIZON 2020 STATE OF IMPLEMENTATION .. 74
D.1. Overall 74
D.2. Type of organisations ...................................................................................... 74
D.3. Per programme part ......................................................................................... 75
D.4. Type of instrument .......................................................................................... 78
D.5. Member States ................................................................................................. 80
D.6. Benchmarking with FP7 .................................................................................. 82
D.7. Newcomers ...................................................................................................... 83
E. SUCCESS STORIES FROM PREVIOUS FRAMEWORK PROGRAMMES ....... 86
F. EUROPEAN ADDED VALUE CASE STUDIES ................................................... 88
F.1. European added value case study 1: Antimicrobial resistance ........................ 88
F.2. European added value case study 2: Large-Scale Data gathering, omics
research and biobanks which contribute to personalised medicine approaches100

2
F.3. European added value case study 3: Fisheries .............................................. 113
F.4. European added value case study 4: Fuel Cell & Hydrogen ......................... 127
F.5. European added value case study 5: Food Waste .......................................... 144
F.6. European added value case study 6: Climate Change evidence .................... 156
F.7. European added value case study 7: Contributions to the Digital Single
Market through innovative online public services in an inclusive and reflective
society ............................................................................................................ 166
G. TOP 50 HORIZON 2020 PARTICIPANTS PER TYPE OF ORGANISATION .. 181
G.1. Organisations ................................................................................................. 181
G.2. Higher and secondary education institutions (HES) ..................................... 182
G.3. Other organisations (OTH) ............................................................................ 183
G.4. Private for profit companies (PRC) ............................................................... 184
G.5. Public sector organisations (PUB) ................................................................ 185
G.6. Research Organisations (REC) ...................................................................... 186
G.7. SMEs 187
H. THE COVERAGE OF CROSS-CUTTING ISSUES IN HORIZON 2020 ............ 188
H.1. Introduction ................................................................................................... 188
H.2. The development and application of key enabling and industrial technologies
as well as future and emerging technologies ................................................. 191
H.3. Bridging from discovery to market application ............................................ 191
H.4. Interdisciplinary and cross-sectoral research and innovation ........................ 195
H.5. Social and economic sciences and humanities .............................................. 202
H.6. Sustainable development, climate change and biodiversity .......................... 205
H.7. Fostering the functioning and achievement of the ERA ............................... 213
H.8. Framework conditions in support of the flagship initiative "Innovation Union"216
H.9. Contributing to the Digital Agenda for Europe ............................................. 217
H.10. Widening participation across the Union in research and innovation and
helping to close the research and innovation divide in Europe ..................... 220
H.11. International networks for excellent researchers and innovators such as
European Cooperation in Science and Technology (COST) ......................... 228
H.12. International cooperation - Cooperation with third countries ....................... 233
H.13. Science and Society: Responsible Research and Innovation ........................ 245
H.14. Gender equality ............................................................................................. 250
H.15. SME involvement in research and innovation and broader private sector
participation ................................................................................................... 261
I. FURTHER INFORMATION ON THE IN-DEPTH ASSESSMENT OF PUBLIC-
TO-PUBLIC PARTNERSHIPS .............................................................................. 267

3
I.1. Introduction ................................................................................................... 267
I.2. Overview P2Ps .............................................................................................. 267
I.3. ERA-NET Cofund under Horizon 2020 ........................................................ 270
I.4. Art.185 initiatives .......................................................................................... 272
I.5. Joint Programming Initiatives ....................................................................... 274
I.6. Evaluation Results on Public-Public Partnershipss ....................................... 277
I.7. Lessons learnt ................................................................................................ 283
J. FURTHER INFORMATION ON THE IN-DEPTH ASSESSMENT OF PUBLIC-
PRIVATE PARTNERSHIPS .................................................................................. 287
J.1. Introduction ................................................................................................... 287
J.2. Openness ....................................................................................................... 288
J.3. Transparency ................................................................................................. 297
J.4. Effectiveness ................................................................................................. 300
J.5. Overview Joint Undertakings Key Performance Indicators .......................... 308
K. FURTHER INFORMATION ON THE EUROPEAN INSTITUTE OF
INNOVATION AND TECHNOLOGY (EIT) ........................................................ 312
K.1. Overview ....................................................................................................... 312
K.2. Rationale ........................................................................................................ 313
K.3. Implementation .............................................................................................. 313
K.4. Achievements so far ...................................................................................... 315
K.5. Lessons learnt/Areas for improvement.......................................................... 325
L. FURTHER INFORMATION ON THE FAST TRACK TO INNOVATION PILOT
2015-2016 ................................................................................................................ 326
L.1. Relevance ...................................................................................................... 326
L.2. Effectiveness ................................................................................................. 326
L.3. Efficiency ...................................................................................................... 327
L.4. Coherence ...................................................................................................... 328
L.5. EU added value ............................................................................................. 328
M. IMPACT OF THE NEW MANAGEMENT MODES ON THE PERFORMANCE
OF HORIZON 2020 – FOCUS ON EXECUTIVE AGENCIES ............................ 329
M.1. Background ................................................................................................... 329
M.2. Setting up Executive Agencies under Horizon 2020 ..................................... 330
M.3. Assessment of implementation of Horizon 2020 activities delegated to the
Executive Agencies ....................................................................................... 332
M.4. Main findings and conclusions from the recent evaluations of ERCEA and
REA operations ............................................................................................. 337

4
N. THE IMPACT OF SIMPLIFICATION AND THE NEW FUNDING MODEL ... 340
N.1. Context and legal requirements – Horizon 2020 new funding model ........... 340
N.2. The impacts of the new model on attractiveness, accessibility and
participation in Horizon 2020........................................................................ 342
N.3. The impacts of the new model on funding levels .......................................... 342
N.4. Lessons learnt and areas for improvement .................................................... 343
O. ANALYSIS OF THE COMPANIES PARTICIPATING IN HORIZON 2020 ...... 345
O.1. Company sectors by age and grants .............................................................. 346
O.2. Company age and grants ............................................................................... 349
O.3. Company employment and grants ................................................................. 351
O.4. Company revenues and grants ....................................................................... 352
O.5. Companies by Member State ........................................................................ 355
P. POSITION IN INTERNATIONAL RANKINGS .................................................. 356
P.1. Companies ..................................................................................................... 356
P.2. Universities and research institutions ............................................................ 357
Q. PARTICIPATION PATTERNS AND BALANCE BETWEEN LARGE AND
SMALL PROJECTS ............................................................................................... 359
Q.1. Introduction and background......................................................................... 359
Q.2. Analysis 1 – Descriptive overview of participation in different-size projects
based on budget data ..................................................................................... 359
Q.3. Analysis 2 – Composite threshold and comparison Horizon 2020 - FP7 ..... 361
R. HORIZON 2020 NETWORKS - COUNTRIES AND GATEWAYS FOR
NEWCOMERS ....................................................................................................... 364
R.1. Trans-national collaboration in projects ........................................................ 364
R.2. Geographic collaboration networks in publications from the Framework
Programmes ................................................................................................... 366
R.3. Analysis of newcomers to the Framework Programme ................................ 370

5
A. PROCEDURAL INFORMATION
Lead DG: Directorate General Research and Innovation (RTD)
Agenda Planning number: 2015/RTD/005 Interim evaluation of Horizon 2020.
The requirement for the interim evaluation of Horizon 2020 derives from Article 32 of
Regulation 1291/2013/EC establishing Horizon 2020. This stipulates that "by 31 December
2017, and taking into account the ex-post evaluation of the Seventh Framework Programme to be
completed by 31 December 2015 and the review of the EIT, the Commission shall carry out,
with the assistance of independent experts, selected on the basis of a transparent process, an
interim evaluation of Horizon 2020, its specific programme, including the European Research
Council (ERC), and the activities of the EIT".
The interim evaluation of Horizon 2020 started in 2016 and has been guided by Terms of
Reference adopted by the Commission after a vote by the Member States’ Programme
Committee1. An evaluation roadmap, summarising the design, purpose and scope of the Horizon
2020 interim evaluation, was published in May 20162.
An Inter-Service Group (ISG) 3
gathering representatives of different Directorates-General (DG)
of the Commission was set up in early 2016 and held 7 meetings prior to submission of the Staff
Working Document to the Regulatory Scrutiny Board in March 2017 (14 April 2016, 12 May
2016, 13 June 2016, 13 July 2016, 20 September 2016, 27 October 2016, 23 February 2017). A
series of internal seminars were also organised between December 2016 and February 2017, to
which all ISG members were invited, at which the emerging interim evaluation results were
presented and discussed.
The interim evaluation was coordinated by the Evaluation Unit of the Commission's Directorate-
General for Research & Innovation (DG RTD) with inputs from several Commission services
that, in turn, contracted studies or steered groups of independent experts. A cross-DG Working
Group was established and held 13 meetings between March 2015 and November 2016. The
evaluation is based on a wide range of sources comprising internal assessments by Commission
services as well as external expert group reports, horizontal and thematic evaluation studies, the
results of the ex-post evaluation of 7th
European Research Framework Programme (FP7) and the
review of the European Institute of Innovation and Technology. The sources are systematically
described and identified throughout the Staff Working Document.
A public stakeholder consultation on the interim evaluation of Horizon 2020 was launched on 20
October 2016 and closed on 15 January 2017. On 28 April 2017 a conference was organised by
DG RTD in cooperation with the European Economic and Social Committee (EESC) to present
the results of this consultation.
In accordance with the feedback received from the Regulatory Scrutiny Board on 31 March
2017, the Staff Working Document has been revised as presented in Figure 1 These revisions
were endorsed by the Inter Service Group during the meeting of 7 April 2017.
1 C(2016)5546. 2 See: http://ec.europa.eu/smart-regulation/roadmaps/docs/2015_rtd_005_evaluation_ie_horizon_2020_en.pdf 3 The ISG for the Horizon 2020 interim evaluation consisted of representatives from the following Directorates-General of the
European Commission: AGRI, BUDG, CLIMA, CNECT, EAC, ENV, ECFIN, ENER, GROW, HOME, JRC, MOVE, REGIO,
RTD, SG.

6
Figure 1 Modifications to the draft Staff Working Document based on comments received
from the Regulatory Scrutiny Board
Comments from the Regulatory Scrutiny
Board
Actions taken for the Staff Working Document
(1) Expected vs actual results - key evaluation
questions
The report does not make enough use of the
available evidence to benchmark and compare
results with what was anticipated.
The introduction should elaborate on the
presentation of the programme. It should
highlight the differences with its predecessor,
FP7. On that basis, the report should clearly set
out the initial expectations of the programme. It
should link these to a strengthened analysis of
the results obtained so far and the reasons for
possible deviations. A clear intervention logic
should describe how the programme aims to
achieve its intended effects, what were the
projections made and how those compare with
the results achieved so far. Since this is an
interim evaluation, the report should focus on
the key channels of the intervention logic which
can be checked at this stage. It should formulate
key questions around the five evaluation criteria.
The report should select the relevant data that
answer these questions and explain how the
programme is performing. This is for instance
the case for the efficiency criteria where the
evaluation could benchmark the efficiency gains
against the forecasts of the cost-benefits study
on the externalisation of the management of EU
funds. In terms of coherence, the report should
provide a critical picture of how Horizon 2020
and some of its parts (such as the financial
instruments) fit with other programmes in a
complementary manner.
The’ background to the initiative’ section has been
completed to present the key evolutions from FP7
(novelties and continuity), and key features and
expectations of Horizon 2020 compared to FP7.
The objectives pursued through Horizon 2020 have
been clarified and the detailed intervention logic
used for the interim evaluation has been included
(including the different types of expected outputs,
results and impacts around which the effectiveness
analysis is structured).
Key questions for each evaluation criteria have
been included as well as a short explanation at the
beginning of each section on the purpose of the
analysis performed.
Under the effectiveness section, the structure of the
analysis of the progress towards impacts has been
further explained according to the channels used
under Horizon 2020 for the generation of impacts.
Comparisons with FP7 have been included where
relevant and possible (availability of comparable
data). A benchmarking table of the main
implementation data for FP7 and Horizon 2020 has
been added.
The baseline scenario and expectations from
Horizon 2020 based on the Impact Assessment
have been clarified for each evaluation criteria.
In the efficiency assessment, comparisons with the
forecasts of the cost-benefits analysis of the
externalisation of the programme management
have been added.
The coherence assessment has been strengthened
to provide a more critical and comprehensive
picture of the complementarity of the instruments
of Horizon 2020 with other instruments.
(2) From key questions to key conclusions
The conclusions do not always clearly stem from
the analysis.
The report should more systematically qualify
its key findings in terms of positive and negative
developments. It would clarify what issues will
be addressed at different stages. It should put
more emphasis on possible areas for
improvements in the remaining three years of
the programme. This would for examples
include adapting the SME instrument to support
the most disruptive innovations, increasing the
participation of third countries and reconciling
its focus on excellence with capacity building in
The conclusion section has been restructured to
present more clearly the key findings and areas for
improvement, with distinctions made between
improvements needed on the short term (e.g 2017-
2020) and in the longer term (e.g next Framework
Programme). These include suggestions for further
simplification.
The expectations from the programme have been
added under each evaluation criteria accompanied
by an overview box on the key conclusions from
the analysis.

7
Comments from the Regulatory Scrutiny
Board
Actions taken for the Staff Working Document
some countries. The report should also better
identify the remaining areas for further
simplification. As mentioned under point 1), for
each of these, it should start from the intention
of the programme, the actual results and suggest
possible solutions.
(3) Prioritisation
The report does not fully explain how activities
were given priority within and between the three
pillars.
The report should more clearly explain how
specific topics are prioritised under Horizon
2020. In particular the report should clarify
whether the programme properly addresses
current challenges identified by stakeholders.
Generally, it should break down stakeholders'
views and distinguish between beneficiaries and
other parties. It could supplement those views
with case studies, illustrating both good
practices and challenges encountered. In
addition, the report should provide further
explanations on the implementation of priorities
that are both pillar-specific and cross-cutting
(such as excellence or innovation).
The structure of Horizon 2020 has been clarified as
well as the way the priorities were defined at time
of programme design. The strategic programming
process has been further explained as well as
further references to the thematic assessments
(Annex Part 3) were introduced - where the
allocations per topics are discussed in-depth.
Stakeholder views are used for contextualising the
findings. These are based on a public consultation
questionnaire (app. 3500 respondents) and more
than 300 position papers received. In addition,
horizontal studies and thematic assessments used
surveys of project coordinators, participants/non-
participants and interviews of multiple
stakeholders as evidence base for their analysis.
The wording has been revised to ensure the
differences between the sources of information are
clear for the reader.
Projects’ example boxes have been introduced
throughout the document as illustrations.
The text has been clarified in order to stress that
the interim evaluation is not ‘pillar-based’ but
covers the whole programme according to the
objectives sought (e.g. excellence is supported
under all pillars and innovation can emerge from
ERC grants). Detailed assessments of each
programme part are provided in Annex Part 3.
(4) Synthesis:
The structure and presentation of the report do
not convey a clear overview of key messages.
The extended summary could serve as a basis
for a more synthetic Staff Working Document.
The report should in a balanced manner take
stock of the achievements and difficulties
encountered so far. This would correspond to the
evaluation's objective to inform the College and
feed into the impact assessment for a future
research programme. It would also pave the way
for future general orientations on issues like
innovation, basic research or support to SMEs.
The extended summary has been reworked to
clearly present the key findings from the interim
evaluation, the strengths from Horizon 2020 and
the remaining challenges to be addressed in the
(near) future as the main Interim Evaluation. In
order to ease the reading it follows the same
structure as the In-Depth Interim Evaluation.

8
B. STAKEHOLDER CONSULTATION RESULTS
A public stakeholder consultation on the interim evaluation of Horizon 2020 was launched on 20
October 2016 and closed on 15 January 2017. The stakeholder consultation results were
discussed at a conference organised by the European Commission, DG RTD, with the European
Economic and Social Committee on 28 April 2017.This document presents an analysis of the
responses received, structured according to the five evaluation criteria: relevance; effectiveness;
efficiency and use of resources; coherence; EU added value.
The document concludes with the analysis of 296 position papers also received within the
context of the stakeholder consultation.
B.1. Overview of respondents
B.1.1. Who are the respondents?
In total 3483 responses to the online questionnaire were received:
49% (1721) from individuals;
5% (175) from representatives of "umbrella" organisations of EU interest; and
46% (1587) from representatives of a single institution or a company.
Among different types of organisations, the highest number of responses was submitted by
businesses (687 or 20%), of these 65% (443) were SMEs.
Answers come from 69 different countries. However, the majority of the respondents come from
EU15 countries with Spain and Italy being the most active. 65 respondents come from third
countries.
Table 1 What type of organisation do you represent?
Type of respondent 1. I am responding Total % of respondents
As an individual n/a 1721 49.4%
Academia
On behalf of a single institution/company 297 8.5%
On behalf of an “umbrella” organisation of EU interest 27 0.8%
Business
On behalf of a single institution/company 664 19.1%
On behalf of an “umbrella” organisation of EU interest 23 0.7%
Non-Governmental Organisation
On behalf of a single institution/company 88 2.5%
On behalf of an “umbrella” organisation of EU interest 37 1.1%
Public authority
On behalf of a single institution/company 133 2.9%
On behalf of an “umbrella” organisation of EU interest 13 1.6%
Research organisation On behalf of a single institution/company 305 8.8%
On behalf of an “umbrella” organisation of EU interest 20 0.6%
Other
On behalf of a single institution/company 100 3.8%
On behalf of an “umbrella” organisation of EU interest 55 0.4%
Total 3483 100.0%

9
Figure 1 Country of respondents
B.1.2. Which part of the programme have they participated in?
76% (2648) of the respondents received support from different parts of the Horizon 2020
programme. Most commonly, they participated in the Marie Skłodowska-Curie Actions (MSCA,
30% of respondents) or the Leadership in Enabling and Industrial Technologies (LEIT, 22% of
respondents) parts of the programme. 30% (790) of the respondents who received support from
Horizon 2020 are newcomers to the programme (not having participated in FP7).
Figure 2 Share of respondents that have participated in Horizon 2020 (2648) stating which
part the programme they have participated in
29.6%
21.8%
16.1%
15.9%
15.8%
15.4%
15.1%
13.6%
13.4% 12.9% 11.5%
10.2%
10.0%
8.6%
6.9%
6.3%
6.3%
0.8%
0.0 %
5.0 %
10. 0%
15. 0%
20. 0%
25. 0%
30. 0%
MSCA
LEIT
SC3 : Secure, clean and efficient energy
SC5: Climate action, environment, resourceefficiency and raw materials
ERC
FET
SC1: Health, demographic change and well-being
SC2: Food security, sustainable agriculture andforestry, marine, maritime and inland water…
SC4: Smart, green and integrated transport
Innovation in SMEs (including SME Instrument)
RI
SC7: Secure societies – Protecting freedom and security of Europe and its citizens
SC6: Europe in a changing world – Inclusive, innovative and reflective societies
SWAFS
EIT
FTI
SEWP
ARF

10
Horizon 2020 Pillar Number of respondents Share of respondents
Societal Challenges 2227 36.6%
Excellent Science 2185 35.9%
LEIT 940 15.4%
Other 745 12.2%
B.1.1. Main reasons for not participating
24% (835) of respondents did not receive support from Horizon 2020. Besides not being funded,
the main reasons for not participating in Horizon 2020 were:
1) Success rates in Horizon 2020 are too low to be worth applying; and
2) Limited financial/human resources to prepare a proposal.
Figure 3 Main reasons for not participating to Horizon 2020 (max 3 answers)
Out of the 134 respondents, who listed "Other", 58 were not researchers/ innovators and a few
more quoted reasons for not participating that are already listed above ('lack of relevant topics-
areas', for example, because topics are too broad and limited resources). 8 indicated they were in
the process of applying or were awaiting results after a proposal submission, while 5 were still
involved in ongoing FP7 projects that had prevented them from applying to the new programme.
A few mentioned conflicts of interest or a desire to maintain an independent view of on the
programme, for example consulting firms involved in evaluations of Framework Programmes
(FPs).
Some respondents commented on Horizon 2020 requirements that had hampered their
participation mostly because they applied from third countries (e.g. Swiss respondents). Among
other reasons for not participating were the lack of incentives, lack of awareness of the Horizon
2020 programme, lack of experience in participating in such a programme, and the limited
involvement of end-users in FP projects.
262
194
190
175
122
118
106
63
63
60
30
15
134
I tried, but my proposal wasn't selected
Success rates in Horizon 2020 are too low to be worth applying
Limited financial/human resources to prepare a proposal
I'm not a researcher/innovator
Lack of a relevant area/topic for my needs
Difficulties to find project partners
Horizon 2020 project implementation rules are cumbersome
Preference to participate in other national or regional programmes
Lack of an adequate type of financial support needed for my work
Lack of awareness of the EU research and innovation framework…
Preference to participate in other European or international…
Concerns about sharing valuable knowledge with partners
Other

11
B.2. Relevance
B.2.1. Is Horizon 2020 tackling the right issues?
B.2.2. The relevance of Horizon 2020 given the challenges to address
When asked whether Horizon 2020 priorities address the current challenges confronted by the
European Union (e.g. migration, terrorism, ageing population), 77% of the consultation
respondents agree fully or to a large extent, and 8% judge that it is not the case at all. Academia
and research organisations tend to be more positive (86-83% think it does at least to some extent)
than business (71% think it does at least to some extent).
Figure 4 Do you think that Horizon 2020 priorities address the current challenges
confronted by the European Union (e.g. migration, terrorism, ageing population)?
Source: Replies to stakeholder consultation questionnaire launched in the framework of the Interim Evaluation of
Horizon 2020, October 2016-January 2017, N=348.3

12
B.2.3. The relevance of Horizon 2020 to address European objectives
Almost all the consultation respondents agreed to some extent or more that Horizon 2020 is
contributing to support jobs, growth and investments (95%) and to foster the role of the
European Union as a stronger global actor (92%).
The vision of respondents on the contribution of Horizon 2020 to other EU priorities is more
nuanced: 74% agree to some extent or more that Horizon 2020 is contributing to achieving a
deeper and fairer internal market with a strengthened industrial base, 72% to promoting an
Energy Union with a forward-looking climate policy (25% do not share this vision at all, that is
the priority which sees the highest proportion of disagreement), and 66% to helping to create a
Digital Single Market (however 29% of respondents declare that they do not know).
Figure 5 Do you think that Horizon 2020 is contributing to the following priorities of the
European Union?
Source: Replies to stakeholder consultation questionnaire launched in the framework of the Interim Evaluation of
Horizon 2020, October 2016-January 2017, N=3483
B.2.4. Does Horizon 2020 allow adapting to new scientific and socio-economic
developments?
While the majority of consultation respondents thought that the programme’s thematic coverage
was flexible enough to cope with changing circumstances (77% agree to some extent or more),
the rate of full disagreement is however higher than for other statements (12% do not agree at
all). In addition, NGOs tended to disagree more than the other categories of respondents did
(16% of NGOs do not agree at all).

13
Figure 6 Do you think that Horizon 2020 thematic coverage is flexible enough to cope with
changing circumstances?
Source: Replies to stakeholder consultation questionnaire launched in the framework of the Interim Evaluation of
Horizon 2020, October 2016-January 2017, N=3483
A high percentage of respondents agreed, to some extent or more, that Horizon 2020
supported the latest developments in research and innovation (93% of agreement rate). The
most positive respondents are business and public authorities.

14
Figure 7 Do you think that Horizon 2020 priority areas and calls support the latest
developments in research and innovation at the national/European and international level?
Source: Replies to stakeholder consultation questionnaire launched in the framework of the Interim Evaluation of
Horizon 2020, October 2016-January 2017, N=3483
Overall, consultation respondents think that Horizon 2020 is stimulating disruptive and
market-creating innovation but a large share think this is only the case to some extent (37%).
The most positive respondents on this question are SMEs, with 63% thinking that Horizon 2020
is fully or to a large extent stimulating disruptive and market-creating innovation.

15
Figure 8 Do you think that Horizon 2020 is stimulating disruptive and market-creating
innovation (a new process, product or service that upsets existing business models and
serves new set of customers)?
Source: Replies to stakeholder consultation questionnaire launched in the framework of the Interim Evaluation of
Horizon 2020, October 2016-January 2017, N=3483
B.2.5. Is Horizon 2020 responding to stakeholder needs?
More than 80% of the consultation respondents agree that the frequency of the calls and
their clarity are either “good” or “very good”.
However, the views regarding the transparency of the process of formulating the Work
Programmes and the ease of finding the right call for proposal differ. Many of the respondents
(67%) had a positive opinion on both these aspects. But some respondents (26%) found that the
transparency of the process of formulating the Work Programmes and the ease of finding the
right call “poor” or “very poor”. 45% of the respondents thought that the inclusion of Social
Sciences and Humanities in the calls was “good” or “very good” and many (39%) did not know.

16
Figure 9 Please rate the following Horizon 2020 implementation aspects – Work
Programme and calls
Source: Replies to stakeholder consultation questionnaire launched in the framework of the Interim Evaluation of
Horizon 2020, October 2016-January 2017, N=2648
The comments to the open responses elaborate on the observed quantitative results. Some
respondents highlight difficulties in finding and identifying the calls documents. For instance,
they mention a lack of clarity in the calls and the dispersion of documents and information in
various places. They also ask for explanatory documents, as it is judged difficult to find
aggregated and clear information on the programme.
In addition, through an open question, consultation respondents were asked to outline the main
reasons for participating in Horizon 2020. Three main reasons stand out from the analysis,
pointing to the type of needs Horizon 2020 is able to address:
Respondents highly value the financial support provided by Horizon 2020 (with a few
respondents underlying the long-term and reliable nature of Horizon 2020 funding streams);
Respondents value the access to new knowledge and know-how, mostly through exchanges
of experiences and skills with partners, that allow them to build new competences and
capacities;
Respondents underline that participation provides unique opportunities for collaboration
with European or international partners and for contacts with key players that are often
the best in their field. Respondents value the opportunities to strengthen partnerships inside
existing networks as much as the ability to meet new partners or build new networks.
Interdisciplinary work and the opportunity to work with other types of actors (business-
academia-research organisations- governments- end users) also stand out.
Among the other reasons for participating in Horizon 2020 that are underlined by respondents, it
is worth mentioning the following: products, solutions development and commercialisation
(mainly quoted by businesses); internationalisation, visibility and enhancement of the
participants’ research profile (mainly quoted by academia); the ability to advance global
knowledge and solve societal challenges such as climate change and health; and the ability to
perform or have access to high-profile research. Some business respondents also mention growth

17
opportunities and a better or secured position on markets, as well as the ability to develop
innovation faster.
30% (790) of the respondents who received support from Horizon 2020 are newcomers to
the programme (not having participated in FP7). 87% (2310) of respondents who received
support from Horizon 2020 are cooperating with a new partner(s) in Horizon 2020. The
main reason for collaboration with new partners in Horizon 2020 is to include specific
expertise from another discipline. Out of the 134 respondents, who list "Other reasons", 52
explained that they cannot choose only one main reason and that various or all reasons apply. 28
were approached by other organisations and were not themselves engaged in finding new
partners. Other reasons include: accessing new contacts, larger networks, expertise or
information on local specificities for product development, and benchmarking organisations'
practices (for public authorities).
Figure 10 Why did you look for a new partner (one main reason)?
Source: Replies to stakeholder consultation questionnaire launched in the framework of the Interim Evaluation of
Horizon 2020, October 2016-January 2017, N=2310
When asked whether the different forms of funding provided through Horizon 2020 are relevant
to their needs or not, 76% of consultation respondents agree that grants for collaborative
projects are “fully” or “largely” relevant to their needs, while 49% do so for grants for single
beneficiary projects. Grants are therefore considered by consultation respondents to be the most
relevant forms of funding provided through Horizon 2020, followed by co-funding actions,
prizes, financial instruments and public procurement.
Compared to other respondents, SMEs value more the financial instruments and the grants
for single beneficiary projects. However they seem to be less aware of prizes than other types
of stakeholders.
It is also worth noting that some 8% of the respondents who did not participate in Horizon
2020 underline that they lacked an adequate type of financial support for their work and
15% mention that the programme lacked a relevant area/ topic for their needs (see Figure
2). This therefore suggests that despite increased interest from newcomers, there is still room for
attracting more participants.

18
Figure 11 Are the forms of funding provided through Horizon 2020 relevant to your needs?
Source: Replies to stakeholder consultation questionnaire launched in the framework of the Interim Evaluation of
Horizon 2020, October 2016-January 2017, N=3483
Additional comments provided by survey respondents in the open boxes corroborated these
results. Collaborative grants and the European Research Council stand out as being particularly
relevant to respondents. Some respondents specify that they find grants more relevant than
financial instruments (this applies to research organisations and academia as well as to business
respondents). Some respondents indicate that Horizon 2020 is too costly and the process is too
slow and complex to efficiently meet their needs.
57% of the respondents find the balance between small and large projects in calls for
proposals “good” or “very good”, but 24% of them find it "poor" or "very poor" and 19%
of respondents do not know. In their open comments, consultation respondents ask for more
opportunities for small projects (although some respondents are in favour of more support for
large-scale demonstrators), more prescriptive calls (to decrease the number of applicants); and
more funding opportunities for SMEs.

19
Figure 12 Please rate the balance between small and large indicative project sizes in the
calls for proposals
Source: Replies to stakeholder consultation questionnaire launched in the framework of the Interim Evaluation of
Horizon 2020, October 2016-January 2017, N=2648
A high percentage of respondents agree, to some extent or more, that Horizon 2020
addresses the main citizens’ needs (86% agreement rate), however 37% agree only to some
extent. The least positive respondents are NGOs.

20
Figure 13 Do you think that Horizon 2020 addresses the main citizens' needs in terms of
research and innovation?
Source: Replies to stakeholder consultation questionnaire launched in the framework of the Interim Evaluation of
Horizon 2020, October 2016-January 2017, N=3483
Among the issues listed in the consultation as needed to further maximize the socio-economic
impact of the EU framework programme for research and innovation, four items stand out (i.e.
meaning that more than 30% of respondents strongly agree): i) more room for bottom-up
proposals; ii) more focus on the support for the exploitation of research results; iii) better
access to the programme for newcomers and iv) increased focus on fundamental research.

21
Figure 14 To what extent do you agree that the following issues are needed to further
maximize the socio-economic impact of the EU framework programme for research and
innovation?
Source: Replies to stakeholder consultation questionnaire launched in the framework of the Interim Evaluation of
Horizon 2020, October 2016-January 2017, N=3483
Academia strongly agree with the statement that suggested increasing the focus on bottom-up
research and fundamental research (53% of the total number of academia respondents “strongly
agreed”), whereas 48% of business respondents “strongly agree” with an increased focus on
support to closer-to-market activities, 38% with an increased focus on demonstration and 43%
with an increased focus on supporting the exploitation of research results. 40% of research
organisations also “strongly agree” that more needs to be done with respect to the exploitation of
research results.

22
Figure 15 To what extent do you agree that the following issues are needed to further
maximize the socio-economic impact of the EU framework programme for research and
innovation? Specific issues

23
Source: Replies to stakeholder consultation questionnaire launched in the framework of the Interim Evaluation of
Horizon 2020, October 2016-January 2017, N=3483

24
The consultation’s respondents were asked to share a short, telegraphic testimonial on Horizon
2020. The results were analysed using a word cloud. The most common words used by
stakeholders to express what Horizon 2020 means to them are ‘research’, ‘innovation’, ‘funding,
‘opportunity’, ‘collaboration’, ‘new’, ‘international’, ‘cooperation’ (see below).
Figure 16 Please share with us a short, telegraphic testimonial. What does Horizon 2020
mean to you? What is its main feature?
Wordle®, Source: Replies to stakeholder consultation questionnaire launched in the framework of the Interim
Evaluation of Horizon 2020, October 2016-January 2017, N=1704
B.2.6. Key points / Areas for improvement
To conclude, the respondents to the stakeholder consultation generally:
Agree that Horizon 2020 priorities address the current challenges confronted by the European
Union and are relevant for achieving European objectives (e.g. supporting jobs, growth and
investments and fostering the role of the European Union as a stronger global actor).
Agree that Horizon 2020 supports the latest developments in research and that the
programme’s thematic coverage is flexible enough to cope with changing circumstances.
Participate in Horizon 2020 mainly to access funding, knowledge and expertise, and to
collaborate with European or international partners.
See grants for collaborative projects as the most relevant form of funding for their needs,
compared to financial instruments and public procurement.
Referred to the complexity and length of the funding process.

25
B.3. Effectiveness
B.3.1. Progress towards achieving Horizon 2020's objectives
Stakeholders were asked about the progress of Horizon 2020 in achieving its objectives. The
figure below provides an overview of the results for each of the eight objectives. A more in-
depth analysis for each objective is presented in the subsections underneath.
Figure 17 Do you think that Horizon 2020 is helping to:
Source: Replies to stakeholder consultation questionnaire launched in the framework of the Interim Evaluation of
Horizon 2020, October 2016-January 2017, N=3483
B.3.1.1. EU world-class excellence in science
94% (3279) of the public consultation respondents agree, at least to some extent or more,
that Horizon 2020 helps to foster excellent science. The contribution of the programme to this
objective is assessed very positively, since 36% (1242) of the respondents agree “fully” with this
statement, which is the highest result scored by the statements that were proposed in the
questionnaire.

26
Figure 18 Do you think that Horizon 2020 is helping to foster excellent science?
Source: Replies to stakeholder consultation questionnaire launched in the framework of the Interim Evaluation of
Horizon 2020, October 2016-January 2017, N=3483
B.3.1.2. Fostering European Industrial Leadership
84% (2927) of the public consultation respondents agree, to some extent or more, that Horizon
2020 helps foster European industrial partnerships. Businesses agree more with this statement
(94% of agreement rate) when compared to academia or research organisations (83%).
The contribution of the programme to this objective is assessed positively by a large majority of
respondents, but a comparatively low number of respondents (17%) agree “fully" with this
statement. This is less than the number of respondents who do so for the contribution of the
programme to fostering excellence in science. Also a comparatively large share of respondents
(12%) "don't know" about the Horizon 2020 contribution to this objective..

27
Figure 19 Do you think that Horizon 2020 is helping to boost industrial leadership?
Source: Replies to stakeholder consultation questionnaire launched in the framework of the Interim Evaluation of
Horizon 2020, October 2016-January 2017, N=3483
B.3.1.3. Spreading Excellence and Widening Participation
65% of the public consultation respondents agree fully or to a large extent that Horizon
2020 helps spread excellence and widen participation (and 91% agreed at least to some
extent) in research and innovation across Europe. The agreement level is similar for EU15
and EU13 respondents, but respondents from third countries (72%) and associated countries
(67%) are even more positive. The most positive types of stakeholders are SMEs (73% think it
does fully or to large extent) and individuals (63.4%). NGOs are slightly less positive.

28
Figure 20 Do you think that Horizon 2020 is helping to spread excellence and widen
participation?
Source: Replies to stakeholder consultation questionnaire launched in the framework of the Interim Evaluation of
Horizon 2020, October 2016-January 2017, N=3483

29
B.3.1.4. Generating Science with and for Society
70% of the public consultation respondents agree fully or to a large extent that Horizon 2020 is
helping to support science with and for society (92% agreed at least to some extent). 3.3% do not
agree at all. The most positive respondents are businesses and research organisations, whereas
the least positive are NGO and public authorities.
In addition, 87% (2310) of the public consultation respondents who were funded by Horizon
2020 cooperated with new partners thanks to Horizon 2020 projects and 11% of them did so in
order to involve potential users of the results.
Figure 21 Do you think that Horizon 2020 is helping to support science with and for
society?
Source: Replies to stakeholder consultation questionnaire launched in the framework of the Interim Evaluation of
Horizon 2020, October 2016-January 2017, N=3483

30
B.3.1.5. Generating Science for Policy
87% (3018) of the public consultation respondents agreed, to some extent or more, that
Horizon 2020 helps developing and implementing EU policies, yet a comparatively low
number of respondents (18%) agreed “fully" with this statement, which is less than the number
of respondents who did so for the contribution of the programme to support science with and for
society.
B.3.1.6. Integrating the knowledge triangle of higher education, science, and
education
96% (3279) of the public consultation respondents agree, to some extent or more, that
Horizon 2020 helps building a society and an economy based on knowledge and innovation.
87% (2310) of the respondents who were funded by Horizon 2020 cooperated with new partners
thanks to Horizon 2020 projects, and 1037 of them (45%) declare they have done so to include
specific expertise from another discipline. This result underlines the importance of
interdisciplinary work.
B.3.1.7. Addressing the Major Societal Challenges
The results of the consultation suggest that Horizon 2020’s contribution to addressing the
major societal challenges is assessed more negatively by respondents than its contribution
to the other objectives.
Horizon 2020 scored higher on its contribution to fostering a greater understanding of Europe,
providing solutions and supporting inclusive, innovative and reflective European societies
(Societal Challenge 6), with 79% of respondents agreeing at least to some extent, and on its
capacity to improve the lifelong health and well-being of all (Societal Challenge 1) (78% agree
to some extent, but also 18% think the programme is not helping at all). For all the other
challenges, around 30% of the respondents do not know, which is not surprising given the early
stage of the programme's implementation.
24% of respondents think Horizon 2020 is not helping at all to address the challenge of securing
sufficient supplies of safe, healthy and high quality food and other bio-based products (Societal
Challenge 2). A comparatively lower number of respondents agreed “fully” with the statements
that were provided and more respondents expressed their disagreement.

31
Figure 22 Do you think that Horizon 2020 is helping to address major societal challenges?
Source: Replies to stakeholder consultation questionnaire launched in the framework of the Interim Evaluation of
Horizon 2020, October 2016-January 2017, N=3483
B.3.2. Contribution of Horizon 2020 to Growth, Jobs and Investments
60% of the survey respondents agree "fully" or "to large extent" that Horizon 2020 is
supporting jobs, growth and investments (95% of the respondents think so at least to some
extent). Only 1.7% entirely disagreed.

32
Figure 23 Do you think that Horizon 2020 is contributing to the following priorities of the
European Union? Supporting jobs, growth and investment
Source: Replies to stakeholder consultation questionnaire launched in the framework of the Interim Evaluation of
Horizon 2020, October 2016-January 2017, N=3483
B.3.3. Contribution of Horizon 2020 to the Europe 2020 Strategy
62% of the survey respondents think that Horizon 2020 is helping fully or to a large extent to
‘implement the Europe 2020 strategy, the EU’s strategy for jobs and smart, sustainable and
inclusive growth’ (90% of the respondents think so at least to some extent). Only 2% do not
share this view at all. In addition, 72% of the respondents think that Horizon 2020 is helping
fully or to a large extent to build a society and an economy based on knowledge and innovation.
For both options, the least positive respondents are umbrella organisations representing research
organisations and NGOs.

33
Figure 24 Do you think that Horizon 2020 is helping to implement the “Europe 2020”
strategy, the EU’s strateagy for jobs and smart, sustainable and inclusive growth?
Source: Replies to stakeholder consultation questionnaire launched in the framework of the Interim Evaluation of
Horizon 2020, October 2016-January 2017, N=3483

34
Figure 25 Do you think that Horizon 2020 is helping to build a society and an economy
based on knowledge and innovation?
Source: Replies to stakeholder consultation questionnaire launched in the framework of the Interim Evaluation of
Horizon 2020, October 2016-January 2017, N=3483
B.3.4. Contribution of Horizon 2020 to the achievement and functioning of the
European Research Area
75% of the respondents to the stakeholder consultation think that Horizon 2020 is fully or to a
large extent ‘helping to support the development of the European Research Area, a unified area
open to the world, in which scientific knowledge, technology and researchers circulate freely’
(94% think so at least to some extent). Only 2.2% do not share this view at all. The least
positive respondents are umbrella organisations representing businesses and NGOs.

35
Figure 26 Do you think that Horizon 2020 is helping to support the development of the
European Research Area, a unified area open to the world, in which scientific knowledge,
technology and researchers circulate freely?
Source: Replies to stakeholder consultation questionnaire launched in the framework of the Interim Evaluation of
Horizon 2020, October 2016-January 2017, N=3483
B.3.5. Key points / Areas for improvement
To conclude, the respondents to the stakeholder consultation generally:
Agree that Horizon 2020 contributes to achieving the Europe 2020 strategy and the European
Research Area.
Agree that the programme is effective in achieving its own objectives, for instance in
fostering excellent science.

36
Agree to a lesser extent that Horizon 2020 is boosting European industrial leadership,
compared to other objectives.
Agree that the programme is having at least some impacts, but the rates of disagreement
increase when asked about the programme’s contribution to addressing a set of societal
challenges
B.4. Efficiency and use of resources
Satisfaction with the programme is high among respondents: 78% (2732) state that they are very
satisfied or satisfied with the programme. Comparatively, a higher number of NGOs are
dissatisfied with the programme (20%) and a higher number of businesses (25%) are very
satisfied with the programme. EU13 countries express a higher level of dissatisfaction (18%),
while 25% of third-country respondents are very satisfied with the programme. The satisfaction
rate reaches 88% among the participants in Horizon 2020, but decreases to 49% for the
respondents who have not participated in the programme.
Figure 27 Overall are you so far satisfied with Horizon 2020?
Source: Replies to stakeholder consultation questionnaire launched in the framework of the Interim Evaluation of
Horizon 2020, October 2016-January 2017, N=3483
B.4.1. Programme's management and use of resources
B.4.1.1. New management modes
For 73% (1927) of the respondents, the support provided by the EC services (including
agencies) during grant preparation and implementation was either “very good” or “good”.

37
Figure 28 Please rate Horizon 2020 implementation aspects for support provided by the EC
services (including agencies) during grant preparation and implementation
Source: Replies to stakeholder consultation questionnaire launched in the framework of the Interim Evaluation of
Horizon 2020, October 2016-January 2017, N=2648
The analysis of the open responses also reveals some testimonials of good working relationships
with European Commission project officers. However some of the respondents who described
this relationship underline the delays they experience in receiving answers to their requests from
the project officers, while a few others ask for more personalised support from the agencies.
Additionally, a few respondents specifically comment on "New management modes" in their
open responses to questions on the efficiency and implementation of the programme.
B.4.1.2. Use of resources
89% of respondents “strongly agreed” or “agreed” that an increased budget was needed
for financing research and innovation at EU level.
Figure 29 To what extent do you agree that increased budget for financing research and
innovation at EU level is needed to further maximize the socio-economic impact of the EU
framework programme for research and innovation?
Source: Replies to stakeholder consultation questionnaire launched in the framework of the Interim Evaluation of
Horizon 2020, October 2016-January 2017, N=3483

38
For 21% of respondents the frequency of use of a two-stage procedure in evaluating proposals is
“poor” or “very poor”.
Furthermore, in the open comments, some stakeholders call for a more competitive selection
process at the first stage of the two-stage application process. Given the competitiveness of
Horizon 2020 funding, they feel high-quality projects are not being funded, and this could reduce
the number of proposals submitted at second stage and mitigate the risk of “wasting” time in
developing proposals. In this respect, a large number of open comments deal with
oversubscription and the low success rate caused by the high number of (good) proposals given
the limited amount of funding. This is further illustrated by the fact that, out of the 835
respondents who did not participate in Horizon 2020, 194 explain that the main reason is the
success rates that are too low to be worth applying. This item is the most common explanation
for non-participation for respondents who have never applied for Horizon 2020 funding (see
Figure 2).
Figure 30 Please rate the following Horizon 2020 implementation aspects: frequency of use
of 2-stage procedures in evaluating proposals
Source: Replies to stakeholder consultation questionnaire launched in the framework of the Interim Evaluation of
Horizon 2020, October 2016-January 2017, N=2648

39
B.4.2. Programme's implementation
B.4.2.1. The impact of simplification and the new funding model
Out of the 835 respondents who did not participate in Horizon 2020, 106 explain that the
main reason is that the Horizon 2020 project implementation rules are cumbersome.
The analysis of open answers confirm this result. While some respondents (participants as well
as non-participants) acknowledge that progress has been made, many mention that further
simplification is needed. Many note that more could be done in terms of simplification, for
instance regarding cost reimbursement and further simplification of the process and acceptance
of organisations’ accounting practices. However, 65% (1732) of the survey respondents to a
closed question note that the acceptance of organisations’ accounting practices in the programme
is “good” or “very good” and 18% (475) view it as “poor” or “very poor”.
Some respondents also note that the rules are different from one call to the other and recommend
more standardisation. Others point to a proliferation of funding and instruments that hamper their
ability to grasp the broader picture and apply for the funding that is most tailored to their needs.
Some additional ideas that were identified during the analysis of the responses to open questions
concern the need to diminish the administrative burden experienced by participants of the
process and to promote more flexibility. For example, by allowing for some adjustments during
the implementation of the projects (e.g. one respondent noted it is not possible to work with a
third party who was not a formal project partner at the project start).
The respondents also elaborate on the imbalance between the need for control and the
importance of trust. Some argue that the European Commission needs to focus on the quality of
project outcomes rather than paperwork, while others propose that past participations in the FPs
or a track record at the national level should be used as a proof that participants can be trusted.
Many comments deal with the high amount of time spent on reporting. Despite these comments,
a majority of respondents find the balance between control and trust of beneficiaries (71.5%,
1894) and the mechanisms for reporting and monitoring (79%, 2091) “good” or “very good”.
B.4.2.2. Mobilisation of stakeholders
This topic was covered through consultation questions that relate to the efficiency, transparency,
clarity and flexibility of the processes to attract participants.
More than 80% of the respondents agree that the time taken to sign a grant agreement and to
evaluate the proposal is either “good” or “very good”. 21% to 22% find that the communication
activities to attract applicants are “poor” or “very poor”. Furthermore, 62% (1647) of the
respondents assess the quality of the feedback from the evaluations as “good” or “very good”,
while 34% (905) judge it is “poor” or “very poor” (which is the highest score reached by the
“poor” and “very poor” categories compared to the other items related to the implementation
aspects of Horizon 2020 on which respondents were asked questions).

40
Figure 31 Please rate the following Horizon 2020 implementation aspects
Source: Replies to stakeholder consultation questionnaire launched in the framework of the Interim Evaluation of
Horizon 2020, October 2016-January 2017, N=2648
In their feedback to open questions, many respondents asked for more transparency and an
improved quality in the feedback they received. Some respondents complained that not enough
details were provided, that the quality of the feedback varied greatly from one evaluation panel
to the other, and that discordant views could be provided to the participant. The selection of
experts for proposal reviews was also questioned by a few; with some participants stressing that
expertise in the field was not always available. Some mentioned that evaluations should not only
take place remotely.
B.4.3. Geographical dimension
The geographical dimension was covered in the survey questions that related to the non EU-
countries' and non-associated countries’ participation. The figure below suggests that the
majority of respondents from these countries were rather satisfied with the communication on
Horizon 2020 in their countries, with 69% (42) having “agreed strongly” or “agreed” that
communication activities helped them find out about the programme and that it was easy to find
calls which were relevant to their area (strong agreement or agreement of 62% (38) of the
respondents). 45% (27) felt that it was easy to find calls that encourage the participation of non-
EU and non-associated country partners and 43.4% (26) “disagreed” or “disagreed strongly”
with this statement.

41
Figure 32 If your organisation is established in a non-EU, non-associated country, to what
extent do you agree with the following statements?
Source: Replies to stakeholder consultation questionnaire launched in the framework of the Interim Evaluation of
Horizon 2020, October 2016-January 2017, N=61
In their open comments on the relevance of and the issues at stake for the programme, some
respondents from third countries as well as respondents from EU-countries explicitly referred to
the need to increase the possibility for third countries to take part in Horizon 2020.
B.4.4. Cost-benefit analysis
The consultation’s respondents were asked about the costs of participating in Horizon 2020
compared to previous or other international programmes. The interpretation of the results has to
take into account the high percentage of respondents (over 30%) who declared they could not
respond due to a lack of knowledge of previous or other programmes. This set aside, the results
suggest that slightly more respondents think that the costs of participating in Horizon 2020
compared to FP7 had decreased rather than increased with the simplification measures that have
been implemented by the European Commission. 20% (521) of the respondents shared the view
that the costs of participating in Horizon 2020 are lower than in the previous FP7, 14% (364) felt
they are higher and 36% (950) felt they are similar. A more detailed analysis indicates that
comparatively business have a slightly better opinion of the costs of Horizon 2020 than research
organisations. While 20% of research organisations found the costs of Horizon 2020 higher than
FP7, only 10% of the business did so (and 7% of the SME respondents).

42
Figure 33 Level of costs of participating in Horizon 2020 compared to the 7th
Framework
Programme as a result of the simplification measures
Source: Replies to stakeholder consultation questionnaire launched in the framework of the Interim Evaluation of
Horizon 2020, October 2016-January 2017, N=3483
Keeping in mind that a high percentage of respondents (34%) declare they could not respond due
to a lack of knowledge of other programmes, the majority of those who responded assess the
costs of participating in Horizon 2020 as similar to other international research and innovation
programmes (see Figure 33). Going into further detail, 25% of research organisations say that the
costs of Horizon 2020 are higher than for other international programmes, while only 15% of
business (and 14% of the SMEs) do so. More specifically there are slightly more SMEs that,
overall, find that the costs of participating to Horizon 2020 are lower than other similar
international research and innovation programmes (19%) than SMEs judging these costs higher
(17%). 21% of the respondents from associated countries share the view that Horizon 2020 is
more costly than international programmes. Overall, the results seem to suggest that EU13
respondents and newcomers do not feel that the costs are higher compared to other respondents.
They even seem to have a more positive opinion about the costs of the programme (e.g. 18% of
EU15 respondents and only 11% of EU13 respondents find the costs of Horizon 2020 higher
than the costs of other international programmes).

43
Figure 34 Level of costs of participating in Horizon 2020 compared to those of other similar
international research and innovation programmes
Source: Replies to stakeholder consultation questionnaire launched in the framework of the Interim Evaluation of
Horizon 2020, October 2016-January 2017, N=2648
B.4.5. Key points / Areas for improvement
To conclude, the respondents to the stakeholder consultation generally:
Are satisfied with the programme. The support provided by the European Commission is
appreciated, although there is some criticism of the externalisation of grant management to
executive agencies. Some stakeholders reported delays in getting in touch with project
officers and asked for more personalised support and an improvement in the quality of
evaluation feedback.
Agree that an increased budget was needed for financing research and innovation at EU
level.
Assess the cost of participation to be lower than in previous programmes but noted there is
room for further decreasing the costs. Simplification measures are welcomed (processes are
efficient) but the administrative burden is still high for some respondents. Further
simplification (in terms of cost reimbursement for instance) is an area for improvement.

44
Note that there is room for improvement in the standardisation between the different calls
and the information and communication activities to attract applicants (dispersion of
information, lack of explanatory documents).
Prefer a ‘real’ two-stage application processes (in which proposals would be thoroughly
selected at the first stage) to address the oversubscription issue.
B.5. Coherence
B.5.1. Internal coherence within the Framework Programme
B.5.1.1. Coherence between the implemented actions
71% of the respondents agree that combining different forms of support for research and
innovation into one single programme better address stakeholder needs than having
separate programmes.
B.5.1.2. Coherence between Horizon 2020 intervention areas
76% of the respondents agree that the increased use of calls for cross cutting activities and
interdisciplinary is a positive feature in the programme (see Figure 35). 66% find that the
different parts of Horizon 2020 complement each other but only 46% agree that there is more
coherence and synergies in Horizon 2020 than in the FP7 (a large share of stakeholders (44%)
don't know). More academia and research organisations subscribe to these last two statements
than businesses and NGOs.
Figure 35 To what extent do you agree with the following statements regarding the internal
structure of Horizon 2020?
Source: Replies to stakeholder consultation questionnaire launched in the framework of the Interim Evaluation of
Horizon 2020, October 2016-January 2017, N=3483
The majority of respondents agree that to increase the socio-economic impact of EU Framework
Programmes for research and innovation, there is a need for more cross-cutting calls (16.8%
disagree), more focus on capacity-building activities for R&I (15% disagree) and increased
coordination/synergy with other programmes (23% disagree). More than 30% of NGOs and
public authorities are in favour of more cross-cutting calls. However only 23% of research
organisations, 22% of academia and 16% of business feel this is needed.
45
Figure 36 To what extent do you agree that the following issues are needed to further
maximize the socio-economic impact of the EU framework programme for research and
innovation?
Source: Replies to stakeholder consultation questionnaire launched in the framework of the Interim Evaluation of
Horizon 2020, October 2016-January 2017, N=3483
B.5.2. Coherence with other EU initiatives
The results of the consultation survey are difficult to interpret as most respondents feel they were
unable to answer because of their lack of familiarity with other initiatives, which explains the
high number of respondents having ticked the “I don’t know” box.
B.5.2.1. The European Structural and Investment Funds
Of the respondents who were able to provide an opinion, 15.6% find that Horizon 2020 and the
European Structural and Investment Funds complement each other and 12% judge that they work
in synergy (despite the existence of overlaps for 2.7% of the respondents) (cf. Figure 37).
B.5.2.2. The European Fund for Strategic Investments (EFSI)
For respondents who were able to provide an opinion, 10.4% find that Horizon 2020 and the
European Fund for Strategic Investments complement each other and 6.7% judge that they work
in synergy (despite the existence of overlaps for 1.8% of the respondents) (see Figure 37 below)..
B.5.2.3. Other EU initiatives
Among other programmes, Erasmus+ is assessed as the most complementary to Horizon 2020
(28% of respondents assess positively the complementarity between the two programmes) and
8% of respondents judge that they work in synergy (despite the existence of overlaps for 2% of
the respondents).

46
Figure 37 The European Commission implements several funding programmes.
How would you describe the linkages between Horizon 2020 and the following
programmes?
Source: Replies to stakeholder consultation questionnaire launched in the framework of the Interim Evaluation of
Horizon 2020, October 2016-January 2017, N=3483
Additional comments provided by the respondents suggest that the funding architecture is seen
as too complex and prevents organisations from identifying the calls and instruments that are
best fitted to their needs. Promoting synergies at project level is said to be very difficult and not
always realistic, given the fact that the rules and procedures are not standardised across different
EU funding programmes. Some recommendations include a joint funding of projects by different
instruments or funding of cross-project networking activities.
B.5.3. Key points / Areas for improvement
To conclude, the respondents to the stakeholder consultation generally:
Agree that combining different forms of support for research and innovation into one single
programme is better for addressing their needs than having separate programmes.
Agree that the programme should increase the use of cross-cutting activities to further
maximize its socio-economic impact.. Respondents also note that the coherence between the
different parts of Horizon 2020 improved compared to the previous Framework Programme.
Indicate that more could be done to simplify the funding landscape and make it easier for
participants to identify the call(s) that best fit their needs.
Lack knowledge of other, complementary funding opportunities at the EU level which
indicates that synergies with other EU programmes could be very limited.

47
B.6. EU added value
For 63% (2176) of the respondents the added value of Horizon 2020 is higher than that of
national and/or regional programmes for research and innovation (see Figure 38 below).
Research organisations and business respondents have the highest rate of agreement (66% and
65% respectively), while the agreement rate is lowest for public authorities (56%) also because
many note that they "don't know".
Figure 38 How do you rate the overall added value of Horizon 2020 compared to national
and/or regional level research and innovation programmes in EU Member States?
Source: Replies to stakeholder consultation questionnaire launched in the framework of the Interim Evaluation of
Horizon 2020, October 2016-January 2017, N=3483
Furthermore, out of the 835 respondents who did not participate in Horizon 2020, a rather low
number prefer participating in other regional/ national programme (63 respondents) or in other
European or international programmes (30 respondents).
For respondents, the main added value of participating in Horizon 2020 compared to national
and/or regional research and innovation programmes is cooperation with partners from other
countries, followed by improved international visibility and the financing of the projects that
otherwise would not be supported (see below).

48
Figure 39 What are the main expected benefits of participating in Horizon 2020 compared
to national and/or regional research and innovation programmes in EU Member States?
Number of respondents per option (1-5 answers)
Source: Replies to stakeholder consultation questionnaire launched in the framework of the Interim Evaluation of
Horizon 2020, October 2016-January 2017, N=3483
In terms of effectiveness, respondents strongly agree with statements suggesting that Horizon
2020 strengthens the quality and visibility of research in the EU. For 1908 respondents, the
programme contributes to improving international visibility and 1,357 are confident it improves
excellence in research and innovation. In their open comments, respondents also outline the
visibility and reputation they gain from being selected for funding. Horizon 2020 is qualified as a
“prestigious” programme that set high standards for research and innovation in Europe and could
lead to career development or help organisations to attract top researchers.
In terms of efficiency, for 1,076 respondents, the programme strengthens critical mass to address
pan-European challenges. In their open comments, respondents go as far as saying that Horizon
2020 promotes trust between partners and a more coherent and integrated Europe through shared
goals and joint work. 1,574 respondents highlights that it finances projects that otherwise could
not be supported at national or regional level. 788 respondents state that European funding is all
the more important given that the reimbursement of costs is higher than in national / regional
programmes. Within the open responses, some respondents also outline that 100% cost funding
for SMEs is a major incentive to participate (although it should also be noted that a few
comments were against full reimbursement of costs).
In terms of synergy, Horizon 2020 is said to contribute to strengthening interdisciplinary
cooperation (by 1147 respondents) as well as cooperation between academia and the private
sector (873 respondents). Additional comments provided by respondents suggest that the
programme offers opportunities (qualified by some respondents as “unique opportunities”) to
access new partners and new expertise, and to work with the best and internationalise their
activities. It promotes a more integrated vision of the research and innovation system, one that

49
links together academia, business and SMEs. Working with different types of organisations and
across different countries fosters cross-cultural experiences (to the benefit of young researchers
more particularly), thus encouraging the confrontation of different points of views, stimulating
ideas and fostering creativity and the emergence of disruptive ideas.
To provide a further analysis of the programme's added value and additionality, respondents
were asked what would be the impact if EU support to research and innovation (Horizon 2020
and its possible successor) were to be discontinued. According to the basic analysis that was
carried out, very few of the respondents judge that a discontinuation of the framework
programme would only have a limited impact on their organisation and most of the ones who do
are NGOs and public authorities (a few businesses, very few academia organisations). Overall,
the discontinuation of the programme would be judged as “catastrophic”, “devastating” “a
nightmare”, or a significant “drawback”.
Potential negative impacts are numerous and vary based on the dependence of the organisation to
Horizon 2020 funding:
The impacts would be worst for business whose activities are very much dependent on EU
funding, as a programme’s discontinuation would result in a reduction in scope or even in a
discontinuation of research and innovation activities, less or slower product development and
it could reduce business activities and staff (one business even indicates this would mean
moving its research activities outside of the EU and, for another, that it would question its
viability as a business).
For academia and research organisations, it would mean less funding for fundamental,
interdisciplinary, risky and disruptive research, less drive to cooperate and less international
contacts, less exposure to new knowledge and more limited capacity to anticipate new trends,
less learning and exchange of ideas, less ability to carry out high level research and a
withdrawal into national research capacities hence losing the ability to create critical mass at
the European level. It could lead to the disappearance of existing networks since a stable
framework would no longer be available to support joint work. Ultimately, this could be a
drawback for research and innovation in the EU, affecting the ability of Europeans to carry
out top research and to address global challenges, thus resulting in a loss of competitiveness
and international visibility of the EU on the international research and innovation stage.
B.6.1. Key points / Areas for improvement
To conclude, the respondents to the stakeholder consultation generally:
Judge the added value of Horizon 2020 to be higher than that of national and/or regional
programmes for research and innovation.
Indicate that the cooperation with international partners is a key feature of Horizon 2020’s
added value.
Agree that the additionally of the programme is strong and feel that a possible
discontinuation of the programme would have strong negative impacts, which would extend
far beyond a simple reduction of research and innovation funding for their organisations.
B.7. Areas for future consideration
Stakeholders were asked to choose up to 5 Sustainable Development Goals on which the future
EU framework programmes for research and innovation should focus. Six areas top the list
where each area is selected by more than 1,000 respondents: i) Combat climate change and its
impacts; ii) Healthy living and well-being at all ages; iii) Affordable, reliable, sustainable and

50
modern energy for all; iv) Inclusive and quality education for all and lifelong learning; v)
Inclusive and sustainable economic growth, employment and decent work for all; and vi)
Resilient infrastructure, sustainable industrialisation and innovation.
Figure 40 Please choose up to 5 Sustainable Development Goals on which, in your opinion,
the future EU framework programmes for research and innovation should focus. Number
of respondents per option
Source: Replies to stakeholder consultation questionnaire launched in the framework of the Interim Evaluation of
Horizon 2020, October 2016-January 2017, N=2648
Respondents were also asked to state what is for them the most important area/ topic to be
addressed by the EU framework programmes for R&I. The results are broadly in line with the
above findings. The most frequent words quoted are climate change (190 times), health (188
times), society/ societal (139 times) and social (73 times), inclusive (100 times), growth (99
times), education (87 times), and environment (83 times). The topics of safety (69 times) and
security (59 times) also emerge strongly.

51
Figure 41 In your opinion, what is the most important issue/problem/opportunity to be
addressed by the EU framework programmes for research and innovation? Indicate one
area/topic.
Wordle®, Source: Replies to stakeholder consultation questionnaire launched in the framework of the Interim
Evaluation of Horizon 2020, October 2016-January 2017, N=191
B.8. Position Papers
387 position papers were received as part of the stakeholder consultation exercise. After the first
screening and the removal of duplicates and documents that were not addressing the Horizon
2020 programme directly (e.g. promotional material), 296 papers were retained and analysed
internally by the European Commission services.
The analysis followed a qualitative method of approach. Based on a sample of 20 position
papers, a coding frame of 18 broad themes was constructed. Based on the frame, the European
Commission developed a template to ensure a systematic and comparative analysis across the
group of officials reading the papers. Each piece of text of every position paper was then
categorised under one or more of the 18 broad themes. The final analysis per theme and any
emerging sub-themes was conducted by a stakeholder group: academia, research organisations,
public authorities, businesses, NGOs, individuals, international stakeholders (i.e. non-EU
Member States) and others.
More than 7,000 pages were submitted by stakeholders in the form of position papers.
The figure below shows the most common words used in the analysed stakeholders’ input.

52
Figure 42 Most common words used in the analysed stakeholders' input
Source: Position papers, N=296.
The analysed position papers submitted by stakeholders for the Interim Evaluation of Horizon
2020 include:
89 (30%) position papers submitted on behalf of an "umbrella" organisation of EU
interest;
185 (63%) position papers submitted on behalf of a single institution or a company; and
22 (7%) position papers submitted by individuals.
The majority of the position papers were submitted by stakeholders from EU15 countries 68%
(202 position papers), whereas from the EU13 only stakeholders from Poland, Estonia and
Slovenia submitted their position papers (4%, 11 position papers). 9% (27 position papers) were
received from international stakeholders including Norway, Switzerland, Israel, Chile, Turkey,
USA and international organisations.
The representation of the position papers according to the stakeholder group (self-reported) and
country is provided in figure below.

53
Figure 43 Overview of stakeholder groups (left) and countries (right) represented in the
selected 70 position papers
The remainder of the section summarises main views expressed in position papers with the
following structure:
The role of Horizon 2020 in policy priorities;
Design of Horizon 2020;
Implementation of Horizon 2020;
EU added value;
Views or recommendations specific to a future European Innovation Council; and
Overall comments regarding impact, openness (3Os) or excellence.
B.8.1. Role of Horizon 2020 in policy priorities
Horizon 2020 is addressing policy priorities of Europe but there is room to increase programme flexibility.
The majority of stakeholders representing different stakeholder groups commented on the role of
Horizon 2020 in policy priorities. More than half of those who commented depict a positive
view of the contribution of Horizon 2020 to current policy priorities. For instance, stakeholders
note that:
Horizon 2020 is tackling Europe's current challenges by contributing directly to
competitiveness which leads to increased jobs and growth. They wrote that Horizon 2020
is "key", "crucial" and "a step towards" the implementation of the Europe 2020 strategy.
A few respondents highlighted the contribution of Horizon 2020 to the realisation of the
European Research Area (ERA) by funding collaborative research, trans-national
infrastructure and mobility.
Businesses that addressed this point specifically highlighted that the (societal) “challenge
driven” research and innovation approach of Horizon 2020 and the fact that the
programme covers the whole innovation chain is crucial for a competitive European
industry.

54
The international stakeholders that addressed this point also mention that Horizon 2020
plays a role that and should be further strengthened in addressing challenges that are of a
global nature (i.e contributing to COP21, the UN Agenda for Sustainable Development).
Similarly a few research organisations noted that there is a potential for Europe to
become a stronger global actor if Europe manages to properly address Sustainable
Development Goals or concentrate its research efforts into few/less priorities.
A few stakeholders also commented on the programme's flexibility and stated that improvements
are needed mainly regarding Horizon 2020's flexibility with respect to changing priorities. One
research organisation noted that the rapid response to emerging areas such as migration, Ebola
and Zika is a good practice example of the flexibility of the programme that could be applied to
other parts of the programme. An NGO suggested parts of the budget could be reserved for such
changing priorities.
B.8.2. Design of Horizon 2020
The current pillar structure improves the clarity of the programme but linkages among the pillars should be enhanced.
Almost half of the stakeholders commented on the current programme structure. Half of those
commenting have a positive view of the three pillar structure. They see it as a pragmatic and
easy way to clarify the goals of different programme priorities.
Others indicated that the coherence and linkages between activities and projects under the three
pillars could be strengthened. In particular, they mentioned a need for better links between the
excellent research supported under Pillar 1 and topics in Pillars 2 and 3. To enhance such
linkages, one representative of academia, for instance, suggested to extend the principle of ERC
proof of concept grants across the entire programme. It was suggested that cross-pillar
innovation should be enabled and ensured by the Work Programmes by, for example, giving a
preferential score for proposals that build on previous project results.
Grants should remain the primary funding instrument of Horizon 2020. Funding should not divert to loan based financing under the EFSI.
A few stakeholders including those representing academia, research organisations, public
authorities, international stakeholders as well as businesses, explicitly stated that grants should
remain the primary funding instruments under Horizon 2020. In their opinion:
Horizon 2020 funding should not be used for loans under the EFSI;
Not all R&D is viable on a short to medium term despite high potential for long term
impacts. Grants are the most suitable government support instruments for risky cutting
edge programmes with long term pay back. For instance an industry representative noted
that manufacturing companies participate in Horizon 2020 because of their desire to share
this risk; and
Research entities such as academia and research organisations are legally not allowed to
take loans.

55
The programme is complex and there is a need to streamline. Several instruments under Horizon 2020 work particularly well such as the ERC and MSCA grants. Some new instruments could be further improved.
A few stakeholders expressed their concerns about the complexity of the Framework
Programme. They believe that the policy mix of the overall programme should be simplified: the
number of instruments should be limited, their intervention logic clearly defined, and
complementary/synergies with other instruments well stated.
Public authorities that commented on the instruments mainly noted that the collaborative projects
and grants were preferred over other types of projects and loans. Some of them had a positive
view specifically of instruments bringing together states and regions such as the public-public
partnerships, cofund schemes and ERANETs, INNOSUP and MSCA.
Some stakeholders from academia and research organisations also depict a very positive view of
the current set of instruments fostering excellent science in particular the ERC and MSCA
grants. For instance, a representative from academia wrote that "the ERC is the single most
successful EU research funding instrument ever" due to reputational effects and the recognition
of bottom-up science.
Furthermore some representatives of the business community specifically commented on the
Joint Technology Initiatives (JTIs), Joint Undertaking (JUs) and the contractual Public Private
Partnerships (cPPPs). They noted that Horizon 2020 provides a ring-fenced budget to PPPs, JTIs
and other industry initiatives which is in particular beneficial for the industries that are
represented by, or are a member of, such initiatives. Besides giving access to a reserved budget,
these initiatives also enable the respective industries to be closely involved in the definition of
the research and innovation priorities of the initiative through the drafting of the Strategic
Research Agenda and in the definition of the call topics. The initiatives are seen as promising
tools to increase the introduction of a R&D&I application in real markets. Other benefits
mentioned are the fruitful collaboration possibilities between the different players in the
respective industries (bringing together both SMEs and large companies) and the creation of
scientific networks amongst them.
In addition, some SME and business representatives commented on and welcomed the inclusion
of innovation activities in Horizon 2020. They see the introduction of the SME Instrument as a
good opportunity for high-innovative and market ready SMEs. However, one research
organization noted that the SME instrument should be opened up to allow for collaboration with
universities.
A few international stakeholders included comments and suggestions regarding the financial
instruments, on average being relatively critical and requesting improvements.
Finally, a small number of stakeholders discussed the Seal of Excellence (SoE) initiative4. A few
stakeholders praised the initiative, whereas others pinpointed the need to review its effectiveness.
NCPs in particularly highlighted that the SoE is difficult to put into practice. One of the major
obstacles is the state-aid rules and the different funding principles within the Member States.
4 This quality label is awarded to project proposals which were submitted for funding under Horizon 2020 and have passed
stringent selection award criteria but could not be funded due to budget constraints. As such the SoE aims to highlight proposals
which deserve funding from alternative sources such as public, private, national, regional, European or international.

56
Horizon 2020 needs to ensure a good balance between research and innovation support (in Technology Readiness Levels). Concerns are voiced over the perceived increase in the funding of higher TRL levels to the detriment of collaborative lower TRL research.
Almost half of the stakeholders commented on the balance between research and innovation
support. The majority of those who commented stated that the programme needs to ensure a
good balance between research and innovation. By stakeholder group, the majority of
stakeholders from academia, research organisations and public authorities, indicated that
currently Horizon 2020 seems to be moving away from funding basic, collaborative and frontier
research. They believe there is a need to close the gap in funding lower technology readiness
levels (TRL) to create the ground breaking technological foundation for innovation. Only
business representatives are positive about the shift towards innovation that took place under
Horizon 2020. But still, a few pointed to the current lack of projects at the level of TRLs 3 to 5
under Horizon 2020.
Research organisations that commented on these issues were critical about the emphasis on
higher TRLs and the ‘unbalanced’ relation between basic and applied research funding. They
urge the European Commission to keep the number of calls and budget allocated to basic
research at the current level. Similarly, academic stakeholders unanimously denounced a shift
towards innovation that they do not see as justified for two main reasons: higher TRL research is
funded by companies and relies on other forms of finance; and public research grants and
funding for 'high TRL' research will result in less disruptive, radical innovation.
More than half of the public authorities commented on the TRL levels. Of those who commented
half noted that more support should be given to lower TRLs. Only one Swedish region advocated
strongly for higher TRLs e.g. for close-to-market activities.
There is also a clear message from international stakeholders that expressed an opinion that the
inclusion of innovation activities in Horizon 2020 (as opposed to the previous Competitiveness
and Innovation Programme, which ran from 2007 to 2013 in parallel to FP7) is in the right
direction but that it should not be done at the expense of funding for basic research. Therefore, it
is requested that the focus be on lower TRL levels, closer to basic research.
Half of the business respondents that expressed a view are positive about the shift towards more
innovation funding that took place under Horizon 2020. Still, a few business respondents pointed
out the current lack of TRL 3-5 projects under Horizon 2020.
Social science and humanities (SSH) need to be better integrated in the programme design.
Some stakeholders representing different types of organisations mentioned that social science
and humanities (SSH) are currently not adequately integrated into the programme specifically in
Pillar 2 and 3. Some stakeholders stressed that the SSH have an equal capacity to solve the
challenges of society today as the natural sciences. In their opinion, the SSH need to be better
integrated into the design of work programmes, into the description of calls and into project
evaluation (i.e. ensure at least one evaluator has an SSH expertise). None of the position papers
submitted by businesses addressed this issue.

57
The transnational and multi-sectorial approach for excellent research and innovation is working well.
Some stakeholders including academia, research organisations, public authorities and NGOs
commented on the transnational and multi-sector collaborative approach for excellent research
and innovation and perceive it as an "attractive" and "successful" method and "the backbone" of
Horizon 2020.
A few research organisations that commented on collaborative approaches depict a positive
view. For some of them, the links between natural sciences and the human and social sciences
seem to be very important. Others highlighted the benefits of research involvement in, for
instance, risk detection and development and validation of standards. Similarly, a few public
authorities that commented on the interdisciplinary approach in Horizon 2020 noted that it is
welcomed and should be continued, even in the case where some participants (e.g. SMEs) may
need help to deal with such an approach. Almost half of the NGOs appreciate the integration of
the collaboration and several positions from academia remarked on the benefits of collaborative
research.
Very few representatives from the business community commented on the topic of collaboration
and their opinions differ. On the one hand a few business representatives expressed a positive
opinion and the need for collaborative and interdisciplinary projects to bring solutions to societal
challenges. On the other hand, few suggested that these large collaborative projects need new
tools to manage and to safeguard relationships between partners that are created.
Furthermore, a few international stakeholders mention that the streamlining of international
cooperation in Horizon 2020 is not effective and that the participation of third countries in the
programme should be enforced.
Stakeholders have different opinions on the degree and appropriateness of their involvement in the design of Horizon 2020.
Some stakeholders commented on the degree of their involvement in the design of Horizon 2020
and its activities, but their opinions differ:
Of those commenting, some stakeholders representing different types of stakeholder groups have
a positive view on the current level of involvement and see the agenda-setting process as
contributing to a comprehensive and widely-supported programme;
Several others, however, noted that the current design of the Work Programmes is not
transparent and that processes vary in different parts of the programme. In general, organisations
found the involvement of stakeholders from their particular field to be lacking. For instance,
among others, the following issues were highlighted:
Inadequate coordination with the Member States specifically mentioned by Germany and France
but also from stakeholders in academia;
Estonia as well as one SME noted that larger players seem to have more influence on the
research programme and the call topics; and

58
A few stakeholders that commented on this issue from industry and the business community
noted they are not well represented in the Horizon 2020 projects, working groups, advisory
groups and committees (below 20%).
B.8.3. Implementation of Horizon 2020
Oversubscription is one of the most commonly quoted issues of Horizon 2020.
The majority of stakeholders touch upon the issue of oversubscription in Horizon 2020. In
general they consider that oversubscription discourages participation, reduces the quality of
evaluations, 'wastes' too many resources and leaves a number of high quality proposals
unfunded.
Stakeholders proposed a variety of solutions on how to reduce oversubscription rates:
Increase budget specially for the bottom-up calls to better meet the demand;
Reduce scope of calls;
Improve and expand the two-stage proposal procedure with the success rates at the
second stage reaching 30% to 50%. Increase the time between the first and the second
step so that proposers receive negative feedback before preparing their submission to the
second step. Make the first step lighter. Evaluators between the two stages should remain
the same to ensure continuity and coherence in the evaluation process. A few respondents
noted that the current introduction of a two-stage proposal procedure to manage
oversubscription in certain calls is welcomed, but that the process is not selective enough
in the first stage.
The quality of current evaluation process of Horizon 2020 calls should improve.
Some stakeholders from academia, research organisations as well as public authorities and
business commented on the evaluation process and noted that the quality of the current process
should be improved. A variety of issues was highlighted, in particular:
The Evaluation Summary Reports are reportedly too short and provide generic and not
tailored feedback. In particular, applicants would like to receive better feedback in
between steps in two-stage procedures. Some stakeholders suggested that a lack of
feedback partially caused the oversubscription issue of the programme.
A few business representatives further noted that the selection rules of expert panels
should be clarified and made transparent.
Excellence should remain the main driver of Horizon 2020 and subsequent programmes.
Some stakeholders representing different stakeholder groups underlined that excellence should
remain the highest priority and the driving principle of Horizon 2020.

59
Widening participation is crucial, but should not come at expense of excellence.
Some stakeholders representing different stakeholder groups commented on the need for a more
balanced participation of different stakeholders in the Horizon 2020 programme and in general
welcomed the "Spreading excellence and widening participation" activities of the programme.
Most commonly, stakeholders mentioned low participation rates of EU-13 countries due to their
lower research and innovation capacities. However, there seems to be an agreement that this
issue should not be addressed by changing the nature of the current research funding which is
based on excellence. Some other solutions were proposed such as:
Greater use of European Structural and Investment Funds (ESIF) for capacity building in
research and innovation or for financial incentives to catch up with research systems;
Follow-up and opening of the twinning and teaming mechanisms;
Introduction of a milestone prize mechanism;
Extension of the ERA Chairs to early stage researchers; and
Introduction of a bottom-up networking instrument for experienced researchers across
Europe.
Furthermore, a few representatives of research organisations and public authorities noted
that more could be done to attract SMEs and newcomers to the programme.
In addition, almost all business respondents stating their opinion on the topic of participation
believe that industry is under-represented in Horizon 2020 projects, although they see their
participation as essential for turning ideas into value in the market. Furthermore, they noted that
among the top-100 beneficiaries of Horizon 2020 funding, few are from the private sector.
Sharp decline in the participation of international partner countries is worrying.
A few organisations from different stakeholder groups are worried about the observed drop in
international partners' participation in Horizon 2020 and noted the issue should be addressed
strategically.
Some recommended that rules for participation and the regulatory framework should be
simplified, for instance through a standard contract with global acceptance and guarantee of IP
rights. Others noted that the programme should introduce topics that explicitly flag international
collaboration, have a ring-fenced budget or a separate pillar for international collaboration.
In a White Paper5 submitted to the public consultation, the USA offered some lessons learnt to
facilitate international cooperation, based on their own experience. For instance, they note that
the programme should further reduce the procedural burden and administrative and bureaucratic
requirements for participants, permit a greater range of options for governing law and choice of
5 United States Feedback on Horizon 2020 and Suggestions for Framework Programme 9, January 19 2017

60
courts in agreements, limit liability for third parties and allow for secondary recipients of funds
to negotiate the terms of their cooperation directly with their European partners.
Information exchange between National Contact Points (NCPs) and the European Commission could improve.
A few stakeholders representing different stakeholder groups noted that information exchange
processes between National Contact Points (NCPs)6 and the European Commission should be
strengthened.
According to a few representatives of research organisation, the current quality of NCP services
differs. One business representative noted that NCPs need to be better briefed to avoid the
submission of irrelevant proposals. This view was also shared by a representative from academia
who noted that the quality of communication varies depending on the thematic programme and
the Commission Directorate-General. One NCP network made the same observation in its
position paper and added that some struggle to get adequate and timely programme information,
specifically in relation to externalised programmes such as JTIs.
There needs to be a balance between small, medium and large projects.
Some stakeholders commented on the current project size in Horizon 2020. The majority of
those commenting noted that a better balance between small, medium and large projects should
be achieved within the programme. However, stakeholders do not seem to agree on what such a
balance should look like. For instance, it was noted that the effectiveness of very large size
consortia in some projects should be reviewed. At the same time, a few stakeholders noted that
larger projects are more efficient. A few others stated that smaller projects allow for higher
participation of SMEs and newcomers into the programme and can be as effective as large
projects.
Simplification is welcomed but further steps are needed.
Some stakeholders that commented on the simplification measures under Horizon 2020 have a
positive view. In particular, they see the Research Participant Portal and shorter time to grant as
important improvements.
However, they also noted that further simplification efforts are needed for instance related to
preparation and submission of proposals, reimbursement rules, cost declarations and recognition
of nationally accepted and audited accounting practices.
B.8.4. EU added value
Horizon 2020 brings an EU added value.
Many different types of stakeholders make comments reflecting the EU added value and the
majority of the views depict that Horizon 2020 brings an EU added value through:
6 The network of National Contact Points is the main structure to provide guidance, practical information and assistance on all
aspects of participation in Horizon 2020.

61
Collaborative cross-sectorial, interdisciplinary and international projects and associated
networking effects;
Faster and large scale implementation which is not possible on national or bilateral level;
and
Scientific excellence.
Business respondents specifically mentioned the following areas of EU added value:
Opportunity to leverage financial investment;
Opportunities for SMEs to globalize through their cooperation with large companies; and
Access to international/ European supply chain.
B.8.5. EIC specific views or recommendations
The current approach to building up the EIC seems to address the key challenges in innovation support to SMEs.
Some stakeholders from different types of organisations except the NGOs, expressed specific
views related to a future European Innovation Council (EIC), an initiative in the making that
could encourage breakthrough, market-creating innovation that helps European start-ups grow
into world-beating companies.
The majority of those who commented support for the current approach to build up the EIC. In
particular, they highlighted:
An EIC will seem to address the key challenges in innovation support to the best SMEs:
bottom-up calls, market creating innovations, face-to-face interviews, access to
mentoring and coaching and access to scale-up money;
A few representatives of the business community noted that the industry should be in the
steering board of the EIC to integrate the market and industry vision in the selection of
start-ups and to facilitate their future partnership with the manufacturing industry;
The financial allocation for the EIC should not be detrimental for fundamental research
and it should not come from Horizon 2020;
Both stakeholders from business community and research organisations noted that the
EIC should not contribute to a rigorous split between research and innovation.
Collaboration among different stakeholders should be encouraged;
The EIC could function as a 'trademark' similar to the European Research Council; and
Coherence and complementarity of the EIC with the existing instruments needs to be
ensured.

62
B.8.6. Other comments
More sophisticated measures are needed to monitor impact.
Some stakeholders from different types of organisations commented on the monitoring system
and, for the most part, noted that it needs to improve. Most of those commenting believe the
current interpretation of programme impact is narrow and too short-term focused and a more
"sophisticated" approach should be adopted. Some other stakeholders call for better monitoring
of downstream impacts.
A few NGOs in particular stressed a need for better measurement of impact. Similarly, one
public authority stressed that the interpretation of impact specifically related to societal
challenges should be broader in scope to account for a wide range of effects including social,
economic, environmental and cultural.
One business respondent stated that Horizon 2020 and the future Framework Programme should
be at the forefront of practice in monitoring, evaluation and impact assessment.
Views on the Open Data initiative diverge.
Some stakeholders commented on the Open Data initiative, on which views diverge:
Some stakeholders in particular NGOs, research organisations and academia welcome the
Open Data initiative and call for greater transparency and open access;
Yet others including representatives of businesses and industry, but also academia,
underline that the new emerging 3Os policy (Open Science, Open Innovation, Open to
the World) will need to be flexible to allow industry participation rather than being a
disincentive. In particular, open access should not apply by default to research data from
private-sector research, nor from public-sector research performed in collaboration with
industry.

63
C. METHODS AND ANALYTICAL MODELS USED
C.1. Main data sources
Contrary to the ex-post evaluation of FP7, the predecessor Programme, the interim evaluation of
Horizon 2020 has not been carried out by one external expert group, but has been coordinated by
the Evaluation Unit of the Commission's Directorate-General for Research & Innovation, with
the support of a Working Group drawn from the services of the R&I family DGs and an Inter-
Service Group also comprising other Commission services. The interim evaluation of Horizon
2020 started in 2016 and has been guided by Terms of Reference adopted by the Commission
after a vote by the Member States’ Programme Committee7.
It has been based on the following data sources:
Monitoring reports of Horizon 2020 and statistical data mainly from the Commission’s
internal IT Tools as well as Eurostat/OECD data;
Extensive analysis carried out by the responsible Commission services on specific
objectives of Horizon 2020 (‘thematic assessments’), cross-cutting issues, the Horizon
2020 funding model and various Horizon 2020 instruments/actions (Article 185/187
initiatives, Fast Track to Innovation, SME Instrument EIT). Most internal assessments
benefitted from the support from external expert groups/studies as well as dedicated
surveys of beneficiaries;
External horizontal studies covering the entire Horizon 2020 programme on publications
and networking (‘Elsevier study’) based on Scopus data, EU Added Value (‘PPMI
study’) which included a detailed counterfactual analysis and macro-economic modelling
and work of a Methodologies Expert Group on relevance and impact using text- and data
mining tools;
Data from other EU Institutions such as the Conclusions on the Interim Evaluation of the
Council, work of the ITRE committee of the European Parliament, relevant Court of
Auditors’ reports and reports/evaluations of the European Economic and Social
Committee.
Input from various stakeholder consultations was used to triangulate the findings, in particular
the NCP surveys launched in the context of the Horizon 2020 Annual Monitoring reports, the
simplification survey, the Call for Ideas on the European Innovation Council and the stakeholder
consultation on the Interim Evaluation of Horizon 2020 to which more than 3,500 stakeholders
replied and the input received through more than 300 stakeholder position papers.8
While detailed descriptions of the models and methods used in the external assessments on
which the interim evaluation draws upon are available in each respective external study or report
and, in the case of internal assessments, in dedicated sections of this Annex, below is a short
overview.
7 C(2016)5546. 8 A full analysis of the stakeholder consultation (both the questionnaire and the position papers) is provided in Annex – Part B.
The SWD summarised key stakeholder input to dedicated topics. Input received from stakeholders in position papers is
highlighted in blue boxes throughout the SWD.

64
C.2. Overall limitations of the interim evaluation
The main limitation of this interim evaluation concerns its timing: it is taking place only three
years after the beginning of Horizon 2020, when most projects have only just started. It is too
early to present a complete picture of results and impacts. Whereas for most innovation
instruments some effects may be expected in a five-year period, such as an increase in private
investment, this period is too short for wider impacts to emerge. Some lower risk actions have
many incremental and short term effects – easier to capture and to report on - whereas long term
or high risk actions (such as fundamental research) might bear more radical effects in the longer
term (e.g. 20-30 years) and have effects more difficult to capture through usual indicator systems
(e.g. the general advancement of knowledge).
Limitations include limitations on data availability and measurability of outcomes (for example,
most Horizon 2020 indicators focus on input/results but not on impact; in particular the
indicators to track progress on the societal challenges are not challenge specific, i.e. they relate
to classical outputs from R&I projects - publications, patents, prototypes - but not to their
impacts on e.g. decreasing CO2 emissions, improving health of citizen, or their security),
aggregation (for example most indicators are collected for specific programme parts only and not
for the whole programme and monitoring data covering the entire programme comes from
various data sources, which are difficult to aggregate) and reliability of certain monitoring data
(for example data on patents and publications are based on self-reporting by project coordinators;
data on the cross-cutting issues gender and social sciences and humanities is based on flagging
by project officers). It has not always been possible to validate findings from external
studies/expert groups, for example through a peer-review of macro-econometric modelling
results.
Another limitation is the lack of benchmarks to compare performance. Worldwide there is no
programme similar to Horizon 2020 in terms of size, thematic coverage and depth: the EU
Framework Programmes are rather unique in their form, covering R&I aspects from fundamental
research to close-to-market innovation, from programmed topics in specific thematic areas to
fully bottom-up blue-sky science. Also, the R&I performance of countries is influenced by many
other factors than Horizon 2020 only. The performance of Horizon 2020 should thus be seen in
the context of its role in the wider R&I support system in particular as regards its positioning
against (and impact on) the national and regional policy initiatives.
As regards the stakeholder consultation, the views represented by the respondents are not
random and representative of the EU population due to self-selection bias. In addition, whereas
qualitative data and analysis enabled a deeper look into the areas of the consultation, the methods
are very prone to bias. An attempt was made to minimise such bias with the use of a word cloud
function and a coding frame.
To overcome/mitigate these limitations, the interim evaluation is transparent in indicating its data
sources and all underlying data sources are made publicly available. The analysis of the evidence
by Commission services has allowed identifying data availability/quality problems that could
already be overcome over the course of the evaluation. Conclusions are drawn based on the
systematic triangulation of evidence from various data sources. All evaluation results have been
systematically checked against input from stakeholders. Whenever possible (i.e. in the case of
the analysis of participation patterns), FP7 was used as a benchmark.

65
C.3. Monitoring data
The Horizon 2020 Interim Evaluation focuses on the implementation of Horizon 2020 from 1
January 2014 to 1 January 2017. It follows the approach of reporting as implemented in the
Annual Monitoring Reports9. The included data is based on data collected directly from the
Common Research Data Warehouse (CORDA) Portal, using Commission's internal reporting
tools provided by the Common Support Centre in the Directorate-General for Research and
Innovation (DG RTD).
The scope of the Staff Working Document includes all calls with a closure deadline on and
grants signed by 1 January 2017. It includes grants to named beneficiaries under Horizon 2020
(and under Euratom, unless specifically stated). The overall report includes 1-stage calls and
second stage in 2-stage calls, producing results aggregated at programme's part level. It includes
calls from the Work Programmes of the Public-Private Partnerships (PPPs, Joint Undertakings),
while data on Public-Public Partnership (P2Ps) is collected separately but excluded from the
overall calculation. Special analysis has been made on 1 stage of 2-stage proposals. Calls from
the Innovative Medicines Initiative (IMI2) Joint Undertaking are not accounted for because IMI2
is not currently integrated in the CORDA database, while three calls from Clean Sky 2 (CS2)
Joint Undertaking are excluded since full integration to CORDA is to be finally implemented:
nonetheless, available figures regarding the implementation of IMI2 and CS2 are provided in a
dedicated annex on Funding for PPPs and P2Ps.
The horizontal analysis in the Staff Working Document does not include data on European
Institute of Innovation and Technology (EIT)'s Knowledge and Innovation Communities (KICs),
however statistics on the EIT are presented separately in Section K of this annex, but excluded
from the overall calculation. Direct actions from the Joint Research Centre are also excluded.
Calls belonging to the Research Fund for Coal and Steel do not belong to Horizon 2020,
therefore are outside the scope of this Staff Working Document. Regarding some specific types
of action, the Framework Partnership Agreements (FPA) are excluded because there are no
grants associated to them, while prizes are reported separately where appropriate.
The statistics on applications and proposals excludes 2,063 non-eligible proposals (ex.
duplicates, withdrawals, inadmissible, etc.), which represent 2% of the total number of proposals
submitted, while statistics on participations and projects are also based on grants agreements
signed before 1 January 2017. Calculations regarding participants are limited to beneficiaries
who are signatories to the grant agreement, thus being real consortia members. Other categories
of participants, such as "Third Parties", "Partner Organisations" or others do not receive funding
directly from the EU, but indirectly from the beneficiaries, and are not computed in the
horizontal analysis.
Differences in reimbursement of indirect costs under Horizon 2020 imply, that beneficiaries no
longer report the real indirect project costs (i.e. under Horizon 2020 indirect costs are calculated
automatically as a share of direct costs). As a result, the reported total project cost to the
Commission under the Horizon 2020 programme is lower than the actual total project cost. To
allow a comparison of co-funding rates between Horizon 2020 and FP7 at programme level, the
indirect costs in Horizon 2020 were estimated for all beneficiaries of Research and Innovation
9 Annual Monitoring Reports 2014 and 2015: https://ec.europa.eu/research/evaluations/index_en.cfm?pg=monitoring

66
Actions (RIA) and Innovation Actions (IA) on the basis of the ratio between the real indirect and
direct costs for participants in FP7 collaborative projects10
.
The interim evaluation of Horizon 2020 includes statistics related to outputs of funded projects,
in particular publications, patent applications and patent awarded. It should be noted that output
data is collected through the continuous project reporting made by beneficiaries under their own
responsibility. At this early stage of data reporting, no systematic data quality check has been
performed by the Commission services, hence data on publications and patents is solely based on
self-declarations of project coordinators.
C.4. The economic impact and the European added value of the programme
Several of the quantifications of European Added Value in this interim evaluation are drawn
from a study11
that performed a counterfactual analysis (based on a regression discontinuity and
propensity matching) of FP7 top-scoring applicants who happened to be just above and below
the funding threshold. This FP7 evidence is corroborated in the study with a survey of a sample
of Horizon 2020 beneficiaries (for which not enough time has elapsed to carry out the same
analysis) and several in-depth case studies of European Added Value.
Within the same study, macro-econometric simulations based on the NEMESIS12
model were
used to assess the economic impact of the Framework Programmes. The simulations estimated
the contribution of FP7 and Horizon 2020 to growth and jobs on the basis of the difference
between the EU economic performance with and without the implementation of the Framework
Programmes. In the context of this study, the reference scenario was based on the assumption
that, at the end of the respective predecessor programme, FP7 and Horizon 2020 would have not
existed. The reference scenario is based on the extrapolation of past trends and different forecasts
at medium and long term, notably the EPC/DG ECFIN Ageing Report.13
It should be recalled that a similar assessment was done in the context of the ex-ante Impact
Assessment of Horizon 202014
, in which four options were analysed reflecting different
situations: business as usual (mainly continuing FP7), Horizon 2020 (more focused, innovation
oriented programme), renationalisation (lower MS contribution to EU budget, increased MS R&I
budget) and Framework Programme discontinuation (gradual decrease in total GBAORD). The
later was assimilated to the cost of non-Europe. The main differences between scenarios were the
amount and evolution of the European contribution through the Framework programme (EC
contribution), national investments in R&I, type of research (basic, applied), sectoral allocation
of funding, crowding-in and multipliers for national and EU R&I funding as well as spill-overs
(intersectoral, international). The coefficients used in the scenarios were based either on
academic literature or on deductions and analogies reflecting the implementation logic and
programme structure.
The key parameters of the simulations are the following:
10 The methodology identifies a coefficient (funding intensity) for each type of organisations (distinguishing SMEs and large
entities) calculated as the real indirect cost/direct cost (IC/DC) ratio for FP7 collaborative projects. The coefficient is then applied
to the equivalent types of organisations in Horizon 2020 RIA and IA projects and multiplied to their direct cost. 11 PPMI, “Assessment of the Union Added Value and the Economic Impact of the EU Framework Programmes (FP7, Horizon
2020)”, forthcoming 12 http://www.erasme-team.eu/modele-economique-econometrie-nemesis-vp14.html 13 http://ec.europa.eu/economy_finance/publications/european_economy/2014/pdf/ee8_en.pdf 14http://ec.europa.eu/research/horizon2020/pdf/proposals/horizon_2020_impact_assessment_report.pdf#view=fit&pagemode=no
ne

67
Reference scenario: in the ex-ante Impact Assessment, the business as usual scenario was
used as benchmark for the comparisons, while for the Interim Evaluation the reference
scenario is based on the discontinuation of the Framework Programme.
Actual allocation by country: while in the ex-ante Impact Assessment, the EC
contribution to Member States was based on projections of FP7 data, in the Interim
Evaluation the analysis was based on a real allocation of Horizon 2020 funds during the
first years of Horizon 2020 (grants signed by 1 August 2016) and then projected for the
remaining years of Horizon 2020 implementation.
Crowding in factors: while it is not possible to identify the real indirect leverage of the
programme (i.e. the additional venture capital or public/private investments that project
results are able to attract), this is estimated on the basis of the assumption that the
elasticity of R&D intensity is constant with respect to the output of the sector. Therefore,
it is a function of the direct crowding-in coefficients: they were calculated as the
contribution by the type of actor to the total costs of the projects. Different estimates
were established for basic (mainly pillar 1) and applied research (pillars 2 and 3) as well
as for private and non-private beneficiaries. Different values for crowding-in factors were
used in the sensitivity analysis: in the pessimistic scenario, the crowding-in factor was
calculated on the basis of Corda data and it resulted in EUR 0.16 per each EUR of EU
contribution; in the optimistic scenario, the crowding-in was estimated on the basis of a
methodology to calculate real indirect project costs, which beneficiaries no longer report
in Horizon 2020 and it resulted in EUR 0.40 per each EUR of EU contribution.
Multipliers: for the study, a standard assumption used is that the European Framework
Programmes are 15% more efficient than national research activities. This value was
reinforced by a counter-factual analysis, which found that this figure is relatively
conservative considering the European Added Value of Framework Programmes. A
sensitivity analysis was carried out with the assumptions that the EU economic
performance is equivalent (0%) or higher (21%) compared to that of national research
activities: the economic impacts vary within the range of about 10% to 12%.
Sectoral allocation of funds: given that in Horizon 2020, data regarding NACE codes are
not systematically collected at participant level, the sectoral allocation (which is
important to establish how the EU funds are distributed at sectoral level in the Member
States) is based on FP7 Corda data (grandfathering principle). These data correlate well
with the Eurostat BERD (2014) sectoral allocation, therefore the FP7 sectoral allocation
can be considered still relevant.
C.5. Analysis of participation and publication networks, including
interdisciplinarity
Collaboration patterns were explored using two different approaches: through the analysis of
projects’ participation networks and through the analysis of publications from projects funded
through the Framework Programme.
The analysis of projects’ participation networks at institution type, sector or country level is
based on projects’ participations as of 1 January 2017. The networks have been mapeed using

68
the Tool for Innovation Monitoring run by the Joint Research Centre15
, an interface tool for
collaboration mapping, which is, based on data from EU Open Data Portal16
.
As regards the analysis of interdisciplinarity scientific publications, an external study17
analysed
the EU-funded publication output of both FP7 and Horizon 2020 through a citation-based
analysis. The basic principle of this approach is that an article is going to be interdisciplinary if it
cites papers that are 'far away' from each other in terms of the similarity of the journals they
appear in (based on how often those journals are cited together in a certain period). On the other
hand, if it cites papers in journals that are cited together very frequently, it is likely to be a mono-
disciplinary article. By thus focusing on the outcomes of research (i.e. journal publications and
citations), this approach does not take into consideration the underlying processes of knowledge
integration in cross-disciplinary research (research teams whose members have a variety of
disciplinary backgrounds). It also takes into consideration that the research landscape is
dynamic: what is considered interdisciplinary today may be disciplinary tomorrow.
Indicators used for this analysis are:
Institutional, national and international collaboration: all authors are from the same
institution (Institutional collaboration), authors are affiliated with at least two institutions
within a country (National collaboration), at least one author is from an institution outside of
the country (International collaboration), single-authored publications are used as a
benchmark. The indicators include for each type of collaboration: Absolute numbers, Share
relative to country/institution’s output and growth expressed by CAGR (Compound Annual
Growth Rate).
Inter-geographical dimension collaboration: international collaboration counts between
members of the geographical dimension.
Collaboration networks: the more intensive the collaboration, the more closely the two
countries/institutions are plotted to each other on a collaboration network map.
Interdisciplinary research publications: interdisciplinary research output as measured by
volume of publications (i.e. articles, reviews and conference proceedings). This indicator
includes: absolute numbers of interdisciplinary research output; interdisciplinary research
output growth per year as compound annual growth rate (used to identify the trend in the
volume of interdisciplinary research publications).
Field Weighted Citation Impact18
(FWCI) of interdisciplinary research publications: this
is a widely recognized proxy for research quality which normalizes the citations received
using the world benchmark of citations received in the same subject area, by publications
15 http://test.technologymonitoring.eu/TimCordis/main.jsp 16 https://data.europa.eu/euodp/en/data/dataset/cordisHorizon 2020projects 17 Elsevier, Study on overall output of select geographical group comparators and related FP7- and Horizon 2020-funded
publication output, forthcoming 18 Field-weighted citation impact (FWCI) is an indicator of mean citation impact, and compares the actual number of citations
received by an article with the expected number of citations for articles of the same document type (article, review or conference
proceeding paper), publication year and subject field. When an article is classified in two or more subject fields, the harmonic
mean of the actual and expected citation rates is used. The indicator is therefore always defined with reference to a global
baseline of 1.0 and intrinsically accounts for differences in citation accrual over time, differences in citation rates for different
document types (reviews typically attract more citations than research articles, for example) as well as subject-specific
differences in citation frequencies overall and over time and document types. It is one of the most sophisticated indicators in the
modern bibliometric toolkit.

69
published in the same year and with the same document type (e.g., articles, reviews and
conference proceedings). The indicators include for each type of collaboration: Absolute
numbers Share relative to country/institution’s output growth expressed by compound annual
growth rate.
C.6. Stakeholder consultation
The stakeholder consultation on the interim evaluation of Horizon 2020 was based on an online
questionnaire and the submission of position papers.
The online questionnaire included 25 questions and several sub-questions. The majority of the
questions were of a closed type, but there were also 8 open questions where the respondents had
an opportunity to elaborate on their views. In total the Commission received 3,483 responses to
the questionnaire. Basic analysis of closed questions was performed by stakeholder groups to
explore differences in opinion between different stakeholders. The affiliations of respondents
(e.g. SME, academia, public authority) are self-reported, and were not verified. The analysis of
the open questions followed a qualitative method of approach. The questions were analysed
either with the use of basic qualitative analysis (i.e. grouping respondents into broad stakeholder
groups and reading the responses to get an overview of the key themes) or with the use of word
cloud function (the function is used to indicate the most frequently used words in the qualitative
responses and present the results graphically).
In addition to the online questionnaire, 386 position papers were received as part of the
stakeholder consultation exercise, After the compilation of all the position papers and the first
screening and the removal of duplicates, campaigns and documents that were not addressing the
Horizon 2020 programme directly (e.g. promotion material), 295 papers were analysed internally
by the Commission services. Those position papers are also published on the interim evaluation
website. The analysis followed a qualitative method of approach. Based on a sample of position
papers, a coding frame of broad themes was constructed. The final analysis per theme and any
emerging sub-themes was conducted by stakeholder group: academia, research organisations,
public authorities, businesses, NGOs, individuals, international stakeholders (i.e. non-EU
Member States) and others.
C.7. Estimation of the costs of writing proposals
In order to evaluate the cost of the programme, not only the expenses held by the European
Commission and its executive agencies should be included. In the first three years of Horizon
2020 about 74,769 distinct universities, private companies, research organisations, public entities
and others have applied for Horizon 2020 funding. The expenses related to processes on writing,
coordinating consortia and administrative questions vary greatly on the types of proposal, single
beneficiary vs. collaborative projects, salary level of participants involved, administrative
support needed etc.
Competition is an essential element of the scientific life, inextricably linked to cooperation and
openness. Researchers are therefore expected to apply for and compete for research funding,
including from the EU framework programmes as a part of their day to day jobs. Studies have
shown that depending on their age and position researchers spend between 5 – 10% of their time
applying for research funding.19
A study on the effects of participating in a project under the
19 E.g. see page 15 http://www.eui.eu/Documents/MWP/Publications/20111012MWP-ACOSurveyResearchFunding-Full.pdf

70
Framework programme (FP) from a human resource perspective showed that researchers that
participate in FPs strengthen almost all skills and capacities.20
Another study suggested that the
simplification efforts implemented in FP7 compared to FP6 had saved each participant EUR 8
66821
. In 2015 the Commission launched an online survey on the perception of the simplification
measures by stakeholders, addressed to all beneficiaries in ongoing Horizon 2020 grants. The
results cover the first 20 months of Horizon 2020 implementation and were published on 30 May
2016. In total 4,185 beneficiaries responded. 75% of those respondents with experience in FP7
and Horizon 2020, confirmed that, overall, the processes in Horizon 2020 are much simpler than
in FP7. The survey looked at the time spent on preparing proposals:
For coordinators in a multi-partner project 52.3% of the respondents say that they spend
more than 30 days, 32% stated that they spent between 15-30 days preparing a proposal.
For partners in multi-partner projects 14.3% spend more than 30 days, 52.6% that they
spend between 15 and 30 days.
For single beneficiary projects (non SMEs) 19.3% state they spend more than 30 days,
and 60.4% between 15 and 30 days.
For the SMEs in mono-partnered projects 59.8% state that they spend more than 16 days
and 27.7% say that they spend less than 15 person days. 22
The European University Association (EUA) states that these numbers are in line with costs
reported by their members. EUA estimates the cost per proposal to range from EUR 10 000 to
100 000 and applies these numbers to the overall proposals numbers and numbers of retained
proposals in the first year of Horizon 2020 to calculate the cost of unfunded projects: between
EUR 268 million and EUR 2.68 billion23
.
Based on these studies, a rough estimation was made by Commission services, based on a
division of four levels of average estimated expenses depending on the complexity of the
proposals from EUR 5 000 for phase/stage 1 proposals (stage 1 not included in the EUA
assessment), EUR 10 000 for single beneficiary smaller proposals, EUR 20 000 for medium size
collaborative proposals and more complex single beneficiary proposals and finally EUR 50 000
for large collaborative proposals. The calculations account for resubmission for bottom-up
calls.24
The estimation shows that the share of Horizon 2020 funding spent on proposal writing is
8.4% in the first three years of Horizon 2020. This is roughly EUR 1.9 billion or EUR 633
million annually. In total EUR 1.7 billion is spent on proposals that are not funded. Out of this,
the expense of writing high quality proposals that are not funded is estimated at EUR 643
million. Further details on this assessment are provided in the table below.
20 Study on assessing the contribution of the framework programmes to the development of human research capacity:
http://ec.europa.eu/research/evaluations/pdf/archive/other_reports_studies_and_documents/fp_hrc_study_final_report.pdf 21 Budgetary impact of the changes in the cost calculation regime in FP7 (EC and Euratom) as compared to FP6 (EC and
Euratom) and its effects on the administrative burden for participant:
https://ec.europa.eu/research/evaluations/pdf/archive/other_reports_studies_and_documents/budgetary_impact_fp6-fp7.pdf 22 Report on the Horizon 2020 Simplification Survey, page 20.
http://ec.europa.eu/research/participants/data/ref/h2020/other/events/survey/h2020_simplification-survey_final-report_en.pdf 23EUA MEMBER CONSULTATION A CONTRIBUTION TO THE HORIZON 2020 MID-TERM REVIEW, page 32
http://www.eua.be/Libraries/publications-homepage-list/eua-membership-consultation-2016-a-contribution-to-the-horizon-2020-
mid-term-review.pdf?sfvrsn=4 24 From 2014-2016: MSCA-ITN 42.9%, MSCA-IF 15.4%, MSCA-RISE 27.9%, ERC 27%. SME-instrument 40%

71
Table 2 Estimation of proposal writing costs
*Full number of proposals / excluding
resubmission
Number of
eligible proposals
Number of high-quality
proposals
Number of
retained proposals
EU funding
to retained
proposals (EUR
million)
Cost of writing
all propo-
sals (EUR
million)
Cost of writing
non-funded
proposals (EUR
million)
Cost of writing
non-funded high-
quality proposals
Share of funding
spent on proposal writing
High expense level: EUR 50 000 Instruments included: RIA and IA COFUND-EJP/PCP/PPI/ERA.NET
22338 / 22267
10246 /10189
2643 / 2616
13870.7 1113.4 982.6 378.7 8.0%
Medium expense level: EUR 20 000 Instruments included: CSA, ERC ADG/COG/LVG/ POC/STG, MSCA Cofund/ITN/RISE
32849 / 24571.7
15182 / 11176
4587 / 3621
7451.6 491.4 419.0 151.1 6.6%
Low expense level: EUR 10 000 Instruments included: MSCA-IF and SME-2
24737 / 18774
16706 / 13235
2973 / 2397
1244.9 187.7 163.8 108.4 15.1%
Very low expense level: EUR 5000 SME-1
22152 /13291
3498 / 2099
1864 /1118
93.2 66.5 60.8 4.925
22.3%
Stage 1 applications in two stage applications (not included in total number of eligible proposals)
(10001) (3203) (3100) N/A 50.0 N/A N/A N/A
Total 102076 45632 12067 22660.5 1908.7 1661.5 643.0 8.4%
Source: CORDA, Signed Grants cut-off date by 1/1/2017 (calculating cost, excludes resubmissions)
C.8. Text mining on the relevance of the programme
A dedicated expert group appointed by the European Commission on evaluation methodologies
for the interim and ex-post evaluations of the Framework programmes26
developed and applied
several methodologies to investigate the relevance of Horizon 2020. This was primarily done by
comparing the degree of matching between keywords extracted from the establishing act and the
25 No including stage 1proposals 26 European Commission Expert group on evaluation methodologies for the interim and ex-post evaluations of Horizon 2020,
Applying relevance-assessement methodologies to Horizon 2020 (forthcoming report).

72
work programmes against keywords extracted from international and EU policy documents,
social media, and patents and publications.
The assessment of relevance was defined as the process determining whether the original
objectives of the Framework Programme are still relevant and how well they still correspond to
present needs and challenges. The analysis was structured around three basic questions
concerning the institutional perspective, the citizens’ perspective, and the scientific and
technological perspective:
Is the programme in line with EU and International priorities?
Is Horizon 2020 in line with the needs of EU citizens?
How well adapted is Horizon 2020 to the subsequent technological or scientific
advances?
These questions guided the development of four methodologies for the assessment of the
relevance: an expert exploratory approach using computer-based content; an expert exploratory
approach using human-based content; a text mining approach; and a social media approach.
When applied to Horizon 2020, the following texts were considered as the basis for keyword
matching:
Council Decision of 3 December 2013 establishing the specific programme implementing
Horizon 2020 - (2013/743/EU);
The 2014 – 2015 Horizon 2020 Work Programme;
The 2016 – 2017 Horizon 2020 Work Programme.
The following texts were used to identify relevant keywords for the EU and International
priorities:
European Commission (2010). Europe 2020, A strategy for smart, sustainable and
inclusive growth, Communication from the Commission, Brussels, COM (2010) 2020
final.
Juncker, J.-C. (2014). A New Start for Europe: My Agenda for Jobs, Growth, Fairness
and Democratic Change. Political Guidelines for the next European Commission.
Opening Statement in the European Parliament Plenary Session. Strasbourg, 15 July
2014.
European Commission (2015). Communication from the Commission to the European
Parliament and the Council, The Paris Protocol – A blueprint for tackling global climate
change beyond 2020. /COM/2015/081 final/2. Brussels, 4.3.2015.
Gurría, A. (2015). “21-21”: A Proposal for Consolidation and Further Transformation of
the OECD.
United Nations, General Assembly, Seventieth session. (2015). Transforming Our World:
The 2030 Agenda for Sustainable Development (A/RES/70/1).

73
World Health Organisation (2015). Health in 2015: from MDGs, Millennium
Development Goals to SDGs, Sustainable Development Goals. ISBN 978 92 4 156511 0.
World Health Organization 2015.
G7 Leaders (2016). G7 Ise-Shima Leaders’ Declaration, G7 Ise-Shima Summit, 26-27
May 2016.
Several social media sources were used to identify the needs of EU citizens: Twitter, Facebook,
Wikipedia and YouTube.
In order to assess keywords relevant for subsequent technological and scientific advances, the
analysis used Google Scholar.

74
D. MONITORING DATA ON HORIZON 2020 STATE OF IMPLEMENTATION
D.1. Overall
Table 3 Overall proposal and project data
Number Applications Applicants
EU Contribution Requested (EUR
million)
Eligible Proposals 102076 379169 74769 172748.1
High Quality Proposals 45632 203308 41161 85006.1
Retained Proposals 12067 54466 19233 22660.5
Number Participations Participants EU Contribution
allocated (EUR million)
Signed Grants 11108 49090 16679 20400.1
Source: CORDA, cut-off date by 1/1/2017 (including grants to named beneficiaries)
D.2. Type of organisations
Table 4 Summary table of applications per type of organisation
Source: Corda, cut-off date by 1/1/2017 (including grants to named beneficiaries, success rate is calculated
excluding grants to named beneficiaries
Table 5 Summary of participations table by type of organisation
Applicants Applications
Success rate of applications
Newcomer applicants
Newcomer applications
Universities (HES) 5022 140900 12.3% 3024 7973
Other (OTH) 5376 14492 19.2% 4309 8460
Private Sector (PRC) 55296 141880 13.0% 46034 84462
Public Bodies (PUB) 3925 13551 24.8% 2815 5480
Research Organisations (REC)
5150 68346 17.0% 2464 5341
(SME's) 35288 99434 12.0% 28551 58646
Total 74769 379169 14.1% 58646 111716
Participants
Participations
Nr of Projects Coordinators in Signed Grants
EU contribution (EUR
million)
Newcomer
participants
Share of
newcomer
participants
Average
participation per
participant
Average EU
contribution per
participant (EUR million)
Universities (HES) 1421 16153 5266 7840.2 205 14.4% 11.4 5.5
Other (OTH) 1593 2599 211 689.2 1057 66.4% 1.6 0.4
Private Sector (PRC) 10367 16298 3017 5653.5 6352 61.3% 1.6 0.5
Public Bodies (PUB) 1315 3090 225 804.2 668 50.8% 2.4 0.6
Research Organisations (REC)
1983 10950 2389 5413.0 408 20.6% 5.5 2.7
(SME's) 6979 10147 2625 3270.3 4291 61.5% 1.5 0.5
Total 16679 49090 11108 20400.1 8690 52.1% 2.9 1.2
Source: Corda, cut-off date by 1/1/2017 (including grants to named beneficiaries)

75
D.3. Per programme part
Table 6 Proposals and success rates per programme part
27 NMBP stands for Nanotechnologies, Advanced materials, Biotechnology and Advanced manufacturing and processing. 28 The figures are presented within brackets because, while belonging to the Innovation in SMEs Programme Part in the legal
basis, the SME Instrument is implemented in both Industrial Leadership and Societal Challenges.
Number of eligible
proposals received
Number of high
Quality Proposals
Success rate
proposals
EC Funding requested in eligible proposals
Success rate
funding
Excellent Science 48128 27832 12.9% 71977.6 10.9%
European Research Council (ERC) 22832 8394 12.1% 40255.4 11.4%
Future and Emerging Technologies (FET) 3199 1506 4.1% 11133.7 4.7%
Marie-Skłodowska-Curie Actions (MSCA) 21644 17592 14.9% 18290 10.6%
Research Infrastructures (RI) 453 340 29.7% 2298.5 33.9%
Industrial Leadership 20436 6549 9.7% 34308.7 17.8%
Leadership in Enabling and Industrial Technologies (LEIT)
19746 6031 8.9% 33684.3 13.7%
Information and Communication Technologies
12772 3867 8.1% 21334.1 13.4%
NMBP27
5640 1493 9.2% 10455 13.7%
Space 1334 671 15.7% 1895.2 17.5%
Access to Risk Finance (ARF) 47 21 7.0% 79.2 9.3%
Innovation in SMEs 643 497 43.5% 545.2 15.3%
(The SME Instrument28
) 30901 7145 7.6% 15462.1 5.7%
Societal Challenges 29865 9819 11.1% 58873.8 14.7%
Health, demographic change and wellbeing (SC1)
6461 1928 9.1% 17912.6 9.0%
Food security, sustainable agriculture and forestry, marine and maritime and inland water research and the bioeconomy (SC2)
3489 1233 13.0% 6424.3 19.5%
Secure, clean and efficient energy (SC3) 5824 1515 11.6% 11688.8 15.7%
Smart, green and integrated transport (SC4) 4507 1766 18.0% 6280.7 30.6%
Climate action, environment, resource efficiency and raw materials (SC5)
3765 1216 10.0% 5810.8 18.9%
Europe in a changing world - inclusive, innovative and reflective societies (SC6)
3653 1221 5.4% 4953.1 6.6%
Secure societies protecting freedom and security of Europe and its citizens (SC7)
2166 940 9.9% 5803.5 10.1%
Spreading excellence and widening participation (SEWP)
826 487 14.3% 1281.1 20.5%
Science with and for Society (SWAFS) 771 414 9.0% 1540.2 9.5%
Euratom 67 56 33.3% 688.3 37.6%
Pilot: Fast-track to Innovation 1983 475 4.7% 4078.3 4.9%
TOTAL HORIZON 2020
102076 45632 11.6% 172748.1 12.7%
Source: CORDA, cut-off date by 1/1/2017 (including grants to named beneficiaries, except for calculation of
success rates)

76
Table 7 Number of signed grants and EU Contribution to signed grants per programme's
part
29 http://eur-lex.europa.eu/legal-content/EN/TXT/HTML/?uri=CELEX:32015R1017&from=EN 30 NMBP stands for Nanotechnologies, Advanced materials, Biotechnology and Advanced manufacturing and processing. 31 Around EUR 994 million of this amount may go towards the implementation of the Strategic Energy Technology Plan (SET
Plan) projects. Around one third of this may go to SMEs.
32 Within the target of allocating a minimum of 20 % of the total combined budgets for the specific objective “Leadership in
enabling and industrial technologies” and the priority “Societal challenges” for SMEs, a minimum of 5 % of those combined
budgets will be initially allocated to the dedicated SME instrument. A minimum of 7 % of the total budgets of the specific
objective “Leadership in enabling and industrial technologies” and the priority “Societal challenges” will be allocated to the
dedicated SME instrument averaged over the duration of Horizon 2020. 33 The figures are presented withing brackets because, while belonging to the Innovation in SMEs Programme Part in the legal
basis, the SME Instrument is implemented in both Industrial Leadership and Societal Challenges.
34 Within the target of allocating a minimum of 20% of the total combined budgets for the specific objective “Leadership in
enabling and industrial technologies” (LEIT) and the priority “Societal challenges” for SMEs, a minimum of 5% of those
combined budgets will be initially allocated to the dedicated SME instrument. A minimum of 7% of the total budgets of the
specific objective LEIT and the priority “Societal challenges” will be allocated to the dedicated SME instrument averaged over
the duration of Horizon 2020.
Number of
signed grants
Share in
total signed grants
EU contribution to signed grants (EUR
million)
Share in total
EU contribution
to signed grants
Project total cost
Time to
grant in
days
Share of
grants signed within
8 months
Budget (EUR
million)29
Share of
budget allocat
ed
Excellent Science 5964 53.7% 7514.4 36.8% 7856.3 208.8 90.3% 24232.1 31.0%
European Research Council (ERC)
2440 22.0% 3874.2 19.0% 3879.5 377.8 8.0% 13094.8 29.6%
Future and Emerging Technologies (FET)
129 1.2% 654.4 3.2% 701.6 230.3 96.9% 2585.4 25.3%
Marie-Skłodowska-Curie Actions (MSCA)
3246 29.2% 2114.9 10.4% 2303.9 280.5 91.1% 6162.3 34.3%
Research Infrastructures (RI)
149 1.3% 870.9 4.3% 971.3 264.1 67.6% 2389.6 36.4%
Industrial Leadership 1933 17.4% 4539.9 22.3% 6139.7 177.2 95.1% 16466.5 27.6%
Leadership in Enabling & Industrial Technologies (LEIT)
1728 15.6% 4462.2 21.9% 6058.7 175.3 96.3% 13035 34.2%
Information and Communication Technologies
1005 9.0% 2600.6 12.7% 3828.2 174.3 97.0% 7423 35.0%
NMBP30
512 4.6% 1505.3 7.4% 1823.4 154.9 98.2% 4242 35.5%
Space 211 1.9% 356.3 1.7% 407.1 182.3 88.3% 1403 25.4%
Access to Risk Finance (ARF)
7 0.1% 7.9 0.0% 8 272.5 0.0% 2842.331
-
Innovation in SMEs 198 1.8% 69.8 0.3% 73 242.4 55.3% 589.232
-
(The SME Instrument
33)
2090 18.8% 781.7 3.8% 1087.5 112.8 98.9% -34
-
Societal Challenges 2941 26.5% 7351.5 36.0% 9693.2 177.9 92.3% 28629.6 25.7%

77
35 The Fast Track to Innovation (FTI) pilot actions will be funded from the specific objective “Leadership in enabling and
industrial technologies” and from the relevant specific objectives of the priority “Societal challenges”. A sufficient number of
projects will be launched in order to allow a full evaluation of the FTI pilot.’ 36 Includes EUR 1855.7 million earmarked for EIT and EUR 2383 earmarked for Non-nuclear direct actions of the Joint
Research Centre (JRC)
Health, demographic change and wellbeing (SC1)
570 5.1% 1705.8 8.4% 2010.5 160.8 96.8% 7256.7 23.5%
Food security, sustainable agriculture and forestry, marine and maritime and inland water research and the bioeconomy (SC2)
365 3.3% 832.1 4.1% 1082.3 157.6 97.0% 3707.7 22.4%
Secure, clean and efficient energy (SC3)
640 5.8% 1735.2 8.5% 2333.7 179.2 94.2% 5688.1 30.5%
Smart, green and integrated transport (SC4)
655 5.9% 1376.8 6.7% 2152.4 192.3 86.4% 6149.4
22.4%
Climate action, environment, resource efficiency and raw materials (SC5)
340 3.1% 912.6 4.5% 1202.8 161.9 93.5% 2956.5 30.9%
Europe in a changing world - inclusive, innovative and reflective societies (SC6)
194 1.7% 342.1 1.7% 411.6 187.2 85.0% 1258.5 27.2%
Secure societies protecting freedom and security of Europe and its citizens (SC7)
177 1.6% 446.9 2.2% 499.9 209.1 88.6% 1612.7 27.7%
Spreading excellence and widening participation (SEWP)
118 1.1% 209.1 1.0% 213.7 233.9 91.3% 816.5 25.6%
Science with and for Society (SWAFS)
53 0.5% 108.9 0.5% 112.5 267.4 52.1% 444.9 24.5%
Euratom 24 0.2% 514.9 2.5% 989.4 278.1 65.2% - -
Fast-track to Innovation Pilot
75 0.7% 161.2 0.8% 215.1 230.8 78.7% -35
-
TOTAL HORIZON 2020
11108 100% 20400.1 100% 25220 192.2 91.6% 74828.336
27.3%
Source: CORDA, cut-off date by 1/12/2017 (including grants to named beneficiaries, time to grant excludes grants to
named beneficiaries and excludes ERC in overall calculations, as ERC is exempt from time to grant)

78
D.4. Type of instrument
Table 8 Summary table - proposals per type of instrument
Source: Corda, cut-off date by 1/1/2017 (including grants to named beneficiaries except for calculating success
rates)
Number of eligible
propo-sals
Number of
applica-tions
Number of high quality propo-
sals
EC funding requested by eligible proposals
(EUR million)
Success rate
propo-sals
Success rate
funding
New-comer
applica-tions
Private sector applica-tions
SME appli-
cations
COFUND-EJP
3 178 3 524.5 100% 100% 18 8 7
CSA 4706 34600 2459 6832.4 20.7% 19.5% 11236 8714 6400
ERA-NET-Cofund
49 1073 47 391.7 95.9% 99.0% 70 24 15
ERC-ADG 5931 6838 2562 14392.0 7.8% 7.9% 306 114 133
ERC-COG 6782 7417 2384 12856.7 14.5% 15.2% 288 97 129
ERC-LVG 2 2 2 0.1 100% 100% 1 0 1
ERC-POC 1150 1232 609 170.8 31.8% 32.0% 44 52 42
ERC-STG 8947 9605 2827 12816.3 10.6% 11.3% 507 145 191
IA 6090 52937 2374 24758.6 13.2% 17.5% 19858 29152 16826
MSCA-COFUND
207 1219 158 590.3 25.1% 25.7% 178 162 82
MSCA-IF 15988 17993 13059 2899.8 15.6% 15.7% 1946 402 305
MSCA-ITN 4282 47926 3645 13968.1 7.8% 7.9% 7256 12933 7456
MSCA-RISE 927 8018 588 787.4 27.7% 27.6% 2574 1926 1189
PCP 35 283 21 138.4 42.9% 45.5% 105 59 24
PPI 5 31 3 37.1 60.0% 84.5% 13 2 2
RIA 15989 154472 7664 66105 10.8% 12.5% 35858 53765 32040
SGA 82 385 82 16.7 100% 100% 227 96 37
SME-1 22152 23895 3498 1107.5 8.4% 8.4% 21819 23371 23626
SME-2 8749 11065 3647 14354.6 5.5% 5.5% 9412 10858 10929
Total 102076 379169 45632 172748.1 11.6% 12.7% 111716 141880 99434

79
Table 9 Summary table – signed grants and participations per type of instrument
Source: Corda, cut-off date by 1/1/2017 (including grants to named beneficiaries except for calculating success
rates)
Number of signed
grants
Share of signed grants
EU contribution
to signed grants (EUR
million)
Share of EU contribution
to signed grants
Partici-pations
Newcomer participa-
tions
Private sector partici-pation
SME parti-cipati
on
COFUND-EJP
3 0.0% 494.6 2.4% 99 3 1 0
CSA 923 8.3% 1212.8 5.9% 7379 1596 1426 1076 ERA-NET-Cofund
44 0.4% 340.5 1.7% 992 36 14 3
ERC-ADG 468 4.2% 1096 5.4% 563 6 6 7 ERC-COG 693 6.2% 1329.8 6.5% 773 5 4 2 ERC-LVG 2 0.0% 0.1 0.0% 2 1 0 0 ERC-POC 320 2.9% 47.7 0.2% 346 12 21 17 ERC-STG 950 8.6% 1397 6.8% 1027 7 3 4 IA 684 6.2% 3513.8 17.2% 7491 2295 4151 2169 MSCA-COFUND
55 0.5% 163.7 0.8% 55 1 0
MSCA-IF 2444 22.0% 450.5 2.2% 2467 14 16 8 MSCA-ITN 389 3.5% 1259.8 6.2% 3195 293 739 415 MSCA-RISE 265 2.4% 223 1.1% 1718 364 466 345 PCP 12 0.1% 47.9 0.2% 100 23 16 6 PPI 2 0.0% 5.4 0.0% 15 7 2 1 RIA 1680 15.1% 8018.2 39.3% 20046 3481 6996 3726 SGA 82 0.7% 17.6 0.1% 489 304 106 38 SME-1 1670 15.0% 83.5 0.4% 1817 1534 1815 1817 SME-2 422 3.8% 698.2 3.4% 516 393 516 513
Total 11108 100.0% 20400.1 100.0% 49090 10375 16298 10147

80
D.5. Member States
Table 10 Summary table - applications by Member States
Nu
mb
er
of
app
lican
ts
Shar
e o
f ap
plic
ants
Nu
mb
er
of
app
licat
ion
s
Shar
e o
f ap
plic
atio
ns
EU c
on
tri-
bu
tio
n
req
ue
ste
d
Shar
e o
f EU
con
trib
uti
on
req
ue
ste
d
Succ
ess
rat
e
(ap
plic
atio
ns)
Shar
e o
f p
riva
te
sect
or
app
licat
ion
s
Shar
e o
f SM
E
app
licat
ion
Shar
e o
f n
ew
com
er
app
licat
ion
s
Austria 1668 2.2% 9316 2.5% 4199.5 2.4% 16.6% 37.1% 27.3% 25.3%
Belgium 2397 3.2% 14080 3.7% 6185.1 3.6% 17.0% 31.5% 22.9% 23.9%
Bulgaria 1018 1.4% 2594 0.7% 716.1 0.4% 9.0% 47.1% 41.0% 60.7%
Croatia 632 0.8% 2020 0.5% 549.6 0.3% 10.6% 38.0% 26.8% 48.8%
Cyprus 362 0.5% 2082 0.5% 738.9 0.4% 10.7% 44.8% 41.6% 29.6%
Czech Republic
975 1.3% 4149 1.1% 1426 0.8% 13.3% 35.7% 26.7% 31.8%
Denmark 1382 1.8% 8382 2.2% 4488.8 2.6% 14.8% 33.5% 24.3% 24.6%
Estonia 501 0.7% 1961 0.5% 727.8 0.4% 12.1% 41.6% 36.9% 41.6%
Finland 1649 2.2% 8300 2.2% 4657.5 2.7% 12.9% 35.3% 34.0% 30.1%
France 5149 6.9% 28702 7.6% 15315.9 8.9% 16.5% 39.0% 23.6% 24.0%
Germany 7438 9.9% 42637 11.2% 22492.8 13.1% 15.6% 36.4% 23.1% 22.6%
Greece 1801 2.4% 12383 3.3% 4788.3 2.8% 12.2% 37.3% 26.1% 24.0%
Hungary 1478 2.0% 4740 1.3% 1650.8 1.0% 10.4% 52.5% 45.9% 48.8%
Ireland 1072 1.4% 6043 1.6% 3069.6 1.8% 15.0% 38.9% 26.7% 26.6%
Italy 9040 12.1% 43222 11.4% 18036.5 10.5% 11.4% 44.7% 31.9% 34.0%
Latvia 441 0.6% 1384 0.4% 384.5 0.2% 11.0% 42.3% 34.2% 51.8%
Lithuania 471 0.6% 1572 0.4% 404.6 0.2% 11.1% 37.3% 28.2% 45.2%
Luxembourg 216 0.3% 1045 0.3% 425.2 0.2% 15.8% 50.2% 29.5% 28.8%
Malta 154 0.2% 641 0.2% 182.6 0.1% 13.3% 52.6% 40.1% 48.2%
Netherlands 3527 4.7% 21174 5.6% 11161.1 6.5% 16.1% 36.7% 24.6% 24.6%
Poland 2227 3.0% 7630 2.0% 2414.4 1.4% 11.0% 41.3% 31.8% 44.2%
Portugal 1625 2.2% 9148 2.4% 3391.2 2.0% 12.4% 37.0% 29.9% 29.8%
Romania 1217 1.6% 4099 1.1% 1187 0.7% 11.3% 39.4% 22.3% 45.6%
Slovakia 613 0.8% 1842 0.5% 652.4 0.4% 13.2% 47.5% 34.9% 48.7%
Slovenia 1091 1.5% 4351 1.1% 1419.1 0.8% 10.0% 44.9% 39.6% 44.1%
Spain 7206 9.6% 40361 10.6% 16536.2 9.6% 13.3% 42.3% 30.8% 30.4%
Sweden 1912 2.6% 10843 2.9% 5899.2 3.4% 15.2% 32.0% 20.5% 24.4%
UK 7053 9.4% 45757 12.1% 24981.2 14.5% 14.4% 30.9% 22.2% 23.1%
EU-28 64178 85.8% 340458 89.8% 158081.9 92.1% 14.0% 38.1% 27.1% 28.5%
EU-13 11177 14.9% 39065 10.3% 12453.8 7.3% 11.1% 43.0% 34.2% 44.6%
EU-15 53013 70.9% 301393 79.5% 145628.1 84.8% 14.4% 37.5% 26.2% 26.5%
Associated Countries (16 in total)
6310 8.4% 26997 7.1% 12128.5 7.1% 13.7% 37.1% 23.9% 33.3%
Third Countries (144 in total)
4340 5.8% 11671 3.1% 1514.9 0.9% 18.3% 17.2% 5.5% 47.3%
Total (188 countries)
74769 100.0% 379169 100% 171725.4 100% 14.1% 37.4% 26.2% 29.5%
Source: CORDA, Cut-off date by 1/1/2017 (including grants to named beneficiaries, except for calculation of
success rate, where they are excluded)

81
Table 11 Country performance summary table (participations, participants, EU
contribution, number of coordinators, success rates, newcomers)
Num-ber of Participants
Share of
Participants
Num-ber of
participations
Share of
participations
Num-ber of coordinators
Share of
coordinators
EU contribution to Partici-pation (EUR
million)
Share of EU
contri-bution
to Participation
s
Success rate of
applica-tions
Share of
private sector partic-
ipations
Share of SME parti-
cipations
Share
Austria 463 2.8% 1404 2.9% 279 2.5% 576.2 2.8% 16.6% 37.7% 22.6% 20.5%
Belgium 713 4.3% 2194 4.5% 377 3.4% 965 4.7% 17.0% 26.9% 20.9% 19.6%
Bulgaria 150 0.9% 246 0.5% 18 0.2% 29.8 0.1% 9.0% 24.0% 18.7% 37.4%
Croatia 108 0.6% 208 0.4% 15 0.1% 32.1 0.2% 10.6% 26.0% 12.5% 38.5%
Cyprus 73 0.4% 230 0.5% 44 0.4% 61.8 0.3% 10.7% 36.1% 30.9% 18.3%
Czech Republic
201 1.2% 506 1.0% 49 0.4% 129.2 0.6% 13.3% 32.2% 20.6% 23.3%
Denmark 347 2.1% 1157 2.4% 326 2.9% 497 2.4% 14.8% 30.3% 20.1% 20.5%
Estonia 106 0.6% 241 0.5% 65 0.6% 66 0.3% 12.1% 34.0% 29.0% 27.8%
Finland 327 2.0% 995 2.0% 208 1.9% 430.3 2.1% 12.9% 32.0% 19.7% 22.3%
France 1394 8.4% 4409 9.0% 1013 9.1% 2097 10.3% 16.5% 36.2% 19.2% 18.5%
Germany 1974 11.8% 6280 12.8% 1281 11.5% 3464.4 17.0% 15.6% 35.5% 18.7% 17.6%
Greece 396 2.4% 1426 2.9% 211 1.9% 434.7 2.1% 12.2% 32.4% 21.7% 17.2%
Hungary 206 1.2% 439 0.9% 80 0.7% 108.8 0.5% 10.4% 36.7% 30.8% 33.3%
Ireland 254 1.5% 855 1.7% 253 2.3% 356.3 1.7% 15.0% 36.8% 24.9% 19.4%
Italy 1672 10.0% 4675 9.5% 996 9.0% 1663.6 8.2% 11.4% 40.3% 25.0% 23.4%
Latvia 72 0.4% 147 0.3% 18 0.2% 21.6 0.1% 11.0% 22.4% 17.0% 29.3%
Lithuania 81 0.5% 172 0.4% 26 0.2% 21 0.1% 11.1% 33.1% 20.9% 40.1%
Luxembourg 70 0.4% 165 0.3% 27 0.2% 54.2 0.3% 15.8% 44.8% 21.8% 29.7%
Malta 34 0.2% 84 0.2% 13 0.1% 15.6 0.1% 13.3% 27.4% 21.4% 39.3%
Netherlands 933 5.6% 3109 6.3% 770 6.9% 1565.5 7.7% 16.1% 32.9% 20.5% 17.9%
Poland 376 2.3% 784 1.6% 110 1.0% 184.5 0.9% 11.0% 27.3% 18.8% 28.6%
Portugal 389 2.3% 1091 2.2% 206 1.9% 342.9 1.7% 12.4% 31.4% 24.1% 23.3%
Romania 233 1.4% 439 0.9% 32 0.3% 77.2 0.4% 11.3% 25.1% 12.8% 37.6%
Slovakia 124 0.7% 239 0.5% 28 0.3% 50.3 0.2% 13.2% 40.2% 22.2% 37.2%
Slovenia 187 1.1% 419 0.9% 66 0.6% 109.4 0.5% 10.0% 37.2% 28.4% 30.3%
Spain 1781 10.7% 5006 10.2% 1344 12.1% 1812.8 8.9% 13.3% 38.8% 25.6% 23.1%
Sweden 474 2.8% 1517 3.1% 291 2.6% 703.8 3.4% 15.2% 32.0% 16.2% 20.4%
UK 1641 9.8% 6289 12.8% 2153 19.4% 3082.5 15.1% 14.4% 27.2% 19.4% 17.0%
EU-28 14779 88.6% 44726 91.1% 10299 92.7% 18953.4 92.9% 14.0% 33.9% 21.3% 20.8%
EU-13 1951 11.7% 4154 8.5% 564 5.1% 907.4 4.4% 11.1% 31.1% 21.8% 31.2%
EU-15 12828 76.9% 40572 82.6% 9735 87.6% 18046 88.5% 14.4% 34.2% 21.2% 19.7%
Associated Countries (16 in total)
1241 7.4% 3436 7.0% 805 7.2% 1332.1 6.5% 13.7% 30.3% 17.0% 22.5%
Third Countries (87 in total)
659 4.0% 928 1.9% 4 0.0% 114.7 0.6% 18.3% 11.0% 6.0% 33.3%
Total (131 countries )
16679 100% 49090 100% 11108 100% 20400.1 100% 14.1% 33.2% 20.7% 21.1%
Source: CORDA, Signed Grants cut-off date by 1/1/2017 (including grants to named beneficiaries, except for
calculation of success rate, where they are excluded)

82
D.6. Benchmarking with FP7
Figure 44 FP7 vs Horizon 2020 benchmarking
FP7
2007-2013,
€ 55 billion
Horizon
2020
2014-2020,
€ 74.8 billion
Status as of
01/01/2017
Difference
Eligible proposals submitted (number) 134 535
102 076
-
-
EC Contribution requested in eligible proposals (EUR million) 216 358 172 748 -
High Quality Proposals submitted (number) No info 45 632 -
EC Contribution requested in High Quality Proposals (EUR million) No info 85 006.1 -
Signed grants (number) 25 781 11 108 -
EC Contribution to signed grants (EUR million) 45 452 20 400.1 -
Applications in proposals (number) 563 079 379 169 -
Open Access (share of peer-review publications provided in open-access) 61.8% 60.8% 1 pps
Peer reviewed publications (number) 219 620 4 043 -
Patent applications (number) 2 669 153 -
Newcomers (share of participants) Above 70% 52.1% 19.9 pp
Collaborative projects (% of total EC contribution) 72% 76% 4pps
Time to grant in number of days (excl. ERC) 303 days 192.2 days 110.8
days Funding rate (EC contribution as % of total project costs) 70% 70% stable
Concentration of funding to top 100 beneficiaries (% of EC contribution) 34.6% 32.9% 1.7 pps
Yearly
(2007-
2013 for
FP7;
2014-
2016 for
Horizon
2020)
.. EU contribution to signed grants (EUR million) 6 493.1 6 800.0 4.7%
.. EU contribution requested in eligible proposals (EUR million) 31 111.1 57 582.7 85.1%
.. eligible proposals submitted 19 219 34 025 77.0%
.. participations supported 19 736 16 363.3 17.1%
.. signed grants 3 683 3 703 0.5%
.. participants supported 4332 5 559.6 28.3%
.. applications submitted 80 440 126 390 57.1%
.. applications submitted from private sector 20 443 47 293 131.3%
.. applications submitted from SMEs 19 027 33 145 74.2%
Private
sector
(PRC)
.. share of applications 25.4% 37.4% 12.0 pps
.. share of participations 30.4% 33.2% 2.4 pps
.. share of EU contribution 24.2% 27.7% 3.5 pps
SME
.. share of applications 23.7% 26.2% 2.5 pps
.. share of participations 18.4% 20.7% 2.3 pps
.. share of EU contribution 14.4% 16.0% 1.6 pps
EU-13
.. share of applications 9.6% 10.3% 0.7 pps
.. share of participations 7.9% 8.5% 0.6 pps
.. share of EU contribution 4.2% 4.4% 0.2 pps
Associate
d
countries
.. share of applications 8.4% 7.1% 1.3 pps
.. share of participations 8.2% 7.0% 1.2 pps
.. share of EU contribution 9.0% 6.5% 2.5 pps
Third
countries
.. share of applications 5.6% 3.1% 2.5 pps
.. share of participations 3.6% 1.9% 1.7 pps
.. share of EU contribution 1.3% 0.6% 0.7 pps
Success
rate
.. of projects’ proposals 18.4% 11.6% 6.8 pps
.. of total funding requested 19.9% 12.7% 7.2 pps
.. of total applications 21.8% 14.1% 7.7 pps
.. for private sector (applications) 23.3% 13.0% 10.3 pps
.. for SMEs (applications) 20.2% 12.0% 8.2 pps
.. of EU-13 countries (applications) 18.0% 11.1% 6.9 pps
.. of Third Countries (applications) 23.8% 18.3% 5.5 pps
.. of Associated Countries (applications) 21.7% 13.4% 8.3 pps
Proposals’
evaluation
Number of proposals evaluated per year ~20 000 ~33000 65%
Time spent per evaluator per proposal 0.8 day 0.7 day 0.1 day
Source: CORDA, cut-off date 1/1/2017 and EMM2

83
D.7. Newcomers
78% of all organisations that applied to Horizon 2020 funding in the first three years of
programme implementation where newcomers (i.e. have not received funding under FP7)
requesting 22% of the overall requested EC funding. Each returning participant applied for
Horizon 2020 funding 17 times on average whereas each newcomer applied for Horizon 2020
funding 2 times on average during the first three years of the programme implementation.
53.4% of the returning participants applying to the programme were successful with at least one
submitted proposal being selected, whereas only 18.1% of the newcomers were successful with
at least one submitted proposal being retained. This is in part explained by the fact that the
returning participants submitted many more proposals and as such increased their probability to
be selected. At the same time, the success rate of proposals submitted by returning participants is
still considerably higher (13.9%) when compared to newcomers (9.2%).
As a result, newcomers represent 52% of all organisations participating in Horizon 2020 but their
share of obtained funding is only 14% of the total Horizon 2020 budget implemented in the first
three years of the programme.
Figure 45 Number of applicants and participants (left) for newcomers and returning
participants to Horizon 2020 (compared to FP7) and total requested and obtained EC
contribution in signed grants (right)
Note: The percentages refer to newcomers. The figures above the bar refer to total numbers for the programme as a
whole. Source: CORDA cut-off date 1.1.2017
Newcomers Returning participants
The highest share of newcomers and returning participants that applied to Horizon 2020 is from the private sector: 79% of newcomers and 57% of the returning applicants were from the private sector.

84
The highest share of newcomers and returning participants that signed grants in Horizon 2020 is also from the private sector: 73% of the newcomers are from the private sector, compared to 50% of the returning participants. The success rates among the different types of organisations differ from 26.2% for public bodies to 12.5% for universities.
The highest share of requested EC contribution among the newcomers is also from the private sector (80%), but a few applicants (29% or 4684) from research organisations and universities requested 80% of the overall funding requested by returning participant. On average each returning participant from research organisation or university submitted 42 proposals to the Horizon 2020 programme in the first three years of implementation.
Amongst newcomers, the highest share of the funding goes to the private sector (78%). Amongst returning participants, the largest share of the funding of goes to research organisations and universities.
Looking at different types of actions implemented under Horizon 2020, Research and Innovation
Actions (RIA) and Innovation Actions (IA) attracted the highest number of newcomer applicants
(53% of all newcomer applicants applied to this type of support) followed by the SME
Instrument (25% of all newcomer applicants). Consequently 54% of all newcomers participating
in Horizon 2020 do so through RIA and IA actions, 33% through the SME Instrument. 64% of
the EC contribution to newcomers came through RIA and IA actions, 21% through the SME
Instrument.
Looking at the balance between newcomers and returning participants within each type of action
the European Research Council, the Cofund-EJP and the ERA-NET-Cofund are least attractive
to newcomers (less than 21% of all applicants to these actions are newcomers). However the
SME Instrument seems to attract almost exclusively newcomers to the Framework Programme
(91% of all applicants to these actions were newcomers, ie. did not participate to FP7) and as a
result 77% of the EC Contribution under the SME Instrument also went to newcomers.

85
Figure 46 Number of applicants and participants per action (above) for newcomers and
returning participants to Horizon 2020 (compared to FP7) and total requested and
obtained EC contribution in signed grants per action (below)
Note: The percentages refer to newcomers. Source: CORDA cut-off date 1.1.2017

86
E. SUCCESS STORIES FROM PREVIOUS FRAMEWORK PROGRAMMES
FP7 projects outcomes provide an illustration of the types of effects that can be generated by
R&I projects. The box below lists four projects and their main outcomes37
. These projects have
outcomes or results that have had a significant added value, impact on the society and potentially
on the economy.
Textbox 1: Examples of impacts from FP7 projects
HYPE
38
Based on the work conducted during HYPE (nine partners from four countries) and also during previous FP and nationally funded projects one partner built an advanced biorefinery demonstration plant at the port of Kalundborg in Denmark. The consolidated process developed during HYPE was tested in this plant. By the end of 2010 the demonstration plant was fully commissioned and went into the production phase. The first 2nd generation ethanol has been sold to Statoil and is now distributed in 100 filling stations all over Denmark as Bio95 2nd generation gasoline. Lignin pellets are also produced there and are sold to DONG Energy and used as high-quality solid biofuel in power plants.
METOXIA
39
This 11 partner project studied regulatory mechanisms which help cancer cells survive under micro-environmental conditions. The interviewed partners of the consortium state that the outcomes of this project were significant advancements in the area and led to new research projects, trials and commercialisation opportunities. One partner reported that his research group attracted more than EUR 20 million in grants and investment. The products developed during METOXIA are still at a very early stage, however, the impact could be large, as the drugs could address half of the population of patients with solid cancers that include breast, lung, prostate, cervix and brain tumours.
HIVE40
In 2013, the first computer mediated brain-to-brain communication was achieved using the knowledge and capabilities developed during the HIVE project. This ‘hyperinteraction’ communication achieved to send single words between one person in France and another in India using brain stimulation. The results of the experiment are considered a critical proof-of-principle demonstration of the possible development of conscious brain-to-brain communication technologies.
REBIOFOAM
41
The academia-industry collaboration between this 10 partners project developed an environmentally friendly biodegradable packaging material that can be used across a variety of industries, even for the packaging of heavy objects. The packaging material produces no waste; its production reduces energy use by more than 50% and cuts CO2 emissions. The REBIOFOAM project was the first eco-friendly packaging initiative with such a wide range of possible applications across industries.
37 For details and additional success stories please see Annex Part 2. 38 http://cordis.europa.eu/project/rcn/88489_en.html 39 http://cordis.europa.eu/project/rcn/91061_en.html 40 http://cordis.europa.eu/project/rcn/87676_en.html 41 http://cordis.europa.eu/project/rcn/90452_en.html

87
To showcase the longer term impact of previous Framework Programmes, the 'Expert Group on
evaluation methodologies for the interim and ex-post evaluations of Horizon 2020'42
delineated
several portfolios of projects spanning from FP5 to Horizon 2020. Projects from these five
portfolios were scrutinized for impact through an analysis of corresponding policy documents,
publications, patents, pilots and demonstrators in order to evince the economic, environmental
and social impacts of previous Framework Programmes.
The patents developed within the portfolio analysing the effects of applying the Life Cycle
Assessment technique to the circular economy confirmed the high market value of results.
Successful production, pilots and demonstrators from this portfolio led to: a 40% better
performance in terms of global warming for multilayer composite decking boards; a 80% better
performance of raw materials with recycled cellular concrete for subfloors in all impact
categories; recycled gypsum consuming less than 65% of the energy required to produce natural
gypsum and emitting less than 65% of greenhouse gases; a reduction of carbon dioxide
emissions of 0.3 kg CO2-eq. for every kg of broiler feed using a novel mix diet, with the net
results of a total avoidance of 0.62 million tons of CO2 emissions to the atmosphere each year. A
further analysis on policy documents related to this projects’ portfolio revealed that in one
instance, the agreement between local companies and a regional public waste agency resulted in
meeting the ambitious goal of 30,000 tons of cellular concrete recycled in high-end applications
in 2014.
Looking at the economic impacts of fuel cells related projects one project managed to lower the
commercial cost of modular heating systems, after the deployment of 80 fuel cell Combined
Heat and Power (micro-CHP) systems across a number of Member States. Numerous spin-offs
were generated out of the projects, such as the company Plant-e.
Considerable environmental impact was also achieved through FP projects, such as a single FP5
project managing to replace 945,000 liters of Diesel fuel and avoid 2.5 tons of CO2 emissions by
using 27 Hydrogen-powered buses to transport four million people for more than one million
kilometres in nine European cities.
42
European Commission Expert group on evaluation methodologies for the interim and ex-post evaluations of Horizon 2020,
Applying relevance-assessement methodologies to Horizon 2020 (forthcoming report).

88
F. EUROPEAN ADDED VALUE CASE STUDIES43
F.1. European added value case study 1: Antimicrobial resistance
F.1.1. Overall context
(a) Definition and expected impact of the area
Antimicrobial resistance is the ability of microorganisms to resist antimicrobial drugs. Various
pathogens, including bacteria, viruses, fungi and parasites can evolve to be resistant to
antimicrobial drugs due to gene mutations over time.44
Generally, gene mutation is a naturally
occurring phenomenon. However, due to certain factors the evolution of microbes happens faster
than the development of new antimicrobial drugs. Excessive and inappropriate use of
antimicrobial medicines on humans and animals, and poor infection control practices, are both
speeding up the evolution of resistant strains of microbes and transforming antimicrobial
resistance into a worldwide public health threat.
Antimicrobials are used in various settings for different purposes. They are used to treat
infectious diseases (e.g. pneumonia, tuberculosis, malaria, HIV/AIDS) and hospital-acquired
infections (HAI) (e.g. methicillin resistant Staphylococcus aureus (MRSA). They are also used
in complex medical interventions, such as hip replacements, organ transplants, chemotherapy
and the care of premature babies that are at a higher risk of infection. In addition, antimicrobials
are used in veterinary medicine and in animal husbandry for non-therapeutic purposes (e.g.
disinfectants, preservatives, and food and feed additives). Hence, antimicrobial resistance cuts
across a wide range of areas that affect human health both directly and indirectly.
The misuse of antimicrobials can also occur at different levels. It can occur due to individual
misuse at patient level or inadequate prescription patterns by health professionals. In addition,
lack of clear antimicrobial drug prescription policies at national level and their monitoring also
contribute to the misuse of drugs. Finally, extensive promotion or pressure to sell large quantities
of drugs at industry level can influence the overuse of antimicrobials.
Although the rates of resistance to various antimicrobials are increasing, the discovery of new
antimicrobial drugs has decreased. The pressure to reduce the use of antimicrobials, together
with weak market incentives and increasing difficulty and costs related to the development of
new antibiotics have discouraged investment in this area. As a consequence, only a few new
antibiotics are currently under development by pharmaceutical industry.
(b) Rationale for public intervention: key trends in the area, main challenges and
indicators
Antimicrobial resistance is a global public health concern involving many different sectors (e.g.
medicine, veterinary medicine, animal husbandry, agriculture, environment and trade).
antimicrobial resistance cannot be successfully tackled through isolated, sectoral efforts. The fact
that resistance may spread from country to country when people and animals travel, or when
food and feed are traded, stresses the need for coordinated efforts across borders. In addition,
43 The seven case studies of EU added value were developed within the following study: PPMI, “Assessment of the Union Added
Value and the Economic Impact of the EU Framework Programmes (FP7, Horizon 2020)”, forthcoming 44 Communication from the Commission to the European Parliament and the Council - Action plan against the rising threats from
Antimicrobial Resistance. COM (2011) 748 final.

89
new antimicrobials, diagnostic tools or treatment guidelines are global public goods that should
be available to everyone in order for collective efforts to combat the resistance to be effective.
Antimicrobial resistance also carries a significant economic cost for countries’ healthcare
budgets. Several reports have produced estimates of mortality rates, productivity losses, societal
costs per patient and other associated expenditures related to antimicrobial resistance (see Table
1 for the full list of indicators). According to a report produced by ECDC and EMEA, a subset of
multidrug-resistant bacteria in Europe are responsible for about 25 000 of human deaths
annually.45
In addition to the avoidable deaths, this also translates into extra healthcare costs and
productivity losses of at least EUR 1.5 billion each year. In 2007, infections caused by antibiotic-
resistant bacteria resulted in approximately 2.5 million extra hospital days, which translated into
EUR 900 million hospital costs.
According to a report commissioned by the UK Government in collaboration with the Wellcome
Trust, 700 000 people die of resistant infections every year.46
If by 2050 the misuse of
antimicrobials does not decrease, approximately 10 million lives a year and USD 100 trillion of
economic output will be at risk due to the rise of drug resistant infections. If these projections
materialise, the mortality attributed to antimicrobial resistance would be higher than cancer
related deaths.
Table 12. List of key indicators related to antimicrobial resistance
Indicator Indicator values/examples
Antibiotic
consumption
Between 2000 and 2010, consumption of antibiotic drugs increased by 36% (from 54 083
964 813 standard units in 2000 to 73 620 748 816 standard units in 2010).47
Deaths attributable
to antimicrobial
resistance
10 million people die annually due to antimicrobial resistance.48
25 000 persons may have died in 2011 due to ARM in the EU.49
214 500 neonatal sepsis deaths are attributable to resistant pathogens each year.50
Antimicrobial
resistance cost
Hospital expenditure is on average an additional USD 10 000 to 40 000 to treat a patient
infected with antimicrobial resistance51
Antibiotics
consumed without
prescription
An estimated 20-30 % in Southern and Eastern Europe.52
Antibiotic use in
animal production
Global consumption of antimicrobials in food animal production was estimated at 63,151
(±1,560) tons in 2010 and is projected to rise by 67%, to 105,596 (±3,605) tons, by 2030.53
45 EMEA and ECDC Joint Technical Report. The bacterial challenge: time to react. 2009. 46 Tackling drug-resistant infections globally: final report and recommendations. The review on Antimicrobial resistance chaired
by Jim O‘Neill. (2016). 47 Van Boeckel, T. P., Gandra, S., Ashok, A., Caudron, Q., Grenfell, B. T., Levin, S. A., Laxminarayan, R. (2014). Global
antibiotic consumption 2000 to 2010: an analysis of national pharmaceutical sales data. Lancet Infectious Diseases, Vol. 14, pp:
742–50. 48 Tackling drug-resistant infections globally: final report and recommendations. The review on Antimicrobial resistance chaired
by Jim O‘Neill. (2016). 49 EMEA and ECDC Joint Working Group (2009). The bacterial challenge: time to react. A call to narrow the gap between
multidrug-resistant bacteria in the EU and the development of new antibacterial agents. Joint Technical Report 50 Laxminarayan, R., Matsoso, P., Pant, S., Brower, C., Røttingen, J. A., Klugman, K., Davies, S. (2015). Access to effective
antimicrobials: a worldwide challenge. Lancet Special Series. 51 Cecchini, M., Langer, J. and Slawomirski, L. (2015). Antimicrobial Resistance in G7 Countries and Beyond: Economic Issues,
Policies and Options for Action. OECD. 52 Morgan, D.J., Okeke, I.N., Laxmanirayan, R., Perencevich, E.N., Weisenberg, S. (2011). Non-prescription antimicrobial use
worldwide: a systematic review, Lancet Infectious Diseases, Vol. 11, No. 9, pp: 692-701. 53 Van Boeckel, T. P., Brower, C., Gilbert, M., Grenfell, B. T., Levin, S. A., Robinson, T. P., Teillant, A. and Laxminarayan, R.
(2014). Global trends in antimicrobial use in food animals. PNAS, Vol. 112, No. 18, pp: 5649-5654.

90
Indicator Indicator values/examples
Denmark has a highly productive farming system with levels of antibiotic use of less than
50 mg / kg.
From 2010 to 2030, global consumption of antimicrobials in livestock production will
increase by two thirds, and that it will double in the rapidly growing economies of Brazil,
Russia, India, China, and South Africa.54
EUROBAROMETER data
Levels of knowledge
on the use of
antibiotics
Measure the levels of public knowledge about the nature and effectiveness of antibiotics and
the risks associated with their unnecessary use. Based on 4 statements:
Antibiotics kill viruses (FALSE)
Antibiotics are effective against colds and flu (FALSE)
Unnecessary use of antibiotics makes them become ineffective (TRUE)
Taking antibiotics often has side-effects, such as diarrhoea (TRUE)
On average, only around a quarter (24%) of Europeans answered all four questions
correctly, while around half (51%) gave at least three correct answers, and 94% gave at least
one correct answer.
Use of antibiotics
during the last year
A third of Europeans have taken antibiotics in the last 12 months
Ways of obtaining
antibiotics
93% say that they obtained their last course of antibiotics from their health care provider
Source: PPMI, “Assessment of the Union Added Value and the Economic Impact of the EU Framework
Programmes (FP7, Horizon 2020)”, forthcoming).
In order to tackle antimicrobial resistance the EU employed a "One Health" approach and also
initiated coordination efforts between countries and international organisations. In 2011 the
European Commission adopted an action plan against the rising threats of antimicrobial
resistance.55
It contains 12 actions (see Table below) for implementation within EU Member
States, with seven key areas identified as most in need of practical measures:
making sure antimicrobials are used appropriately in both humans and animals
preventing microbial infections and their spread
developing new effective antimicrobials or alternatives for treatment
cooperating with international partners to contain the risks of antimicrobial resistance
improving monitoring and surveillance in human and animal medicine
promoting research and innovation
54 Robinson, T. R., Wertheim, H. F. L., Kakkar, M., Kariuki, S., Bu, D., Price, L. B. (2015). Animal production and antimicrobial
resistance in the clinic. Lancet Special Series. 55 Communication from the Commission to the European Parliament and the Council - Action plan against the rising threats from
Antimicrobial Resistance. COM (2011) 748 final.

91
Table 13. Actions outlined in the EC action plan against the rising threats of antimicrobial
resistance
No Actions
1 Strengthen the promotion of the appropriate use of antimicrobials in all Member States.
2 Strengthen the regulatory framework on veterinary medicines and on medicated feed via the
review package foreseen for 2013.
3 Introduce recommendations for prudent use in veterinary medicine, including follow-up reports,
using the same approach as 2002 Council Recommendation on prudent use of antimicrobial
agents in human medicine.
4 Strengthen infection prevention and control in healthcare settings.
5 Introduction of the new Animal Health Law, which will focus on prevention of diseases,
reducing the use of antibiotics and replacing current Animal Health provisions based on disease
control.
6 To promote, in a staged approach, unprecedented collaborative research and development
efforts to bring new antibiotics to patients.
7 Promote efforts to analyse the need for new antibiotics into veterinary medicine.
8 Develop and/or strengthen multilateral and bilateral commitments for the prevention and
control of antimicrobial resistance in all sectors.
9 Strengthen surveillance systems on antimicrobial resistance and antimicrobial consumption in
human medicine.
10 Strengthen surveillance systems on antimicrobial resistance and antimicrobial consumption in
animal medicine.
11 Reinforce and co-ordinate research efforts.
12 Survey and comparative effectiveness research.
Through its research framework programmes (e.g. FP7, Horizon 2020) the European
Commission contributed to several of these areas by funding research activities in the fields
related to antimicrobial resistance. Research projects directly or indirectly related to
antimicrobial resistance were conducted under different themes, including Health, Nanosciences,
Nanotechnologies, Materials & New Production Technologies (NMP), Knowledge Based
Bioeconomy (KBBE), Information and communication technologies (ICT) and others. A Joint
Programming Initiative on antimicrobial resistance (JPIAMR) was also established to create a
common research agenda and to integrate research efforts across national borders via alignment
and research funding.56
Since 2012 the JPIAMR is supported by the EC via a Coordination and
Support Action grant of EUR 2 million. The strategic research agenda of JPIAMR was launched
on 3 April 2014, and provides a framework for future investment and research priorities.57
So
56 http://ec.europa.eu/research/health/index.cfm?pg=area&areaname=amdr 57 Commission Staff Working Document: progress report on the Action plan against the rising threats from Antimicrobial
resistance. SWD(2015) 59 final

92
far, the initiative has brought together 22 members to coordinate their research in order to allow
greater impact in the field and avoid effort duplication.58
In order to promote adequate use of antimicrobial drugs, the European Commission launched a
EUR 1 million challenge prize to develop a rapid diagnostic test for upper respiratory tract
infections that can be safely treated without antibiotics.59
To foster the engagement of industry in
antibiotic research, several antimicrobial resistance related projects were launched under the
Innovative Medicines Initiative (IMI). IMI was launched in 2008 and is currently one of the
largest public-private partnership between the EU and the European Federation of
Pharmaceutical Industries and Associations (EFPIA).
(c) Defining the scope of the European added value case study
The EU has contributed more than EUR 1 billion towards combating antimicrobial resistance
over the years.60
More than EUR 600 million was allocated through FP7 to foster research and
innovation (see Table below for more information). The FP7 Health theme and Joint Technology
Initiative (JTI) ‘Innovative Medicines Initiative’ received the largest proportion of the funding,
around EUR 406 million and EUR 337 million respectively. The Health programme also had the
highest number of projects. In total, 85 projects related to antimicrobial resistance were funded
under the FP7 Health theme. Under IMI, nine projects related to antimicrobial resistance were
funded.
Antimicrobial resistance-related projects conducted under the Knowledge Based Bioeconomy
(KBBE) programme as well as Nanosciences, Nanotechnologies, Materials & New Production
Technologies (NMP) have also received significant funding under FP7. These projects received
approximately EUR 109 million and EUR 48 million respectively. There were 26 projects
funded under KBBE and eight projects funded under NMP. Nineteen projects related to
antimicrobial resistance were also conducted under ICT, Regional potential and Research for the
benefit of SMEs. Together these projects received around EUR 40 million of EU funding.
Table 14. Projects related to the area of antimicrobial resistance and their allocated EU
contribution
Programme Number of projects EU contribution, EUR million
FP7 Health 85 406 180 902,2
FP7 ICT 4 20 410 712
FP7 Regional potential 2 5 218 112
FP7 NMP 8 47 802 599
FP7 KBBE 26 108 974 798
FP7 Research for the benefit of SMEs 13 14 227 801
FP7 JTI IMI 9 335 767 601
Total 147 602 814 924,20
Source: PPMI, “Assessment of the Union Added Value and the Economic Impact of the EU Framework
Programmes (FP7, Horizon 2020)”, forthcoming , based on CORDA data
58 Matthiessen, L., Bergström, R., Dustdar, S., Meulien, P., Draghia-Akli, R. (2016). Increased momentum in antimicrobial
resistance research. Lancet, Vol 388, pp: 865. 59 http://ec.europa.eu/research/index.cfm?pg=newsalert&year=2015&na=na-260215 60 Matthiessen, L., Bergström, R., Dustdar, S., Meulien, P., Draghia-Akli, R. (2016). Increased momentum in antimicrobial
resistance research. Lancet, Vol 388, pp: 865.

93
As antimicrobial resistance cuts across different areas, in this case study a choice was made to
include projects that were indirectly or directly related to antimicrobial resistance research.
Projects in the areas of infection control, diagnostics, public health, drug development and
clinical trials were included. As antibiotics are used in humans and animal husbandry, projects
related to both human and animal health were selected.
F.1.2. Key findings
(a) Factors/mechanisms of influence fostering European added value
Reduction of commercial/research risks
In terms of commercial and research risks, many interviewees agreed that risks are reduced
or shared between the partners in European FP projects. Small and Medium-sized
Enterprises (SMEs) that are working in the late development and close to market phases face
more risks compared to basic research projects. In addition, compared to academic researchers
companies need to deliver specific products and might need to take higher risks to achieve that.
Therefore, EU funding can help to mitigate those risks with upfront payments. Some funding for
companies might also be available at local levels. Many researchers said that national
governments are moving towards the implementation of different funding mechanisms for
SMEs. However, the situation still depends on the country and research funding policies. The
support available nationally might not be as substantial as provided through EU funding
mechanisms.
Regarding research risks, the fact that in the FP projects researchers work in consortia helps to
mitigate risks to a large extent. As stated by a number of interviewees, some projects are
successful and others might encounter obstacles in reaching their results or delivering results that
are different from what was initially planned. This is part of the overall research process. The
fact that there are different teams and work packages involved in projects helps to secure that
research progress is made, irrespective of possible setbacks. Also, FP projects in the
antimicrobial resistance field often involve different levels of research advancement, from basic
to applied and clinical research. This approach also helps to spread risks compared to a focused
project conducted by one research group.
Leverage of private and public investment
The interview participants agreed to a large extent that the participation in European FP
projects helps to attract further research funding. Regarding public investment, some
researchers stated that participation in a large international collaborative project is seen as a
benefit by funders, although this differs between countries and funding agencies. Depending on
the country, some national agencies (as stated by respondents from Norway, Sweden, the UK)
value participating in FP projects more and others (as stated by interviewees from Spain and
Austria) do not differentiate between research experience gained nationally or through European
collaborative projects.
In terms of leveraging private funding, the Innovative Medicines Initiative (IMI) programme
New Drugs for Bad Bugs (ND4BB) has fostered the industry’s participation in the antimicrobial
resistance area and generated significant in kind contribution from the industry. The programme
was started with an aim to research and tackle the scientific, regulatory and business challenges
that lay in the development of new antibiotics. Through the partnership between industry,
academia and biotech organisations, seven large projects were funded. The total budget of the

94
programme was EUR 700 million, with industry contributing half of this sum in-kind (personnel
costs).
However, a few projects also mentioned the problem of attracting funding from the
pharmaceutical industry for the commercialisation of their project results. The projects are facing
a ‘valley of death’ where their formulations or technologies produced cannot be further
developed due to a lack of funding from companies. Although, the outcomes of the projects are
ready for commercialisation or licensing, finding industrial partners interested in conducting
clinical trials and continuing with development is proving difficult.
Pooling resources and building critical mass
The majority of interviewees confirmed that there was resource sharing or pooling in the
EU projects they participated in. In some cases, it included equipment, but mostly researchers
pooled and shared samples, animal models, patient data, research protocols or bacterial strains.
Most of the interviewees said that such resource pooling could be done nationally. Some
researchers also stated that doing it at national level could be easier due to faster communication
and lower transportation costs. However, the scale of the material available or collaboration
opportunities would be much smaller. For example, one project has established a network of 700
clinical trial sites across 42 countries in Europe and this would not be possible on a national
scale. The existence of such a network means that clinical sites are already identified and the
preparation phase for clinical trials is shortened to a minimum. Hence, clinical trials can be
initiated much faster.
The most commonly emphasised aspect of FP projects compared to national projects was
the pooling of scientific expertise and collaboration with the experts working in the
antimicrobial resistance area from other EU or third countries. Since resistance patterns are
different across the globe and human behaviours in antibiotic use also differ, working across
country borders helps to pool knowledge and expertise. Since antimicrobial resistance can spread
easily across borders, employing diverse expertise can help to build the knowledge base quicker
and more effectively.
Some respondents stated that due to the broad scope of FP projects, they require the
engagement of diverse interdisciplinary and inter-sectoral expertise. This is the case for IMI
projects that often involve more than 20 partners from academia and the private sector, and also
for regular FP7 projects. For example, they analyse different bacteria, several types of nano-
carrier systems, several drug formulations or are conducting clinical trials. These types of
projects require pooling various lines of work, including transcriptomics, microbiology,
proteomics, epidemiology and others. Gathering all the competencies and capacities needed for
such broad projects in one country would not be possible in any single Member State.
Another aspect of European added value emphasised by researchers was the larger sums of
funding available in FP projects compared to nationally funded projects. According to some
researchers, the amount awarded to some projects would not be feasible for some governments.
Support available from the EU helps to ensure longer term funding for projects focused on
research questions that cannot be addressed by individual laboratories or research groups.
Interviewees also said that large funding brings another dimension and size to project
activities and helps to build the critical mass needed for research in certain areas of
antimicrobial resistance. Some estimates state that it costs over USD 1 billion (EUR 0.9
billion) to bring a pharmaceutical to the market. Large scale projects are particularly needed

95
when running clinical trials. It also becomes cheaper and more effective to run clinical trials, as
the required levels of resistance and number of patients are much easier to reach when
collaborating across countries.
Increased international and/or inter-sectoral mobility of researchers
International and inter-sectoral mobility of students was emphasised by some beneficiaries
as a pertinent aspect of FP funded projects. There were PhD students and postdoctoral
exchanges between different academic centres, between academia and industry, and between
labs in different countries. However, the relevance of this aspect depended on the specific area of
the antimicrobial resistance research. Whereas some research groups saw it as a great
opportunity, others appreciated other aspects of EU projects more. For example, in clinical trials
mobility and exchange was not always seen as crucial:
Interviewed scientists said that in many countries student exchange is also funded by
national or regional funding agencies. Although in these instances mobility can take place
only on a national level or bilaterally. In European projects, mobility occurs across country
borders and contributes to networking, idea exchange and capacity building among young
scientists. According to some interviewees, collaboration between researchers from different
parts of Europe promotes capacity building as well. Particularly in countries where research
funding is lower (Eastern European or Southern European countries) FP projects allow them to
come on board and improve their research capacities.
(b) Better results achieved because of European added value
Improved research capabilities/excellence
Through the interviews with the beneficiaries, there are a few aspects of FP funding that were
found to improve research capabilities and excellence in the area of antimicrobial resistance. All
researchers agreed that FP funding gives many opportunities to network and exchange ideas
with the best scientists across the EU. It also provides opportunities to engage with new
expertise, new methodologies, techniques and instruments. Also, EU projects are
multidisciplinary and thus allow collaborations to happen across different fields. According to
the interviewees, the spill overs of knowledge and ideas that occur through such collaborations
can advance antimicrobial research.
Since EU funding is usually much larger than nationally available funding, bigger research
bottlenecks in the antimicrobial resistance can be addressed. This is of particular relevance
in the field where no new antibiotics have been developed for decades. Respondents said that to
change this situation, efforts across a spectrum of research activities are needed. From
identification of molecules, implementation of the formulations, pre-clinical in vitro testing, to in
vivo testing and clinical studies. These are large efforts in terms of the development phases they
include. Compared to EU projects, national research agencies fund much more focused, targeted
and smaller activities. They are also needed to complement EU projects but the scale and scope
of research questions they can address are much lower.
Through interviews, there were some distinct views found when comparing national
research capacities in the antimicrobial resistance field to capacities available at the
European level. Most of the scientists (although there were exceptions) working in the UK,
France, Belgium, Sweden and the Netherlands stated that for many research areas, nationally
existing expertise would be sufficient to implement projects of such broad scope as FP projects.

96
Scientists from Norway, Austria, Switzerland and Italy, and researchers working in
epidemiology or conducting clinical trials, said that national expertise would not be sufficient.
Particularly, in large comparative multicentre studies or, as one respondent said, in a very
specific field of science.
The opinions of interviewed scientists also differed on whether or not EU funding helps to
increase scientific capabilities better than national funding. Many interviewed researchers
stated that this was possible due to the large amount of funding available. But many Member
States, particularly in the North West of Europe, also have large R&D budgets and provide
funding for PhD and postdoctoral students. In certain cases, interviewed researchers suggested
that EU research funding could help certain countries to build up their research capacities.
Mostly, for the MS from the South and East of Europe, this can improve their research
capabilities due to collaboration and exchange opportunities offered by FP funding.
Wider availability and dissemination of knowledge
Some of the interviewed researchers agreed that European efforts to promote open access
and data sharing and wider dissemination of research results are stronger compared to
national level efforts (Sweden). Others stated that both national and EU efforts are at the
same level or that national research agencies are catching up and also include requirements
for open access publishing (Belgium, Norway, the UK). However, not all of the interviewees
saw open access publishing as the best way to disseminate one’s research results. The facts that it
is costly and that the open access journals are usually low ranked were named as significant
drawbacks of open access publishing.
Some of the researchers stated that with or without open access, disseminating research
outcomes and reaching wider audiences is becoming more and more difficult. With increasing
numbers of publications, it gets harder to draw attention of academia and the public. European
collaborative projects are seen to have an advantage here. Since there are many partners involved
and publications are usually co-authored, it helps to widen dissemination and strengthen the
impact of research results:
However, apart from open access publications, researchers emphasised the importance of
opening and depositing research data in online repositories. In the area of antimicrobial
resistance, this was stressed as a crucial factor to advance research and provide some urgently
needed answers. Interviewees stated that having more data openly available would make
research easier and more efficient, help to advance new treatment strategies and develop new
drugs faster. As data is not published or is not available, there is duplication of research efforts
and a subsequent waste of resources. When data is not open, scientists might be working on the
same discoveries that were already made. For example, when studying toxicity, there is a strong
probability that many models were tested for toxicity previously but the data is not published
openly. Conducting trials in this area would results in a significant waste of research money.
Openly depositing data would save time and resources but also would provide opportunities to
analyse data from different angles and perspectives. One project funded by FP7 (already
described above) is working to develop such a database of tuberculosis patient data. It will
comprise data from older and recent clinical tuberculosis trials and will provide ample
possibilities for further research.
Researchers also see a need for more guidance and stewardship in developing and setting up
one platform that would facilitate data storing. There is already a lot of data collected,
analysed and stored by ECDC on epidemiology, surveillance, resistance levels and antibiotic use.

97
Still, for new drug developments, more advanced techniques and the omics technologies, a data
depository is still missing. Having a common platform where publication associated original data
could be stored safely and accessed by peers was seen as a real benefit by the interviewed
researchers. In projects with industry involvement, a single platform and clear data publishing
rules in EU funded projects would help to open more data that companies are not always willing
to reveal. Feedback from researchers stated that currently there are many questions arising data
ownership and issues of intellectual property rights when working with private industry.
Economies of scale and scope
Although this aspect was not extensively addressed by respondents, some reported several
factors on why carrying out antimicrobial research through pan-European collaborations
can reduce research costs. Conducting smaller projects that have the same aim and scope in
different institutions and countries reduces the possibilities to pool the results and increases the
overall cost of running such projects. On the other hand, running several research lines in one
project might be more efficient. Also, the fact that antimicrobial resistance related projects are
complex in terms of the different disciplines and phases of development they encompass was
mentioned by many researchers. This complexity translates into projects that are very expensive
for national funders. By combining expertise and funds and running collaborative projects,
funders make the best use of resources and prevent that two or more expensive studies are
conducted simultaneously.
Better coordination of national research policies and practices at the EU level
Overall, researchers saw national and European projects in antimicrobial resistance differently
due to the much larger scale and scope of the later projects. Both types of research activities
were seen as complementary rather than fragmented or as duplications of a research
effort. This is because, according to researchers, there are many knowledge gaps in the
antimicrobial resistance area that need to be filled in by both smaller, more focused studies as
well as large scale projects. Also, rates of infections, levels of resistance and prescription and
consumption of anti-infective drugs are diverse across Europe and the world. Hence, conducting
studies with similar goals or validating results in different regions is seen as valuable to generate
stronger evidence.
Regarding research coordination, most of interviewed participants saw a need for a macro
level coordination between the EU, other big funding agencies (e.g. BARDA) and
international organisations such as WHO or EU organisations such as ECDC. This type of
coordination could help to align strategies and organise data management more efficiently.
Regarding coordination of national and EU research policies, not all researchers were aware of
the already existing mechanisms. As one of the interviewees put it that few results of these
mechanisms are disseminated. The researchers who knew or had participated in calls for ERA-
NETs and JPIAMR projects stated that these efforts do not provide equal opportunities for all
European research groups to participate but favour certain clubs. Some researchers also stated
that this kind of coordination is not always effective since resources are used to manage the
interests of the Member States.
Some researchers see a lack of coordination and communication between projects
conducted under FP7. They stated that projects should put more effort on aligning their
research activities and collaborate more in result dissemination. Particularly in projects where
data can be pooled together to validate the results or in projects that are funded under the same
calls. This might need a different leadership from the EC and possibly a different outcome-based

98
funding strategy for antimicrobial resistance related projects. According to some of the
researchers, more communication between projects themselves and between projects and project
officers would help to avoid duplication of research efforts. It would also ensure that the funding
is spent effectively and would help to maximise the uptake of the results and outcomes of FP
projects. Such close communication could also better inform further policy or research agenda
setting.
Although there were researchers saying that more coordination between FP projects is needed,
there are also examples of well-coordinated research activities. For instance, the FORMAMP,
PNEUMONP and NAREB projects funded under Nanosciences, Nanotechnologies, Materials
and New Production Technologies theme in FP7. They work towards unifying methods and
uniting efforts to disseminate their work to the general audience, industry and decision-makers.
There are challenges in management and result sharing due to IPR issues, according to the
coordinator of one of the projects. But the cluster of the three projects aims to overcome them
and foster collaborative and synergistic approaches.
(c) Long-term impacts resulting from European added value
Addressing societal/ pan-European challenges
Most researchers believed that European collaborative projects address infectious diseases and
the antimicrobial challenges better than national level projects. Pan-European projects can
have bigger impacts as they reach much wider audiences across Europe. National level
projects are still needed though, as they are complementary to European or international projects.
However, they are not equipped to produce as significant impacts in the antimicrobial resistance
area as FP projects since their scope is usually narrower, their funding is considerably lower and
the funding policies are more vulnerable to political circumstances.
In addition, to address antimicrobial resistance, very broad studies are needed that deal with
different levels of antimicrobial resistance, including prevention, infection diagnostics,
epidemiology and treatment strategies. Conducting such studies nationally would be less
efficient and more expensive. According to some researchers, 15 or more years are needed to
find a new drug and bring it to the market. Many different actors are involved in this process. EU
funding allows to address several aspects of the R&D chain of drug development in one project.
The interviewees also reported that FP funding has contributed to a significant change in
antimicrobial research through the IMI programme New Drugs for Bad Bugs. Industry’s
involvement is crucial in order to develop new anti-infective drugs and bring them to patients.
However, the monetary incentives for pharmaceutical companies to work in this area are very
low as the field is not profitable. The Innovative Medicines Initiative showcases a new
collaboration model between academia and industry to advance the developments in the
antimicrobial resistance field. The programme has already helped to generate more interest from
the industry to engage in this field of research.
Also, projects conducted under FP7 will contribute to overcoming several challenges in
antimicrobial resistance. The possibility to deliver new drug compounds to the market could
save many lives of patients that cannot be treated with currently available anti-infectives. Other
areas, such as immunization, epidemiology, new diagnostics or better surveillance could have
economic impacts. Healthcare costs and treatment costs that are very high, particularly for
multidrug resistant pathogens, could be reduced. Patient stays in hospitals or sick days could also
be reduced. Several projects also reported that they actively collaborate with policy makers, such

99
as the European Medicines Agency and that their results have had an effect on antibiotic
stewardship policies and infection control policies.
European research in the antimicrobial area has a good track record, according to the interviewed
participants. Due to already invested large amounts of funding and the expertise that has
been built up within the continent, Europe could take the lead in coordinating the
antimicrobial resistance research efforts globally. Compared to other continents, Europe is
ahead in many sub fields. Some of the researchers also emphasised that European wide
perspective might not be sufficient in the antimicrobial resistance field and that a broader view
spanning the globe would help to address the issue more effectively.
F.1.3. Stories of impact
Through research carried out for this case study several areas and projects were identified that
are examples of successful initiatives of FP7 funding. They include the IMI ND4BB programme,
advancement in diagnostic practices and product development, as well as the interdisciplinarity
of research conducted in European projects.
The Innovative Medicines Initiative (IMI), according to some of the beneficiaries, has helped to
attract the interest of the pharmaceutical industry and generate more research in the
antimicrobial resistance field. The industrial partners contributed more than EUR 360 million
in-kind. The programme has also helped to bring larger scale and scope to the European
antimicrobial research. The projects in ND4BB have addressed a continuum of issues in the
antibiotic resistance research cycle. The topics of funded projects ranged from early discovery
and development, to preclinical as well as clinical phases. Also, one of the projects, DRIVE-AB,
was conducted in the area of new economic models to reward the antimicrobial development
while de-linking it from return on investment from sales volume. The results of these projects
will contribute to overcoming barriers that lay in antibiotic drug design, in delivery of new
leads in the antibacterial candidate pipeline, in clinical trials and in return on investment
models for antibiotic development.
One of the challenges that contributes to increasing antimicrobial resistance is the
incorrect diagnosis of diseases. This can lead to the wrong drugs being prescribed for
treatment. Tests to diagnose a specific disease or infection are not always available and doctors
might rely on symptoms to make a diagnosis and prescribe drugs. Some European FP projects
addressed this challenge and worked on developing diagnostic tests for various infections.
In one of those projects, NIDIAG, a large international consortium conducted research in several
low-income countries and developed a test for sleeping sickness (Human African
Trypanosomiasis), an infectious disease caused by a parasite. According to the World Health
Organisation, the estimated number of infections currently is below 20 000 and the estimated
population at risk is 65 million people. The Rapid Diagnostic Test developed by NIDIAG is
available on the market and will be particularly useful for remote rural settings where this
disease mostly occurs. The project focused not only on developing the specific test but also on
guidelines for health practitioners on how to make a more accurate and faster diagnosis of
this disease. The NIDIAG project developed the guidelines that can be used by health care
professionals to make more accurate diagnosis, do it quicker and prescribe a correct drug for the
treatment.
The EU funded various projects to develop specific products that could be used to avoid or
treat infections (drug formulations, vaccines and other products). For example, one project

100
called NanoTi developed a new titanium implant that is able to resist bacterial infections without
the addition of any antibacterial compounds. The incidence of infections related to dental
implants is between 2-5% and can sometimes reach 15%. The new implant can help to decrease
this number and at the same time reduce the need for anti-infective drugs. Many other FP7
projects worked on the development of similar products, vaccines or drugs. Their outputs will
contribute to providing better targeted treatments and lowering the overall numbers of
infections.
Antimicrobial resistance is a complex area, requiring research in animals and humans as well as
across an array of bacteria, viruses, fungi and protozoa. Also, research across a range of
disciplines is needed including molecular and pharmacological studies, epidemiology and
clinical trials. In this case study, we analysed a small fraction of all FP7 projects related to
antimicrobial resistance. Projects were conducted under different FP7 programmes such as
Health, ICT, NMP, KBBE and IMI. This fraction of FP7 projects illustrates and represents
the diversity and broad scope of topics addressed by European funding. The majority of the
interviewees agreed that with national research project such broad scope and scale could not be
achieved.
F.2. European added value case study 2: Large-Scale Data gathering, omics
research and biobanks which contribute to personalised medicine approaches
F.2.1. Overall context
(d) Definition and expected impact of the area
‘Personalised medicine’ is not a precise term and no single definition has been agreed upon.
Many other terms, such as genomic medicine, stratified medicine and precision medicine are
frequently used synonymously with personalised medicine. For this analysis the definition of the
European Commission, which was revised by the Horizon 2020 Advisory Group for Societal
Challenge 1 ‘Health, demographic change and Wellbeing’ were used61
: “personalised medicine
refers to a medical model using characterisation of individuals’ phenotypes and genotypes (e.g.
molecular profiling, medical imaging, lifestyle data) for tailoring the right therapeutic strategy
for the right person at the right time, and/or to determine the predisposition to disease and/or to
deliver timely and targeted prevention”.
Large-scale molecular data are fundamental for the understanding of the molecular basis of
diseases. The high-throughput omics technologies as well as the resulting data are the
prerequisites for personalised medicine. Research into molecular understanding of diseases also
requires large-scale biobanking securing the availability and accessibility of high-quality
biological samples collected in a standardised manner. Access is needed to large-scale
population as well as to patient cohorts that are coupled with a large quantity of omics, clinical,
lifestyle and imaging information. Selected projects in this analysis belong to categories of basic
research and translational research and also include so-called enablers for personalised medicine
which generated large data and sample sets and developed or improved generic technologies.
According to the Advisory Group for Societal Challenge 1research should aim to establish or
support a ‘pipeline’ needed to implement personalised medicine:
61 Advice for 2016/2017 of the Horizon 2020 Advisory Group for Societal Challenge 1 ‘Health, demographic change and
Wellbeing’

101
Better understanding of diseases and their co-morbidities as well as resilience to
disease at the systems and mechanistic levels. Formulating hypotheses for biomarkers or
targeted interventions aimed at disease prevention or therapy.
Development of new tools for utilising/extracting/sharing new knowledge in the most
informative and efficient manner (e.g. molecular profiling, biotechnology, diagnostics,
ICT tools) in the most appropriate personalised setting (e.g. health care system, at home),
as well as accelerating and facilitating regulatory approval paths for new medical
products for personalised medicine.
Piloting the personalised medicine concept in real life settings (e.g.
genetic/phenotypic screening programmes, responding to the paradigm shift in clinical
trials which move away from unselected patient populations towards more individualised
approaches in molecularly defined subgroups), demonstrating the health benefit and cost-
effectiveness.
Sharing the data generated in new and existing studies, while ensuring confidentiality
and data security, and feeding this information towards the new discoveries.
Empowerment of individuals to manage their data, understanding of diseases and their
co-morbidities as well as resilience to disease.
The key challenges ahead and future research needs are the adaption of research tools for clinical
use, standards for data and sample collection, novel statistical and modelling methods for
analyses, clinical bioinformatics, translation of omics research into clinical applications,
identification, qualification and clinical validation of biomarkers, adapted clinical trial
methodologies, and research on the economic impact of personalised medicine. Many of these
aspects were already addressed in the later stage of FP7 and have been continued in Horizon
2020. In addition, the European Medicines Agency (EMA) launched a pilot project to explore
the adaptive pathways approach62
(MAPP - Medicines Adaptive Pathways to Patients), a
scientific concept of medicines development and data generation intended for medicines that
address patients’ unmet medical needs and improve timely access for patients to new medicines.
The Horizon 2020 Advisory Group came up with a list of key weaknesses and threats affecting
the development and uptake of personalised medicine. Insufficient interdisciplinarity and
existence of “silos” were identified as a key weakness, followed by insufficient entrepreneurship
and transfer of knowledge. Data privacy, ownership and security were identified as key
threats, as were reluctance to move from old to new ways of medicine by health professionals. In
this context public/FP7 funding had its role next to others in the promotion of interdisciplinary,
the creation of joined up databases, the interoperability of data and formats (overcome silos), and
contribute to addressing the data privacy, ownership and security issues.
62 http://www.ema.europa.eu/ema/index.jsp?curl=pages/regulation/general/general_content_000601.jsp

102
Table 15 SWOT analysis of the personalised medicine area
Strengths
Comparatively strong health care system
infrastructures to conduct clinical studies.
Longitudinal/prospective cohort studies. Strong
basic research.
Rapid advances in ‘omics’ resulting in decreasing
costs.
Weaknesses
Insufficient interdisciplinary, existence of ‘silos’.
Different health care systems and regulations
across EU.
Insufficient entrepreneurship, making
implementation of personalized medicine in real
life challenging.
Lack of joined up databases.
Lack of training of health care and other providers.
Opportunities
Need for new business models
Need for improved public health.
Need for change to health care systems to reduce
the costs.
Threats
Inadequately addressing the risks associated with
personalized medicine, such as issues of data
privacy/ownership and security.
Resistance to change. Despite demonstrated
success, public and health care professionals do not
support implementation of personalized medicine.
Source: Horizon 2020 Advisory group for Health, demographic change and wellbeing
(e) Rationale for public intervention: key trends in the area, main challenges and
indicators
One of the greatest societal and economic challenges of the 21st century for European societies is
health and the increasing pressure on European health care systems in an ageing population. By
2025, more than 20% of Europeans will be 65 or older, with a particularly rapid increase in
numbers of over-80s. According to World Bank figures, public expenditure on healthcare in the
EU could jump from 8% of GDP in 2000 to 14% in 2030 and continue to grow beyond that date.
As a percent of a country’s GDP, the USA also spent almost 16% of their GDP on healthcare. As
an example the global economic impact of the five leading non-communicable diseases (NCDs)
– cardiovascular disease (CVD), chronic respiratory disease, cancer, diabetes and mental ill-
health – could total US$ 47 trillion over the next 20 years, according to a study released in 2011
by the World Economic Forum. Current medical treatments based on the “average patient” and
“one-size-fits-all” are in many cases not effective, but often also very harmful. The list of
conditions for which there is no satisfactory treatment is increasing and, even when treatments
are available, many patients either do not respond or experience unacceptable side effects. For
example, a 2001 study showed that the response rates of patients to common medications from
different therapeutic classes ranged from ~80% analgesics) to ~25% (oncology). Progress in
developing and adopting diagnostics to identify which medicines work best for which patients,
thus reducing adverse events, has been slow. In fact, between 2000 and 2011, the number of
adverse events recorded by the FDA nearly tripled. According to several studies, about 5.3% of
all hospital admissions are associated with adverse drug reactions (ADRs).
The increasing drug development cost with a decreasing success rate of approval is an additional
burden. In oncology, as an example, average costs for clinical trials are 1.5 billion dollars per
candidate. The current success rate for each candidate is between 8% and 25% with the vast
majority of drugs failing to be approved at the end of long overall development time (phase I-III)
of 6.5 years.

103
(f) Defining the scope of the European added value case study
Extensive desk research and content analysis of final and periodic reports were applied to
identify FP7 Health projects that were related to personalised medicine. The final list of
personalised medicine projects was narrowed down to 209 projects. In addition 17 research
infrastructure projects and 34 IMI projects related to personalised medicine were identified. 40
projects belonging to the research area of “large-scale data gathering, -omics research and
biobanks which contribute to personalised medicine approaches” were identified. The majority
of projects from FP7 Health were funded under pillar 1, activity 1.1. HIGH-THROUGHPUT
RESEARCH and pillar 2, activity 2.1.1 LARGE-SCALE DATA GATHERING (22 projects).
For the analysis 30 interviews were conducted with scientists covering 21 projects.
Projects belonging to the research area of “large-scale data gathering, -omics research and
biobanks which contribute to personalised medicine approaches” are transnational collaborative
projects involving large consortia. European collaborative research is a key element of the
European Research Framework Programmes. Cooperation in collaborative projects and the
resulting exchange or shared use of knowledge, methods, infrastructures and data provide critical
mass across national borders. European added value could most likely be realised within these
collaborative research projects.
Table 16 Projects related to the area “Large-scale data gathering, omics research and
biobanks which contribute to personalised medicine approaches” and their allocated EU
contribution
Programme Number of projects EU contribution, EUR million
FP7 Health 30 296.767.230
FP7 Infrastructures 7 39.399.293
FP7 JTI IMI 2 47.840.380
FP7 ERC 1 2.498.658
Total 40 386.505.561
Source: PPMI, “Assessment of the Union Added Value and the Economic Impact of the EU Framework
Programmes (FP7, Horizon 2020)”, forthcoming). based on CORDA data
F.2.2. Key findings
(a) Factors/mechanisms of influence fostering European added value
Reduction of commercial and research risks
The majority of projects in the area of “large-scale data gathering, omics research and biobanks
which contribute to personalised medicine approaches” were aiming at the generation of new
data sets, resources, generic technologies and infrastructures which could be later used by the
scientific community and were therefore more basic or clinical research projects. The
commercial risks of such projects were regarded as low. The participation of SMEs was seen as
beneficial for the projects, but the main drivers were the academic groups.
The research risk was mitigated by the composition and size of the research consortia. The large
European initiatives relied on project partners with a proven track record of synergistic expertise
and productivity. Even in case one partner failed to deliver the required research results, the

104
consortia were usually large enough to find a different partner which could took over the tasks.
This approach helped to spread risks compared to a project conducted by one research group.
Leverage of private and public investment
EU funding leveraged other sources of support to research in their field. EU funding helped them
to access other funding to expand or continue their research. The majority of interviewees
reported that FP7 funding was beneficial to leverage additional funding from the EU including
Horizon 2020 grants, but also from other sources. Some interviewees from larger Member States
pointed out that the leverage of additional funding was not relevant for them, but they admitted
that leverage of additional funding was an important driver for participants of smaller countries.
The majority of newly attracted funding came from the public sector including European and
national grants. The European initiatives pay back to the national level and leverage additional
funds in several Member States. Without pan-European initiatives it would not have been
possible to promote certain national resources and programmes. European funds were
prerequisite to develop or/and improve national initiatives and roadmaps.
The ESFRI infrastructure projects received a limited seed funding by FP7 for a so-called
preparatory phase. This phase already included a fundraising exercise. BBMRI, Biobanking and
Biomolecular Resources Research Infrastructure, received EUR 5 million from the EU. BBMRI
secured EUR 170 million by Member States.
A clear leverage effect could be seen in the Czech Republic, the Netherlands and Finland in the
area of research infrastructures for mouse functional genomics, where according to the
interviewees there would be no national programmes without the European funding. As an
example, participation in the European initiative was the prerequisite to apply for national funds
for the France Phenomin - French National Infrastructure for Mouse Phenogenomics.
The participation in successful European initiatives also helped researchers to compete for
internal institutional funding. The programme-oriented funding (POF) within the German
Helmholtz Association is evaluated every 5 years and the European funding is an asset to secure
the basic funding of research groups.
Through the participation in large European initiatives existing networks were able to
successfully apply for ERA-NET grants. Scientists are not only partner in the ERA-NET grants,
but participate in Scientific Advisory Boards. They were able to shape the corresponding ERA-
NET calls, because specific calls were leveraging on existing infrastructures and other project
outcomes like data collections of these large European initiatives. The latest E-Rare calls
demand a data-managing plan and directly refer to the use of the infrastructures developed
within the RD-Connect project. In addition, the larger European initiatives influenced the
structure of later European grant applications. An increase of independent biobank work
packages dedicated towards sample quality and management could be observed as a clear trend.
The FP7 funding is also seen as a door opener for European Structural and Investment Funds like
the teaming actions disseminating best practises to countries with lower funding capacities.
Some European calls directly supported existing initiatives like the infrastructure calls aiming at
optimising the use and development of the best research infrastructures existing in Europe.
Several interviewees highlighted that the fact that they led or participated in a large European
project helped to attract additional national grants. Numerous examples were given including
MRC, BMBF, DFG, ANR, Genopole. National calls also aimed at the expansion of research
programmes towards for example the low and middle income countries.

105
Other national calls directly referred to existing European projects and only the partners of these
initiatives were eligible to apply for the national grants. This can be exemplified by the BMBF
call ” Improvement of German biobank sites for connection to BBMRI” where it was stated “The
development, testing and application of overarching, generic standards, products and solutions
for the integration of German biobank sites with human samples and data in BBMRI will be
promoted. The work of BBMRI must be taken into account in all work. It is not the objective of
the funding to develop or improve local, isolated infrastructures.”
The main aims of the large-scale data gathering, omics research and biobank projects were the
generation of data sets, resources and infrastructures. Interaction with industry happened mainly
in precompetitive areas. Therefore, the direct leverage of private funds plays for most of the
projects’ participants only a minor role, but several interviewees expect to attract private funds in
the near future, when projects are more advanced. On the other hand, projects’ participants often
claimed that initial contacts and discussion with biotech, pharma and medical technology
companies were started and small-scale side projects focussing on specific aspects of the
research between single project partners and industry were funded by private funds. European
projects helped to attract funding from foundations like for example the Wellcome Trust (UK),
Hannelore-Kohl Stiftung (Germany) and a foundation from the USA.
Pooling resources and building critical mass
Projects in the area of “large-scale data gathering, omics research and biobanks which contribute
to personalised medicine approaches” are characterised by large and multidisciplinary consortia.
Nearly all of the interviewed project partners and coordinators emphasised that bringing the best
people in Europe together resulted in stronger collaborative networks and better scientific
excellence. These networks often outlive the duration of the grants. The required knowledge and
expertise for these large European initiatives were not available in single countries. Projects in
this area require individuals and institutions of proven expertise and productivity for the various
classes of data production, analysis and integration. Compared to national funded projects
European projects could tackle the full spectrum of analyses methods in contrast to smaller and
more focused projects funded nationally.
The second most important European added value aspect highlighted by the interviewees was the
pooling of samples and data. The large-scale data gathering projects are illustrations of the merits
of EU-induced critical mass. They had brought together large amounts of data on patients,
permitting the identification of susceptibility genes and biomarkers for common diseases.
Interactions of genetic variation, lifestyles and wider range and variety of environmental
exposures are best studied against a background of widely different environments, something
that is best leveraged between, rather than within, countries. Clinical expertise including
pathologists was needed from different countries in order to get enough high quality samples.
Genomic cancer projects rely on high numbers of fresh frozen samples, which are only available
by pooling samples transnationally. The European large-scale data gathering projects were able
to collect the worldwide largest disease cohorts. Interviewees conceded that the biggest countries
have the ability to raise individual cohorts for common diseases, but even then projects were
much better of with in international perspective to analyse the full spectrum of the disease
including genomics gene expression, methylation and copy number variation. Gathering all the
competencies and capacities needed for such broad projects in one country would not be possible
in many of the Member States. Rare diseases are prime examples of a research area that strongly
benefits from coordination on a European and international scale. The funding of transnational
collaborative research through FP7 Health was more efficient and enhanced the cooperation
between scientists working on rare diseases in Europe and beyond and thus reducing

106
fragmentation of research in this field. In many countries dedicated research programmes were
not available. This was especially true for the smaller countries of the EU.
Large sample sizes are required to investigate the variable incidence of specific cancers across
Europe. Incidence rates for renal cancer have been sharply increased with unexplained variation
in different countries. The highest rates that are observed worldwide occur in Central Europe and
some other European regions compared to elsewhere in the world. The underlying processes of
the disease vary in different European populations. Only the analysis of a European sample
collection can led to the explanation of these differences. Large sample sizes are even more
important in more homogeneous disease samples in order to stratify the disease samples.
One interviewee from France underlined that the European project was instrumental in getting all
clinical colleagues together at her local institute for patient recruitment. The fact that the project
was a European programme was key to motivate the clinicians to include their patients into this
study. Only at her side, 12 clinicians were involved in patient recruitment.
Comparative effectiveness research (CER) is designed to inform health-care decisions by
providing evidence on the effectiveness, benefits, and harms of different treatment options. CER
makes use of large between-centre and between-country differences in treatment and outcome.
The stratification of patients by genomics, imaging technology and protein biomarkers and the
observational research design is dependent on large number of patients but also on big
differences in the variation of treatment. The aim is by identifying and disseminating best
treatment practises and the most cost effective practise across the European Union to reduce the
mortality rate to the lowest European level.
Projects in the area of “large-scale data gathering, omics research and biobanks which contribute
to personalised medicine approaches” mainly pooled and shared scientific expertise and patient
samples. In addition they pooled and shared research data and protocols. The pooling and
sharing of infrastructures and equipment were not regarded as a major aspect for European added
value, but the development of common resources and infrastructures were. Developing Europe-
wide infrastructures facilitated harmonisation of protocols and integration and interoperability of
data from multiple population samples. Harmonisation was recognised as a key enabling factor.
Samples were collected, stored and classified according to similar procedures. Compared to
national funded projects the required infrastructure could be build much faster. In one project,
the coordinator was able to set-up a core lab in his department completely dedicated to omics
and pain with the European FP7 funds. In several projects structures and pipelines for data
collecting and analyses, data sharing and standards were established. Building of common
resources helped to avoid multiplying the costs and gaining efficiency. The newly created
resources and infrastructures are already used by several European but also national projects.
Another aspect of European added value relates to the missing funding opportunities in single
Member States. In several of the smaller countries including the Netherlands, Belgium, Finland
and the Czech Republic no dedicated national programmes and funding calls for large-scale data
gathering or infrastructure projects were available. Researches in these countries were dependent
on European funds. In some cases, the European projects helped to initiate the respective
national programmes. However, even researchers from some larger Member States emphasised
that the scale of national funding compared to European funded projects is much smaller and did
not allow the same scientific ambition.
Increased international and/or inter-sectoral mobility of researchers

107
International and/or inter-sectoral mobility of researchers and training were considered as an
important European added value aspect by some, but not all interviewees. Often no explicit
training and mobility activities were part of the research plan. Training events were often
coupled to the annual project meetings or were organised as webinars. Exchange of researchers
occurred on a bilateral level between academic groups in order to learn new competences and
skills that were not accessible in their own institution. In addition, consortia supported the
exchange of early-stage researchers between partner laboratories through the implementation of
short-term travel fellowships. In IMI projects responders pointed to their short secondments from
EFPIA members to academic laboratories and vice versa.
Even in projects with a dedicated mobility and training work package, these activities were often
postponed, because other project tasks were considered as more important for the success of the
project. In other projects these activities were a central part of the research agenda and multiple
training courses in different institutions were organised by project partners. In addition, summer
schools were organised, often in collaboration with other FP7 funded projects, in order to train
young researchers of project beneficiaries but also scientists from outside the projects. Some of
the training materials established through these projects are now used for training courses at EBI
and elsewhere. Summer schools and training events were also used to reach out to smaller
countries embedding additional Eastern and Southern European countries in order to strengthen
the idea of the European Research Area.
In other cases the training and mobility activities were “outsourced” by obtaining addition grants
like MSCA ITN projects or by the participation in dedicated training projects like IMI
EMTRAIN. The landmark BMS Research infrastructures successfully applied for a Horizon
2020 training project for managers and operators of research infrastructure.
(b) Better results achieved because of European added value
Improved research excellence / capabilities
UK based researchers considered European funded large-scale data production projects in
general as not successful compared to the larger, well-funded projects by the Wellcome Trust
and NIH, respectively. On the other hand they admitted that several projects in the area of
“large-scale data gathering, omics research and biobanks which contribute to personalised
medicine approaches” were success stories of European funding. These include the BMS
landmark research infrastructure initiatives and the European projects as part of larger
international initiatives. The larger amount of available funding for collaborative research allow
for larger and more multidisciplinary consortia where more ambitious research questions can be
tackled. Compared to EU projects, national funded projects are more focused, targeted and
smaller.
Scientific publications in peer-reviewed journals are good indicators for scientific excellence. It
can be shown that the EU level research projects resulted in higher quality publications
compared to national funded projects. Good examples are provided by European and national
projects funded as part of larger international initiatives like, IRDiRC, IHEC, ICGC and InTIBR.
For example, in November 2016 a collection of 41 coordinated papers were published by
scientists from across the International Human Epigenome Consortium (IHEC). A set of 24
manuscripts has been released as a package in Cell and Cell Press-associated journals, and an
additional 17 papers have been published in other high-impact journals. These papers represent
the most recent work of IHEC member projects from Canada, the European Union, Germany,
Japan, Singapore, South Korea, and the United States. The German Epigenome Programme

108
contributed four minor manuscripts to the collection whereas the European project contributed
26 publications in journal with highest impact factors. The scales of funding of both projects are
similar in scale.
According to the interviewees, good quality consortia with complementary expertise within FP7
projects led to higher quality research results, which attracted more interest from the scientific
community. Besides analysing the project results within the consortium, some projects made
them immediately available to the scientific community to allow optimal usage of the generated
datasets, which is in contrast to most national funded projects. An indicator is the numerous data
requests these projects received by the scientific community.
The European networks not only bring together European stakeholders but help build
competitiveness against other continental networks like the ones in Asia and USA. The network
of a single country does not have the same power of impact. The European epigenome
programme has been one of the leading consortia within IHEC which could be judged by the
mutual appearance in the boards and the scientific working groups. At the end of the funding
period Europe lost the leadership in this research area. Several interviewees stated they were
missing a funding opportunity to secure the scientific lead and sustain the acquired expertise and
project outcomes and resources. In contrast, USA and Asia increased their investment in
epigenomic research. In addition to the European funding gap, there were no appropriate national
funding programmes available in several countries to compensate for this.
FP7 projects also helped to create a strong position and visibility attracting interests by other
groups including groups from outside Europe which allowed the researchers to collaborate and
share data with other large international initiatives in the USA and Asia.
Another European initiative as part of the larger International Mouse Phenotyping Consortium
(IMPC) made it as the first life science project to the G7 list of research infrastructures of global
interest with global impact. The mission of IMPC is to build the first comprehensive functional
catalogue of a mammalian genome, which will give new insights into gene function and human
disease. This bold goal will require the support, infrastructures and cooperation of multiple
countries. The IMPC is coordinating efforts to generate a knockout mouse strain for every
protein-coding gene in the mouse genome (~20,000).
Economies of scale and scope
Projects in the area of “large-scale data gathering, omics research and biobanks which contribute
to personalised medicine approaches” are in general expensive and beyond the scope of most
national funding agencies. Pooling scientific expertise and funding allowed for larger and
coordinated collaborative research and prevent fragmentation and duplication of research efforts.
Wider availability and dissemination of knowledge
Most interviewees confirmed that a majority of scientific publications were published in open
access journals, but researchers differ in the handling of research data. Some projects released
and disseminated the data to the wider scientific community even before they analysed them
themselves. Other projects made the research data only available after the end of the project,
because scientists preferred to analyse their data first or secured protection of IP has happened
first. Most projects generated personal medical data which are more sensitive than other research
data. Access to these data were often organised by an instrument called controlled access, where

109
scientists have to apply for the access to the data and have to show that they are bona fide
scientists. Others were promoting an instrument called registered access.
The European Open Science Cloud (EOSC), a virtual environment to store, share and re-use data
across disciplines and borders, was known by most of the interviewees, but not all. Several
responders believed that EOSC would not be the optimal instrument for health related data.
Others could see the EOSC as a framework for the different cloud initiatives. Interviewees
stressed that long-term data stewardships for the different data sets would be an important aspect
which has to be introduced from the beginning, otherwise it would be only another online
repository with no additional benefits. One scientist alerted that with the implementation of the
EOSC the data analysis capacities in Europe have to be increased. The weakness in data analysis
in Africa and Europe compared to the USA and some other regions would otherwise penalise
European research. Several interviewees promoted the inclusion of data management plans
according to the FAIR data principle (make research data findable, accessible, interoperable and
reusable).
Some of the projects reached out to a broader audience in addition to researchers. One project
will publish an entire commissioned issue of a Lancet journal in order to inform policy makers
and funders about their research programme. Other projects coordinated the publication of a
collection of scientific papers to reach the maximum public awareness.
In addition, projects organised workshops and conferences together with other initiatives
including ERA-NETS to spread the project outcomes to a wider scientific community and
Member State funders. Also common guideline papers were published to reach a greater
acceptance. In other cases, common workshops were organised by all funded projects of one
specific call in order to inform the EU, policy makers and other stakeholders about their research
topic and results and to push for additional funding opportunities.
Several projects jointly organised a strategic meeting at the European Parliament in Brussels.
Other projects directly visited the responsible ministries in several Member States to discuss
what infrastructures are available at the national level and explain the added value of linking
these infrastructures on the European level.
Projects involved specific patient organisations or the European umbrella patient organisations
directly as project beneficiaries and by them reached out to patients but to the general public as
well. In addition, researchers were invited by EMA to provide their statements about the
utilisation of data, big data and omics, patient registries, data linkage and FAIR data principle.
Better coordination of national research policies and practices at the EU level
The coordination of national research policies and practices at the EU level was no direct aim of
the projects in the area of “large-scale data gathering, omics research and biobanks which
contribute to personalised medicine approaches”. Nevertheless, most of these large initiatives
directly or indirectly contributed to the coordination of research policies and had an impact on
the structuring effect of the European Research Area (ERA) and on national programmes in the
area of health research. The members of the large collaborative networks are often key opinion
leaders serving as advisers to policy makers and other stakeholders in charge of research policies
that inform national funders about cutting-edge research performed by the large international
initiatives. They were participating in the European Union Committee of Experts in Rare
Diseases, were at the Scientific Advisory Boards of ERA-NETS, were coordinators of relevant

110
Joint Actions, and served as chairs of Interdisciplinary Scientific Committees and International
Scientific Steering Committee of large international initiatives.
In the area of traumatic brain injury the two coordinators of an FP7 project together with two
other colleagues started a lobbying initiative in 2009 resulting in the launch of the International
Initiative on TBI Research (InTBIR), a collaboration of funding agencies aiming to stimulate
TBI research. In addition the MRC will take the model of CENTER-TBI to South Africa and
India (low and middle income countries).
In the area of rare diseases FP7 researchers were in a leading position in other relevant initiatives
coordinating the EUCERD Joint Action on Rare Diseases and as lead principal investigators in
its successor initiative Joint Action RD-Action. These initiatives are in the science policy area of
the rare disease field complementing the more research oriented projects. EUCERD aimed at
aiding the European Commission with the preparation and implementation of Community
activities in the field of rare diseases and were considered as the midwife of the European
Reference Networks (ERN) for rare diseases, a novel EU initiative to form networks of centres
of expertise and healthcare providers that support clinicians and researchers to share expertise,
knowledge and resources across the EU. ERNs use communication and eHealth tools to enable
the mobility of expertise across borders, rather than the movement of patients who often travel
abroad, to access the care they need. The first successful ERNs were announced early 2017.
Services and pipelines on data sharing and analyses generated within the FP7 project RD-
CONNECT were offered to be used in the ERNs.
Another prime example was the BMS landmark research infrastructures. Without pan-European
initiatives it would not have been possible to promote certain national resources and
programmes. European funds were necessary to improve or even initiate national initiatives.
Without the European funding there would be no national programmes on infrastructures on
mouse disease models at least in several Member States according to the interviews.
In addition, the ESFRI BMS infrastructure initiatives published several common position papers
on policy issues, aiming to inform national and European policy makers about the relevance of
the BMS research infrastructures for building the European Research Area. As a latest example
they published the position paper “Contribution from the Health related infrastructures: BBMRI,
ECRIN, EATRIS, ELIXIR, EU-OPENSCREEN, INFRAFRONTIER and ISBE to Medicine
Roadmap for Europe” in response to the Strategic Research and Innovation Agenda of PerMed.
The interviewees gave multiple examples where the European initiatives directly pay back to
national research and research programmes. In one project the coordinator was able to set-up a
national database in Italy where 12 national centres for chronic pain research were collaborating
and submitted their research data for data sharing to the newly generated national database.
Through the European funded project these centres, which were no partners in the FP7 project,
got motivated to contribute their data to this central national database. Without the European
project this would not have happened. This model database will also be replicated in several
other European countries. The database and established protocols were already transferred to
another country with had no expertise in this specific topic before.

111
(c) Long-term impacts resulting from European added value
Better addressing societal / pan-European challenges
Research and Innovation in response to the challenge of “Health, demographic change and
wellbeing” is crucial to ensure better health for all European citizens. To the main research
priorities of Horizon 2020 belong next to others personalised medicine and rare diseases. The
projects in the area of “Large-scale data gathering, omics research and biobanks which
contribute to personalised medicine approaches” all contributed to this challenge by providing
insights in the underlying mechanisms of many diseases and establishing large cohorts including
patient cohorts associated with clinical, omics and environmental data. These projects
established or ensured a European leadership in various disciplines including epidemiology,
registers, biobanks and cohorts, rare diseases, cancer and epigenetics. Medical or health research
includes basic, translational and clinical research. Most of the projects of this area were basic
science projects and the transfer of scientific discoveries into the clinic is a long process often
outside the scope of these activities. The majority of projects in the area of “large-scale data
gathering, omics research and biobanks which contribute to personalised medicine approaches”
were aiming at the generation of new data sets, resources, generic technologies and
infrastructures which could be later used by the scientific community for supporting future
clinical trials in these areas. The gained knowledge and established and developed results,
resources and infrastructures were the prerequisites for the stratification of diseases and
personalised medicine. Understanding the critical mutational events underlying the development
of diseases, comprehensive catalogues of mutations and the detection of new disease genes are
paramount for advancing prevention, early detection and effective treatment of the diseases.
The interviewees argued that the private sector alone would not have been able to resource the
projects sufficiently. No concrete case was found where a project could have been implemented
using private or own funds in its entirety. Although some beneficiaries agreed that certain
aspects of their projects could have been implemented with their own or private funds, the
resulting outputs would have been either smaller/partial or substantially delayed. The Wellcome
Trust as a charitable foundation is able to fund large-scale data gathering projects on a similar
scale like the EC.
Several national strategic programmes for personalised medicine have been set up like the
“Stratified Medicine in the UK” and the Personalised Medicine –Action Plan” in Germany to
name only two. Some Member States initiated large-scale data gathering projects like the
100,000 genomes project by Genomics England and the UK Biobank initiative in England and
the UK respectively and the planned French Genome Project with an investment of
approximately EUR 700 million to build a network of sequencing and analysis centres capable of
processing the equivalent of 235,000 genomes a year by 2020. In addition to the European
funded ICGC and IHEC projects, several nationally funded ICGC and IHEC projects exist. But
all interviewees underlined that without the EU action their projects could not have been
realised. This means that the effective critical mass of knowledge and expertise were not
available within a single Member State, that the scale of the project would not have been
possible with national funding and/or that the appropriate funding programmes were missing at
least in some Member States.
The beneficiaries also highlighted the critical mass of data, research subjects and infrastructures
(cohorts, complementary capacities, multi-centre clinical trials and data collection) that were
superior to what would have been available nationally. Responses of the interviewees point to
the perception that participation brings benefits in terms of ability to tackle more ambitious

112
research objectives in European cooperation than in national funded collaborations. The
European setup of research in this area had a huge impact in coordinating and managing the
activities by creating, optimising and sharing resources, and avoiding duplication of efforts.
These are clear indications that the FP7 large-scale data gathering projects directly contribute to
the creation of the European Research Area in health research.
All interviewees were in line with the recommendation of the 2016 report of the Horizon 2020
Advisory Group for Societal Challenge 163
who identified as a main research gap that European
research suffers from lack of sustainability of successful projects, infrastructures and projects
outcomes. For better addressing the pan-European challenges the Horizon 2020 Advisory Group
expressed the need for assuring sustainability of publicly funded projects including the
possibility to follow up successful projects that have ended.
F.2.3. Stories of impact
Comparative effectiveness research (CER) makes use of large between-centre and between-
country differences in treatment and outcome. The need for European action is dictated by these
national and regional differences. These inequalities in treatment provision and outcome are not
small. Up to 35,000 lives could be saved annually if traumatic brain injury mortality rates across
Europe could be reduced to the lowest observed national rate. Research is expected to provide
robust guidelines on best clinical and most effective practice, ensuring that every EU citizen
obtains the best possible care, regardless of country or region of residence.
Several European infrastructures supported health research in general, but other platforms were
specifically developed for rare diseases, which linked omics data, registries, biobanks and
developed analysis pipelines. The access and the connection to these European infrastructures
were already implemented in some later calls like in the E-Rare or some national calls
guarantying the long-term storage and re-use of large sample and data sets. European research
infrastructures served as facilities for storage, curation, annotation and distribution of samples
and data for re-use in academia and for commercial purposes. New models for public-private
partnerships were established.
In one of the large cancer projects, a large comprehensive catalogue of somatic mutations was
generated. The results of the project are now taken further towards translation. Women with
germline BRACA1/BRACA2 accounts for 1% of cases and PARP inhibitors are tested in clinical
trials as medication. Based on the obtained molecular signatures patients could be stratified
much better. They found additional 20% which looks like BRACA1/BRACA2 germline
mutation carrier, but they do not have mutations in these genes. By changing the clinical trial
strategy based on the genomic data, a therapy change of 20% of women with breast cancer can
be envisaged, if successful. Several patents have been filled.
In the area of rare diseases 80 new disease genes were identified in one project and further 100
genes are in the analysis pipeline. As a result, new disease panels for stepwise diagnostics are
under development. The diagnostic kits will result in the availability of targeted genetic testing.
This will help physicians provide the most appropriate treatment, allow affected families to make
informed family planning decisions, form better-stratified patient cohorts for interventional
trials, shorten the time to diagnosis and avoid unnecessary or invasive test procedures.
63 http://ec.europa.eu/research/health/pdf/ag_advice_report_2018-2020.pdf

113
F.3. European added value case study 3: Fisheries
F.3.1. Overall context
(a) Definition and expected impact of the area
Fisheries and aquaculture play an important role in European societies for their capacity to
satisfy the demand of safe, nutritious and healthy food as well as for their ability to provide a
large number of jobs and business opportunities.
Through the Common Fisheries Policy, the EU aims to ensure that fishing and aquaculture are
environmentally, economically and socially sustainable and that they provide a source of healthy
food for EU citizens. The future challenge lies on building a sustainable production system able
to meet food demand and provide jobs and economic growth in a context of increasing resource
scarcities and growing maritime services.
Research funded by FP7 and Horizon 2020 aims at creating the conditions for the development
of new technologies, maximising synergies with activities funded at national and regional levels
and avoiding duplication of research efforts. The focus of the Framework Programmes’ support
related to fisheries and aquaculture can be summarised in three areas.
The first area is the improvement of resource-efficiency and management of fisheries. This
sector lacks behind in the implementation and use of technologies already developed (i.e.
information technology, detection, monitoring and surveillance techniques, new materials, etc.).
Adaptation to new technologies would benefit the extraction sector by improving cost-efficiency
and limiting its environmental impact. At the same time, the EU needs to avoid the loss of
depletion of ecosystem services and produce “more with less” to achieve the sustainability goals
set in the reviewed ‘Common Fisheries Policy’64
. Projects from the Framework Programmes
aimed at exploring opportunities to increase the use of innovative technologies in fisheries
activities, as well as to enhance scientific knowledge to reinforce advice on fisheries
management. Some of the expected impacts of FP7 on resource-efficiency and management
would be:
Improvement in energy efficiency;
Increase in overall economic productivity;
Improved competitiveness of fishing sector;
Increase of private investment in innovation, notably leverage of private co-investor
and/or follow-up investments;
Reduction in damage to other marine resources and ecosystems;
Support decision making and better ecosystem-based fisheries management.
The second area of focus is the improvement of the technical performance of aquaculture.
Projects from the Framework Programmes seek to develop new technologies and implement
64 The Common Fisheries Policy (CFP), January 2014. http://ec.europa.eu/fisheries/reform_en

114
existing ones to make the European aquaculture sector more competitive and help meet the
targets set in the ‘Strategic Guidelines for the sustainable development of EU aquaculture’. At
the same time, projects from the FPs aim to expand and diversify aquaculture in Europe by
promoting market-driven research, innovation and knowledge transfer. With this aim, FPs
synergized with national research programmes and incentivised the participation of industry
partners in research activities.
Examples of impacts of Framework Programmes on the competitiveness and technical
performance of European aquaculture can be found in the Strategic Research Agenda from the
European Aquaculture Technology and Innovation Platform. Some of these are:
Maximise health benefits, high quality and safety of aquaculture products;
Improve fish health, treatments and disease prevention methods;
Ensure an environmentally sustainable and profitable industry by developing improved
management systems and technology;
Improve output and cost control at every production stage of the lifecycle;
Implement innovations and improvements on fish genetics, reproduction in captivity and
new species in aquaculture;
Improve knowledge on fish nutritional and feeding requirements as well as safe
technologies to produce cost effective feed;
Ensure the availability and efficient use of aquaculture research infrastructures across all
boundaries to benefit the industry;
Build capacities and human capital in the European aquaculture sector.
The third area is research in marine conditions, safety and dietary properties of seafood and
the impact of oceans on human health. Projects from the Framework Programmes seek to
tackle challenges such as reducing sea emissions, noise and pollution. Both fisheries and
aquaculture need good quality aquatic environment to ensure the production of safe and
nutritious products. Projects from the FPs extensively cover areas of research related to
environmental sustainability of seafood production and processing industry, seafood quality and
safety and the assessment of potential public health risks caused by marine-degraded
environments. This degradation might be caused by debris, chemical and microbial pollution,
which cause increasing problems in oceans and seas. The economic and ecological costs of these
for fishing and aquaculture industries are considerable.
European research aims to improve the observation and monitoring of marine environment.
Examples of these are research on forecasting and anticipating effects of climate change and
efforts to develop non-invasive systems to monitor and assess fish-stocks and biodiversity. A key
focus area of Horizon 2020 Work Programme 2016-2017 programme65
is placed on the creation
of an integrated Mediterranean Sea Observing System, while the Horizon 2020 Work
65 Horizon 2020, Work Programme 2016-2017, Food security, sustainable agriculture and forestry, marine and maritime and
inland water research and the bioeconomy. http://ec.europa.eu/research/participants/data/ref/h2020/wp/2016_2017/main/h2020-
wp1617-food_en.pdf

115
Programme 2014-201566
focused efforts on tools and methodologies to model, understand and
predict Atlantic marine ecosystems.
Projects in this area are expected to create European added value by supporting trans-national,
pan-European research networks and synergies among national/regional and EU research
programmes as well as to facilitate economies of scale and research investment efficiency by
better aligning national/regional research programmes. Some of the expected impacts of FP7 on
this area of focus would be:
Providing solutions to minimise risks and transmission of fish and mollusc diseases;
Prevention and mitigation of diseases that impede the development of the European
fishing and aquaculture sectors;
Improved productivity, economic performance and image of European fishing and
aquaculture through improved biosecurity, health and welfare of marine animals;
Improve resources management to preserve ecosystems’ potential for sustainable
production;
Increased capacity to predict and measure the evolution of maritime pollution;
Mitigate negative impacts of marine pollution on the marine environment, fisheries and
maritime farms;
Improve modelling outputs and reduce cost of data collection in support of maritime-
related industrial and societal activities.
(b) Rationale for public intervention: key trends in the area, main challenges and
indicators
The European Union has agreed that by 2015 where possible and by 2020 at the latest all fish
stocks should be exploited at a level that will let them produce the maximum sustainable yield
for the long term (MSY)67
. This means taking the highest catches possible without affecting
future productivity of the stocks. As an example of the current situation, in the Mediterranean
Sea 93% of assessed fish stocks were overfished in 201568
.
Catches are limited to levels based on scientific advice. This is done by setting total allowable
catches (TACs) which are subdivided into national quotas69
. These set limits on the amount of
fish that can be caught and landed. The political and legal efforts of the EU will be in vain if all
actors do not collaborate. Therefore, the EU fisheries sector has a very clear EU dimension, as
choices at national or regional level directly impact the development and sustainability of the
activity in neighbouring Member States.
66 Horizon 2020, Work Programme 2014-2015, Food security, sustainable agriculture and forestry, marine and maritime and
inland water research and the bioeconomy. http://ec.europa.eu/research/participants/data/ref/h2020/wp/2014_2015/main/h2020-
wp1415-food_en.pdf 67 European Commission, Managing Fisheries. http://ec.europa.eu/fisheries/cfp/fishing_rules_en 68 European Commission – Press release. Commission plans for 2016 fishing opportunities: North and Atlantic seas fisheries
progress to sustainability, serious overfishing in Mediterranean. http://europa.eu/rapid/press-release_IP-15-5082_en.htm 69 More information on TACs and quotas can be found in European Commission, Managing Fisheries, TACs and quotas
webpage. https://ec.europa.eu/fisheries/cfp/fishing_rules/tacs_en

116
The EU fishing fleet is very diverse, with vessels ranging from under six metres to over 75.
According to the Communication on the Reform of the Common Fisheries Policy, fleet
overcapacity remains one of the main obstacles to achieve sustainable fisheries70
. Under EU law
the total capacity of the fishing fleet may not be increased and any decommissioning of vessels
or reduction of fleet capacity obtained through public support must be permanent. For the last 20
years, the EU fishing fleet capacity has declined in terms of both tonnage and engine power.
Despite enlargements to the EU, the number of EU vessels in 2015 was 85,154, 18,693 fewer
than in 1996. Restructuring the fishing industry is estimated to raise crew wages and improve job
attractiveness and working conditions in the sector. At the same time, the creation of jobs in the
processing industry should partially compensate job losses in the catching sector71
.
The unintended effects of fishing on the marine environment and ecosystems have to be
mitigated. Where necessary, the EU adopts measures to protect vulnerable habitats such as deep-
sea corals, and to reduce unintended harm to seabirds, seals and dolphins. Illegal fishing is also a
major threat to global marine resources. It depletes fish stocks, destroys marine habitats, distorts
competition, puts honest fishers at an unfair disadvantage, and destroys the livelihoods of coastal
communities, particularly in developing countries. It is estimated that between 11 and 26 million
tonnes of fish are caught illegally a year, corresponding to at least 15% of the world's catches.
Promoting the sustainable development of aquaculture is crucial to reduce the pressure on
fisheries and meet the growing global demand for fish and seafood. Europe represents the largest
market for fish in the world. Currently, an average of 23.1 kg of seafood per person per year are
consumed in Europe72
. Consumption has increased over the past decades and is predicted further
growth in the future. Only one out of four fish we eat in the EU comes from aquaculture today.
That is not nearly enough, especially considering that seafood products farmed in the EU are as
safe as can be – for animals and ecosystems as well as for us humans.
With EU landings of caught fish decreasing, fish imports have increased to around 65% of the
seafood consumed in the EU. In 2015, the UE produced only 1.53% of all worldwide
aquaculture production. Asian countries currently dominate aquaculture production, with China
producing 61% of the whole aquaculture production volume. EU aquaculture produces around
1.25 million tonnes of fish, which represents around 4 billion Euros in value and directly
employs 85.000 workers. EU aquaculture should be seen as an heterogeneous sector, with 90%
of EU enterprises in the sector having under 10 employees, ranging from coastal and pond
farming to a high-tech industrialised activity in particular marine fish farming. Current EU
aquaculture production is mainly concentrated in 4 countries: Spain, United Kingdom, France
and Greece making up 70% in volume and value of whole EU-28.73
Currently, the open method of coordination provides a framework for national strategy
development of aquaculture and for coordinating policies between EU Member States. This
voluntary process aims at giving practical answers to the challenges identified by the Member
70 Communication from the Commission to the European Parliament, the Council, the European Economic and Social Committee
and the Committee of the Regions: Reform of the Common Fisheries Policy. http://eur-lex.europa.eu/legal-
content/EN/TXT/PDF/?uri=CELEX:52011DC0417&from=EN 71 Commission Staff Working Paper, Impact Assessment Accompanying Commission proposal for a Regulation of the European
Parliament and of the Council on the Common Fisheries Policy. Referenced in http://eur-lex.europa.eu/legal-
content/EN/TXT/PDF/?uri=CELEX:52011DC0417&from=EN 72 European Commission, Facts and figures on EU aquaculture production and consumption in an EU and global context.
https://ec.europa.eu/fisheries/sites/fisheries/files/docs/body/2015-aquaculture-facts_en.pdf 73 The Economic Performance of the EU Aquaculture Sector – Scientific, Technical and Economic Committee for Fisheries
(STECF) https://stecf.jrc.ec.europa.eu/documents/43805/839433/2014-11_STECF+14-18+-
+EU+Aquaculture+sector_JRCxxx.pdf

117
States and stakeholders. According to the aquaculture Strategic Guidelines74
, four priority areas
should be addressed to unlock the potential of EU aquaculture:
Enhancing the competitiveness of EU aquaculture. Business development and
diversification can be promoted by market-driven research, innovation and knowledge
transfer. To this end, the Member States should foster synergy between national research
programmes and promote the participation of industry in research and innovation
activities.
Promoting a level playing field for EU operators by exploiting their competitive
advantages. Experience in the agricultural sector confirms that there is a growing
demand for sustainable, high quality food. High environmental, animal health and
consumer protection standards are among the EU aquaculture's main competitive factors
and should be more effectively exploited to compete on the markets. According to FAO,
organic aquaculture production in Europe increased by close to 30% annually between
1998 and 2007.
Securing sustainable development and growth of aquaculture through coordinated
spatial planning. The lack of space often cited as a hindering factor for the expansion of
EU marine aquaculture can be overcome by identifying the most suitable sites amenable
for aquaculture, as the current surface and coastline occupation by aquaculture activities
appears to be limited. Assessing environmental aspects in the frame of the spatial
planning process can reduce the administrative burden for private developers and limit
uncertainty in the licencing procedures, thus making investments more attractive.
Simplify administrative procedures. Available information suggests that in several
Member States authorisation procedures often take around 2-3 years to complete. Most
aquaculture producers are SMEs, and they are disproportionately affected by red tape.
Interacting with fishing and aquaculture activities, marine environment and conditions across
Europe are protected by the Marine Strategy Framework Directive since it was first adopted on
June 200875
. The Directive aims to achieve Good Environmental Status (GES) of EU’s seas and
oceans by 2020. This is defined as the “status of marine waters where these provide ecologically
diverse and dynamic oceans and seas which are clean, healthy and productive”76
. Moreover,
GES implies that: first, ecosystems are fully functioning and resilient to human-induced
environmental change. Second, the decline of biodiversity caused by human activities is
prevented and biodiversity is protected. Third, human activities introducing interacting with
marine environment do not cause pollution effects.
Member States are required to develop a strategy for achieving Good Environmental Status and
these must be kept updated and reviewed every 6 years. National marine strategies must include
an initial assessment of the current environmental status of national marine waters,
environmental targets with indicators and the establishment of a monitoring programme.
The table below provides a list of example indicators commonly used to measure the key trends
and challenges of European fisheries, aquaculture and marine conditions sectors.
74 European Commission, Strategic Guidelines for the sustainable development of EU aquaculture
http://ec.europa.eu/fisheries/cfp/aquaculture/official_documents/com_2013_229_en.pdf 75 Directive 2008/56/EC of the European Parliament and of the Council. Establishing a framework for community action in the
field of marine environmental policy (Marine Strategy Framework Directive). http://eur-lex.europa.eu/legal-
content/EN/TXT/PDF/?uri=CELEX:32008L0056&from=EN 76 Article 3. Directive 2008/56/EC of the European Parliament and of the Council. Establishing a framework for community
action in the field of marine environmental policy (Marine Strategy Framework Directive). http://eur-lex.europa.eu/legal-
content/EN/TXT/PDF/?uri=CELEX:32008L0056&from=EN

118
Table 17 Key indicators related to the areas of fisheries, aquaculture & marine conditions
Indicator Indicator values/examples
Apparent seafood consumption 23.1 kg/year in 201277
Gross amount of catches from EU fishing sector 5.1 million tonnes in 201578
Gross profit of EU fishing fleet 1.3 billion Euros in 2013Error! Bookmark not defined.
Net profit of EU fishing fleet 506 million euros in 2013Error! Bookmark not defined.
EU fishing fleet capacity 83,734 vessels in 2013;
Combined gross tonnage of 1.6 million tonnes in 2013;
6.5 million kilowatts of engine power in 201379
.
Sector energy consumption in millions of litres of
fuel/ energy efficiency
2, 353 million litres of fuel in 2013;
502 litres per landed tonne of fish in 201380
.
Direct employment in the fishing sector 149,000 workers which correspond to a total of 110,000 jobs
in Full Time Estimates.Error! Bookmark not defined.
Productivity of EU fleet 23.000 Euros per full time job.Error! Bookmark not defined.
Sustainability of fish stocks Percentage of stocks overfished.
Gross production from EU aquaculture sector 1.2 million tonnes in 2014Error! Bookmark not defined.
Value of production from EU aquaculture sector 3.9 billion Euros in 2014Error! Bookmark not defined.
Direct employment in the aquaculture sector Direct employment of 85,000 workersError! Bookmark not defined.
Average yearly wage of aquaculture workers 22,100 euros in 2012Error! Bookmark not defined.
Aquaculture key performance indicators (KPI):
growth rates, mortality and feed efficiency/feed
conversion ratio
Feed conversion ratio of [1.0-1.2] for salmonids and [1.4-
1.8] for omnivorous fish.81
Aquaculture productivity & economic
performance
3,000 Euros per tonne in 201482
Net investments in aquaculture sector i.e. 64.8 million Euros in France in 2012; 223.8 million
Euros in Italy in 201283
Index of diversification of EU aquaculture 0.3504 for freshwater aquaculture, 0.3 for marine, 0.19 for
shellfishError! Bookmark not defined.
Source: PPMI, “Assessment of the Union Added Value and the Economic Impact of the EU Framework
Programmes (FP7, Horizon 2020)”, forthcoming).
77 European Commission, Facts and figures on EU aquaculture production and consumption in an EU and global context.
https://ec.europa.eu/fisheries/sites/fisheries/files/docs/body/2015-aquaculture-facts_en.pdf 78 Eurostat 79 Scientific, Technical and Economic Committee for Fisheries, 2015 Annual Economic Report on the EU Fishing Fleet.
https://stecf.jrc.ec.europa.eu/documents/43805/1034590/2015-07_STECF+15-07+-+AER+2015_JRCxxx.pdf 80 Based on data in Table 3.6.1 in Scientific, Technical and Economic Committee for Fisheries, The 2015 Annual Economic
Report on the EU Fishing Fleet https://stecf.jrc.ec.europa.eu/documents/43805/1034590/2015-07_STECF+15-07+-
+AER+2015_JRCxxx.pdf 81 JRC Technical Reports, An approach Towards European Aquaculture Performance Indicators: Indicators for Sustainable
Aquaculture in the European Union.
http://publications.jrc.ec.europa.eu/repository/bitstream/JRC75891/jrc_g04_fishreg_eapi%20final.pdf 82 Source: Eurostat 83 JRC Scientific and Policy Reports, The Economic Performance of the EU Aquaculture Sector (STECF 14-18).
https://stecf.jrc.ec.europa.eu/documents/43805/839433/2014-11_STECF+14-18+-+EU+Aquaculture+sector_JRCxxx.pdf

119
(c) Defining the scope of the European added value case study
FP7 contributed with almost EUR 100 million to R&D activities in the fisheries sector. Most of
the funded FP7 projects in this area were supported by Food, Agriculture and Biotechnology
(FP7-KBBE) and Transport (FP7-TRANSPORT), contributing with EUR 28 and 27 million
respectively. Projects funded under FP7-KBBE were related to a wide range of topics such as: 1)
fisheries management and sustainability; 2) transmission of scientific knowledge to stakeholders;
and 3) mitigating the adverse impacts of fisheries on marine environment and ecosystems.
Fisheries projects under FP7-TRANSPORT were mostly related to technological improvements
of vessels such as reduction of fuel consumption and decreasing emissions. Projects funded
under FP7-ENVIRONMENT, with a total contribution of EUR 20 million, also had an important
role on promoting sustainable fisheries through the involvement of stakeholders on fisheries
management and diminishing the impact of fishing activities on seas and oceans.
With 51 projects and a total contribution of approximately EUR 130 million, FP7-KBBE and
FP7-SME had a major role in funding Aquaculture projects with around EUR 80 and 30 million
respectively. These programmes covered research areas such as: the introduction of new species;
the improvement of technical capabilities and productivity of the sector; achieving products with
higher market value; and minimising the environmental risk of fish escapes.
Research on marine conditions received around EUR 340 million from FP7 funding. The largest
part of the funding was supported under KBBE and ENVIRONMEMT programmes. Activities
in KBBE tended to interact with fishing and aquaculture activities. Some examples of issues
covered in this theme were monitoring toxins and pollutants in food production processes in the
aquatic environment, the study of genetic differences of released farmed fish and helping
consumers make fully informed choices with regards sustainability and safety of their seafood.
FP7 ENVIRONMENT projects focused on topics with slightly less direct impact on fisheries and
aquaculture. Examples of the areas covered are the better understanding and knowledge of
ecosystems and their interaction with human activities, improving capacities to obtain and
manage sea and ocean environmental data, reducing environmental risks such as algal blooms
and understanding the impacts of climate change on marine ecosystems.
Table 18 Projects related to the areas of Fisheries, Aquaculture and Marine conditions and
their allocated EU contribution
Fisheries Aquaculture Marine Conditions
Programme Number
of
projects
EU
contribution,
EUR million
Number
of
projects
EU
contribution,
EUR million
Number
of
projects
EU
contribution,
EUR million
FP7-KBBE 10 31.1 21 77.7 16 77.8
FP7-TRANSPORT 9 26.5 0 0.0 2 5.6
FP7-SME 4 6.0 24 29.1 5 7.1
FP7-ENVIRONMENT 3 20.1 1 6.0 23 74.8
FP7-SiS 2 6.6 0 0.0 0 0.0
FP7-INFRA 1 5.0 1 9.2 5 24.0
FP7-REGPOT 1 0.9 3 4.3 0 0.0
FP7-ICT 0 0.0 0 0.0 3 8.7
FP7-SPACE 1 1.6 1 2.5 5 69.3
Total 30 97.8 51 128.8 60 336.6
Source: PPMI, “Assessment of the Union Added Value and the Economic Impact of the EU Framework
Programmes (FP7, Horizon 2020)”, forthcoming). based on CORDA data

120
F.3.2. Key findings
(a) Factors/mechanisms of influence fostering European added value
Reduction of commercial and research risks
The reduction of commercial risk was an added value in certain areas of research with potential
return on investment. These areas were usually characterised by having long maturity processes
of their innovation and therefore being many years away from the market. Long-term research
actions could be considered too risky without public funds. According to interviews, projects of
this kind would most probably have been discontinued without public intervention. Most
interviewees were uncertain if national funds would have been able to cover commercial and
research risks to the same extent as FP7 did.
Reduction of research risks would also be important in specific projects where fish are farmed
and diseases or other biological hazards could have substantial negative impact on research
outcomes. The availability of a large number of partners in FP7 and the flexibility in distributing
funds across partners helped these projects diversify their risks.
Leverage of private and public investment
Interviews with beneficiaries revealed that FP7 leverage of investment in fisheries and
aquaculture projects was rather limited and happened mostly from public sources of funding.
Fisheries and aquaculture R&D activities are not traditionally associated with large amounts of
funding from private sources. Interviews confirmed the difficulties of these research areas to
attract additional private funds. Only a limited number of projects achieved further direct private
investment. These projects were characterised by the development of close to market
innovations. There is, however, an interesting trend of FP7 attracting considerable in-kind
investments. This is especially relevant in aquaculture, where industry partners frequently
committed part of their eggs/fish stocks or facilities for research purposes. The value of these in-
kind investments is not easy to quantify in monetary terms, but it was relevant to kick-start many
projects.
Another trend found during the interviews is that many projects used European funds to start
research on specific areas. At later stages of the project, they obtained follow-up national grants
to further develop narrow research issues. These sub-areas of research funded by national grants
tended to be more geographically localised and more focused in scope. Follow-up national grants
were especially common in certain countries where national R&D policies have traditionally
allocated larger amounts of resources to support research on fisheries and aquaculture (i.e.
Norway and France).
Pooling resources and building critical mass
Access to infrastructures not available in many EU countries was crucial for the development of
most FP7 projects in fisheries, aquaculture and marine conditions. There are at least three
reasons for this. First, many projects required infrastructures, skills or capacities that could only
be found in certain ‘innovation clusters’ around Europe. These are projects that require very
specific technical knowledge, skills or infrastructures that could not be found in any single
European country. Therefore, without FP7 funds, research teams would not have been able to
access key infrastructure or knowledge available somewhere else in Europe. Many projects in

121
fisheries and aquaculture were based on these kinds of ‘vertical cooperation’ where each partner
was in charge of a particular task or contributed with unique facilities.
In aquaculture, it was frequent to observe private partners in hatcheries and fish farms
implementing actual interventions and collecting data while universities or public research
centres focused on analysing results. Therefore, research centres tended to rely not only on their
own data, but also on important research data collected, in many cases, by private partners. A
number of interviews confirmed that most national programmes would not include the required
amount of international partners and kinds of collaborations that these projects require.
Therefore, a majority of these projects involving specialised partners would not have gone ahead
without European funding.
A second European added value aspect on pooling resources can be found on projects that were
based on comparative research. Many FP7 projects in the areas of fisheries, aquaculture and
marine conditions consisted on comparing the effects of an intervention on different species or
ecosystems. These frequently required international partners in different European sea basins to
cooperate in the implementation of the project. Data was usually collected in different
environments (i.e. different sea basins) and analysed to compare results. In this kind of
‘comparative projects’ interviewees said that, without FP7 funds, projects would have gone
ahead with a very substantial reduction in scope. This was mostly because they would not have
been able to do these comparisons or application of research in different
environments/ecosystems.
Related to this European added value aspect, interviews also showed that European fisheries and
aquaculture projects offered many more possibilities to include multi- and inter-disciplinary
teams than most national schemes. This made it possible to implement projects which were
based on innovative combinations of approaches (i.e. integrating social sciences and pure
sciences) or involvement of stakeholders. Therefore, without European funds the diversity of
partners would most likely have been lower.
A third European added value aspect related to pooling resources and building critical mass is
the size of certain European projects. The amount of funding of some of these projects is larger
than that available from most national funding schemes. Occasionally, EU funding acted as a
catalyst for projects that could not be developed only at national level. In this sense, EU funding
kick-started research in one area and later attracted further national funds for complementary
research activities.
Increased international and/or inter-sectoral mobility of researchers
Interviews with project beneficiaries confirmed that international and cross sectorial mobility
was one of the main European added value aspects in fisheries, aquaculture and marine
conditions projects. Practically all projects in these research areas included examples of
international mobility of researchers, PhD students and/or stakeholders. International exchanges
between public research institutions were very frequent. These tended to have relatively long
durations (6 months to 1 year) and largely contributed to knowledge transfer and creating
research networks.
International travels to visit research infrastructures (i.e. fish farms or hatcheries in case of
aquaculture projects) were also common. According to interviews, even these short-term
exchanges (few days to weeks) proved to support outstanding results and benefits, especially
when associated to detailed planning and preparatory work, with the establishment of long-term

122
collaborations that are still on force, even beyond the duration of the project. Interviews
highlighted the creation of knowledge and share of know-how that these visits meant for many
partners. There were even cases where professionals from academia switched to the private
sector and reached management positions in private research facilities. This happened in two
ways. First, researchers in public research institutions moved to technical positions in partner
companies. The second way was the direct creation of spin-offs from academy. Interviews
confirmed that the links and networks established during FP7 projects have been crucial for these
inter-sectoral exchanges of personnel and professional careers.
Some FP7 projects also included international stakeholder meetings and trips to exchange
experiences. Interviews confirmed that FP7 projects made sharing information among
stakeholders possible by bridging typical language barriers that would occur otherwise.
(b) Better results achieved because of European added value
Improved research excellence / capabilities
FP7 funding in the areas of fisheries, aquaculture and marine conditions had a considerable
positive added value on research excellence and capabilities. According to interviewees, the
European added value of FP7 on research capabilities was related to its ability to: 1) allow the
cooperation among best experts on a field; 2) promote multidisciplinary teams; 3) develop new
open access research infrastructures; and 4) create jobs in research institutions.
A clear added value of FP7 is its capacity to create first-class international networks with leading
partners and the best experts on the field. Inside of these networks, there is frequently a high
degree of multi- and interdisciplinarity that allows associates to complement each other in terms
of specific skills and knowledge. This larger diversity of partners in European networks also
allowed collaborations across different fields of research which were sustained once the project
was finished.
In certain cases, FP7 helped develop further research infrastructures and data which are now
openly available to the whole research community. A clear example is the ‘Transnational
Access’ online platform created during the FP7 - AquaExcel project (and developed under
Horizon 2020 – AquaExcel2020) 84
. This platform currently allows online applications to pursue
research using aquaculture research facilities located all across Europe. It also includes an
‘interactive map’ that allows to visualise these and other research infrastructures in Europe and
beyond. Another example are the data and models from FP7 - LifeWatch project, currently on
open access and under creative commons, which allow researchers from all around the world to
have an insight on marine biodiversity in European coasts 85
.
In many cases, the implementation of FP7 projects also created direct research job positions and
PhD vacancies in research institutions. These largely benefited from the European added value
of FP7 on mobility and research networks and are expected to contribute to improve future
research capabilities of European organisations.
84 Aquaexcel 2020. http://www.aquaexcel2020.eu/ 85 LifeWatch. E-Science European Infrastructure for Biodiversity and Ecosystem research http://www.lifewatch.eu/
And LifeWatch Marine VRE. http://marine.lifewatch.eu/

123
In terms of research excellence, FP7 contributed to achieve a larger number of relevant and high
impact scientific publications. This was mostly due to the improved research capacities and new
approaches developed during FP7 projects. Research outputs greatly benefited from the
possibility of bringing together the best experts from all across Europe, the capacity of sharing
research data and infrastructures and the combination of different disciplines inside of FP7
projects. Many interviewees highlighted the possibility provided by FP7 of doing research in
different ecosystems (i.e. different sea basins, fish species, water environments, etc.) and with
people in different branches of science (including social scientists) as key factors behind the
improvement of their research outputs and excellence. The comparative and
multi/interdisciplinary approaches that FP7 allowed had a very large impact on producing new
methodologies, research results and high impact scientific publications.
Another important factor behind better research excellence was the prestige granted by having
received FP7 funds. The competition in FP7 calls was widely known in the research community.
Therefore, FP7 beneficiaries were helped by a label of ‘high competitive organisations’ obtained
from having been selected for European funding. According to interviews, this had a positive
impact on beneficiaries in terms of participation in scientific conferences and general scientific
publications. However, some interviewees reported that it is unlikely that this more prestigious
image of FP7 beneficiaries would have helped achieve more publications in peer-reviewed
journals. Peer reviewed journals in fields linked to aquaculture, fisheries and marine conditions
(i.e. genomics, biology, environmental sciences) typically have robust revision procedures that
only take into account the quality of submitted research. However, according to some
interviewees, there is still a lack of high quality journals that recognize the value of inter-
disciplinary research, as in the case of projects which applied a typical RRI approach. This
barrier might affect the interest of marine scientists to engage into inter-disciplinary studies.
The increased visibility of researchers, the data collected within projects, the network
established, and projects achievements, leveraged the capability of FP7 projects participants to
get involved in application to new EU/national project calls, both as a spill-over activity from
consortium already established or, as single partners involved by other, earlier unknown
scientists, in new consortium.
Some interviewees also revealed an European added value aspect related to the perspective of
reapplying to future FP7 and Horizon 2020 calls. According to them, there is a strong incentive
to publish scientific publications based on research results from FP7 projects. These publications
would show evaluators the capacities and achievements of the consortium members in previous
projects and would therefore increase the chances to get funding in future FP calls. This
motivation to publish is not present in most national programmes as they are usually not so
competitive.
Economies of scale and scope
Despite not being the main area of European added value in fisheries, aquaculture and marine
conditions, some interviewees agreed that their project achieved an increase in resource
efficiency due to the scale of the project. This was mostly due to sharing research infrastructures
and data between international partners. Without European-wide projects there would have been
a repetition of efforts on developing facilities that can already be found in other EU countries.
Moreover, those projects that involved data collection or analysis in different sea basins greatly
benefited from international partnerships in terms of travel costs. Without international partners
these projects would have sometimes required moving across Europe key infrastructures such as
research vessels.

124
Wider availability and dissemination of knowledge
Interviews with project beneficiaries confirmed that FP7 funding had a substantial added value in
terms of wider availability and dissemination of knowledge. More specifically, FP7 projects
related to fisheries, aquaculture and marine conditions would have produced many more
dissemination outputs and achieved a higher involvement of stakeholders than similar national
projects.
Interviewees indicated that the size of FP7 projects and the prestige of having won a competitive
EU grant allowed them to reach a much larger audience. A vast majority of projects had their
own webpage with full explanations of the project, highlighted news and activities and links to
publications with main results. However, in most cases these websites last only until a few years
after the finalization of the projects. Many interviewees noted their participation in activities
such as conferences, symposiums, expositions and radio interviews among others. According to
interviews, these activities also affected the visibility and interest on FP7 activities at national
level, thus also influencing national research interest on topics and innovative approaches
developed at European scale.
European projects, due to the fact of being larger and more prestigious, were more successful in
attracting and involving stakeholders. This further increased the impact and dissemination of
results. At the same time, some projects acted as a platform for stakeholders to reach and
influence European policy-makers. This was especially important in the fisheries sector, where
small actors usually do not have the resources to cooperate among them at an international level
(i.e. because of language barriers).
An obstacle to further added value of FP projects was the lack of incentives of certain partners to
disclose research results. Interviews identified that private partners in projects could sometimes
release only part of their research results in order to preserve their commercial interests.
Interviews showed disagreements between project partners in public institutions and those in the
private sector. While the former put emphasis on publishing results, the later were sometimes
slightly reluctant to share knowledge that could give advantages to their direct competitors. A
point of agreement between project partners was usually reached. This consisted on publishing
all important research results except those that involved a larger level of micro-managing of
privately owned research facilities.
Better coordination of national research policies and practices at the EU level
FP7 funded four ERA-NET projects in the areas of fisheries, aquaculture and marine conditions
that had an added value in coordinating national research policies. These were the projects
MariFish (2006-2011), SEAS-ERA (2010-2014), MarineBiotech (2011-2013), and the still
active COFASP (2013-2017). The total EU funding for these four actions was around 8 million
euros. According to interviews, these ERA-NET projects greatly helped identifying gaps,
avoiding duplication of efforts and strengthening collaboration among national programmes and
agencies in the areas of fisheries, aquaculture and marine conditions. Moreover, ERA-NET
actions contributed to identify strategic and future priority sub-areas of research and reduced the
financial and research risks by spreading research and innovation costs.
(c) Long-term impacts resulting from European added value
Better addressing societal / pan-European challenges

125
EU level actions were crucial to develop a more resource-efficient Europe with sustainable
production of safe, nutritious and healthy food from renewable resources. FP7 largely
contributed to optimise the sustainable contribution of fisheries and aquaculture while providing
viable solutions to natural ecosystems. Interviewees mentioned that some national programmes
can also address these issues, but they tend to be too specific and do not have a long term
perspective of these pan-European challenges.
As explained in previous sections, the fisheries sector can not rely on fishing more because it
would not be sustainable. There needs to be a change towards fishing more intelligently with a
more modern and innovative fishing sector. FP7 projects have contributed to enhance scientific
knowledge and innovation which is used to support decision making and more sustainable
fisheries management. Moreover, some projects (e.g. Gap1, Gap2, Jakfish) also addressed the
benefits of an increased stakeholders participation into research activities, fisheries management
and marine governance, providing pan-European experiences, guidelines and toolbox to support
approaches for a more active engagement of societal actors to tackle EU societal challenges that
are relevant to managers and policy makers. At the same time, FP7 actions have played a part in
producing innovations to increase fuel efficiency of vessels which can reduce emissions and
noise in seas.
FP7 recognised the potential of aquaculture for growth, innovation and addressing pan-European
societal challenges. Interviews confirmed that Europe is one of the leading actors behind
aquaculture technological development and research. European R&D projects played a key role
in achieving innovations and research outputs much faster that it would have taken without
international cooperation.
F.3.1. Stories of impact
SALMOTRIP
Escaped fish can potentially cause disastrous consequences on ecosystems. These animals can
impact the genetic pool of native fish populations through interbreeding, affect ecosystems
through predation and competition, and transfer diseases to wild fish. In a worst-case scenario,
escaped fish can expand, devastate local species and cause ecosystem collapse. Moreover, fish
escapes might have had a substantial impact on the image of aquaculture. From 2007 to 2009,
255 escape events were documented in Europe. These added an estimated 9.2 million fish86
.
These events were mostly caused by technical and operational failures such as cages break,
netting holes and operational accidents.
The FP7 project SALMOTRIP offered important steps to tackle negative impacts of fish escapes
in aquaculture87
. The project provided very relevant evidence of the possibility of farming and
commercialising sterile salmon. In the mid future, this could generate an important innovation
that could significantly improve the performance of European salmon industry and its ecological
risks.
SALMOTRIP achieved the production of sterile (triploid) salmon for experimental and
commercial trials and significantly strengthened the scientific understanding of biological needs
of sterile (triploid) fish. Moreover, the project provided important recommendations on how to
implement a full-scale production of sterile salmon and identified areas for further study before
86 Final Report from FP7 project Prevent Escape. http://cordis.europa.eu/result/rcn/56373_en.html 87 Salmotrip. http://cordis.europa.eu/project/rcn/92644_en.html

126
triploid salmon can be commercialised. According to interviews performed, results from this
project could be potentially extended to other species in the future.
Sterile (triploid) fish are created by forcing the egg to keep a chromosome that is normally
eliminated during egg development. This is usually achieved by applying pressure to recently
fertilised eggs. Before SALMOTRIP, tripoloid salmon was associated to poor economic
performance due to higher mortalities and deformities. This occurred because traditional triploid
egg production was often based on using substandard quality eggs. SALMOTRIP proved that
with an adequate broodstock selection, triploid salmon can perform as well and even better than
diploid ones. This was an important result as it constituted a significant improvement in this area
of research and a potential culture change in the aquaculture sector.
FP7-SALMOTRIP was also an example of pan-European cooperation with strong trans-national
collaboration involving two leading salmon breeding SMEs along with fish farming SMEs from
three European countries and two UK research centres.
AQUAEXCEL
Interviewees highlighted the importance of cross-country cooperation in aquaculture. This allows
researchers to compare results of research in different ecosystems (i.e. sea basins); to find very
specific knowledge for cutting-edge projects; and to find particular infrastructures for
experiments.
European aquaculture research experienced a certain degree of fragmentation as well as a lack of
harmonization with important differences in criteria, methods and processes used for
experiments.
One key FP7 project in the area of aquaculture, AQUAEXCEL88
(2011-2015), provided a
platform of top class research infrastructures and common standards and protocols for the
aquaculture research community. This platform is still active under the follow-up AQUAEXCEL
2020 (2016-2020) project supported by Horizon 2020 funds. It currently integrates 39 facilities
which range from production systems and fish species to research centres with specialised fields
of expertise. Both projects (FP7-AQUAEXCEL and Horizon 2020-AQUAEXCEL 2020) were
excellent examples of pooling resources at European level and were pointed as having very large
European Added Value to aquaculture research.
The platform provides subsidised access to these facilities to selected research proposals and
offers training for aquaculture researchers, technical staff and industry stakeholders.
AQUAEXCEL was highly successful in this regard. It received 146 applications for research
projects and funded 97 of these. The current project AQUAEXCEL 2020 has a budget of 9.7
million Euros and grants access to research teams, industry and SMEs from the EU-28 and
associated research teams. Access for organisations based in third countries is limited to a
maximum of 20%. AQUAEXCEL 2020 offers transnational access to infrastructures located in
almost 20 different countries.
ARRAINA
88 Aquaexcel http://www.aquaexcel.eu/ and Aquaexcel 2020. http://www.aquaexcel2020.eu/

127
ARRAINA contributed to develop sustainable alternative fish diets with reduced use of fish meal
and fish oil89
. This was achieved by studying the impact of different diets on various fish species
over their full life cycle. The project carried out a large selection of tasks such as:
Analysing previous scientific findings on fish diet requirements;
Studying the most efficient method to feed fish larvae and develop diets for these;
Compiling a database to predict fish flesh fatty acid based on compared diets. This
resulted in a tool that predicts the nutritional value of fish for human consumption;
Comparing the effects of plant-based with traditional juvenile fish dietary supplements;
Analysing the presence of contaminants (i.e. pesticides and mycotoxins) associated to
non-marine based ingredients of aquaculture feed;
Estimating waste loads and environmental impact of fish farms depending on the diet.
ARRAINA is expected to have a positive impact on fish nutrition and growth. In the mid-future,
this will benefit aquaculture efficiency, competitiveness and economic performance. The project
will potentially reduce environmental impacts of fish farms and will contribute towards safer fish
for human consumption.
F.4. European added value case study 4: Fuel Cell & Hydrogen
F.4.1. Overall context
(a) Definition and expected impact of the area
The availability of sustainable, secure and competitive energy sources is a major factor
determining today’s economy’s growth, jobs, stability and general well-being of European
citizens. Energy is at the root of the climate change and air pollution: it accounts for 80% of all
greenhouse gas (GHG) emission in the EU. Unfortunately, even today Europe’s economy is still
largely dependent on unsustainable carbon-based energy sources that also pose major
environmental challenges. In the EU, the primary energy supply is 80% dependent on fossil
fuels. Changing this trend will be extremely difficult primarily because the current infrastructure
- networks and supply chains - have been optimised over decades to deliver energy from oil, coal
and gas. In addition to the threat of the climate change and other environmental issues, this
situation has made Europe vulnerable to energy supply fluctuations outsides its borders, which
poses a major security issue for Europe.90
It is estimated that Europe’s dependence on carbon-
based energy import will grow even more in the future: reliance on imports of gas is expected to
increase from 57% to 84% by 2030, of oil from 82% to 93%. Finally, dependence on old sources
of energy will likely to be a major challenges to Europe’s future competitiveness with the EU
becoming increasingly exposed to the effects of price volatility and price rises on international
energy markets. 91
89 Arraina http://www.arraina.eu/ 90 Communication from the Commission, „Investing in the Development of Low Carbon Technologies“
(SET-Plan), Brussels, 7.10.2009 COM(2009) 519 final. 91 Communication from the Commission, „An energy Policy for Europe“, Final, 2007.

128
All of the above challenges related to global climate change, Europe’s security and
competitiveness raise a need for a concerted EU-level action. Already the Europe’s Energy
Policy raised a strategic goal of 20% GHG reduction by 2020 (compared to 1990) and 80-95%
reduction of 1990 levels by 2050 to keep the global temperature increase below 2°C. Tackling
the energy-related challenges in Europe and meeting the above targets requires a transition to an
energy and transport system built around low-carbon technologies.92
Fuel cells and hydrogen
(FCH) technologies belong to the most promising research areas, likely to contribute to the
realisation of low-carbon economy in future’s Europe. The main reason for this is that hydrogen
is an energy carrier with the unequalled advantage of being storable in various forms and
transportable in various modes. Most importantly, it can be produced from carbon-free or
carbon-neutral energy sources, thereby allowing a drastic reduction of greenhouse gas emission
in energy sector. Fuel cells provide the most efficient conversion device for converting
hydrogen, and possibly other fuels, into electricity. In combination, fuel cells and hydrogen
provide a pathway for a safe, carbon-free and decentralised energy generation with multiple
applications.93
The importance of hydrogen as an alternative fuel is also acknowledged at the EU level. In 2008,
the Fuel Cells and Hydrogen Joint Undertaking was established by a Council Regulation as a
public-private partnership between the European Commission, European industry and research
organisations to accelerate the development and deployment of fuel cell and hydrogen
technologies. It was assumed that research, development and deployment strategies in which all
the stakeholders are committed to common objective are necessary in order to achieve a
significant market penetration by fuel cells and hydrogen technologies in transport and power
generation.
In 2013, the Commission issued a Communication on Clean Power for Transport: A European
alternative fuels strategy94
followed by a Directive on the deployment of alternative fuels
infrastructure95
. These documents list hydrogen as one of the alternative fuels to substitute fossil
oil sources in the energy supply to transport. Hydrogen is seen as having a potential to cover all
transport modes (road-passenger, road-freight, rail and water) except air transport.96
In order to
improve the acceptance of these technologies related to the alternative fuels, information
campaigns and large-scale demonstration projects are seen as important tools. The Strategy
emphasises that based on the experience gained with the European Technology Platforms and
Joint Technology Initiatives, public-private partnerships should be further developed. The
Directive indicates the need to better coordinate the policy in this field and therefore requires that
“Each Member State shall adopt a national policy framework for the development of the market
as regards alternative fuels in the transport sector and the deployment of the relevant
infrastructure”.97
92 Georg Zachmann, Cutting Carbon, not the Economy, Bruegel Policy Contribution, Issue 2012/03 FEBRUARY 2011. 93 Pierre-Etienne Franc et al., Fuel Cell and Hydrogen technologies in Europe 2014-2020: Financial and technology outlook on
the European sector ambition 2014- 2020, 2011. 94 EC, Communication from the Commission to the European Parliament, the Council, the European Economic and Social
Committee and the Committee of the Regions, Clean Power for Transport: A European alternative fuels strategy. Brussels,
24.1.2013, COM(2013) 17 final. 95 Directive 2014/94/EU of the European Parliament and of the Council of 22 October 2014 on the deployment of laternative
fuels infrastructure. Official Journal of the European Union, 28.10.2014, L 307/1. 96 EC, Communication from the Commission to the European Parliament, the Council, the European Economic and Social
Committee and the Committee of the Regions, Clean Power for Transport: A European alternative fuels strategy. Brussels,
24.1.2013, COM(2013) 17 final. P. 4. 97 Directive 2014/94/EU of the European Parliament and of the Council of 22 October 2014 on the deployment of alternative
fuels infrastructure. Official Journal of the European Union, 28.10.2014, L 307/1.

129
Expected impact
The overall long-term objective of the FP7-funded research projects in the area of fuel cells and
hydrogen is to accelerate the market introduction of fuel cells and hydrogen technologies,
realising their potential as an instrument in achieving a carbon-lean energy system in Europe.
However, to achieve this general objective intensive research efforts are needed in several
important areas, where the impacts of the EU-funded research in fuel cells and hydrogen are
mostly expected98
:
Hydrogen Production. In this area the research is expected to result in the development and
implementation of cost-competitive, energy efficient and sustainable hydrogen production,
storage and distribution processes that would satisfy Europe‘s long-term energy demands and
help to switch to hydrogen-based economy. When considered as based on natural gas, hydrogen
production is already an advanced technology. However, more intense research is needed in
order to provide hydrogen from ‚CO2-free‘ sources, such as renewables and nuclear power. The
sustainable hydrogen production technologies expected to result from the research include (i)
reforming (and gas purification) based on bio-fuels as well as conventional fuels; (ii) cost-
efficient low-temperature electrolysers adapted for the large-scale use of carbon free electricity
and (iii) biomass to hydrogen (BTH) thermal conversion.
Hydrogen storage and distribution. Major technical advances are needed in this area as the
current energy density is fairly low for existing hydrogen storage technologies, being 10 – 20 %
of that of gasoline or diesel. To increase the storage capacities, current research is expected to
result in the development and demonstration of technology options for high volume, safe
hydrogen storage such as storage in underground caverns and decentralized storage. In addition,
the research should provide improved hydrogen storage based on solid and liquid materials. In
terms of the hydrogen distribution, the research is expected to improve the means of hydrogen
distribution and delivery by road transport (e.g. increased capacity), in order to meet the needs of
large fuelling stations.
Stationary Power Generation and Combined Heat & Power. In this area, research is expected
to improve the technology for fuel cell stack and balance of plant components to the level
required by the stationary power generation and Combined Heat and Power (CHP) markets by
bridging the gap between laboratory prototypes and pre-commercial systems. For this purpose, it
will be important to achieve the principal technical and economic specifications necessary for
stationary fuel cell systems to compete with existing and future energy conversion technologies.
Research will deliver new or improved materials as well as reliable control and diagnostics tools
both at component and system levels. It will also improve their performance, endurance,
robustness, durability and cost. In addition, research will aim at making the new technologies
ready for their introduction into the market: this will require test campaigns for product
validation under real market conditions and preparations for the start-up of fuel cell installation,
operation and maintenance services.
Transport & Refuelling Infrastructure. In this area research is expected to support the
development and testing of competitive hydrogen-fuelled road vehicles and corresponding
hydrogen refuelling infrastructure, and the full range of supporting elements for market
deployment and increased industrial capacity. Most importantly, a variety of fuel cell hybrid
98 Fuel Cells And Hydrogen Joint Undertaking (Fch Ju), Multi - Annual Implementation Plan 2008 – 2013, Adopted by the FCH
JU Governing Board on 22nd November 2011.
Also: European Hydrogene & Fuel Cell Technology Platform: Strategic research Agenda, 2005.

130
vehicles, including cars and buses, hydrogen-fuelled vehicles and an appropriate number of
refuelling stations, should be generated and demonstrated in fuel cells and hydrogen focused
research projects. In addition, the research should demonstrate that this new type of vehicles are
suitable are ready for large-scale market use, including the durability, robustness, reliability,
efficiency and sustainability of both vehicles and support infrastructures. In addition, research
activities also envisage the application of fuel cells and hydrogen based technologies in the area
of heavy duty road transport, such as commuter trains, rail cars, city trains, trucks, aircrafts, as
well as maritime applications. Finally, in terms of the refuelling infrastructures, research
activities are expected to result in the development and integration of the necessary components
for hydrogen refuelling stations and their associated peripheral conditioning systems. As in the
case of transport, application, research should also lead to the improvement of refuelling
infrastructure‘s energy efficiency, robustness, functionality, safety, as well as prepare it for
large-scale introduction into the markets. Overall, research on the application of fuel cells and
hydrogen technologies in the area of transport and refuelling technologies is expected to be the
main instrument in reducing CO2 emissions, alleviating dependence on oil and improve fuel
economy in Europe.
Early Markets (portable applications). Although not highly relevant for reducing CO2
emissions and developing carbon-free energy economy, early market applications are important
in terms of proliferating fuel cells and creating an early industry consisting mainly of SMEs.
Therefore, it is expected that research projects focusing on fuel cells and hydrogen will also
contribute to the development and deployment of a range of fuel cell-based products capable of
entering the market in the near term. More specifically, research will show the technology
readiness of (i) portable and micro fuel cells for various applications; (ii) portable generators,
back-up power and UPS-systems; (iii) specialty material handling vehicles including related
hydrogen refuelling infrastructure. Most importantly, the expected impacts include not only the
development of these technologies, but also preparation for their wide-scale market introduction
by reducing the production costs, achieving the market economies.
(b) Rationale for public intervention: key trends in the area, main challenges and
indicators
Although fuel cells and hydrogen provide probably one of the most promising pathways to a
carbon-free economy in Europe, markets alone cannot encourage the development and
deployment of competitive technologies.99
The scale and scope of the financial resources and
technical capacities necessary for the development and deployment of fuel cells and hydrogen
technologies across the spectrum of applications goes beyond the capacity of single companies
or public research institutions. Several key barriers require a concerted EU-level action that
would unite and coordinate the efforts of industry and research community:
In order to introduce new technologies into a consumer market, a close collaboration
between public and private entities is necessary. This collaboration will help to bridge the
gap between the research/prototype demonstration stage and the full-scale commercial
introduction of fuel cells and hydrogen technologies100
. The Joint Undertaking in the area of
fuel cells and hydrogen supported by the European Commission helps to ensure the leading
role of industry in defining priorities and timeliness of the work;
99 Georg Zachmann et al., The great transformation: decarbonising Europe’s energy and transport systems, Bruegel 2012. 100 European Hydrogen and Fuel Cells Technology Platform, Deployment Strategy, August 2005.

131
As in the case of many new technologies, a threat of market failure poses a real threat for the
deployment of fuel cells and hydrogen technologies in European economies. During the
transition period, the initial investment cost and risks are too great for private companies and
mass-market volumes are too distant, as is return on investment. This means public
intervention is needed to share costs and risks with the private sector and to bridge the gap
to the market. A critical mass of public investment in R&D and infrastructure should help to
create the conditions for the emergence of a competitive consumer market101
;
Mobilisation and pooling of resources and expertise: strong involvement of the EU in
supporting the research in fuel cells and hydrogen helps to mobilise a critical mass of
financial resources and expertise necessary for complex and expensive tasks involved, as well
as to leverage the funds from private and national/regional entities. Moreover, a better
coordination of the European, national and private resources should increase the efficiency
and economic value of the research.
A European public-private partnership – Fuel Cells and Hydrogen Joint Undertaking – was
established in order to address all of the above needs. High-level objectives and targets have
been identified following a thorough assessment performed primarily by working groups
comprising representatives of the Industry and Research Groupings and in consultation with the
Commission (see Table below). The targets represent qualitative and quantitative objectives
against which the progress of the Fuel Cells and Hydrogen Joint Undertaking is to be assessed in
four application areas: transportation and refuelling infrastructure; hydrogen production;
stationary power generation and combined heat and power; early markets. These targets and
indicators summarised below are of different types and concern the price of the fuel cells and
hydrogen technologies (e.g. it is aimed that the hydrogen delivered to retail stations should cost
around 5-9 EUR per kilogram by 2020), quantity (e.g. by 2020 it is expected to have 20 000 fuel
cell cars) and capacity (e.g. the target for distributed production of hydrogen by water
electrolysis for 2015 was 1.5 tonnes per day).
Table 19. List of key indicators related to the area of this European added value case study
Indicator Volume & cost
Application
Area
Market application 2015 mid-term
MAIP targets
2020 long-term
MAWP targets
AA1 –
Transpor-
tation &
Refuelling
Cars: Vehicle
PEM-FC System
>5,000 / <50k€
100€/kW
50,000 /<30k€ for C-segment
50€/kW
Busses: Vehicle
PEM-FC System
500 / <1M€
<3,500€/kW
200 / <650k€
<400€/kW
Hydrogen refueling stations <300 / 0.6 - 2.5 M€ (depending on
size of filling station)
/ 0.8 - 2.1M€ (depending on
size of filling station) no target
for nr of HRSs in MAWP
APU'
s
for truck
applications (5kW)
1,000€ <3000 €/kW for 3 kW
for aircraft
applications (20-
120kW)
flight validation supply <3000 €/kW for 3 kW
101 Pierre-Etienne Franc et al., Fuel Cell and Hydrogen technologies in Europe 2014-2020: Financial and technology outlook on
the European sector ambition 2014- 2020, 2011; Also http://www.fch.europa.eu/page/who-we-are

132
Indicator Volume & cost
for maritime
applications (50-
500 kW)
some tens / 3000-4000 €/kW <3000 €/kW for 3 kW
AA2 –
Production
Hydrogen delivered to retail
station
5 €/kg 5-9 €/kg
Distributed production of
hydrogen by water
electrolysis
1.5 t/d cap. | 68% eff. | 2.8 M€/(t/d) No capacity and no efficiency
targets in MAWP | 2 M€/(t/d)
for electrolysers (irrespective
of whether distributed or
centralised H2 production
Distributed production by
reforming of biogas SMR
(incl. purification)
1.5 t/d cap. | 64% eff. | 3.8 M€/(t/d) No capacity target in MAWP|
70% eff. | 3.1 M€/(t/d)
Total installed production
capacity from renewables
- No target in MAWP
Centralized production of
hydrogen by water
electrolysis
- No target in MAWP
specifically for centralised or
distributed electrolysers
Centralized underground
storage of hydrogen
- No target in MAWP
Target of 0.45 M€/t for gas
storage
Distributed storage of
gaseous hydrogen
5 t cap. | 0.45 M€/t No target in MAWP
Storage of hydrogen in solid
materials
5 t cap. | 1.5 M€/t No target in MAWP
Total installed storage
capacity of H2 produced
from grid
- No target in MAWP
High capacity compressed
H2 trailer
1.3 t cap. | 0,55 M€/t No capacity target in MAWP.
| 0.55 M€/t
AA3 –
Stationary
Micro-CHP (residential),
natural gas based
1,000 units / 10,000 € per system
(1kWe + household heat) Assuming
supported deployment from 2013+
No deployment targets in
MAWP /12000€/kW
Industrial/commercial, H2
based
>5 MW / 3,000 €/kW Assuming
supported deployment from 2013+
No deployment target in
MAWP / 2000-3000 €/kW
without limitation to H2 feed
Industrial/commercial,
natural gas based
>5 MW / 4,000 €/kW Assuming
supported deployment from 2013+
No distinction in MAWP
whether H2 or natural gas
AA4 -
Early
markets
Heavy duty material
handling vehicles
>1,500 units | <1,500€/kW fuel cell
system Anticipating supported
deployment from 2013+
No deployment targets in
MAWP | <1,200€/kW fuel cell
system
Back-up power systems 9.000 units | <1.500€/kW fuel cell
system
No specific targets in MAWP
Small micro fuel cells >30,000 units | <6,000€/kW fuel
cell system
No specific targets in MAWP
Source: Source: PPMI, “Assessment of the Union Added Value and the Economic Impact of the EU Framework
Programmes (FP7, Horizon 2020)”, forthcoming based on Fuel Cells and Hydrogen Joint Undertaking (FCH JU),
Multi - Annual Implementation Plan 2008 – 2013, Adopted by the FCH JU Governing Board on 22nd November
2011; FCH2 JU, Multi-Annual Work Plan 2014 – 2020, Adopted by the FCH2 JU Governing Board on 30th
June
2014.

133
(c) Defining the scope of the European added value case study
With 155 projects and EUR 450 million EC contribution, the largest and the most important
programme supporting research in fuel cells and hydrogen was the FP7 Fuel Cells and Hydrogen
Joint Undertaking. The relevant research, however, was conducted under other FP7 specific
programmes, including FP7-Energy, FP7-NMP and others.
The distribution of FP7 funding for fuel cells and hydrogen research across different
programmes shows the current state-of-play and the general policy objectives in this area.
Around 72% of all FP7 projects in fuel cells and hydrogen and 71% of all funding was
distributed through the Fuel Cells and Hydrogen Joint Undertaking, thereby implying that fuel
cells and hydrogen research in Europe has reached advanced stages and the major efforts are
made to bring the technology closer to the market and translate it into specific products.
Although to a considerably smaller extent, FP7-ENERGY was the second most popular
programme for the fuel cells and hydrogen related research, thereby showing that fuel cells and
hydrogen is one the most promising research area in terms of advancing alternative sources of
energy.
Table 20 Projects related to the area of fuel cells and hydrogen and their allocated EU
contribution
Programme Number of projects EU contribution, EUR million
FP7-ENERGY 20 73.3
FP7-ENVIRONMENT 4 11.8
FP7-NMP 16 58.3
FP7-Infrastructures 1 8
FP7-KBBE 1 4.5
FP7-REGPOT 4 4.9
FP7-REGIONS 1 2.7
FP7-SME 10 13.5
FP7-TRANSPORT 3 7.8
FP7-JTI 155 450
Total 215 634.8
Source: PPMI, “Assessment of the Union Added Value and the Economic Impact of the EU Framework
Programmes (FP7, Horizon 2020)”, forthcoming based on CORDA data
F.4.2. Key findings
(a) Factors/mechanisms of influence fostering European added value
Reduction of commercial and research risks
Interviews confirmed that the sharing of risks was indeed an added value of implementing a
project at the EU level. First, the substantial investments from EC provided the certainty and
trust in the future returns of research, which is crucial to attract investment from private
companies. The interviewees indicated that the “Commission brand” helped private companies
consolidate the funds necessary for project realisation, especially in terms of negotiating and

134
securing bank loans. This was particularly important for SMEs, which have limited resources
and therefore are very sensitive to potential risks. Similarly, a number of beneficiaries confirmed
that by pooling together a number of different organisations FP7 projects helped to share the
potential financial risks related to the withdrawal of one or several partners:
In addition to reducing the financial risks, the quality of the consortia in terms of the
complementary expertise helped to reduce the potential research risks. Certain tasks and
activities were shared among the organisations and researchers who were the best fit for their
implementation. A larger number of partners involved in the project implementation also
allowed to reduce the risks in case some other partners quit or failed to deliver the required
outputs. However, some interviewees noted that the sharing of research and financial risks is a
characteristic of any large project involving a number of different partners and that this is not an
exclusive advantage of European projects alone.
Leverage of private and public investment
Interviews with the participants of the projects and other stakeholders supported the claim that
FP7 funds helped to leverage additional research funding both from private and public
sources. A leverage effect can materialise at two stages: leverage of private and public
investments for the implementation of the specific project and leverage after the project
implementation in attracting funding for further research.
Interview respondents were quite reserved in claiming that the fact that it was an FP7 project
made it more attractive for project partners to invest their own financial resources into the
project. The decision to get involved in the implementation of a EU level project and to invest
their money is much more complex and cannot be explained by one sole reason. However, quite
a few respondents noted that the changed co-financing requirements under Horizon 2020
increased the attractiveness of EU level projects.
However, according to official information, for the closed projects as of 31 December 2015 the
leverage effect of the Fuel Cells and Hydrogen Joint Undertaking was EUR 1.2 /EUR 1, meaning
that each EUR 1 spent by the EC for Fuel Cells and Hydrogen Joint Undertaking research
projects attracted EUR 1.2 into the project from private industries and research partners.102
Moreover, according to the representatives of the Fuel Cells and Hydrogen Joint Undertaking,
before the coordinated European efforts in this field, only Germany was making major
investment in fuel cells and hydrogen research. Although the national/regional funding for fuel
cells and hydrogen research differs across Europe, the trend is that funding for this research area
is quite limited: there are almost no dedicated programmes for fuel cells and hydrogen research
at the national/regional level. Most of the national funding comes from the general R&D
research programmes, but due to the financial crisis these funds were also reduced, especially in
Southern Europe.103
Coordinators and participants of these projects have noticed a positive trend
that after the establishment of the Fuel Cells and Hydrogen Joint Undertaking, a number of other
European countries started to pay more attention to this research area and invest in order to bring
these technologies closer to the market.
Almost all respondents agreed that the EU funding received and the implementation of EU level
projects helped their organisations to stand-out in the national context and therefore to
indirectly attract further funds for their research. The fact that an institution participated in a
102 Report to the European Parliament On The Socio-Economic Impact Of The FCH JU Activities, 21st January 2016. 103 Based on the information provided by the interview respondents

135
European project provides quite a good outreach in terms of image and marketing, which in
return results in better exposure to industry and helps to leverage additional funding.
Participation in EU level projects also allowed SMEs to establish contacts with other big
companies prominent in the field and as a consequence to establish cooperation for continuing
their research and to sign new contracts for their further research.
Pooling resources and building critical mass
Access to large infrastructures is particularly important for the success of fuel cells and hydrogen
research, which requires the use of complex measurement, testing and other tools. The majority
of interviewed project coordinators and participants confirmed that the implementation of their
project at the EU-level helped to access and share one or another type of research
equipment crucial to the project’s success, including large-scale computational equipment,
pressure vessel testing facilities etc. Without the European collaborative projects, especially
smaller countries would not have the opportunity to access and use these infrastructures because
they are not available in their own countries. In some cases only a few countries in Europe have
the equipment for these specific types of computation or testing, and project beneficiaries even
coming from large countries like Germany or Italy would not be able to perform their research
without the access to these infrastructures or the support from institutions who have them.
Even if such infrastructures are available at the national level, the respondents still emphasised
the advantages of being able to choose from the best partners from across the EU with the
highest quality and fit of the infrastructure for the specific project needs. Very often project
partners shared technical tasks within the consortium depending on the relative capacities and
expertise of each partner to implement a specific task. In many cases, EU-level cooperation and
sharing of infrastructure continued even after the end of the project, thereby contributing to the
establishment of long lasting collaborations.
The evidence also confirms that FP7 projects in fuel cells and hydrogen allowed gathering larger
consortia that, as a consequence, had considerable added value in terms of pooling
complementary expertise and skills available in different countries and organisations. One
project, for instance, brought together the leading European research institutes and companies to
use their specific expertise in specific components of fuel cells stack in order to put this expertise
together and come up with a European stack platform, which can address any applications in
cars, busses or residential applications. According to the project coordinator, many of the project
partner organisations were willing to participate only if they were supported by the Fuel Cells
and Hydrogen Joint Undertaking. Otherwise, without the EU-level platform and support, it
would not be possible to realise these kinds of projects in the real world. According to the
representative of the Fuel Cells and Hydrogen Joint Undertaking, almost all of the 200 projects
in this programme have a similar story of the European added value created behind it. Similarly,
in another case, developing a strong expertise in deploying hydrogen refuelling stations in one of
the partner countries (the UK) and project success could have been achieved only by sharing the
expertise with partners from other countries.
A number of interviews with project coordinators confirmed that without the EC financial
support the projects could not be realised either because they required sharing of certain
infrastructures, access to international expertise in fuel cells and hydrogen research or the
funding itself was quite limited at the national/regional level. This was the case even for research
organisations from large countries with a highly developed RTD landscape.

136
Some of the organisations with the necessary skills and expertise could have also been found at
the national level, though, the diversity and motivation of the partners would be considerably
lower.
Similarly, several beneficiaries also confirmed that their projects could have been realised even
without the EU funds, although at a much lower scale and scope. It was estimated that
without the EC contribution and relying only on private industry and national public funds, the
FP7 project HyFIVE would have deployed only around 70 fuel cell cars, instead of the actual
185. Without the EC contribution, the research projects would have also been slower in the sense
that it would have taken more time to implement the project activities. In some other cases
project coordinators also indicated that without the FP7 funds their project would have started at
least 1-2 years later than it actually did. The main reason for this is that the EC funds reduced the
financial and research risks related to the project results: some of the organisations involved
would have waited for a longer period until it was better proven that it is possible to achieve the
research results with the research and technological means available.
Finally, in some projects the European dimension helped some beneficiaries to access the
research data crucial for the project success. For instance, in the project HyFIVE the
participating car manufacturers and fuel cell infrastructure developers acquired from the
partnering research institutes access to crucial research data which revealed the technically
strong and weak sides of their products. As it is very difficult for private companies to
implement their own research data collection, they would not have had the access to these data
without the FP7 funds.
Increased international and/or inter-sectoral mobility of researchers:
Interviews with the coordinators and participants of the projects suggested that
international/cross-sectorial mobility of the researchers and staff was quite limited in FP7 fuel
cells and hydrogen projects. In those cases where mobility actually took place, it was usually
between academia and public research institutions. The involvement of industry partners in the
mobility activities during the implementation of these projects was limited.
Despite the limited mobility in fuel cells and hydrogen projects, beneficiaries noted that in order
to develop the necessary skills and expertise, it is crucial for young researchers working in the
field of fuel cells and hydrogen to be internationally mobile: only by working in an international
environment could they develop a broad perspective in relation to experimenting techniques and
other skills. Mobility was identified as a crucial prerequisite in developing human research
capacities in the fuel cells and hydrogen area because the research facilities in this field are still
scarce and distributed across different European countries: training of top-class researchers able
to work with the newest research equipment thereby requires mobility. Although the evidence of
mobility in fuel cells and hydrogen projects is limited, there were several examples of MSCA
Innovative Training Networks (ITN) projects specifically focusing on training young researchers
working in the area of hydrogen storage: in one of these projects 10 PhDs and in another – 12
PhDs were trained.
(b) Better results achieved because of European added value
Improved research excellence / capabilities
Interviews with project beneficiaries confirmed that FP7 support had considerable added value in
terms of improved excellence and research capabilities in the area of fuel cells and hydrogen

137
research. First, the case study findings indicate that the European scale of research funding
helps to ensure the high quality of research proposals selected. A number of project
coordinators confirmed that the evaluation procedure of FP7 projects (especially those under the
Fuel Cells and Hydrogen Joint Undertaking) are very competitive since the staff involved in the
proposal evaluation have high expertise and experience in this area. In addition, the interviewees
indicated that the FP7/Horizon 2020 project proposals in fuel cells and hydrogen tend to be of
higher quality since they attract the top experts in relevant research areas. This is particularly
important for fuel cells and hydrogen because the pool of top experts and organisations deeply
involved in fuel cells and hydrogen in Europe is not large, and none of the single countries have
enough expertise covering all of the application areas. The representatives of the Fuel Cells and
Hydrogen Joint Undertaking confirmed that overall the proposals quality of the research projects
under the Joint Undertaking is very good and has been steadily increasing over the last years: the
proposal are now much more competitive than they were before. According to one member of
the Fuel Cells and Hydrogen Joint Undertaking, an American expert that they were consulting
recognised that the quality of the EU proposals was much higher than those usually developed in
the USA.
Some project coordinators noted that in comparison to national level projects, the funding
selection procedures in FP7/Horizon 2020 are much more objective, transparent and clear.
In contrast, the criteria under which projects are selected under national funding schemes are not
always as transparent and are often influenced by lobbying. The level of excellence within FP7
fuel cells and hydrogen projects was also increased due to the efficient coordination during the
project implementation: project coordinators from the Fuel Cells and Hydrogen Joint
Undertaking side usually have a high technical knowledge and can even advise and criticise
technical aspects of the research approach. This also facilitates and improves the project’s
reporting phase because the involvement of highly-qualified project coordinators allows to
include more technical details into the report.
Second, a number of FP7 projects focusing on fuel cells and hydrogen research resulted in a
common development of advanced applications and scientific breakthroughs that could
have hardly been realised by a single institution or Member State. For instance, one project
developed a completely new model to measure the heat and mass balances in solid fuel cells,
while taking into account the 3D mechanical design of the system. This model was later shared
among all of the project partners, and the staff was trained on how to use it. According to the
project coordinator, this was made possible only due to the combination of the expertise and
knowledge of different countries and organisations involved. Similarly, in one of the major
projects 54 new generation fuel cell buses were deployed across different European cities. New
generation buses included a number of improvements, including hybridisation of the fuel cell
drivetrain, with the integration of batteries/super capacitors allowing the bus to buffer peak
loads, boost acceleration and allow energy recovery from braking. In addition, the new hybrid
systems allowed smaller and cheaper fuel cell systems, offering extended lifetimes and better
fuel efficiency, leading to the use of fewer storage tanks while maintaining the range.
In other projects, the research led to the improvement of the efficiency of multiple fuel cells
and hydrogen technologies in one country. In one of such instances, meetings between
partners from different countries and organisations allowed British partners to learn and apply in
their national context the superior technologies already developed by partners abroad, as well as
to solve the existing technical problems and shortcomings, including the deployment of
hydrogen stations, fixing problems of the compressor or pump in the refuelling stations and
increasing the accuracy of metering in hydrogen refuelling stations. In some cases the
technological improvements were related to the improvements of user experience in the already

138
developed fuel cells and hydrogen applications: one of the projects, for instance, helped the
German partners to improve the vehicle charging card technology for users, which was more
advanced in partner countries.
Third, although publications in peer-reviewed academic journals are the usual outcomes of
collaborative projects at both national and at the EU level, the evidence shows that the EU-level
research projects resulted in higher quality publications. According to the respondents, good
quality consortia with complementary expertise within FP7 projects led to higher quality
research results, which, in its turn, attracted more interest from the scientific community. This
allowed the project beneficiaries to publish their research results in more prestigious journals
with a higher impact factor. The exception to this general trend was the demonstration and
applied research projects with high technology readiness levels or pre-normative research, as
well as the studies commissioned by the Fuel Cells and Hydrogen Joint Undertaking in which the
academic publications are not very usual due to their specificity.
Table 21. Number of publications and patents produced in Fuel Cells and Hydrogen Joint
Undertaking projects
2013 2014
Number of projects with publications in peer-reviewed journals 9 21
Number of publications in peer-reviewed journals 70 115
Number of projects generating one or more patent applications 4 6
Number of patent applications 12 14
Source: Fuel Cells and Hydrogen Joint Undertaking Annual Activity Report 2014
Fourth, the interview results indicate that the network and communication activities between
researchers and organisations involved in fuel cells and hydrogen projects resulted in significant
learning effects for all sides. This learning experience, increased knowledge and updated skills
mainly resulted from the large scope and interdisciplinary nature of the research activities
undertaken. Beneficiaries from different countries shared their experience, thereby contributing
to the growing understanding and expertise in each of the researchers involved. This was
particularly the case during the early project stages (when, for instance, the partners from
different countries met to discuss the results of the calculations, thermodynamic measurements
and testing), as well as the phase when various prototypes and demonstration modules had to be
assembled and the technologies developed by different partners integrated. A number of
beneficiaries acknowledged that they learnt new competences and skills that were not accessible
in their institution or even country.
Finally, the representatives of the Fuel Cells and Hydrogen Joint Undertaking confirmed that
tremendous progress was made in all of the five Fuel Cells and Hydrogen Joint Undertaking
application areas: whereas some of the long-term indicators for 2020 might not be achieved, it
was estimated that around 90% of the targets will be achieved. Moreover, during the period
between FP7 and Horizon 2020 significant progress has been made in terms of the Technology
Readiness Levels (TRL) in Fuel Cells and Hydrogen Joint Undertaking projects: whereas at the
beginning of the initiative, the first projects mainly focused on fundamental research, by 2014-
2016 the majority of projects supported under the Fuel Cells and Hydrogen Joint Undertaking
corresponded to the proof-of-concept and even higher TRLs.
Economies of scale and scope

139
The main economies of scale and scope in FP7 projects resulted from pooling together the
research infrastructure possessed by project partners. One of the main strengths of the Fuel Cells
and Hydrogen Joint Undertaking was that it gathered into one pool all the major European
industries (more than 100 enterprises as of 2016) and research players (more than 60 institutions)
in this field. All the major European research institutes working in fuel cells and hydrogen
research (ENEA, CEA, SINTEF, JRC and others) are members of the Joint Undertaking and
support the research with opening-up their infrastructures and other facilities. Thanks to the FP7
fuel cells and hydrogen projects, beneficiaries from smaller countries, like Denmark, the
Netherlands or Belgium, had access to large and complex infrastructures that could only be
provided by large research centres. This opportunity helps to save up large amounts of
funding, which would otherwise had to be spent on building similar infrastructures across
different Member States.
Some of the business partners indicated that the EU contribution is the sole means to achieve
the economies of scale necessary for the market introduction of fuel cells and hydrogen
technologies. The main reason for this is that market introduction of fuel cells and hydrogen
products, in addition to technological advance, also and foremost requires the increase in sales
volumes. Currently single hand-crafted models of fuel cells and hydrogen applications have to
compete with the series of traditional products produced at a mass scale. However, in practice it
is possible to compete only if sufficient quantity of applications are produced and sold on the
market. Private industries usually start at very low sales volumes and there is very little chance
that they could alone reach the necessary sales volumes and start competing at price. In order to
speed up the market application of fuel cells and hydrogen technologies, volume effects must be
created in the value chain and the price must be reduced so that the industries could compete
with the traditional systems. Interviews with beneficiaries indicate that the FP7 support already
contributed in this area, though, public funding should be boosted in order to accelerate further
market application of fuel cells and hydrogen technologies in Europe.
The available evidence shows that coordination activities by the Fuel Cells and Hydrogen Joint
Undertaking already contributed to the achievement of the economies of scale in fuel cells and
hydrogen products. Five procurement clusters of bus operators and cities from different
European regions/countries were established under the lead of the Joint Undertaking, in order to
agree on a common bus specification and enable joint procurement of fuel cell buses. By 2016,
all five clusters reached an agreement to procure 600 new fuel-cell buses, thereby creating
economies of scale and reducing the unit price. Successful application for funding has already
been made which will support the deployment of the first 142 buses. It is estimated that this
large-scale joint procurement alone will reduce fuel cell bus capital costs by 25% versus the
current state-of-the-art (i.e. from today’s EUR 850,000 per 12 m bus to below EUR 650,000). It
will also double the size of Europe’s fuel cell bus fleet - from 90 by the end of 2016 to more than
220.104
Wider availability and dissemination of knowledge
The available evidence shows that FP7 projects focusing on fuel cells and hydrogen research
had considerable knowledge dissemination effects through the organisation of and
participation in conferences and workshops, as well as the preparation of reports and
papers. Some larger projects (CHIC, HYTEC and MobyPost) included wider-ranging
104 Element Energy et al.: Strategies for joint procurement of fuel cell buses [July 2016]
http://www.fch.europa.eu/sites/default/files/Strategies%20for%2joint%20procurement%20of%20FC%20buses_0pdf

140
dissemination and awareness-raising activities, such as launch events, test-drive opportunities,
school visits, participation in fairs or local festivals, a shuttle service at public events and
substantial press presence.105
Especially the demonstration projects involved a high scope of
dissemination activities. e.g. during the H2moves Scandinavia project public ride and drive
events of hydrogen vehicles were organised. Similarly, the hydrogen road tour took place in
2012, during which nine different cities in Europe were visited (in the United Kingdom,
Northern Italy, Germany and Denmark). Some of the projects were also tackling broader
audiences in addition to researchers and other stakeholders directly involved in fuel cells and
hydrogen research. For instance during the RELHY project an article was published in a more
general technological-political EU journal called International Innovation, which is accessible to
a wider audience. In some cases, project outputs included studies on the factors determining the
acceptance of the new technology: the CHIC project, for instance, conducted a study on
influencing factors for fuel cell bus acceptance. The study included 185 face-to-face, one-hour
interviews in five European regions.
The representatives of the Fuel Cells and Hydrogen Joint Undertaking maintain a constant
contact with key EU and national policy makers and inform them about the state of play
and future prospects of fuel cells and hydrogen research. The events organised by the Fuel
Cells and Hydrogen Joint Undertaking were a good platform for SMEs to promote and introduce
themselves to the big players prominent in the field. The interviews also show that coordination
activities by the Joint Undertaking also provided synergies between the dissemination activities
under different projects: meetings organised by the Joint Undertaking allowed the project
coordinators to get acquainted with each other’s work and to organise common dissemination
activities such as workshops and conferences. Some of the projects focusing on pre-normative
research disseminated information about the knowledge produced in their work, in order to
change the industrial standards, as this is the only way to bring knowledge closer to the market.
The main instruments used for this purpose were the publications, presentations and workshops
dedicated to key European industrial and research stakeholders in this field.
Even though the EU research funding programmes aim at making knowledge more widely
available, e.g. through open access to publications and data, some of the beneficiaries noticed
that many companies tend to protect the knowledge developed during fuel cells and hydrogen
research and not to share it publicly in order to protect their commercial interests. This trend was
identified as a potential source of tensions between the companies cautious of sharing any
research results with a potential commercial value and academia/public research institutes, which
are strongly interested in producing high-quality publications.
Better coordination of national research policies and practices at the EU level
The European added value in the area of EU-level coordination of fuel cells and hydrogen
research was very clear and specific since more than 70% of the EU funding in this area was
distributed through the Fuel Cells and Hydrogen Joint Undertaking– a large public-private
partnership, which helps to coordinate research in accordance to the interests and needs of
different stakeholders involved. A number of interviews confirmed significant added value of
this coordination at different levels. First, the presence of such a public-private partnership
ensured a strong involvement of industry and its role in leading research activities, which is
crucial to push technologies into the market. This is mainly achieved through the involvement of
both academic and industry partners in drafting common implementation plans and strategies,
105 FCH Joint Undertaking: Programme Review Report 2015.

141
which set the research agenda and priorities while taking into account the industry interests and
needs.
Some beneficiaries, however, noticed that because of the industry’s strong role in the Fuel Cells
and Hydrogen Joint Undertaking, there is too much focus on demonstration projects at the
expense of fundamental research. In the future this might jeopardize the progress in the area of
fuel cells and hydrogen research. According to some opinions, the European research funds
should instead concentrate on fundamental research, since it is more sensitive to sharing of top
expertise and infrastructures, whereas demonstration projects could be supported at national or
even regional level with high support from private industries. Divergent opinions of the
respondents clearly shows the importance (and difficulty) of finding the optimal balance between
supporting low and high technology readiness levels activities.
Second, hydrogen technology has a number of different application areas and makes links to
other technologies (solar, wind energy, transport, medicine etc.). Because there are so many fuel
cells and hydrogen application areas and because they are so interlinked, it was necessary to
establish one formal European-wide coordination platform and strategy, which helps to set
priorities and ensures the pooling and rational distribution of resources for research. A
single European research coordination platform is necessary because an overall success in fuel
cells and hydrogen research can only be achieved if research in different application areas is
implemented simultaneously and is being jointly coordinated. For example, in order to have a
clean hydrogen-based transport system, it is necessary to have clean (CO2 emission-free)
hydrogen production, as well as efficient and safe hydrogen storage and transportation
technology. Similarly, in order to have a system of harvesting the unused electric energy in a
form of hydrogen, it must be possible to apply it in the transport system: the two application
areas are therefore closely interdependent. According to one of the interviewees, the Fuel Cells
and Hydrogen Joint Undertaking provides this European-wide framework for coordination and
priority-setting, which is essential for long-term success in this area.
Every year the Fuel Cells and Hydrogen Joint Undertaking reviews the progress achieved against
target indicators in five different application areas. This helps to maintain progress across all of
the areas, since it helps to trace which areas of research are lagging behind and need further
stimulation. After identifying these areas the Joint Undertaking launches a new call in the
area/topic that needs acceleration. This approach allows efficient distribution of resources and
prevents the duplication of funding for those areas where substantial progress has been
already achieved. However, one respondent stated that the Joint Undertaking should me more
directive in deciding what kind of topics should be financed and better strategic prioritisation
should take place on what research projects should be continued and where the funding flows
should be directed.
Third, some of the FP7 projects had considerable impact on national policy regulations and
even the general outlook of policy makers towards fuel cells and hydrogen technologies. For
instance, the agreement between two project partners in FP7 HyFIVE project (ITM Power and
Shell) influenced the UK’s regulations and facilitated collocating the hydrogen and petrol on the
same refuelling forecourts. The implementation of EU-level projects helped to showcase the
importance of this research area and therefore contributed to allocating higher national/regional
financing. Similarly, some of the private companies indicated that the presence of the Fuel Cells
and Hydrogen Joint Undertaking demonstrates the political support at the highest level, as well
as the need of fuel cells and hydrogen technology for the society at large. This support
encourages businesses to invest in this research area even when the financial returns of this
investment are not immediate and the payback time is quite in the future.

142
(c) Long-term impacts resulting from European added value
Better addressing societal / pan-European challenges
Horizon 2020 addresses major concerns shared by citizens in Europe and elsewhere by tackling
seven main societal challenges.106
All of the interviewees agreed that their research in the area
of fuel cells and hydrogen is particularly relevant and contributing to solving three of these
seven societal challenges:
Secure, clean and efficient energy;
Smart, green and integrated transport;
Climate action, environment, resource efficiency and raw materials.
A number of interviewees confirmed that the EU research funding has already contributed
a lot in solving the above societal challenges, mainly by helping to demonstrate the
applicability of hydrogen as a transport fuel across Europe and building necessary infrastructure
(e.g. hydrogen refuelling stations). One of the largest projects under the FP7 Fuel Cells and
Hydrogen Joint Undertaking, for instance, gathered good practices and demonstrated to other
cities in Europe how effectively the deployment of fuel cell buses can address CO2 emissions
and climate change issues. It was shown that the deployment of 12 meter fuel cell bus using the
hydrogen mix (combination of hydrogen from renewable and conventional sources) reduces the
global warming potential impact by 43% compared with a corresponding state-of-the-art diesel
bus, whereas fuel cell bus using 100% green hydrogen fuel reduces the global warming potential
impact by 85%107
.
Overall, in terms of CO2 emissions, fuel cells are currently the most efficient way of
addressing climate change: studies conducted under the Fuel Cells and Hydrogen Joint
Undertaking estimated that even the natural gas based fuel cell technology can reduce the CO2
emissions by up to 80%. The technology combining fuel cells with hydrogen produces a 0% CO2
emissions. Due to the increased efficiency and reduced consumptions of energy, the introduction
of fuel cells and hydrogen technology could save around EUR 1,000 of energy bills per year for
an average European family. In addition, the shift towards a fuel cells and hydrogen based
energy and transport system would significantly increase Europe’s energetic security and
stability by reducing its dependence on energy imports: hydrogen can be produced locally in a
number of different ways, depending on the original feedstock. For instance, hydrogen can be
produced through electrolysis, which is a completely zero-emission based production method. A
number of interviewees recognized that the future transformation of energy and transport sector
will probably be based on a mix of electricity and hydrogen based applications, rather than
hydrogen alone.
The interviewees also agreed that it is indispensable to implement the shift towards a fuel
cells and hydrogen based energy and transport system at the European, rather than
national or regional levels. Due to their importance, the coordinated and concerted actions at
the EU level are needed in order to avoid any contradictions among the national policies. The
main reason for this is that the EU energy and transport infrastructure is so interlinked that it
106 https://ec.europa.eu/programmes/horizon2020/en/h2020-section/societal-challenges 107 Source: Clean Hydrogen in European Cities (CHIC) 2010-2016 project, Fuel cell electric buses: a proven zero-emission
solution. Key facts, results, recommendations. 2016.

143
would be impossible to have a fuel cells and hydrogen based system in one country and a
completely different system in another.
In addition, because of the natural-geographic factors, every European country has different
advantages and capabilities to produce hydrogen: some countries or regions (for instance,
southern European countries) have the potential to produce hydrogen from solar energy, others
from hydro energy (for instance, Scandinavian countries), whereas others have none of these
natural advantages. As a consequence, in order to achieve a zero-emission based system in
Europe countries have to cooperate and share the resources necessary for the introduction of fuel
cells and hydrogen technologies.
F.4.3. Stories of impact
The FP7 H2SusBuild project (Development of a clean and energy self-sustained building in the
vision of integrating hydrogen economy with renewable energy sources), implemented from
2008 to 2012, aimed at developing a self-sustainable and zero-CO2-emission hybrid energy
system, in which the storage of hydrogen provides the energy supply for heating, cooling and
electricity of buildings in case of energy shortage. The new system allows converting the excess
of renewable energy produced from photovoltaic solar panels and wind power generators into
hydrogen to be used as energy storage medium. The project resulted in the development and
installation of this full-scale system in a medium-sized (525 m2) office building located in
Greece. At the time H2SusBuild project demonstrated the first and the most advanced
technology in this area,.
The FP7 SOFCOM proof-of-concept project (SOFC CCHP with poly-fuel: operation and
maintenance), implemented from 2011 to 2015, was the world’s first demonstration of an
innovative system where fuel cells were used to generate electricity and water that is clean
enough to be drunk by consuming organic waste that is collected from wastewater treatment
plants. Project partners built two demonstrations of biogenous-fed solid oxide fuel cell (SOFC)
systems in order to test the proof of concept. The first was in Turin, Italy and featured a fuel cell
system fed with biogas produced from an industrial water treatment plant. The second system
was based in Helsinki, Finland and comprised a fuel cell stack fed with another type of
renewable fuel – syngas produced from biomass gasification. The system developed for
electricity production from renewable energy sources ensured negative CO2 emissions. This
project is expected to have a positive impact on society and the environment through the
sustainable management of energy and its related effects on the global climate. The follow-up
project (DEMOSOFC), financed under Horizon 2020, started in 2015 and aims at scaling up the
technology. This will result in the installation of a 174 kW electric biogas-fuelled SOFC system
that will also be the biggest size plant in the EU so far.
Even though the functional readiness of the fuel cell technology in automotive application is
very advanced, durability, efficiency, power density and cost of the fuel cell stack need further
advancements and in some cases substantial improvements. The Auto-Stack Core project
(Automotive Fuel Cell Stack Cluster Initiative for Europe II), implemented from 2013 to 2017,
therefore aims to develop the best-of-its-class automotive stack technology with superior power
density and performance. The newly developed stack technology will be beyond of what is
currently known for the global market in respect to power density and volume of the stack. The
project’s current progress shows that the targets will be reached as planned and automotive stack
production in Europe will start from 2018/19.

144
The aim of the HyLIFT-EUROPE project (Large scale demonstration of fuel cell powered
material handling vehicles), implemented from 2013 to 2017, is to demonstrate more than 200
fuel cell materials handling vehicles and associated refuelling infrastructure at 5-20 sites across
Europe, making it one of the first and the largest European demonstrations of hydrogen fuel cell
materials handling vehicles. By 2016, a fleet of 46 vehicles was already in operation in one of
the project partner’s logistics facility in France and contracts for more vehicles were already
signed. In addition, Carrefour Group, the second-largest retailer in the world, plans to purchase
more than 150 fuel cell forklifts, which will be deployed at Carrefour's brand new distribution
centre located in Vendin-lès-Béthune, France. It is expected that the demonstration of the fuel-
cell vehicles at large industrial companies will ensure maximum exposure of the project results,
whereas the project’s best practice guide to be shared with potential future vehicle-users will
help streamlining the procedures for future deployments of fuel cell materials handling vehicles.
Several large-scale FP7 projects included some of the most significant breakthroughs in
developing fuel cells and hydrogen transport infrastructure in Europe. In HyFIVE the
project consortium uniting the researchers and some of the largest car manufacturers in the world
(including Daimler, BMW, HONDA, Hyundai and Toyota) are deploying 185 fuel cell electric
vehicles (FCEVs) and 6 new hydrogen refuelling stations across three geographical clusters in
Europe. Similarly, the FP7 CHIC project deployed a fleet of 54 fuel cell electric buses and 6
hydrogen refuelling stations across 8 European countries. In addition, the project consortium
achieved a number of technical improvements significantly facilitating the commercialization
and wider applications of fuel cells and hydrogen technologies in transport in the future: these
include short refuelling times at hydrogen refuelling stations, high fuel consumption efficiency,
reduction of CO2 by up to 85% and other. It is estimated that these project will significantly
contribute to removing the remaining barriers to wide-scale application of fuel cells and
hydrogen in European transport system, thereby making a major step in cutting greenhouse gas
emissions and increasing the share of renewable energy sources in the Union's energy mix.
F.5. European added value case study 5: Food Waste
F.5.1. Overall context
(a) Definition and expected impact of the area
Food waste is an important ethical, economic and environmental issue. Recent studies show that
between one-third and half of the world’s food production is wasted at different stages of
production and throughout the supply chain, starting at the farm (e.g. vegetables/fruits that do not
meet quality requirements thrown away) and ending at consumer level waste108
. By conservative
estimates, about 1.3 billion tonnes of food produced for human consumption is lost globally
every year. In the EU alone about 88 million tonnes of food are wasted every year, worth an
estimated EUR 143 billion (Stenmarck A. et al, 2016). Surprisingly, developing and developed
countries experience similar levels of food waste – about 40%. The largest food losses in the
developing world occur at the harvesting and processing stages, whereas in the developed world
most of the food is wasted at retail and consumer levels. The European Commission is
committed to preventing and reducing food waste in order to transition towards a resource
efficient and more environmentally friendly Europe.
108Jenny Gustavsson, Christel Cederberg, Ulf Sonesson, Robert van Otterdijk & Alexandre Meybeck (2011). “Global Food
Losses and Food Waste: Extent, Causes and Prevention”, Rome: Food and Agriculture Organisation of the United Nations; Åsa
Stenmarck, Carl Jensen, Tom Quested, Graham Moates (2016). “Estimates of European food waste levels“. FUSIONS EU
project.

145
Food waste causes negative environmental (e.g. energy, climate change, water, availability of
resources), economic (e.g. resource efficiency, price volatility, increasing costs, consumption,
waste management, commodity markets) and social (e.g. health, equality) consequences.
Moreover, a significant amount of food, especially in developed countries, is wasted at the
consumption stage. To tackle these issues and meet the Sustainable Development Goals (SDGs),
the European Commissions has introduced a new Circular Economy Package109
, which
stimulates Europe’s transition towards a circular economy that boosts global competitiveness,
fosters sustainable growth and generates new jobs. Food waste prevention is an integral part of
the package and aims to halve the per capita food waste at the retail and consumer level by 2030,
as well as significantly reduce food losses along the food production and supply chains.
Food waste distribution among different food production and supply stages is presented in the
chart below.
Figure 1 Split of EU-28 food waste in 2012 by sector
Source: Stenmarck A. et al, 2016
Ensuring global food security, good environmental governance and prevention of food losses is
of vital importance. Food waste, in addition to a loss of resources used in production such as
land, water, energy and inputs, produces negative externalities as a result of the production -
such as CO2 emissions - and represent a loss of economic value of the food produced. Thus,
actions geared towards food waste prevention and reduction play a big role in combating hunger
and climate change. Becoming more efficient in food production and more responsible at the
consumption level will have positive economic and environmental impacts.
United Nations (UN) members agreed to frame their agendas and policies following the SDGs,
which aim to end poverty, protect the planet and ensure prosperity for all. Since food waste
reduction is an essential part of the agreement, the UN carried out a study on food waste,
detailing the main causes and proposed prevention mechanisms to combat food loss throughout
the food production and supply chains (Gustavsson J. et al, 2011). The main goal of the EU is to
reduce food waste without compromising food safety (the EU food safety policy – to protect
both human and animal health). Thus, in addition to the UN’s propositions on achieving food
109More on Sustainable Development Goals: https://sustainabledevelopment.un.org/topics. More on the EU Action Plan for the
Circular Economy: http://ec.europa.eu/priorities/jobs-growth-investment/circular-economy/docs/communication-action-plan-for-
circular-economy_en.pdf

146
waste SDG targets, the Commission is in the process of pursuing several actions aimed to reduce
food losses110
:
Elaborate a common EU methodology to measure food waste consistently across the
Member States and stakeholders (unified quantification of food waste levels);
Create a new platform (EU Platform on Food Losses and Food Waste111
) involving
both Member States and actors within the food chain (the goal is to define measures
needed to achieve the food waste SDG, facilitate inter-sector co-operation, and share best
practices and results achieved);
Take measures to clarify EU legislation related to waste, food and feed and facilitate food
donation and the use of former foodstuffs and by-products from the food chain for feed
production, without compromising food and feed safety;
Examine ways to improve the use of date marking by actors in the food chain and its
understanding by consumers, in particular "best before" labelling.
The EU Member States are committed to meeting the SDGs, and if prevention mechanisms are
implemented successfully, expect:
A 50% reduction in the per capita food waste at the retail and consumer level by 2030;
A significant reduction of food losses across entire food production and supply chains.
In order to achieve these targets, all actors in the food chain have to play a role in preventing and
reducing food waste, from those who produce and process foods (farmers, food manufacturers
and processors) to those who make foods available for consumption (hospitality sector, retailers)
and consumers themselves.
(b) Rationale for public intervention: key trends in the area, main challenges and
indicators
As discussed above, food waste has a negative impact on a wide range of issues in particular
ethical, economic and environmental. Food losses occur, to various degrees, at all stages of
production and the supply chain. Studies argue that public intervention is necessary in preventing
and reducing food waste for a number of reasons:
Government agencies and public institutions are better positioned than non-profits to
inform and raise awareness about the benefits of reducing food wastage (saving money
by reducing over-purchasing and disposal costs, positive environmental impacts) via
public education, public campaigns, etc. For example, in 2008, the University of Texas at
Austin initiated a programme to raise awareness among students about food waste that
produced impressive results – a 48% reduction in wasted food112
;
110 More on EU actions against food waste:
http://ec.europa.eu/food/safety/food_waste/eu_actions/index_en.htm 111 http://ec.europa.eu/food/safety/food_waste/eu_actions/eu-platform/index_en.htm 112 EPA (2016). “Reducing Wasted Food & Packaging: a Guide for Food Services and Restaurants”; European Commission,
http://ec.europa.eu/food/safety/food_waste/eu_actions/index_en.htm

147
Investments in infrastructure, transportation, food processing and storage require
enormous resources, and the private sector would not be able to do it alone, especially in
developing countries (Gustavsson J. et al, 2011);
Data collection – the European Union will create a unified methodology and then
Member States will calculate food waste based on the proposed methodology. A common
methodology will allow different countries to better understand levels of food waste, and
therefore, encourage them to take action if necessary (Gustavsson J. et al, 2011;
Stenmarck A. et al, 2016; European Commission’s commitment113
);
Governments can create policies that promote prevention and reduction of food waste,
and punish food waste (e.g. recent French legislation, which forbids food waste for
supermarkets114
).
Therefore, public intervention not only raises public awareness, but makes a difference in food
wastage – through creative legislature that significantly reduces food waste. The main food
recovery strategies food waste projects pursue (from the most environmentally friendly to the
least):
Reduction (seeking supply demand balance, better processing and storage practices,
increasing consumer awareness)
Reuse (feed hungry people, feed animals)
Recycle/Recover (Industrial uses, recover food waste to energy, composting)
Landfill/incineration (Last resort option for food waste management)
(c) Defining the scope of the European added value case study
Food waste is a complex and new area of research, requiring collaboration between top experts,
sharing of infrastructure and heavy investments. A multidisciplinary approach is needed to tackle
the food waste challenge effectively. In the case study, a big fraction of all FP7 projects related
to food waste were analysed. Projects were implemented under different FP7 programmes
including Energy, Environment, KBBE, NMP, Regions, Science in Society, SME and ICT.
Projects analysed represent the diversity and broad scope of topics addressed by the FP7.
Overall, approximately 40 European projects tried to determine or solve problems related to food
wastage. Most of the observed projects associated with food waste either produced new
technologies (e.g. robotic flexible food handling, innovative packaging) or provided services
(databases, policies, various innovative tools). Most projects, 23 in total, were implemented
under the FP7 KBBE programme. The EU contribution for these projects topped EUR 82
million. An additional 17 projects related to food waste were identified in other parts of FP7,
including notably Research for the Benefit of SMEs (7 projects), Environment (3 projects). The
full list of projects that worked on food waste prevention and reduction are presented in the table
below.
113 More information on the EC proposed actions against the food waste:
http://ec.europa.eu/food/safety/food_waste/eu_actions/index_en.htm 114 More information: https://www.theguardian.com/world/2016/feb/04/french-law-forbids-food-waste-by-supermarkets

148
Table 22 Key projects related to the area of Food waste
Programme Number of projects EU contribution, EUR million
FP7 Energy 1 3.48
FP7 Environment 3 9.62
FP7 KBBE 23 82.06
FP7 NMP 1 7.208
FP7 Regions 1 0.88
FP7 Science in Society 1 0.40
FP7 SME 7 8.62
ICT 3 19.27
Total 40 131.53
Source: PPMI, “Assessment of the Union Added Value and the Economic Impact of the EU Framework
Programmes (FP7, Horizon 2020)”, forthcoming , based on CORDA data
F.5.2. Key findings
(a) Factors/mechanisms of influence fostering European added value
Reduction of commercial/research risk
Interviewed coordinators and project members confirmed that European level projects enabled
sharing and reduction of commercial and research risks. Respondents named three main
factors that helped reduce commercial and research risks: (1) substantial financial support
from the European Commission, (2) the Commission’s reputation and the prestige of FP7
projects and (3) the high quality of consortia in terms of expertise and commitment. In the
area of food waste, both reduction of commercial and research risks are important factors in
pursuing EU projects. According to the participants, the effect of added value in this area is
much more expressed and clear in European than in national projects.
Most of the respondents supported a claim that research risks were reduced (for all types of
projects). Significant funding from the European Commission provided recipients with necessary
cash flows and allowed stable implementation of the projects.
In addition, the trust and certainty in the future returns of research that came with the
Commission’s “brand” facilitated access to funds essential for project realisation (for example,
negotiating and securing bank loans). Finally, organisations and researchers shared certain tasks
and activities that were best fit for their implementation, or in some cases, other partner
organisations took over tasks when assigned researchers or organisations failed to successfully
complete them. Similarly, beneficiaries supported the claim that by pooling together a number of
different organisations, FP7 projects helped to share potential financial risks related to the
withdrawal of one or several partners.
The European level intervention reduced commercial risks for projects that produced
technologies and prototypes. Respondents from such projects confirmed that in many cases they
could not attract equivalent funding from private sources to develop prototypes and innovative
technologies.

149
According to the beneficiaries EU projects provided them with additional funding to implement
technologies and worked as a leverage effect to attract funding before and after the
implementation of the project. As a result, participants significantly reduced commercial risks.
Leverage of private and public investment
Interviews with project participants and other stakeholders revealed that FP7 funds helped to
leverage additional research funding from both private and public sources. The vast
majority of respondents agree that the leverage effect from European projects is higher than
from national Programmes. Moreover, with the exception of large European countries, such as
France and Germany, as well as Scandinavian countries, there are almost no equivalent
national/regional programmes in the area of food waste. Given limited national/regional
funding, European funds are essential in supporting food waste research.
It was observed that FP7 funds had two types (before-and-after the project) of leverage
effects, which materialised at different stages of the project. First, the prestige of FP7 funding
allows coordinators to form highly competent and motivated research teams. The international
profile of the consortia and potential European funding attracts industrial partners, both
nationally and internationally, and investments into the project as a result. Second, winning of
grants and the successful implementation of EU projects at the European level not only make
research teams more visible in international arena, but also send positive signals to potential
investors. The European funding aspect and the prestige of winning Framework
Programmes’ grants helped participating institutions to stand-out in the national context and therefore to indirectly attract funds for research. Research teams that participated in
European projects became more visible in the industry, strengthened their image and
demonstrated their portfolios to a wider, international audience. These factors, in particular,
international reputation, image and better exposure to the industry, helped participants to
leverage additional funding. For SMEs, EU-level projects guaranteed contacts (and in some
cases contracts) with other companies, such as innovative SMEs and leading industrial
corporations prominent in the field.
Among above mentioned reasons for increased funding from other sources, participants cited
specific skills and experiences they acquired that helped them attract additional financing for
their projects: management skills, conflict-management (between partners), studying of the new
areas of research via collaboration with the different and complementary partners/experts,
learning the rules and evaluation schemes of EU projects.
According to most of the respondents, participation in a European project increased funding
from national programmes, charities and non-governmental organisations, and the industry, not
only for the particular project, but also for projects that followed. In some cases, project
participants gained significant amounts of additional funding for their current and future
research.
Pooling resources and building critical mass
A key added value for project participants in the area of food waste, according to the project
participants, was the pooling resources and building critical mass. European level projects
opened opportunities for cooperation with international partners that possess necessary
and unique skills and knowledge, data sources, laboratories and other infrastructures.

150
Most of the interviewed project participants supported the claim that the implementation of
their project at the EU-level helped to access and share region-specific knowledge and data,
equipment, testing facilities etc. crucial for the projects’ success. European collaborative
projects were extremely important for participants from smaller countries, who would not have
had opportunities to access and use the knowledge and infrastructures unavailable in their own
countries. European level projects allowed respondents to choose the best, most experienced
partners from across the EU (and beyond) and to access infrastructure and data needed to
successfully implement the project.
Food waste research is a relatively new area with little funding at national level. The current
patterns of multidisciplinary approach in food waste research and the adoption of innovations
from other industries than food require various types of skills, equipment and data sources. Thus,
European level funding, and especially the international aspect that comes with it, becomes
superior to other forms of funding.
Some respondents suggested, that these additional benefits of European projects, networking and
learning from each other in particular, offset the co-funding requirement - which is not required
by national programmes in their countries - and makes EU funding more desirable than funding
from national sources.
Virtually all interviewed coordinators and project participants (with the exception of very few
participants from Germany, France and the United Kingdom who could have implemented the
project at full or nearly full scale and scope) confirmed that without European funding the
projects could not be implemented, either because they required sharing of certain
infrastructures, access to international expertise in food waste research or the funding itself was
quite limited at the national/regional levels. Only a few respondents substantiated that their
projects could have been implemented without EU funds, but at a much lower scale and scope.
International expertise and infrastructure encouraged the sharing of tasks between partners.
Many respondents emphasised that EU-level cooperation and sharing of infrastructure
established strong networks, exposed to new markets and encouraged learning from each other.
These connections continued even after the end of the project, thereby contributing to the
establishment of long lasting partnerships. These partnerships allowed research teams to grow,
ensured effective cooperation and helped attract additional funding from other than European
sources.
Increased international and/or inter-sectoral mobility of researchers
Interviewed coordinators and project participants emphasised several aspects of increased
international and/or inter-sectoral mobility of researchers that bring added value in the area of
food waste research. However, the European aspect is not an exclusive advantage over national
programmes in this case. Although international mobility is higher for European projects, inter-
sectoral cooperation is common among national projects as well.
According to the participants mobility occurred between universities, research institutions,
large corporations and SMEs in some cases. All levels of specialists participated in this
mobility – from PhD students to experts and academia. As some participants from SMEs and big
companies acknowledged, industry partners were less likely to send their staff to other
institutions, because they have assigned tasks and responsibilities beyond the project.

151
For those who participated in international or inter-sectoral mobilities, this was a good learning
experience: gaining knowledge in the field of food waste research, learning new competences
and skills.
Most participants agree that young researchers and PhD students benefited the most from these
exchanges – they developed new crucial research skills, broadened their perspectives by working
in an international environment, defended PhD theses on this topic and some even received job
offers from the institutions with whom they interned.
(b) Better results achieved because of European added value
Improved research capabilities / excellence (also involves access to skills, data, infrastructures
and research capacities)
The European aspect of FP7/Horizon 2020 enabled project participants to build strong
international research teams, attract top experts, innovative SMEs and leading industrial partners.
Interviewed beneficiaries confirmed that European projects brought higher added value in
terms of research excellence and capabilities than projects funded only under national
programmes.
According to a significant share of project participants, there are a number of reasons that make
EU-level programmes stand out in terms of research excellence. The selection mechanism of
Framework Programmes ensures a high quality of research proposals selected. The large scale of
the projects encourages top experts in the field to participate. The international nature of these
projects allows consortia to form the most capable teams with expertise from different countries
and access necessary infrastructure and databases. A large number of interviewed project
participants emphasised efficient coordination and sharing of tasks as an important aspect in
ensuring successful project implementation. All these factors lead to improved research
capabilities and excellence.
In addition, some of the project participants noted that the funding selection procedures in
European Framework Programmes are more objective and transparent compared to national level
programmes. This finding contrasts the often perceived “bureaucracy” of EU research
programmes.
Economies of scale and scope
A number of respondents stressed that EU funding, together with international cooperation
ability to pool resources and increased visibility across Europe, are necessary for the wider
European level adoption of food waste research and technologies. In general, respondents agreed
that European level food waste projects achieve economies of scale and scope much more
often than projects funded under national research programmes.
From the interviews with project participants it appears that economies of scale and scope are
most prevalent in those food waste projects that focus on development of databases,
software tools and methodologies. European aspect allows project participants to bring project
outcomes accessible and applicable across Europe at relatively low cost. In many cases national
level project could not be widely applied due to lack of experts, experience from other countries
and infrastructure.
The main factors that contribute to the effectiveness of EU projects, according to the
participants, are:

152
Outcomes of similar projects at national level can often only be applied at tackling food
waste in the country where research is performed. Slightly larger project budget, access
to top experts and infrastructure make results applicable more widely;
Comparable national projects are implemented slower due to a lack of experts,
infrastructure and funding opportunities;
Limited access to institutes and infrastructure nationally makes national projects less
efficient and more complicated.
Increased access to European infrastructures and top experts as well as guaranteed EU funding
allowed focusing on research activities, saved time and resources. Instead of working at
national level, researchers aimed to make the outputs of the project applicable across
Europe. The European dimension and larger scale reduced unit cost of outputs.
Wider availability and dissemination of knowledge
Virtually all respondents agreed that a larger number of dissemination activities is an
important added value of European projects, which make them superior to national level
programmes. In addition, international recognition and reputation that comes with the EU brand
enable project participants to attract top experts and cooperate with European and international
partners. As a result such projects produce high quality research, publish in top peer-reviewed
journals and attract attention from non-European countries (e.g. the USA). In addition, most of
the interviewed participants viewed positively the Commission’s efforts to promote open access
and data sharing, and believed that it helps to draw attention from academia and the public.
These aspects make the outcomes of European projects more visible internationally compared to
national programmes.
Interviewed coordinators and project participants supported the claim that European projects
lead to and open opportunities for considerable dissemination activities that would not be
available at national level. For project participants, these dissemination activities included
publications in peer-reviewed journals, patents and other protection of intellectual property
rights, tests at laboratory scale and participation in conferences, seminars and workshops. In
general, according to interviewees, FP7 funding had a clear effect on improving access to
research outputs. Project participants support European efforts to promote open access and
stressed the importance of open access to publications and data. According to them, making
knowledge more widely available helps them reach wider audiences and advance research.
However, speaking about the open access as such, some of the respondents were wary of and
pessimistic about the impact it produces – publishing in open access journals, which are often
lower ranked, is costly and not always an effective way of reaching wider audiences.
Better coordination of national research policies and practices:
Most of the researchers separated national and European projects as serving different purposes.
European projects are larger scale projects and usually make bigger impact than national
programmes. Moreover, a large number of European countries do not have national funding
dedicated to food waste research. Interviews revealed that only Germany, France, the
Netherlands and some Scandinavian countries have comparable programmes with sufficient
funding. In other countries food waste research usually fits under broader categories in national
programmes, but competition for grants is very high and the funding is relatively small.

153
According to the participants, in a perfect scenario, both European and national programmes in
food waste research would complement each other. Currently, however, in many European
countries there is a lack of national programmes that could complement EU programmes.
Despite the EU’s efforts many respondents mentioned the still existing research bottlenecks at
national level.
(c) Long-term impacts resulting from European added value
Addressing societal/ pan-European challenges
Researchers believe that European collaborative projects address food waste research,
specifically food waste reduction, prevention and valorisation, make bigger impact at a shorter
time period than national projects. Pan-European projects have bigger impacts, because these
projects are more visible across Europe, enable collaboration with top experts and allow
consortia share region-specific knowledge and data, equipment and testing facilities.
However, participants agree that national level projects complement European projects.
It is difficult to distinguish the main trends of food waste projects, since they cover a wide
range of topics and aim to solve various problems related to food waste reduction,
prevention and valorisation. Analysed food waste projects built tools (software, apps, and
databases) that promote healthier lifestyle, sustainable food consumption, encourage food waste
reduction and promote waste valorisation. Also, EU-level projects developed technologies that
reduce food waste at both food processing and consumer levels. In addition, food waste projects
proposed new policies and directives to policymakers that could help prevent or significantly
reduce food wastage. Overall, there is a wide pallet of issues these projects dealt with at different
stages of production and throughout the supply chain.
From the interviews with project respondents, two main advantages of EU-level projects
compared to national programmes emerged. First, European projects save time, especially
when commercialising the products, according to most of the participants. Respondents estimate
that European level allows project outcomes to reach the market 3-5 years and in some cases up
to 10 years faster than national projects. Second, European projects in the area of Food Waste
reach much larger population than national projects. According to the respondents, EU-level
brings a connection to the European market, and as a result, such projects make an impact on
several hundreds of thousands of people at European level. According to the participants, some
of the European projects have a potential to reach up to 100 million people (e.g. the NanoBarrier
project) across Europe. Under the national programme such level of impact would not have been
possible. EU-level project outputs reach the market quicker and have a positive impact on a
larger customer base compare to national projects.
Virtually all interviewed participants agreed that their research in the area of food waste
achieved broader impact with European level projects than they would have achieved at
national level programme. All food waste projects tackle the following societal challenge
directly: ‘Food security, sustainable agriculture and forestry, marine and maritime and inland
water research, and the Bioeconomy’. A large portion of European projects related to Food
waste, although indirectly, also contribute to solving challenges, such as:
Health, demographic change and wellbeing (e.g. the ECsafeSEAFOOD project, which
helps consumers detect contaminants in seafood and get dietary recommendations,
whereas for processing facilities and aquaculture proposes innovative solutions how to
reduce contaminants and toxins in the environment and in seafood);

154
Secure, clean and efficient energy (e.g. the Muse-tech project introduced innovative
energy-efficient sensors that could be used in food production and the FRISBEE that
provided new refrigeration tools and concepts for energy optimisation along the cold
chain in Europe);
Climate action, environment, resource efficiency and raw materials (e.g. the PicknPack,
NOSHAN and Susfood projects that aimed to ensure efficient food processing, packaging
processes and introduce innovative solutions to re-use the food waste; The Veg-I-Trade
project sought to assess the impact of anticipated climate change and globalisation on the
safety issues concerning fresh produce and derived food products).
Most of the participants agreed that European research on food waste is on the right track. The
EC funding is sufficient, and these EU-level programmes connect top experts in their fields
all across Europe. Together they make break-through discoveries. Although respondents
emphasize the effectiveness of European projects, they realise the importance of national
programmes too. However, they are not equipped to produce as significant impacts especially in
the technological food waste projects that require heavy investments, top experts (usually
available in different countries), infrastructure and leverage to attract additional private sources
of funding (the prestige of European level project increases visibility and reputation, and trust
from potential private investors as a result). France, Germany and Scandinavian Countries are
few exceptions that have strong national programmes in the areas of food security and food
waste. For other participants, European projects allow producing high quality research, an
opportunity they would not be able to realize at national level.
To tackle societal challenges European leadership is necessary. When large investments are
needed but the industry is not getting involved because of the risks involved, European
programmes can play a significant role. EU funding allows science to produce high quality
research, attract top experts, encourage sharing of infrastructure and as a result help
tackling societal challenges. Key sources of European added value are the leverage effect of EU
projects that helped attract additional funding from other public and private sources, as well as
the international aspect – project participants reached wider audiences, i.e. European scientific
community and European consumer base. National programmes are not enough, although they
are important in complementing EU research. Compared to other continents Europe is
leading in the food waste research.
F.5.3. Stories of impact
Several areas and projects were identified that are examples of successful initiatives of FP7
funding in the area of food waste. These successful projects tackle the food waste challenge at
three levels: reduction, prevention and valorisation. The majority of projects focused on building
new software tools, databases, methodologies and technologies as well as proposed new policies
and directives. Projects covered various stages of the food industry value chain. The results of
these initiatives are expected to contribute to reducing food losses across the entire food
production and supply chains, re-using existing food waste (e.g. feed production) and achieving
the European Commission targets to reduce per capita food waste by 50% at the retail and
consumer level by 2030.
One category of projects – databases and software tools – aimed at raising awareness of food
waste issue, developing tools that improve health of consumers and increase effectiveness of
food processing, optimizing food distribution, and pushing for new policies regarding food waste
among other impacts. Notable examples of such projects are ECsafeSEAFOOD, Hightech

155
Europe, FoodIntegrity and FOODMETRES. One key project ECsafeSEAFOOD assessed food
safety issues related to contaminants present in seafood and evaluated their impact on public
health. Based on their findings project members developed an online tool for different
stakeholders and guidelines, a result of which, consumers can assess nutrition and contaminants
of their seafood consumption as well as get dietary recommendations. By using project outcomes
food processing facilities will be able to ensure the quality of food, measure contaminants and
process the food more effectively, and as a result, reduce food waste. One small part of the
project is expected to have a significant impact on the public health and food waste. Although
the success of the ECsafeSeafood project depends on the capacity of private businesses to
integrate the outcomes of the project in their daily activities, project participants estimate that
several hundreds of thousands of people at European level will benefit from the results of this
project.
Technological food waste projects increased effectiveness in food processing and production,
reduced energy use, and introduced sustainable eco-friendly solutions to packaging. One of the
success stories in this category, the NanoBarrier project searched for innovative and safe
multifunctional packaging solutions. The project developed a renewable sustainable
nanotechnology-based platform. The characteristics of packaging developed throughout the
project include better oxygen barrier and sensor features (PH, temperature), which not only
increase the shelf life of the product, but also allow real-time monitoring of food freshness and
quality (any changes in the quality are detected by sensors). The nanosensors make it possible to
provide information of the condition of food, packaging and environment (e.g. freshness,
whether packaging is damaged or product is kept in required conditions). According to the
interviewed members of the project, the application of intelligent packaging solutions is an
emerging market that will see an accelerated growth in the coming years. Since project
participants estimate a potential reach of 100 million consumers across Europe, the project
outcomes are very likely to significantly reduce food waste.
The food industry lags behind other industries in terms of automation and use of technologies in
food production. One of the success stories in this area, PicknPack, a technological food waste
project aimed to revolutionise food production and packaging processes. The concept developed
throughout the project offers a flexible solution for food industry that helps cope with variability
of food products (types and sizes of products). The project achieved progress in three areas of
food production: food quality inspection (a sensing module assesses the quality of products
before and after the packaging), food handling (a robotic solution separates the product from a
harvest bin/transport system and places it in the right position in a package) and adaptive
packaging (accommodates various types of packaging with flexibility in terms of package shape,
size, product environment, sealing and printing). According to the participants of the project,
intelligent solutions developed throughout the project will lead to maximum performance in
quality, reducing change over time, reducing time for reprogramming, adaption to operators,
reducing waste of food and packaging material and stock. Moreover, flexible food picking,
processing and packaging, allow early and self-learning quality assessment of food and more
accurate prediction of the shelf life. The project was technologically challenging, but according
to the participants the process was rewarding – some of the project outcomes are already
commercialised. Project outcomes provide the industry with the benefits of automation:
reduction in costs, greater hygiene and more efficient use of resources.
Another project that aimed to modernise the food industry, the Hightech Europe project, is a
network of excellence. The project focused on the introduction of already existing modern
technologies to the food industry and making the industry more efficient by connecting relevant
companies from all over Europe. With the help of this tool, European companies shared their

156
knowledge with each other and as a result adopted new technologies. For example, the food
industry in Spain has adopted technological solutions for food handling using experience from
other industries than food. After a publication in the project‘s website, these solutions were
adopted by food companies from other European countries (Scandinavia in particular). As a
result, more efficient food handling allowed European countries to reduce food waste in the food
processing stage. Project participants believe that the Hightech Europe project will help the
European food industry to embrace new technologies from other industries towards more
efficient use of resources and reduced food waste.
Projects concerned about food waste valorisation, for example the NOSHAN project,
investigated the processes and technologies that could be used to convert food waste to feed
production. The low energy consumption and positive environmental impact are features that
make the NOSHAN project stand out. In addition, project participants made knowledge available
through open access to the wider audience. By processing the food waste and converting it into
animal feed, the project not only tackled the societal challenge of food security, but also other
challenges, such as climate action, environment, resource efficiency and raw materials.
Other successful food waste projects, such as FoodIntegrity were concerned about the EU brand
and food quality. Modeextreme, aimed to improve yield monitoring and forecasting systems, and
as a result to help European Agriculture to face extreme weather events by simulations and
analysis of plant responses to weather extremes (heat waves, cold shocks, droughts, frost). The
project also developed softwares that could be used by the general public. The Food Metres
project aimed to improve the sustainability of the urban food production chain. The project‘s
goal was circular economy. It assessed the demand and supply of different types of food, which
is expected to lead to better strategic planning by local governments and businesses, and as a
result to reduction in food wastage and increased food security. These projects although very
different in nature all helped to reduce food waste at different food supply and production stages.
F.6. European added value case study 6: Climate Change evidence
F.6.1. Overall context
(a) Definition and expected impact of the area
Small changes in the average temperature of the planet can translate to large and potentially
dangerous shifts in climate and weather. Land and ocean surface data shows a warming of 0,85
°C over the period 1880 to 2012115
(for more indicators see table 32 below). Rising global
temperatures have been accompanied by changes in weather and climate. Many places have seen
changes in rainfall, resulting in more floods, droughts, or intense rain, as well as more frequent
and severe heat waves. The planet's oceans and glaciers have also experienced some big changes
– oceans are warming and becoming more acidic, ice caps are melting, and sea levels are rising.
As these and other changes become more pronounced in the coming decades, they will likely
present challenges to the environment and society.
Therefore, climate change is a global problem to be addressed by combining global efforts. This
case study concerns less environment policy and climate change in general, but more a specific
part which relates to providing scientific evidence/data/knowledge for policymakers and
115 IPCC Climate change 2014 synthesis report, p. 8;

157
society on environmental and climate change issues. The case study deals with this type of
projects financed under European Union FP7 programmes and, largely, with FP7 Environment.
Many adaptation and mitigation options can help address climate change, but no single option is
sufficient by itself. Effective implementation depends on policies and cooperation at all scales
and can be enhanced through integrated responses that link mitigation and adaptation with other
societal objectives. Adaptation and mitigation responses are underpinned by common enabling
factors. These include effective institutions and governance, innovation and investments and
environmentally sound technologies and infrastructure, sustainable livelihoods and behavioural
and lifestyle choices116
.
The ex-post evaluation of FP7 Environment documented the European added value of
environmental research projects from different perspectives including capacity building and
development of a critical mass, as well as harmonising databases, procedures, measurements,
models, etc. However, it was noted that the added value of a project heavily depended on the
uptake of research results, including the adoption of harmonised measurement procedures or
tools, or the integration of recommendations into relevant policies.
Some intervention areas of FP7-Environment are exemplary of European added value, because
research is to be coordinated at European and/or international level. This is clearly the case of
Earth Observation. The FP7- Environment programme played an active role in implementing the
Global Earth Observation System of Systems (GEOSS) while the European Commission is
one of the four co-chairs of the Group on Earth Observation (GEO). GEO is an
intergovernmental organisation of 89 governments and around 80 international organisations,
which develop together projects and coordinate their strategies on earth observation. GEOSS is
critical to tackle global challenges such as a climate change, energy and food security, or health.
FP7-Environment also played a key role in the development and aggregation of climate change
models, with a strong impact at the International Panel on Climate Change (IPCC). FP7-
Environment was unique because of its coordination role. FP7-Environment allowed an
international co-development of climate change models, creating a process of mutual learning
and an efficient knowledge creation. With its funding activities in the field, the Commission
contributed to the creation of international standards that avoid fragmentation of research
and funding. Something similar happened in other areas, like greenhouse gases (GHG)
measurement or carbon in the sea, where the EU is leader thanks to its coordination and
standardisation role.
Interest of the EU and society, with a view to preserving and improving human life and lifestyle,
were addressed through the design of strategically oriented research programmes in the different
fields within the theme. The FP7-Environment work programme was specifically designed to
support the refinement of the EU’s environmental policies, thus further contributing to the
development of said policies in a research-informed manner. The FP7-Environment calls for
proposals were also designed to provide impetus to enhance the coordination of European
research efforts, both trans-boundary and trans-disciplinary.
116 IPCC Climate change 2014 synthesis report, p. 62;

158
The majority of projects funded via FP7-Environment were collaborative research projects
involving large consortia (some over 30 partners) and large-scale EU funding investment
(several over EUR 10 million)117
. Areas of action of FP7-Enviroment include118
:
Climate change, pollution and risks;
Sustainable management of resources;
Environmental technologies;
Earth observation and assessment tools for sustainable development.
The Council Decision 2006/971/EC119
underlined the European added-value of cooperation in
the field of environment research, and defined the main orientations or functions of future
actions as:
Coordination and integration of research outputs: developing common methodologies,
databases, large-scale observations and forecasting systems;
Policy support to the EU and Member states;
Contribution to global and EU commitments;
Technology development: supporting innovative environmental technologies for a more
sustainable use of resources, contributing to the improvement of the competitive position
of European enterprises.
From the review of 90 projects in the framework of the FP7 Environment ex-post evaluation, it
was evident that activities funded through FP7-Environment contributed strongly to addressing
increasingly global-scale environmental challenges, supporting the improvement of the policy
making process through the provision and improvement of scientific evidence for policy
assessment. Examples of such contribution include120
:
Strong contribution to the EU’s Climate Action and Renewable Energy Package, the
Floods Directive, the Droughts and Water Scarcity Communication, the Communication
and Action Plan on Disaster Prevention and Early Warning, the Environmental and
Health Action Plan, the Environmental Technologies Action Plan, etc.
Strong contribution to international initiatives, including International Panel on Climate
Change (IPCC), Global Earth Observation System of Systems (GEOSS), the Biological
Diversity Convention (BDC).
The relevant programmes may not be directly linked with the decision-making as their main
policy role was more in creating knowledge that would subsequently be used through
intermediaries, such as the Joint Research Centre, the European Environment Agency, think-
117 Ibidem, p. 18; 118 FP7 Cooperation Work Programme 2010: Environment (including climate change), p. 2; 119 Council Decision 2006/971/EC of 2006 concerning the specific programme ‘Cooperation‘ implementing the FP7 of the
European Community for research, technological development and demonstration activities; 120 Ex-post evaluation of FP-7 Cooperation Programme Theme: Environment (including Climate Change), p. 57;

159
tanks and consultancies. However, some major provision and improvement of scientific evidence
for policy making could be observed.
Table 23. Key indicators related to the area of this European added value case study
Indicator Indicator values/examples
Atmosphere and ocean
warming
Land and ocean surface data shows a warming of 0,85 °C over the period
1880 to 2012121
;
Ice mass loss The annual mean Arctic sea ice decreased over the period 1979 to 2012.
The rate of decrease was very likely in the range 3.5 to 4.1 percent per
decade122
.
Sea level rise Over the period 1901-2010 global mean sea level rose by 0.19 m123
;
Natural and anthropogenic
radiative forcing
Concentrations of carbon dioxide, methane and nitrous oxide have all
shown large increases since 1750 (40%, 150%and 20% respectively)124
.
Source: PPMI, “Assessment of the Union Added Value and the Economic Impact of the EU Framework
Programmes (FP7, Horizon 2020)”, forthcoming , based on IPCC Climate change 2014 synthesis report
(b) Defining the scope of the European added value case study
The majority of climate change projects were funded under FP7-Environment. However, a
considerable part was also funded by other FP7 programmes, such as FP7-Infrastructures, FP7-
ICT and FP7-Social Sciences and Humanities.
According to the Work Programme on Environment 2010125
, in FP7 Environment the emphasis
was put on the prediction of climate, ecological, earth and ocean system changes, on tools and
technologies for monitoring, prevention and mitigation of environmental pressures and risks.
Examples of FP7-Environment projects related to the area of climate change are I-REDD,
EUROCHAR and GEOWOW126
. FP7 Environment was primarily designed to support and
coordinate cooperation in environmental and climate change research. Innovation and
technological development was a secondary objective of FP7-Environment, until the global
economic crisis127
. The re-orientation of research towards innovation and impact became a major
tool in addressing the financial crisis and tackle societal challenges. Thus, the global economic
crisis of 2007 required that the FP7 focus adapted and evolved within a changing global context.
FP7 Infrastructures refer to facilities, resources and related services used by the scientific
community to conduct top-level research in their respective fields. Examples of FP7
Infrastructures projects related to the area of climate change are ICOS, IAGOS-ERI and
INCREASE.
Within FP7 ICT the research funding is focused on seven key research challenges to ensure
Europe becomes a world leader in ICT. Three challenges aim at industrial leadership in key ICT
sectors, while four are driven by socio-economic targets. Examples of FP7 ICT projects related
to the area of climate change are AEOLUS, E-AGRI and TELEIOS.
121 IPCC Climate change 2014 synthesis report, p. 8; 122 Ibidem, page 10; 123 Ibidem; 124 Ibidem, page 12; 125 Work Programme 2010 on Environment (including climate change), 2009; 126 Please find examples of climate change projects in www.cordis.europa.eu; 127 Ex-post evaluation of FP-7 Cooperation Programme Theme: Environment, p. 3;

160
FP7 Social Sciences and Humanities contribute to an in-depth, shared understanding of the
complex and interrelated socio-economic challenges facing Europe and the rest of the world.
Examples of FP7 Social Sciences and Humanities projects related to the area of climate change
are CREATING and TRANSIT.
Table 24 Key projects related to the area of Climate change
Programme Number of projects EU contribution, EUR million
FP7 Environment 60 259
FP7 Infrastructures 30 145
FP7 ICT 27 21
FP7 Social Sciences and Humanities 10 75
Total 127 500
Source: PPMI, “Assessment of the Union Added Value and the Economic Impact of the EU Framework
Programmes (FP7, Horizon 2020)”, forthcoming based on CORDA data
F.6.2. Key findings
Thirty interviews with coordinators of different climate change projects have been carried out
(including FP7 Environment, FP7 Infrastructures, FP7 ICT and FP7 Social Sciences and
Humanities) in the framework of this case study. The key findings from these interviews are are
structured according to different categories of European Added Value. All interviews were semi-
structured and performed by telephone.
(a) Factors/mechanisms of influence fostering European added value
Reduction of commercial and research risks
As climate change research projects usually have a considerable number of partners, they
allowed sharing of project risks among them. In case one partner was unavailable, another one
could undertake its tasks to achieve the planned result of a project. Moreover, the large budgets
of projects allow shifting resources among activities and adapting to new circumstances and thus
addressing unanticipated risks.
In a considerable number of climate change projects, SMEs and other private companies were
engaged to carry on certain tasks, like maintenance of equipment, delivery of software,
supercomputing services, etc. However, because the climate change projects usually had many
partners and considerable budgets, researchers belonging to large networks and having long
track records of relevant research were better placed to enter such projects. Smaller
research teams and young researchers experienced certain difficulties to be invited to participate
in such projects.
Leverage of private and public investment
EU funds helped to attract additional funds (national/ regional/ from other EU funding
bodies/ private funding) to the same research area or other stages of the same research.
This was confirmed by almost all interview respondents. Moreover, interviewees indicated that
the amount of resources they received from the Framework Programme would be hardly possible
to assemble through national and/or regional financing.

161
In some instances the EU funding covered only a certain part of research costs; the remaining
part was covered by national governments (i.e. in the DACCIWA project the national
governments of France, Germany and the UK made available their research aircraft for data
collection on climate change in West Africa). One more example is the PREFACE project that
utilised the ship time of German, French, and Norwegian vessels.
Moreover, in some of the projects national financing made up quite a considerable share. For
example, in the ICOS project the Framework Programme funded only the preparatory phase of
the project. Thus, the running of operational systems, the acquisition of equipment (such as
atmospheric stations, ecosystems stations, or ships that continuously measure the transfer of
greenhouse gases in the surface of earth and in the atmosphere) were financed by national
governments.
A successful commercial application in the private sector usually helps to attract private
funding to a particular research area. Moreover, in some instances private companies showed
interest in climate change research because they wanted to know their own impact on climate
change and be more socially responsible (i.e. different aircraft companies in the IAGOS-ERI).
As research projects financed by the Framework Programme usually last a couple of years, a
successful project often helps to secure a follow-up project. The majority of project coordinators
mentioned that they have successfully applied or intended to apply for a follow-up within
Horizon 2020 and other sources of EU financing.
Pooling resources and building critical mass
EU funds made it possible to acquire research equipment (in some instances
sophisticated/expensive equipment) that could be shared by project partners and even by
researchers outside the project. This was also supported by the majority of the interviewees.
For example in the MESOAQUA project the equipment was unique in the world and can be run
in the open ocean. Other countries (Japan, the USA) have tried to design similar equipment, but
they failed. Researchers from all over the world could come and work with this equipment. To
analyse the results of the data obtained, the best groups of scientists in the world were invited.
In some projects supercomputing, sophisticated sensors or similar equipment were used (i.e.
in the IS-ENES). In some instances (for example in the SEMANCO project) the equipment and
different software products used by the researchers were developed by private companies. The
software license was usually paid for with the project’s funding.
In some instances the research equipment used in the projects created the possibility to take
samples inside and outside the EU was essential for the success of a project. The climate
change research area is rather unique in the sense that it is often very important to take regular
samples across many countries (in different meteorological and climatic regions) in order to
produce reliable climate models and to predict future climate change. For example, the IAGOS-
ERI project achieved that the necessary equipment was placed on airplanes for conducting
atmospheric observations on a global scale. The JERICO project offered a pan-European
approach for European coastal marine observatory network. The PREFACE project has helped to
extend and maintain the ocean observing system in the Tropical Atlantic.
In a majority of climate change projects large sets of data were produced, which were shared
not only by project partners, but also for a wider scientific community and even the general
public. Moreover, in some instances sophisticated ICT tools were used. For example, the main

162
purpose of the SEMANCO project was to develop an ICT platform to support the decision
making of different stakeholders, who are involved in energy related urban planning, particularly
in urban areas.
Increased international mobility of researchers
EU funds contributed to the enhancement of researchers’ skills through international/cross-
sectorial mobility, networking activities, workshops and other similar events. This was
confirmed by almost all interview respondents. Networking activities, workshops and other
similar events organised by different projects were very important in enhancing capacities of
researchers and in exchanging their knowledge.
As research projects usually had a considerable number of partners, quite many mobility
instances could be observed among them. However, a considerable share of projects attracted
researchers outside of the project. It was quite a usual case in many projects for a PhD or
postdoctoral student outside of the project to use the project infrastructure to collect data for
his/her dissertation or other research activity. Moreover, a considerable share of mobility took
place for taking different samples in different EU and non-EU countries. In some cases, it was
necessary to take samples in as many countries as possible to build reliable climate models.
(b) Better results achieved because of European added value
Improved research excellence/capabilities
EU funded climate change research allowed the EU to be at the forefront of this research
area and/or ahead of other countries. This statement was supported by the majority of
interviewees. The EU was well placed to reach scientific excellence in this research area, as
efforts of different EU Member States could be pooled. This has been a significant value added
of the climate change projects and allowed joining forces and even being ahead of such countries
as the USA, China, Canada and others.
Moreover, in many instances EU funded climate change projects were carried out outside
the EU: in different African countries (i.e. building research capacity of local researchers in the
CREATING), Southeast Asia (i.e. fighting deforestation in the I-REDD) or Middle East (i.e.
building climate data depository in the DARECLIMED), as climate change is a global challenge
where global efforts are necessary. Frequently the countries being the most affected by climate
change are the least well placed to understand the issues. Therefore, they need help to develop
appropriate adaptation plans and to implement them. Some of the projects were only partially
related to climate change. For example, the SEMANCO project developed an innovative
platform to assess energy performance in buildings of urban areas, the TRANSIT project focused
on social innovations.
Climate change science is usually basic research and it is quite difficult to use its findings
for commercial application. Nevertheless, in some instances such applications were discovered
(i.e. in agricultural or tourism sectors). For example, the ACTRIS project had strong
collaboration with the private sector, in particular with SMEs. The cooperation took place
because the project participants had to offer expertise that the private sector needed. This
cooperation evolved into developing prototypes together. Private companies also came to the
project sites to test their instruments. In some cases they produced a prototype and the project
tested it.

163
EU funded climate change science projects produced a considerable number of publications,
which might be openly accessed by the public/other researchers. Climate change projects
usually produced publications not only in prominent scientific journals, but different kinds of
reports and newsletters for wider public were also delivered. Different conferences, symposiums
and seminars were also organised for dissemination of project findings and results. Interaction
with policy bodies and ministries outside the EU is also a very important means of dissemination
(i.e. PREFACE interacted with the Ministry for Fisheries in several African countries and
communicated with sub regional fishery commissions).
The EU funding facilitated engaging in interdisciplinary research in the area of climate
change, which enabled comparing different approaches. For example, in the I-REDD project
geographers, biologists, economists received a possibility of working together to find necessary
solutions. With national funding, it would not have been possible to have a project of this scale.
Economies of scale and scope
The majority of EU funded climate change science projects were large-scale projects with a
considerable number of partners and work packages. As the deliverables of such projects were
quite many and diverse, this could entail some economies of scope.
Economies of scale are not very much relevant to the research area of climate change.
However, in a considerable share of climate change projects a large number of samples were
taken in different EU and non-EU countries, which allowed researchers to improve their skills
and to do the job better after a certain amount of samples. For example, in the ACTRIS project it
was important to have the equipment located in different meteorological and climatic regions and
researchers moved from one location to the other and studied different processes that are related
to different climatic areas.
Moreover, advanced equipment purchased in a considerable number of projects, allowed the
sample collection job to be easier and cheaper to handle. For example, in the ACTRIS and
MESOAQUA projects some of the research stations or experimental installations were equipped
with very advanced instrumentation.
Wider availability and dissemination of knowledge
In a majority of climate change projects large sets of data were produced, which were usually
made available not only for project partners, but also for a wider scientific community. For
example, in the case of the ACTRIS some private services were based on its data. The data could
be used for agriculture, tourism and other applications with economic impact. For example,
during the volcano eruption in Iceland in 2010, the aircraft industry was interested in receiving
information about real level of risk for flying in specific areas. According to the International Air
Transport Association, the total loss for the airline industry was around EUR 1.3 billion due to
the volcano eruption. The atmospheric data helped to somehow alleviate this loss. In many cases
special portals were created for the data. Alternatively, the data was placed in already existing
data portals.
Better coordination of national research policies and practices at the EU level
Climate change research usually needs to be carried out in different EU and even non-EU
countries (i.e. for atmosphere/sea/ocean data collection in different countries). Therefore, efforts
of different countries may be easily combined and national research policies coordinated.

164
In this regard the EU has an advantage against other large economies (i.e. USA and Canada),
which enables pooling its resources to solve pan-European challenges.
In many instances the EU funded research in the area of climate change started/initiated research
and then national/regional authorities decided to get involved, thus contributing to the
achievement of the projects’ objectives of fighting climate change.
A few interviewees indicated that much more coordination is necessary between European
and national funding in terms of different evaluations, methodologies, etc. in order to avoid
unnecessary overlaps and duplications. This would allow a more efficient use of project
resources. In some instances, access to different research infrastructures should be more
coordinated as well to achieve a better use.
(c) Long-term impacts resulting from European added value
Better addressing societal pan-European challenges
One of the strengths of EU funding lies in the possibility to join efforts of different EU
Member States to tackle wider societal challenges, such as climate change; secure, clean and
efficient energy; smart green and integrated transport; food security. For example, the ACTRIS
data can be used for improvement of weather forecasts and serve as solid input data for future
climate scenarios. This allows also dealing with natural and anthropogenic disasters like
eruptions of volcanos, forest fires, and nuclear accidents. Climate modelling is very important in
this regard, as it is essential to understand how the climate will evolve and to be prepared for
extreme events and to mitigate them.
When available data or models do not permit forecasting effects of climate shift on ecosystems,
full ecosystem-scale empirical studies, such as done in the MESOAQUA, delivered critical data
from many sites from the Mediterranean to the Arctic. Data from the MESOAQUA thus
significantly contributed to increase our present understanding of future risks. It is critical to
conduct such investigations over a wide and representative range of climate zones, and over
extended time to gain adequate understanding of these complex systems. Thus, such coordinated
transnational studies are only possible through strong international funding schemes, such as
from the Framework Programmes.
As addressing wider societal challenges does not pay off immediately and requires
continuous efforts, it is quite difficult to gather necessary resources to tackle them. Moreover,
certain climate change projects undertake such tasks as fighting climate change in West Africa
(such as the DACCIWA and PREFACE projects), which are expensive to be undertaken by a
Member State alone. In this regard the Framework Programmes are well placed to deal with pan-
European challenges.
In some instances FP7 climate change projects contributed to the development and
implementation of EC directives and action plans in the area of climate change. For
example, the HYDROLAB project strongly supported the development and implementation of
the European Floods Directive firstly adopted in 2007. The European Floods Directive stipulated
how to act facing the danger of flooding in different EU Member States. Another similar
example is the SEMANCO project, which contributed to the implementation of the Energy
Performance Directive.

165
F.6.3. Stories of impact
Climate change research played an active role in implementing the Global Earth Observation
System of Systems (GEOSS). The EOS conducted long-term global observations of the land
surface, biosphere, atmosphere and oceans of the Earth, by producing large quantities of
data, which is critical to tackle global challenges such as a climate change, energy and food
security or health. Some of the research stations were equipped with very advanced equipment
and infrastructure and employed researchers from different countries and sectors. Projects of this
kind engaged in research on air quality by placing sensors on commercial aircraft (i.e. IAGOS-
ERI), in water related research (i.e. HYDRALAB IV) by focusing on marine ecology and in full
scale ecosystems regional experiments in a global manner (i.e. MESOAQUA).
MESOAQUA critically contributed to the international joint activity that generated a
comprehensive data set which allowed to study the complex responses of pelagic communities to
climate change, in a way that was not previously possible. In particular, the project increased our
understanding of how the lower part of the pelagic food web works, how it responds to climate
change, pollution and environmental toxins, and what role it plays in producing food for
larger species of fish. Thus, the project strongly contributed to tackling food security issue
on a global scale. During four years MESOAQUA offered to more than 150 European and not-
European marine scientists access to research facilities where they were leading or contributing
to a total of 23 different cooperative international experiments, thereby advancing studies of
aquatic ecosystems from the Arctic to the Mediterranean.
The data obtained from the HYDRALAB IV project tests is crucial to reduction of the cost of
energy from wave energy systems. Commercial exploitation of wave energy will require
installation of large numbers of Wave Energy Converters (WECs), arranged in an array (or a
farm or park). Given their geographical distribution and the wealth of resources available in
Europe, tidal and wave energy is poised to provide the most significant contribution to the
European energy system128
. To illustrate this, as much as 45 % of wave energy developers are
located in the EU. Moreover, the majority of ocean energy infrastructure, such as ocean energy
test centres, is also hosted in the EU129
.
Climate change research played a key role in the development and aggregation of climate change
models, which are essential to understand how the climate will evolve and to be prepared for
extreme weather events and to mitigate them. For example, floods are a serious problem in
the EU and world-wide. In May-June 2016, flooding killed 20 people in different EU Member
States (in Germany, France, Belgium and Romania). HYDRALAB IV research findings allowed
the quantitative assessment of flood risk reduction by salt marshes under extreme
conditions and thus provided input into the future engineering of such biophysical buffers in the
face of global environmental change. The project also improved ice load measurements, which
improved the understanding of loading on structures and icebreakers. Moreover, GEOWOW
provided solutions that contributed to further improvements in high impact weather
forecasting. In particular, GEOWOW provided a get around the 2-day delay in the data
accessibility and helped weather forecasters to improve warnings of hazardous weather, and so
avoid some of the associated impacts, especially in developing countries.
128 2014 JRC Ocean energy status report, page 14; 129 Ibidem;

166
The ACTRIS project was an essential pillar of the EU ground-based observing system that
provides the long-term observations information required to understand current variability of
the atmospheric aerosol components and better predict their impact on climate and air
quality in a changing climate. ACTRIS aimed at integrating European ground-based stations
equipped with advanced atmospheric probing instrumentation for aerosols, clouds, and short-
lived gas-phase species. ACTRIS supported and complemented aircraft and satellite observations
and had an important role in the validation, integration, full exploitation of remote sensing data.
The strategic focus of ACTRIS was to ensure the long-term continuation of advanced
measurements on aerosols, clouds and reactive gases in Europe in a coordinated and cost-
efficient way.
Climate change research is unique because of its strong coordination role, as it allows an
international co-development of climate change models, creating a process of mutual learning
and an efficient knowledge creation. In many instances EU funded research initiated climate
change research and then national/regional authorities topped up the efforts with additional
financial resources, thus creating synergies and added value. In some of the projects national
financing made up quite a considerable share. For example, in the ICOS project the Framework
Programme funded only the preparatory phase of the project. Thus, the running of operational
systems, acquisition of equipment (such as atmospheric stations, ecosystems stations, or ships
that continuously measure the transfer of greenhouse gases in the surface of earth and in the
atmosphere) were financed by national governments, thereby strongly complementing the EU
funding and creating additional value.
EU-funded climate change research is very valuable, as the obtained data can be used for
multiple purposes in different sectors ranging from climate change, energy to food security
and health. Therefore, good accessibility to this data is crucial. The GEOSS portal provides
scientists, policymakers and citizens with improved discovery and access to cross-discipline
Earth observation data and services that meet their individual needs (i.e. GEOWOW project).
Via the GEOSS portal users may discover and access different earth observation resources which
have been registered. It connects data providers with users by having implemented different apps
and interfaces in a way that users can easily find data without being expert in different protocols
used by data providers.
EU climate change research is unique of its global character. A considerable share of EU
climate change projects were carried out in non-EU countries: in different African countries (i.e.
building research capacity of local researchers in the CREATING), Southeast Asia (i.e. fighting
deforestation in the I-REDD) or the Middle East (i.e. building climate data depository in the
DARECLIMED). This was an important contribution in fighting climate change, because the
countries most affected by climate change are often the least well placed to understand the
issues and provide financing.
F.7. European added value case study 7: Contributions to the Digital Single Market
through innovative online public services in an inclusive and reflective society
F.7.1. Overall context
(a) Definition and expected impact of the area
This case study focuses on the research supported by FP7 in the area of innovative online public
services and the contribution (the European added value) it has made to the Digital Single
Market as well as to building a more inclusive and reflective European society. The subject of

167
this case study draws its rationale from one of the societal challenges that Horizon 2020
programme aims to address, namely Societal Challenge 6 (SC6): Europe in a changing world -
inclusive, innovative and reflective societies. Among other research areas falling under this
Societal Challenge, Horizon 2020 will finance research on how Information and Communication
Technologies (ICT) could contribute to the inclusiveness, innovativeness and reflectivity of the
European societies. As clarified by the Societal Challenge 6 Work Programmes 2014-2015 and
2016-2017, issues researched in this area can be quite diverse, ranging from eGovernance (the
way governments are using ICT for providing public services) and eParticipation (providing
citizens with a way to engage in policy-making with the help of ICT) to the digitisation of
resources with societal relevance (e.g. digitising historical books and other resources, 3D
modelling for accessing EU cultural assets).
This case study aims to assess the European added value and impacts of the research on
innovative online public services funded under the predecessor FP7 programme. In broad terms,
projects analysed fall into one of the following research topics:
eGovernment/ eGovernance – the use of ICT to improve the activities of public sector
organisations. The following sub-topics will be covered under this research area;
o Improving government process. Initiatives within this domain are concerned
particularly with improving the internal workings of the public sector;
o Connecting citizens and government. Such initiatives deal particularly with the
relationship between the government and the citizens: either as
voters/stakeholders from whom the public sector should derive its legitimacy, or
as customers who consume public services;
o Building external interactions (eSociety). This area covers initiatives aimed at
developing citizens-to-citizens interactions (building communities), as well as
creating links between citizens and other organisations (NGOs, businesses).
Digitisation and digital preservation of culturally relevant resources. Research in this
area aims to analyse, among other things, (1) how cultural and historical resources can be
digitised and preserved, (2) how these resources can be made accessible to citizens as
well as researchers, and (3) how cultural digital resources can be innovatively re-used to
offer economic opportunities to the cultural and creative industries.
The Digital Agenda for Europe130
adopted in 2010 indicated eGovernment services as a cost-
effective route towards better public services for every citizen and business, as well as towards a
participatory, open and transparent government. eGovernment services can reduce costs and save
time for public administrations, citizens and businesses. They can also help mitigate the risks of
climate change, natural and man-made hazards, for example by sharing of environmental data
and environment-related information.
The main impact expected from research funded in the area of eGovernment is to contribute to
developing new and improved processes, products, services and methods of delivery in the
public sector. Using ICT to innovate in the public services provision is also expected to make the
130 Communication from the Commission to the European Parliament, the Council, the European Economic and Social
Committee and the Committee of the Regions A Digital Agenda for Europe: http://eur-lex.europa.eu/legal-
content/EN/TXT/?uri=celex:52010DC0245

168
public administrations more effective and efficient (e.g. through better responding to society’s
needs) as well as to improve the quality of services they provide.
The Digital Agenda for Europe has also indicated the need131
to digitise Europe’s cultural
heritage and make it available to this and future generations as well as to create a legal
framework to facilitate the digitisation and dissemination of cultural works in Europe.
In the area of digitisation and digital preservation, the key expected impacts of the EU-funded
research are:132
Improving access to and use of digitised cultural material that is in the public domain;
Improving conditions for the digitisation and online accessibility of digitised material;
Reinforcing strategies and legislation for the long-term preservation of digital material;
Making the necessary arrangements for the deposit of material created in digital format in
order to guarantee its long-term preservation.
(b) Rationale for public intervention: key trends in the area, main challenges and
indicators
There is an unquestionable rationale for the public intervention in the area of innovative online
public services. The output of research in this area itself is first and foremost used by the public
institutions. Even in such cases when research leads to marketable innovations (e.g. applications,
websites) developed by the private sector organisations, they usually have a social purpose and
therefore contribute to the objectives of public institutions. Furthermore, research funded by the
FP7 in the area of digitisation and digital preservation often has not only national, but also EU-
level rationale, since it is related to protecting the European cultural and historical heritage.
Research in the area of eGovernment mostly responded to a challenge on how to make public
administrations in Europe more effective and efficient in providing public services. A recent
study on eGovernment services in Europe133
showed that there remain many issues to be
addressed in this area: for example, in many cases users of public services in different countries
are still asked to fill forms with information already available to the administration. Only 57% of
the public services are available to trans-national businesses and only 41% to other EU citizens
across the border. As many as 73% of the public services websites do not have a mobile-friendly
version. These are just a few indicators underlining the importance of funding research (and
especially EU-level research) in this area.
The orientation paper published in 2013 as a result of the public consultation on directions for
EU-level research on ICT-driven public sector innovation134
listed a number of measures how
research supported at the EU level is expected to foster ICT-driven public sector innovations.
131 Communication from the Commission to the European Parliament, the Council, the European Economic and Social
Committee and the Committee of the Regions A Digital Agenda for Europe: http://eur-lex.europa.eu/legal-
content/EN/TXT/?uri=celex:52010DC0245 132 Commission’s Recommendation on the digitisation and online accessibility of cultural material and digital preservation:
http://eur-lex.europa.eu/LexUriServ/LexUriServ.do?uri=OJ:L:2011:283:0039:0045:EN:PDF 133 Capgemini, IDC, Sogeti, and Politecnico di Milano, “Future-proofing eGovernment for the Digital Single Market: An
assessment of digital public service delivery in Europe.” Background report, June 2015. 134 Orientation paper: research and innovation at EU level under Horizon 2020 in support of ICT-driven public sector innovation,
10 May 2013, p. 2.

169
These measures were summarised into two categories related to (1) the key drivers and trends in
the eGovernance area and (1) the basic technology tools and other enablers.
Regarding key eGovernance drivers and trends, it was recommended that researchers in the ICT
area to focus on:
Promoting open data, open services and open participation through developing
frameworks and models linking many parts and levels of the public sector as well as
linking the public sector to other appropriate actors outside government;
Promoting approaches focusing on the user/client: user empowerment, co-creation,
service personalisation, simplicity and needs fulfilment. To achieve this, the researchers
were invited to learn from the best in the private sector and to ensure that that all users
are served by employing appropriate channels and that their privacy and integrity are
protected. This also includes supporting the development of local and location-based
services, based on open data and mobile devices using GPS and web-based services (e.g.
smart city approaches);
Fostering participation and engagement of citizens/users. Researchers are expected to
focus more on enabling widespread collaboration in service strategy development,
making design decisions, managing public assets and other work process arrangements.
Undertaking bottom-up societal experimentations on a small scale where failure is
small and thus survivable, while success can be supported and up-scaled.
The following key aspects to be addressed by EU-funded research were highlighted in the area of
basic technology tools and other enablers:
There is a need to adopt and develop new types of infrastructures and processes (both
hardware and software) as well as to use and adjust the technological elements already
developed elsewhere. Among other things, research should focus on building
infrastructures needed to support ‘big processes’ (such as decentralised innovative
operations, big data analysis) and the use/development of reference models and standards
for ICT. Regarding infrastructure, the following trends should be especially noted:
o Increasing the focus on web 2.0, social media, gamification, mobile solutions and
Bring Your Own Device (BYOD;
o Developing and deploying privacy-enhancing-technologies which ensure data
protection, cyber security, identity management and authentication;
o Deploying advanced cloud solutions, semantic interoperability, web 3.0
approaches and the Internet of Things.
EU-funded research must use and focus on obtaining good quality data available in
machine readable linked datasets which can be easily searched and merged. In addition,
future research is expected to focus on ways how to enhance standards for data quality,
structuring, linking and searching, as well as on the development of standard tool
modules for compilation, analysis and visualisation of data. Safeguards for ensuring the
provenance, integrity, auditability, authenticity and transparency of data should also be
taken into account.

170
EU funded research is expected to investigate ICT-based policy modelling and making
by developing common public sector toolboxes for data analytics to address complex
societal problems, investigating the potential of policy simulation, massive multiplayer
policy gaming and model-based decision-support systems.
Researchers should also assess how the most recent ICT can contribute to measuring
and monitoring government performance in particular through providing new
measurement tools and methods;
EU-funded research is also expected to look at how ICT can be used to empower public
sector staff as well as how the public sector employees can be assisted in acquiring
necessary skills to use the ICTs.
However, researchers and practitioners in the area should also note certain concerns that
changing and adapting the roles of government based on the ICT-driven innovation might
bring135
:
Loss of control and blurred accountability of services (by whom to whom?);
Service quality standards are more difficult to determine and maintain with many
designers and suppliers;
Privacy and data security;
Danger of data and content misuse;
Information and data overload.
The rationale for the EU to invest in digitising cultural resources was already underlined in the
Commission’s Communication “i2010: Digital libraries” published in 2005.136
The key objective
of the initiative was to make Europe’s cultural and scientific record accessible for all and to
create a virtual European library. The initiative indicated three main strands of action to be
followed that are still valid:
Digitisation of resources for their wider use in the information society;
Preservation and storage of digital resources to ensure that future generations can
access the digital material and to prevent precious content being lost;
Fostering online accessibility of digital resources to maximise the benefits that
citizens, researchers and companies can draw from the information.
135 Orientation paper: research and innovation at EU level under Horizon 2020 in support of ICT-driven public sector innovation,
10 May 2013, p. 3. 136 Communication from the Commission of 30 September 2005 to the European Parliament, the Council, the European
Economic and Social Committee and the Committee of the Regions – i2010: digital libraries, COM(2005) 465 final: http://eur-
lex.europa.eu/legal-content/EN/TXT/PDF/?uri=CELEX:52005DC0465&from=EN

171
The Digital Agenda for Europe indicated137
that the fragmentation and complexity in the current
licensing system hinders the digitisation of a large part of Europe's recent cultural heritage.
Rights clearance must be improved, and Europeana – the EU public digital library – should be
strengthened. Increased public funding is needed to finance large-scale digitisation, alongside
initiatives with private partners provided that they allow a general accessibility of Europe's
common cultural heritage online. Europe’s cultural heritage should also be made better
accessible to all Europeans by advancing and using modern translation technologies.
The table below provides a list of quantitative indicators most commonly employed to measure
the impacts of innovative online public services.
137 Communication from the Commission to the European Parliament, the Council, the European Economic and Social
Committee and the Committee of the Regions A Digital Agenda for Europe: http://eur-lex.europa.eu/legal-
content/EN/TXT/?uri=celex:52010DC0245

172
Table 25 Key indicators related to the area of innovative online public services
Indicator More detailed description Indicator values/examples
E-GOVERNMENT
UN E–Government
Development Index
(EGDI)
The EGDI is based on a comprehensive survey
of the online presence of all 193 United Nations
Member States, which assesses national
websites and how e-government policies and
strategies are applied in general and in specific
sectors for delivery of essential services. The
assessment rates the e-government performance
of countries relative to one another as opposed
to being an absolute measurement. The results
are tabulated and combined with a set of
indicators embodying a country’s capacity to
participate in the information society, without
which e-government development efforts are of
limited immediate use.
EGDI is a weighted average of normalised
scores on the three most important dimensions
of e-government, namely:
Scope and quality of online services (Online
Service Index, OSI);
Status of the development of
telecommunication infrastructure
(Telecommunication Infrastructure Index,
TII);
Inherent human capital (Human Capital
Index, HCI).
The indicator takes values from 0 to
1. Where 1 indicates the maximum
development level of E-Government.
For example:
The UK: EGDI was 0.9193 in
2016;
Germany: EGDI was 0.8210 in
2016.
UN
Telecommunication
Infrastructure Index
(TII)
The TII is an arithmetic average composite of
five indicators:
Estimated internet users per 100 inhabitants;
Number of main fixed telephone lines per
100 inhabitants;
Number of mobile subscribers per 100
inhabitants;
Number of wireless broadband subscriptions
per 100 inhabitants;
Number of fixed broadband subscriptions
per 100 inhabitants.
The indicator takes values from 0 to
1. Where 1 indicates the maximum
development level
telecommunication infrastructure. For
example:
San Marino: TII was 0.61276 in
2016;
Serbia: TII was 0.54344 in 2016.
UN Online Service
Index (OSI)
The OSI assesses each country’s national
websites in the native language, including the
national portal, e-services portal and e-
participation portal, as well as the websites of
the related ministries of education, labour,
social services, health, finance and environment
as applicable.
The assessment includes the accessibility and
usability of online tools provided by the national
institution website.
The indicator takes values from 0 to
1. For example:
San Marino: OSI was 0.23913 in
2016;
Serbia: OSI was 0.81884 in 2016.
Individuals using the
internet for interaction
with public authorities
(Eurostat)
Individuals using the internet for interaction
with public authorities within the last 9 months
before the survey: % of individuals aged 16 to
74.
Netherlands: 61 % of individuals
were using the internet for interaction
with public authorities in 2009.
Austria: 49 % of individuals were

173
Indicator More detailed description Indicator values/examples
using the internet for interaction with
public authorities in 2009.
Note: Indicator covers period from
2008 – 2015.
Individuals using the
internet for taking part
in online consultations
or voting (Eurostat)
Individuals using the internet for taking part in
online consultations or voting within the last 3
months before the survey: % of individuals aged
16 to 74.
Denmark: 12 % of individuals were
using the internet for taking part in
online consultations or voting in
2011.
Ireland: 4 % of individuals were
using the internet for taking part in
online consultations or voting in
2011.
Note: Indicator covers period from
2011-2015.
DIGITISATION AND DIGITAL PRESERVATION
Institutions with digital
collections per country
(Enumerate)
Actual number of institutions (incl. national
libraries, museums, archives, etc.) possessing
digitised material.
Sweden has around 107 national
institutions with digital collections;
Spain has more than 146 national
institutions with digital collections.
Presence of a written
digitisation strategy
per country
(Enumerate)
Actual number of institutions (incl. national
libraries, museums, archives, etc.) possessing
written digitisation strategy.
Sweden has around 39 national
institutions with written digitisation
strategy;
Spain has more than 60 national
institutions with possessing written
digitisation strategy.
Existence of embedded
policies related to the
sustainability of digital
collections
(Enumerate)
This indicator is a measure of the
internal/managerial support for activities related
to the preservation of an institution’s digital
collections.
-
Online access to digital
heritage (Enumerate)
Percentage of metadata that is available online
for general use.
There is ~46% of digitised material
which could be accessed through
online platform in Spain;
There is ~45% of digitised material
which could be accessed through
online platform in Sweden.
Source: PPMI, “Assessment of the Union Added Value and the Economic Impact of the EU Framework
Programmes (FP7, Horizon 2020)”, forthcoming ).
(c) Defining the scope of the European added value case study
The FP7 ICT programme (FP7 ICT)was the single largest and most important FP7 programme
part supporting research in the area of innovative online public services. As many as 62 projects
were funded by FP7 ICT in this area with around EUR 169 million of EU contribution. A few
relevant projects were also funded by other FP7 programme parts, which are listed in the order of
significance in the table below.

174
Table 26 Projects related to the area of innovative online public services and their allocated
EU contribution
Programme Number of projects EU contribution, EUR million
FP7 ICT 62 169.14
FP7 Environment 5 26.02
FP7 Infrastructures 2 4.95
FP7 Research for the benefit of
SMEs 2 2.32
FP7 Social sciences and humanities 2 5.10
FP7 Regions of knowledge 1 2.60
FP7 Transport 1 2.82
Total 75 212.95
Source: PPMI, “Assessment of the Union Added Value and the Economic Impact of the EU Framework
Programmes (FP7, Horizon 2020)”, forthcoming based on CORDA data
F.7.2. Key findings
(a) Factors/mechanisms of influence fostering European added value
Reduction of commercial and research risks
When it comes to the research risks, such as addressing an innovative research topic that is
uncertain to lead to relevant results, most of the interviewees had a general feeling that the EU
funding provided a major contribution to mitigate such risks. Although the participants of the
FP7-funded projects could not provide many specific examples, one of the area where risk-
reducing effect of the EU funding was rather clear was research on digital preservation of the
European cultural resources. The main argument for this was that national or private funders
would not be interested in this issue with specific European relevance. Therefore FP7 funding for
research in this area was of key importance to make it happen.
The interviewees also mentioned that FP7 funding ensured a certain level of trust that research
will go on without interruption at least for a few years, which made mainly the private actors
become more interested in participating in such projects. This way businesses could be ensured
that for a certain amount of time they will have a reduced risk to analyse the specific and
sometimes riskier-than-usual topics.
In addition to this, the interview programme indicated the potential of FP7 to contribute to
reducing commercial risks: there were a number of business participants in the research area of
innovative online public services (especially companies developing potentially marketable
applications), who claimed that participation in FP7 allowed them to look at specific innovative
issues, which later resulted in commercialisation through the development of a mobile
application or some specific process/part of the application necessary for the operationalisation.
However, interviewees from businesses said that in many cases it takes a lot of time (4-6 years)
to commercialise research outputs, which means that the EU funding often helps to avoid risks
only for some time and later on these risks still have to be taken by companies.

175
For example, in the case of the project Instant Mobility it took around 6 years - adding both the
time were FP7 support was received (2011-2013) and the time where research was funded by the
company itself (2010-2011 and 2013-2016) - to arrive at a situation where customers were ready
to buy the application to improve the multimodal mobility systems.
Leverage of private and public investment
Interviews with participants of EU-funded projects did not allow to come to a straightforward
conclusion on whether funding from FP7 tends to attract additional private or public investment
in the area of innovative online public services. Although there are a number of specific
examples when (1) the fact that an organisation was applying to FP7 helped to find public or
private co-funding for a specific project or (2) additional funding was leveraged as a result of the
project success, interviewees were reluctant to claim that this is a general trend in the research
area focusing on innovative online public services.
However, evidence from interviews showed that a significant share of participants of EU-funded
research projects have successfully attracted additional follow-up funding from FP7 and
Horizon 2020 to continue their research and development of technologies in follow-up projects.
The analysis also revealed that there are significant differences among EU countries in terms
of funding opportunities available at the national level in the area of innovative online public
services. A consensus among the interviewees emerged that, on average, the smaller a Member
State is, the less national opportunities it has. A similar statement can be made related to the
economic development level of a country. Therefore EU research funding opportunities would
be especially important for smaller and less economically advanced countries. The funding from
FP7 has certainly helped such EU Member States to catch up or to get closer to the leading
Member States both in terms of research capacities and level of excellence. On the other hand,
many of the interviewees mentioned Germany, the UK, France and the Netherlands as those
countries where it would be possible to find similar funding opportunities in the absence of the
EU framework programmes.
The case study also showed that some large private organisations (including, for example,
Google) are very active in the area of digitisation of cultural resources (especially, books). Some
of the interviewees mentioned that they have cooperated with Google, who was providing co-
funding in digitisation projects. Interviewees also noted that, however, it is very difficult to
attract any private funding for digital preservation (in contrast to digitisation) projects, since it is
much more difficult to translate research on digital preservation of cultural resources into
marketable products. Therefore public funding is necessary in this area.
Pooling of resources and building critical mass
When it comes to pooling of resources, the key concern of the participants in research
projects implemented in the area of innovative online public services was receiving good
and sufficiently large datasets. Many interviewees mentioned that collaborating with partners
in different countries helped them gather richer data as well as different types of data. Examples
in this area are provided by five projects under the FP7-funded initiative called “Citizens’
Observatories”, which aimed at developing novel technologies and applications in the domain of
Earth observation. These projects have exploited the capabilities offered by portable devices
(smartphones, tablets, etc.), to enable an effective participation by citizens in environmental data
collection. For example, under one of the projects – COBWEB – the visitors of four Biosphere

176
Reserves (Dyfi in Wales; Wadden Sea and Hallig Islands in Germany; Gorge of Samaria and Mt
Olympus in Greece) were involved to collect environmental data using their mobile devices.
The mere size of the European research projects was also mentioned as an advantage. There
was a consensus among the interviewed participants that large projects such as the ones funded
in FP7 are very rare at the national level. Most interviewees were of the opinion that their
projects would not have taken place at all without European funding. According to the projects
participants, they would still research the same issues even without receiving funding from FP7,
however, the objectives of their research and most likely the results would have changed
significantly.
FP7-funded projects have frequently involved a large number of partners from different
countries and different disciplines, thus enabling the consortia to expand their research depth
and scale. For some of the digitisation projects focusing on preservation of the European cultural
resources, cooperation between partners in different countries and large-scale funding was
absolutely necessary due to the specific European-level relevance of their research. In addition,
many interviewees mentioned that their partners sometimes possessed additional skills, which
were lacking in their own organisations, for example, on the application of specific research
methods or use of specific softwares.
Interviews revealed that pooling infrastructure was not a vitally important issue in the area
of innovative online public services. The necessary softwares and hardwares (mostly
computers) were usually relatively cheap and available in all partner organisations.
Increased international and/or inter-sectoral mobility of researchers
The interview programme did not indicate any relevant instances of international or inter-
sectoral mobility. In most of the analysed projects, partners were working specifically on their
own work packages while exchanging the insights from their research in the regularly organised
meetings or online calls with their partners. In some cases, researchers from one partner moved
to the premises of other international partners for no more than 1-2 weeks in order to do
research, which is specifically related to their own work packages.
The case study did not indicate any instances of inter-sectoral mobility. Nevertheless, taking into
account the fact that many of the analysed projects involved both academic and business
partners, the involved researchers did get exposed to some extent to operations/research in a
different sector (academia to business and vice versa).
As mentioned by some interviewees from the private sector, businesses are often not willing to
send their researchers to work or do internship in other research institutions, e.g. academia. This
is related to the unwillingness of private companies to use their human resources in a way, which
is not directly related to the key business operations and is not directly leading to revenue/profit.
(b) Better results achieved because of European added value
Improved research excellence / capabilities
One of the main ways through which FP7 funding contributed to improving research capabilities
of organisations doing analysis in the area of innovative online public services, was by helping
to build new research partnerships/ consortia or to sustain those that already existed. The
interview programme has indicated that the impact of FP7 on building new international research

177
teams and networks was especially significant. Many interviewees reported that they have found
new partners. when applying to FP7 funding. Furthermore, most of them said that they have
continued cooperating with the newly established partners even after the EU funding has ended.
In a number of cases the research consortia that were established as a result of FP7 funding
succeeded in securing further funding from FP7 or Horizon 2020. This evidence suggests a clear
and very significant impact of EU research funding on building lasting research consortia.
In addition to this, there is a clear impact not only on the cooperation as such, but also on
inter-sectoral collaboration. The interview programme indicated a number of instances where
FP7 funding led to long-term cooperation between academia or public research institutes and
businesses.
FP7-induced long-term cooperation also helped smaller actors to up-scale, enter and establish
themselves in specific research areas or even markets through cooperating with larger
organisations in the area. This is relevant both for academic and business sectors. First, the case
study indicated instances where SMEs established themselves in specific markets by cooperating
in FP7 projects with larger and very well-established companies. A similar trend was indicated in
academia. Through participating in FP7, less established universities, especially from the new
EU Member States, have successfully built links with the best universities in Europe and the
world.
FP7 also had a significant effect on the size of the research teams – this was indicated by
many interviewees. However, it is not entirely clear to what extent this effect was direct (i.e.
hiring researchers from the project funding) compared to the leverage effect (hiring additional
researchers as a result of project results, which would not be funded from FP7 funding). The
collected evidence shows only that the new researchers were certainly hired from the project
funding. The analysis done for the case study even indicated a number of research institutes,
where the employees are mainly remunerated through funding from the Framework Programme.
This means that such teams would likely disappear if the EU funding was to end. Interviewees
did not mention any specific examples where the employment of new researchers would have
been the result of the success of a project and the attraction of funding from other sources than
EU.
The interview programme also revealed that in the area of research on online services there is
some tension between the development of excellent research (measured in the number of
scientific articles published in top journals) and the development of specific ICT applications.
For example, the POSEIDON project has developed an application for users with Down’s
syndrome, which supports daily planning of activities such as shopping, money handling,
traveling and similar. Although FP7 was a programme focusing in particular on support for
research activities, the researchers in the area of ICT saw the development of very concrete
innovative tools and applications as no less important. Some interviewees even indicated that
they would like the Commission to focus less on the quality of research itself and more on the
applicability of the developed tools. A number of interviewees also noted that follow-up funding
for making the developed innovations operational or marketable would be welcome.
The interview programme indicated a low effect (if any) of FP7 funding on
training/improving the skills of researchers. Interviewees reported that training for the
researchers working in the projects was not usually provided as part of the project funding.
Nevertheless, other training opportunities were offered for researchers in the organisations, both
academia and businesses, as part of usual operations of the involved participants.

178
Economies of scale and scope
There was little evidence demonstrating the impact of EU research funding on economies of
scale and scope. An example coming closest to such effect was research in the area of
digitisation of cultural resources. A number of interviewees in this area indicated that without the
EU funding and involvement of partners from different countries it would have been impossible
to digitise as many resources at the national level in separate countries as the FP7 funding
allowed to at the European level. Access to different types of data available in different countries
(e.g. historical fonts, paintings) also allowed improving the digital recognition tools so that the
digitisation of each specific cultural unit is relatively easier and also cheaper. This shows that
cooperation in digitisation projects at the European level allowed to improve the efficiency of the
relevant ICT tools and therefore to save resources.
Wider availability and dissemination of knowledge
According to interviewees, FP7 funding had a clear effect on improving access to research
outputs. However, this is mostly the result of projects where the European Commission required
that all data and research outputs should be published in open source repositories. When it was
not directly required, participating organisations were less willing to do this on their own. A
number of interviewees from businesses indicated that a requirement to publish data or the
developed prototypes in openly accessible websites has harmed commercialisation opportunities
related to the potentially marketable outputs developed.
Interviewees also agreed that, compared to the nationally-funded projects, research done under
the EU-funded projects is generally much better communicated to the practitioners in the
area as well as to the wider public, since the Commission often directly asks to allocate a certain
amount of resources for communication (which is not always the case in nationally-funded
projects or even less so in projects funded with own resources). A number of conferences and
other communication events were organised as part of projects funded by the EU in the area of
innovative online public services.
Finally, a clear result of the FP7 funding is a better international visibility of research results.
Not only it is the case that FP7 projects allow research organisations to cooperate with EU and
international partners, but they also attract more attention from third countries and especially the
USA.
Some of the EU-funded projects also led to the establishment of competence centres or similar
institutions, which, among other things, seek to share knowledge about specific research topics
with the scientific community. Examples of such centres are PrestoCentre (a result of the project
PrestoPRIME) and the Impact Centre of Competence (project IMPACT). However, interviewees
noted that in many cases it is difficult to keep the websites of these competence centres up-to-
date without additional funding from the EU.
Better coordination of national research policies and practices at the EU level
A clear positive effect that the EU funding had on the coordination of national research policies
and practices in the area of innovative online public services was through establishing research
standards in this area, for example through building centres of excellence/competence. An
example of this phenomenon is the Impact Centre of Competence established as a result of the
FP7 project “Improving Access to Text (IMPACT).” The centre was a direct planned outcome of
the project. It provides tools, services and facilities to further advance the state-of-the-art in the

179
field of document imaging, language technology and the processing of historical text. It is one of
many examples how FP7 projects contributed to establishing research standards in the ICT area.
As already mentioned above, a similar centre of competences – PrestoCentre – resulted from
another project called PrestoPRIME. The PrestoCentre is a membership-driven organisation that
brings together a global community of stakeholders in audio-visual digitisation and digital
preservation to share, work and learn. PrestoCentre works with experts, researchers, advocates,
businesses, public services, educational organisations and professional associations to enhance
the audiovisual sector's ability to provide long-term access to cultural heritage.
There was also a consensus among the interviewees that EU-funded projects tend to be of more
interdisciplinary nature than those funded at the national level. Many of the interviewed
participants claimed that they have felt a certain push from the Commission to involve partners
representing a wide variety of disciplines, not only ICT, which was certainly beneficial
especially in the area of eGovernment.
(c) Long-term impacts resulting from European added value
Better addressing societal / pan-European challenges:
Research funded by FP7 in the area of digitisation and digital preservation had a clear
positive impact on making European historical and cultural resources better accessible to
the general public, the researchers (e.g. historians) and to audio-visual industries.
FP7 funding in the area of innovative online public services also had a structuring effect in
the area of environmental monitoring and especially in involving citizens as important sources
of information about the environment they are interacting with. Five FP7 funded projects (CITI-
SENSE; OmniScientis; Citclops; COBWEB and WeSenseIt) developed and implemented a
highly innovative approach of “Citizen Observatories”, involving citizens in information
capturing, evaluation and communication, mostly in the area of environmental research. A
number of novel technologies and applications were developed in the domain of Earth
Observation as a result of FP7 funding. These projects contributed to finding new ways how to
exploit portable devices (smartphones, tablets, etc.) and enable effective participation by citizens
in environmental monitoring based on broad stakeholder and user involvement in support of both
community and policy priorities. This approach was later taken up in 2015 with a specific topic
in Horizon 2020 called “Growing a Low Carbon, Resource Efficient Economy with a
Sustainable Supply of Raw Materials” aiming at strengthening environmental monitoring
capabilities by using Citizen Observatories.
EU research funding in the area of innovative online public services has also contributed to
a better inclusion of disadvantaged persons into the European society. Such projects as
Prosperity4All and POSEIDON can be mentioned as examples and good practices in the field.
The Prosperity4All project, which is still ongoing, is a response towards a societal challenge that
over 2 billion people worldwide have different types, degrees, or combinations of disability,
literacy, digital literacy or aging related barriers that impede or prevent the use of ICT. The
researchers involved in the project believe that the EU cannot afford (socially, politically and
economically) having this large percentage of society offline in the time when access to ICT is
required for most education, employment, and commerce, and is increasingly required for travel,
health, safety, daily living and participation in society. By building on the success of another
EU-funded project Cloud4All (2011-2015), which has developed preference management tools
for people with special needs to auto-configure their computers, tablets and smartphones, making

180
them easier to use, the Prosperity4All project further develops the infrastructure and ecosystem
that is necessary for a sustainable Global Public Inclusive Infrastructure (GPII)138
– a software
and service enhancement to our broadband infrastructure. The two mentioned projects have
attracted more than EUR 25 million (of which, more than EUR 15 million from FP7) to improve
the accessibility of people with disabilities to Internet and key related technologies.
Another good practice project in the same area, “Personalized Smart Environments to increase
Inclusion of people with Down’s syndrome (POSEIDON),” researched on the ways to use ICT to
help people with Down’s syndrome to achieve a greater level of independence in their lives, a
greater autonomy at home, at work, education and leisure, as well as to improve their
opportunities for socialising. The project resulted in a number of prototypes for apps to support
the daily lives of people with Down syndrome and their carers. The developed apps support
independence in different areas of living such as daily plans, travel, shopping and money
handling.139
F.7.3. Stories of impact
The EU-funded Citizens’ Observatories initiative, covering five FP7-supported projects
(Citclops, CITI-SENSE, COBWEB, Omniscientis and WeSenseIt) has a clear potential to foster
a major break-through in the way that personal portable devices (smartphones, tablets or micro-
sensors) are used to enable an effective participation by citizens in environmental monitoring.
The goal of the above-mentioned five projects was to develop novel technologies and
applications in the domain of Earth Observation, which is defined as the gathering of information
about the planet Earth’s physical, chemical and biological systems via remote sensing
technologies supplemented by earth surveying techniques, encompassing the collection, analysis
and presentation of data. Earth Observation is usually carried out through complicated
technologies available for the governmental agencies or private corporations. The Citizens’
Observatories initiative succeeded in fostering active participation of lay citizens in
environmental monitoring and policy making through using their personal portable devices. In
addition to this, the five projects enabled sharing of data and information through advanced data
management strategies based on open e-collaboration, addressing questions of privacy, data
standards, quality and reliability.
For example, WeSenseIt project140
(2012-2016) enabled citizens to become active stakeholders
in information capturing, evaluation and communication for the water environment including
flood risk. The project brought together the expertise of 14 European partners across academic
institutions, research centres and industry. The project has already delivered new smartphone
crowdsourcing apps, innovative low cost rain gauges, and autonomous soil-moisture sensors. It
encouraged citizen communities to upload, share, discuss and rate data and information on their
water environment with a focus on minimising the effects of pluvial flooding and poor water
quality. The developed technology was tested in three case studies: Doncaster, UK; Delftland,
the Netherlands; and Vicenza, Italy.
138 Global Public Investment Infrastructure, http://gpii.net/index.html 139 For examples of the developed apps, visit: http://www.poseidon-project.org/product/ 140 Project website: http://www.wesenseit.com/

181
G. TOP 50 HORIZON 2020 PARTICIPANTS PER TYPE OF ORGANISATION
G.1. Organisations
Table 27 Top-50 (all) organisations in terms of EU funding
Rank Participant legal name Type of
organisation Country EU
contribution (EUR million)
Number of participations
1 MAX-PLANCK-GESELLSCHAFT ZUR FORDERUNG DER WISSENSCHAFTEN EV REC Germany 443.5 213
2 CENTRE NATIONAL DE LA Research Organisations (REC)HERCHE SCIENTIFIQUE CNRS REC France 361.4 505
3 FRAUNHOFER GESELLSCHAFT ZUR FOERDERUNG DER ANGEWANDTEN FORSCHUNG E.V. REC Germany 223.9 407
4 COMMISSARIAT A L ENERGIE ATOMIQUE ET AUX ENERGIES ALTERNATIVES REC France 218.7 246
5 THE CHANCELLOR, MASTERS AND SCHOLARS OF THE UNIVERSITY OF OXFORD HES United Kingdom 174.5 251
6 THE CHANCELLOR, MASTERS AND SCHOLARS OF THE UNIVERSITY OF CAMBRIDGE HES United Kingdom 172.1 267
7 UNIVERSITY COLLEGE LONDON HES United Kingdom 159.1 239
8 IMPERIAL COLLEGE OF SCIENCE TECHNOLOGY AND MEDICINE HES United Kingdom 120.0 192
9 CONSIGLIO NAZIONALE DELLE RICERCHE REC Italy 114.2 250
10 AGENCIA ESTATAL CONSEJO SUPERIOR DEINVESTIGACIONES CIENTIFICAS REC Spain 110.1 237
11 ECOLE POLYTECHNIQUE FEDERALE DE LAUSANNE HES Switzerland 106.6 142
12 TECHNISCHE UNIVERSITEIT DELFT HES Netherlands 104.7 155
13 KATHOLIEKE UNIVERSITEIT LEUVEN HES Belgium 104.2 170
14 KOBENHAVNS UNIVERSITET HES Denmark 101.8 196
15 THE UNIVERSITY OF EDINBURGH HES United Kingdom 100.7 142
16 INTERUNIVERSITAIR MICRO-ELECTRONICACENTRUM REC Belgium 93.0 86
17 COST ASSOCIATION OTH Belgium 89.6 1
18 DEUTSCUniversities (HES) ZENTRUM FUER LUFT - UND RAUMFAHRT EV REC Germany 86.1 163
19 INSTITUT NATIONAL DE LA SANTE ET DE LA Research Organisations (REC)HERCHE
MEDICALE REC France 85.3 113
20 EIDGENOESSISCHE TECHNISCHE HOCHSCHULE ZUERICH HES Switzerland 74.7 145
21 DANMARKS TEKNISKE UNIVERSITET HES Denmark 72.8 136
22 THE UNIVERSITY OF Manchester HES United Kingdom 71.7 119
23 UNIVERSITEIT VAN AMSTERDAM HES Netherlands 68.7 96
24 KAROLINSKA INSTITUTET HES Sweden 68.6 99
25 KARLSRUHER INSTITUT FUER TECHNOLOGIE HES Germany 67.2 106
26 TECHNISCHE UNIVERSITAET MUENCHEN HES Germany 66.9 105
27 GEANT LIMITED OTH United Kingdom 64.6 8
28 Teknologian tutkimuskeskus VTT Oy REC Finland 64.3 127
29 POLITECNICO DI MILANO HES Italy 63.9 133
30 FORSCHUNGSZENTRUM JULICH GMBH REC Germany 62.0 82
31 UNIVERSITY OF SOUTHAMPTON HES United Kingdom 60.8 83
32 LUNDS UNIVERSITET HES Sweden 60.4 84
33 UNIVERSITY OF BRISTOL HES United Kingdom 60.1 98
34 UNIVERSITEIT GENT HES Belgium 60.0 109
35 STICHTING KATHOLIEKE UNIVERSITEIT HES Netherlands 59.4 90
36 UNIVERSITEIT UTRECHT HES Netherlands 59.1 109
37 TEL AVIV UNIVERSITY HES Israel 58.6 60
38
THE PROVOST, FELLOWS, FOUNDATION SCHOLARS & THE Other (OTH)ER MEMBERS OF BOARD OF THE COLLEGE OF THE HOLY & UNDIVIDED TRINITY OF QUEEN ELIZABETH
NEAR DUBLIN HES Ireland 57.9 81
39 FUNDACION TECNALIA RESEARCH & INNOVATION REC Spain 57.6 122
40 NEDERLANDSE ORGANISATIE VOOR TOEGEPAST NATUURWETENSCHAPPELIJK
ONDERZOEK TNO REC Netherlands 55.7 109
41 LUDWIG-MAXIMILIANS-UNIVERSITAET MUENCHEN HES Germany 55.5 84
42 STICHTING VU HES Netherlands 54.7 100
43 TECHNISCHE UNIVERSITEIT EINDHOVEN HES Netherlands 54.6 100
44 RHEINISCH-WESTFAELISCHE TECHNISCHE HOCHSCHULE AACHEN HES Germany 53.2 91
45 EUROPEAN MOLECULAR BIOLOGY LABORATORY REC Germany 52.9 60
46 THE UNIVERSITY OF BIRMINGHAM HES United Kingdom 52.8 116
47 KUNGLIGA TEKNISKA HOEGSKOLAN HES Sweden 52.2 104
48 THE HEBREW UNIVERSITY OF JERUSALEM HES Israel 51.9 57
49 AGENZIA NAZIONALE PER LE NUOVE TECNOLOGIE, L'ENERGIA E LO SVILUPPO
ECONOMICO SOSTENIBILE REC Italy 51.6 53
50 AARHUS UNIVERSITET HES Denmark 51.6 104
Corda, Signed Grants cut-off date by 1/1/2017; Higher and Secondary Education Institutions (HES); Research
Organisations (REC); Other (OTH).

182
G.2. Higher and secondary education institutions (HES)
Table 28 Top-50 higher and secondary education institutions in terms of EU funding
Rank Participant legal name Country EU
contribution (EUR million)
Number of participations
1 THE CHANCELLOR, MASTERS AND SCHOLARS OF THE UNIVERSITY OF OXFORD United Kingdom 174.5 251
2 THE CHANCELLOR, MASTERS AND SCHOLARS OF THE UNIVERSITY OF CAMBRIDGE United Kingdom 172.1 267
3 UNIVERSITY COLLEGE LONDON United Kingdom 159.1 239
4 IMPERIAL COLLEGE OF SCIENCE TECHNOLOGY AND MEDICINE United Kingdom 120.0 192
5 ECOLE POLYTECHNIQUE FEDERALE DE LAUSANNE Switzerland 106.6 142
6 TECHNISCHE UNIVERSITEIT DELFT Netherlands 104.7 155
7 KATHOLIEKE UNIVERSITEIT LEUVEN Belgium 104.2 170
8 KOBENHAVNS UNIVERSITET Denmark 101.8 196
9 THE UNIVERSITY OF EDINBURGH United Kingdom 100.7 142
10 EIDGENOESSISCHE TECHNISCHE HOCHSCHULE ZUERICH Switzerland 74.7 145
11 DANMARKS TEKNISKE UNIVERSITET Denmark 72.8 136
12 THE UNIVERSITY OF MANCUniversities (HES)TER United Kingdom 71.7 119
13 UNIVERSITEIT VAN AMSTERDAM Netherlands 68.7 96
14 KAROLINSKA INSTITUTET Sweden 68.6 99
15 KARLSRUHER INSTITUT FUER TECHNOLOGIE Germany 67.2 106
16 TECHNISCHE UNIVERSITAET MUENCHEN Germany 66.9 105
17 POLITECNICO DI MILANO Italy 63.9 133
18 UNIVERSITY OF SOUTHAMPTON United Kingdom 60.8 83
19 LUNDS UNIVERSITET Sweden 60.4 84
20 UNIVERSITY OF BRISTOL United Kingdom 60.1 98
21 UNIVERSITEIT GENT Belgium 60.0 109
22 STICHTING KATHOLIEKE UNIVERSITEIT Netherlands 59.4 90
23 UNIVERSITEIT UTResearch Organisations (REC)HT Netherlands 59.1 109
24 TEL AVIV UNIVERSITY Israel 58.6 60
25
THE PROVOST, FELLOWS, FOUNDATION SCHOLARS & THE Other (OTH)ER MEMBERS OF BOARD OF THE COLLEGE OF THE HOLY & UNDIVIDED TRINITY OF QUEEN
ELIZABETH NEAR DUBLIN Ireland 57.9 81
26 LUDWIG-MAXIMILIANS-UNIVERSITAET MUENCHEN Germany 55.5 84
27 STICHTING VU Netherlands 54.7 100
28 TECHNISCHE UNIVERSITEIT EINDHOVEN Netherlands 54.6 100
29 RHEINISCH-WESTFAELISCHE TECHNISCHE HOCHSCHULE AACHEN Germany 53.2 91
30 THE UNIVERSITY OF BIRMINGHAM United Kingdom 52.8 116
31 KUNGLIGA TEKNISKA HOEGSKOLAN Sweden 52.2 104
32 THE HEBREW UNIVERSITY OF JERUSALEM Israel 51.9 57
33 AARHUS UNIVERSITET Denmark 51.6 104
34 THE UNIVERSITY OF WARWICK United Kingdom 51.6 85
35 HELSINGIN YLIOPISTO Finland 49.8 92
36 WEIZMANN INSTITUTE OF SCIENCE Israel 49.7 61
37 THE UNIVERSITY OF SHEFFIELD United Kingdom 48.2 104
38 TECHNISCHE UNIVERSITAET DRESDEN Germany 47.4 82
39 UPPSALA UNIVERSITET Sweden 46.7 79
40 UNIVERSITY OF GLASGOW United Kingdom 46.0 86
41 CHALMERS TEKNISKA HOEGSKOLA AB Sweden 45.3 80
42 RIJKSUNIVERSITEIT GRONINGEN Netherlands 44.8 67
43 UNIVERSITEIT LEIDEN Netherlands 43.9 60
44 TECHNION - ISRAEL INSTITUTE OF TECHNOLOGY Israel 41.5 56
45 KING'S COLLEGE LONDON United Kingdom 40.2 75
46 THE UNIVERSITY OF EXETER United Kingdom 39.6 61
47 UNIVERSITY OF LEEDS United Kingdom 38.6 83
48 UNIVERSITY COLLEGE CORK - NATIONAL UNIVERSITY OF IRELAND, CORK Ireland 37.5 70
49 NATIONAL UNIVERSITY OF IRELAND, GALWAY Ireland 36.9 77
50 UNIVERSITETET I OSLO Norway 36.5 50
Corda, Signed Grants cut-off date by 1/1/2017.

183
G.3. Other organisations (OTH)
Table 29: Top-50 other organisations in terms of EU funding
Rank Participant legal name Country EU contribution (EUR million)
Number of
participations
1 COST ASSOCIATION Belgium 89.6 1
2 GEANT LIMITED United Kingdom 64.6 8
3 CSC-TIETEEN TIETOTEKNIIKAN KESKUS OY Finland 8.2 14
4 ICLEI EUROPEAN SECRETARIAT GMBH (ICLEI EUROPASEKRETARIAT GMBH)* Germany 7.9 22
5 BIO BASE EUROPE PILOT PLANT VZW Belgium 7.1 10
6 Stichting EGI Netherlands 5.9 14
7 FUNDACION BANCARIA CAIXA D ESTALVIS I PENSIONS DE BARCELONA LA CAIXA Spain 5.0 3
8 EUN PARTNERSHIP AISBL Belgium 4.7 5
9 OSTERREICHISCHE ENERGIEAGENTUR AUSTRIAN ENERGY AGENCY Austria 4.5 14
10 FUNDINGBOX ACCELERATOR SP ZOO Poland 4.4 1
11 OSLO MEDTECH FORENING Norway 4.4 2
12 NORDUNET A/S Denmark 4.4 4
13 ISTITUTO DI STUDI PER L'INTEGRAZIONE DEI SISTEMI SC Italy 4.3 13
14 PARTNERSHIP FOR ADVANCED COMPUTINGIN EUROPE AISBL Belgium 4.1 6
15 FORUM VIRIUM HELSINKI OY Finland 4.0 7
16 UNION INTERNATIONALE DES TRANSPORTS PUBLICS Belgium 3.9 10
17 YOURIS.COM Belgium 3.9 14
18 GRAND EQUIPEMENT NATIONAL DE CALCUL INTENSIF France 3.7 2
19 UMWELTBUNDESAMT GMBH Austria 3.6 9
20 GESELLSCHAFT FUR ANGEWANDTE MIKRO UND OPTOELEKTRONIK MIT BESCHRANKTERHAFTUNG AMO GMBH
Germany 3.5 6
21 FONDATION EUROPEENNE DE LA SCIENCE France 3.5 9
22 European Business and Innovation Centre Network Belgium 3.4 14
23 CYBERFORUM EV Germany 3.3 1
24 SYNESIS-SOCIETA CONSORTILE A RESPONSABILITA LIMITATA Italy 3.3 8
25 POLIS - PROMOTION OF OPERATIONAL LINKS WITH INTEGRATED SERVICES, ASSOCIATION INTERNATIONALE
Belgium 3.3 15
26 ASSOCIATION EUROPEENNE DES EXPOSITIONS SCIENTIFIQUES TECHNIQUES ET INDUSTRIELLES
Belgium 3.2 8
27 SONDERBORG FORSYNINGSSERVICE AS Denmark 3.1 1
28 Fachagentur Nachwachsende Rohstoffe e.V. Germany 2.9 13
29 EUROCITIES ASBL Belgium 2.9 8
30 INFRAFRONTIER GMBH Germany 2.9 5
31 ASSOCIATION INTERNATIONALE EXTREME-LIGHT-INFRASTRUCTURE DELIVERY CONSORTIUM
Belgium 2.8 4
32 IDRYMA PROOther (OTH)ISIS EREVNAS Cyprus 2.7 28
33 STICHTING PROSAFE (THE PRODUCT SAFETY ENFORCEMENT FORUM OF EUROPE)
Netherlands 2.7 2
34 BIOPRAXIS RESEARCH AIE Spain 2.6 3
35 EIT DIGITAL Belgium 2.6 2
36 FOMENTO DE SAN SEBASTIAN SA Spain 2.6 3
37 STICHTING OPEN TICKETING Netherlands 2.6 1
38 VEREIN ZUR FOERDERUNG EINES DEUTSCHEN FORSCHUNGSNETZES DFN VEREIN E.V.
Germany 2.6 4
39 UNION INTERNATIONALE DES CHEMINS DE FER France 2.6 9
40 STICHTING TUBERCULOSIS VACCINE INITIATIVE Netherlands 2.5 1
41 IMP'ROVE - EUROPEAN INNOVATION MANAGEMENT ACADEMY EWIV Germany 2.5 2
42 ASSOCIATION 2 INVESTING INITIATIVE France 2.2 3
43 AquaTT UETP Ltd Ireland 2.2 7
44 AEROSPACE VALLEY France 2.1 8
45 ASSOCIACAO UNIVERSIDADE EMPRESA PARA DESENVOLVIMENTO TECMINHO Portugal 2.1 3
46 FEDERATION EUROPEENNE DES GEOLOGUES France 2.1 8
47 OPEN DATA INSTITUTE LBG United Kingdom 2.1 4
48 ASSOCIATION DES CITES ET DES REGIONS POUR LE Research Organisations (REC)YCLAGE ET LA GESTION DURABLE DES RESSOURCES
Belgium 2.0 7
49 INSTRUCT ACADEMIC SERVICES LIMITED United Kingdom 2.0 6
50 EUROPEAN MARINE ENERGY CENTRE LTD United Kingdom 2.0 6
Corda, Signed Grants cut-off date by 1/1/2017.

184
G.4. Private for profit companies (PRC)
Table 30 Top-50 private for profit companies in terms of EU funding
Rank Participant legal name Country EU contribution (EUR million)
Number of participations
1 SIEMENS AKTIENGESELLSCHAFT Germany 48.7 43
2 ATOS SPAIN SA Spain 31.9 74
3 BORREGAARD AS Norway 26.7 3
4 ROBERT BOSCH GMBH Germany 23.6 39
5 AVL LIST GMBH Austria 22.4 34
6 ENGINEERING - INGEGNERIA INFORMATICA SPA Italy 18.9 35
7 ACCIONA INFRAESTRUCTURAS S.A. Spain 18.7 37
8 ASML NETHERLANDS B.V. Netherlands 18.0 3
9 IBM ISRAEL - SCIENCE AND TECHNOLOGY LTD Israel 15.5 19
10 INDRA SISTEMAS SA Spain 14.4 37
11 DAIMLER AG Germany 14.4 12
12 GlaxoSmithKline Biologicals Belgium 14.1 2
13 ENERGOCHEMICA TRADING AS Slovakia 13.4 1
14 ALSTOM TRANSPORT S.A. France 12.7 9
15 SOLIDPOWER SPA Italy 12.7 5
16 ITM POWER (TRADING) LIMITED United Kingdom 12.6 8
17 D'APPOLONIA SPA Italy 11.8 39
18 RENAULT SAS France 11.7 18
19 TELEFONICA INVESTIGACION Y DESARROLLO SA Spain 11.3 33
20 THALES COMMUNICATIONS & SECURITY SAS France 11.2 20
21 IBM IRELAND LIMITED Ireland 10.9 18
22 IBM RESEARCH GMBH Switzerland 10.2 38
23 PHILIPS ELECTRONICS NEDERLAND B.V. Netherlands 9.9 20
24 INFINEON TECHNOLOGIES AG Germany 9.7 10
25 THALES ALENIA SPACE FRANCE France 9.5 24
26 WELLO OY Finland 9.4 1
27 MATRICA SPA Italy 9.3 1
28 INNOVACIO I Research Organisations (REC)ERCA INDUSTRIAL I SOSTENIBLE SL Spain 9.2 13
29 NEC EUROPE LTD United Kingdom 9.2 19
30 JOHNSON MATTHEY PLC United Kingdom 9.2 18
31 BOSCH THERMOTECHNIK GMBH Germany 9.0 2
32 LEONARDO - FINMECCANICA SPA Italy 9.0 30
33 ESTEYCO SAP Spain 8.9 3
34 VAILLANT GMBH Germany 8.7 3
35 STMICROELECTRONICS SRL Italy 8.7 21
36 VOLKSWAGEN AG Germany 8.4 11
37 FONROCHE GEOther (OTH)ERMIE SAS France 8.4 1
38 ARTTIC France 8.3 22
39 GEO@SEA NV Belgium 8.3 1
40 NOVAMONT SPA Italy 8.0 5
41 SOITEC SA France 7.9 5
42 DNV GL NETHERLANDS B.V. Netherlands 7.9 6
43 ANSALDO STS S.p.A. Italy 7.8 13
44 AIR LIQUIDE ADVANCED TECHNOLOGIES SA France 7.8 2
45 AIRBUS DEFENCE AND SPACE GMBH Germany 7.8 20
46 PHILIPS MEDICAL SYSTEMS NEDERLAND BV Netherlands 7.7 13
47 SIEMENS PUBLIC LIMITED COMPANY United Kingdom 7.7 7
48 THALES AIR SYSTEMS SAS France 7.7 23
49 RICARDO UK LIMITED United Kingdom 7.7 12
50 BULL SAS France 7.6 10
Corda, Signed Grants cut-off date by 1/1/2017.

185
G.5. Public sector organisations (PUB)
Table 31 Top-50 public sector organisations in terms of EU funding
Rank Participant legal name Country EU contribution (EUR million)
Number of
participations
1 REGION HOVEDSTADEN Denmark 19.5 31
2 AGENCE NATIONALE DE LA Research Organisations (REC)HERCHE France 19.4 36
3 NORGES FORSKNINGSRAD Norway 17.4 42
4 BUNDESAMT FUER STRAHLENSCHUTZ Germany 14.8 2
5 BUNDESMINISTERIUM FUER BILDUNG UND FORSCHUNG Germany 12.9 17
6 CENTRO PARA EL DESARROLLO TECNOLOGICO INDUSTRIAL. Spain 12.6 30
7 MINISTERIE VAN ECONOMISCHE ZAKEN Netherlands 11.6 31
8 OESTERREICHISCHE FORSCHUNGSFOERDERUNGSGESELLSCHAFT MBH Austria 10.5 29
9 The Department Of Energy and Climate Change United Kingdom 9.6 4
10 WELSH ASSEMBLY GOVERNMENT United Kingdom 9.6 2
11 FUNDACAO PARA A CIENCIA E A TECNOLOGIA Portugal 8.8 63
12 ENERGISTYRELSEN Denmark 8.6 8
13 VETENSKAPSRADET - SWEDISH RESEARCH COUNCIL Sweden 8.1 10
14 MINISTERIO DE ECONOMIA Y COMPETITIVIDAD Spain 8.0 29
15 THE SECRETARY OF STATE FOR ENVIRONMENT, FOOD AND RURAL AFFAIRS United Kingdom 7.6 22
16 NARODOWE CENTRUM NAUKI Poland 7.6 10
17 FORSKNINGSRÅDET FÖR MILJÖ, AREELLA NÄRINGAR OCH SAMHÄLLSBYGGANDE Sweden 7.5 14
18 NARODOWE CENTRUM BADAN I ROZWOJU Poland 7.5 26
19 MET OFFICE United Kingdom 7.4 14
20 STOCKHOLMS LANS LANDSTING Sweden 7.1 5
21 LANDESHAUPTSTADT MUENCHEN Germany 6.9 3
22 ENTERPRISE IRELAND Ireland 6.5 9
23 MINISTERIE VAN INFRASTRUCTUUR EN MILIEU Netherlands 6.5 20
24 STOCKHOLMS STAD Sweden 6.2 4
25 MINISTERO DELL'ISTRUZIONE, DELL'UNIVERSITA' E DELLA RICERCA Italy 6.1 28
26 AGENCIA PER A LA COMPETITIVITAT DE LA EMPRESA Spain 6.0 6
27 SERVICIO MADRILENO DE SALUD Spain 5.9 17
28 STATENS ENERGIMYNDIGHET Sweden 5.9 12
29 INNOVATIONSFONDEN Denmark 5.7 17
30 TARTU LINNAVALITSUS Estonia 5.4 1
31 SERVICIO ANDALUZ DE SALUD Spain 5.4 12
32 CAMARA MUNICIPAL DE LISBOA Portugal 5.4 11
33 COMUNE DI FIRENZE Italy 5.3 5
34 SVERIGES METEOROLOGISKA OCH HYDROLOGISKA INSTITUT Sweden 5.1 14
35 MINISTERO DELLA SALUTE Italy 5.0 13
36 AN TUDARAS UM ARD OIDEACHAS Ireland 5.0 4
37 SERVIZO GALEGO DE SAUDE Spain 4.6 9
38 Nottingham City Council United Kingdom 4.5 2
39 TRAFIKVERKET - TRV Sweden 4.2 11
40 Vivienda y Suelo de Euskadi, S.A. Spain 4.2 2
41 AGENCE DE L'ENVIRONNEMENT ET DE LA MAITRISE DE L'ENERGIE France 4.2 9
42 AYUNTAMIENTO DE VALLADOLID Spain 4.2 3
43 MATIMOP - THE ISRAELI CENTER FOR R&D Israel 4.1 18
44 KOBENHAVNS KOMMUNE Denmark 4.1 10
45 BRISTOL CITY COUNCIL United Kingdom 3.9 5
46 CENTRE HOSPITALIER UNIVERSITAIRE VAUDOIS Switzerland 3.9 11
47 BRITISH BROADCASTING CORPORATION United Kingdom 3.8 5
48 TEPEBASI MUNICIPALITY Turkey 3.8 1
Corda, Signed Grants cut-off date by 1/1/2017.

186
G.6. Research Organisations (REC)
Table 32 Top-50 public sector organisations in terms of EU funding
Rank Participant legal name Country EU contribution (EUR million)
Number of participations
1 MAX-PLANCK-GESELLSCHAFT ZUR FORDERUNG DER WISSENSCHAFTEN EV Germany 443,5 213
2 CENTRE NATIONAL DE LA RECHERCHE SCIENTIFIQUE CNRS France 361,4 505
3 FRAUNHOFER GESELLSCHAFT ZUR FOERDERUNG DER ANGEWANDTEN FORSCHUNG E.V. Germany 223,9 407
4 COMMISSARIAT A L ENERGIE ATOMIQUE ET AUX ENERGIES ALTERNATIVES France 218,7 246
5 CONSIGLIO NAZIONALE DELLE RICERCHE Italy 114,2 250
6 AGENCIA ESTATAL CONSEJO SUPERIOR DEINVESTIGACIONES CIENTIFICAS Spain 110,1 237
7 INTERUNIVERSITAIR MICRO-ELECTRONICACENTRUM Belgium 93,0 86
8 DEUTSCHES ZENTRUM FUER LUFT - UND RAUMFAHRT EV Germany 86,1 163
9 INSTITUT NATIONAL DE LA SANTE ET DE LA RECHERCHE MEDICALE France 85,3 113
10 Teknologian tutkimuskeskus VTT Oy Finland 64,3 127
11 FORSCHUNGSZENTRUM JULICH GMBH Germany 62,0 82
12 FUNDACION TECNALIA RESEARCH & INNOVATION Spain 57,6 122
13 NEDERLANDSE ORGANISATIE VOOR TOEGEPAST NATUURWETENSCHAPPELIJK ONDERZOEK TNO Netherlands 55,7 109
14 EUROPEAN MOLECULAR BIOLOGY LABORATORY Germany 52,9 60
15 AGENZIA NAZIONALE PER LE NUOVE TECNOLOGIE, L'ENERGIA E LO SVILUPPO ECONOMICO SOSTENIBILE Italy 51,6 53
16 STICHTING WAGENINGEN RESEARCH Netherlands 44,4 75
17 ETHNIKO KENTRO EREVNAS KAI TECHNOLOGIKIS ANAPTYXIS Greece 44,1 100
18 INSTITUT NATIONAL DE RECHERCHE ENINFORMATIQUE ET AUTOMATIQUE France 40,1 63
19 STIFTELSEN SINTEF Norway 39,0 76
20 FOUNDATION FOR RESEARCH AND TECHNOLOGY HELLAS Greece 38,1 96
21 EUROPEAN ORGANIZATION FOR NUCLEAR RESEARCH Switzerland 36,1 46
22 AIT AUSTRIAN INSTITUTE OF TECHNOLOGY GMBH Austria 29,8 55
23 INSTITUT NATIONAL DE LA RECHERCHE AGRONOMIQUE United Kingdom 29,3 58
24 NATURAL ENVIRONMENT RESEARCH COUNCIL France 29,3 75
25 INSTITUT PASTEUR France 28,5 46
26 VLAAMSE INSTELLING VOOR TECHNOLOGISCH ONDERZOEK N.V. Belgium 28,0 46
27 UNITED KINGDOM ATOMIC ENERGY AUTHORITY United Kingdom 27,8 3
28 FONDAZIONE ISTITUTO ITALIANO DI TECNOLOGIA Italy 25,9 36
29 KONINKLIJKE NEDERLANDSE AKADEMIE VAN WETENSCHAPPEN - KNAW Netherlands 25,3 35
30 HELMHOLTZ ZENTRUM MUENCHEN DEUTSCHES FORSCHUNGSZENTRUM FUER GESUNDHEIT UND UMWELT GMBH Germany 24,7 29
31 VIB Belgium 24,3 34
32 INSTITUTE OF COMMUNICATION AND COMPUTER SYSTEMS Greece 24,0 54
33 CENTRO RICERCHE FIAT SCPA Italy 23,9 47
34 FUNDACIO INSTITUT DE CIENCIES FOTONIQUES Spain 23,7 37
35 BARCELONA SUPERCOMPUTING CENTER - CENTRO NACIONAL DE SUPERCOMPUTACION Spain 22,5 49
36 ISTITUTO NAZIONALE DI FISICA NUCLEARE Italy 21,3 39
37 FUNDACIO CENTRE DE REGULACIO GENOMICA Spain 19,8 27
38 SCIENCE AND TECHNOLOGY FACILITIES COUNCIL United Kingdom 19,8 45
39 FRIEDRICH MIESCHER INSTITUTE FOR BIOMEDICAL RESEARCH Switzerland 19,7 13
40 TWI LIMITED United Kingdom 19,0 30
41 HELMHOLTZ ZENTRUM POTSDAM DEUTSCHESGEOFORSCHUNGSZENTRUM GFZ Germany 18,9 24
42 INSTITUTO DE MEDICINA MOLECULAR Portugal 18,5 19
43 INSTITUT JOZEF STEFAN Slovenia 18,3 60
44 UMWELTBUNDESAMT Germany 18,3 7
45 MEDICAL RESEARCH COUNCIL United Kingdom 17,6 36
46 INSTITUT CURIE France 17,0 25
47 CENTRO DE INVESTIGACIONES ENERGETICAS, MEDIOAMBIENTALES Y TECNOLOGICAS-CIEMAT Spain 16,8 31
48 FORSCHUNGSVERBUND BERLIN EV Germany 16,4 28
49 STICHTING NATIONAAL LUCHT- EN RUIMTEVAARTLABORATORIUM Netherlands 16,1 39
50 TURKIYE BILIMSEL VE TEKNOLOJIK ARASTIRMA KURUMU Turkey 15,8 44
Corda, Signed Grants cut-off date by 1/1/2017.

187
G.7. SMEs
Table 33 Top-50 SMEs in terms of EU funding
Rank Participant legal name Country EU contribution (EUR million)
Number of participations
1 GEANT LIMITED United Kingdom 64.6 8
2 SOLIDPOWER SPA Italy 12.7 5
3 SWEREA MEFOS AB Sweden 12.6 5
4 ITM POWER (TRADING) LIMITED United Kingdom 12.6 8
5 WELLO OY Finland 9.4 1
6 INNOVACIO I Research Organisations (REC)ERCA INDUSTRIAL I SOSTENIBLE SL Spain 9.2 13
7 ESTEYCO SAP Spain 8.9 3
8 ARTTIC France 8.3 22
9 ICLEI EUROPEAN SECRETARIAT GMBH (ICLEI EUROPASEKRETARIAT GMBH)* Germany 7.9 22
10 Centre for Process Innovation Limited United Kingdom 7.7 8
11 Kompetenzzentrum - Das Virtuelle Fahrzeug, Forschungsgesellschaft mbH Austria 7.4 23
12 BIO BASE EUROPE PILOT PLANT VZW Belgium 7.1 10
13 H2 Logic A/S Denmark 6.8 5
14 HS ORKA HF Iceland 6.6 2
15 SYMBIOFCELL SA France 6.3 3
16 EURICE EUROPEAN RESEARCH AND PROJECT OFFICE GMBH Germany 6.3 15
17 FUNDACION CENER-CIEMAT Spain 6.3 13
18 GEANT VERENIGING Netherlands 6.1 8
19 SPACE APPLICATIONS SERVICES NV Belgium 5.9 6
20 AVANTIUM CHEMICALS BV Netherlands 5.3 8
21 AMONETA DIAGNOSTICS France 5.0 1
22 TC LAND EXPRESSION SA France 5.0 1
23 Agendia NV Netherlands 5.0 2
24 ALACRIS THERANOSTICS GMBH Germany 4.9 4
25 NOVA INNOVATION LTD United Kingdom 4.8 3
26 INTELLIGENT ENERGY LIMITED United Kingdom 4.8 4
27 METGEN OY Finland 4.7 6
28 META Group S.R.L Italy 4.7 8
29 GREEN MARINE(UK)LTD United Kingdom 4.6 1
30 LATERIZI GAMBETTOLA SRL Italy 4.5 5
31 TRUST-IT SERVICES LIMITED United Kingdom 4.5 15
32 RADISENS DIAGNOSTICS LIMITED Ireland 4.5 1
33 GENERAL EQUIPMENT FOR MEDICAL IMAGING SA Spain 4.4 2
34 FUNDINGBOX ACCELERATOR SP ZOO Poland 4.4 1
35 OSLO MEDTECH FORENING Norway 4.4 2
36 NORDUNET A/S Denmark 4.4 4
37 TECHNIKON FORSCHUNGS- UND PLANUNGSGESELLSCHAFT MBH Austria 4.4 12
38 EryDel S.p.A. Italy 4.3 1
39 ECOLOGIC INSTITUT gemeinnützige GmbH Germany 4.3 9
40 PMD DEVICE SOLUTIONS LIMITED Ireland 4.3 1
41 ISTITUTO DI STUDI PER L'INTEGRAZIONE DEI SISTEMI SC Italy 4.3 13
42 IMMUNOVIA AB Sweden 4.2 1
43 P1VITAL LIMITED United Kingdom 4.1 2
44 NEMO HEALTHCARE BV Netherlands 4.1 2
45 HOLONIX SRL-SPIN OFF DEL POLITECNICO DI MILANO Italy 4.1 13
46 THE SCOTTISH ASSOCIATION FOR MARINESCIENCE LBG United Kingdom 4.1 9
47 EXUS SOFTWARE LTD United Kingdom 4.0 7
48 XLAB RAZVOJ PROGRAMSKE OPREME IN SVETOVANJE DOO Slovenia 4.0 13
49 UNION INTERNATIONALE DES TRANSPORTS PUBLICS Belgium 3.9 10
50 YOURIS.COM Belgium 3.9 14
Corda, Signed Grants cut-off date by 1/1/2017

188
H. THE COVERAGE OF CROSS-CUTTING ISSUES IN HORIZON 2020
H.1. Introduction
Regulation (EU) No 1291/2013 Annex 1 highlights that cross-cutting issues will be promoted
between specific objectives of the three priorities of Horizon 2020 as necessary to develop new
knowledge, key competences and major technological breakthroughs as well as translating
knowledge into economic and societal value. Furthermore, in many cases, interdisciplinary
solutions will have to be developed which cut across the multiple specific objectives of Horizon
2020. Horizon 2020 will provide incentives for actions dealing with such cross-cutting issues,
including by the efficient bundling of budgets.
According to Article 32 the interim evaluation shall assess the progress of the different parts of
Horizon 2020 against {…} the efficiency and use of resources, with particular attention to cross-
cutting issues and other elements referred to in Article 14(1). Article 14(1) provides an indicative
list of cross-cutting issues:
The development and application of key enabling and industrial technologies as well as future
and emerging technologies;
Areas relating to bridging from discovery to market application;
Interdisciplinary and cross-sectoral research and innovation;
Social and economic sciences and humanities;
Climate change and sustainable development;
Fostering the functioning and achievement of the ERA and of the flagship initiative
'Innovation Union';
Framework conditions in support of the flagship initiative "Innovation Union";
Contributing to all relevant Europe 2020 flagship initiatives (including the Digital Agenda for
Europe);
Widening participation across the Union in research and innovation and helping to close the
research and innovation divide in Europe;
International networks for excellent researchers and innovators such as European Cooperation
in Science and Technology (COST);
Cooperation with third countries;
Responsible research and innovation including gender;
SME involvement in research and innovation and broader private sector participation;
Enhancing the attractiveness of the research profession; and
Facilitating trans-national and cross-sector mobility of researchers.

189
Article 31 further states that the Commission monitoring activities as regards the implementation
of Horizon 2020, its specific programme and the activities of the EIT shall include information
on cross-cutting topics such as social and economic sciences and humanities, sustainability and
climate change, including information on the amount of climate related expenditure, SME
participation, private sector participation, gender equality, widening participation and progress
against performance indicators.
The following sections provide an in-depth analysis of each cross-cutting issue; including the
rationale, implementation, main achievements so far and lessons learnt. The table below provides
an overview of the indicators to monitor progress on the cross-cutting issues.
Figure 47 Overview of progress on coverage of cross-cutting issues in Horizon 2020
Cross cutting
issue
Indicator Progress
Contribution
to the
realisation of
the European
Research
Area
Annual number of research positions advertised
on EURAXESS Jobs
The number of research positions
advertised on EURAXESS Jobs
between 1 January and 31 December
2015 comprised 286,525 job
vacancies and 62,088 fellowships.
Number of national research infrastructures
networked (in the sense of being made
accessible to all researchers in Europe and
beyond through Union support)
National research infrastructures
networked thanks to Horizon 2020
support by the end of 2015 were 363.
The target by the end of Horizon
2020 is 900.
Number and share of Open Access articles
published in peer-reviewed journals
65% (CORDA)
Number of projects that make scientific data
accessible and re-usable and number of
scientific datasets made accessible and re-usable
So far, 65% of the projects covered
by the scope of the pilot (2014-2015
figures) participate in the pilot and
34.6% opt-out. Furthermore, outside
the areas covered by the pilot, a
further 11.9% of projects participate
on a voluntary (opt-in) basis.
Number of Multiannual Implementation Plans
adopted by Joint Programming Initiatives
In 2015 all 10 Joint Programming
Initiatives have adopted their
Multiannual Implementation Plan.
Widening
participation
Share of participations to EU-13 Member States 8.5%
Share of financial contribution to EU-13
Member States
4.4%
SME
participation
Percentage of EU financial contribution going
to SMEs (LEIT and SC)
TARGET: 20% of allocation
In LEIT and Societal Challenges, the
SMEs received 23.9% of the funding
and had 26.9% of the participation
fulfilling the 20% target of funding to
SMEs in LEIT and SC.141
SMEs had 16.0% of the total funding
of Horizon 2020 and had 20.7 % of
the participations
Percentage of EU financial contribution
committed through the SME instrument (LEIT
and SC)
5.6%142
141 Results based on data extracted from CORDA; compilation of budgets allocated to SMEs in the framework of Horizon 2020
grant agreements signed in 2014, 2015 and 2016 142 Results based on financial commitments under the different parts of the Horizon 2020 Work Programmes 2014-2015 and
2016-2017 contributing to the budget for the SME instrument call.

190
Social Science
and
Humanities
Percentage of SSH partners in selected projects
in all Horizon 2020 priorities and percentage of
EU financial contribution allocated to them
SSH partners comprised 26% of
partners in selected projects under
SSH-flagged topics, receiving 22% of
the budget within these projects.
Science and
Society
(Responsible
Research and
Innovation)
Percentage of projects where citizens, Civil
Society Organisation (CSOs) and other societal
actors contribute to the co-creation of scientific
agendas and scientific contents
In 11.0% of the projects.
Gender Percentage of women participants in Horizon
2020 projects.
40.3%
Percentage of women coordinators in Horizon
2020.
31% of the coordinators of the
projects are women
Percentage of women in EC advisory groups
expert groups, evaluation panels, individual
experts, etc.
53% of the members of Advisory
Groups in 2016 were women
36.7% of the evaluators were women.
Percentage of projects taking into account the
gender dimension in research and innovation
content.
NA
International
Cooperation
Share of Third Country participations in
collaborative projects143
.
Third countries had 2.5% of the
participations (for all Horizon 2020
projects third countries had 1.9% of
the participations)
Share of EU financial contribution attributed to
Third Country participants of collaborative
projects.
Third countries received 0.8% of the
funding in collaborative projects
(0.6% of the funding of all Horizon
2020 projects)
Share of budget of topics in the Work
Programme 2014-15 mentioning at least one
Third Country or region.
23.3%
Sustainable
development
Share of EU financial contribution that is
climate related in Horizon 2020 (EUR)
Target: 35%
27.0%
Share of EU financial contribution that is
sustainability related in Horizon 2020 (EUR)
Target: 60%
53.3%
Share of EU financial contribution that is
biodiversity related in Horizon 2020 (EUR) (no
target):
4.0%
Bridging
from
discovery to
market
application
Share of projects and EU financial contribution
allocated to innovation actions in Horizon 2020.
17.2%
Within the innovation actions, share of EU
financial contribution focussed on
demonstration and first-of-a-kind activities.
86.5% was focussed on
demonstration and 7.7% of first of a
kind activity.
Digital
Agenda
Share of EU financial contribution that is ICT
Research & Innovation related in Horizon 2020
(EUR)
30.0%
Private sector
participation
Percentage of Horizon 2020 beneficiaries from
the private for profit sector
62.2% of the beneficiaries came from
the private sector and represented
33.2% of the participations.
Share of EU financial contribution going to
private for profit entities (LEIT and Societal
Challenges).
Private sector entities received 42.8%
LEIT and SC and 27.7% in all of
Horizon 2020.
Source: CORDA, 01/01/2017 cut-off date
143 "Collaborative" projects refer to all Horizon 2020 projects apart from ERC, SME Instrument, MSCA, projects under "Access
to Risk Finance", JRC and EIT.

191
H.2. The development and application of key enabling and industrial technologies as
well as future and emerging technologies
An in-depth analysis of the development and application of key enabling and industrial
technologies as well as future and emerging technologies is provided under the Annexes 2.E, 2.F
2.G and 2.B related to the specific objectives Leadership in Enabling and Industrial Technologies
(LEIT-ICT, LEIT-NMBP, LEIT-Space) and Future and Emerging Technologies (FET).
H.3. Bridging from discovery to market application
H.3.1. Overview
The Europe 2020 strategy focusses on smart, sustainable and inclusive growth, highlighting the
role of research and innovation as key drivers. Horizon 2020 puts a specific focus on innovation
under its second and third pillars (Industrial Leadership and Societal Challenges).
According to Regulation (EU) No 1291/2013 linkages and interfaces shall be implemented
across and within the priorities of Horizon 2020. Particular attention shall be paid in this
respect to {…} areas relating to bridging from discovery to market application. {…} Bridging
actions throughout Horizon 2020 are aimed at bringing discovery to market application, leading
to exploitation and commercialisation of ideas whenever appropriate. The actions should be
based on a broad innovation concept and stimulate cross-sectoral innovation.
H.3.1. Rationale
Previous framework programmes were effective in strengthening scientific excellence, in
involving leading international scientific and technological talent, and in fostering increased
Europe-wide research and innovation collaboration, but less effective in taking innovative
products to market. Horizon 2020 also supports innovation to help discoveries make it into
applications. The term "innovation" means the introduction to the market of new or improved
products, services, processes, and solutions. These activities support the market uptake and
should lead to job creation, economic growth and social benefits.
H.3.2. Implementation
The programme is based on a broad innovation concept which is not limited to the development
of new products and services on the basis of scientific and technological results, but which also
incorporates the use of existing technologies in novel applications, continuous improvement,
non-technological and social innovation. It includes activities closer to the market and to end-
users (e.g. prototyping, testing, demonstrating, piloting, product validation and market
replication) and demand-side approaches (such as pre-commercial procurement and procurement
of innovative solutions). It deploys new instruments for this: innovation actions, innovation
procurement and inducement prizes.
Innovation actions: these actions focus on demonstrations, tests and other activities close to
applications. These innovation actions can build on the results of previous projects. They can
also complement research and innovation actions that contain more research. These innovation
actions are used for areas where the scientific and technology insights are available and the focus
shifts to turning these into applications.
Innovative procurement: the pace of adoption of innovations in the public sector is slow
despite the potential of innovation procurement to modernize the public sector (public

192
procurement accounts for approximately 14% of EU GDP144
). Companies – in particular SMEs -
identify the lack of first buyers as the number one barrier for company growth. Innovative
procurement has the ability to improve the quality and efficiency of public services whilst also
opening up market opportunities for innovative companies.
Inducement prizes: R&I funding often follows the path of technological innovation through
incremental steps. Horizon 2020 introduced Prizes to support open innovation. Prizes are a 'test-
validate-scale' approach that brings together new-to-industry players and small players that may
pursue more radically new concepts than large, institutionalized contestants. Inducement prizes
offer an incentive by mobilising new talents and engaging new solver communities around a
specific challenge. Smart prize designs can activate this huge potential and leverage private
investment into R&I, often manifold of the prize offering. Prizes are a prime example of 'value
for money' as inducement prizes are only awarded based on the achievement of the target set,
solving the challenge defined.
Other modalities are also expected to improve the uptake of results:
The Innovation Radar: external monitoring experts with innovation and market
knowledge assess the innovations and innovators coming out of Horizon 2020. They
register their assessment in structured data which allows for early identification of high
potential innovations and innovators in projects. This also may provide insights on
support needs of individual innovators to get their innovations to the market.
Additional tailored support for projects145
through a consultancy service. It assists
projects by analysing their key exploitable results and by developing strategies for their
exploitation. The services are tailored to the projects' needs and levels of maturity (such
as an exploitation strategy seminar or the development of a business plan).
The InnovFin instruments to provide investment for taking results to the market,
implemented by EIF and by private investors. Companies taking part in the SME
instrument are informed about these opportunities, can get coaching and are offered
sessions to pitch for investors.
These support measures are expected to help Horizon 2020 deliver economic impact by bridging
the gap between scientific discoveries and their market application.
H.3.3. Achievements so far
Innovation Actions (IA): at the beginning of Horizon 2020, no targets were set for the share of
Innovation Actions close to the market. At the end of 2016, 6.2% of the signed grants and 17.2%
of the funding is allocated to these (Excellent Science does not have IAs; within the other two
pillars Industrial leadership and Societal Challenges, 10.2% of the projects are IAs with 23.6% of
the EU contribution). Especially in the programme parts related to Energy, Security, the Fast
Track to Innovation and the SME instrument, innovation actions are often used. Under the
Societal Challenges of Health and ‘Europe in a changing world’ which are more research-
oriented, their share is much lower..
144 Public procurement for Innovation – Good Practices and Strategies, OECD, 2016:
http://www.oecd.org/gov/ethics/Procurement-Innovation-Practices-Strategies.pdf 145 Applied for projects in nano- and material technologies, energy, and in one action that covers in potential all parts of FP7 and
Horizon 2020. A private consultancy provides the support.

193
Currently, 87% of the funding within innovation actions is allocated to demonstration actions
and 8% to first-of-a-kind activities146
. This shows that Horizon 2020 is moving towards higher
Technology Readiness Levels (TRLs).
Table 34 Percentage of projects and EU financial contribution allocated to Innovation
Actions (IA) per Horizon 2020 programme part
Source: CORDA data, extraction 1 January 2017
Looking into the proposal texts of 227 innovation actions that started in 2015, a study147
identified three categories of projects:
'Pioneering' projects: scoring high on technological novelty, market scope and
innovation readiness, but low on ecosystem embeddedness (64 projects out of the 227
projects). They focus on breakthrough technological results that may create markets.
Pioneering projects involve relatively more private companies, esp. SMEs, and research
institutions.
'Diffusing' projects: emphasising ecosystem embeddedness and scoring lower on the
other three aspects (58 projects). They aim at the diffusion and exploitation of the
innovative solution in the ecosystem. The diffusing projects involve less companies and
more public bodies.
146 The remaining 5% of the projects are not classified. 147 Grimpe, C. et al., Study on innovation in Horizon 2020 Innovation Actions, EC, 2017. For this study, 227 Innovation Actions
were selected that started in 2015, most of them in the PPPs such as Ecsel (LEIT-ICT), Clean Sky (Societal Challenge 4),
Factories of the Future (LEIT-NMBP), Energy Efficient Buildings (LEIT-NMBP), Clean Vehicle (Societal Challenge 4), but also
in other calls. The texts of the granted projects were analysed using content analysis methodology, based on keywords that
indicate four innovation aspects: technological novelty, market scope, ecosystem embeddedness and innovation readiness.

194
'Sustaining' projects: the remaining 105 projects pay only modest attention to each of the
four aspects. They are dominated by higher education institutions.
Whereas it is still too early to characterise these innovation actions and their impacts, these
initial findings indicate that a quarter of innovation actions have a disruptive, market-creating
potential, and that companies and research institutions play a leading role in these initiatives.
Looking closer at Horizon 2020 initiatives in the field of pre-commercial public procurement
(PCP) and public procurement for innovation (PPI), both in 2014 and 2015, some topics
supporting the implementation of innovation procurement did not receive eligible proposals.
However, in 2015, six projects were signed that are implemented through PCP or PPI with a total
EC contribution of EUR 18.5 million. Three additional projects submitted under a deadline in
2015 were signed in the first semester of 2016 with an overall EC contribution of EUR 7.9
million.
As regards inducement and recognition prizes, the first ones were launched in 2015: five
inducement prizes with a budget of EUR 6 million148
together with three recognition prizes with
an overall budget of EUR 1.33 million149
were selected. Up to the end of 2016, 12 Horizon
inducement prizes have been launched and six more will follow in 2017. All prizes are 'best-in-
class prizes' which reward contestants that best meet the predefined objective. They target
challenges such as Sharing of Spectrum, Breaking the Optical Barrier, Aging population, Mother
and child health, CO2 reuse, Clean car engines, Cyber security etc.150
The Fast Track to Innovation (FTI) was launched as a pilot action in 2015, aiming at bringing
close-to-market innovation by consortia to the market. It supports innovation actions under
Industrial Leadership and the Societal Challenges, relating to any technology field, on the basis
of a continuously open call (bottom-up). The pilot action had seen a high number of submitted
proposals (887) that requested an EU contribution mounting to EUR 1.7 billion while the budget
was EUR 100 million. After evaluation, 181 proposals scored above threshold and 46 proposals
were finally retained (average amount of EC budget allocated per grant: EUR 2.1 million).
Participation in 2015 in the FTI shows that participation from the private sector (76.7%
budgetwise) and SMEs (48.0%) is high. Close to 60% of the FTI project coordinators are SMEs.
Other indicators signalling the bridging efforts from discovery to market:
93% of all projects in Horizon 2020 pillars 2 (Industrial Leadership) and 3 (Societal
Challenges) has one or more participating businesses, which indicates a market interest;
Innovation Radar: at the end of 2016, 800 FP7 and over 150 Horizon 2020 collaborative
projects in the ICT area were monitored and assessed, with a pilot going on to extend this
further to non-ICT themes of Horizon 2020. The 150 Horizon 2020 projects are expected
to deliver over 300 distinct innovations;
The additional support for recognising exploitable results and developing measures for
their exploitation has been applied to 355 projects in the nano- and material technologies.
A second round that would cover all sorts of projects is being prepared for ca. 250
projects by April 2018;
148 There has been no budget executed yet. 149 EUR 0.15 million of the budget has been executed so far. 150 http://ec.europa.eu/research/horizonprize/index.cfm?lg=en&pg=prizes

195
Out of the 10,000 companies taking part in Horizon 2020, in the first three years 225
benefitted from the financial instruments in InnovFin for investments in scaling up151
.
Out of the 1,640 SMEs taking part in the SME instrument, 134 companies secured
venture capital recently, out of which 31 during or after the project152
. These numbers are
expected to increase in the years to come when more projects start delivering results.
Also in the ‘Excellent Science’ pillar of Horizon 2020 innovation is targeted. The
European Research Council (ERC) has funded around 400 'proof of concept' projects that
bring an invention towards application. The first 140 were analysed which showed that
42% use a spin-off company (existing, new or planned) to take the results to the market.
Out of 2 460 distinct beneficiaries of the Marie Skłodowska Curie Actions (MSCA),
more than 40% are private for profit organisations. Although they tend to participate in
fewer projects than universities they account for 16% of all participations, i.e. the number
of projects in which they are beneficiaries. Furthermore, around 45% of all MSCA
fellows benefit from some form of cross-sectoral mobility out of or into an academic
setting.
H.3.4. Lessons learnt/Areas for improvement
In the first years of Horizon 2020, experience was gained with how to evoke innovation-oriented
projects (innovation actions, procurement projects, prizes) and how to link best to follow-up
investment. An area for improvement is monitoring the results of these projects. Quantitative
indicators like science publications and patents have to be complemented by other indicators
such as the number of spin-off companies, the realised or expected additional employment and
turnover, venture capital raised for scaling up, and examples of realised impacts on policies,
markets, environment and society.
H.4. Interdisciplinary and cross-sectoral research and innovation
H.4.1. Overview
According to Regulation (EU) No 1291/2013 linkages and interfaces shall be implemented
across and within the priorities of Horizon 2020. Particular attention shall be paid in this
respect to {…} interdisciplinary and cross-sectoral research and innovation. {…} In many
cases, interdisciplinary solutions will have to be developed which cut across the multiple specific
objectives of Horizon 2020.
The general objective of Framework programmes is to contribute to building a society and an
economy based on knowledge and innovation across the EU and the world, by leveraging
additional research, development and innovation funding. Interdisciplinarity research and cross-
sectoral collaboration push fields forward and accelerate scientific innovation and discovery
through research breakthroughs that address societal problems and foster innovation.
H.4.2. Rationale
Interdisciplinarity research integrates information, data, techniques and perspectives from two or
more disciplines of specialised knowledge to solve problems whose solutions are beyond the
scope of a single discipline or area of research practice.
151 Source : European Investment Bank, data per January 2017. 152 Source: www.ventureradar.com

196
Higher or secondary
education (HES)
Private for profit
(excluding education) (PRC)
Public body
(excluding research &
education) (PUB)
Research organisations
(REC)
Other (OTH)
Part of the FP7 ex post evaluation stated that FP7 "was effective in fostering inter-disciplinary
research and increased Europe-wide research and innovation collaboration and networking….
FP7 reinforced a new mode of collaboration and an open innovation framework". This was
achieved through a more decentralised approach to the design, structure and direction of projects
across the ERC, JTIs and the EIT.
H.4.3. Achievements so far
H.4.3.1. Collaboration between types of institutions
When comparing the collaborations of different types of institutions in Horizon 2020 and FP7,
the private for profit sector (PRC) appears as the main collaborative partner of academia (HES)
as opposed to research organisations (RECs) in FP7. As can be seen from the figure below the
main collaborations in Horizon 2020 occur between the higher education sector and private firms
(2355 collaborative projects), the higher education sector and research organisations (2289
collaborative projects) and between the private-for-profit sector and research organisations (2169
collaborative projects). Participants classified in the category ‘Other’, which include Civil
Society Organisations, collaborate more with the private sector (1021 collaborative projects)
than with research organisations (1019 collaborative projects) and with the higher or secondary
education sector (966 collaborative projects), while the public bodies are the least preferred hub
(604 collaborative projects).
Figure 48 Number of collaborative projects between different types of institutions in FP7
and Horizon 2020
FP7
Horizon 2020
Source: JRC Technology Innovation Monitoring. Cut-off date: 01/01/2017, Graph: European Commission – DG
RTD
H.4.3.1. Collaboration between industry sectors
The NACE sector classification of the companies participating in Horizon 2020 is used to
examine the collaborations between companies from different industry sectors. As detailed in
Part O of this annex, most of the Horizon 2020 companies are from the Professional, Scientific
and Technical activities sector (33 %), the Manufacturing sector (27 %) and the Information and
communication sector (17 %). However while the overall sector of Wholesale trade and retail
trade represent 5% of the companies in Horizon 2020, the sub-sector of wholesale trade is the
main sector when looking at collaborative projects only (749 collaborative projects), which

197
illustrates the interconnected nature of the sector (i.e. connections with producers, industrial
demand and retail trade from various sectors). The digital sector is strongly represented in
collaborative networks, with computer programming, consultancy and related activities (467
collaborative projects) and the manufacture of computer, electronic and optical products (385
collaborative projects) being respectively the second and third sectors in terms of collaborative
projects.
Collaborations between the wholesale trade sector and the digital sector are also the most
recurrent type of inter-industry collaborations in Horizon 2020.
Figure 49 Horizon 2020 Top 10 industry sectors by number of collaborative projects
Source: JRC Technology Innovation Monitoring. Cut-off date: 01/01/2017, Graph: European Commission, DG RTD
Figure 50 Industrial inter-sector collaboration networks in Horizon 2020
Source: JRC Technology Innovation Monitoring. Cut-off date: 01/01/2017, Graph: European Commission, DG RTD
749
467
385
382
308
263
258
247
186
177
0 100 200 300 400 500 600 700 800
Wholesale trade, except of motor vehicles and motorcycles
Computer programming, consultancy and related activities
Manufacture of computer, electronic and optical products
Architectural and engineering activities; technical testing and analysis
Scientific research and development
Retail trade, except of motor vehicles and motorcycles
Activities of head offices; management consultancy activities
Manufacture of machinery and equipment n.e.c.
Manufacture of fabricated metal products, except machinery and…
Other professional, scientific and technical activities

198
H.4.3.2. Collaborations between academic fields based on projects’ participations
Taking a closer look at how knowledge circulates between academic fields in Horizon 2020, an
analysis of the projects’ focus was carried out. Projects were classified according to the Scopus
bibliographic database which includes scientific, technical, medical, and social sciences
(including arts and humanities). The classification was done based on text mining of the projects'
description and machine learning performed by the Joint Research Centre, the science and
knowledge service of the European Commission.
Social sciences lead the field in terms of collaborative projects that involve at least one
representative of the field, with business, management and accounting scoring very high as well.
They are followed close behind by the STEM field with Computer Science, Medicine,
Engineering and Physics and Astronomy all containing at least 1000 collaborative projects in
Horizon 2020. Of note is the fact that sciences related to the medical field such as Immunology
and Microbiology, Chemical Engineering, Dentistry, Veterinary, Nursing and other Health
Professions occupy 6 of the last 7 positions in the ranking of fields in terms of number of
collaborative projects.
Noticeably, the disciplines of Computer Science and Engineering are the most connected within
Horizon 2020 projects.
Figure 51 Main academic fields represented in Horizon 2020 collaborative projects, based
on projects’ keywords, by number of projects
Source: JRC Technology Innovation Monitoring. Cut-off date: 01/01/2017, Graph: European Commission, DG RTD
0 500 1000 1500 2000
33 | Social Sciences
17 | Computer Science
14 | Business, Management and Accounting
27 | Medicine
22 | Engineering
31 | Physics and Astronomy
21 | Energy
13 | Biochemistry, Genetics and Molecular Biology
23 | Environmental Science
19 | Earth and Planetary Sciences
25 | Materials Science
11 | Agricultural and Biological Sciences
20 | Economics, Econometrics and Finance
28 | Neuroscience
30 | Pharmacology, Toxicology and Pharmaceutics(all)
32 | Psychology
16 | Chemistry
12 | Arts and Humanities
26 | Mathematics
24 | Immunology and Microbiology
15 | Chemical Engineering
18 | Decision Sciences
29 | Nursing
36 | Health Professions
34 | Veterinary
35 | Dentistry

199
Figure 52 Collaboration networks in Horizon 2020 projects between different academic
fields, based on projects’ keywords, by number of projects
Source: JRC Technology Innovation Monitoring. Cut-off date: 01/01/2017, Graph: European Commission, DG RTD
H.4.3.3. Collaborations between academic fields based on publications
Interdisciplinary publications accounted for 7.45% of total EU-28 publications in FP7 while they
represent 7.55% of publications in Horizon 2020 (based on publications during the first three
years of both Programmes). EU-15 and EU-13 shares were respectively 7.53% and 5.87% in FP7
and 7.29% and 10.19% in Horizon 2020. In both Programmes the share of interdisciplinary
publications was the lowest for third countries (approximately 6%). Overall, interdisciplinarity is
noticeably reinforced in Horizon 2020, especially for EU-13 and Associated countries. In
comparison with publications that were not funded by the Framework Programmes, the
proportion of interdisciplinary publications is similar for EU countries.
For both framework programmes, the field weighted citation impact of interdisciplinary
publications is high, and higher than for non-FP publications.
H.4.3.4. Examples of interdisciplinary projects
A case study of DG Connect153
analyses the implementation and experiences of interdisciplinary
collaborative research in Horizon 2020, and exemplifies the lessons learnt so far based on the
achievements of selected FET projects. Overall, major scientific advances in research have come
from the interstices and synergies among different disciplines (e.g. molecular biology,
153 CARSA-Annex XII on Interdisciplinarity Research- Support study for the Interim Evaluation of Horizon 2020- DG
CONNECT Activities.

200
psychology, nanotechnology)154
and this was possible thanks to the complementarities of
interdisciplinary research collaboration. The results achieved with the contribution of
interdisciplinary research clearly show that the complementarity of the different disciplines can
lead to innovative and novel solutions beyond traditional research paradigms. FET has always
been welcomed interdisciplinary research. In this sense, recent Horizon 2020 FET projects
(including both FET-open and FET-proactive) are significant examples of how complementarity
plays a key role and what kind of achievements have been made through the contribution of
interdisciplinary research.
IBSEN155
(Bridging the gap: from Individual Behaviour to the Socio-tEchnical Man) is a FET-
open research project that intends to provide a real breakthrough by creating a repertoire of
human behaviours in large (more than 1000 people) structured groups using controlled
experiments. In particular, the project builds on a novel experimental protocol, software and
analytical tools to allow large scale experimentations. To achieve these results, IBSEN requires a
high-degree of interdisciplinary which is reflected in its team composition, consisting of
physicists, economists, social psychologists, and computer scientists. This variety will allow to
create a technology providing a basis for socio-economic simulations that are expected to
radically change many fields, from robotics to economics, with technological and societal
impacts, including policy-making in socially pressing issues.
CONQUER156
(Contrast by Quadrupole Enhanced Relaxation) is a highly interdisciplinary
project combining expertise in quantum physics, chemical and biomedical engineering, material
characterisation as well as nano-toxicology. In particular, the combination of quantum-
mechanics and cutting-edge imaging technologies has the potential to create Molecular Imaging
solutions with significant impact: the radically new diagnostic and therapeutic treatments
developed in the project are key elements to achieve the healthy well-being of European citizens.
The purpose of 2D-INK157
(Redesigning 2D Materials for the Formulation of Semiconducting
Inks) is to develop inks of novel 2D semiconducting materials for low-cost large-area fabrication
processes on insulating substrates through a new methodology, which will exceed the properties
of state-of-the-art graphene- and graphene oxide based inks. The inherent high-risk of 2D-INK is
countered by a strongly interdisciplinary research team composed of 9 partners with experience
in their corresponding fields and with different highly complementary backgrounds: only this
synergy can address the challenges of the multiple research and innovation aspects of 2D-INK.
Thanks to this interdisciplinary, the project shows the potential to revolutionize research on 2D
semiconducting materials, since it enables the applications of these materials over different
scientific and technological disciplines, such as electronics, sensing, photonics, energy storage
and conversion and spintronic.
NuClock158
(Towards a nuclear clock with Thorium-229) is developing a novel type of clock,
based on a unique nuclear transition in Thorium-229, which will be largely inert to perturbations
and holds the potential to outperform existing atomic clocks in terms of precision. The next-
generation satellite-based navigation technology and other precision timing applications will
greatly benefit from more precise and robust clocks. Research related to this specific topic
154 Nigel Gilbert, University of Surrey, Thrills and spills in interdisciplinary research: the case of Future and Emerging
Technologies in Horizon 2020; https://www.ukro.ac.uk/aboutukro/Documents/150618_fet.pdf. 155 http://ibsen-h2020.eu/. 156 http://cordis.europa.eu/project/rcn/196966_en.html 157 http://www.2d-ink.eu/ 158 http://www.nuclock.eu/

201
demands supreme expertise in a variety of fields, encompassing nuclear and atomic physics,
quantum optics, metrology, as well as detector- and laser-technology: in NuClock, the
interdisciplinary consortium precisely matches all these requirements.
GOAL-Robots159
(Goal-based Open-ended Autonomous Learning Robots) intends to develop a
new paradigm to build open-ended learning robots, addressing pressing societal needs. The
interdisciplinary project consortium consists of leading international roboticists, computational
modellers and developmental psychologists, working with complementary methods. This
interdisciplinary approach will allow to greatly advance the understanding of the fundamental
principles of open-ended learning and to produce a breakthrough in the field of autonomous
robotics, by creating robots that can autonomously accumulate complex skills and knowledge in
a real open-ended way.
The aim of Lumiblast160
(A paradigm shift in cancer therapy – using mitochondria-powered
chemiluminescence to non-invasively treat inaccessible tumours) is to establish a breakthrough
technology by providing proof-of-concept in extracellular systems, particular cancer cell cultures
and animal models, with the vision to advance to a different treatment for cancers of various
origins in the next years. To this end, the project relies on a concerted interdisciplinary action
involving expertise in various fields: photo-medicine, synthetic chemistry, photo-chemistry,
pharmaceutical formulation, ROS-activated luminescence.
LiRichFCC161
(A new class of powerful materials for electrochemical energy storage: Lithium-
rich oxyfluorides with cubic dense packing) is based on a long-term vision to develop a novel
class of materials into practical use, involving foundational aspects in S&T with breakthrough
character, high novelty and risk. Indeed, the project intends to explore and optimise possible
compositions, synthesis methods, structural properties and dynamics of Li-rich FCC materials
through a broad interdisciplinary approach, involving predictive computational work, advanced
chemical synthesis and high-end characterisation. This will lead to a paradigm change in the
design of battery materials and unexpected effective mechanisms: it could revolutionise the use
of batteries in applications involving a need for supplying large amounts of energy and power
from small spaces.
The FET-Proactive project ESCAPE162
(Energy-efficient SCalable Algorithms for weather
Prediction at Exascale) aims to develop world-class, extreme-scale computing capabilities for
European operational numerical weather prediction (NWP) and future climate models, based on
a holistic understanding of energy-efficiency for extreme-scale applications using heterogeneous
architectures, accelerators and special compute units. In this way, the project will provide the
necessary means to take a huge step forward in weather and climate modelling, through
interdisciplinary research on energy-efficient high-performance computing and the combination
of complementary skills of all project partners, including global NWP and high-performance
computing centres.
Based on the evidence collected, the main success factor of interdisciplinary collaboration seems
to lie in the fact that it involves interactions between disciplines with focus on major real-life
problems and practical solutions. Such an approach implies new forms of knowledge and
159 http://cordis.europa.eu/project/rcn/203543_en.html 160 http://cordis.europa.eu/project/rcn/203541_en.html 161 http://cordis.europa.eu/project/rcn/203539_en.html 162 http://cordis.europa.eu/project/rcn/197542_en.html

202
research that go beyond the bounds of validity of existing disciplines and are more suitable for
specific inherently complex problems.
H.4.4. Lessons learnt/Areas for improvement
Horizon 2020 projects illustrate how the knowledge triangle of research, education and
innovation is deeply embedded in the programme, with significant numbers of collaborations
being observed between the academic sector, private companies and research organisations but
also with the public sector. The private for profit sector appears as the main collaborative partner
of academia as opposed to research organisations in FP7.
In terms of inter-industry collaborations of companies, the wholesale trade sector and the digital
sector appear to collaborate more with other sectors. Computer sciences and engineering are at
the core of the interdisciplinary collaborations within projects.
Interdisciplinarity seems to be slightly reinforced in Horizon 2020 compared to FP7, especially
for EU-13 and Associated countries. Furthermore, the research quality of these publications, as
proxied by the Field Weighted Citation Index, is particularly high in the Framework
Programmes.
H.5. Social and economic sciences and humanities
H.5.1. Overview
Social sciences and humanities research is integrated into each of the priorities of Horizon 2020
and each of the specific objectives and shall contribute to the evidence base for policy making at
international, Union, national, regional and local level. In relation to societal challenges, social
sciences and humanities (SSH) are mainstreamed as an essential element of the activities needed
to tackle each of the societal challenges to enhance their impact.
H.5.2. Rationale
The approach of integrating the SSH as a cross-cutting issue has meant that inter-disciplinary
cooperation is dealt with in a different way as compared with FP7. A strong network of SSH
liaison officers has thus been established across all Societal Challenges and LEIT parts of the
programme to facilitate this task. It also requires applicants to submit proposals and build
consortia that transcend disciplinary and sectorial boundaries, bringing together scholars from
SSH and from life and physical sciences, technology, engineering and mathematics (STEM) as
well as researchers and practitioners across these fields.
This way of cooperating across sectors and disciplines is fairly new to many researchers in
Europe while others have worked in such a way for a long time already. It is clear that both
inside the European Commission and amongst stakeholders and potential applicants such as
universities, research institutes and companies it will take some time before everyone is fully
aware of the principle of interdisciplinarity and willing to somewhat change their practice.
The challenge approach with the principle of integrating SSH aspects wherever relevant has
gradually gained more support since the start of Horizon 2020. Inputs from all the different
Expert Advisory Groups across Horizon 2020 on which direction the programme parts should
take certainly confirm that SSH aspects, and perhaps especially economic, are essential for the
programme to deliver concrete societal impact. Amongst many of these experts there seems to be

203
an agreement that the need of interdisciplinary solutions to current challenges faced by society
has never been more obvious.
H.5.3. Implementation
Every year a monitoring report of the SSH Integration in Horizon 2020 is carried out by the
European Commission (DG RTD). The table below shows the key findings of the reports based
on SSH flagged topics in 2014 and 2015, including comparisons between the two. There are
quite large differences between the programme parts both in quantitative and qualitative terms. It
is to be noted however that due to the focus areas which combine funding from several Societal
Challenges and the LEITs these numbers do not present the entire picture.
The second monitoring report assesses to what extent the 2015 calls for proposals under the
Societal Challenges and the Industrial Leadership priorities have delivered on the integration of
SSH as a cross-cutting issue. It provides data on the budget dedicated to SSH activities, the share
of SSH partners as well as their country affiliation and type of activity, the prevalence of various
disciplines and the overall quality of integration.
As data collection for the report progressed, the lessons learnt have been gradually fed into the
preparation of the 2016-17 Work Programme. In particular, corrective measures have been
identified that could improve the qualitative integration of SSH in upcoming and future Horizon
2020 calls. The report also provides a baseline against which performance in terms of
quantitative integration of SSH can be benchmarked in the upcoming years of Horizon 2020.
Table 35 Budget allocated to SSH flagged topics and to SSH partners (EUR million) 2014 -
2015
Programme part Number of SSH
flagged topics and
other actions (2014-
2017)
Share of SSH partners in
the SSH flagged
topics (2014 and 2015
projects)
Share of budget going to
SSH partners from the SSH
flagged topics (2014 and
2015 projects)
Societal Challenge 1 37 19% 14%
Societal Challenge 2 83 22% 22%
Societal Challenge 3 43 19% 19%
Societal Challenge 4 60 18% 16%
Societal Challenge 5 44 11% 11%
Societal Challenge 6 90 79% 75%
Societal Challenge 7 34 43% 35%
LEIT-ICT 22 20% 14%
LEIT-NMBP 24 22% 10%
LEIT-SPACE 4 8% 6%
Total 441 26% 22%
Source: European Commission, DG RTD analysis
H.5.4. Achievements so far
Societal Challenge 6 and its calls and topics attract many of the SSH disciplines. The 2015 calls
focused on social cohesion, the young generation, the EU crisis, social innovation and cultural
heritage, all fields being relevant for and demanding contributions from SSH disciplines. Other
Societal Challenges have also flagged many SSH topics. In the 2014-15 Work Programme 37%

204
of the topics have been flagged for SSH in the Societal Challenges pillar and the Industrial
Leadership pillar. For WP 2016-17 this increased to 41%.
Regarding the variety of SSH disciplines in the funded projects, contributions from economics,
sociology, political science and public administration are well integrated while many other SSH
disciplines are underrepresented. This is especially the case for geography/demography and
philosophy/anthropology. The low participation of the humanities and the arts remains a
challenge which has to be addressed.
According to the two SSH reports on SSH integration, EUR 433 million went to SSH partners in
SSH flagged topics. Overall, the share of budget going to SSH partners amounted to 22% of the
estimated total budget for the SSH flagged topics. While in projects funded under SSH flagged
topics exclusively SSH partners account for 32% of the total number of consortia partners. In
terms of countries represented, the SSH partners and coordinators in projects flagged as SSH
relevant come predominantly from a group of 5-6 Member States. This concentration is not
surprising that due to, for example, the size of the country and number of researchers in the field
some countries do have comparative advantages. However more efforts should be done to see
how this situation compares to for example programme parts such as the societal challenges.
The quality of SSH integration in 2014-15 – according to the methodology used in the reports –
is highly uneven across projects. Almost half of the projects funded under SSH flagged topics
show good or fair integration of SSH in terms of share of partners, budget allocated to them, and
variety of disciplines involved. In terms of financial contributions to signed grants, most funding
to SSH relevant projects are to be found in SC1 "Health, demographic change and well-being"
(EUR 308 million to 72 projects) followed by SC5 "Climate action, environment, resource
efficiency and raw materials" (EUR 304 million allocated to 54 projects) and SC6 "Europe in a
changing world - Inclusive, innovative and reflecting societies" (EUR 228 million to 92
projects).163
H.5.5. Lessons learnt/Areas for improvement
Important work has already been done since the launch of Horizon 2020. Almost half of the
projects selected for funding under SSH flagged topics show a good or fair integration of SSH in
terms of participation and budget. Call drafters in the different services of the Commission have
become more familiar with social sciences and humanities and what researchers and innovators
from these disciplines can contribute with. Many SSH scholars in Europe say that there were
more interesting interdisciplinary topics in 2016-17 than was the case in 2014-15. However,
there is still room for improvement, notably when it comes to the qualitative integration of the
SSH.
A weakness of the two first reports has been that the comparison between different programme
parts when it comes to for example the number of SSH partners - and budget going to SSH - has
not fully taken into account focus areas cutting across different societal challenges and LEITs.
As the reports show some disciplines are well represented but others are not. This is particularly
the case for the humanities and the arts. This may have different explanations. Partly it may be
163 One issue with the monitoring report to track the progress of the SSH integration across societal challenges and the LEITs is
the existence of Focus areas (FA). Topics in the FA are attributed to the WP part where the FA call is located, rather than to the
WP part funding the individual topics. This partly explains the differences between the programme parts. In the case of SC5 for
example 11% of partners and budget within SSH flagged topics go to the SSH community is quite low, but also a bit misleading
as SC5 contributed with funding to other topics for example in SC2 and SC3.

205
because the relevant research community is not fully aware of the opportunities Horizon 2020
present for these disciplines.
Box 1 Examples of SSH relevant Horizon 2020 projects
Project NANORESTART: NANOmaterials
for the REStoration of works of ART
Budget: EUR 7.9 Million ; Type of action:
IA; WP Part: LEIT; Call: Nanotechnologies
& Advanced Materials
http://www.nanorestart.eu
In BBC Science in Action:
http://www.bbc.co.uk/programmes/p03zzgnj
NANORESTART will develop nanomaterials to ensure long
term protection and security of modern and contemporary
cultural heritage, taking into account environmental and human
risks, feasibility and materials costs. NANORESTART brings
together specialists in chemistry, materials science, art
conservation, art restoration as well as museum curators and
cultural heritage educators. They will priorities and assess the
new materials on modern and contemporary artefacts in urgent
need of conservation, then disseminate the knowledge among
conservators on a worldwide perspective.
Project LIFEPATH: Life course pathways underlying social
differences in healthy ageing
Budget: EUR 6 Million; Type of action: RIA;
WP Part: SC1 Health; Call: Personalised
Healthcare
http://www.lifepathproject.eu/
There are significant differences in the biological pathways to
aging among individuals. In particular, healthy ageing, quality
of life and life expectancy differ significantly between
individuals of different socioeconomic groups.
To understand what determines this variation, LIFEPATH
integrates biology, biostatistics, epidemiology and epigenomic
approaches with social science approaches (sociology,
economics and public health policies).
H.6. Sustainable development, climate change and biodiversity
H.6.1. Overview
The EU has committed to collect and publish the Horizon 2020 expenditure on sustainable
development and climate change. The whole programme is accordingly indeed expected to
invest 60% of its overall budget in sustainable development and 35% in climate action.
H.6.2. Rationale
Regulation 1291/2013 establishing Horizon 2020164
requires the tracking of and reporting on
sustainability and climate-related expenditure. That regulation specifies that:
(…) it is expected that at least 60 % of the overall Horizon 2020 budget should be related to
sustainable development. It is also expected that climate-related expenditure should exceed 35 %
of the overall Horizon 2020 budget, including mutually compatible measures improving resource
efficiency. The Commission should provide information on the scale and results of support to
climate change objectives. Climate-related expenditure under Horizon 2020 should be tracked in
accordance with the methodology stated in that Communication
This is linked with the Communication of 29 June 2011 entitled 'A Budget for Europe 2020',
where the Commission committed to mainstream climate change into Union spending
programmes and to direct at least 20 % of the general budget of the Union to climate-related
objectives. The policy expectations of the co-legislator led to the mainstreaming of sustainability
and climate action in EU’s spending programmes, including Horizon 2020.
164 Regulation (EU) No 1291/2013 of the European Parliament and of the Council of 11 December 2013 establishing Horizon
2020 – the Framework Programme for Research and Innovation (2014-2020) and repealing Decision No 1982/2006/EC, recital
(10).

206
It should be noted that, in addition, biodiversity-related expenditure is tracked as a result of the
Aichi Biodiversity Target 20, as adopted by the Conference of Parties to the Convention at its
12th meeting to the Convention on Biological Diversity, held on 6-17 October 2014 in the
Republic of Korea. There are no targets for biodiversity and biodiversity is not covered in this
section165
.
Politically, the tracking of sustainable development and climate change expenditure has become
even more important in the framework of implementing the UN’s Sustainable Development
Goals (SDGs)166
and the Paris Agreement on Climate Change167
.
H.6.3. Implementation
The methodology, which builds on the so-called "Rio Markers" developed by the OECD168
, is
similar for tracking climate-related expenditure across all the EU’s expending programmes and
has been adapted for applying to sustainable development. Overall consistency of approach at
across all EU funding programmes is monitored by DG CLIMA (for climate action). The
approach for assessing sustainable development (and biodiversity) has been developed in close
collaboration with DG ENV.
The contribution of Horizon 2020 to these objectives is assessed:
For those parts of Horizon 2020 with a thematic focus (“programmable actions”), at the
level of the Work Programme's topics. Each topic is assigned a 0%, 40% or 100%
coefficient, corresponding to the relevant qualitative “Rio Marker” category, which is
then applied to the EU budget contribution to the individual projects that derive from
such topics in order to achieve a quantitative result;
For bottom-up actions (e.g. European Research Council , Marie Sklodowska-Curie), the
coefficients were assigned individually at the level of individual projects for 2014
actions. For subsequent years, proxies based on the 2014 results of the thematic
evaluation panels have been used;
For some parts of the programme (e.g. Financial Instruments, EIT, Article 185 initiatives)
reporting is done on an ad hoc basis.
The Commission services in charge of this cross-cutting issue (DG RTD, Directorate “Climate
action and resource efficiency”) prepare an annual forecast based on the indicative budgets
published in the Work Programme. Then, when all evaluations related to a Work Programme
year are concluded, the total expenditure in support of climate action and sustainable
development respectively is calculated on the basis of the actual EC budget contribution to the
projects selected. Final data for the whole of Horizon 2020 per year are therefore only available
with a considerable time lag after the publication of the calls.
The Commission organises training sessions for project officers and policy officers within the
Commission services and Executive Agencies and has drafted guidelines to facilitate the
165 The estimated funding proportion, based on the same methodology, is 4.04% between 2014 and 2016. 166 http://ec.europa.eu/environment/sustainable-development/SDGs/implementation/index_en.htm 167 http://ec.europa.eu/clima/policies/international/negotiations/paris_en 168 The “Rio Markers” are based on a scoring system with three values (See: OECD (2011) Handbook on the OECD-DAC
Climate Markers. Paris: OECD):
principal objective (score 100%),
significant objective (score 40%), and
not targeted (score 0).

207
assessment of both projects and Work Programme topics. Moreover, information has also been
provided to evaluators, applicants and Horizon 2020 National Contact Points (NCPs) on the
cross-cutting objectives of climate action and sustainable development.
It is worth mentioning that the data collected measure only the EU expenditure in support of
sustainable development and climate action, not the results and actual impacts of such
investments.
H.6.4. Achievements so far
The table below presents the ongoing results of Horizon 2020 expenditure for sustainable
development and climate change, for 2014, 2015 and 2016. It shows that Horizon 2020 still falls
behind the expected expenditure for these objectives. However, the programme seems to have
considerably increased its financial effort in this field as regards FP7. The “Cooperation” part of
FP7 is estimated to have contributed EUR 2.4 billion to projects related to climate action,
whereas for only the first three years (2014-2016) of Horizon 2020 the equivalent figure (i.e.
LEIT and Societal challenges together) is EUR 4.2 billion.

208
Table 36 Horizon 2020 expenditure relating to sustainable development and climate change, 2014-2015
Topic Unique
Programme Part Code
Topic Unique Programme Part Description Total Max GA CC in € CC in % SD in € SD in %
EU.1.1. European Research Council (ERC) €3.892.415.850 €350.317.427 9,00% €1.206.648.914 31,00%
EU.1.2. Future and Emerging Technologies (FET) €655.431.712 €96.405.365 14,71% €103.044.580 15,72%
EU.1.3. Marie-Sklodowska-Curie Actions €2.140.167.785 €492.238.591 23,00% €1.326.904.027 62,00%
EU.1.4. Research Infrastructures €870.924.665 €112.229.571 12,89% €159.618.398 18,33%
Sum Pillar 1 €7.558.940.012 €1.051.190.954 13,91% €2.796.215.918 36,99%
EU.2.1.1. Information and Communication
Technologies
€2.600.625.571 €169.750.563 6,53% €782.674.517 30,10%
EU.2.1.2. LEIT- Nanotechnologies €364.913.028 €14.413.667 3,95% €209.014.778 57,28%
EU.2.1.3. LEIT- Advanced materials €355.548.010 €142.271.539 40,01% €248.521.298 69,90%
EU.2.1.4. LEIT- Biotechnology €145.591.736 €30.809.110 21,16% €136.064.144 93,46%
EU.2.1.5. LEIT- Advanced manufacturing and
processing
€642.456.139 €304.039.088 47,32% €498.846.983 77,65%
EU.2.1.6. LEIT- Space €344.897.303 €59.355.382 17,21% €145.797.628 42,27%
EU.2.2. Access to risk finance €7.471.875 €48.000 0,64% €1.871.430 25,05%
EU.2.3. Innovation in SMEs €63.698.824 €10.686.098 16,78% €29.436.265 46,21%
Sum Pillar 2 €4.525.202.485 €731.373.447 16,16% €2.052.227.041 45,35%
EU.3.1. Societal Challenge 1 - Health, demographic
change and wellbeing
€1.731.996.562 €51.738.591 2,99% €679.826.875 39,25%
EU.3.2. Societal Challenge 2 - Food security,
sustainable agriculture and forestry, marine
and maritime and inland water research and
the bioeconomy
€841.635.074 €421.322.698 50,06% €785.349.303 93,31%
EU.3.3. Societal Challenge 3 - Secure, clean and
efficient energy
€1.773.811.033 €1.761.420.873 99,30% €1.753.218.498 98,84%
EU.3.4. Societal Challenge 4 - Smart, green and
integrated transport
€1.380.622.074 €776.660.946 56,25% €1.125.279.867 81,51%
EU.3.5. Societal Challenge 5 - Climate action,
environment, resource efficiency and raw
materials
€912.498.191 €443.694.709 48,62% €875.308.822 95,92%
EU.3.6. Societal Challenge 6 - Europe in a changing €339.547.784 €5.737.295 1,69% €107.754.721 31,73%

209
world - inclusive, innovative and reflective
societies
EU.3.7. Societal Challenge 7 - Secure societies -
protecting freedom and security of Europe
and its citizens
€446.884.784 €43.385.004 9,71% €183.869.324 41,14%
Sum Pillar 3 €7.426.995.502
€3.503.960.116 47,18% €5.510.607.411 74,20%
EU.4.0. Spreading Excellence and Widening
Participation - Cross-theme
€1.749.999 €600.000 34,29% €1.499.999 85,71%
EU.4.a. Teaming of excellent research institutions and
low performing RDI regions
€15.841.868 €3.705.210 23,39% €5.636.748 35,58%
EU.4.b. Twinning of research institutions €67.263.941 €7.632.541 11,35% €26.905.577 40,00%
EU.4.c. ERA chairs €34.024.659 €6.836.140 20,09% €13.609.864 40,00%
EU.4.e. Supporting access to international networks
for excellent researchers and innovators who
lack sufficient involvement in European and
international networks
€89.619.171
€0 0,00% €35.847.668 40,00%
EU.5.0. Science with and for Society - Cross-theme €800.000
€0 0,00% €0 0,00%
EU.5.a. Science with and for Society - Make scientific
and technological careers attractive to young
students, and foster sustainable interaction
between schools, research institutions,
industry and civil society organisations
€30.151.169 €0 0,00% €22.806.208 75,64%
EU.5.b. Science with and for Society - Promote
gender equality in particular by supporting
structural change in the organisation of
research institutions and in the content and
design of research activities
€18.634.809 €0 0,00% €11.119.623 59,67%
EU.5.c. Science with and for Society - Integrate
society in science and innovation issues,
policies and activities in order to integrate
citizens' interests and values and to increase
€34.107.173 €0 0,00% €29.973.807 87,88%

210
the quality, relevance, social acceptability and
sustainability of research and innovation
outcomes in various fields of activity from
social innovation to areas such as
biotechnology and nanotechnology
EU.5.f. Science with and for Society - Develop the
governance for the advancement of
responsible research and innovation by all
stakeholders, which is sensitive to society
needs and demands and promote an ethics
framework for research and innovation
€21.852.379 €0 0,00% €15.814.398 72,37%
Sum Pillar 4+5 €314.045.168 €18.773.891 5,98% €163.213.891 51,97%
Sum Pillars 1 to 5: €19.825.183.167 €5.305.298.407 26,76% €10.522.264.261 53,08%
Ad-hoc part:
EMPIR €24.948.914,00 €5.377.490,60 21,55% €16.738.152,00 67,09%
art.185+187 (adhoc) € 27.800.000,00 € 0,00 0,00% € 11.120.000,00 40,00%
JRC €150.500.000,00 € 48.800.000,00 32,43% € 95.000.000,00 63,12%
EIT € 218.500.000,00 € 103.280.000,00 47,27% € 174.460.000,00 79,84%
Financial Instr. € 50.320.000,00 € 15.808.000,00 31,41% € 7.200.000,00 14,31%
Sum ad-hoc part €472.068.914,00 €173.265.490,60 36,70% €304.518.152,00 64,51%
TOTAL €20.297.252.081,11
€5.478.563.898,06 26,99% €10.826.782.412,96 53,34%
NB: Data extraction from CORDA: January 2017. Actions EU.4.a. and 5.0. are not included for 2014 and 2015; actions EU.4.b. are not included for 2014 and 2016; actions
EU.4.c. are not included for 2015 and 2016; and actions 5.b., 5.c. and 5.f. are not included for 2014 and 2015. “Ad-hoc” parts not available for 2016, and Art.185 not available
for 2015 either.

211
H.6.5. Lessons learnt/Areas for improvement
As shown in the previous section, the main difficulty to reach the expected investment in
sustainable development and climate change comes from the bottom-up parts of
Horizon 2020. The content of bottom-up actions is unpredictable by nature. The Commission
has no means to steer the orientation of the projects that are funded, while they represent a
very substantial part of the budget. On the contrary, figures for the Societal Challenges pillar
are well beyond the targets: 47.2% on Climate Change and 74.2% on Sustainable
Development. In addition, experience shows that the “Rio Markers” methodology is not
always suitable for assessing the contribution of fundamental research to policy objectives.
Monitoring the Horizon 2020 expenditure on sustainable development and climate action was
particularly difficult during the two first years of the programme due to IT-related issues.
These problems are still in the process of being resolved.
The alignment of the sustainable development tracking methodology with SDGs in 2015 has
facilitated implementation, because this has clarified the scope of sustainable development in
relation to globally-recognised goals. There is indeed a substantial increase of the share of the
budget devoted to sustainable development between 2014 (51.6%) and 2015 (58.4%), but this
trend is not confirmed in 2016.
One major positive aspect of tracking expenditure for sustainable development and climate
action is the mainstreaming effect. The level of awareness about this cross-cutting issue
amongst the Commission services and Executive Agencies has substantially increased since
the beginning of Horizon 2020. This not only facilitates data collection but – more
importantly – has increased the attention paid to sustainable development and climate change
objectives in drafting Horizon 2020 Work Programmes.
In November 2015 the Commission services devised an internal action plan169
in order to
remedy Horizon 2020’s sub-optimal progress towards the expected funding objectives. The
plan included the following measures:
a) Priority setting and programme phase:
Ensure that all Horizon 2020 Advisory Groups are aware of cross-cutting objectives
and expenditure targets, so that climate change and sustainable development
challenges are taken into account in their advice, where relevant.
Ensure that all Horizon 2020 Programme Committee (PC) configurations are aware of
these objectives and expenditure targets, with a view to future programming (strategic
programming and Work Programme drafting).
b) Work Programme drafting phase:
Ensure that actions which are 'horizontal' or address up-stream/enabling technologies
consistently reference embedded cross-cutting objectives, where relevant.
In the Societal Challenges/LEIT-NMBP, ensure that the expected impact on climate
change and/or the dimensions of sustainable development are more explicitly taken
169The Strategic Research and Innovation Group of Directors-General endorsed on 12 November 2015 the measures included
in the Action Plan for increasing mainstreaming of sustainable development and climate action in Horizon 2020.

212
into account by moving from a technology focus to a more systemic approach in
topics.
c) Proposal and evaluation phase:
Ensure that potential climate action/sustainable development impacts are mentioned
by applicants and can therefore be taken into account by evaluators, by adjusting
proposals templates where relevant and providing information to applicants and
evaluators.
d) Bottom-up actions:
Ensure that potential climate action/sustainable development impacts are mentioned
by applicants and can therefore be taken into account by evaluators, by adjusting
proposals templates where relevant and providing information to applicants and
evaluators
Ensure that sectors and communities particularly relevant for climate-
change/sustainable development-related R&I are aware of opportunities in bottom-up
parts of Horizon 2020.
e) Improving the tracking methodology:
Ensure consistency by adapting guidance to specific needs of services.
For ERC/MSCA bottom-up actions, reduce the burden of assessing all projects
selected for funding by focusing on those where contribution to climate action and / or
sustainable development can be expected (e.g. panel approach).
Improve the reporting on Horizon 2020 Financial Instruments' contribution to climate
action and sustainable development.
Improve technical/IT issues to ensure completeness and consistency of data.
Treat more parts of the programme as 'bottom-up' (project-level assessment) to better
quantify their contribution to climate action and sustainable development.
f) Aligning the method for sustainable development with the Sustainable Development
Goals (SDGs)
Demonstrate the contribution of Horizon 2020 to the implementation of the SDGs by
referencing them in the Work Programme.
Alignment of definition used for guidance on sustainable development with the
Sustainable Development Goals (SDGs), for use from 2015 calls;
g) Communicating on climate action and sustainable development in Horizon 2020
Develop an overall 'story' on climate action and sustainable development goals to
supplement the tracking results for communication purposes.
Most of these measures have already been implemented or are ongoing. The R&I Directors-
General also noted that the critical moment is the preparation of the Work Programme 2018-
2020, when Horizon 2020 would need to make up the shortfall acquired in the initial years of
Horizon 2020. The preparation of the Work Programme 2018-2020 is on-going and identifies
climate action as a strong priority.

213
H.7. Fostering the functioning and achievement of the ERA
H.7.1. Overview
It is the European Union's objective to strengthen its scientific and technological bases by
achieving a European Research Area ('ERA') in which researchers, scientific knowledge and
technology circulate freely, and by encouraging the Union to advance towards a knowledge
society and to become a more competitive and sustainable economy in respect of its industry.
Horizon 2020 should contribute to achieving the ERA, encouraging the development of
framework conditions to help European researchers to remain in or to return to Europe, attract
researchers from around the world and make Europe a more attractive destination for the best
researchers.
H.7.2. Rationale
As the earlier Framework Programmes, Horizon 2020 is the financial pillar of the Union's
actions and the key instrument to support ERA development. Funding measures are crucial to
the realisation of ERA and have important effects on coordination and governance, common
agenda setting, researcher's mobility and pooling of resources. As a leverage, Horizon 2020
should also be crucial in driving ERA reforms at national level.
H.7.3. Implementation
Horizon 2020 provides support to Member States and the main stakeholders in implementing
the ERA reform agenda across the following key priorities:
1. More effective national research systems: using Horizon 2020's new tool 'Policy
Support Facility’ (PSF), providing tailor-made services at the request of Member
States and Associated Countries. Its support is either topic-specific (mutual learning
exercises) or country-specific (peer reviews of national R&I systems, or specific
support to a policy reform). Four Member States and one associated country have
already been reviewed, while many other requests are arising. The recurrent feedback
received on the PSF work has shown that the operational recommendations formulated
by leading experts and policy practitioners prove valuable as catalysers and to support
countries in implementing national R&I reforms. For example, the renewed Science
Agenda of Bulgaria pays particular attention to the recommendations formulated by
the dedicated PSF Peer Review.
2. Optimal transnational co-operation and competition on common research
agendas, grand challenges and infrastructures: Public to Public Partnerships P2P's
(funded through the various Societal Challenges of Horizon 2020's third pillar), the
European Strategy Forum on Research Infrastructures ESFRI 170
objectives, supported
by the Research Infrastructures Programme (funded by Horizon 2020's 'Excellent
Science' first pillar, € 2.488 M in regulation (EU) No 1291/2013), and the ERIC
Regulation (EU legal status for Research Infrastructures)171
;
170 http://ec.europa.eu/research/infrastructures/index_en.cfm?pg=esfri 171 ESFRI: European Strategy Forum on Research Infrastructures; ERIC: European Research Infrastructure Consortium.

214
3. An open labour market for researchers facilitating mobility, supporting training
and ensuring attractive careers: Euraxess network172
and Resaver173
, both funded
through Horizon 2020's 'Science with and for society' programme.
4. Gender equality and gender mainstreaming in research: it encompasses three
objectives: remove barriers and biases to women's careers in science, gender balance
in decision-making and the integration of the gender dimension in research content.
These objectives are implemented through institutional change. Horizon 2020 supports
the implementation of the ERA objectives in two ways: by integrating gender as a
cross-cutting issue and by funding institutional change in research organisations
through the 'Science with and for society' programme.
5. Optimal circulation and transfer of scientific knowledge to guarantee access to
and uptake of knowledge by all: communication and dissemination of programme
results, demonstration and pilot projects, Open Access, including to data, to become
the default regime in Horizon 2020.
6. International cooperation to ensure that Europe as a whole is able to take
maximum advantage of the best R&I opportunities in a global setting.
In order to measure the contribution of Horizon 2020 to the realisation of the ERA, the
following indicators have been identified:
Annual number of research positions advertised on EURAXESS Jobs;
Number of national research infrastructures networked (in the sense of being made
accessible to all researchers in Europe and beyond through Union support);
Number and share of Open access articles published in peer-reviewed journals;
Number of projects that make scientific data accessible and re-usable and number of
scientific datasets made accessible and re-usable174
;
Number of Multiannual Implementation Plans adopted by Joint Programming
Initiatives.
H.7.4. Achievements so far
The implementation of ERA Priority 1 ("More effective national research systems") relies
much more on national reforms than on the Framework Programme. The analysis carried out
in the context of the 2016 ERA Progress Report shows that "most countries have made
progress in the field of research excellence and almost all of them have adopted national
strategies for research and innovation. Several Member States are redefining their National
R&I strategies further based on a broad concept of innovation, encompassing education,
research and innovation to achieve greater efficiencies". A first inventory of the ERA NAPs
shows a more holistic strategic approach to R&I will be strengthened in the future. A
necessary condition, however, is to ensure more stable funding mechanisms of government
investment."
172 Pan-European initiative providing access to a complete range of information and support services to researchers wishing
to pursue their research careers in Europe or stay connected to it. 173 Retirement Savings Vehicle for European Research Institutions, state of the art retirement savings product that will enable
mobile and non-mobile employees to remain affiliated to the same pension vehicle when moving between different countries
and changing jobs. 174 The data on number of scientific datasets made accessible is collected in the reporting template of Horizon 2020 projects.
No data on this is yet available

215
Regarding ERA Priority 2A, the Joint Programming Initiatives (JPIs) stem from the Joint
Programming Process, one of the building blocks of the European Research Area (ERA)
launched in December 2008. In this structured and strategic process, Member States agree, on
a voluntary basis and in a partnership approach, on common visions and they implement
Strategic Research Agendas (SRA) together. Ten Joint Programming Initiatives (JPIs) have
been launched to date and all have adopted Multiannual Implementation Plans. In addition, in
the period 2014-2016, 48 ERA-NET Cofund actions were selected under Horizon 2020 for a
total budget in excess of EUR 1300 million. The total EU contribution to the ERA-NET
Cofunds will be around of EUR 380 million.
Preliminary results indicate that the number of national research infrastructures (ERA Priority
2B) networked thanks to Horizon 2020 support was 363 by the end of 2015. The target by the
end of Horizon 2020 is 900.
As a good example of achievement obtained in the context of ERA priority 3, 289.981 job
vacancies have been advertised on EURAXESS until February 2017.
Horizon 2020 supports the implementation of the ERA priory 4's objectives in two ways: by
integrating gender as a cross-cutting issue and by funding institutional change in research
organisations through the 'Science with and for society' programme.
Regarding the ERA priority 5, aiming at "Optimal circulation, access to and transfer of
scientific knowledge" a major challenge is to broadly implement Open Access - i.e. free
online access to and use of publicly-funded scientific publications and data - given the uneven
state of advancement of Member State policies in this area. The Commission is leading by
example by making open access to peer-reviewed scientific publications resulting from
Horizon 2020 mandatory and by running a aflexible pilot in Horizon 2020 ('ORD pilot'). In
the Work Programmes 2014-2016, this ORD pilot concerned selected areas of Horizon 2020.
However, in the Communication 'a European Cloud Initiative – Building a competitive data
and knowledge economy in Europe' the Commission committed itself to "make open research
data the default option, while ensuring opt-outs, for all projects of the Horizon 2020
programme" as of 2017. As of the revised version of the Work Programme 2017, the ORD
pilot has therefore been extended to all thematic areas of the Horizon 2020 Research and
Innovation Programme. While open access to research data thereby becomes applicable by
default in Horizon 2020, the Commission also recognises that there are good reasons to keep
some or even all research data generated in a project closed. It has, therefore, provided robust
opt-out possibilities at any stage..A further new element in Horizon 2020 is the use of Data
Management Plans (DMPs) detailing what data the project will generate, whether and how it
will be exploited or made accessible for verification and re-use, and how it will be curated and
preserved.
For the uptake of the pilot from 2014 to 2016 (when its scope was more restricted), figures
show an opt-out rate of 35% in the core areas of the pilot. In other words 65% of projects in
the core areas participate in the ORD pilot. The most important reasons for opt-outs were (i)
IPR concerns (ii) projects which do not expect to generate data or (iii) over privacy concerns.
Outside the core areas, 14% of projects make use of the voluntary opt-in possibility. Since
Horizon 2020 projects have yet to produce a significant number of scientific publications or
datasets, no specific quantitative data on the indicators related to scientific publications can
yet be provided.

216
H.7.5. Lessons learnt/Areas for improvement
Horizon 2020's instruments that directly support some of the ERA priorities (especially PSF,
P2Ps and the 'Science with and for society' programme) provide satisfactory results. Other
parts of the Framework Programme provide more diffuse results, with an impact difficult to
assess.
The article 32 of grant agreement contracts within Horizon 2020 (Recruitment and working
conditions for researchers) is also a strong catalyst regarding the implementation of the
principles set out in the Commission Recommendation on the European Charter for
Researchers and the Code of Conduct for the Recruitment of Researchers, in particular
regarding working conditions, transparent recruitment processes based on merit, and career
development.
H.8. Framework conditions in support of the flagship initiative "Innovation
Union"
H.8.1. Overview
The Innovation Union was launched in 2010 as a flagship initiative of the Europe 2020
strategy to build on Europe's strengths and address its weaknesses with respect to innovation.
It aimed to tackle both the supply and demand side elements of the innovation eco-system: the
public sector, businesses, academia and finance. The activity was evaluated in 2015 (State of
the Innovation Union 2015)175
to take stock of the progress and set out next steps under six
building blocks:
Strengthening the knowledge base and reducing fragmentation;
Getting good ideas to market;
Maximising social and territorial cohesion;
Pooling forces to achieve breakthroughs: European Innovation Partnerships;
Leveraging our policies externally; and
Making it happen.
The overall conclusion was: 'Six years after the Innovation Union was launched as one of the
pillars of the Europe 2020 growth strategy, the evaluation shows that impressive progress has
been made in numerous fields. Great progress has been achieved in making Europe a more
innovative continent since the launch of the Innovation Union in 2010. Nevertheless, the
world has evolved since then and new elements need to be taken into account so as to better
tackle the challenge of innovation in Europe'. Innovation has been embedded in initiatives as
the Digital Single Market, the Energy Union, the Capital Markets Union, the work on ERA,
the European Social Fund, European Structural and Investments Funds and Horizon 2020.
H.8.1. Rationale
In 2010, innovation was recognised as essential to make Europe more competitive in times of
budgetary restraints and increased global competition. It marked a step forward. Since then,
innovation has been regarded as a mainstream policy to be embedded in policy areas
wherever relevant.
175http://ec.europa.eu/research/innovation-union/pdf/state-of-the-union/2015/state_of_the_innovation_union_report_2015.pdf

217
H.8.1. Implementation
Horizon 2020 contributes to the framework conditions for innovation by its focus on both
research and innovation. Some specific elements are the innovation actions, innovation
through public procurement, inducement prizes for innovative solutions for societal
challenges, the access for innovation projects to risk finance.
H.8.2. Achievements so far
The Innovation Union initiative succeeded in building momentum around innovation,
mobilising stakeholders and mainstreaming innovation in key European, national and regional
policies. The evaluation in 2015 provided an overview. There is still uncertainty about some
of the legislative actions mentioned in the Innovation Union, regarding the Unitary Patent.
Twelve Member States have ratified the Agreement on the Unified Patent Court. When
ratified by the United Kingdom and Germany the Unitary Patent package will enter into force.
The commitments that require greater involvement of Member States appear to have
progressed to a lesser extent, either because of the long legislative processes (e.g. directives
ratification), or because they are less binding in nature. The European Innovation Scoreboard
(latest issue 2016)176
keeps track of indicators for innovation.
H.8.3. Lessons learnt/Areas for improvement
The European Innovation Scoreboard 2016 shows that since 2008, the EU continues to be less
innovative than South Korea, the United States and Japan, but performance differences with
the last two countries have become smaller. However, South Korea has managed to improve
its performance at a much faster pace than the EU over the last eight years. The EU still has a
considerable performance lead over many other countries, including China. However, China
is catching up, with a performance growth rate five times that of the EU. It is necessary to
continue paying attention to Europe's innovation performance. Attention is also needed for
innovation at sectorial level. Fit-for-purpose regulatory frameworks are essential for EU
industry; they allow specific sectors to benefit from opportunities in the internal and global
markets. Moreover, a pro-innovation regulatory climate attracts international investment. A
Commission Staff Working Document177
evaluated how supportive to innovation the EU
regulatory framework is at sectorial-level. It highlighted the need for forward-looking
regulatory approaches, innovation-friendly and innovation targeting regulatory policies.
H.9. Contributing to the Digital Agenda for Europe
H.9.1. Overview
The Digital Agenda for Europe, one of seven EU2020 flagship initiatives, has established
'digital' as a policy brand in its own right, by aspiring to make every European digital. The
EU’s Digital Single Market Strategy, launched in May 2015, builds on these foundations,
aiming to remove regulatory barriers and move from 28 national markets to a single one, to
unlock online opportunities and make the EU's single market fit for the digital age.
176 http://ec.europa.eu/DocsRoom/documents/18062 177 (SWD 2015) Better regulations for innovation driven investment at EU level

218
H.9.2. Rationale
ICT R&I is key to the realisation of the Digital Single Market. ICT R&I has dedicated topics
in all Horizon 2020 pillars. EU investments in ICT R&I are expected to contribute to the
Digital Single Market in various aspects, addressed in 2014 and 2015 calls:
A multidisciplinary approach to lay the foundations for radically new technological
possibilities. EU support allows exploring novel and visionary ideas (FET Open), fostering
transformative research in most promising thematic domains (FET Proactive) and tackling
grand scientific and technological challenges by large-scale, science driven research
initiatives (FET Flagships).
e-Infrastructures to make every European researcher digital, increasing creativity and
efficiency of research and bridging the divide between developed and less developed
regions.
Investments in several domains to support the digital transformation of industry and enable
progress and growth of many other sectors. These include for example Photonics,
Robotics, Internet of Things (IoT), Future Internet, micro- and nano-electronic
technologies, electronic components and systems, Big Data, 5G, HPC technologies.
Actions in these areas also support Public Private Partnerships which link up European
industry (large players and SMEs), researchers, academia and the European Commission to
cooperate in research and innovation and define strategic roadmaps in key sectors.
Investments in investigating ICT contribution to the industrial-scale roll-out of multi-
disciplinary solutions to address societal challenges. For example ICT Research and
innovation helps build a digital society caring about individuals by supporting active and
healthy ageing, assistive robotics, eHealth for personalised care, security and privacy, and
services for inclusiveness.
ICTs have an enabling and pervasive nature, which permeates countless aspects of the
economy and personal lives, impacting areas as varied as banking, retail, energy,
transportation, education, publishing, media, health or social interactions. Given its enabling
and pervasive nature, the presence of ICT goes beyond the above dedicated topics, and is
expected to span into the activities of the ERC, MSCA grant-holders and JTIs.
H.9.3. Implementation
The cross-cutting indicator aims at tracking the ICT-related activities and the related spending
at the EU level. This should provide a more accurate estimate of how Horizon 2020
contributes to the realisation of a Digital Europe. This indicator relates to the expenditure in
ICT related research and innovation activities, meaning ICT and ICT-enabled new products,
services or processes (within and outside the ICT sector). This is computed as the share of EU
financial contribution that is ICT Research & Innovation related in Horizon 2020 (EUR),
based on the "RIO markers" methodology178
.
178 Projects for which ICT R&I is the principal (primary) objective are marked with 100%, indicating that 100% of the
project budget contributes to ICT R&I. Projects for which ICT R&I is a significant, but not predominant objective are
marked with 40%, indicating that 40% of the project budget contributes to ICT R&I.

219
H.9.4. Achievements so far
The Digital Agenda indicator allows tracking spending related to digital R&I throughout the
Programme. Preliminary estimates for the calls up to January 2017 show that about 30% of
the EC financial contribution under Horizon 2020 (about EUR 5.3 billion) went to actions
promoting to some extent research and innovation in information and communication
technologies179
, thus showing the enabling nature of such technologies, e.g. in helping address
the Societal Challenges..
Table 37 EC Contribution through Horizon 2020 projects to the Digital Agenda
Programme Part EC contribution to Digital
Agenda (overall) (EUR million)
Share of EC contribution to Digital
Agenda (only flagged projects)
LEIT-ICT 2 594.6 99.8%
FET 447.6 68.4%
RI 492.0 56.5%
SC6 119.3 34.9%
ARF 1.0 34.2%
SC7 152.9 34.2%
Total 5 330.0 30.0%
SC1 303.3 18.4%
SEWP 21.3 18.2%
SC4 228.3 16.7%
LEIT-NMBP 225.5 16.2%
SC5 122.6 13.4%
FTI 20.1 12.5%
MSCA 202.4 10.4%
ERC 172.7 7.7%
SC3 133.9 7.7%
LEIT-SPACE 26.6 7.5%
SC2 57.2 6.9%
SWAFS 7.3 6.7%
Innovation in SMEs 1.4 3.6%
Source: CORDA data, extraction 1 January 2017. Data provided by Work Programme Drafters during WP
preparation (topic level) and by Project Officers during Grant Agreement Preparation (bottom-up), calculated
on the basis of the RIO methodology
This figure shows the presence of ICT R&I throughout the programme: by design, all the
projects within LEIT ICT contribute to the indicator, and about 68% of FET projects.
Research Infrastructures contribute to ICT R&I with 57% of the budget. In the Societal
Challenges, contribution to ICT R&I is at 35% of the total budget of SC6 and 34% of SC7,
although the highest number of projects and EC contribution to ICT are found in SC1 (EUR
303 million, representing 18% of the total budget of SC1). In terms of budget, projects in SC4
also contribute significantly to ICT (EUR 228 million, representing 17% of the total budget of
SC4). These figures reflect budget allocation to ICT topics within the SC1, SC6, SC7, but go
beyond it, in particular for SC4, 2 and 3: they show contributions from individual projects that
have ICT as primary objective, or as significant objective thus indicating the enabling nature
of ICT. Concerning LEIT, the contributions from NMBP are at 17%, whereas they are very
179 This excludes the 1,271 signed grants where information is missing, and which represent 11% of the total signed grants,
out of which 77% are supported under the Excellent Science priority, otherwise – if included - the share would be 26%.

220
low for LEIT Space (at 7% only). A high number of projects contributing to ICT is also found
within MSCA grants: 603 (19% of total signed grants), representing 10% of the total budget.
Figure 53 Projects for which ICT R&I is a primary or a significant objective, by
programme part
Source; CORDA data, extraction 1 January 2017
H.9.1. Lessons learnt/Areas for improvement
The Digital Agenda indicator allows tracking spending related to digital R&I throughout the
Programme. The preliminary data up to January 2017 show that about EUR 5.3 billion or
slightly less than one third of the overall EC funding are contributing to ICT R&I, thus
providing an important input to the progress towards the Digital Single Market objectives.
This budget goes beyond what allocated through dedicated topics to ICT and signals the
cross-cutting nature of digital technologies and their societal relevance.
Estimates from the Digital Agenda indicator should be treated with caution. The application
of the OECD 'Rio Markers' methodology to bottom-up and thematic research funding still
requires further optimisation and fine-tuning. In addition, due to the reporting issues in the
first year of Horizon 2020, it is not possible to draw comparisons on the evolution of the
indicator. This needs to be monitored in the years to come.
H.10. Widening participation across the Union in research and innovation and
helping to close the research and innovation divide in Europe
H.10.1. Overview
Despite efforts at national and European level, disparities in terms of research and innovation
performance persist among EU Member States. Especially in advanced economies like
Europe's, scaling up and improving investment in research and innovation is an essential

221
pathway to economic growth and competitiveness. Increasing the R&I performance of low
performing Member States and integrating their unexploited potential into the European
Research Area and single market will maximise the impact of R&I investment, for Europe as
a whole and for each Member State concerned.
Widening Participation is therefore a cross-cutting issue in Horizon 2020 mentioned under
Article 14 of the Framework Programme regulation180
: 'Widening participation across the
Union in research and innovation and helping to close the research and innovation divide in
Europe'.
H.10.2. Rationale
According to an analysis by the European Commission181
, some of the main causes of low
participation to past EU Framework Programmes of certain countries were:
Insufficient R&D investments in those countries;
Lack of synergies between certain countries’ national research systems and EU
research;
Lagging system learning effects and access to existing networks;
Differential wage levels between countries;
Insufficient and ineffective information, communication advice and training.
Additionally, the High Level Expert Group on the Ex-post evaluation of FP7 concurred that
"some of most important reasons for the comparably lower share and lower success rates of
the EU‐13 organisations are information and language barriers; lack of professional contacts
and research networks; lack of leading Universities and Research organisations leaders in
proposal matters; limited understanding of FP7; weak training in preparing successful
proposals; insufficient motivation to participate in FP7; lack of practice in project
management; little experience in cross‐country cooperation; generally low focus on R&D in
policy and in business; few options for exploitation of research results at the national level."
As it can be seen in Table 39 the need/problem to address was the low participation of certain
countries in Framework Programmes with EU-13 participation in FP7 being only 4.2% of the
total EU contribution. Despite a small increase to 4.4% in Horizon 2020 the situation of low
participation is still valid today, although participation is in line with the share of the EU-
13 in total EU R&D expenditure (GERD), as is shown in table 40.
Table 38 EU-13- EU-15 budget share in overall programme (FP7 & Horizon 2020)
FP7 Horizon 2020
EU-13 EU-15 EU-13 EU-15
EU Funding (% of total contribution) 4.2% 85.2% 4.4% 88.6%
Source: For FP7: Data from SWD FP7 Ex-Post Evaluation, for Horizon 2020: European Commission, CORDA data, cut-off
date 1 January 2017
180 http://eur-lex.europa.eu/LexUriServ/LexUriServ.do?uri=OJ:L:2013:347:0104:0173:EN:PDF 181 Commission analysis of September 2011, at the request of the Polish Presidency, see
http://register.consilium.europa.eu/doc/srv?l=EN&f=ST%2014728%202011%20INIT This has been confirmed by other
studies, analysis and public discussions, for instance the FP7 MIRRIS project http://www.mirris.eu/.

222
Looking at the weight of the science and innovation systems of the EU-13 and EU-15 (table
40) within the overall European R&I system across a number of dimensions, leads to the
conclusion that the role of the EU-13 in the EU's R&I system is in 2015 still limited, and
overall slightly below its weight in total GDP. The exceptions to this are the number of
scientific publications and the number of researchers, where the weight of the EU-13 is above
its GDP share. A second conclusion that can be drawn is that the EU-13's role has developed
considerably over the past 10 years. The weight of the EU-13 has been growing most
considerably for the expenditure indicators and somewhat less for the patenting and
publication indicators. As regards the number of researchers, the weight has been more or less
stagnant, yet it continues to be well above the investment and outcome shares, which may
point to remaining inefficiencies in the research and innovation systems of these countries.
Table 39 Share of the EU-13 and EU-15 in the overall EU-28 performance for key
science and innovation indicators
Indicator % share of EU-13 % share of EU-15
2005 2015 2005 2015
Distribution of R&D expenditure
Gross domestic expenditure on R&D (GERD) 2.6 4.5 97.4 95.5
Business enterprise expenditure on R&D (BERD) 1.9 3.6 98.1 96.4
Public expenditure on R&D (GOVERD plus HERD) 3.9 6.1 96.1 93.9
Distribution of scientific publications
Total number of scientific publications 8.8 11.9 91.2 88.1
Top 10% highly cited publications 4.2 5.8 95.8 94.2*
Distribution of Researchers
Total number of researchers 12.5 13.1 87.5 86.9
Distribution of PCT patent applications
PCT patent applications 1.7 2.7 98.3 97.3
Distribution of GDP (in current euro)
GDP 6.2 8.0 93.8 92.0
*2014 Note: *The latest year available is 2014.
Source: European Commission, DG RTD.Data: Eurostat, OECD, CWTS based on Web of Science database
H.10.3. Implementation
In order to increase the excellence of the scientific output, the international connectivity,
capacity to attract funding, as well as the reform process of EU-13, a different range of
measures have been put in place within Horizon 2020 to help spread excellence and widen
participation.
Horizon 2020's Specific Programme 'Spreading Excellence and Widening Participation'
(SEWP), with its specific and targeted measures, aims to 'fully exploit the potential of
Europe's talent pool and to ensure that the benefits of an innovation-led economy are both
maximised and widely distributed across the Union in accordance with the principle of
excellence'. It has a total budget of EUR 816 million (proposed by the Commission to be

223
increased by EUR 110 million following the mid-term review/revision of the Multiannual
Financial Framework (MFF) of September 2016182
).
Teaming, Twinning and ERA Chairs are the key measures falling under SEWP. In addition,
other initiatives falling under the SEWP pillar of Horizon 2020 that provide indirect support
to low performing countries are COST183
(promoting networking and connecting pockets of
excellence) the Policy Support Facility184
(PSF) (providing on-demand advice to policy
makers on national R&I systems) and the Widening National Contact Points (NCPs)185
through the NCP WIDE_NET186
project that provides support to SEWP calls applicants. The
rationale and achievement of this part of Horizon 2020 are detailed in the relevant part of the
Thematic annex.
Furthermore, during the negotiations of Horizon 2020, Member States paid special attention
to low participation. The emphasis was put on the differences in remuneration of
participants in the same FP projects. A special provision was therefore introduced to allow
FP projects to pay researchers a "bonus" (i.e. an additional salary of up to EUR 8000 per
year). However, following concerns of some Member States (e.g. Romania) that this
provision was not helping to address the issue, the Commission very recently agreed to revise
the model grant agreement (formal adoption in February). According to the new approach, all
elements that are paid under national programmes are considered basic salary, while only
additional bonuses for working in international programmes are considered as additional
remuneration (with the 8000 Euro capping).
In addition, widening participation is also recognised and addressed as a cross-cutting issue
by other parts of Horizon 2020 (Societal Challenges/LEIT/ERC/EIT). This takes different
forms, going from an in-depth analysis of the situation, to specific actions such as
Coordination and Support Actions to establishing Memoranda of Understanding with relevant
stakeholders and multipliers or again through targeted awareness raising events. This is done
without putting into question the objective and principle of excellence that is at the heart of
the Framework Programme.
Box 2 Examples of initiatives to widen participation across Horizon 2020
The European Research Council (ERC) set up in 2013, in preparation to Horizon 2020, a Working
Group on Widening European Participation187
with a mission to capitalize on the full potential for
frontier research in Europe without departing from the ERC's principle of excellence. Its main task
was to facilitate an all European dialogue, exchange of experiences, networking and learning about
good practices in supporting the very best researchers to successfully apply to the ERC.
In 2015 the European Institute of Innovation and Technology (EIT) took targeted action to widen
the geographical coverage of its Knowledge and Innovation Communities (KICs) and further integrate
the knowledge triangle outside the KIC framework. To this end, the EIT decided to mainstream the
EIT Regional Innovation Scheme (RIS) actions into KICs activities and earmarked a dedicated budget
for 2016 activities. Activities undertaken as part of the EIT RIS aim at ensuring the flow of both
knowledge and people between KICs and selected partnerships with a view to enhancing the regional
182 http://ec.europa.eu/budget/mff/lib/COM-2016-603/COM-2016-603_en.pdf 183 http://www.cost.eu/ 184 https://rio.jrc.ec.europa.eu/en 185 National Contact Points are national structures established and financed by governments of the 28 EU MS and the states
associated to the framework programme. NCPs give personalised support on the spot and in applicants' own languages. 186 http://www.ncpwidenet.eu/ 187 https://erc.europa.eu/about-erc/organisation-and-working-groups/working-groups/working-group-widening-participation

224
innovation capacity by fostering the integration of the Knowledge Triangle. The RIS initiative is
targeted at countries which have no participating organisations into the existing KICs and belong to
the ‘moderate and modest innovators’ groups identified in the 2015 Innovation Union Scoreboard.
In the area of Health the RegHealth-RI project188
was completed in 2016 that aimed at analysing,
discussing and improving the performance of health research & innovation across the different low
performing EU regions and countries.
In Research Infrastructures, a Memorandum of Understanding was signed on 25 October 2016
between CERIC-ERIC (Central European ERIC) and SHARE-ERIC that aims to both boost regional
cooperation and collaboration between these infrastructures in different fields (active ageing, transport
and connectivity, education, research and innovation) and will support scientists from low R&I
performing countries to access different research infrastructures.
In the area of Transport a Memorandum of Understanding (MoU) has been signed in June 2016 by
the Transport NCPs network and the Enterprise Europe Network transport sector groups; Under the
MoU, an action plan is currently in preparation – among other issues, one of the key aspects is
organising targeted support activities for EU-13 SMEs for the last Horizon 2020 Transport calls,
including the SME instrument. The action plan covers information sharing, trainings, joint activities
that aim to raise awareness of the available opportunities and support EU13 SMEs participation to
Horizon 2020 programme – increased access to consortia, for instance networking researchers and
SMEs, support for proposal building, including high quality business plans and improving business
readiness of ideas.
In the Bioeconomy field a Letter of Intent (LoI) was signed189
in 2016 between the Bio-based
Industries Joint Undertaking, its private member, Bio-based Industries Consortium, and 8 Polish
regions for cooperation and awareness raising in the regions (in synergies with Regional Operational
programmes, Smart Specialisation Strategies and to related and available EU structural funds managed
at regional level). Also, a Lodz Bioregions Declaration190
was signed with the aim to establish a
Central and Eastern European Bioregions Forum for the further development of the bioeconomy at
local and regional levels, and to help establish synergies in the implementation of ESIF, including
research, education and training, transfer of knowledge and other activities.- Following a call in
Societal Challenge 2 in 2016 on the regional dimension of bio-based industries, BioREG CSA
project was selected titled "Absorbing the Potential of Wood Waste in EU Regions and Industrial Bio-
based Ecosystems". The project will create a Stakeholder platform of regional and local organisations
(regional authorities or mandated agencies or clusters) interested to develop ambitious strategies in
support of bio-based products/industries. Building on the "model demonstrator regions", successful
case studies shall be shared and transposed to other interested European regions, among which also
EU13 with the aim to widen the participation of countries developing regional bio-based strategies.
In Industrial technologies191
, a series of targeted awareness raising events started in 2016 and will
continue on a more systematic basis in 2017. A first event was organised in Romania in June 2016 on
the topic of smart specialisation in nanotechnology and advanced materials.
Complementing the above actions under Horizon 2020, also strengthened synergies of
Horizon 2020 with the European Structural and Investment Funds (ESIF) and with the
Instrument of Pre-Accession (IPA II) for Associated Countries are a way to increase the
impact of investments in low R&I performing countries.
188 http://rhing-net.eu/reghealth-ri/ 189 European Bioeconomy conference, Lodz/Poland, 6-7/10/2016; http://www.bbi-europe.eu/news/bbi-ju-signs-letter-intent-
develop-bioeconomy-partnerships-central-and-eastern-regions-0 190 http://bioeconomy.lodzkie.pl/wp-content/uploads/dekl_en.pdf 191 Nanotechnologies, Advanced Materials, Biotechnology and Advanced Manufacturing and Processing

225
The European Structural and Investment Funds (ESIF) include in fact support for
research infrastructures and research centres; promoting business R&I, technological and
applied research and key enabling technologies, as well as networking and development of
clusters. An important example of synergies between ESIF and Horizon 2020 is the ELI -
Extreme Light Infrastructure (distributed), located in Czech Republic, Hungary and Romania.
ELI192
will be the first and the world's biggest international laser infrastructure fully dedicated
to external users with an investment volume exceeding EUR 850 million. It is the first ESFRI
project to be fully implemented in the newer EU Member States and pioneers an innovative
funding model, pooling FP7 – Horizon 2020 funds for the preparatory phase, EU Structural
Funds (ERDF) and EIB loans for the construction phase.
The Seal of Excellence is another practical manifestation of the development of synergies
between Horizon 2020 and ESIF. It is a quality label granted to proposals submitted under
Horizon 2020, which succeeded in the highly competitive evaluation but could not be funded
under the available budget. The Seal allows regions, Member States or any other funding
sources (including ESIF) to identify and support these high quality proposals.
While both Horizon 2020 and ESIF aim to maximizing synergies, and there are good
examples as demonstrated above, challenges remain in order to achieve such synergies easily
and systematically on the ground. Overcoming these difficulties would enable especially
Widening countries to better enhance their R&I capacities and enter successfully in the
competitive funding arena.
A dedicated service of the European Commission in DG RTD has an overall coordinating role
regarding widening participation in general, being responsible for the synergies between
Horizon 2020 and ESIF as well as for the implementation of the SEWP specific objective.
Furthermore, since 2014, it chairs the RTD-ESIF contact group that is responsible to follow
the implementation of synergies between Horizon 2020 and ESIF across the different DG
RTD Directorates. In late 2016 it was decided that the mandate of the group will be extended
to cover the issue of widening participation in Horizon 2020.
One of the new tasks of the RTD-ESIF contact group would be to put in place a more
structured monitoring system (both quantitative and qualitative) across the thematic
directorates of DG RTD and other DGs and to keep track of the different widening-related
measures being adopted and their effectiveness.
H.10.4. Achievements so far
Achievements in SEWP
Widening actions led to a high level of participation in all calls under SEWP so far.193
Especially the Teaming action has attracted a lot of attention at political level, with submitted
proposals either coordinated or supported financially by national or regional authorities. In
several countries (e.g. Poland), national competitions were held by relevant Ministries in
order to identify the best proposals for facing the intense competition at the European level –
a first in the history of Framework Programmes. Equally, because of the link (Teaming in
particular) with Smart Specialisation Strategies for Research and Innovation, countries took
192 https://eli-laser.eu/ 193 169, 88 and 553 proposals submitted respectively under the 2014-15 Teaming, ERA Chairs and Twinning calls.

226
the initiative to link the actions with their Operational Programmes in ESIF (e.g. Poland,
Czech Republic).
Under Horizon 2020 so far, 31 Teaming Phase 1, 10 Teaming Phase 2, 67 Twinning and 14
ERA Chairs projects have been funded. Out of a total of EUR 254 million allocated, 73% of
the funding went to partners from low R&I performing countries. In terms of the
achievements of the individual projects of Teaming, Twinning and ERA Chairs, these are not
yet measurable as all projects have started at the earliest in mid-2015 and are still running.
More details can be found under the SEWP thematic annex of the Staff Working Document to
the Horizon 2020 interim evaluation.
Achievements in other parts of Horizon 2020
For the different initiatives undertaken to widen participation across Horizon 2020 mentioned
in Box 2 above, the actions have successfully managed to raise awareness and bring EU-13
stakeholders closer to Horizon 2020, through networking, information sharing and exchange
of best practices. The table below presents the relevant data per country group for FP7 and
Horizon 2020.
Table 41 Key data on participation per country group, FP7 and Horizon 2020
Horizon 2020
FP7, EU-13 EU-13 EU-15 EU-28 Overall
Share of EC contribution 4.2% 4.4% 88.5% 92.9% 100%
Average EC Contribution per year (EUR million) 272 302 6,015 6,318 6,800
Annual EC contribution per inhabitant (in EUR) 3 3 15 12 n.a
Annual EC Contribution per researcher FTE (in EUR) 1,321 1,271 3,808 3,475 n.a
EC Contribution per EUR million spent on R&D (public and private, GERD) N/A 67,524 63,277 63,429 n.a
Share of participations 7.9% 8.5% 82.6% 91.1% 100%
Share of SME participation 9.3% 21.8% 21.2% 21.3% 20.7%
Share of newcomers participations N/A 31.2% 19.7% 20.8% 21.1%
Share of private sector participation 28.7% 31.1% 34.2% 33.9% 33.2%
Share of unique participants 10.9% 11.7% 76.9% 88.6% 100%
Success rate of applications 18.0% 11.1% 14.4% 14.0% 14.1%
Share of Projects Coordinators in Signed Grants 9.7% 5.1% 87.6% 92.7% 100%
Source: European Commission, cut-off data 1 January 2017, and HLEG report on FP7 ex-post evaluation
In spite of the bulk of the newcomers having origin in EU-15, EU-13 has a significantly
larger (31.2%) share of participations of newcomers compared to EU-15 (19.7%).
Some programme parts register however a better EU-13 participation than others, and
better than in FP7, but still quite low. The picture is therefore diversified and a causality link
between measures in place and participation/success rates cannot be defined. Participants
from EU-13 Member States represent 8.5% of the participations in Horizon 2020 and
receive 4.4% of the overall funding, which is slightly more than under FP7 (respectively
7.9% and 4.2%). Overall the EC contribution to participants from EU-13 countries increased
from approximately EUR 270 million per year in FP7 to EUR 300 million per year under
Horizon 2020.
Again, presenting the Member States in terms of EU-13 and EU-15 hides the fact that within
each group performance is far from homogenous. The analysis at country level performed in

227
the table 42 clearly shows that some EU-13 countries are in spite of overall lower Horizon
2020 contribution outperforming the EU-15 average. E.g. Slovenia, Cyprus and Estonia
outperform the EU-15 averages, taking into account the size of the population, the number of
researchers and national investments in R&D.
Furthermore taking national investments in R&D into account, EU-13 Member States on
average outperform EU-15 Member States by 6.7%. The variations in Horizon 2020
funding to a large extent can thus be explained by differences in national investments in R&I.
Overall applications from EU-15 Member States (14.4%) have a higher success rate than
applications from EU-13 (11.6%). Noticeably, EU-13 countries record a higher share of
SME participation that under FP7 (from 18.2% to 21.8%) which is above the performance
of EU-15 countries. The private sector participation also increased compared to FP7 (from
28.7% to 31.1%). There are however big differences between countries as regards the
shares of SME participation - with Hungary, Estonia and Cyprus having the largest share of
around 30% of SME participation.
Table 42 Horizon 2020 contribution normalised by inhabitant, researcher and R&I
investment nationally
H2020
contribution
(EUR million)
CountryPer inhabitant
Per
researcher
FTE
Per EUR
million spend
on R&D
Malta 16 36 19,094 230,759
Lithuania 21 7 2,585 54,264
Latvia 22 11 5,978 141,825
Bulgaria 30 4 2,095 68,791
Croatia 32 8 5,042 85,644
Slovakia 50 9 3,492 54,245
Luxembourg 54 94 18,892 80,767
Cyprus 62 73 71,860 768,657
Estonia 66 50 15,767 217,990
Romania 77 4 4,422 98,703
Hungary 109 11 4,298 72,008
Slovenia 109 53 13,848 128,243
Czech Republic 129 12 3,393 39,751
Poland 185 5 1,908 42,743
Portugal 343 33 8,663 149,794
Ireland 356 75 16,610 121,962
Finland 430 78 11,470 70,879
Greece 435 40 12,396 258,158
Denmark 497 87 11,887 61,706
Austria 576 66 13,609 55,170
Sweden 704 71 10,249 48,267
Belgium 965 85 17,518 95,806
Netherlands 1,566 92 20,337 114,857
Italy 1,664 27 13,786 75,991
Spain 1,813 39 14,806 137,627
France 2,097 31 7,812 43,110
United Kingdom 3,083 47 10,654 70,251
Germany 3,464 42 9,690 39,735
EU-28 18,953 37 10,426 63,429
EU-13 907 9 3,812 67,524
EU-15 18,046 44 11,423 63,277
Source: European Commission, CORDA data, cut-off date 1 January 2017
Horizon 2020 contribution

228
H.10.5. Lessons learnt/Areas for improvement
The EU funding from Horizon 2020 to EU-13 countries has a slow increasing trend (4.2% in
FP7 to 4.4% in Horizon 2020)194
. It is to be noted that some programme parts register
however a better EU-13 participation that others, and better than in FP7, but still quite low.
The picture is therefore diversified and a causality link between measures in place and
participation/success rates cannot be defined. Presenting the Member States in terms of
EU-13 and EU-15 hides the fact that within each group performance is far from
homogenous. The analysis at country level clearly shows that some EU-13 countries are in
spite of overall lower Horizon 2020 contribution outperforming the EU-15 average. E.g.
Slovenia, Cyprus and Estonia outperform the EU-15 averages, taking into account the size of
the population, the number of researchers and national investments in R&D.
Raising participation of low performing countries in Horizon 2020 is a complex and multi-
faceted issue. The measures currently in place have a long term impact and do not result in an
immediate increase of the participation rates of low performing countries.
Widening participation is a shared responsibility, which needs to be addressed both nationally
and at EU level in a complementary way whilst respecting the principles and role of each
level and instrument used. Horizon 2020 can stimulate reforms and leverage higher and better
R&I investments across Europe, but always maintaining R&I excellence as the cornerstone
objective and evaluation criterion, if Europe wants to be able to compete worldwide and
deploy measures that mutually benefit all parties involved.
H.11. International networks for excellent researchers and innovators such as
European Cooperation in Science and Technology (COST)
H.11.1. Overview
COST (Cooperation in Science and Technology) is a European intergovernmental framework
to support the networking of nationally funded research activities. It provides means to jointly
develop ideas and new initiatives across all fields in science and technology, including social
sciences and humanities, through pan-European networking of nationally funded research.
COST receives funding from Horizon 2020 and complements the activities of the programme
itself, in particular by serving as a bridge to the less connected and less supported research
communities of the COST Member States195
.
COST is an integral part of European Research Area (ERA) and contributes to the delivery of
the Europe 2020 agenda and the Innovation Union goals. It aims to increase participation of
researchers from Widening countries196
in European networks, to support the involvement of
early stage researchers and to ensure a gender balance in research. By involving institutions
from Near Neighbour Countries (i.e. the non-COST members Albania, Algeria, Armenia,
Azerbaijan, Belarus, Egypt, Georgia, Jordan, Lebanon, Libya, Moldova, Morocco, the
Palestinian Authority, Russia, Syria, Tunisia and Ukraine) and International Partner
194 Source: European Commission, CORDA data, cut-off date 1 January 2017 195 COST has currently 36 Member Countries (28 EU Member States, Bosnia-Herzegovina, Former Yugoslav
Republic of Macedonia, Iceland, Montenegro, Norway, Serbia, Switzerland and Turkey) and one Cooperating State (Israel). 196Countries eligible for funding under SEWP (EU-15 + Luxembourg + Portugal, Former Yugoslav Republic of Macedonia,
Montenegro, Serbia and Turkey)

229
Countries, COST supports European neighbourhood policy and contributes to the "Open to
the World" objective of Commissioner Moedas197
.
H.11.1. Rationale
COST was set up as the first intergovernmental framework to promote cooperation among
researchers across Europe in 1971, at a time when there was no such research collaboration at
the European level. Since then, COST has become one of the widest frameworks for research
and technology cooperation. For this reason, COST is one of the cross-cutting issues in
Horizon 2020 as specified in Regulation 1291/2013:
“{…} linkages and interfaces shall be implemented across and within the priorities of
Horizon 2020. Particular attention shall be paid in this respect to {…} international
networks for excellent researchers and innovators such as European Cooperation in
Science and Technology (COST). {…} The cross-cutting issues will be supported by a
number of horizontal support measures, including support to {…} administration and
coordination of international networks for excellent researchers and innovators, such as
COST.”
COST is an independent organisation. Its objective is not to fund research itself, but to fund
research networks among R&I stakeholders (academia, public institutions, SME/industry,
NGOs, European/International organisations) through a set of tools such as short term
scientific missions, workshops, conferences, training schools, dissemination activities. These
networks, i.e. COST Actions, are financed via cascade funding based on a competitive
evaluation and selection of proposals. COST organises open calls for the submission of
proposals with collection dates every 6 to 9 months. COST Actions are open to researchers
from universities, public private institutions, NGOs, industry and SMEs regardless of their
scientific disciplines. The average size of a COST action is 50 participants with an annual
budget of EUR 130 000 and a total duration of 4 years.
As the very nature of research environment has become more international and challenge-
oriented over the years, today such networks which facilitate trans-disciplinary collaboration
among researchers and different stakeholders are crucial. Furthermore, COST is facing a large
degree of oversubscription, e.g. 516 proposals were received for the last proposal deadline
date with less than 40 to be funded. Even though oversubscription is considered usual for
programmes with a bottom-up profile, these numbers show the high interest which COST has
created among researchers.
As set out in the Horizon 2020 Work Programme 2016-2017 'Spreading Excellence and
Widening Participation'198
, COST is an integral part of the Innovation Union and the
European Research Area (ERA) and contributes to the delivery of the Europe 2020 agenda
and the Innovation Union commitments199
, notably on business academia collaboration
(commitment 2), mobility and trans-national collaboration (commitment 4), SME
involvement (commitment 7) and knowledge transfer (commitment 21) through efficient
implementation of the COST networking. COST strategic objectives (see table below) are
197https://ec.europa.eu/digital-single-market/en/news/open-innovation-open-science-open-world-vision-europe 198 Horizon 2020 Work Programme 2016-2017 'Spreading Excellence and Widening Participation'
http://ec.europa.eu/research/participants/data/ref/h2020/wp/2016_2017/main/h2020-wp1617-sewp_en.pdf 199 Europe 2020 Flagship Initiative Innovation Union, SEC(2010) 1161
https://ec.europa.eu/research/innovation-union/pdf/innovation-union-communication_en.pdf

230
closely aligned with the priorities of ERA and the objectives of the Widening pillar under
Horizon 2020. Through its "Excellence and Inclusiveness Policy", COST aims to increase
participation of researchers from Widening countries, to support the involvement of early
stage researchers and to ensure a gender-balance.
By their very nature, a large proportion of COST actions are multidisciplinary and focus on
cutting-edge research problems. There are currently about 300 ongoing COST networking
actions covering a wide range of scientific fields. Furthermore, in its recently published
strategy paper, COST has made clear that it aims to respond to future 'megatrends' in the
science system such as digitisation, cross disciplinary research, pooling of resources,
changing relations between science and society.200
Table 40 Objectives of COST
1. Joining research efforts and developing common S&T programmes through coordination of
nationally funded research activities led by pan-European, high quality, collaborative S&T networks
2. Capacity building by providing networking and leadership opportunities for new talents and
thereby contributing to strengthen and build up excellent S&T communities
3. Addressing Societal Questions by promoting trans-disciplinary, new approaches and topics and
identifying early warning signals of unforeseen societal problems aiming at contributing to Societal
Challenges
4. Strengthening COST Inclusiveness Policy by fostering better access and integration of less
research intensive countries’ researchers to the knowledge hubs of the European Research Area with
the aim of contributing to the Widening Pillar of Horizon 2020
H.11.2. Implementation
The implementation of COST as a programme in support of the networking of nationally
funded research activities is under the direct governance of the Committee of Senior Officials
(CSO), the supreme governance body of COST. Each of the 36 Member States is represented
by a delegate in the CSO. The CSO is chaired by a President and a Vice-President, and is
supported by Executive Body (EB), various sub-committees and ad-hoc working groups.
Furthermore, the day-to-day programme implementation falls under the immediate
responsibility of the COST Association which is an international non-profit organisation
under Belgian law.
COST Actions are funded by the European Commission, mainly DG RTD with a total of
EUR 300 million provided equally by two different programme lines (Societal Challenge 6
'Europe in a changing world - inclusive, innovative and reflective Societies'; and 'Spreading
Excellence and Widening Participation'). This financial support is based on Specific Grant
Agreements (SGAs) between the Commission and the COST Association. Even though
COST receives EU funding from two different work programmes under Horizon 2020, the
overall budget is used in an integrated manner. In line with Horizon 2020 Spreading
Excellence and Widening Participation's objectives, COST has developed an inclusiveness
policy, which commits the programme to spend at least 50% of its budget on actions which
benefit research communities in Widening countries.
200 COST, Inspiring researchers, strengthening Europe - Vision and strategic goals for COST, COST 094/16, 1
July 2016, Brussels.

231
The Commission has only observer status in the Committee of Senior Officials as well as in
the Executive Board. DG Research and Innovation Unit B5 'Spreading Excellence and
Widening Participation' is in charge of the policy and operational management of the Grant
Agreement of COST. In order to explore potential synergies and complementarities between
COST and research and innovation projects under Horizon 2020, a network of correspondents
in 8 thematic directorates including DG CONNECT was established in early 2016. This also
shows in practice how COST functions as a cross-cutting issue in Horizon 2020.
In order to track the progress in implementation, two kinds of internal assessments are done
by the European Commission. The first one is the assessment of periodic and final reports of
SGAs. Secondly, the European Commission carries out midterm and final review of the
COST activities with the help of independent experts. The midterm review will take place in
2017. The COST Association also monitors COST activities via Impact Analysis Studies and
Customer Satisfaction Survey201
. In this way, the COST Association evaluates COST
activities in terms of the overall outcome and impact achieved and assesses stakeholders’
satisfaction with COST activities. The Scientific Committee (SC), composed of independent,
high level scientists from all COST Member States, is responsible for the overall supervision
and quality control of procedures related to the submission, evaluation and selection of
proposals, and the monitoring and final assessment of COST actions. In addition, for each
individual COST networking action, an action rapporteur – i.e. external expert - is assigned in
order to assess the outputs and impacts of the Action. Last but not least, every five years, the
COST CSO President reports to the COST Ministerial Conference on progress achieved by
COST.
H.11.3. Achievements so far
At the start of Horizon 2020 in 2014, the COST Association, as an independent, non-profit
organisation, took over the implementation of the COST actions from the European Science
Foundation (ESF). The COST Scientific Committee was renewed. Three open calls were
already published and evaluated and 66 excellent proposals were selected and approved. In
December 2016, according to the information received from the COST Association, there are
about 300 networking actions run by more than 45000 researchers.
International Cooperation continued to be implemented on the basis of mutual benefit, as
defined by COST and confirmed by the candidate international cooperation partner on the
participation of researchers, engineers and scholars from outside Europe. Montenegro
formally became a COST Member in May 2015. There are currently 276 Near Neighbour
Countries participations in COST Actions from 16 countries and 546 International Partner
Countries participations in COST Actions from 38 countries.
The expected impacts of COST are grouped into four objectives: “Joining research efforts and
developing common S&T programmes”, “Capacity building”, “Addressing Societal
Questions” and “Strengthening COST Inclusiveness Policy”. Key Performance Indicators,
KPIs, developed in order to monitor the progress towards achieving the objectives and their
progress are given in the table below.
201 See: http://www.cost.eu/media/newsroom/2014_IA_CSS

232
Table 41 Status of the Key Performance Indicators of COST (Status by April 2016202
)
Objective KPI Target Current
result
Remarks
1. Joining research efforts
and developing common
S&T programmes through
coordination of nationally
funded research activities
led by pan-European, high
quality, collaborative S&T
networks
a) Average increase in size of
the COST Action network
(Openness indicator)
on average 30%
increase at the
end of the Action
50% Above the
target
b) Average number of
reimbursed participants per
Action per year
around 100
reimbursed
participants per
Action per year
80 Slightly
below
target
2. Capacity building by
providing networking and
leadership opportunities for
new talents and thereby
contributing to strengthen
and build up excellent S&T
communities
a) Share of Early Career
Investigators (ECI) among
reimbursed participants in
COST Actions
20% to 50% 36% Within the
target
b) Share of Early Career
Investigators acting as Action
Chairs or Vice-Chairs
10% to 30% Chair: 13%
Vice-
Chair: 10%
Within the
target
3. Addressing Societal
Questions by promoting
trans-disciplinary, new
approaches and topics and
identifying early warning
signals of unforeseen
societal problems aiming at
contributing to Societal
Challenges
a) Number of trans-
disciplinary Actions
Increasing trend 83% Within the
target
b) Share of Actions in the area
of different societal challenges
Between 20%
and 50%
56% Above the
target
c) Share of Actions involving
business enterprises
10 to 50 % of all
Actions
59% Above the
target
d) Share of Actions involving
government organisations
5% to 20 % of all
Actions
23% Above the
target
4. Strengthening COST
Inclusiveness Policy by
fostering better access and
integration of less research
intensive countries’
researchers to the knowledge
hubs of the European
Research Area with the aim
of contributing to the
Widening Pillar of Horizon
2020
a) Share of Actions’ S&T
budget benefiting
Inclusiveness Target
Countries203
50% 32% Below the
target
b) Share of reimbursed
researchers204
from
Inclusiveness Target
Countries
between 35% to
50%
32% Slightly
below
target
c) Average share of
Inclusiveness Target
Countries per Action205
between 40% and
50%
43% Within the
target
Source: COST (status 30/4/2016, periodic report SGA 68146)
With reference to the inclusiveness policy, COST has adopted a list of Inclusiveness Target
Countries (ITC), which corresponds to the Horizon 2020 Widening countries, and has
committed to spend 50% of its budget at the benefit of the research communities in those
countries. Such objective however has not been fully attained. By the end of 2016, the
fulfilment of the target was 40%. A specific task force was launched in July 2016 with
participation of European Commission DG RTD Unit B5 to boost participation and fully fulfil
the KPI. The Task Force came up with a package of measures for Widening countries
including: 1) minimum condition for the inclusion of those countries already at proposal stage
202 This table is established once a year with periodical report due end of April. 203 It was the most conservative calculation used when providing the data. The conservative way meant exclusively the direct
reimbursement to ITC participants at COST Actions' activities. It does not consider strategic, communication efforts and
indirect capacity building effects. 204 Researchers here cover all participants receiving a reimbursement. 205 The KPI looks into the proportion of COST Member Countries within the MC members of an Action.

233
(based on a fixed ratio); 2) the obligation to fill at least one key position of the management
committee (chair, vice chair, working group leaders); 3) a new conference grant for young
researchers, 4) the development of a mentoring scheme for improving payment modalities.
This package of measures was adopted by the CSO in November 2016 for implementation in
2017. Regarding the participation of early career investigators in COST actions, the KPI was
fully attained (36% versus minimum requirement of 20%).
Societal impacts are mainly achieved indirectly at the level of the individual networking
actions. 83% of these actions are trans-disciplinary. 56% of these actions are addressing all
societal challenges tackled by Horizon 2020 and 59% include business entities and %23
government organisations. Further to that, there is an active participation of SMEs in 59% of
all networking actions.
H.11.4. Lessons learnt/Areas for Improvement
When evaluating the potential of COST to contribute to the Innovation Union there is still
some potential for improvement. As a generic broad KPI the participation of business
enterprises has already attained the level of 59 % but could still be strengthened. In addition
COST could elaborate more on its contribution to some concrete commitments of the
Innovation Union.
With reference to the overall Widening expenditure indicator, the 50% spending target has not
yet been fully attained. In order to boost participation, the set of measures proposed by the
task force on Widening and inclusiveness need to be further implemented.
COST networking actions are in general relatively specialized which might impact the
visibility and policy impact of COST actions. Finally, as stated in the COST new strategy
paper, which looks at some 'megatrends' in the science system, innovative networking tools
incorporating new digital technologies need to be developed.
H.12. International cooperation - Cooperation with third countries
H.12.1. Overview
The Horizon 2020 Regulation states that international cooperation shall be promoted and
integrated into the programme to achieve, in particular, the objectives of strengthening the
Union's excellence and attractiveness in research and innovation as well as its economic and
industrial competitiveness, effectively tackling common societal challenges, and supporting
the Union's external and development policy objectives. Targeted international cooperation
actions shall be implemented on the basis of common priorities and mutual benefits, taking
account of scientific and technological capabilities, market opportunities and expected impact.
H.12.2. Rationale
Although certain fields of research have been broadly international since several decades, in
recent years the worldwide landscape of research and innovation (R&I) has undergone
substantial transformations, shifting towards an increasingly globalised and multipolar
network of science and technology actors. In this context, the European Union's political
priority to remain a major global actor through an R&I system that is open to the world
requires cooperating more closely with international partner countries.

234
International cooperation strengthens the Union's R&I excellence, attractiveness and
competitiveness by enabling European R&I access to the global state of the art knowledge,
research test beds and innovation advances in fields where Europe is less specialised. It is
attracting the best minds to perform R&I in Europe, facilitating European researchers to
pursue an international career and giving access to European researchers to systems and
resources that are not found in Europe. Indeed, bibliographic studies indicate a relatively
higher scientific impact of researchers with international experience while international co-
publications tend to be more often cited206
.
The need for international cooperation in order to strengthen the Union's competitiveness in
R&I is more pressing now than ever as more R&I is performed outside Europe207
. There has
been a significant drop in the EU's share of the world's gross expenditures in R&D, from
around one fourth in 2000 to around one fifth in 2013, in the output of scientific publications,
from around one third in 2000 to slightly more than one fourth in 2013 and in patent
applications, from more than one third in 2000 to less than one fourth in 2013208
.
Global challenges call for global mobilisation of resources and coordination of activities. For
example, international cooperation allows research on treatments for infectious diseases or on
climate change to be performed more efficiently and to maximize impact. Furthermore, an
increasing number of research fields require infrastructures which are so sophisticated or
costly that they exceed the capabilities of a single country, thereby leading to major
multinational collaborations.
The objectives of international cooperation under Horizon 2020 apply in different ways
depending on the international partner country or region, while areas for cooperation are
identified on the basis of R&I capacities, market access opportunities, the contribution to
international commitments, and the R&I framework conditions in place. For EEA, EFTA and
EU enlargement countries, the focus is on fostering integration into the European Research
Area. For European Neighbourhood Policy countries, the objective is to support a Common
Knowledge and Innovation Space, including mobility for academics and capacity building.
For industrialised countries and emerging economies, the focus is on increasing
competitiveness, joint tackling of global challenges and increasing participation in
international value chains. For developing countries, the emphasis is on promoting their
sustainable development and addressing global societal challenges.
H.12.3. Implementation
The objectives for international cooperation are implemented by opening up Horizon 2020 to
researchers and innovators from across the world and supporting targeted activities on the
basis of priority areas for cooperation with international partner countries and regions. The
political ambition in Horizon 2020 is to maintain international cooperation activities at least at
the level of FP7.
Participation of third-country entities in Horizon 2020 can lead to different types and levels of
cooperation. Entities from associated countries (AC) enjoy the highest level of cooperation as
206 See Fig. I-2-37 and I-2-44 of "Science, Research and Innovation Performance of the EU", European Commission (2016). 207 See e.g. "Science, Research and Innovation Performance of the EU", European Commission (2016), or "Study on EU
positioning: An analysis of the international positioning of the EU using revealed comparative advantages and the control of
key technologies", Fraunhofer, IDEA Consult, DG RTD A.6 (2016). 208 See Fig. I-2-5, I-3-1 and I-3-15 of "Science, Research and Innovation Performance of the EU", European Commission
(2016).

235
they can participate and be funded under the same rules that apply for EU Member States.
International cooperation with third-country209
entities is primarily achieved through their
participation in grant agreements of collaborative210
projects of Horizon 2020, where entities
from EU or associated countries and third-countries submit together a proposal under a
Horizon 2020 call. Depending on the eligibility for funding of the third-country participants,
they can either receive funds from Horizon 2020 or not211
.
Furthermore, in projects of “joint” and “coordinated” calls, Horizon 2020 and third-country
R&I programmes coordinate calls under which EU and/or AC participants collaborate with
third-country participants, each side being funded by the respective programme. In projects
under “twinning” calls, cooperation is achieved mainly through the co-organisation of
activities such as workshops, exchange of results etc.
Several calls of the Horizon 2020 work programmes contribute to the objectives of various
multilateral initiatives tackling societal challenges with the participation of the EC, national
and regional funding agencies. Even if participants of projects under these calls do not
necessarily directly collaborate with third-country entities, they contribute to the shared scope
and priorities of the multilateral initiative.
International cooperation through promoting R&I staff mobility at an international level is
achieved by participation of third-countries in projects under the Marie Skłodowska Curie
actions (MSCA).
Funding bodies of EU or AC and third-countries can also join to issue calls under joint
programming such as the ERA-NETs and the Article 185 initiatives. Depending on the
specific rules for participation, third-country participants can then collaborate in projects
funded under these calls.
The international dimension of Horizon 2020 is also reflected by the number of ERC grant
holders and researchers funded under MSCA grants that are non EU nationals, since Horizon
2020 is open to participation and funding of people of any nationality.
While Horizon 2020 is generally open to third-countries, certain topics of the Horizon 2020
Work Programmes (WP) have been flagged as particularly relevant for international
cooperation. This helps identify the extent of WP topics that have a strong international
dimension and encourage international cooperation, but also as a service provided in the
Horizon 2020 participant portal in order to better guide potential applicants.
A set of key indicators have been identified to measure achievements towards international
cooperation within Horizon 2020. They relate to the share of third-country participations in
Horizon 2020 and the EU financial contribution attributed to them, as well as the share of
budget of topics in the WPs that are flagged as particularly relevant for international
cooperation. Further indicators that are more connected to research results and the
international impact of Horizon 2020 (such as Horizon 2020-funded international co-
209 Here referring to all countries that are neither EU Member States nor associated to Horizon 2020. 210 As "collaborative" we refer to projects under non bottom-up, internationally open calls of Horizon 2020, i.e. all parts
except for the ERC, Marie Skłodowska-Curie Actions, the SME instrument and the "Access to Risk Finance". 211 The list of countries that are automatically eligible of funding from Horizon 2020 can be found in Appendix A of the
Horizon 2020 Main Work Programmes.

236
publications and co-patents) will become more trustworthy in the coming years, as more
projects deliver results.
The EU international cooperation policy also includes improving the framework conditions
that underpin international cooperation. Such conditions may refer to reciprocity in accessing
public funding, research data or infrastructures, to standards for research integrity, or to the
ability to fund a single Horizon 2020 project from third country sources in addition to the EU
funding. Today, nine industrialised countries and emerging economies provide support for
funding the participation of their researchers in Horizon 2020212
.
Another area of action under the EU international cooperation policy deals with exploiting
synergies between Horizon 2020 actions and activities of other EU programmes and policies.
For instance, synergies are exploited with the 'EU Macro-regional Strategy for the Danube
Region' and the Instrument for Pre-Accession Assistance, aiming to increase the effectiveness
of investments into R&I, enhance the regional research and education capacity and develop
smart specialisation strategies for R&I. Complementarities have also been developed with the
programme for S&T Innovation and capacity building in African, Caribbean and Pacific
countries of the European Development Fund, the European Neighbourhood Instrument, the
R&I pillar of the Cross Border Cooperation Programme for the southern Mediterranean
countries, and the African Union Research Grants.
H.12.4. Achievements
Key indicators
The main indicators for monitoring the implementation of international participation in
Horizon 2020 are i) the share of third-country participations213
in collaborative projects; ii) the
share of EU contribution to participants from third-countries and iii) the share of budget of
topics in the WP that are flagged as particularly relevant for international cooperation. Since
the rules for participation are different for countries that are either associated or non-
associated (third countries) to Horizon 2020, different figures are computed for each of these
cases214
.
As of January 2017, the share of third-country participation in collaborative projects is 2.5%
in Horizon 2020215
as compared to 4.3% in FP7216
(see Table below). The same share is 6.7%
for associated countries including Switzerland and 4.3% excluding Switzerland.
212 Australia, China, India, Japan, Mexico, Russia, South Korea and regions of Brazil and Canada. 213 For sake of brevity, in the following we will occasionally refer to “entities from third countries” as “third countries” (e.g.
“participation of South Africa in Horizon 2020” is meant to abridge “participation of entities from South Africa in Horizon
2020”). 214 Following the International Agreement of 5 December 2014 associating Switzerland to parts of Horizon 2020,
Switzerland has an associated country status for actions under these parts, while it remains a non-associated country for the
rest. For this reason, the values of the indicators for associated countries are presented both with and without Switzerland. 215 2.5% (2.6%) including (excluding) projects under Joint Technology Initiatives. 216 4.3% (4.6%) for the same countries as in Horizon 2020 and including (excluding) projects under Joint Technology
Initiatives (JTI). 4.9% for third countries non-associated to FP7, excluding JTIs.

237
Table 42 Share of non-EU participations in the number of total participations to
Horizon 2020, for signed contracts in collaborative projects
Indicators Horizon 2020 FP7 Baseline* Target
Third countries (excluding Switzerland) 2.5% 4.3% 4.3%
Associated countries (including Switzerland) 6.7% N/A N/A
Associated countries (excluding Switzerland) 4.3% N/A N/A
Source: CORDA; Signed grants cut-off date by 1/1/2017 *FP7 figures are presented for the same countries as for Horizon 2020.
Regarding the EU contribution to third-country participants in collaborative projects, as
shown in the table below, it has dropped from 1.8% in FP7 to 0.8% in Horizon 2020.
Table 43 Share of EU financial contribution to non-EU participants in total Horizon
2020 EU contribution, for signed contracts in collaborative projects
Indicators Horizon 2020 FP7 Baseline*
Third countries (excluding Switzerland) 0.8% 1.8%
Associated countries (including Switzerland) 4.8% N/A
Associated countries (excluding Switzerland) 4.1% N/A
Source: CORDA; Signed grants cut-off date by 1/1/2017 *FP7 figures are presented for the same countries as for Horizon 2020.
Four significant reasons can be identified behind the drop of third-country participations and
EU contribution217
: 1) the change in the eligibility conditions for funding of BRICM218
countries in Horizon 2020 with respect to FP7, 2) the effects of mainstreaming international
cooperation in Horizon 2020 as opposed to the dedicated “Activities of International
Cooperation” theme of FP7, 3) the absence of a funding scheme that mandates international
participation in Horizon 2020 as opposed to the 'Specific International Cooperation Actions'
(SICA) scheme of FP7 and 4) to a lesser extent, because of a significant drop in the EU
neighbourhood, supposedly due to recent conflicts and socio-political developments in the
region.
On the other hand, the share of budget allocated to topics of the WPs that are flagged as
particularly relevant for international cooperation219
has increased, from 12% in FP7 to
around 23% in Horizon 2020. As shown in the table below, a total of EUR 3 175.8 million are
allocated by the EC to international cooperation topics, with the biggest share coming from
LEIT-ICT, Research Infrastructures, SC4 "Smart, green and integrated transport", SC1
"Health, demographic change and well-being" and SC2 "Food security, sustainable
agriculture and forestry, marine, maritime and inland water research and the bioeconomy" and
SC4 "Smart, green and integrated transport".
217 For more details, see "Performance Analysis of International Participation in Horizon 2020", October 2016, European
Commission, DG RTD-C. 218 Brazil, Russia, India, China and Mexico 219 These are topics that mention at least one third country or region or encourage third-country entities to apply.

238
Table 44 Percentage of budget of topics in the Horizon 2020 Work Programme 2014-
2015 that are particularly relevant for international cooperation
Programme part* Allocated EU
budget to
International
Cooperation topics
(EUR million)
Share of EC
contribution to
International
Cooperation
topics
FET - Future and Emerging Technologies 94.5 19.8%
RI - Research Infrastructures 551.0 63.3%
LEIT-ICT 585.0 23.8%
LEIT-NMBP 267.6 18.8%
LEIT-SPACE 31.2 9.3%
SC1 - Health, demographic change and well-being 364.5 23.4%
SC2 - Food security, sustainable agriculture and forestry,
marine, maritime and inland water research and the bioeconomy
287.0 37.6%
SC3 - Secure, clean and efficient energy 179.8 11.0%
SC4 - Smart, green and integrated transports 365.5 29.0%
SC5 - Climate action, environment, resource efficiency and raw
materials
223.3 26.0%
SC6 - Europe in a changing world - Inclusive, innovative and
reflecting societies
69.2 21.6%
SC7 - Secure societies - Protecting freedom and security of
Europe and its citizens
77.0 18.3%
SEWP - Spreading excellence and widening participation 0.1 0.1%
SWAFS - Science with and for society 14.1 13.0%
Euratom 63.9 12.4%
Total Horizon 2020 3 175.8 23.3%
Source: CORDA data; extraction on 1/1/2017 *Bottom-up/not internationally open parts (FTI, ERC, MSCA, "Access to Risk Finance" and "Innovation in SMEs") not shown.
In the following, a more detailed analysis of the participation of the third and associated
countries as well as international participation in the different programme parts, types of
action and how they compare to FP7220
is provided.
Performance of entities from associated or third countries
Regarding countries that are not automatically eligible for funding from Horizon 2020, the
most active up to January 2017 in terms of participations are the USA, China, Canada, Brazil
and Australia as compared to USA, Russia, China, Brazil and Australia in FP7. The change in
the eligibility conditions for automatic funding in Horizon 2020 has affected the BRICM
countries apart from China and to a lesser extent, Brazil. In particular, the participation share
of the non-BRICM third countries has dropped by around 40% from FP7 to Horizon 2020. A
drop is also registered for China (around 25%) Brazil (30%), Mexico (40%), Russia (75%)
and India with a drop of close to 85%.
The participation share of third countries that are automatically eligible for funding from
Horizon 2020 has dropped by around 30% with respect to FP7. The most active country in
Horizon 2020 is South Africa, followed by Argentina, Chile, Kenya and Egypt, as compared
to FP7, where the most active countries were South Africa, Argentina, Morocco, Egypt and
Chile. The overall drop is partly attributed to the absence in Horizon 2020 of the FP7 SICA
220 Results not emanating from the tables included are taken from "Performance Analysis of International Participation in
Horizon 2020", October 2016, RTD-C.

239
scheme and the "Activities of International Cooperation" theme. The first accounted for
around 25% and the second for around 11% of the participations from developing counties in
FP7, more than three times the corresponding 7% and 3% share for industrialised countries.
Therefore, their absence in Horizon 2020 affected more the developing than the industrialised
countries. Also, the participation share of developing countries from the Southern
Neighbourhood region has fallen by almost 55% in Horizon 2020 with respect to FP7 while
for countries outside this region the fall is around 25%. It is reasonable to conclude that the
recent socio-political turmoil in some of these countries has affected their participation in the
Framework Programme.
Table 45 Participations and EU financial contribution to signed grants of collaborative
projects of the 10 most active third countries
Third countries Number of participations in signed grants
EU contribution to participants of signed grants (EUR million)
Horizon 2020 (up
to Jan '17)
FP7 Horizon 2020 (up to
Jan '17)
FP7
United States 116 509 19.2 79.0
China 81 334 2.2 32.8
South Africa 75 233 16.5 33.1
Canada 50 198 3.1 11.2
Brazil 50 217 7.6 31.3
Australia 45 199 3.7 12.0
Russian Federation
43 520 1.7 69.5
Kenya 27 72 4.7 12.1
South Korea 26 67 0.2 1.94
Mexico 24 118 0.0 17.4
Third countries* 897 4 721 108.4 575.8
All countries 36 149 111 316 13 621 32 833
Source: CORDA, extraction date 1/1/2017 Note: Data for Beneficiaries only (third-parties are not included). *FP7 figures are presented for the same countries as for Horizon 2020.
The participation of third countries in MSCA and ERC grants is presented in the following
table221
. Participations in MSCA account for more than half of all participations of third
countries in Horizon 2020. The drop in the share of participations from FP7 to Horizon 2020
(10.4% in Horizon 2020 compared to 11.8% in FP7) is not as significant as that among
projects in the rest of the programme. As for participations in the SME instrument, there are
two exceptional participations with EU contribution of EUR 0.37 million.
221 For MSCA actions, both beneficiaries and "partner organisation" participants are included.

240
Table 46 Participations and EU financial contribution to MSCA and ERC signed grants
of the 10 most active third countries
Third countries MSCA Third countries
ERC
Participations* EU contribution
(MEUR)
Participations EU contribution
(MEUR)
United States 468 0.25 United States 8 1.51
China 96 0.00 Brazil 2 1.07
Australia 78 0.26 New Zealand 2 0.33
Canada 75 0.00 Chile 1 0.51
Argentina 57 0.20 South Korea 1 0.49
Brazil 47 0.00 Colombia 1 0.42
Japan 45 0.05 Australia 1 0.16
Chile 40 0.21 Singapore 1 0.15
South Africa 31 0.00 Guatemala 1 0.09
Russian Federation
27 0.00 Canada 1 0.06
Third countries 1241 0.98 Third countries 22 4.90
All countries 11 892 2 097 All countries 2 711 3 871
Source: CORDA, extraction date 1/1/2017 *Participations include beneficiaries and partner-organizations
Including collaborative, MSCA, ERC and SME instrument actions, the EU contribution to
participants from third countries is EUR 114.65 million, which amounts to 0.56% of the EUR
20 400 million total EU contribution.
Regarding associated countries, the most active in terms of participations are Switzerland,
Norway and Israel, followed by Turkey and Serbia. There is a slight drop in participation
shares from FP7 to Horizon 2020 for the most active countries, with the exception of Serbia
whose share has increased by around 50%. If Switzerland - that was not associated to all parts
of Horizon 2020 until 2017 - is excluded, the share of EU financial contribution to
beneficiaries has remained stable: 4.1% in Horizon 2020 compared to 4.0% in FP7. The
biggest recipient of EU contribution for collaborative projects is Norway while more than half
of the EU contribution to Israel is given via ERC grants. The change from 2014 to 2015 is
generally positive both for participations and EU contribution shares.
Table 47 Participations and EU financial contribution to signed grants of collaborative
projects of associated countries
Associated countries Participations from Associated Countries
EU contribution to participants in signed grants (EUR million)
Horizon 2020 (up
to Jan '17)
FP7 Horizon 2020 (up to
Jan '17)
FP7
Switzerland 889 3 327 91.2 1 140.2
Norway 632 1 980 299.4 608.2
Israel 288 1 093 126.1 381.7
Turkey 249 888 58.1 148.0
Serbia 125 264 24.0 59.5
Iceland 73 224 31.7 53.0

241
Associated countries Participations from Associated Countries
EU contribution to participants in signed grants (EUR million)
Horizon 2020 (up
to Jan '17)
FP7 Horizon 2020 (up to
Jan '17)
FP7
Ukraine 52 201 5.7 23.0
FYROM 28 83 2.0 10.9
Moldova 21 41 1.7 3.1
Tunisia 15 39 1.9 2.7
Bosnia & Herzegovina 14 103 1.6 12.1
Georgia 14 60 0.7 4.6
Montenegro 10 37 0.2 3.8
Armenia 9 40 0.3 3.1
Faroe Islands 8 37 1.4 2.1
Albania 7 14 2.2 2.4
Associated countries* 2434 8431 648.3 2 458.2
All countries 36 149 111 316 13 621 32 833
Source: Corda, extraction date 1/1/2017 Note: Data for Beneficiaries only (third-parties are not included). *FP7 figures are presented for the same countries as for Horizon 2020.
Entities from associated countries enjoy the same level of participation in Horizon 2020 as
Member States. Therefore, they are eligible to participate in mono-beneficiary calls such as
the ERC and those under the SME instrument, as well as in calls that are not open to third
countries such as the "Access to Risk Finance" part. The table below shows the participations
and EU contribution to associated countries for ERC, MSCA and the SME Instrument actions.
Almost half of participations to MSCA are from Switzerland, while Israel is first in ERC
grants and grants under the SME Instrument. Also, there is one (Swiss) participation in a
signed grant under "Access to Risk Finance", with no EU contribution.
Table 48 Participations of and EU financial contribution to associated countries for
signed grants of MSCA, ERC and the SME Instrument
Countries MSCA ERC SME Instrument
Partici-
pations*
EU contribu-
tion (MEUR)
Partici-
pations
EU contribu-
tion (MEUR)
Partici-
pations
EU contribu-
tion (MEUR)
Switzerland 327 61.6 162 264.6 0 0.00
Israel 110 16.2 145 187.9 66 28.0
Norway 105 25.2 22 38.3 47 13.6
Turkey 67 6.8 14 14.3 15 4.6
Serbia 38 1.7 1 1.7 5 1.8
Ukraine 36 2.9 0 0.00 2 1.3
Iceland 20 3.7 2 0.00 13 2.6
Tunisia 10 0.41 0 0.00 0 0.00
Bos. & Herz. 8 0.35 0 0.00 0 0.00
Armenia 6 0.00 0 0.00 0 0.00
Moldova 5 0.46 0 0.00 0 0.00
Georgia 4 0.52 0 0.00 0 0.00

242
Countries MSCA ERC SME Instrument
Partici-
pations*
EU contribu-
tion (MEUR)
Partici-
pations
EU contribu-
tion (MEUR)
Partici-
pations
EU contribu-
tion (MEUR)
Albania 3 0.08 0 0.00 0 0.00
Montenegro 3 0.00 0 0.00 0 0.00
FYROM 2 0.13 0 0.00 0 0.00
Faroe Islands 0 0.00 0 0.00 1 0.05
Associated countries*
687 120.1 346 509.0 149 51.9
All countries 11 892 2 097 2 711 3 871 2333 781.7
Source: CORDA, extraction date 1/1/2017 *Participations include beneficiaries and partner-organizations
Including collaborative, MSCA, ERC and SME instrument actions, the EU contribution to
participants from associated countries is EUR 1329.3 million, which is 6.5% of the EUR 20
400 million total EU contribution.
Performance of the different programme parts and types of action
MSCA have the highest number and share of third-country participations. The other parts that
perform above average are Societal Challenges 6 – "Europe in a changing World – Inclusive,
innovative and reflecting societies", 5 – "Climate action, environment, resource efficiency and
raw materials" and 2 – "Food security, sustainable agriculture and forestry, marine, maritime
and inland water research and the bioeconomy". The parts with the least international
participation are the Future and Emerging Technologies, LEIT-ICT, LEIT-NMBP
(Nanotechnology – Materials – Biotechnology – Primary metals) as well as Societal
Challenges 3 – "Secure, clean and efficient energy", 4 – "Smart, green and integrated
transports" and 7 – "Secure societies – Protecting freedom and security of Europe and its
citizens" . In terms of EU contribution to third-country participants, the highest and lowest
performing parts are the same as before, except for Research Infrastructures and the Societal
Challenge 1 – "Health, demographic change and well-being", with a relatively high EU
contribution to third country participants, but also the MSCA, where the EU contribution is
relatively low as there are only exceptional third-country beneficiaries222
.
Apart from the MSCA mentioned above, other types of action with significant international
participation are the Coordination and Support Actions (CSA) and the Research and
Innovation Actions (RIA). In terms of EU contribution, third-country beneficiaries receive EU
funds mostly under the RIA, followed by the CSA (although with a higher share among
recipients).
The strong international performance of the MSCA is expected since all its four main actions
support the international mobility of researchers, in particular MSCA-RISE and the Global
Fellowships of the MSCA-IF schemes. On the other hand, the SME instrument has only two
and the ERC eighteen exceptional participations since these mono-beneficiary types of action
are, up to exceptions, restricted to entities from EU or associated countries.
222 In the MSCA-RISE program, third-country partner-organisation participants from countries that are eligible for automatic
funding can receive indirect EU contribution.

243
Innovation actions (IA) include significantly less international participation than RIA. Indeed,
more than 35% of all participations of Horizon 2020 are of private for-profit entities (PRC),
while the same number among third-country participations is only 22%. This is even more
manifest within IA, where the figures are 52% of PRC against only 29% within non-AC
participations.
Projects of Public-Private Partnerships (the contractual PPP and the JTIs) have either no or
very few international participants, except for the JTI “Innovative Medicines Initiative”
(IMI2). Regarding Public-Public Partnerships, the ERA-NET-Cofund actions are among the
most international types of action with a third-country participation share at around 5%. Also,
three out of the four Horizon 2020 Article 185 Initiatives cooperate with non-Associated
Countries (which are not participating states in the sense of the basic act): the EDCTP2
programme has a very strong international dimension via participation of 14 sub-Saharan
countries, while Canada cooperates in AAL2 and South Korea in Eurostars2223
. On the other
hand, 'European Joint Programme' (EJP) projects have no international participants.
Regarding the EU's investment in topics directly related to the objectives of multilateral
initiatives:
In health-related initiatives (IRDiRC, IHEC, IHMC, IKMC, ICGC, InTBIR, GACD,
GloPID-R, GTBVP) during 2014-2015 the EU's investment has been around EUR 114
million, leveraging around EUR 532 million, while the EU investment for 2016-2017 is
expected to be higher than EUR 120 million, leveraging around three times more non-EU
funding.
In activities related to climate action and the environment such as the 'Belmont Forum', the
Group on Earth Observation (GEO) and the Intergovernmental Panel on Climate Change
(IPCC), the total Horizon 2020 budget for these topics is close to EUR 200 million, while
the total investment by all partners is estimated to be around three to four times this
amount.
The key indicators presented above do not capture cooperation through projects under joint or
coordinated calls, where the third-country partners are not beneficiaries of an EU grant. The
Work Programmes of Horizon 2020 for 2014-15 and 2016-17 contain 21 joint/coordinated
calls that have so far led to more than 30 projects of around 220 participations from EU or
associated countries, receiving EUR 55 million from the EU. With a roughly equal number of
third-country participants, this corresponds to around 25% of the total third-country
participations to collaborative projects.
In FP7 there were 31 coordinated calls, leading to 91 projects of around 790 participations
that received close to EUR 153 million from the EU, which is roughly three times more than
the current Horizon 2020 figures. Assuming that there will not be a large change in the
number of signed projects under joint/coordinated calls in the rest two thirds of Horizon 2020,
it can be concluded that joint/coordinated projects of Horizon 2020 and FP7 have similar
participations and EU contribution.
223 For more details, see the dedicated Staff Working Documents for the art. 185 and 187 initiatives.

244
H.12.5. Lessons learnt/Areas for improvement
The discontinuation in Horizon 2020 of the dedicated international cooperation theme and
specific international cooperation actions of FP7 has not been accompanied by a transversal
increase of international participation across the different parts of Horizon 2020, while the
change in the funding eligibility conditions for certain third countries has negatively affected
their participation to the programme.
Furthermore, Horizon 2020 attracts third-country research organisations more than private
for-profit entities, with Innovation Actions being among the least international of the
programme. The programme's increased focus on closer-to-market activities has required
finding an appropriate balance between engaging in international cooperation and
safeguarding the interests of the EU's companies.
Corrective actions have been taken to improve international participation in Horizon 2020,
including increasing the number of work programme topics that are specifically relevant for
international cooperation, improving the framework conditions for international collaboration,
and refining the communication strategy to ensure global awareness of EU's strengths and of
the international openness of Horizon 2020.
In particular, the budget allocated to Horizon 2020 WP topics flagged as particularly relevant
for international cooperation has increased, from 12% in FP7 to over 22%. It should be noted
though that there are only very few topics for which international participation is mandatory.
Regarding framework conditions, a priority has been to stimulate and assist industrialised
countries and emerging economies in setting up mechanisms to fund the participation of their
researchers in Horizon 2020 actions. So far, mechanisms exist in several countries – including
Australia, China, India, Japan, Mexico, Russia, South Korea and regions of Brazil and
Canada, and efforts are continuing to broaden their scope of application. Furthermore, global
multilateral fora in different thematic fields have addressed framework conditions such as
open access to research data and infrastructures in their respective fields.
Regarding collaboration with developing countries, the priority has been to enhance the
synergies with the external instruments and ensure that science, technology and innovation are
taken on board in the planning of the national and regional programmes. This is in line with
the Sustainable Development Goals' strategy which encompasses science, technology and
innovation as an effective engine for sustainable development.
Regarding the communication strategy, the EC has continued its 'Horizon 2020 – Open to the
World' communication campaign to ensure that the programme is known worldwide. It has
also improved visibility and guidance on the Participant Portal and the international
cooperation website. The EU delegations have contributed to promote the EU strategy, and
Horizon 2020 National Contact Points have continued to provide guidance and advice to
researchers and assisting in partner search. Furthermore, a series of bilateral policy support
projects with partner countries and regions have carried on with awareness raising, while the
EC is setting up a facility to provide services in support of further policy development,
priority-setting and implementation of international cooperation.
Moreover, the updating of the roadmaps for international cooperation has been synchronised
with the Horizon 2020 strategic programming cycle such that science and technology policy

245
dialogues and cooperation roadmaps can effectively serve as a basis for priority setting in
programming.
H.13. Science and Society: Responsible Research and Innovation
H.13.1. Overview
Responsible Research and Innovation (RRI) is a cross-cutting issue in Horizon 2020 that
encourages societal actors (researchers, citizens, policy makers, businesses, third sector
organisations, etc.) to work together during the whole research and innovation (R&I) process
to better align R&I and its outcomes with the values, needs and expectations of society. In
practice, it means taking action in the five following dimensions: public engagement, science
education, gender equality, ethics, and open access/data. Where relevant, it also involves
institutional changes to governance frameworks224
.
H.13.1. Rationale
Regulation (EU) No 1291/2013 refers to Responsible Research and Innovation (RRI) on
several instances, outlining the rationale for this cross-cutting issue (CCI). For instance,
Recital 22 states that "Horizon 2020 should foster the informed engagement of citizens and
civil society in research and innovation matters by promoting science education, by making
scientific knowledge more accessible, by developing responsible research and innovation
agendas that meet citizens' and civil society's concerns and expectations and by facilitating
their participation in Horizon 2020 activities. The engagement of citizens and civil society
should be coupled with public outreach activities to generate and sustain public support for
Horizon 2020". These activities are to be carried out with the aim of ensuring that R&I deliver
smart, inclusive and sustainable solutions to societal challenges by engaging new
perspectives, new innovators and new talent225
.
In the 'real world' these aspirations are leading to the emergence of different kinds of R&I
infrastructures and modes of R&I, such as citizen science, open innovation platforms226
,
Living Labs227
and programmes dedicated to RRI launched by research institutes. These
engage and open up R&I to stakeholders including SMEs, third sector organisations, policy
makers, citizens, end-users and students. In this way, the beneficiaries of R&I contribute to
research (e.g. agenda setting, scientific research, analysis of results and policy development)
and innovation (e.g. ideation, concept design, rapid prototyping and verification of results).
The accelerating pace of the co-evolution of science and society makes new ways of
conducting R&I ever more important at all levels of governance, as exemplified by
Commission Moedas' 3Os Strategy. As underlined by Commissioner Moedas, "an invention
becomes an innovation only if users become a part of the value creation process. Notions
such as 'user innovation'… emphasize the role of citizens and users in the innovation
processes as 'distributed' sources of knowledge. This kind of public engagement is one of the
aims of the Responsible Research and Innovation programme in Horizon 2020"228
. Citizen
224 http://ec.europa.eu/research/swafs/index.cfm?pg=about. 225 http://ec.europa.eu/research/participants/data/ref/h2020/legal_basis/fp/h2020-eu-establact_en.pdf. 226 See for instance https://ec.europa.eu/growth/tools-databases/regional-innovation-monitor/support-measure/manner-
suomi/six-city-programme-6aika-open-innovation-platforms-spearhead-project. 227 See for instance, http://www.enoll.org/ and http://www.iemed.org/llista_activitats-en/the-mediterranean-as-an-open-
living-lab?set_language=en. 228 https://ec.europa.eu/digital-single-market/en/news/open-innovation-open-science-open-world-vision-europe

246
science aims to encourage citizens to become involved in the science itself: "Citizen Science
can contribute to the Commission’s goal of Responsible Research and Innovation, as it
reinforces public engagement and can re-direct research agendas towards issues of concern
to citizens"229
.
The 2014 Rome Declaration on RRI in Europe230
argued that good marketing cannot be relied
upon for R&I acceptability, that diversity in R&I is "vital for enhancing creativity and
improving scientific quality", and that "early and continuous engagement of all stakeholders
is essential for sustainable, desirable and acceptable innovation". Building on the Lund
Declaration of 2009 (which called for an emphasis on tackling societal challenges) and the
Vilnius Declaration of 2013 (which underlined the need for resilient partnerships with all
relevant actors for research to serve society)231
, the Rome Declaration called on "European
Institutions, EU Member States and their R&I Funding and Performing Organisations,
business and civil society to make Responsible Research and Innovation a central objective
across all relevant policies and activities, including in shaping the European Research Area
and the Innovation Union". The R&I Commissioners' meeting on 25 May 2016 re-iterated the
need to promote RRI throughout the Horizon 2020 Work Programme; all parts of Horizon
2020 are therefore expected to make efforts to embed RRI to bring science closer to society
and vice versa. As part of interim evaluation activities of Horizon 2020, the European
Economic and Social Committee found very strong support for the involvement of civil
society organisations in Horizon 2020 project consortia (81% of those who responded to a
targeted survey)232
. In addition, the open public online consultation on the Science with and
for Society (SWAFS) Work Programme 2018-2020 received 104 contributions representing
more than 6,500 organisations from a wide range of stakeholder groups (e.g. industry,
academia, civil society) and found a very high degree of support for integrating RRI across
Horizon 2020233
.
H.13.2. Implementation
The Key Performance Indicator (KPI) for RRI in Horizon 2020 is "instances where citizens,
Civil Society Organisations (CSOs) and other societal actors contribute to the co-creation of
scientific agendas and scientific contents"234
. It is a proxy for actions across the five
dimensions of RRI, though like most KPIs it imperfectly captures the concept.
Mainstreaming/embedding RRI across Horizon 2020 is the responsibility of a dedicated
service with the European Commission, DG RTD which is also responsible for the Science
with and for Society (SWAFS) programme part. This service regularly screens Scoping
Papers and Work Programmes to monitor how RRI is being embedded in Horizon 2020.
Meetings are held with EC services responsible for other parts of Horizon 2020 on an ad hoc
basis, and briefings are written to support other EC services to embed RRI. Recently, a
229 Ibid. 230 Made under the Italian Presidency of the Council of the European Union. See
https://ec.europa.eu/research/swafs/pdf/rome_declaration_RRI_final_21_November.pdf. 231 See The Lund Declaration (2009), http://www.vr.se/download/18.7dac901212646d84fd38000336/ made under the
Swedish Presidency of the Council of the European Union, and The Lund Declaration (2015),
http://www.vr.se/download/18.43a2830b15168a067b9dac74/1454326776513/The+Lund+Declaration+2015.pdf made as part
of the high-level conference "Lund Revisited: Next steps in tackling societal challenges" and organised by the European
University Association. 232 Draft Information Report – Section for the Single Market, Production, and Consumption: Interim evaluation of Horizon
2020); European Economic and Social Committee. INT/807. 233 http://ec.europa.eu/research/consultations/swafs-wp2018-2020/consultation_en.htm. 234 https://ec.europa.eu/programmes/horizon2020/en/news/horizon-2020-indicators-assessing-results-and-impact-horizon.

247
training package developed by the RRI Tools project235
was used to train RRI stakeholders
across Europe, including EC civil servants.
The Common Research Datawarehouse (CORDA) allows identification of RRI-relevant
funded projects through a system called 'flagging'. Flagging is the process by which projects
that fit the criteria for being RRI-relevant are attributed a 'flag'; these flags are attributed by
project officers from the EC and executive agencies responsible for managing different parts
of Horizon 2020. In this way CORDA allows quick identification of projects that are flagged
as RRI relevant, those that are not relevant, and also those that are missing flags (for whatever
reason that may be). The flagging system does not hold any other data – such as information
about why projects are attributed a flag.
A potential additional source of information on the prevalence of RRI in Horizon 2020 is the
participation of civil society organisations (CSO). The "Study on network analysis of civil
society organisations’ participation in research framework programmes" examined this using
CORDA data. It had to clean the data carefully and developed a four-fold typology of CSO
participants in Framework Programmes to analyse CSO participation: 1) Core CSOs (e.g.
individuals and non-profits), 2) organisations that are publicly financed and oriented to
society, 3) organisations that are financed by business and oriented to society, 4) organisations
that are financed by and oriented towards business. It found (using data up to April 2015) that
in Horizon 2020 CSO types 1 and 2 made up 2.7% of project participants receiving just 0.7%
of total funding; by contrast, 5.3% of participants receiving 1.6% of funding were CSO types
3 & 4236
. Overall, this study suggested that CORDA cannot currently be used to assess CSO
involvement in consortia, and that the level of involvement of 'true' CSO in consortia is very
low, of peripheral importance, and of a potentially poor quality given the low funding.
H.13.3. Achievements so far
As of 1 January 2017, CORDA data show that 11.0% of Horizon 2020 projects, for which
data are available (i.e. not missing), are RRI relevant. The EC contribution to these flagged
projects is EUR 2.7 billion this equates to 13.95% of the Horizon 2020 budget237
. Excluding
ad hoc calls and joint undertakings, more than two-thirds of the RRI-flagged EC contribution
goes to MSCA (30.4%), SC1 – Health (14.8%), Industrial Leadership – LEIT (13.7%), and
SC5 – Climate (12.4%).
235 http://www.rri-tools.eu/. 236 Study on network analysis of civil society organisations’ participation in research framework programmes (CONTRACT
NO. RTD-B6-2014-SI2.687781) - D5: Draft final report. 237 Where EUR 19,361,213,441 EU contribution (eCorda data extraction 19/01/2017) are allocated to Horizon 2020 projects
and 784 projects have an RRI flag (eCorda data extraction 19/01/2017).

248
Figure 54 EC contribution (EUR million) to RRI-flagged projects in Horizon 2020
programme parts
Source: CORDA data, 1 January 2017
238
These figures do not take into account the 33.8% of Horizon 2020 projects that current lack
RRI flags altogether. Indeed, RRI flags are almost completely missing from some lines of
Horizon 2020, for instance ERC (99.9%), Euratom (83.3%), and Innovation in SMEs
(82.3%). This suggests that the EC contribution to RRI-flagged projects could be considerably
higher than indicated above.
The patterns suggested by CORDA data are backed up to some extent by text screening
exercises. In the 2014-2015 Work Programme, RRI was explicitly addressed in six
programme parts and the translation of RRI into topics was not extensive. Nevertheless, some
parts of Horizon 2020 did demonstrate a good level of appropriation, for instance, Industrial
Leadership – LEIT (which has 7.6% of projects flagged as RRI relevant in CORDA for which
data are available). Progress was made in the Work Programme 2016-2017, where RRI was
addressed in almost all parts, either by mentioning RRI explicitly or by demonstrating a
greater understanding of it. The increased emphasis on RRI suggests that a higher proportion
of projects should be attributed an RRI flag as increasing numbers of grants from the Work
Programme 2016-2017 are signed.
Screening of the draft 2018-2020 Work Programme scoping papers239
provides preliminary
cause for concern: just two mentioned RRI explicitly (Excellent Science – MSCA & SC2 –
Food) and in some lines no keywords associated with RRI were mentioned at all (Industrial
Leadership – Innovation in SMEs, Industrial Leadership – Access to Risk Finance).
Nevertheless, some dimensions of RRI were mentioned more frequently than others (e.g.
public engagement and gender) and in some scoping papers keywords were mentioned several
times across the context and strategic orientations, pointing to a fuller treatment and
embedding of the concept; these include SC5 – Climate (which currently has 22.5% of
238 Where EUR 2,586,774,344 are allocated to 751 RRI-flagged projects excluding joint actions and grants to identified
beneficiaries (eCorda data extraction 19/01/2017). 239 RTD B7 - Screening of "Responsible Research & Innovation" in Horizon 2020 Work Programme 2018-2020 Scoping
Papers.
0
100
200
300
400
500
600
700
800
Mill
ion
s

249
projects flagged as RRI relevant in CORDA for which data are available) and SC6 – Inclusive
Societies (which currently has 41.5% of projects flagged as RRI relevant in CORDA for
which data are available).
Unfortunately, the figures suggested by CORDA data and text screening exercises do not
make it possible to conclude that RRI is well embedded in Horizon 2020, as this would
require in-depth analysis of what the attribution, non-attribution or even omission of the RRI
flag represents in practice.
H.13.4. Lessons learnt/Areas for improvement
RRI is a cross-cutting issue that is relatively new to Horizon 2020. CORDA data suggest it is
now integrated in around 11% of total Horizon 2020 projects, and this has a significant budget
associated with it. The prevalence and distribution of RRI across Horizon 2020 varies greatly
between programme parts; this pattern of distribution is backed by the RRI text screenings of
Work Programmes. RRI is highly policy relevant and there is widespread support for
involving citizens and CSOs in Horizon 2020. However, CSO involvement in Horizon 2020
is very low, and CSOs are generally “hangers on” in projects and rarely co-ordinate them240
.
It is therefore important to understand what RRI flags in CORDA represent and whether and
how RRI-flagged projects are really "instances where citizens, Civil Society Organisations
(CSOs) and other societal actors contribute to the co-creation of scientific agendas and
scientific contents". It is also important to increase the involvement of CSOs in Horizon 2020.
RRI cannot be well implemented without involving representatives of citizens and civil
society in the programme itself. This would likely involve improving the collection of data
about CSO participation.
240 "Study on network analysis of civil society organisations’ participation in research framework programmes"
(CONTRACT NO. RTD-B6-2014-SI2.687781) - D5: Draft final report.

250
H.14. Gender equality
H.14.1. Overview
Gender equality is implemented as a cross-cutting issue in Horizon 2020 with three objectives
and according to the following intervention logic.
Figure 55 Gender equality in Horizon 2020 - Intervention logic
Source: European Commission, DG RTD
H.14.2. Rationale
The EU has developed over the years a well-established regulatory framework on gender
equality, with binding directives, which apply across the labour market including the research
sector. The European Commission has defined for the period 2016-2019 a Strategic
engagement for gender equality241
in all EU policies. Gender equality in research and
innovation is part of this strategic engagement. The EC gender equality policy is also in line
with international priorities such as the Beijing Platform of Action242
, the UN Sustainable
Development Goals243
, and the G7 Guiding Principles for Capacity Building of Women &
Girls244
, included in the Ise-Shima Declaration
Gender equality is one of the priorities of a “Reinforced European Research Area Partnership
for Excellence and Growth245
” (ERA). In its 2015 Conclusions on Advancing Gender
241 http://ec.europa.eu/justice/gender-equality/files/documents/160111_strategic_engagement_en.pdf 242 http://www.un.org/womenwatch/daw/beijing/platform/ 243 http://www.un.org/sustainabledevelopment/gender-equality/ 244 http://www.mofa.go.jp/files/000160274.pdf 245 http://ec.europa.eu/research/era/era_communication_en.htm

251
Equality in the ERA246
, the Council invites the Commission to continue to strengthen the
implementation, monitoring and evaluation of all Horizon 2020 objectives related to gender
equality.
Achieving gender equality is not only a matter of social justice but also of economic growth
and research performance. Including sex and gender analysis247
enhances research quality and
the societal relevance of the produced knowledge, technologies and innovations. It also
contributes to the production of goods and services better suited to potential markets. Gender
equality calls for more transparency and a wider access of women scientists to research,
thereby enlarging the pool of talents and the innovation potential. It therefore contributes to
Commissioner Moedas Three O’s priorities248
and to President Juncker's priorities249
for the
European Union.
The FP7 ex-post evaluation250
showed that gender equality in R&I is advancing very slowly.
In FP7, women represented 38%251
of the total reported workforce of the projects, but only
28.5 % of projects coordinators252
, 35% of the experienced researchers253
and 29% of Work
Packages leaders254
. This vertical segregation is also combined with a horizontal one,
depending on the scientific fields. Similar gaps are reflected across the EU as shown by the
latest She Figures255
.
Given the challenges to address, the original three objectives set for gender equality in
Horizon 2020 continue to be highly relevant, and aligned with international and EU policies.
H.14.3. Implementation
Major changes were introduced in Horizon 2020 compared to FP7 in the way gender equality
is mainstreamed as a cross-cutting issue. The objectives stated in Article 16 of Horizon 2020
Framework Regulation are implemented at several levels in the funding process, starting with
the work programmes and topic description, through the application and proposal evaluation,
the granting phase to the projects monitoring and reporting. More specifically:
Gender balance in research teams: The relative gender balance in teams is one of the
factors used to rank proposals with the same evaluation scores256
. By signing their
grant agreement, beneficiaries commit to promote equal opportunities and gender
balance at all levels of personnel assigned to the action including at supervisory and
managerial level257
.
246 http://data.consilium.europa.eu/doc/document/ST-14846-2015-INIT/en/pdf 247 taking into account both men and women biological characteristics and social / cultural features 248 https://ec.europa.eu/research/openvision/index.cfm 249 https://ec.europa.eu/priorities/index_en 250 https://ec.europa.eu/research/evaluations/index_en.cfm?pg=fp7 251 Table 45, FP7 Monitoring Report 2013 252 Computed from data of Table 9, FP7 Monitoring Report 2013 253 Table 46 – FP7 Monitoring Report 2013 254 CORDA / RESPIR- 04-02-2016 255 https://ec.europa.eu/research/swafs/pdf/pub_gender_equality/she_figures_2015-final.pdf 256 Applicants are asked to indicate in their proposal the gender of the persons primarily responsible for carrying out the
project's activities. Annexe H - WP General Annexes - Horizon 2020 Participant Portal 257 Art. 33.1 of the mono and multi-beneficiaries Model Grant Agreement.

252
Gender balance in decision-making: the EC set two targets: one of 40% of the
underrepresented sex in expert groups and evaluation panels258
and one of 50% of the
underrepresented sex in advisory groups.
Gender dimension in the content of research and innovation: gender issues are
explicitly mentioned in a number of topics of Horizon 2020 work programme. Topics
with a gender dimension are flagged259
on the Participant Portal. When drafting their
proposal, under the chapter “Excellence”, applicants are invited to describe, “where
relevant, to which extent and how their planned research takes into account sex and/or
gender analysis”. In the evaluation process, the gender dimension is mentioned in the
briefing given to evaluators.
An Advisory Group "gender" formulated recommendations to better integrate the gender
dimension in work programmes260
and to identify gender expertise. Training sessions were
organised for Commission and Agency staff and for National Contact Points (NCPs).
Awareness raising on gender as a cross-cutting issues was done in NCPs meetings and
brokerage events.
The implementation of gender equality as a cross-cutting issue is monitored through four Key
Performance Indicators (KPI)261
:
KPI 1: % women participants in Horizon 2020 projects (total workforce)
KPI 2: % women project coordinators in Horizon 2020 projects, i.e. Marie
Skłodowska-Curie Actions (MSCA) fellows, European Research Council (ERC)
principal investigators and scientific coordinators in other Horizon 2020 activities262
KPI 3: % women in EC advisory groups, evaluation panels, expert groups, individual
experts, etc;
KPI 4: % projects taking into account the gender dimension in R&I content.
H.14.4. Achievements so far
An expert group263
helped the EC assess gender equality as a cross-cutting issue using the
following quantitative and qualitative methods:
A quantitative analysis based on a set of data extracted from CORDA (cut-off date 01-
01-2017)
An analysis, both qualitative and quantitative, of a sub-set of 111 projects out of the
263 funded projects that correspond to 35 gender-flagged topics264
,from the seven
Societal Challenges, LEIT-ICT, LEIT-NMBP and SWAFS.
A qualitative analysis of various key documents and information, such as parts of
work programmes, topic descriptions, etc.
258 P.4, 2013 call for interest to independent experts to assist the Commission in implementing Horizon 2020
http://ec.europa.eu/research/participants/data/support/h2020_call-individual_experts_oj_c342_03.pdf Art 10.6 - EC Decision
C(2016) 3301 final http://ec.europa.eu/transparency/regexpert/PDF/C_2016_3301_F1_COMMISSION_DECISION_EN.pdf 259 Topics are flagged when they include one or more of the following words: gender, sex, woman /women, man/men, boy(s),
girl(s) 260http://ec.europa.eu/transparency/regexpert/index.cfm?do=groupDetail.groupDetailDoc&id=18892&no=1 261https://ec.europa.eu/programmes/horizon2020/en/news/horizon-2020-indicators-assessing-results-and-impact-horizon 262 corresponding to the Principal Contact Person in the organisation having the role of Coordinator 263http://ec.europa.eu/transparency/regexpert/index.cfm?do=groupDetail.groupDetail&groupID=3470&NewSearch=1&NewS
earch=1 264 as indicated on the Participant Portal; only RIA and IA funding schemes; Work Programme 2014-2015

253
Objective 1: Gender balance and equal opportunities in research teams
Concerning the first Key Performance Indicator, the proportion of women in projects
workforce is 40.3%. This proportion falls down to 33.6 % if the projects relating to ERC,
MSCA and ICT are excluded. The latter represents a decrease compared with FP7 where this
proportion reached 38%265
. Only preliminary figures are however available as this indicator is
collected from projects periodic reports. When looking at the subset of 111 projects, the
expert group found that women represented 36 % of the key staff named in the Description of
Activities.266
It should be noted that the detailed workforce data gathered in FP7 is not collected under
Horizon 2020. This does not allow to monitor the gender balance at different levels (vertical
segregation). Data on researchers will however be included in the projects periodic reporting
from 2017.
Figure 56 Share of women in total workforce by Horizon 2020 programme parts
Source: Corda – Projects’ periodic reports– cut-off date 01-01-2017
Concerning the second Key Performance Indicator, women represent 31% of projects’
coordinators, including 24.5% of ERC Principal Investigators, 42.2% of MSCA Fellows and
26.9% of scientific coordinators267
in other Horizon 2020 activities.268
This represents an
increase compared to FP7, where women represented overall 28.5% of projects coordinators,
including 20% of ERC Principal Investigators, 36.5% of MSCA Fellows and 20% of contact
persons for scientific Aspects in other F7 activities269
. In the subset of 111 projects, the expert
group found that 25% of projects coordinators are women, a result close to the proportion of
women among scientific coordinators in other Horizon 2020 activities.
It should be noted that data on the gender of scientific coordinators in other Horizon 2020
activities was not collected in case of grants’ amendments, which represents a quite high
proportion of the signed grants (47.3%). It will be corrected in 2017 and all grants will be
taken into account.
265 Table 45: Cooperation – Projects’ Workforce by gender (excluding PEOPLE), FP7 Monitoring Report 2013 266 2398 men and 1409 women and 28 names for which is was not possible to retrieve the gender. The expert group noted
that a significant proportion of projects did not indicate the gender of the consortium members, even though it is requested in
the proposal template. 267 Principal contact person in the organisation having the role of Coordinator 268 These data refer to the ongoing grant agreements where the gender of projects coordinators is known. 269 Table 9 , FP7 Monitoring Report 2013-
http://ec.europa.eu/research/evaluations/pdf/archive/fp7_monitoring_reports/7th_fp7_monitoring_report.pdf
36% 33% 28%
51%
31% 24%
31% 28%
59%
45% 51%
41% 32% 31%
39% 46%
34% 42%
59%
20%
0%10%20%30%40%50%60%70%

254
Figure 57 Share of women coordinators by Horizon 2020 parts – LEIT
Source: Corda – projects at grant agreement level. – cut-off date 01-01-2017
Figure 58 Share of women coordinators by Horizon 2020 Societal Challenges
Source: Corda – projects at grant agreement level. – cut-off date 01-01-2017
Objective 2: Gender balance in decision-making
This objective is close to being achieved. 53% of advisory groups members are women, while
the target was set at 50 % of the under-represented sex. It is higher than in FP7 where 33%
of the members of the advisory groups were women270
. 36.7% of contracts were signed
with women experts participating in evaluation panels271
, while the target was set at 40%.
270 Table 10- FP7 Monitoring Report 2013 271 Horizon 2020 monitoring report 2015

255
Figure 59 Gender distribution per thematic Advisory Group 272
Source: European Commissio,n latest update: December 2016
In the EC expert database, 29,9 % of experts registered with a full profile in December 2015
were women and 30,5% in December 2016. In December 2016, among them 6,022 experts,
3,904 women and 2,118 men declared having a gender expertise, which represented an
increase of 27 % for women and 28 % for men compared with December 2015.
Objective 3: Integration of the gender dimension in research content
The assessment was done by the expert group, at the levels of topics and funded projects, with
a qualitative analysis of the subset of 111 projects from 35 gender-flagged topics.
The number of topics in which gender issues were explicitly mentioned, increased from 99
out of 610 topics in WP 2014-2015 to 108 out of 568 in WP 2016-2017273
. The wording
relating to gender was often vague. However, the expert group noted improvement in the
wording in some parts of the WP 2016-2017.
Figure 60 Topics with and without an explicit gender dimension- Industrial Leadership
Source: European Commission, DG RTD- 2015
272 Latest update December 2016 273 At the level of the adoption of the work programmes – not taking into account the possible amendments
0%
25%
50%
75%
100%
M %
F %

256
Figure 61 Comparison of topics with and without an explicit gender dimension - Societal
Challenges
Source: European Commission, DG RTD- 2015
The expert group noted that in their subset of 35 topics from the WP 2014-2015, gender-
flagged on the Participant Portal, 20% of the topics did not have an explicit gender
dimension274
: in other words, the WP scribes overstated the number of topics with a gender
dimension as presented to the potential applicants. The additional topics referred to people in
general without mentioning gender, women or sex.
Concerning the fourth Key Performance Indicator, 32.4 % of the projects275
were “ticked”
as having a gender dimension by projects officers when preparing the grant agreement, 31.4%
in LEIT and 30.0% in Societal Challenges. The identification of a gender dimension in
projects was done at the level of the Description of Activities annexed to the grant agreement.
Project officers answered a "yes/no" question276
in SyGMA277
when preparing the grant
agreement. In comparison with Societal Challenges, in FP7 17% of the projects278
under
Cooperation, Science in Society and Regions of Knowledge declared having a gender
dimension in their content.
274 They did not include the words gender or women or sex 275 The indicator do not include MSCA and ERC 276 The question was not compulsory. Its status is currently being modified to ensure data completeness. 277 System Grant Management 278 Table 12 FP7 Monitoring report 2013- Self-declaration of beneficiaries at the end of their projects

257
Figure 62 Integration of the Gender Dimension in funded projects – Industrial
Leadership
Source: Corda - * computed on signed grants – cut-off date 01-01-2017
Figure 63 Integration of the Gender Dimension in funded projects – Societal Challenges,
SEWP and SWAFS
Source: Corda - * computed on signed grants – cut off date 01-01-2017
The expert group compared the identification done in SyGMA with their own assessment for
the subset of 111 projects. Among the 61 projects considered with a gender dimension in
SyGMA, only 35 projects actually included it and 12 out of the 17 projects considered by the
expert group as having a gender dimension were retained as such in SyGMA. The gaps cast
doubt on the reliability of the data obtained from this database.
The expert group also assessed the degree of integration of the gender dimension in the 111
projects from gender-flagged topics. It, found that 53% of the projects included a gender
dimension, 14 % well and 39 % in part. The notion did not seem to be well understood yet
and was often confused with gender balance in research teams. Furthermore it was not always
well evaluated. Some ESRs279
were inconsistent with the expert group assessment of the
projects.
279 Evaluation Summary Report
27.6% 34.3% 43.5%
83.3%
16.7%
0%
50%
100%
LEIT-ICT LEIT-NMBP LEIT-SPACE Ac. Risk Fin. SMEs
% of Signed Grants* taking into account the Gender Dimension
70.8%
10.8% 19.6% 15.7%
23.5%
51.4%
21.9%
59.3%
85.4%
0%
20%
40%
60%
80%
100%
% of Signed Grants* taking into account the Gender Dimension

258
Figure 64 Degree of integration of the gender dimension in the sub-set of 111 funded
projects
Projects ranked A: Projects take the gender perspective seriously into account and integrate the gender
dimension into a significant part of their activities, at various levels, such as in theoretical background,
methodology, the impact and dissemination sections. The result is a clear vision of how gender will be integrated
into the research content, with a good internal coherence within the project.
Projects ranked B: Projects discuss gender dimension in a few lines, with no further development.
Projects ranked C: Projects only mention (generally rapidly) gender balance in the team and completely miss
any gender dimension in their research.
Source: EC Expert Group on the interim evaluation of gender as a cross-cutting issue in Horizon 2020
The expert group checked the presence of researchers with gender expertise in the consortium
as presented in the Description of Activities. It found a high frequency of researchers with
gender expertise in projects ranked A. However none of the 111 projects included gender
training (eligible for funding in Horizon 2020).
Figure 65 Researchers with gender expertise in the consortium
Source: EC Expert Group on the interim evaluation of gender as a cross-cutting issue in Horizon 2020
The expert group also evaluated whether the projects were likely to increase gender
knowledge and found that it was the case for most of the projects ranked A.
1
1
1
1
2
9
1
2
3
4
3
7
8
8
4
4
7
13
1
5
2
5
10
5
4
0% 10% 20% 30% 40% 50% 60% 70% 80% 90% 100%
LEIT-NMBP
LEIT-ICT
SC1 Health
SC2 Food
SC3 Energy
SC4 Transport
SC5 Climate
SC6 Societies
SC7 Secure
SwafS
Projects ranked "A" Projects ranked "B" Projects ranked "C"

259
Figure 66 Gender knowledge produced
Source: EC Expert Group on the interim evaluation of gender as a cross-cutting issue in Horizon 2020
Examples of ranked A projects are presented below:
Pan-European web entrepreneurship and start-up ecosystem (WELCOME)
LEIT - Topic ICT-13-2014
The project aims to connect four major EU entrepreneur ecosystems, identifying and
engaging through local partners their most relevant players (investors, corporates, media,
and web entrepreneurs) with prospective, emerging and successful start-ups. The final
goal is to create a Pan-European startup ecosystem in which every entrepreneur in each of
the local ecosystems feels at home and interconnected. The project deals with gender
issues by promoting affirmative action at institutional level and developing an action plan
with activities to promote gender equality in all forms within the project.
Ageing Trajectories of Health: Longitudinal Opportunities and Synergies
(ATHLOS) – Societal Challenge 1- Topic PHC-2014-two-stage
The objective of ATHLOS is to achieve a better understanding of ageing by identifying
patterns of healthy ageing, the determinants of those patterns and the critical points when
changes in trajectories are produced, and to propose timely clinical and public health
interventions to optimize healthy ageing. One of the aims is to understand differentials in
ageing trajectories between men and women. Although gender is not the main focus of the
project, gender considerations are well included in the methodology, work packages and
policy recommendations.
Energy System Transition Through Stakeholder Activation, Education and Skills
Development (ENTRUST) Societal Challenge 3 -Topic LCE-20-2014
The project aims to analyse Europe’s energy system and understand how human
behaviour around energy is shaped by both technological systems and socio-demographic
factors (especially gender, age and socio-economic status). Gender appears in the
theoretical framework, the methodology, the impact and in the dissemination planning. It
is part of a socio-economic WP and has a specific deliverable.
Congestion Reduction in Europe: Advancing Transport Efficiency (CREATE) Societal Challenge 4- Topic MG-5.3-2014
CREATE examines the full range of urban passenger and freight/servicing movements in
urban, suburban and peri-urban areas, and the evolving ways in which urban streets are
used. It identifies and quantifies the main impacts (economic, social and environmental)
of policy measures introduced at different stages in the Transport Policy Evolution Cycle.
15
5
1
12
2
26
50
0% 10% 20% 30% 40% 50% 60% 70% 80% 90% 100%
Projects ranked "A"
Projects ranked "B"
Projects ranked "C"
yes maybe no

260
It assesses the effectiveness of different measures, their distributional consequences by
gender and for residents and mobility disadvantaged groups of travellers. It identifies
gender-specific travel behaviour and transport requirements, and the gender implications
of different technologies and transport policy measures. It monitors quality control and
adherence to the gender dimension of the work.
Development of water supply & sanitation technology, systems & tools, and/or
methodologies-Waterspoutt- Societal Challenge 5-Topic WATER-5-2014c
The project aims to design and field-test solar disinfection technologies to provide
affordable access to safe water to remote and vulnerable communities in Africa. Gender is
presented as a basis issue for the project. It has a Social Science work package (the rest is
more technical) where gender appears at all levels (theory, methodology, impact,
dissemination, in a deliverable). There is good gender expertise in the project and in
particular with the Social Science work package leader.
Revisioning the ‘Fiscal EU’: Fair, Sustainable, and Coordinated Tax and Social
Policies (FairTax) Societal Challenge 6 – Topic EURO-1-2014
The project aims to research ways of harmonizing of EU Member States tax and social
policies to produce fairer, more stable, and more sustainable tax and social policy regimes.
The topic was well worded and the project covers gender very extensively, including it in
its objectives, its theoretical framework, its methodology and impact. It has a specific
gender Work Package and refers to gender in several other parts. The coordinator has
good gender expertise.
Innovative Social Investment: Strengthening communities in Europe (InnoSI)
Societal Challenge 6 - Topic Euro-3-2014
One of the main objectives of InnoSI is to understand better, from the perspective of
recipients, the social and psychological impact of innovative and strategic approaches to
social welfare reform with a particular focus on gender and generational issues. Gender
analysis is a key dimension in the project and runs through all the work packages. The
project is likely to provide new knowledge on how the gender dimension is and could be
integrated in welfare reforms.
Mapping mobility – pathways, institutions and structural effects of youth
mobility in Europe (MOVE) – Societal Challenge 6 - Topic YOUNG-2-2014
MOVE aims to provide a research-informed contribution to improving the conditions of
young people mobility in Europe and a reduction of its negative impacts through the
identification of good practice thus fostering sustainable development and wellbeing. It is
based on a multilevel research design, including case studies on six types of mobility
(higher education, voluntary work, employment, vocational training, pupil's exchange and
entrepreneurship), a survey and secondary data analysis, taking into consideration social
inequality. Gender is a central category within a broader perspective on social inequality
and young people disadvantages.
Finally, to help implement the gender equality objectives at each stage of the research cycle
and across Horizon 2020, awareness raising and specific training are a valuable support to
improve the understanding and take up. Gender equality was included in 12 awareness raising
sessions organised by NCPs at EU level for potential applicants in the period 2014-2016.
Seven training sessions were organised for the EC staff and two for the NCPs academy. The
attendance was limited and largely female with 102 participants for the EC and around 40
participants for the NCP Academy.

261
Figure 67 Participants in DG RTD gender trainings 2014-2016
Source: European Commission, DG RTD - 2017
H.14.5. Lessons learnt/Areas for improvement
The comprehensive approach developed to implement gender equality as a cross-cutting issue
in Horizon 2020 is wider in its coverage and more specific than in FP7. Compared with FP7,
the interim evaluation showed that:
Some progress was made on gender balance in research teams involved in funded
projects, although, considering the current weaknesses in the monitoring system, these
results remain to be confirmed;
The targets are closed to be achieved for the advisory groups and, to a lesser extent for
the evaluation panels, but the involvement of experts with gender expertise is still low;
The gender dimension in R&I content carries a great potential to improve R&I quality
and relevance to society, but it requires more investment to be achieved. The actors
involved should acquire a better knowledge of what the gender dimension entails in
the various fields of R&I and the monitoring system needs to be substantially
improved.
Areas of improvements should therefore be of two main types:
Enhancing the culture of gender equality in R&I through awareness raising and
training. Evaluators and moderators should acquire a better knowledge of the gender
dimension in R&I content and of implicit biases in assessing men and women
applicants.
Adapting the mainstreaming of the gender equality inputs in the Horizon 2020
implementation system to improve efficiency.
H.15. SME involvement in research and innovation and broader private sector
participation
H.15.1. Overview
Economic enterprises strongly participate in all the Horizon 2020 Programme's parts, in
particular when addressing challenges in society by helping to bridge the gap between
research and the market, and through the support of innovative enterprises to develop their
DG AGRI , 1 CAB 28, 1 DG CNECT, 1 DG EAC , 2
EASME, 8
DG ENER, 1
ERCEA , 12 DG HOME, 3
IMI, 1
JRC, 1
DG JUST , 3
REA, 39
DG RTD, 29

262
technological breakthroughs into a viable commercial potential. The market-driven approach
of the innovation part of Horizon 2020 proposes a variety of actions/instruments to the
enterprises, notably the SME Instrument and the financial instruments, with the aim of a
better uptake by companies, in particular SMEs.
H.15.1. Rationale
SMEs play a key role in fostering innovation and have the ability to market new products
quickly. FP7 strengthened the innovation capacity of European SMEs and their contribution
to the development of new technology based products and markets by helping them outsource
research and acquire technological know-how, increase their research efforts and extend their
networks. This with around EUR 1.3 billion for the 'Research for the Benefit of SMEs' under
the FP7 Capacity programme and also, with the target budget of more than 15% under the
FP7 Cooperation programme.
In line with the recommendation of the High level group of the FP7 ex-post evaluation 280
considering that SMEs have an important and needed role in the "innovation
pipeline/innovation value chain", specific rules were established under Horizon 2020 to better
engage SMEs in all sectors and activities. Also, Horizon 2020 focuses on durable benefits by
providing more favourable conditions to SMEs carrying business innovation and bringing it to
the markets. The competitive grants as the ones put in place through the SME Instrument are
therefore shaped to the needs of innovative firms to get successfully into the market with a
targeted objective to impact European society in terms of growth and sustainable employment
on the widest range of thematic sectors.
Also, in order to support SMEs to invest more in innovation, the European Commission
proposed on one hand a dedicated instrument providing grants for R&D projects driven
specifically by SMEs whereas - on the other hand - it gives access to debt facilities (e.g. loans
and guarantees) and to equity (finance for early and growth-stage investment). On debt
finance, Horizon 2020 InnovFin – EU Finance for Innovators, with support of the European
Fund for Strategic Investments (ESFI), provides guarantees to banks and other lenders
providing loans to innovative companies. On equity finance, together with the European
Investment Fund (EIF), the Commission is setting up a Fund-of-Funds to invest in venture
capital funds, with most funding coming from the private sector and with independent fund
management.
The overall idea is to seize innovation’s potential, actually turning it into growth and jobs, by
addressing the issue of insufficient financial availability, in particular of SMEs, aiming at
fostering more innovative, productive and prosperous enterprises in Europe.
H.15.2. Implementation
In Horizon 2020, access to grants for SMEs - either as a single beneficiary as for SME
Instrument, or as a member of consortium as for the Fast Track to Innovation (FTI) or
collaborative grants - is encouraged by a simplification of conditions to apply281
and by a
280 "Commitment and Coherence – Ex‐Post Evaluation of the 7th EU Framework Programme" (p65).
http://ec.europa.eu/research/evaluations/pdf/fp7_final_evaluation_expert_group_report.pdf#view=fit&pagemode=none 281 For e.g. no provision of financial capacity documents for SME applying to SME Instrument Phase 1, less administrative
burden during the application phase.

263
shorter time-to-grant. In addition, under the SME Instrument, proposals can be submitted by
single SMEs (mono-partner grants).
Around EUR 9 billion of the Horizon 2020 budget shall support SME innovation through
grants. Its bulk is allocated to SMEs participating as partners in consortia conducting
collaborative research and innovation projects. The SME Instrument, in parallel, encourages
early-stage for-profit SMEs to put forward their innovative ideas with an EU dimension into
the market. The Better regulation package282
has also influenced the level of attractiveness of
such tools, by ensuring an easy access with simple rules and procedures in all three stages283
of the innovation cycle.
The co-legislators established that within the target of ensuring a minimum of 20% of SMEs’
participation, a minimum of 5% of those combined Societal Challenges and LEIT's budgets
will be initially allocated to the dedicated SME instrument for the transitional two-first years
of the Programme (2014-2015). This target is set to 7% averaged over the duration of Horizon
2020.
The Fast Track to Innovation (FTI) pilot supports innovation actions under LEITs and
Societal Challenges, conducted by industry-intensive consortia with a minimum of 3 and a
maximum of 5 participants. The EU contribution is EUR 2.5 million per project with a Time-
to-Contract of 6 months.
The Second Eurostars Joint Programme (2014-2020)284
promotes market-oriented
transnational research of research performing SMEs in any field. It is undertaken by at least
two Member States and/or Associated countries, with the financial contribution of the EU
(EUR 287 million). By pooling together national resources, Eurostars also aims at
strengthening integration and synchronisation of national research programmes contributing
to the achievement of the European Research Area.
In addition, the new generation of debt and equity Financial Instruments – InnovFin - EU
Finance for Innovators – shall generate direct investments of more than EUR 24 billion and
total final investment of more than EUR 50 billion into research and innovation activities. Of
that amount, at least a third is likely to be absorbed by SMEs and small midcaps below 500
employees285
.
H.15.3. Achievements so far
Through all its actions, Horizon 2020 is contributing significantly to increase private firms'
participation in research and innovation. The trend established under FP7, where private for
profit organisations accounted for a quarter of the total number of applicants and a third of the
total amount of requested EU contribution in retained proposals286
, is confirmed. Private-for-
Profit entities (PRC) represent 33.2% (16,298 participations) of the total (49,090).
Under Societal Challenges and Leadership in Enabling and Industrial Technologies, 8,637
SMEs have already participated to Horizon 2020, for an overall EU financial contribution of
EUR 2,828.4 million. This participation represents 23.9% of budget allocation, which exceeds
282 http://ec.europa.eu/smart-regulation/guidelines/toc_guide_en.htm 283 Innovation cycle phases are: creation/start-up phase, early stage and expansion. 284 https://ec.europa.eu/programmes/horizon2020/en/h2020-section/eurostars-programme 285 See eligibility conditions – InnovFin - http://www.eib.org/products/blending/innovfin/ 286 7th FP7 Annual Monitoring Report 2013.

264
by 3.9 percentage points, the 20% budgetary target set by EU Council and Parliament. At the
end of Horizon 2020, direct support to SMEs would reach EUR 8.33 billion (post-EFSI) of
which about EUR 3 billion devoted to innovative projects through the SME instrument287
.
Industry participation – both in terms of involvement in submitted proposals and in selected
projects – has taken a very encouraging trend over the past two years. Already, 5,399 grants
with at least one participant from the private sector have been signed288
representing an EU
financial contribution of EUR 5,653 million.
Under the Fast Track to Innovation pilot, five cut-off dates in 2015 and 2016 have received a
positive response from the industry, with 75 projects and 342 entities selected for funding
with an EU contribution of EUR 161.2 million. 73% of the entities selected were from the
industrial sector, among which 63.2% were SMEs.
The share of EC funding allocated through the SME instrument between 2014 and 2016 is
5.6% of the total budgets of the specific objectives LEIT and the priority Societal Challenges
and it represents EUR 881.7 million. This share is increasing from 5% in 2014 and 5.1% in
2015 to 5.6% in 2016: the favourable trend is in line with the minimum target of 7%.289
Spain,
Italy and the UK have the largest share of participation funding from the SME Instrument.
Table 49 Number of Member States participation in the SME Instrument
Source: Corda. Cut-off date: 1 January 2017.
Finally, the role of financial instruments has already grown due to their leverage effect on
public investment resources, their capacity to combine different forms of public and private
resources, and their longer-term financial sustainability.
287 For the overall period of Horizon 2020. 288 Source: Corda. Cut-off date: 1 January 2017. 289 Source: Horizon 2020 Work Programmes. These data are not based on Corda, but consider the budget earmarked to the
SME instrument in the Work Programmes. The 7% target is set in Regulation (EU) No 1291/2013 of the European
Parliament and of the Council of 11 December 2013 establishing Horizon 2020, Annex II.
0
50
100
150
200
250
300
350
400
450
ES IT UK DE FR NL SE DK FI IE PT PL HU AT SI EE BE EL LT LV CZ SK BG HR CY LU MT RO

265
Figure 68: Financial instruments per targeted beneficiaries
Source: European Commission
Financial support to SMEs and to private sector as a whole through the financial instruments
of for the entire implementation period of Horizon 2020, InnovFin – EU Finance for
Innovators' will make available more than EUR 24 billion of financing for investments in
research and innovation by companies, small to large, young to well-established. The suite of
tailored-made financial instruments, whatever the size and stage of projects, provides specific
support to SMEs and mid-caps with on one hand equity investments, and debt financing of
EUR 25,000 to EUR 7.5 million via local financial intermediaries through the InnovFin SME
Guarantee on the other hand.
In the first three years of Horizon 2020290
, already more than 5700 SMEs have been funded
thanks to InnovFin which exceed the provisional target of 5,000. This 3-years achievement
covers 29 countries, for a total guarantee amount of EUR 4 billion of which EUR 0.32 billion
issued as counter-guarantees. It enables up to EUR 8.65 billion of loans/leases to innovative
SMEs and Small Mid-caps, mobilising up to EUR 12,53 billion of investments.
Also, 30 InnovFin SIUGI agreements have been signed in Spain, 10 in Bulgaria and 2 in
Malta with financial intermediaries for a maximum portfolio volume of EUR 279 million. The
main aim of this initiative is to facilitate access to finance for SMEs by lowering the interest
rates charged by banks on their loans. At the same time, intermediary banks will considerably
reduce the risk on each SME loan, and the relevant cost of capital, by benefiting from a
financial guarantee issued by the EIB Group.
In terms of estimated mobilised investments, EUR 73.77 billion out of the EUR 82.5 billion
target for the EFSI SME Window are expected to be supported through the transactions
signed by the end of May 2017. This total includes 73 transactions signed with funds for
the Risk Capital Resources (RCR) EIF mandate for EUR 3.2 billion.
290 Source: European Investment Fund. A full assessment of the performance of the Financial Instruments of Horizon 2020
can be found in Annex 2 Part H.

266
With regards to InnovFin Debt – EIB, 40 loans have been granted to Mid-Caps for EUR
1651 million, and 22 loans to SMEs for EUR 330 million.
InnovFin Equity– EIF – IFE aims at providing equity investments and co-investments to
support companies in their pre-seed, seed, and start-up phases operating in innovative sectors
covered by Horizon 2020, including life sciences, clean energy and high-tech. As of
31/12/2016, 10 IFE Operations have been signed in 6 Member States including 7 early stage
and 3 multi stage for an amount of EUR 164.5 million. Also, 5 investments made into Eligible
IFE Final Recipients for EUR 15 million in 4 Member States.
Finally, this overview of this 3-years implementation is also positive with regards to private
sector as a whole. Large companies benefited from specific funding; with in particular 28
loans granted for EUR 2515 million and 5 loans to R&I infrastructures for EUR 527 million
under InnovFin Debt – EIB.
H.15.4. Lessons learnt/Areas for improvement
This state of play of Horizon 2020 so far shows that the objective to increase participation of
innovative SMEs is confirming its positive trajectory. The budget allocated to innovative and
research-performing SMEs is above the target objective of 20% of the combined budgets for
LEITs and the Societal Challenges. These Instruments combined with complementary support
schemes, such as the SME Instrument, adequately respond to the specific financing needs of
SMEs, covering all stages of the innovation cycle of SMEs' projects. Such global approach
shows that Horizon 2020 respond well to innovative SMEs desiring to succeed their market
positioning.
Objectives set under Horizon 2020 as far as financial instruments and their use are concerned
and agreed with the European Investment Bank Group have been achieved in 2016[2]
. This is
a clear demonstration of the attractiveness of such products on the market.
The combination of financial instruments and grants (including the SME Instrument) provides
benefits to reinforce the participation of SMEs and the broader private sector acting as a
driving force of innovation in Europe. This overall combination of instruments offers better
structural conditions to drive their high-risk projects into the market.
[2] SME Guarantee product.

267
I. FURTHER INFORMATION ON THE IN-DEPTH ASSESSMENT OF PUBLIC-TO-PUBLIC
PARTNERSHIPS
I.1. Introduction
Article 181 of the Treaty on the Functioning of the European Union (TFEU) calls for the EU
and Member States to coordinate their research and technological development activities and
invites the Commission, in close collaboration with Member States, to take any useful
initiatives to promote this coordination. As a consequence, the current Framework
Programme, Horizon 2020, specifically aims to establish synergies with national programmes
and Joint Programming Initiatives (JPIs) by providing support to Public-to-Public
Partnerships (P2Ps). These are now increasingly used to support the coordination of national
programmes requiring collaboration on common challenges and currently form an integral
part of Horizon 2020, in particular the pillar addressing societal challenges.
P2Ps support a wide range of activities, including research, coordination and networking,
capacity-building and demonstration and dissemination activities. They are now core
components of the European Research Area (ERA) Roadmap and national ERA action plans,
notably for priority 2a of the ERA Roadmap (jointly addressing societal challenges).
This section is constructed as follows: Firstly, the available evidence and data concerning the
three P2P approaches will be presented. Secondly, the results of recent evaluations of the
Joint Programming291
and ERA-NET Cofund instrument of Horizon 2020 will be presented.
Lastly, the related analysis from the ERA Progress Report 2016292
will be presented.
I.2. Overview P2Ps
The policy approach to foster alignment between Member States by supporting the
networking of national programmes was introduced under FP6 in 2002 as a core component
of the ERA policy framework293
. In 2004 the first joint calls of national programmes were
implemented. When looking at the overall picture of P2Ps since 2004, a clear upward trend
and growing commitment from Member States can be observed – in total more than 480 joint
calls have been implemented.
A summary of the calls that closed each year, since 2004, is shown in the following figure294
.
291 http://bookshop.europa.eu/en/evaluation-of-joint-programming-to-address-grand-societal-challenges-pbKI0416204/ 292 http://ec.europa.eu/research/era/eraprogress_en.htm 293 https://www.era-learn.eu/publications/ec-publications/the-era-net-scheme-from-fp6-to-horizon-2020 294 https://www.era-learn.eu/publications/other-publications/2nd-annual-report-on-p2p-partnerships-2016

268
Figure 69 Calls published by Public-Public-Partnerships, by year and network type
Source: ERA LEARN, 2nd Annual report on p2P partnerships, 2016
The annual national financial contributions for P2Ps shows a clear upward trend since its
inception in 2004 (see the following figure) as well. The additional EU funding (yellow line)
displays an upward trend, underlining the joint efforts towards greater coherence between EU
and MS R&D programmes.
Figure 70 National Joint Call Budget (with EU Contribution for cofounding of calls
overlaid in yellow) for all Calls closed 2004-2016, by network type
Source: ERA LEARN, 2nd Annual report on p2P partnerships, 2016
Accordingly, the number of projects funded by joint calls shows a clear upward trend. 2015
saw the highest number so far, with nearly 800 projects. In total, more than 5 500 projects
have been funded through P2Ps since 2004.

269
Figure 71 Number of projects funded by P2Ps for all Calls closed 2004-2016, by
Network Type
Source: ERA LEARN, 2nd Annual report on p2P partnerships, 2016
The following table presents the main features of an ERA-Net Cofund network. Compared to
the ERA-Net + instrument of FP7, the number of countries per call increased by 50% (from
10 to 15 countries) and the EU13 participation rate nearly doubled, while the share of EU
funding to partners in EU13 countries (budget) remained stable at around 5%.
Table 50 Main characteristics of an ERA-Net Cofund network (based on data from
Horizon 2020 WP 2014/2015); data from ERA-LEARN 2020
Number of
countries per
call /partners
Average call
budget (M€)
Average
project size
(M€)
EU13 share Third country
share
ERA-Net
CoFund
15 29 < 1 -participation:
20%
- budget: 5%
- participation:
11%
- budget: 4%
Source: https://www.era-learn.eu
The use of P2Ps within a variety of thematic fields is presented in the following table (2004 –
2015). It has to be noted, that the number of actions within the described fields is not an
indication of impact with respect to mobilised funding and/or other policy objectives on
national/EU level.

270
Table 51 Relevance for Horizon 2020 priorities and challenges: Active networks (2016)
and research area addressed
Research area Art.169/
Art.185s
ERA-NETs
ERA-NET Cofund
ERA-NET Plus
JPIs Other Total
Biotechnology 1 4 0 1 5 1 12
Energy 3 6 9 5 3 5 31
Environment 3 7 9 3 6 9 37
Food, agriculture and fisheries 2 6 6 3 4 5 26
Government and social relations
2 0 0 1 2 0 5
Health 3 6 9 2 5 2 27
Industrial production 1 2 1 2 1 1 8
Information and communication technologies
3 3 0 2 2 2 12
Materials 1 4 2 2 1 1 11
Nanosciences and nanotechnologies
1 3 1 2 0 1 8
No specific thematic focus 0 1 0 0 0 2 3
Other 1 1 1 2 0 4 9
Security and defence 0 0 1 0 0 0 1
Services 2 0 0 0 1 1 4
Socio-economics sciences and humanities
2 1 3 2 3 2 13
Space 1 0 1 0 0 0 2
Transport 2 0 0 1 2 0 5
Source: https://www.era-learn.eu
I.3. ERA-NET Cofund under Horizon 2020
The ERA-NET Cofund instrument is a merger of the former ERA-NET and ERA-NET Plus
instruments under FP7. ERA-NET Cofund actions should build lasting collaborations
between Member States and their research funding organisations, also drawing on existing,
long-standing partnerships that have been established over the past ten years.
The Horizon 2020 Work Programme 2014/2015 resulted in a total of 27 proposals selected for
funding. The 27 networks from 2014/2015 bring together a total of EUR 728.5 million for the

271
cofunded calls. The leverage effect of the 27 actions is 2.31, i.e. for each euro invested by the
EU, the participating countries invest an additional amount of EUR 2.31295
.
The following figure presents the respective financial contributions from P2P participants
(WP 2014/2015 only).
Figure 72 Budget distribution (contribution to the co-funded calls) for the first 27 ERA-
NET Cofund actions resulting from the WP 2014/5, by participant; source: ERA-
LEARN 2020
Source: ERA LEARN, 2nd Annual report on p2P partnerships, 2016
Several Cofund networks have been initiated by JPIs. Nearly 50% of all calls in
2015/2016 (12 in total) stem from JPI-initiated ERA-Nets.
In addition, over 30 topics are included in the 2016/2017 Horizon 2020 Work Programmes.
Funding from Horizon 2020 is expected to reach about EUR 280 million as pre-commited
budgets from national sources rose to about EUR 700 million. Based on the planning of the
current ERA-NET Cofunds and past experience, an overall leverage effect of 3-5 can be
expected, as many additional calls without EU cofunding are planned.
Beyond the minimum obligation to launch and implement a co-funded joint call, ERA-NET
Cofund actions engage in a variety of additional activities. These include implementing
additional calls without EU co-funding, dissemination activities, strategy building,
networking and expansion, or monitoring and evaluation activities296
. The following table
summarizes the budgets funded so far under Horizon 2020 and the relation to the Horizon
2020 priorities.
295 A detailed overview on the ERA-Nets from WP 2014-2015 is presented in the Annual Report on P2Ps from ERA-LEARN
2020. See in particular Figure 11.5.4 296 https://www.era-learn.eu/publications/ec-publications/analysis-of-era-net-cofund-actions-under-horizon-2020

272
Figure 73 Foreseen budgets from Horizon 2020 for ERA-NET Cofund actions published
in the WPs 2014-2017
Source: European Commission, Analysis of ERA-NET Co-Fund under Horizon 2020297
I.4. Art.185 initiatives
On Art.185 initiatives there is the legal obligation to carry out individual interim and final
evaluations. These will be summarized in a dedicated Staff Working Document on Art.185
initiatives, to be adopted October 2017. The following section will therefore only provide
basic data on Art.185 initiatives.
Art.185 initiatives are jointly implemented multiannual programmes between Member States,
including Associated Countries (AC) for the funding of research activities, in which the
Union participates by providing funding. They were promoted by the Commission in 2001 as
a way to implement the joint programming of research activities. The legal basis for their
creation is Art.185 of the Treaty on the Functioning of the European Union (TFEU).
As stated in Article 26 of the Horizon 2020 Regulation298
, Art.185 initiatives are proposed
only in cases 'where there is a need for a dedicated implementation structure and where there
is a high level of commitment of the participating countries to integration at scientific,
management and financial levels'. In addition, under Horizon 2020, Art 185 initiatives have to
apply the Rules of participation of Horizon 2020, unless derogations are introduced in their
basic acts.
Five Art.185 initiatives have been established since 2003. The actions supported may cover
subjects not directly linked to the themes of Horizon 2020, as far as they have a sufficient EU
added value. The Art.185 initiatives currently active are:
(1) Active and Assisted Living Research and Development Programme (AAL2):
innovative ICT-based solutions for active and healthy ageing.
297 https://bookshop.europa.eu/en/analysis-of-era-net-cofund-actions-under-horizon-2020-pbKI0116995/ 298 http://ec.europa.eu/research/participants/data/ref/h2020/legal_basis/fp/h2020-eu-establact_en.pdf
€M no €M no €M no €M no
Excellent Science
Future and Emerging Technologies 18,0 2 5,0 1
Industrial Leadership
ICT 6,0 1
Nano, Materials, Biotech and Manufacturing 12,5 1 30,0 3
Societal challenges
Health, demographic change and wellbeing 27,4 4 15,0 3 5,0 1
Food security, agriculture, marine,
bioeconomy
5,0 1 15,0 3 35,0 5 15,1 3
Secure, clean and efficient energy 36,8 3 36,3 4 45,8 5 33,5 4
Smart, green and integrated transport 10,0 1
Climate action, environment, resource
efficiency and raw materials
18,2 2 51,0 3 13,0 3 30,0 3
Europe in a changing world – inclusive,
innovative and reflective Societies
5,0 1 5,0 1 5,0 1 5,0 1
Science with and for society 5,0 1
Total 92,4 11 140,8 16 161,8 21 93,6 13
2014 2015 2016 2017

273
(2) European and Developing Countries Clinical Trials Partnership 2 (EDCTP2): new or
improved treatments for poverty-related diseases in sub-Saharan Africa; with
(3) The European Metrology Programme for Research and Innovation (EMPIR): new
measurement solutions for industrial competitiveness and societal challenges;
(4) Eurostars 2: support to the transnational collaboration of R&D performing SMEs;
(5) BONUS: Joint Baltic Sea Research Programme
The following table summarises participation and financial contributions.
Figure 74 Participation and Financial contribution of the Union and the Participating
States to the Art.185 initiatives under Horizon 2020 (in italic: contributions for the
programmes under FP6/FP7
Art.185 initiatives adopted under Horizon
2020
Participating
countries
EU (max)
[Euro million]
Participating States (min)
[Euro million]
Active and Assisted Living R&D
Programme (AAL2)
AAL (FP7)
17 MS + 3 AC 175
150
175
200
European and Developing Countries Clinical
Trials Partnership 2 (EDCTP2)
EDCTP (FP6)
15 MS + 2AC 683
200
683
200
European Metrology Research Programme
(EMPIR)
EMRP, FP7
23 MS + 5 AC 300
200
300
200
Eurostars2 (for SMEs)
Eurostars1 (FP7)
28 MS + 5 AC 287
100
861
300
BONUS (FP7) 8 MS 50 50
Source: European Commission
Following a request made by nine Member States in December 2014, the European
Commission adopted on 18 October 2016 a proposal to establish a new public-public
Partnership for Research and Innovation in the Mediterranean Area (PRIMA) under Art.185
TFEU. PRIMA would focus on two key socioeconomic issues that are important for the
region: food systems and water resources. The proposed decision would establish the
partnership for a period of 10 years and would provide PRIMA with EUR 200 million in EU
funds from Horizon 2020, to match the commitments of the participating states.
All currently active Art. 185 initiatives have been initiated under FP6 (EDCTP) or FP7.
Consequently, these initiatives already comprise several years of activities, where results and
impacts can be described. The five active Art. 185 initiatives display a variety of key
characteristics – BONUS and EDCTP focus on specific regional issues (environmental quality
of the Baltic sea and clinical trials for tropical diseases in Sub-Sahara Africa) – EUROSTARS
has target group orientation (R&D intensive SME) while EMPIR and AAL focus on specific
technologies with a, however, very different scope – AAL targets ICT solutions for active
ageing with a strong end-user perspective while EMPIR focus on metrology technologies in
diverse application areas.

274
Consequently, the desired impacts of the individual initiatives differ substantially – while for
AAL and EUROSTARS the market share/additional turn-over of induced technological
innovations are key impacts, the main objective of BONUS is an improved environmental
management of the Baltic Sea. EDCTP, on the other hand, has desired impacts in the capacity
building in Sub-Sahara Africa for the treatment of tropical diseases and a broad uptake of
good practices i.e. by means of WHO guidelines for the treatment of HIV, Malaria or
Tuberculosis. EMPIR has a clear industrial orientation, with its main impacts in the
contribution/shaping of standards and norms and in the strengthening the uptake of industrial
innovations to societal challenges, notably in the fields of energy, environmental protection
and health.
Despite their variety, however, Art. 185 contribute to EU-policy objectives, it being
competitiveness in the cases of AAL, EMPIR and EUROSTARS or global health in the case
of EDCTP or sustainable development in the case of BONUS.
I.5. Joint Programming Initiatives
In July 2008, the Commission presented joint programming as a Member State-led process,
designed to coordinate research in Europe and to address major societal challenges. The Joint
Programming Process (JPP) aimed at restructuring the European research landscape through
EU-level reorientation and joint programming of research activities in key areas.
The following section provides a short summary of the ten JPIs adopted by the Council. The
Commission acts as an observer in all JPIs.
JPND (Neurodegenerative Diseases)
This JPI was the first to be launched in 2009. Its Strategic Research Agenda (SRA) was
adopted in 2011 and the first implementation plan in 2012. It has the largest number of
member countries (30). The EU FPs (FP7 and Horizon 2020) have supported JPND with two
CSAs and one ERA-NET Cofund299
.
FACCE (Agriculture, Food Security and Climate Change) The JPI on ‘agriculture, food security and climate change’ (FACCE) was launched in 2010.
Its SRA was adopted in 2012 and the first implementation plan in 2013. The updated SRA
was published in January 2016 as well as the Implementation Plan 2016-2018. It has 21 full
members and a significant number of additional third countries are participating through Joint
Calls. The EU FPs (FP7 and Horizon 2020) have supported FACCE with two CSAs and also
ERA-NET contracts (FP7 ERA-NET Plus, two Horizon 2020 ERA-NET Cofunds)300
.
JPI HDHL (Healthy Diet for Healthy Life) The JPI on ‘a healthy diet for a healthy life’ (HDHL) was launched in 2010. It has 19 member
countries (including Canada) and six observers. New Zealand became the most recent full
member. A second edition of the SRA has been produced and the current implementation plan
(2014-2015) will be superseded by another for the 2016-2018 period. The EU FPs (FP7 and
Horizon 2020) have supported JPI HDHL with two CSAs and one ERA-NET Cofund301
.
JPI CH (Cultural Heritage)
299 http://www.neurodegenerationresearch.eu/ 300 https://www.faccejpi.com/ 301 http://www.healthydietforhealthylife.eu/

275
The JPI on ‘cultural heritage and global change’ was launched in 2010. It adopted its SRA in
2013 and implementation plan in 2014. It has 19 members and seven observers. The EU FPs
(FP7 and Horizon 2020) have supported JPI CH with two CSAs and one FP7 ERA-NET
Plus302
.
JPI-MYBL (More Years Better Lives) The JPI for ‘more years better lives’ was launched in 2011 and adopted its SRA in 2014. The
implementation plan is under development and there is a short term work programme for
2015-2016. There are now 17 full members (Israel and Slovenia recently joined) and one
observer. The EU FPs (FP7 and Horizon 2020) have supported JPI-MYBL with two CSAs303
.
JPIAMR (Antimicrobial Resistance) The JPI on ‘anti-microbial resistance’ was launched in 2011 and adopted its SRA at the end of
2013. The 1st implementation plan was adopted in 2014 with the second version adopted in
2016. It has 22 member countries. The EU FPs (FP7 and Horizon 2020) have supported JPI
AMR through two CSAs and one ERA-NET Cofund304
.
Water JPI (Water Challenges for a Changing World) The JPI on ‘water challenges for a changing world’ was launched in 2011 and adopted its first
Strategic Research and Innovation Agenda (SRIA) in 2013 with the implementation plan
adopted in 2014. It has 21 member countries and four observers. Another six third countries
are participating in Joint Calls. The EU FPs (FP7 and Horizon 2020) have supported JPI
Water through two CSAs and two ERA-NET Cofund actions305
.
JPI Oceans (Healthy and Productive Oceans) The JPI on ‘healthy and productive seas and oceans’ was launched in 2011. Its SRIA was
adopted in 2014 and the implementation plan in 2015. There are 21 members and one
observer. The EU FPs (FP7 and Horizon 2020 have supported JPI Oceans through two CSAs
and one ERA-NET Cofund306
.
JPI Climate (Connecting Climate Knowledge for Europe) The JPI on ‘connecting climate knowledge for Europe’ was launched in May 2011 with the
adoption of the SRA. An implementation plan was adopted in 2013. JPI Climate has 17 full
members and four observer institutions. Additional countries participate in individual
activities. The EU FPs (FP7 and Horizon 2020) have supported JPI Climate activities through
one CSA and one ERA-NET Cofund307
.
JPI UE (Urban Europe) JPI Urban Europe was launched in 2011 and adopted its first SRIA at the end of 2015. It has
13 member countries, six observer countries and some dissemination partner countries. The
EU FPs (FP7 and Horizon 2020) have supported JPI UE with two CSAs and two ERA-NET
Cofunds308
.
302 http://www.jpi-culturalheritage.eu/ 303 http://www.jp-demographic.eu/ 304 http://www.jpiamr.eu/ 305 http://www.waterjpi.eu/ 306 http://www.jpi-oceans.eu/ 307 http://www.jpi-climate.eu/home 308 http://jpi-urbaneurope.eu/

276
While the implementation of joint calls is only one typical activity of JPIs, it remains
currently the only activity where, at least to a limited extent, the alignment of national
programmes to the JPIs can be quantitatively described309
. The following figure shows the
level of committed national budgets to the individual JPIs over the period 2011-2015,
highlighting the clear upward trend in national commitments to JPIs joint calls.
Figure 75 National Budgets committed to calls launched by Joint Programming
Initiatives
Source: ERA LEARN, Evaluation of Joint Programming to address grand societal challenges
A breakdown of the national contributions to the joint calls between 2011 and 2015 is
presented in the following figure.
309 As no data are available on total national competitive funding in the targeted fields, the ratio between national funding and
contributions to JPIs can’t be measured.

277
Figure 76 National budgets committed to calls launched by Joint Programming
Initiatives between 2011-2015
Source: ERA LEARN, Evaluation of Joint Programming to address grand societal challenges
I.6. Evaluation Results on Public-Public Partnershipss
From the P2P portfolio, the Joint Programming Process (JPP/JPIs) and the ERA-Net CoFund
instrument under Horizon 2020 have already been subject to evaluations, carried out with the
support of independent experts.310
In addition, the ERA Progress Report 2016 analyses the progress of Member States with
respect to the Top Action Priorities identified in the ERA Roadmap that was adopted by the
Council in June 2015311
. For the priority 2a (jointly addressing societal challenges) the Top
Action Priority is “Improving alignment within and across the Joint Programming Process
and the resulting initiatives (e.g. Joint Programming Initiatives (JPIs)) and speeding up their
implementation”.
310 For the Art 185 initiatives, a number of evaluations are underway, notably two final evaluations of the FP7 initiatives
BONUS and EMPR and four interim evaluations of the Horizon 2020 initiatives AAL2, EDCTP2, EMPIR and
EUROSTARS2. These will be accompanied by a meta-evaluation. Results will be presented in a separate Staff Working
Document (SWD) by the end of 2017, accompanying the Commission Communication on the Horizon 2020 interim
evaluation. 311 https://era.gv.at/object/document/1817/attach/0_pdf.pdf
0 5 10 15 20 25 30
Qatar
Moldova
Greece
Czech Republic
China
Bulgaria
Argentina
United States
South Africa
New Zealand
Japan
India
Brazil
Australia
Slovenia
Lithuania
Slovakia
Estonia
Luxembourg
Israel
Canada
Turkey
Switzerland
Romania
Cyprus
Portugal
Finland
Austria
Poland
Ireland
United Kingdom
Sweden
Denmark
Spain
Italy
Norway
Germany
Belgium
France
Netherlands
l Member State l Associated Country l Third Country

278
I.6.1. Evaluation of Joint Programming to Address Grand Societal Challenges
The Joint Programming evaluation developed a framework with eight indicators to enable a
qualitative assessment of the JPIs with respect to their progress towards impact on the societal
challenge and mobilisation of co-investment and alignment actions. The following diagram
presents the overall qualitative "scores" for the ten JPIs.
Figure 77 Indicators and average scores of JPIs for a qualitative assessment of the JPIs
with respect to their progress towards impact on the societal challenge and mobilisation
of co-investment and alignment actions
Source: ERA LEARN, Evaluation of Joint Programming to address grand societal challenges
All JPIs were qualitatively assessed using this framework. This revealed some different
patterns and the relative nascent nature of some JPIs. The key message from evaluation is that
the Joint Programming Process does not yet have sufficient ‘commitment’ from national
stakeholders to achieve its potential. Important considerations arising from this evaluation for
national and EU policy stakeholders include:
The Joint Programming Process offers the opportunity to create scale and scope in
R&D in Europe but this will only become a reality if national, transnational and EU
policies and priorities are developed in a more collaborative way;
The deliberations for the next Framework Programme offers the option to design and
implement a multi-level approach to joint programming leading to a critical mass of
coordinated societal challenge R&D across Europe and at the EU/international level.
The overarching recommendation of the Expert Group is, therefore, that: “Each of the JPIs
(and any other prospective ones) should be invited to consider their longer term strategy in
terms of socio-economic impact objectives/deliverables and what support instruments they
would need from the next Framework Programme. Any such proposals should, of course,
include firm commitments from national stakeholders (including how they will integrate the
JPI within national programming) and, where appropriate, other societal challenge
stakeholders such as industry”312
.
312
0
1
2
3
4
5
Societal challengepositioning
International leadership
Driving innovation
Variety of instruments
Investment in joint R&I
Share of nationalinvestment
Degree of nationalalignment
Self-sustainability
JPI Average

279
I.6.2. Analysis of ERA-NET Cofund actions under Horizon 2020
An evaluation313
of the ERA-Net Cofund instrument was carried out with the support of an
independent expert group in 2016. The expert group analysed the ERA-Net Cofunds within
the Horizon 2020 WP 2014/2015.
While the relevance of the ERA-NET Cofund instrument has been confirmed by the
evaluation, coherence among ERA-NETs but also between the ERA-NETs and other joint
initiatives is clearly underdeveloped. Consequently, coordination needs to be improved
among different ERA-NET Cofund actions in similar areas, and between ERA-NET Cofund
actions and other instruments and initiatives supporting public-public or public-private
partnerships in research and innovation (such as Joint Programming Initiatives, Art. 185
initiatives, Public-Private Partnerships, Knowledge and Innovation Communities). ERA-NET
Cofund actions are not deeply embedded in national policy portfolios and/or national
strategies possibly reflecting Member States’ lack of ambition to fully realise the instrument’s
potential. These remarks point to the urgent need to define a strategy for the ERA-NET
instrument that is shared both by the different EC Directorates and among Member States.
According to the findings of the evaluation, the ERA-NET Cofund contributes significantly to
strengthening transnational cooperation by establishing lasting cooperation among countries
and creating a critical mass of resources to tackle EU societal challenges. It has contributed to
the coordination of national programmes and to a lesser extent to the alignment of national
policies. The instrument has facilitated widening participation of lower performing countries
although more can be done in this area.
The overall recommendation of the expert group is that the “ERA-NET Cofund actions need
to be underpinned by a comprehensive strategy in the challenge/thematic area addressed and
synergies with other instruments and initiatives should be explored in order to achieve ERA
objectives more efficiently”.
The expert group strongly requested that strategies for challenges/thematic areas should be
supported by an exercise — to be carried out by the interested Member States and Associated
Countries assisted by the Commission — to determine complementarity and synergies with
other existing P2Ps and PPPs as well as the Framework Programme Work Programmes. This
also needs to address the request expressed by Member States for a balance of investments
between P2Ps / PPPs initiatives and instruments and the ‘regular’ Horizon 2020 research and
innovation actions.
The lack of a coherent overall strategy for implementing national / EU R&I policies on
thematic priorities is shown in the following figure; While ERA-Net Cofund stakeholders
acknowledge the EU added-value and the creation of critical mass, coherence within the
ERA-Nets and with other P2Ps is not sufficiently developed.
313 https://bookshop.europa.eu/en/analysis-of-era-net-cofund-actions-under-horizon-2020-pbKI0116995/

280
Figure 78 Relevance of ERA-NET Cofund actions to national / European policies
Source: Analysis of ERA-NET Cofund actions under Horizon 2020314
I.6.3. ERA Progress Report 2016: Priority 2a – jointly addressing societal
challenges
The ERA Progress Report 2016 concentrates on the headline indicators that have been
identified by ERAC315
to measure progress at Member State level in the eight ERA priorities
identified in the ERA Roadmap of 2015. The findings show that priority 2a, together with the
headline indicator for priority 3, has the highest growth rates among all eight ERA headline
indicators with an annual growth rate of 7.8% between 2010-2014. While this result is an
indication of the increasing internationalization of science in general, it also underlines the
increasing importance that national governments in Europe attribute to the stronger policy-
driven joint programming.
The following table presents the results of the ERA Progress Report 2016 for priority 2a
(Technical Report by Science Metrix 316
):
314 https://bookshop.europa.eu/en/analysis-of-era-net-cofund-actions-under-horizon-2020-pbKI0116995 315 http://data.consilium.europa.eu/doc/document/ST-1208-2015-INIT/en/pdf 316 http://ec.europa.eu/research/era/pdf/era_progress_report2016/era_progress_report_2016_technical_report.pdf

281
Figure 79 GBARD (EUR) allocated to Europe-wide transnational, as well as bilateral or
multilateral, public R&D programmes per FTE researcher in the public sector (2010-
2014); the explanation for the Swiss data outlier can be found in the Technical Report
Source: ERA Progress Report 2016, Technical Report317
This interpretation is reinforced by the additional EMM indicators, notably the Member States
financial contributions to P2Ps within the EU R&D policy framework per FTE researcher in
the public sector.. This additional ERA indicator showed the highest growth rate of all ERA
indicators with an annual growth rate of 42.1 % in the years 2012-2014. Clearly, the provision
of a common policy framework at EU level as well as the provision of additional financial
resources (for Art 185 initiatives and ERA-NET Cofunds) acted as a catalyst for joint action
317 http://ec.europa.eu/research/era/pdf/era_progress_report2016/era_progress_report_2016_technical_report.pdf
CountryWeight in
GDPScore
(2014)CAGR
(2010-14)Lead/Gap
to EU-28 CAGRTrendline
(2007-14)
EU-28 2 507 7.8% N/A
Cluster 1 25.9% 10 923 5.0% -2.8
Cluster 2 36.6% 3 642 5.4% -2.4
Cluster 3 36.2% 1 140 15.0% 7.2
Cluster 4 1.2% 63 -22.8% -30.6
Cluster 1
CH 4.1% 27 941 :
BE 3.1% 9 251 1.0% -6.8
IT 12.6% 8 395 18.1% 10.3
AT 2.6% 6 958 3.4% -4.3
IS 0.1% 6 927 :
SE 3.4% 6 067 -2.5% -10.3
Cluster 2
DE 22.8% 4 686 -1.1% -8.9
NO 3.0% 4 414 -3.9% -11.7
NL 5.2% 4 101 10.4% 2.6
FI 1.6% 3 795 -0.2% -8.0
LU 0.4% 3 387 35.2% 27.4
CY 0.1% 3 018 0.7% -7.1
IE 1.5% 2 951 5.7% -2.0
DK 2.0% 2 787 -3.7% -11.4
Cluster 3
UK 17.6% 2 561 11.0% 3.3
ES 8.1% 2 385 6.2% -1.6
HR 0.3% 1 569 22.5% 14.8
CZ 1.2% 1 245 -3.4% -11.1
RO 1.2% 1 191 9.5% 1.7
EL 1.4% 1 098 -12.6% -20.4
LV 0.2% 1 030 47.1% 39.4
SI 0.3% 955 -18.4% -26.2
EE 0.2% 939 25.7% 18.0
PT 1.4% 749 1.4% -6.4
PL 3.2% 678 76.8% 69.0
LT 0.3% 220 24.8% 17.1
HU 0.8% 194 3.8% -4.0
Cluster 4
RS 0.3% 101 :
BG 0.3% 97 16.0% 8.2
SK 0.6% 52 15.7% 7.9
MT 0.1% 0 -100.0% -107.8

282
among Member States, and underlines the importance of EU policies and respective EU
action for the implementation of ERA.
Figure 80 Member State participation (EUR) in Public-to-Public collaborations
(ERA_Net Cofunds, Art. 185 initiatives and JPIs) per FTE researcher in the public
sector (2012-2014)
Source: ERA Progress Report 2016, Data from ERA-LEARN 2020 – calculations by Science Metrix.
As this additional ERA-indicator is statistically one fraction of the headline indicator for this
priority, it can be argued that the common EU policy framework and the additional resources
provided by the EU R&D framework programmes led to a significant leverage effect at
national level for participating in Joint Programming – notably as the growth rate for the
additional indicator is about four times as high as for the headline indicator.
On average, the national P2P contributions account for 20% of the overall national GBARD
to transnational programmes. The comparison between the two tables highlights some
relevant strategies of Member States:
CountryWeight in
GDPScore
(2014)CAGR
(2012-14)Lead/Gap to EU-28 CAGR
Trendline (2012-14)
EU-28 512 42.1% N/A
Cluster 1 3.6% 2 836 123.8% 81.8
Cluster 2 14.6% 1 176 94.7% 52.6
Cluster 3 81.8% 302 66.9% 24.8
Cluster 4 N/A N/A N/A N/A
Cluster 1
CY 0.1% 3 625 235.0% 192.9
LU 0.4% 2 836 29.4% -12.7
SE 3.1% 2 046 107.2% 65.1
Cluster 2
AT 2.4% 1 610 49.9% 7.8
DK 1.9% 1 358 99.1% 57.0
LV 0.2% 1 334 232.2% 190.1
NL 4.7% 1 087 90.3% 48.2
BE 2.9% 1 064 55.5% 13.4
MT 0.1% 1 047 :
FI 1.5% 983 66.4% 24.3
RO 1.1% 927 69.4% 27.3
Cluster 3
SI 0.3% 769 20.6% -21.4
IE 1.4% 739 33.7% -8.4
DE 20.9% 571 21.4% -20.7
FR 15.3% 439 33.0% -9.1
EE 0.1% 367 196.1% 154.0
UK 16.2% 345 38.3% -3.8
ES 7.5% 312 34.7% -7.4
IT 11.5% 255 3.7% -38.4
PL 2.9% 253 23.1% -19.0
PT 1.2% 224 58.3% 16.2
HU 0.7% 199 234.0% 191.9
LT 0.3% 163 104.9% 62.9
SK 0.5% 142 14.6% -27.5
HR 0.3% 133 249.5% 207.4
CZ 1.1% 104 37.3% -4.8
BG 0.3% 103 93.1% 51.0
EL 1.3% 18 -59.5% -101.6

283
Some Member States such as CY or HU invest nearly all available resources for
transnational cooperation in P2Ps;
For the large EU Member States such as DE or the UK, the national contributions to
P2Ps are usually smaller than the EU average of 20%318
;
A substantive group of Member States such as AT, BE, SE, FI or DK display
declining overall funding for transnational cooperation while increasing their
contributions to P2Ps, suggesting clear policy choices in favor of transnational
programmes embedded in the overall EU policy framework of P2Ps.
The ERA Progress Report 2016 includes some analysis on the National ERA Action Plans
(NAPs), which have been developed following the Council Conclusions on the European
ERA Roadmap in 2015. So far, 24 Member States and four Associated Countries adopted a
national ERA action plan.
The NAPs present a broad range of measures and activities of Member States and Associated
countries to strengthen their participation in Joint Programming and to better align national
and Europe-wide R&D programming. These include:
Communication and information measures including better information of R&D actors
concerning the opportunities and added-value from participating in Joint
Programming;
Governance and coordination measures are introduced by a number of Member States.
Dedicated funding measures are introduced by a number of Member States for the
participation in Joint Programming.
Harmonisation of funding rules has been introduced by several Member States aiming
at facilitating the national participation in the JPI’s.
Outreach measures towards smart specialization strategies and sectoral policies,
especially focusing on better articulation between the European Structural and
Investment Funds, notably the regional smart specialization strategies, and the SRIA’s
of the JPI’s.
I.7. Lessons learnt
Based on the evidence accumulated to date, the strengths and weaknesses of P2Ps can be
summarised as follows:
Strengths
There is the potential for high European and national added value due to the more
efficient and effective use of public resources;
There has been a clear contribution to the better design and implementation of sectoral
policies aligned towards societal challenges;
318 Data for FR is not available.

284
Participating countries invest significant amounts in P2Ps and consider that they offer
effective ways of supporting trans-national collaboration;
There have been significant streamlining, leverage and alignment effects as a
consequence of the exchange of good practice, notably in terms of mobilising and
aligning national resources with initiatives with similar objectives in other countries
and with EU level objectives;
The potential for cooperation with international partners both within and outside of
Europe has been enhanced.
Weaknesses
Despite their potential benefits, the long-term commitment of national funds to P2Ps is
limited by budgetary and legal constraints;
Although there have been alignment effects, the strategic positioning of P2Ps between
national initiatives and EU initiatives is not always clear;
The focus of P2Ps to date has been on competitive funding, which is in short supply in
many countries, and the potential for aligning and integrating institutional support
mechanisms remains relatively untapped (apart from the Art.185 on metrology);
Many potential national partners in Joint Programming P2Ps lack the institutional,
organisational and strategic management capacities to participate effectively;
Weak interactions in some countries between national research communities and other
actors located within national innovation systems (e.g. public authorities, industry and
other end users) limit the potential for downstream impacts.
Some key issues are instrumental for an overall performance improvement of P2Ps:
rationale, aims and objectives, scope and focus, governance, finance and impact.
(1) Rationale
The continued existence of Joint Programming depends on the articulation and acceptance at
the highest levels of convincing arguments in its favour.
The case for Joint Programming was established in the last decade and financial support for
initiatives to be undertaken has grown appreciably since. Nevertheless, it still accounts for
only 3% of the Framework Programme budget and for an even smaller percentage of national
expenditure on R&D. It suffers, therefore, from a lack of visibility when overarching
strategies for research and innovation at national and EU levels are discussed at the highest
policy levels. It seems that the arguments elaborated in the early days of Joint Programming319
were still valid, but that they needed to be revisited and reiterated, with the criteria for
establishing P2Ps clearly articulated and widely discussed in policy circles.
319 See, for example, ‘Towards Joint Programming in Research’, SEC(2008)2282, Brussels, 17.07.2008 at
http://register.consilium.europa.eu/doc/srv?l=EN&f=ST%2011935%202008%20ADD%202

285
(2) Aims and Objectives
There is a clear need for mutually agreed aims and objectives if performance is to be
improved.
The evaluations of Joint Programming and of the ERA-Net CoFund noted that there had been
mixed success to date in terms of ensuring that the wishes of all partners are respected when
formulating the aims and objectives of individual P2Ps, and that this situation needed to be
remedied in future. There is an even greater need for clarity concerning the specific aims and
objectives of the Joint Programming process as a whole and the role of Joint Programming
within national and EU contexts. Many individual initiatives coexist within a universe of
multiple other initiatives at EU and national levels, with all the attendant potential for
negative interactions and unrealised synergies in the absence of an overview of how
everything fits together.
(3) Scope and Focus
A greater focus on the scope of initiatives is needed to make the best use of resources and
avoid obvious barriers, traps and pitfalls.
Looking across all P2Ps, there is a tension, on the one hand, between the flexibility and
multiplicity of choice offered by a wide range of joint initiatives and, on the other hand, the
competing need to concentrate on a narrower range of initiatives and topics in order to make
the best use of scarce resources. Finding ways of ensuring that strategic choices can be
implemented in flexible ways is, thus, another key task for the future.
(4) Governance
Clear leadership, lines of responsibility and rules of procedure are essential to sound
governance.
The evaluations expressed some concern about governance arrangements for P2Ps as a whole,
and especially for the relative roles played by, for example, Framework Programme
Committees and the governing bodies of JPIs in the formulation and implementation of
research and innovation-related agendas in Europe. Both evaluations stress the administrative
burden associated with the higher transaction costs of P2Ps is a particular problem that needed
to be resolved. They also point to the continued existence of regulatory and legislative barriers
to the full integration of joint activities at national level.
(5) Finance
Better mechanisms are needed to ensure more stable, longer-term financial arrangements.
The JPI evaluation highlighted that the current rather unstable financing mechanism at
national level for P2Ps constitutes a major barrier for more impacts. Securing long-term
financing while respecting the budgetary constraints and policy cycles of Member States
undoubtedly remains an essential task for the future.
(6) Impact
The need to demonstrate the impact of P2Ps is vital if they are to realise their full potential
within European research and innovation-related policy portfolios.

286
Both evaluations agreed about the need to realise the potential of Joint Programming by
ensuring the attainment of expected impacts. Demonstrating impact is important if the value
of P2Ps is to be recognised at ministerial levels and taken into account when formulating
future strategies at both national and EU levels.

287
J. FURTHER INFORMATION ON THE IN-DEPTH ASSESSMENT OF PUBLIC-PRIVATE
PARTNERSHIPS
J.1. Introduction
Public-private partnerships under Horizon 2020 represent the joining of forces between the
EU and industry and provide funding for large-scale, longer-term and high risk/reward
research. They set out financial commitments, over a seven year period from both the EU and
from the industry partners. They each have clear objectives which need to be achieved by the
Partnerships. They bring together companies, universities, research laboratories, innovative
SMEs and other groups and organisations around major research and innovation challenges.
They establish their own strategic research and innovation agendas and fund projects selected
through open and competitive calls for project proposals.
The Joint Undertakings (JUs)320
are public-private partnerships (PPP)321
in industrial research
at European level. They were set up in 2007-2008 under the Seventh Framework Programme
(FP7) in five strategic areas — aeronautics and air transport, health, fuel cell and hydrogen
technologies, embedded computing systems and nano-electronics. Bringing together industry,
the research community, Member States322
, regulators and the EU to define and implement
common research agendas and invest in large-scale multinational research activities, the Joint
Undertakings are concrete examples of the European Union's efforts towards strengthening its
competitiveness through scientific excellence, industry led research, openness and innovation.
Based on the experience acquired under FP7, a new generation of public and private
partnerships was set up323
by the European Commission, aiming to collectively pool more
than EUR 22 billion of research and innovation investments. This led to the establishment of
the following seven Joint Undertakings that organise their own research and innovation
agenda324
and award Horizon 2020 funding for projects on the basis of competitive calls:
Clean Sky 2 (CS2), Fuel Cells and Hydrogen 2 (FCH2), Innovative Medicines Initiative 2
(IMI2), Electronic Components and Systems for European Leadership (ECSEL replacing
ARTEMIS and ENIAC), Bio-based Industries (BBI), Single European Sky Air Traffic
Management Research (SESAR) and Shift2Rail.
As Article 32 (3) of the Horizon 2020 Regulation requires the Commission to provide an in-
depth assessment on the openness, transparency and effectiveness of Joint Undertakings, this
analysis is organised around these three evaluation topics. Finally, it should be noted that the
report reflects an aggregated assessment of all seven Joint Undertakings together, highlighting
relevant individual examples, exceptions and deviations where needed. A more in-depth
evaluation of Joint Undertakings will be available in Autumn 2017.
320 Article 187 of the Treaty on the Functioning of the EU (TFEU) states that ‘the Union may set up Joint Undertakings or
any other structure necessary for the efficient execution of Union research, technological development and demonstration
programmes’. 321 In addition to the institutionalised PPPs, also the contractual Public-Private Partnerships (cPPPs) have a legal basis in
Article 25 of the regulation establishing Horizon 2020. Please note that the assessment of cPPPs is not included in this
document but will be part of the overall SWD, planned for 2017. 322 Only ECSEL include Member States as part of the JU. All other JUs do not include Member States as such but
nevertheless do consult them through the State Representative Group which is an advisory body. 323 An exception is the SESAR JU for which the existing JU Regulation was extended. 324 Exception is the SESAR JU agenda of which is set by the Member States, various Air Traffic Management. (ATM)
stakeholders and the members of the PPP in the framework of the European ATM Master Plan.

288
Complementing the Joint Undertakings, the Commission in FP7 also engaged in structured
partnerships with the private sector to seek direct input into the preparation of the work
programmes in areas which were defined upfront and which are of great industrial relevance.
Three such partnerships were launched under the European Economic Recovery Plan325
, and
implemented through call topics under FP7 rules of participation with a total Union
contribution of EUR 1.6 billion. The calls have been highly relevant to industry with about
half of the project funding allocated to industry, and about 30% to SMEs.
Building on this experience, under Horizon 2020 ten contractual public-private partnerships326
have been established: Factories of the Future; Energy-efficient Buildings; European Green
Vehicles Initiative; 5G Infrastructure; Sustainable Process Industry; Robotics; Photonics;
High Performance Computing; Big Data Value and Cybersecurity. These partnerships are
implemented through calls with a total Union contribution of EUR 6.6 billion327
, are based on
a contractual arrangement between the Commission and the industry partners, setting out the
objectives, commitments, key performance indicators and outputs to be delivered.
An evaluation on contractual public-private partnerships (except Cybersecurity established in
the second half of 2016), implemented within Horizon 2020 (cPPPs), will be prepared
together with a Group of Experts between April and September 2017.
J.2. Openness
J.2.1. Openness to newcomers
In order to assess the openness of Joint Undertakings, especially towards newcomers, a
distinction is made between the openness of its membership policy and the openness of its
participation policy and procedures for the respective research activities.
J.2.1.1. Openness of the Joint Undertakings Membership policy
In most Joint Undertakings different levels of membership can be distinguished according to a
"hierarchical" logic with different rights (e.g. decision making power within the JU, access to
the JU research programme(s), share of EU contribution) and obligations (e.g. size of the fees
and contributions to be paid to the JU, duration of the commitment). Although not the same
for all Joint Undertakings, overall the following types of members can be distinguished:
Full members (e.g. " BIC328
" in BBI, the "Industrial members" in SESAR329
, the
"Leaders" in CS2, the eight founding members in S2R, the Industry Grouping
members and the Research Grouping members in FCH2, the Private Members Board
in ECSEL)
Associated members (e.g. "Associated Partners" of IMI2, the "Core" partners in
CS2);
325 COM(2008) 800. 326 The first four take forward public-private partnerships established under FP7. 327 Excluding budget for the Cybersecurity cPPP 328 BIC: Bio-based Industries Consortium Asbl, a non-profit organisation established under Belgian law with its permanent
office in Brussels, Belgium. 329 Full members include public and private single entities, legal consortia and consortia established for the purpose of
Membership of the SESAR JU (renewed and extended with the extension of the founding regulation) and in addition to the
two founding members (EU and EUROCONTROL).

289
Partners ("third parties" linked to the industrial partners in SESAR).
Overall, all Joint Undertakings have an open access policy towards membership and describe
their procedure for membership on their respective websites. Depending on the level of the
membership, some eligibility conditions and entry or annual fees apply. Besides the general
condition that candidate members should have knowledge and expertise in the respective
sectors of the Joint Undertakings, the membership criteria per Joint Undertaking can be
summarised as follows:
BBI: any legal entity that directly or indirectly supports R&I in a Member State or in
an Associated Country;
CS2: any legal entity established in a Member State or in an Horizon 2020 Associated
Country may become a core partner;
FCH2: any legal entity in a Member State or Horizon 2020 Associated Country,
which is or plans to be active in the FCH sector and is sharing and supporting the
objectives of the FCH 2 JU can apply to become member of the Industry or Research
Grouping ;
IMI2: any legal entity that directly or indirectly supports R&I in a Member State or in
an Horizon 2020 Associated Country. Legal entities can also apply to become
Associated Partners;
ECSEL: Member States or Horizon 2020 Associated Countries; any country pursuing
R&I policies in electronic components and systems; any legal entity that directly or
indirectly supports R&I in a Member State or in an Horizon 2020 Associated Country;
S2R: any legal entity, grouping or consortium of legal entities established in a
Member State or in an Horizon 2020 Associated Country.
SESAR: beyond the two founding members, any other public or private undertaking
or body including those from third countries that have concluded at least one
agreement with the European Union in the field of air transport330
with the
participation ensuring a proper balance between airspace users, air navigation service
providers, airports, military, professional staff associations and manufacturers and
offer opportunities to SMEs, academia and research organisations331
.
The openness of membership towards newcomers is highly impacted by the entry ticket
system. As already mentioned, this is a system where candidate members are asked to make a
substantial financial contribution and/or in-kind contributions to the Joint Undertaking in
return for their membership. Although it has many advantages, it may also include some
disadvantages that can impact the “openness” of the Joint Undertakings towards new
members.
330 Council Regulation (EC) No 219/2007 of 27 February 2007 on the establishment of a Joint Undertaking to develop the
new generation European air traffic management system (SESAR), Statutes of the Joint Undertaking, Article 1. 331 Council Regulation (EC) No 721/2014.

290
Table 52 Advantages and disadvantages of the entry ticket system
Possible advantages Possible disadvantages
In return for the entry ticket, members are directly
involved in the governance of the JU.
Members can contribute to the definitions and
development of the multi annual action plans,
annual work documents, call topics.
Members have access to the research programmes
and activities of the JU and therefore also to the EU
co-financing budget.
Organisations that make a significant (financial)
contribution to the JU bring stability and tend to be
strongly committed to the success of the
programme.
As was mentioned by S2R, the entry ticket system
results in lower overall co-financing rates for
members and consequently in higher direct
leverage effects as the members are required to
make the majority of their in-kind contributions
towards the indirect actions (projects) co-funded by
the JU.
Smaller entities like SMEs, smaller universities and
research centres and small organisations coming
from EU-13 countries may face difficulties to pay
for the required entry tickets which represent
significant contributions, unless forming consortia.
Entry tickets imply a long term commitment to the
JU, often for the whole duration of the JU. Not all
stakeholders (typically smaller entities) are able to
make this long term commitment
Source: Information provided by the thematic units responsible for the seven respective Joint Undertakings
Another factor which influences the "openness" towards new members is the application
procedure used for membership. While most Joint Undertakings apply a system where a
request for membership can be submitted at any given time and is evaluated on a case by case
basis, other Joint Undertakings organise competitive calls for (associated) membership on a
periodic basis (e.g. S2R). In the latter case, although open to all, candidates have fewer
opportunities to become members as they need to wait until a call is launched. The
membership procedure can also include negotiations between the Joint Undertaking and the
candidate as it is the case of SESAR.
J.2.1.2. Openness of the Joint Undertakings Participation policy
Concerning the openness of Joint Undertakings towards participation in their respective
research activities and programme(s), we can distinguish two types of Joint Undertakings.
Joint Undertakings that publish only calls that are open to both members and non-members
(BBI, IMI2, FCH2, ECSEL) and Joint Undertakings that prescribe restricted research
activities reserved to members only and, also, publish calls on other research activities open to
non-members (SESAR, S2R, CS2).
In addition to the mechanism of open calls, several Joint Undertakings set aside part of the EU
budget that is dedicated to non-members (S2R, CS2, SESAR, ECSEL) in order to
demonstrate their openness to all potential beneficiaries regardless of type or size.
Some quantitative figures on the number of newcomers in the second generation and extended
Joint Undertakings are:
Overall for all Joint Undertakings, 27% of the beneficiaries are new;

291
BBI: among the top 25 beneficiaries that receive the highest BBI JU contribution, 8
have never participated in any of the FP7 or Horizon 2020 calls before, which equals
to 32% newcomers;
IMI2: 50% new participants in signed grants;
FCH2: 24% new participants in signed grants.
To conclude, although the criteria for membership to the Joint Undertakings can be
considered straightforward and open, the size of the financial "entry ticket" or (annual) fees
influences substantially the type, size or composition of the entities that can actually become a
member and hence have access to the full package of benefits that a JU offers to its members.
Due to the substantial financial commitments that members have to make, SMEs, small
universities and research organisations may face financial barriers in becoming a JU member.
The openness to membership may also impact the participation in the research programmes
and the respective EU budget. For some Joint Undertakings certain research activities or
topics are only open to members (CS2, SESAR, S2R) and/or a fixed percentage of the EU
budget is reserved for the non-members (S2R, ECSEL).
In order to overcome some of the entry barriers and to demonstrate openness towards
newcomers and players like SMEs, universities and research organisations the Joint
Undertakings introduced a number of mechanisms and tools:
Applying different levels of membership, implying different levels of commitment as
described above (IMI2);
Applying different minimum contributions and fees or other in kind contributions for
different types of players (e.g. lower fees for SMEs) (SESAR, FCH2);
Organising calls which are reserved only for non-members (SESAR, S2R) or calls
which are open to both members and non-members (BBI, IMI2);
Reserving a minimum volume or percentage of the EU budget for non-members (e.g
S2R, CS2, ECSEL, SESAR).
When assessing the openness towards membership, it has to be noted that not all stakeholders
and, in particular SMEs, are interested in or willing to become a member of the JU.
Membership brings along a long term commitment and some degree of additional
bureaucracy. They are only interested in participating in the research activities as a
beneficiary through the open calls.
J.2.1.3. Openness of the contractual Public-Private Partnerships
In the case of the contractual Public-Private Partnerships, their calls are included in the
Horizon 2020 Work Programme and applicants are then subject to the same rules of
participation as in other parts of the research programme.
a) In addition, the associations constituting the private side are open to new members. In
many industrial sectors and contractual Public-Private Partnerships, the associations
work closely with related European Technology Platforms to develop their strategies

292
and roadmaps. These platforms are also open to new members and do not require a
financial commitment, thus opening up participation in particular to SMEs.
b) The SME participation varies across contractual Public-Private Partnerships and
ranges from 11% to above 35%. The SME participation is based on optional self-
declaration and Commission validation. As such, the numbers may be underestimated.
c) The strong participation of non-members, as well as highly innovative and research
intensive industrial players, shows that the priorities of the contractual Public-Private
Partnerships are highly attractive to a vast range of stakeholders.
All contractual Public-Private Partnerships display an adequate and satisfactory level of
participation in terms of the targeted stakeholders within each field. Furthermore, the number
of members of contractual Public-Private Partnerships is growing, highlighting the positive
trend in terms of the level of engagement of the stakeholder community within the contractual
Public-Private Partnerships. Each contractual Public-Private Partnership aims to engage the
full technological value chain comprising of researchers, academia, manufacturers and users.
Table 53 Participation in calls of the contractual Public-Private Partnerships
Contractual
Public-Private
Partnerships332
FoF EeB EGVI SPIRE 5G HPC333
Photonics334
Robotics335
Big
data336
% of Non-members
in the
participations
77 75 67 73 71 62 80 58 78
% of Non-members
in the EC funding
77 70 53 71 60 60 71 46 71
% of Industry in
the participations
61 57 60 59 64 22 51 37 55
% of SMEs in the
participations
>35 >33 >15 >27 >17 >11 >28 18 >25
Source: European Commission,based on inputs from contractual Public-Private Partnerships
J.2.2. Attracting the "best players"
Judging from the Joint Undertakings memberships and their top ranking beneficiaries, one can
conclude that the Joint Undertakings are able to attract prominent players in their respective
fields of activity not only in terms of size and position in the market but also in terms of R&D
intensity and innovation potential. The table below presents some of the "best" players by
Joint Undertaking and sector of activity.
332 Data referring to the 2014 calls unless otherwise stated. The Big Data cPPP contractual arrangement only entered into
force on 1 January 2015, that for Cybersecurity on 5 July 2016. 333 Approximate figures coming from 29 projects that started in 2015. 334 Calculated for all funded projects in 2014-2016. The non-membership participation and funding is based on the 100
members of the board of stakeholders of the PPP. 335 Relating to 2014 - 2016 calls. 336 Calculated over all projects selected in the Big Data call of 2016. Both 'full members' and ''associate members' of the Big
Data Value Association (BDVA) are counted as 'members', the rest as "non-members".

293
Table 54 Overview of "best" Players by Joint Undertaking and sector of activity
Joint
Undertaking
Sectors/subsectors Presence of "best" players? Examples of attracted
members/participants
SESAR Air Traffic Management (ATM) industry, including air
navigation service providers, ATM systems
manufacturers, aircraft manufacturers, airports,
research institutes
The members of SESAR are indeed prominent players, for some
subsectors even the only players in the market
11 manufacturing industries including
AIRBUS, Dassault Aviation, Leonardo
Finmeccanica, ENAV, DFS, Indra,
Honeywell Aerospace, THALES,...
16 Air Navigation Service providers
7 airports including Paris, Heathrow,
München, Fraport, Schiphol and Zürich
3 Research Institutes: DLR, NLR, SINTEF
BBI BBI covers a wide range of distinct and broadly
defined economic sectors, dedicated to the sustainable
utilisation of Europe’s renewable biological resources
for industrial processing into a wide array of bio-based
products such as Chemicals, Materials, Food
ingredients and feed, and potentially Energy.
All sectors covered by the BBI JU are also active participants in the
calls of the JU.
The top 25 BBI JU participants in calls 2014-2015 in terms of
requested EU contribution include 16 organisations that have already
participated in FP7/Horizon 2020 projects, indicating their scientific
and technological excellence.
Borregaard, Clariant Produkte GmbH,
Novamont SPA, COSUN, UPM-
KYMMENE, METABOLIC EXPLORER,
AVANTIUM CHEMICALS,...
S2R The entire rail value chain: railway manufacturing and
supply industries, railway operating community and
the railway research community
The members of S2R (excl EU) include the leading railway system
integrators, manufacturers, infrastructure managers and passenger and
freight rail operators of Europe. The members show a balanced
representation of actors of the entire value chain, including SMEs and
academia. The same objective of balanced representation has also
been achieved in the first calls launched in December 2015
Alstom SA, AERFITEC, AMADEUS SA,
AZD Praha, Bombardier, Deutsche Bahn
AG, INDRA, Siemens, SNCF, Talgo, …
IMI2 Pharmaceuticals & Biotechnology industries The best and main players are being attracted to IMI2 JU projects,
both Universities benefiting from EU funding as well as Industries
contributing in-kind (members).
The participants of the 15 first signed grants include 50% top 200
worldwide universities ("Multirank 2016"), 3 top 10 universities
("Shanghai Academic Ranking of World Universities 2016"), 9 out of
the top 10 EU Pharmaceutical & Biotechnology companies for R&D
investments (2015 EU Industrial R&D Investment Scoreboard) and all
top 15 world pharmaceutical & biotechnology companies for R&D
investments. Additionally all industries contributing in-kind are
amongst the top 500 R&D investors worldwide (all sectors)
5 major EFPIA members which are leading
the 7 strategic Governing Groups advising
IMI2 are: Novartis, Johnson&Johnson -
Janssen, Sanofi, AstraZeneca, GSK
3 top 10 universities ("Shanghai Academic
Ranking of World Universities 2016") are
participants in the 15 first signed grants:
Massachusetts Institute of Technology
(USA), University of Oxford (UK and
University of Cambridge (UK)
CS2 European Aeronautics and aviation industry (including
the research centres)
The Cleansky membership includes the main European aeronautics
companies and the main European Aviation research centres.
AIRBUS, Dassault, Fraunhofer Gesellshaft,
Alenia, Rolls-Royce, SAAB, Thales,...

294
Joint
Undertaking
Sectors/subsectors Presence of "best" players? Examples of attracted
members/participants
FCH2 Fuel cell and hydrogen energy technologies in fields of
transport (cars, buses and refuelling infrastructure) and
energy (hydrogen production and distribution, energy
storage and stationary power generation).
FCH2 succeeded so far to attract some of the biggest players in the
field:
top-ranking car manufacturers
top energy and utility companies
High innovators both for transport as for energy are well presented.
Car manufacturers: VW, Daimler, Honda,
BMW, Nissan, Renault, Toyota, Hyundai,
…
Energy and utility companies: Bosch,
Siemens, GE, Engie, Solvay,…
ECSEL Electronic components and systems industry
Semiconductor and smart system manufacturing
Looking at the top 30 ECSEL participants and their position in the top
R&D in Europe and worldwide, we can conclude ECSEL attracts the
major players, counting among its participants many of the top-
ranking semiconductor and top multinational engineering and
electronics companies
ASML, Infineon, Fujitsu, Applied Materials,
STMicroelectronics, NXP Semiconductors,
ON Semi, KLA-Tencor, FEI, THALES,
SOITEC, Carl Zeiss, Daimler, Robert
Bosch, Philips and LAM Research
Source: Information provided by the thematic units responsible for the seven respective Joint Undertakings

295
J.2.3. Participation of SMEs
As already mentioned, the entry ticket system can hamper the participation of SMEs in the JU
activities. However, depending on their respective industrial specificities and characteristics,
the Joint Undertakings take particular measures to increase the presence of SMEs in their
activities. These measures include, among others:
Giving SMEs a representation in the Governing Board so they can contribute to the
definition of the Work programme (FCH);
Applying lower entry fees in order to facilitate SME membership;
Simplifying the rules for participation;
Reserving access to funding only to SMEs and familiar research organisations, in
certain type of actions (BBI);
Defining call topics that appeal to SMEs;
Explaining the Intellectual Property (IP) issues;
Communicating better the opportunities and the benefits involved in SME
participation.
The SME shares in Horizon 2020 proposals as well as in the already signed Horizon 2020
grants are summarised in the table below. A distinction is made between their shares in terms
of number of applications/ participations and their shares in terms of EU contribution.
Additionally, the success rates for SMEs participating in JU proposals are presented. The
figures presented in the table refer to the (open) calls launched by the Joint Undertakings.
They do not include the shares of SMEs in research activities which are reserved for members
only.
Overall, 23,3% of all JU applicants are SMEs with 34,62% success rate among all applicants
and requesting 19,3% of the total requested EU contribution.
In signed grants, SMEs represent 19,5% of all JU beneficiaries. In terms of EU contribution,
SMEs received 18,4% of the funding. This also implies that Joint Undertakings almost but not
completely meet the overall target of 20% of the Horizon 2020 budget being earmarked for
SMEs.
The SME participation rates in Joint Undertakings operating under Horizon 2020, especially
in terms of EU funding, are above the overall Horizon 2020 average so far: 18,4% against
15,9% in terms of EU contribution granted to SMEs. In terms of participations however, The
share of SMEs in the JU's (19,5%) is slightly lower than the overall Horizon 2020 share of
19,8%.
It is important to mention that significant disparities in SME shares between the Joint
Undertakings can be observed. One important explanation for these disparities is the
differences in the structure of the respective industries of the different Joint Undertakings and
consequently the type, size and number of players active in them.

296
Another explanation is the barriers that still exist in some sectors that prevent SMEs to
participate. Examples of existing barriers mentioned amongst others by IMI2 are:
Competition with other programmes at national level and EU level, sometimes more
attractive to SMEs such as the SME instrument and Eurostars;
The rather short deadlines in calls in combination with a rather long time to grant from
an SME perspective;
SMEs lack awareness about opportunities under IMI2 JU;
SMEs have relatively weak links with the rest of the innovation ecosystem (academia,
pharmaceutical industries) thus facing problems to join the right consortia;
SME participation is harder for health research projects to attract SMEs because it is a
capital intensive sector compared with other Horizon 2020 funded sectors.
SMEs feel weak in consortia negotiations, especially on IP issues: SMEs come in late
to the (large) consortia, have limited financial and personnel means to allocate time
consuming and hard negotiation;
Topics which are too narrow defined for SMEs; they need more flexibility.
Table 55 SME shares in Horizon 2020 proposals and signed Horizon 2020 grants for
Joint Undertakings
Horizon
2020 JU
Proposals Signed Grants
% of SME
applications
% of
requested
EU funding
SME
Success rate
in terms of
application
SME Success
rate in terms
of EU
contribution
% of SME
participations
% of EU
funding
granted to
SMEs
SESAR 11,3% 8,4% 34,6% 55,6% 6,6% 8,3%
BBI 30,2% 29,6% 31,2% 25,4% 35,6% 29,2%
S2R 24,3% 16,2% 49,1% 37,4% 18,9% 9,6%
IMI 14,8% 11,8% 17,5% 18,7% 8,2% 10,1%
CS2 25,% 14,7% 24,4% 26,0% 27,4% 24,9%
FCH 22,4% 24,9% 29,8% 30,6% 26,5% 27,6%
ECSEL 27,4% 15,8% 55,12% 28,5% 19,2% 9,3%
TOTAL JU 23,3% 19,3% 34,6% 29,6% 19,6% 18,4%
Source: CORDA data as of 2 February 2017, Source for IMI2 data: JU Programme Office, IMI
Concerning the cPPPs, the participation of industrial organisations in the calls is around 60%
with the exception of HPC, and the SME participation ranges from 11% to 35%.

297
Table 56 Share of industry and SMEs in the participations in contractual Public-Private
Partnerships
Contractual
Public-Private
Partnerships 337
FoF EeB EGVI SPIRE 5G HPC338
Photonics339
Robotics340
Big
data341
% of Industry in
the participations
61 57 60 59 64 22 51 37 55
% of SMEs in the
participations
>35 >33 >15 >27 >17 >11 >28 18 >25
Source: European Commission, based on inputs from contractual Public-Private Partnerships
J.3. Transparency
By assessing the transparency of a JU and its research programmes and activities we want to
assess to which extend the Joint Undertakings have an open and non-discriminatory attitude
towards the wider community of stakeholders. All interested stakeholders should be aware of
the existence of the JU and its activities, that they should know where to get the information
needed, whether they have free and easy access to this information and whether rules and
procedures such as, for example, on how to participate in the JU's activities are clear to all. It
also measures to what extend the Joint Undertakings guarantee Open Access to information
and project results including publications and Intellectual Property Rights (IPRs) which is
obligatory under Horizon 2020 and which dissemination activities the Joint Undertakings
have put in place in order to communicate project results and facilitate further exploitation
opportunities. A more recent element of open access is "the open access to data", i.e., to the
underlying research data produced during the lifecycle of the EU funded projects.
J.3.1. Inclusiveness of a wide community of stakeholders and easy and effective
access to information
All Joint Undertakings have put in place a wide range of mechanisms in order to enhance an
open and non-discriminatory attitude towards the wider stakeholder community, including the
general public. These mechanisms include typically a wide range of communication tools
(electronic vs non electronic; interactive vs non-interactive) and other mechanisms like
collaboration, coordination, consultation and advisory mechanisms.
The table below summarizes the most common communication channels used by the Joint
Undertakings for communicating and distribution of information to the relevant stakeholders:
337 Data referring to the 2014 calls (unless otherwise stated). The Big Data cPPP contractual arrangement only entered into
force on 1 January 2015, that for Cybersecurity on 5 July 2016. 338 Approximate figures coming from 29 projects that started in 2015. 339 Calculated for all funded projects in 2014-2016. The non-membership participation and funding is based on the 100
members of the board of stakeholders of the PPP. 340 Relating to 2014 - 2016 calls. 341 Calculated over all projects selected in the Big Data call of 2016. Both 'full members' and ''associate members' of the Big
Data Value Association (BDVA) are counted as 'members', the rest as "non-members".

298
Table 57: Overview of communication channels used by the Joint Undertakings for
communicating and distribution of information
Communication
tools used by Joint
Undertakings
Electronic Non-electronic
Interactive Dedicated interactive space on the official
website of the Joint Undertakings: e.g.
project ideas box, partnering platform
Use of the participant portal of the European
Commission for the launch of the calls
Social media: Twitter, YouTube video's,
LinkedIn, Facebook page
Webinars to provide information on calls
Organisation of or participation in
events on International or
national level: e.g. big
conferences, participation in
events organised by individual JU
members at national level,
organisation of annual
stakeholder meeting/event
reaching out a broad range of
categories of stakeholders
Non-interactive Periodical newsletters
Official JU website including all public
documents like Annual Work Programmes,
Annual Activity Reports, tender
notifications, …
Articles, publications in
specialised or non-specialised
written press, interviews
Distribution of information
leaflets, brochures, flyers
Source: Information provided by the thematic units responsible for the seven respective Joint Undertakings
Overall, the approach of the Joint Undertakings towards their respective stakeholders is open
and inclusive as they consider them as partners rather than competitors. The Joint
Undertakings are employing not only the more "classic" range of communication tools but
also other mechanisms that aim at enhancing this inclusiveness and transparency such as:
Close cooperation and coordination with other Joint Undertakings (e.g. SESAR and
CS2);
Advisory bodies which represent all interested stakeholders (e.g. Open advisory
bodies of S2R, the 7 Strategic Governing Groups at IMI2);
Separate Memoranda of Understanding (MoUs) between the JU and European regions
seeking synergies with other programmes (e.g. ESIF) (BBI);
Distributing "seals of excellence" labels to proposals which were above threshold but
could not be funded. Doing so, the proposal can maybe be picked up more easily by
other support programmes (CS2).
The process involving industrial stakeholders within cPPPs is mainly based on publicly
available strategic research agendas and roadmaps. There are also Partnership Boards between
Commission services (DG RTD or DG CNECT) and the industrial association to ensure
relevant needs and innovation trends are reflected in the programme. In addition, the
Programme Committee configurations with Member State representatives for the various
parts of Horizon 2020 give direct technical input on work programmes and are formally
invited to support the work programme on the basis of a vote. Thus, national administrations
have a major say on the contents of the work programme.

299
J.3.2. Open Access and Dissemination of project results
In order to communicate on and distribute project results to an as large as possible
community, the Joint Undertakings use a variety of tools, very similar to the above mentioned
communication tools:
A dedicated section on the JU's website for dissemination of project results and
publishable project summaries (SESAR, BBI, CS2). FCH2 for example has a fully
searchable project database, accessible to all;
Scientific Publications and Articles related to project results;
Publication of a book summarizing important project results (ECSEL, CS1, FCH2
Annual Programme Review Report);
Social Media such as Twitter, Facebook, YouTube to communicate and demonstrate
project results;
Organisation of and participation in events aiming at the distribution of project results
(conferences, project demonstrations).
However, in order to achieve full Open Access, not only the Joint Undertakings but all
beneficiaries should be aware and convinced of the benefits of an open access policy and take
initiatives in order to make project results available to a wider public. Several Joint
Undertakings therefore actively seek to promote the Open Access philosophy to their
beneficiaries by regularly informing beneficiaries on open access and the common support
services provided or by giving support and advice to beneficiaries on their dissemination
activities through for example validating their project dissemination products.
A step beyond the Open access to project results including publications and Intellectual
Property Rights (IPRs), is the Open Access to Data. During the reference period, the open
access to research data was not yet an obligation and was done on a voluntary basis by the
project beneficiaries. In general Joint Undertakings try to inform and raise the awareness of
their beneficiaries on the issue and on the existing common support services and existing IT
tools provided to facilitate this access to produced data sets. However, few beneficiaries so far
seem to be convinced to take the step towards open access to data, and some beneficiaries
face difficulties in sustaining important resources (including data) generated by the project
and of the added value for the broader community. IMI2 JU plans to launch a special call for
proposals at the end of July 2017 in order to ensure optimal exploitation of the key results
from IMI JU projects that have finished or are near to finish. This call will also aim at
facilitating access to and sustainability of key data sets, biological samples, cohorts, tools and
models produced during the implementation of the projects.
All the cPPPs are fully integrated in the Horizon 2020 dissemination platforms. Moreover, the
associations organise public events, forums, publications and announcements to further the
added value and impact of individual projects. Open access to data has been introduced in the
cPPPs: all new projects are by default in the programme, unless they opt-out with a
justification.

300
J.4. Effectiveness
Due to the late adoption of the Council Regulations establishing the Joint Undertakings only
few calls were launched in 2014. 2015 was the first year of actual implementation of the JU
calls launched under Horizon 2020. More specifically, as of February 2017, 35 JU calls were
launched and concluded. A total of 1677 eligible proposals involving 11719 applicants were
submitted in response to these calls. Following evaluation and selection, 473 proposals (28%)
were retained for funding with a total EU financial contribution amounting EUR 2.162,1
million. 351 grants totalling EUR 1.384,8 million of EU funding were already signed.
Among the successful applicants, 15,4% were HES, 59,8% PRC and 18,7% REC. SME
participation in selected proposals is 19,5 %.
The assessments on the progress made towards meeting the objectives (section 4.2) and the
leverage effects (section 4.3), are based on partial data coming from a limited number of
ongoing projects and/or on estimates based on forecasted project outputs.
J.4.1. Progress made towards meeting the objectives
All Joint Undertakings have included in their legal base a set of JU-specific objectives which
they have to meet by the end of the programme period in addition to a set of common Horizon
2020 objectives. The progress towards achieving these objectives is measured by a set of Key
Performance Indicators (KPIs) common to all Joint Undertakings342
and a set of JU-specific
KPIs343
. These sets of KPIs are regularly monitored and reported on in the Annual Activity
Reports of the Joint Undertakings.
Overall, on the basis of early and partial data available and on the basis of expected results of
the already funded projects (no project reports are yet available), the Joint Undertakings are
on track in terms of carrying out their planned activities, achieving their specific objectives
and ultimately contributing to the overall Horizon 2020 objectives.
The table below gives an overview of the JU-specific KPIs per JU with a qualitative
indication of their progress made so far based on the limited quantitative data available. A
detailed quantitative overview of the KPI's can be found in the annex.
342 Based on Annex II (PERFORMANCE INDICATORS) to Council Decision 2013/743/EU). 343 With the exception of SESAR JU that is not subjected to a predefined set of KPIs.

301
Table 58 Overview of the JU specific KPIs
Objective Key Performance Indicator Qualitative
assessment
IMI2
IMI2’s new calls for proposals
support the implementation of the
research priorities as set out in the
Strategic Research Agenda and
updated by the Governing Board
IMI2 KPI 1: Target number of priority areas defined in
IMI2 JU’s Annual Scientific
Priorities for year n that are addressed by IMI’s calls for
proposals launched in year n
IMI projects effectively deliver and
disseminate high quality outputs344
KPI 3: Target estimated average number of IMI
publications3 per EUR10 million of total IMI funding
requested by the projects
KPI 4: Target to measure extent to which IMI’s average
impact factor of journals in which IMI publications have
been published is higher than the EU average
KPI 5: Target to measure extent to which the citation
impact of IMI publications is higher than the EU average
KPI 6: Target to measure the extent to which IMIs
bibliometric indicators compare with those of other
international funding bodies.
KPI 6.1: Target to compare the citation impact of
IMI publications with the one of other international
funding bodies
KPI 6.2: Target to compare the percentage of highly
cited papers of IMI programme with the one of other
international funding bodies
IMI projects translate key scientific
discoveries into clinical practice and
regulatory framework
KPI 7: Target to measure the number of scientific advice
and qualified opinions initiated by the IMI projects at the
EMA and FDA
IMI projects increase EU
competitiveness and foster
innovation
KPI 10: Target to measure, on average, the number of
patent applications filed and/or awarded to those IMI
projects which have been reimbursed at least for the third
year of implementation
KPI 12: Target to measure the number of spin-off
companies or foundations created as a result of IMI
projects
BBI
Private funding balancing public
funding in all types of projects
KPI 1: in cash contribution committed345
346
Appropriate balance between
research, innovation and
deployment
KPI 2: Balance (%) of R&D, demonstration and
supporting projects
New cross-sector interconnections in
biobased economy
KPI 3: Number of cross-sector-interconnections in BBI
projects
New bio-based value chains KPI 4: New bio-based value chains realised
344 The listed KPIs belong to IMI2. However the underlying figures currently provided in AAR2015 and soon 2016, relate to
the outcomes of IMI JU projects (as outputs from IMI2 projects are still very limited). 345 The term "in cash contribution" refers to the financial contribution mentioned in Article 12(3)(b) corroborated with Article
12(4) of the BBI JU Statutes annexed to the BBI Regulation. 346 The seemingly little progress with regard to the in cash contribution is related to the matter of legal interpretation of the
Council Regulation establishing the BBI JU. The search for a solution is currently ongoing including a possible amendment
of the Council Regulation.

302
Objective Key Performance Indicator Qualitative
assessment
New building blocks based on
biomass of European origin
KPI 5: Number of new bio-based building blocks
New bio-based materials KPI 6:Number of new bio-based materials
New "consumer" products based on
bio-based chemicals and materials
KPI 7: Number of new bio-based consumer products
Flagship bio refinery projects KPI 8:Number of flagship biorefinery plants started
based on BBI demonstration projects
Shift2Rail
No data available yet347
CS2
Reducing at the global fleet level,
CO2 emission by 26%, NOx by 60%
and noise area by 50% to 75%.
Reduction of CO2
Reduction of NOx
Reduction of Noise area
FCH2
KPI 1: Share of the fund allocated to the following
research activities:
- renewable energy
- end-user energy efficiency
- smart grids
- storage
KPI 2: Demonstrator projects hosted in MSs and regions
benefiting from European Structural and Investment
Funds
ECSEL
Programme Magnitude KPI 1: RD&I effort in EUR (eligible costs)
Funding Magnitude KPI 2: Public contributions assigned to ECSEL projects
Extending the Community with
regards to country participation
KPI 5: Number of additional countries on top of the
supporting countries
SESAR348
Cost Efficiency Gate-to-Gate direct ANS cost per flight
Operational efficiency Fuel burn per flight
Flight time per flight
Capacity Departure delay
Additional flights at congested airports
Network throughout additional flights
Environment CO2 Emissions
Safety Accidents with ATM contribution
: Little progress; : On track; : Exceeding targets
Source: based on data provided by thematic units responsible for the seven Joint Undertakings
347 S2R is new and autonomous only as from May 2016, hence the lack of data on the KPIs. 348Please note that the KPIs listed in the table are not the KPIs included in the legal base of SESAR. The main performance
criterion for the SESAR JU is how effective it has been in defining, producing and deploying in a coordinated way new
innovative and harmonised ATM solutions that will improve the performance of European ATM system. This can only be
measured once the solutions have been deployed and are operating (towards 2015). In the context of the objectives of the
European ATM Master plan, SESAR developed a set of KPIs, as listed in the table, which measure the contribution of all
SESAR solutions developed and validated by SESAR until 2015 compared to a baseline "no-SESAR" year (2005).

303
The contractual arrangements with the cPPPs build on industrial roadmaps with ambitious
goals and KPIs related to technological achievements as well as market needs or e.g. in the
manufacturing and processing industries the impact on energy or water consumption, or waste
reduction. On track to achieve their objectives, the projects typically address industrially
relevant demonstrators and pilots to validate technology developments and integration at
higher technology readiness levels. Among the industrial commitments established for the
cPPPs, they have to report on the development of new types of high-skilled jobs and of new
curricula. The projects within the NMBP cPPPs have reported a wide range of results
regarding new types of new high-skilled jobs, the highest average being in FoF (Factories of
the Future), with 3.5 new jobs profiles per project. EeB (Energy-efficient Buildings) projects
currently report 0.8 jobs per project, with 1.6 in FP7. Positive impacts on job creation and
skills have also resulted from EGVI. EGVI also contributed to save time in performing
research activities while structuring the whole value chain and avoiding duplication of efforts.
Several similar initiatives have been implemented at national level, testifying to the benefit of
this specific funding scheme.
J.4.2. European added value and leverage effects
The significance of the EU cooperation with industry in the context of a public-partnership in
strategic areas is recognised in all seven Joint Undertakings operating under Horizon 2020.
The Joint Undertakings are concrete examples of the European Union's efforts towards
strengthening its competitiveness through scientific excellence, industry led research,
openness and innovation. As an illustration of the significance of the Joint Undertakings it is
worth mentioning the White Paper on the "21st Century Cures initiative"349
, issued in January
2015 by the US House of Representatives. Launched by the House’s Energy and Commerce
Committee, it studied what steps can be taken to accelerate the discovery, development and
delivery of cures. It recognises that what is missing in the USA is a public-private partnership
that would bring together the various stakeholders and would need to be “modelled after the
Innovative Medicines Initiative”.
A tangible metric for assessing the EU added value is the "leverage effect", defined as the
total amount of funds leveraged through an Art. 187 initiative, including additional activities,
divided by the respective EU contribution to this initiative. The Table below summarizes the
leverage effect for the Joint Undertakings operating under FP7 and Horizon 2020.
For the Joint Undertakings operating under FP7 the target for the leverage effect was to
achieve parity, i.e. that the contributions from the private side matched the ones of the EU. As
the table shows, this target has been largely achieved. In the case of the FCH in particular, the
target was slightly exceeded which can be considered as a success in a nascent sector.
For the data referring to Horizon 2020 the following clarifications should be noted:
The Council Regulation establishing each JU sets out the total minimum contributions
which members other than the EU (including members' constituent entities and
349https://energycommerce.house.gov/sites/republicans.energycommerce.house.gov/files/files/114/FINAL%20Cures%20Disc
ussion%20Document%20White%20Paper.pdf .

304
affiliated entities and Associated Partners and their constituent entities and affiliated
entities) have to provide to the JU throughout its lifespan350
.
The Council Regulations make a distinction between the required level of financial
contribution (aiming to cover mainly the administrative costs of the JU) and the
minimum amount of in-kind contribution. The in-kind contribution (IK) is calculated
on the basis of costs incurred by members other than the EU in implementing
additional activities and, also, in implementing indirect actions. Declared costs in
implementing additional activities not included in the workplan but contributing to the
objectives of the Joint Undertakings, can be considered as IKAA. The costs incurred
in implementing indirect actions can be considered as IK after deduction of the
contribution of the JU and any other Union contribution to those costs. They constitute
IK to the operational costs of the JU (IKOP).
Theoretically, only certified "in-kind contributions" should be taken into account in
the calculation of the leverage, as requested by the Council regulation. As a
consequence, while the figures provided for the whole period of Horizon 2020 are the
legally foreseen ones, the figures provided for the calls launched so far take into
account the "committed" IKOP as only few amounts of IKOP are certified so far.
In order to have a common approach for the 7 Joint Undertakings for the calculation of
the leverage effect achieved so far and taking into account the above points, the
following formula was applied:
Total leverage = Operational leverage + Additional leverage
Where:
∑ [IKOP of private partners in signed GA (+Private FC)] Operational leverage = --------------------------------------------------------------------------
∑ [EU contribution committed in the signed GA]
And for CS2, S2R, FCH and BBI:
∑ [IKAA of members ] Additional leverage = -------------------------------------------------------------------------
∑ [EU contribution committed in the signed GA]
Definitions:
GA = Grant Agreement of an indirect action receiving an EC contribution
IKOP = In-kind contributions for operational costs in an indirect action (see above).
Private FC = Private Financial Contribution (when allowed in the Regulation).
IKAA = Certified In-kind contributions of members for Additional activities.
The first calculations, based on the above formula and using the figures (committed amounts)
reported in the Annual Activity Reports 2016 of the Joint Undertakings351
, demonstrate that
the Joint Undertakings are well on track in achieving and, in some cases, exceeding the
350 In the case of SESAR JU, the Council Regulation ((EU) No 721/2014 of 16 June 2014) does not set out the total minimum
contributions which members other than the EU have to provide to the JU. 351 Except for FCH, CORDA data (for calls 2014-2016) were used.

305
legally minimum foreseen leverage effect. As the number of signed grant agreements
increases, a more detailed reporting on the leverage effect will be possible. It has to be
stressed, however, that the overall leverage effect can only be assessed at the end of the
programme.
A more in-depth evaluation of Joint Undertakings will be available October 2017.
The added value of cPPPs at the EU level derives from trans-national cooperation, supporting
bridging the valley of death and, most significantly, creating a critical mass of excellence that
can compete globally. Considering the large investments needed, Europe needs to build on
complementary strengths. Intervention at EU level allows getting the major stakeholders and
industrial players along the whole R&I value chain into the process of actively defining the
roadmap and commit to the implementation. In this sense, there is significant added value of
implementing Horizon 2020 funding through the use of contractual cPPPs.
In the case of the cPPPs under the NMBP thematic area, the leverage factors range between
1.5 and 3.5, on the basis of a methodology accounting only for current investments and
discounting future investments. In EGVI projects, on the basis of 2014 estimates, the
additional private investments are expected to lead to a leverage factor of 3. In the Photonics
PPP, the industrial investment has been estimated as being 4.3. This is based on information
received from 80 companies for their investment in 2014-2015. For the other cPPPs, given
their recent start, it is too early to give figures based on project results. However, there are no
indications that the leverage factor are deviating from the commitment laid out in the
contractual arrangements. As with the Joint Undertakings, the overall leverage effect of each
cPPP can only be assessed beyond the end of the programme.

306
Table 59 Leverage effects by Joint Undertakings under FP7 and Horizon 2020
Data on leverage effect for the Joint Undertakings under FP7 and Horizon 2020
Ho
rizo
n 2
02
0
(ov
er t
he
wh
ole
per
iod
201
4-2
02
0, a
cco
rdin
g
to t
he
leg
al
act
) FCH2 CS2 IMI2 BBI ECSEL S2R SESAR
Minimum in-kind contribution
(in EUR million)
285 2 193.75 1 425 1 755 none 457 783.75352
Total minimum contribution
from members other than the
EU Art.4(1) (in EUR million)
380 2 193.75 1 425 2 730 1 170.0353
1 657.5
(Art.4(2))
470 (of which
financial: 13)
825 (of which
financial: 41.25)
Maximum EU contribution
Art. 3(1) (in EUR million)
665 1 755 1 425354
975 1 184.874 450 585
Target Leverage effect
(Targeted partial leverage in
the Council Regulation (only
considering the contributions
of Members other than the EU
and not those of other project
0.67 1.25 1 2.8 2.4355
1,4356
1.04357
2
Ho
rizo
n
20
20
–
Est
ima
ted
Lev
era
ge
effe
ct
for
the
call
s
con
clu
ded
EU contribution (in EUR
million) (as committed,
source: AAR 2016)
285,99 214,01 275,8 414,1 463,4 88 235,8
IKOP (H2020 project costs –
EU funding; in EUR million)
279,28 131,58 263,5 180,39 1030 79,4 241,4
352 This is the amount to which the members committed in the Membership Agreement signed in the context of Horizon 2020. 353 The ECSEL Participating States shall make a financial contribution to the operational costs of the ECSEL Joint Undertaking that is commensurate with the Union’s financial
contribution of at least EUR 1 170 000 000. 354 An additional amount of EUR 213 million will be contributed by the EU in order to match additional contributions from other Members, Associated Partners, or from their
constituent entities or their affiliated entities, if there are any. 355 COUNCIL REGULATION No 561/2014 (21) - In assessing the overall impact of ECSEL, investments from all legal entities other than the Union and the states participating in
ECSEL are expected to amount to at least EUR 2 340 000 000 – this results in a leverage effect of 3. 356 Targeted leverage on EU funding only (excluding other public funding, i.e. national funding). 357 It is important to note that this figure is based on the ratio between the entire EU contribution to the S2R JU and the contribution of the JU private members. However, only a
maximum of 70% of the EU contribution is to be targeted to the JU private members in accordance with the S2R Regulation. This means that in practice, the effective leverage
effect of the EU budget spent with the JU members reaches 1.49.

307
(source: AAR 2016)
IKAA certified (in EUR
million) 186,42 199,16 / 294,8 / / /
Leverage effect (based on
committed amounts as
reported in AARs 2016)
1,63 1,55 0,96 1,15 2,17 (on EU
funding
only)
0,90 1,02
FP
7
Contribution from members
other than the EU (in EUR
million)
488.9 550.9 954.4358
Not
applicable
Not
applicable
Not applicable 1 300 (from FP7
and TEN-T)
EU contribution (in EUR
million)
450 550.9 965.7 700
Leverage effect 1.09 (target was
slightly
exceeded)
1 (as
foreseen in
FP7)
0.99 1.85 (for
SESAR 1)
Source: Data provided by the Thematic Units responsible for the seven Joint Undertakings
358 Commitments

308
J.5. Overview Joint Undertakings Key Performance Indicators
J.5.1. BBI
Little information is available on the concrete outcome of the on-going projects in terms of
achieving the specific BBI JU KPIs as the majority of the data will be provided by BBI JU
beneficiaries through project reporting later on.
Table 60: Key Performance Indicators for BBI
Key
Performance
Indicator
Objective Target at the
End of Horizon
2020
Outcome
(available info
calls 2014 and
20151.2 and
AWP 2016)
AAR2015
Estimated
contributio
n of 10
projects
call 2014
AWP201
5
Contrib
ution to
2020
targets
AWP20
16
Contrib
ution to
2020
targets
PPP leverage:
- in cash
contribution
committed
Private
funding
balancing
public funding
in in all types
of projects
At least EUR
182.5 million
financial
contribution to
the operational
costs
EUR 0.75 million
in cash at
programme level in
2016. EUR 2.94
million in projects
of the 2014 and
2015.2 calls
- - -
Balance (%) of
R&D,
demonstration
and supporting
projects
Reach an
appropriate
balance
between
research,
innovation and
deployment
On programme
level reach a
distribution of
30%, 30%,
34,75%, 3,25%
for RIAs, IA-
Demo, IA-
Flagship, CSAs
The distribution so
far, considering the
projects of the
2014 and 2015
calls and the topics
of the 2016 call, is:
24,2%, 35,8%,
36,5%, 1,5%.
- - -
N° of new cross-
sector
interconnections
in BBI projects
New cross-sector
interconnections
in bio-based
economy
36 by 2020 21-22 > 8 2-3 11
New bio-based
value chains
realised
New bio-based
value chains
10 by 2020 21 10 3 8
Number of new
bio-based
building blocks
New building
blocks based
on biomass of
European
origin
5 by 2020
further
increasing to 10
in 2030
17-18 6-7 3 8
Number of new
bio-based materials
New bio-based
materials
50 by 2020 29-30 5-6 8 16
Number of new
bio-based
'consumer'
products
New 'consumer'
products based
on bio-based
chemicals and
materials
30 by 2020 14 4 7 3
Number of flagship
biorefinery plants
started based on
BBI demonstration
projects
Flagship
biorefinery
projects
5 by 2020 7 1 3-5 3
Source: AAR BBI 2015, AWP BBI 2015 and 2016

309
J.5.2. Shift2Rail
The S2R JU was formally established in July 2014 and its first projects started summer
2016. Hence, we cannot report on progress towards meeting the KPIs at this moment.
J.5.3. IMI2
Figures on the IMI2 KPIs refer to the outcomes of IMI projects. Based on these outcomes,
IMI is on track in achieving its objectives.
Table 61 Key Performance Indicators for IMI2
Key Performance Indicator Objective Qualitative assessment
IMI2 KPI 1: Target number of
priority areas defined in IMI2 JU’s
Annual Scientific
Priorities for year n that are
addressed by IMI’s calls for proposals
launched in year n
IMI2’s new calls for
proposals support the
implementation of the
research priorities as set out
in the Strategic Research
Agenda and updated by the
Governing Board
all scientific priorities identified in
the Annual Work Plans are covered
KPI 3: Target estimated average
number of IMI publications 3 per
EUR10 million of total IMI funding
requested by the projects
IMI projects effectively
deliver and disseminate high
quality outputs359
62 publications per €10 Million of
EU contribution reported and
accepted
KPI 4: Target to measure extent to
which IMI’s average impact factor of
journals in which IMI publications
have been published is higher than the
EU average
large share of the publications is
made of highly cited articles,
KPI 5: Target to measure extent to
which the citation impact of IMI
publications is higher than the EU
average
the citation impact is significantly
above the EU and worldwide
average
KPI 6: Target to measure the extent to
which IMIs bibliometric indicators
compare with those of other
international funding bodies.
KPI 6.1: Target to compare the
citation impact of IMI
publications with the one of other
international funding bodies
KPI 6.2: Target to compare the
percentage of highly cited papers
of IMI programme with the one of
other international funding bodies
Above target
Above target
KPI 7: Target to measure the number
of scientific advice and qualified
opinions initiated by the IMI projects
IMI projects translate key
scientific discoveries into
clinical practice and
10 in 2014 and 8 in 2015 = 18
(above target)
359 The listed KPIs belong to IMI2. However the underlying figures currently provided in AAR2015 and soon in AAR
2016, relate to the outcomes of IMI JU projects, as outputs from IMI2 projects are still very limited.

310
Key Performance Indicator Objective Qualitative assessment
at the EMA and FDA regulatory framework
KPI 10: Target to measure, on
average, the number of patent
applications filed and/or awarded to
those IMI projects which have been
reimbursed at least for the third year
of implementation
IMI projects increase EU
competitiveness and foster
innovation
21 patent applications have been
filed until 31 December 2015,
mostly by public participants in IMI
consortia, such as academia, SMEs,
and research organizations
KPI 12: Target to measure the
number of spin-off companies or
foundations created as a result of IMI
projects
33% of finalized projects had
created spin-off companies or
foundations as a result of IMI JU
projects
Source: AAR IMI2 - 2015
J.5.4. CS2
In order to assess the environmental impact of the Clean Sky technologies once integrated
into a conceptual aircraft, a Technology Evaluator body is set up. Figures in this table refer
to the outcomes of CS as evaluated by the Technology Evaluator (TE). The Horizon 2020
Clean Sky 2 programme also contains a technology evaluator. However, no projects have
yet been finalised.
Table 62 Key Performance Indicators for Clean Sky 2
Clean Sky
objectives at
global feet
level
CO2 Δ -26%
NOx Δ -60%
Noise Δ -50% to -75%
Assessment Metric Mainliners and Regional fleet Business fleet Rotorcraft fleet
Results
from the TE
airport level
assessment
CO2 Δ -30% to -40% Not available -10% to -20%
NOx Δ -35% to -45% Not available -30% to -64%
Noise area Δ -45% to -70% Not available Up to -75%
Results from
the TE global
fleet level
assessment
CO2 Δ -32% 20% -15%
NOx Δ -41% 28%
Vehicle Metric Long
range
Short
Medium
range
Regional Business
aircraft
Rotorcraft
Results
from the TE
mission
level
assessment
CO2 Δ -19% -41% Up to -27% Up to -32% Up to -58%
NOx Δ -39% -42% Up to -46% Up to -32% Up to -64%
Noise area Δ -67% -68% Up to -86% Up to -50% over -50%
Noise Δ -5.7
dB
-5.1 dB Up to -15.7
dB
-5.5 dB Not available
Source: Technology Evaluator (TE) results, 2015
J.5.5. FCH
Regulation 559/2014 lists 5 specific objectives for the FCH 2 JU, all of which have been
addressed during the first 3 calls under Horizon 2020:
Table 63: 5 Specific Objectives of FCH

311
Specific objective Share of the funds from calls 2014-16
allocated to the following research activities
Reduction of the production costs of FC for transport
applications, while increasing their lifespan
51,73%
Increase the efficiency and durability of FC for power
production while reducing cost
25,59%
Increase the energy efficiency of H2 production from
water electrolysis and renewable sources
7,30%
H2 as storage medium for electricity from renewable
energy sources
13,55%
Reduction of critical raw materials 0,17%
Cross-support actions (awareness, education, regulatory
issues etc)
1,65%
Source: FCH Calls information 2014-2016
As regards the specific KPI's for FCH, the amount of data available from Horizon 2020 is
currently limited to the projects resulting from the Call 2014 which have now started work:
Table 64: FCH' specific Key Performance Indicators
Specific KPI's Reference (FP7 estimated
average distribution)
Share of the funds from calls 2014-
16 allocated to the following
research activities
Renewable energy: 10% 8%
End user energy-efficiency: 37% 30%
Smart grids: 1% 11%
Storage: 3% 1%
Specific KPI Qualitative assessment
KPI 2: Demonstrator
projects hosted in MSs and
regions benefiting from
European Structural and
Investment Funds
The FCH 2 JU is making good progress towards the KPI of having
demonstrator projects hosted in MS and regions benefiting from European
Structural and Investment Funds: the project HyBalance is benefiting from
Danish co-funding, and the project JIVE on fuel cell bus deployment
(currently under GA negotiation) will use 5 additional funding schemes in
parallel with that of the FCH 2 JU.
Source: Estimated data based on call information for calls 2014-2016
J.5.6. ECSEL
Results on the KPIs are based on projects resulting from the 2014-15 calls (25 projects)
Table 65 ECSEL specific key performance indicators
Objective Specific KPI % of 2020
target reached
Programme Magnitude KPI 1: RD&I Effort in € (eligible costs) 28%
Funding Magnitude KPI 2: Public Contributions Assigned to ECSEL
Projects
23%

312
Extending the Community with
regards to country participation
KPI 5: Number of additional countries on top of
the supporting countries
87%
Source: ECSEL Project data (25 projects) selected in 2014-2015 calls
It is too early to comment on the outcome of ECSEL. As a proxy, outputs cumulated under
the preceding Joint Undertakings, ARTEMIS and ENIAC, give a good indication as to what
can be expected. The 76 ARTEMIS or ENIAC projects that came to completion by the end
of 2015 generated 237 patents, 20 trade secrets, 13 trademarks, 1382 exploitable foreground
intellectual property items and 3841 scientific publications.
J.5.7. SESAR
The KPIs listed in the table are not the KPIs included in the legal basis of SESAR. The main
performance criterion for the SESAR JU is how effective it has been in defining, producing
and deploying in a coordinated way new innovative and harmonised ATM solutions that will
improve the performance of European ATM system. This can only be measured once the
solutions have been deployed and are operating (towards 2015). In the context of the
objectives of the European ATM Master plan, SESAR developed a set of KPIs, as listed in
the table, which measure the contribution of all SESAR solutions developed and validated
by SESAR until 2015 compared to a baseline "no-SESAR" year (2005).
Table 66 SESAR key performance indicators in the context of the objectives of the
ATM Master Plan
REF Key
Performance
Area in
SESAR2020 (A)
Key Performance
Indicator in
SESAR2020(B)
2014
Performance v
2005 Baseline
(C)
2015
Performance v
2005 Baseline
(D)
Performance
2015 v 2014
43 Cost efficiency:
ANS productivity
Gate-to-gate direct
ANS cost per flight
-3.56% -3.82%
44 Operational
efficiency
Fuel Burn per flight -1.45% -2.26%
Flight time per flight -1.26% -1.48%
45 Capacity Departure delay -16.5% -19.1% n/a
Additional flights at
congested airports
12.10% 11.02%
Network throughput
additional flights
24.22% 33.41%
46 Environment CO2 emissions -1.45% -2.26%
47 Safety Accidents with ATM
contribution
-40% -40% n/a
Source: SESAR AAR, 2015
K. FURTHER INFORMATION ON THE EUROPEAN INSTITUTE OF INNOVATION AND
TECHNOLOGY (EIT)
K.1. Overview
The European Institute of Innovation and Technology’s (EIT) overall mission is to
contribute to sustainable European economic growth and competitiveness by reinforcing the

313
innovation capacity of the Member States and the Union. As part of Horizon 2020, the EIT’s
specific objective is to integrate the knowledge triangle of higher education, research and
innovation and thus to reinforce the Union's innovation capacity and address societal
challenges. The EIT is designed to achieve these goals primarily through its Knowledge and
Innovation Communities (KICs), which operate in specific societal challenges. In the period
covered by the Horizon 2020 interim evaluation, KICs operated in the fields of climate
change, health, energy, raw materials and the digital field.
K.2. Rationale
The long-term strategy of the EIT has been set up in the Strategic Innovation Agenda (SIA)
2014-2020, adopted by the European Parliament and the Council, on the basis of a
Commission proposal. The SIA is a policy document outlining the priority fields of the EIT
for future, including an overview of the planned activities for a period of seven years, in
particular the priority fields for the EIT Knowledge and Innovation Communities (KICs) and
their selection and designation.
The Horizon 2020 Regulation identified specific structural weaknesses in the EU’s
innovation capacity on which the EIT would focus its contributions. The EU has not been
using a sufficient globally competitive scale of resources, including human resources, in
poles of excellence, and has had, more widely, a relatively poor record in talent attraction
and retention. The levels of entrepreneurial activity and mind-set across the EU have been
low, which contributed to the under-utilisation of existing research strengths for creating
economic or social value and the lack of research results brought to the market. Finally, there
has been an excessive number of barriers to collaboration within the knowledge triangle of
higher education, research and innovation on a European level, which contributed to low
leverage of private investment in research and development.
K.3. Implementation
The EIT seeks to achieve its mission through a distributed network of thematically focussed
Knowledge and Innovation Communities (KICs), which bring together higher education
institutions, research organisations, industry and other stakeholders to create critical mass
needed to stimulate innovation.
The KICs are thematically aligned with the Horizon 2020 societal challenges. There are
currently five KICs, as presented in the table below.
Table 67 Knowledge and Innovation Communities of the European Institute of
Innovation and Technology
Wave 1 KICs – established in 2010 Wave 2 KICs – established in 2015
1 Climate-KIC: addressing climate change mitigation
and adaptation
2 EIT Digital: addressing Information and
Communication Technologies
3 KIC InnoEnergy: addressing sustainable energy
4 EIT Health: addressing healthy living and active
ageing; and
5 EIT Raw Materials: addressing sustainable
exploration, extraction, processing, recycling and
substitution
Another KIC has been recently been set-up (EIT Food in the field of sustainable supply
chain i.e. from resources to consumers) and one is in the pipeline in 2018 (EIT Urban
Mobility in improved mobility solutions), pending a positive outcome from the EIT review

314
exercise. The call on a KIC on added-value manufacturing (launched in 2016) did not award
any proposals.
The KICs are independent legal entities, structured around a partnership of core partners
representing all sides of the “knowledge triangle”. Each KIC also includes a large number of
affiliated, associated or network partners that contribute to the KIC’s activities, but do not
participate directly in its governance. KICs apply an ‘open’ entry and exit approach with
regard to the affiliated partners and so the wider KIC community is a ‘living’ network with
evolving membership.
Each KIC is also organised around a small number of co-location centres (CLCs) which are
intended to act as geographical hubs for the practical integration of the knowledge triangle.
The CLCs have substantial autonomy and as such, are organised and structured according to
their respective national and regional innovation context to include partners from research,
education, business and at times, from local authorities. The CLCs build on the existing labs,
offices or campuses of some of a KICs’ core partners. They bring together, at a local or
regional level, the education, research and industry partnerships of the KIC, thus permitting
face-to-face contact and geographical proximity.
Each KIC (in conjunction with its CLCs) has to develop and deliver a portfolio of activities
in three areas:
Research/ Innovation projects: the KICs link universities/ research institutes and
business through their innovation project portfolios. Innovation projects comprise
demonstrators, pilots, proofs of concept etc. All innovation projects are required to
develop clearly identified products that address a specific business opportunity that is
supported by a market study.
Education: a set of post-graduate (MSc/ PhD) programmes and executive/
professional development courses characterised by a multidisciplinary approach,
significant business involvement in the development of learning outcomes and often,
trans-national mobility.
Business Creation and support activities: a range of business support services, often
badged as a start-up accelerator scheme, to help entrepreneurs translate their ideas
into successful businesses. These services focus on areas such as support for
technology, market assessment, access to human resources and, last but not least,
seed and venture capital through specific KIC innovation funds.
Additionally, the KICs/ CLCs engage in a range of outreach, communication and
dissemination activities such as organisation of events, publication of material (e.g. success
stories, newsletters etc.), networking etc.
More recently, the EIT has developed the EIT Regional Innovation Scheme (EIT RIS) which
is a structured outreach scheme to support the integration of the Knowledge Triangle and
increase the innovation capacity in areas and regions in Europe not directly benefitting from
the KICs and their CLCs.
The Performance Measurement System (PMS) is a comprehensive system for continuous
monitoring used by the EIT to keep track of the results achieved at all governance levels.
This system encompasses all related EIT activities ranging from annual Key Performance
Indicators (KPIs) data collection, continuous monitoring, the contribution of EIT to Horizon

315
2020, its methodologies to assess impact and the EIT's monitoring of its own operational
performance in terms of effectiveness, efficiency and impact. In particular, the performance
measurement is carried out at the following four levels:
KIC level: monitoring of a KIC on the basis of its individual targets and Key
Performance Indicators (KPIs) stipulated in a KIC business plan. These KIC-specific
indicators are defined by the KICs based on their internal strategies and organisation
as well as to define their activities and mobilise the resources needed.
Cross-KIC level: The EIT monitoring of all KICs, which will focus on a series of
EIT’s strategic objectives, as identified in the EIT Scoreboard, covering a common
set of indicators across all KICs. The indicators cover the attractiveness of education
programmes, number of new graduates, number of business ideas incubated, number
of start-ups created, knowledge transfer and adoption, and new or improved products,
services and process launched.
EIT level: The monitoring of the EIT’s own activities that add value to the KICs and
their stakeholders, combining quantitative and qualitative indicators in a medium-
term perspective. It monitors on the one hand operational excellence and on the other
its positioning, using indicators, inter alia, due dates for Grant Agreement
completion, reporting acceptance and payment execution, percentage of processes
formalised, talent on the job and level of satisfaction on EIT services.
Horizon 2020: Monitoring and evaluation of the EIT as an EU innovation institute
under Horizon 2020. The indicators for assessing the performance of the EIT are:
organisations from universities, business and research integrated in the KICs; and
collaboration inside the Knowledge Triangle leading to the development of
innovative products, services and processes.
K.4. Achievements so far
The independent external evaluation of the EIT360
has found that, even though the EIT has
contributed to progress in the areas mentioned above, strong need still exists to pursue the
EIT’s mission361
. In the open public consultation in the context of the evaluation, almost
90% of respondents said that Europe’s innovation capacity depended on bringing together
education, research, business and other innovation actors (knowledge triangle integration).
Further, over 80% of stakeholders think that EIT’s focus on specific societal challenges in
the Horizon 2020 context is important. Overall, stakeholders have recognised the EIT’s
progress in bringing together education, research and business organisation to create pan-
European networks in specific fields.
Two main indicators are indicated in the Horizon 2020 Regulation for assessing the
performance of the EIT. In the following tables target and achieved results are reported (all
the figures are cumulative).
360 The independent external evaluation of the EIT is a mandatory requirement from the Regulation (EC) No 294/2008 as
amended by the Regulation (EU) No 1292/2013 establishing the European Institute of Innovation and Technology (EIT
Regulation). 361 ICF, Technopolis Group, Evaluation of the European Institute of Innovation and Technology (EIT), forthcoming

316
Table 68 Organisations from universities, business and research integrated in the
Knowledge and Innovation Communities (KICs)
2014 2015 2016
Indicator 1: Organisations from universities,
business and research integrated in the
Knowledge and Innovation Communities (KICs)
Target 240 450 500
Actual results 550 800 1015*
* Expected results, based on the indications in the KICs´ business plans. Source: EIT
Figure 81 Breakdown of the organisations participating in the KICs (2015)
Source: EIT
It is worth noticing that around 43% of the participants are business (either big companies or
SMEs); SMEs represent around 20% of the total participants.
Table 69 Collaboration inside the knowledge triangle leading to the development of
innovative products, services and processes
Indicator 2: Collaboration inside the knowledge
triangle leading to the development of innovative
products, services and processes
2014 2015 2016
Number of start-ups and
spin-offs set-up
Target 30 280 400
Actual results 181 250 381*
Number of innovations Target 300 800 1500
Actual results 1184 2145 3565*
* Expected results, based on the indications in the KICs´ business plans. Source: EIT
As it is possible to infer from the two tables, results achieved with respect to Indicator n.1
are well beyond the target. Same reasoning applies to the "Innovations" sub-indicator within
Indicator n.2. The number of start-ups and spin-offs set-up by the KICs is slightly behind the
target, even though KICs keep on generating new ventures at a faster pace; results for 2016
are still to be confirmed.
The table below shows target and achieved values for the cross-KIC level indicators (core
KPIs) monitored by the EIT. The figures concern the outputs and results of the three first
wave KICs (which comprises EIT Digital, EIT Climate and KIC InnoEnergy), over the

317
period 2013-2015. As already mentioned, each KIC has also a set of KIC-specific KPIs that
– as the core KPIs- are annually tracked, reported and audited.
Table 70 Innovation KPI performance of the KICs (2013-2015) (unmet targets in bold)
# Code Indicators 2013-2015
Actual
2013-2015
Target
1 EIT01.01 Number of eligible applicants for EIT labelled PhD and Master
programmes
12,783 11,577
2 EIT01.02 Number of available seats for EIT labelled PhD and Master
programmes
3,168 1,864
3 EIT02 Number of new graduates 776 842
4 EIT03 Number of business ideas incubated 1,249 1,076
5 EIT04 Number of start-ups/spin-offs created 216 310
6 EIT05.01 Number of knowledge adoptions (by KIC partners) that are
direct output of a KIC Activity
429 326
7 EIT05.02 Number of knowledge transfers (from one KIC partner to
another KIC partner or to third parties) that are direct output of
a KIC Activity
308 260
8 EIT06 New or improved products/services/processes launched 212 290
Source: EIT
Those indicators reflect the portfolio of activities run by the KICs (education; business
creation and support activities; support to innovation).
The indicators concerning the attractiveness of Education Programmes (n.1 and 2) show that
the courses offered by the KICs attract an interest from students which is line what was
expected at Business Plan level. Nevertheless, the number of new graduates is a bit below
the target. Such indicator is expected to catch up in the coming years, thanks to the maturity
those activities are achieving within the KICs portfolios.
As regards the support to entrepreneurship (indicators n.3 and n.4), despite the number of
ideas incubated, the number of new ventures created is below the target. Business ideas are
screened by the KICs, only the most promising ones are then passed to the following support
stages (and encouraged to be transformed into new ventures); this aspect might partially
explain the gap between target and actual results. Furthermore, some ideas might need a
longer incubation period before being translated into a marketable proposal.
Finally, as regards the support to innovation, figures show that those activities are producing
outcomes beyond the initial expectations, as evidenced by the adoption and the transfer of
knowledge within the KICs and towards external partners. The only indicator that falls
behind is the one related to new products/services/processes launched; 73% of the target has
been achieved.
Overall, most of the objectives/actions defined in the 2013-2015 business plans have been
achieved.

318
In order to provide some qualitative information complementing the abovementioned
figures, some examples of achievements pursued in the different pillars of activities by the
KICs can be highlighted, in particular:
In 2017, Forbes has chosen 18 EIT Community members for their annual Forbes 30
under 30 list.362
The list features the best young innovators, entrepreneurs and game
changers from Europe. In 2016, five EIT KICs' alumni have been selected for the
Forbes' Magazine 30 under 30 list of Social Entrepreneurs. They were coming from
KIC InnoEnergy (1) and Climate-KIC (4);
A quarter of the 175 start-ups supported by KIC Digital raised private funding and
attracted over EUR 20 million of external funds.
KIC InnoEnergy has a portfolio of 68 companies in which the KIC retains an equity
share; those companies have benefited from KIC´s support, and in return, the KIC
received an equity share by each company supported. The portfolio is expected to
start to deliver income for the KIC (from the sale of the equity participation) from
2017 - the KIC´s equity portfolio management is a very notable pillar of its Financial
Sustainability Strategy;
Success stories (support to scale-ups) in terms of leveraged funds:
o Minesto, a Swedish scale-up working in marine hydrokinetic (wave) energy
and supported by KIC InnoEnergy, raised about EUR 18 million in 2015 in
its Initial Public Offering in the Stockholm stock market;
o Tado sells smart thermostats that regulate the heating in the household
according to the location data of inhabitants. Supported by Climate-KIC, the
company has so far raised EUR 32 million investments. It has successfully
launched its product internationally and is a competitor to Google‘s start-up
Nest.
Given this track record, the report of the High-Level Group on the EIT appointed by
Commissioner Navracsics363
argues that the EIT should strive to remain the leading
European performer of goal-driven innovation to address societal challenges through the
integration of education, business and research. Furthermore, the HLG group thinks that
EIT’s expertise and experience can play an important role in the future European innovation
landscape, in particular with respect to the need for the EU to create ‘unicorns’ and
breakthrough (disruptive) innovations. For this, the EIT can develop its own capacity for
comparative innovation analysis and for communicating lessons learnt in various contexts.
The following figures show the evolution of achieved KPI values per each of the KIC
launched in 2010, over the period 2013-2015 (it also includes the expected results for 2016).
362 http://eit.europa.eu/newsroom/eit-innovators-named-forbes-list-2017 363 The Future of the European Institute of Innovation and Technology (EIT) - Strategic Issues and Perspectives, 2016:
https://ec.europa.eu/education/sites/education/files/eit-hlg-final-report_en.pdf

319
Figure 82 KPIs for Climate KIC
Source: EIT
Figure 83 KPIs for EIT Digital
Source: EIT
Figure 84 KPIs for KIC Innoenergy
Source: EIT

320
From those graphs, it appears that, in general, all the KICs are improving their performance
with respect to the core indicators. It is also possible to infer which are the strongest and
weakest areas of activities of each KIC: for instance, KIC Digital is well positioned in all
areas, except for the creation of new ventures; on the other hand, KIC Innoenergy scores
well in terms of new graduates, but is weaker in terms of innovations being generated by its
activities.
EIT interim evaluation
Further evidence on the KICs´ results is provided by the results of the evaluation exercise
commissioned by DG EAC to external independent experts, in particular by the open
consultation (open to all stakeholders in the course of the last quarter of 2016) and the
survey carried out by the contractor hired by DG EAC to run an evaluation study364
.
Effectiveness
One of the aspects scrutinised through the evaluation exercise concerns the focus of the EIT
on both societal challenges and knowledge triangle integration. According to the survey,
70% of KICs´ partners believe that the KICs have been ‘effective’ or ‘very effective’ in
supporting knowledge transfer between businesses and universities/ research organisations.
Figure 85 Effectiveness of KICs in supporting knowledge transfer between businesses
and universities/ research organisations
Source: ICF survey (n=204). Question: Q How effectively do you think that the KIC is delivering activities in
the following areas:… Supporting knowledge transfer between businesses and universities / research
organisations
Furthermore, as part of the KIC partner survey, respondents were asked what impact they
believed ‘their’ KIC had had on addressing societal challenges (Figure 87). As the data
show, around two thirds of KIC partners believed the KIC had had either a ‘moderate’ or
‘large’ impact. The exception was in EIT Digital, where exactly 50% of respondents saw
either a ‘moderate’ or ‘large’ impact on societal challenges, and a similar proportion (47%)
364 ICF, Technopolis Group, Evaluation of the European Institute of Innovation and Technology (EIT), forthcoming

321
saw ‘no’ or ‘small’ impact. This could at least in part relate to the point made previously:
that EIT Digital’s role within societal challenges tends to be indirect – a piece of technology
that forms part of a wider solution.
Figure 86 The impact that KIC partners believed KICs has had on addressing societal
challenges
Base = all respondents (Climate-KIC: 128; EIT Digital: 34; KIC InnoEnergy: 52; EIT Health: 31; EIT Raw
Materials: 31) Question: Q25. What impacts has the KIC had, or you expect it will have, in the following
areas: addressing societal challenges?
Finally, survey participants were asked to rate the importance of a number of aspects
(characterising the KICs) for the EIT to achieve its mission of enhancing Europe’s
innovation capacity.
Table 71 How important are the following characteristics of the KICs in order for the
EIT to achieve its mission of enhancing Europe’s innovation capacity?
Not important
Moderately Important
Very important
No opinion
No response
Involved with KIC/EIT 6% 35% 49% 10%
Not Involved with KIC/EIT 15% 35% 37% 2% 12%
Base (all respondents) = Involved with KIC/EIT (51); not Involved with KIC/EIT (52)
Those findings are strengthened by the HLG report: the HLG advised maintaining this
double focus and developing the EIT as the leading European performer in goal-driven
innovation to address societal challenges.
As regards the specific aspects of KICs activities, it is interesting to notice the results of the
graduate survey on skills developed with EIT-labelled courses, as well as of the accelerator
survey on the participation in a KIC accelerator programme.
5%
6%
2%
13%
6%
23%
41%
38%
16%
26%
38%
32%
46%
35%
39%
30%
18%
8%
32%
26%
4%
3%
6%
3%
3%
0% 10% 20% 30% 40% 50% 60% 70% 80% 90% 100%
Climate-KIC
EIT Digital
KIC InnoEnergy
EIT Health
EIT Raw Materials
No impact Small impact Moderate impact Large impact No response
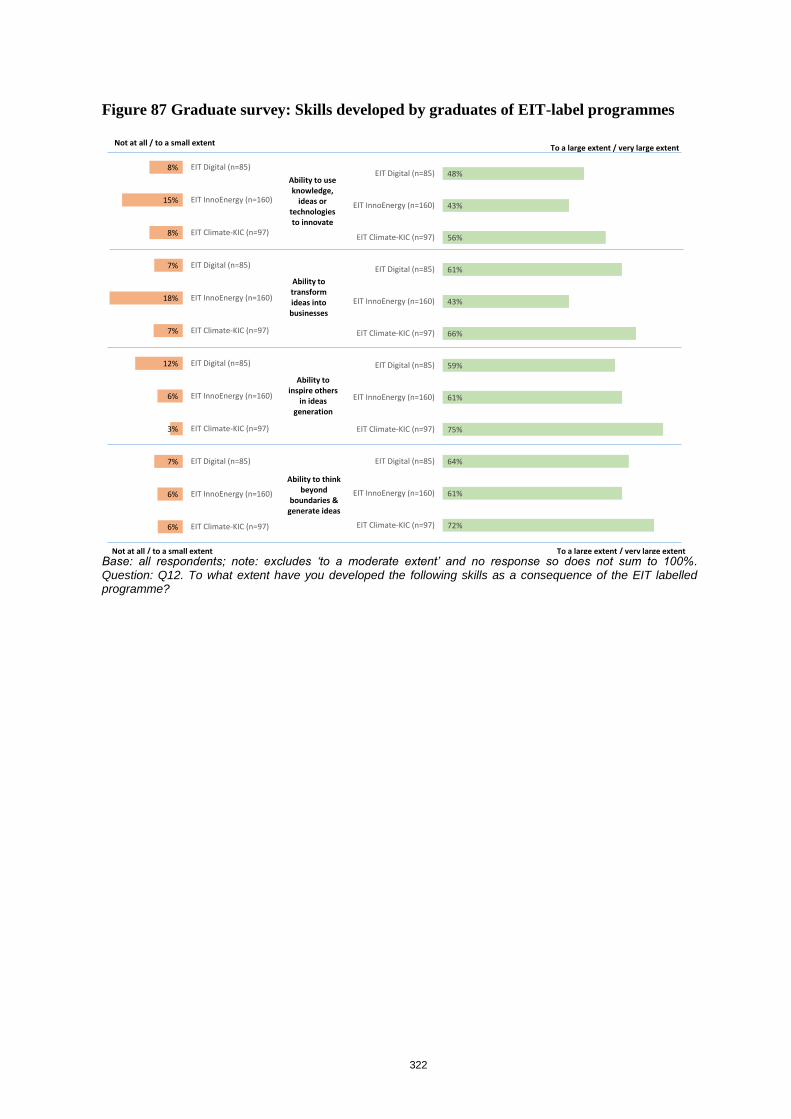
322
Figure 87 Graduate survey: Skills developed by graduates of EIT-label programmes
Base: all respondents; note: excludes ‘to a moderate extent’ and no response so does not sum to 100%. Question: Q12. To what extent have you developed the following skills as a consequence of the EIT labelled programme?
72%
61%
64%
75%
61%
59%
66%
43%
61%
56%
43%
48%
EIT Climate-KIC (n=97)
EIT InnoEnergy (n=160)
EIT Digital (n=85)
EIT Climate-KIC (n=97)
EIT InnoEnergy (n=160)
EIT Digital (n=85)
EIT Climate-KIC (n=97)
EIT InnoEnergy (n=160)
EIT Digital (n=85)
EIT Climate-KIC (n=97)
EIT InnoEnergy (n=160)
EIT Digital (n=85)
6%
6%
7%
3%
6%
12%
7%
18%
7%
8%
15%
8%
EIT Climate-KIC (n=97)
EIT InnoEnergy (n=160)
EIT Digital (n=85)
EIT Climate-KIC (n=97)
EIT InnoEnergy (n=160)
EIT Digital (n=85)
EIT Climate-KIC (n=97)
EIT InnoEnergy (n=160)
EIT Digital (n=85)
EIT Climate-KIC (n=97)
EIT InnoEnergy (n=160)
EIT Digital (n=85)
Not at all / to a small extentTo a large extent / very large extent
To a large extent / very large extentNot at all / to a small extent
Ability to transform ideas into businesses
Ability to inspire others
in ideasgeneration
Ability to think beyond
boundaries & generate ideas
Ability to use knowledge,
ideas or technologies to innovate

323
Figure 88 Accelerator survey: Results of participation in a KIC accelerator programme
Base: all respondents; note: excludes no response so does not sum to 100%. Question: Q16. To what extent do you agree or disagree that your participation in the accelerator programme produced the following benefits or results?
Added-value
As regards the EIT added value, it is worth highlighting the response, within the graduate
survey, about the key distinguishing features of EIT labelled programmes, as well as the
response by companies to the Accelerator survey.
60%
63%
56%
50%
65%
32%
76%
78%
49%
58%
67%
46%
35%
41%
17%
62%
63%
80%
51%
74%
54%
37%
59%
39%
EIT Climate-KIC (n=219)
EIT InnoEnergy (n=54)
EIT Digital (n=41)
EIT Climate-KIC (n=219)
EIT InnoEnergy (n=54)
EIT Digital (n=41)
EIT Climate-KIC (n=219)
EIT InnoEnergy (n=54)
EIT Digital (n=41)
EIT Climate-KIC (n=219)
EIT InnoEnergy (n=54)
EIT Digital (n=41)
EIT Climate-KIC (n=219)
EIT InnoEnergy (n=54)
EIT Digital (n=41)
EIT Climate-KIC (n=219)
EIT InnoEnergy (n=54)
EIT Digital (n=41)
EIT Climate-KIC (n=219)
EIT InnoEnergy (n=54)
EIT Digital (n=41)
EIT Climate-KIC (n=219)
EIT InnoEnergy (n=54)
EIT Digital (n=41)
21%
26%
34%
36%
20%
56%
12%
7%
37%
29%
20%
41%
52%
46%
71%
26%
24%
10%
35%
11%
34%
8%
26%
49%
EIT Climate-KIC (n=219)
EIT InnoEnergy (n=54)
EIT Digital (n=41)
EIT Climate-KIC (n=219)
EIT InnoEnergy (n=54)
EIT Digital (n=41)
EIT Climate-KIC (n=219)
EIT InnoEnergy (n=54)
EIT Digital (n=41)
EIT Climate-KIC (n=219)
EIT InnoEnergy (n=54)
EIT Digital (n=41)
EIT Climate-KIC (n=219)
EIT InnoEnergy (n=54)
EIT Digital (n=41)
EIT Climate-KIC (n=219)
EIT InnoEnergy (n=54)
EIT Digital (n=41)
EIT Climate-KIC (n=219)
EIT InnoEnergy (n=54)
EIT Digital (n=41)
EIT Climate-KIC (n=219)
EIT InnoEnergy (n=54)
EIT Digital (n=41)
Disagree / Strongly disagree Agree / Strongly agree
Agree / Strongly agreeDisagree / Strongly disagree
Access to seed / growth funding
Access to a pool of EIT graduates
Access to potential partners
Better IPR under-
standing
Better under-standing of the market
Access to our first
customer
Reduced time to market
Help to convert idea
into business

324
Figure 89 Graduate survey: the added value of the EIT-label education courses
Base: all respondents: note excludes ‘no comment’ and no response, so does not sum to 100%. Question: Q17. In your view, what are the key distinguishing features of the EIT labelled postgraduate programmes as compared to other similar programmes?
Figure 90 Accelerator survey: Whether businesses believed they could have received
their support from another source
Source: Survey GHK, Q11. Do you think that you could have received this support from another source?
78%
74%
72%
73%
65%
72%
75%
68%
66%
52%
46%
34%
41%
43%
33%
71%
66%
69%
EIT Climate-KIC (n=97)
EIT InnoEnergy (n=160)
EIT Digital (n=85)
EIT Climate-KIC (n=97)
EIT InnoEnergy (n=160)
EIT Digital (n=85)
EIT Climate-KIC (n=97)
EIT InnoEnergy (n=160)
EIT Digital (n=85)
EIT Climate-KIC (n=97)
EIT InnoEnergy (n=160)
EIT Digital (n=85)
EIT Climate-KIC (n=97)
EIT InnoEnergy (n=160)
EIT Digital (n=85)
EIT Climate-KIC (n=97)
EIT InnoEnergy (n=160)
EIT Digital (n=85)
5%
17%
15%
10%
24%
12%
10%
21%
20%
30%
43%
40%
40%
47%
51%
14%
26%
18%
EIT Climate-KIC (n=97)
EIT InnoEnergy (n=160)
EIT Digital (n=85)
EIT Climate-KIC (n=97)
EIT InnoEnergy (n=160)
EIT Digital (n=85)
EIT Climate-KIC (n=97)
EIT InnoEnergy (n=160)
EIT Digital (n=85)
EIT Climate-KIC (n=97)
EIT InnoEnergy (n=160)
EIT Digital (n=85)
EIT Climate-KIC (n=97)
EIT InnoEnergy (n=160)
EIT Digital (n=85)
EIT Climate-KIC (n=97)
EIT InnoEnergy (n=160)
EIT Digital (n=85)
Not as good / as good as other programmes Better / significantly better than other programmes
Engageleading
researchers &businesses
Access to networks of
alumni, businesses
Multi-disciplinaryprogramme
Entrepreneur& innovation
focus
Focus on societal
challenges
Enables international
mobility
Not as good / as good as other programmes Better / significantly better than other programmes
22%
31%
29%
70%
61%
61%
EIT InnoEnergy
EIT Climate-KIC
EIT Digital
Yes No

325
Finally, an aspect raised by the ECA report concerns the need to provide evidence on the
leverage effect, in order to demonstrate the EIT’s success in attracting additional funding for
innovation, as well as the impact of EIT´s activities. On the matter, the EIT has recently
issued a new set of EIT Core KPIs (which started to be tracked from January 2017),
including one conceived to monitor the investments attracted by start-ups supported by
KICs. The set of 11 indicators will help the EIT to provide evidence on the results and
impact achieved.
K.5. Lessons learnt/Areas for improvement
The first three KICs, Climate-KIC, EIT Digital and KIC InnoEnergy, set up in 2010, are now
running at full speed having reached the stage of maturity. They operate in a dynamic
environment which might require sudden shift in strategy and in resource allocation in order
to seize new market and societal opportunities and achieve the best possible results. This can
be done thanks to the flexibility KICs have in shaping and selecting the activities to be
carried out (which are then part of the business plan).
The two KICs launched in 2015 in the areas of Healthy Living and Active Ageing (EIT
Health) and Raw Materials (EIT Raw Materials) are progressively consolidating their
strategies and their portfolio of activities, creating the eco-systems that will deliver the first
tangible results fostered by the integration of higher education, innovative research and
business.
The KICs are also implementing strategies with concrete measures to ensure their long-term
financial sustainability and comprehensive outreach to regions not yet involved in their
activities. The EIT monitoring system keeps track of the results achieved to set incentives for
KICs and, as appropriate, takes on board lessons learnt at individual KIC level and across
KICs.
The ECA performance audit issued in April 2016365
contained a set of four formal
recommendations to which the EIT and Commission responded via an action plan. One of
the 4 recommendations is already accomplished; the other outstanding 3 are in an advanced
stage of implementation. In particular, an amended EIT legal basis, revising the EIT's
funding model, is expected to be tabled to the European Parliament and Council in the first
half of 2018.
Further recommendations have been given through the report of the High-Level Group
appointed by Commissioner Navracsics366
. It provided recommendations on strategic aspects
of EIT and KICs´ operations, like on the need for the KICs to get more embedded into the
local innovation systems, or the need to better communicate their unique selling points in
order to improve the participation of businesses. Those contributions will be part of the
reference documentation for the preparation of the next SIA 2021-2017 and the revision of
the EIT legal basis.
365 Special Report n.04, 2016 "The European Institute of Innovation and Technology must modify its delivery mechanisms
and elements of its design to achieve the expected impact". 366 The Future of the European Institute of Innovation and Technology (EIT) - Strategic Issues and Perspectives, 2016:
https://ec.europa.eu/education/sites/education/files/eit-hlg-final-report_en.pdf

326
L. FURTHER INFORMATION ON THE FAST TRACK TO INNOVATION PILOT 2015-2016
The rationale for the FTI Pilot was the need for bottom-up, commercially driven, easily
accessible grant support for RDI (Research, Development, Innovation, in particular support
for scaling up successfully tested innovations) by high-potential growth businesses. The
Pilot was designed to address:
The sub-optimal performance of European industry and SMEs in the level of
investment in innovation and production of new products and services;
The relatively limited innovation outputs of industry that participated in FP7, and the
need to attract new industry participants to EU Framework Programmes supporting
Research, Technological Development and Innovation; and
The problems in accessing innovation finance which are consequential of the high
level of risk that innovation projects are exposed to.
The FTI Pilot was introduced in conformance with the Horizon 2020 legal basis. The Pilot
Work Programme runs for 2015 and 2016, with an allocated budget of EUR 200 million for
the two years. The FTI Pilot was introduced to offer a ‘bottom-up’ approach targeting
business directly to help address the issues as outlined above, to attract high commercial and
social potential participants, with a quicker appraisal and grant award for those with tested
innovations but not yet fully scaled and launched on the market.
In line with article 32 of Regulation (EU) No 1291/2013, the FTI was subject to an in-depth
assessment, as part of the interim evaluation, commissioned through public procurement.
The summary of this assessment, presenting the main findings against the five criteria for
evaluation defined by the EU Better Regulation Guidelines367
, is described below.
L.1. Relevance
The FTI is clearly highly relevant to the broad policy goals of Horizon 2020 to promote
innovation and its application. As a Pilot testing a new approach, especially in the context of
the proposal for an EU Innovation Council and associated ideas, the lessons are of particular
value both for the remainder of the current programme period, but also for FP9 in the post-
2020 period.
The interest in the FTI from businesses, relative to the allocated budget of EUR 200 million,
is very high, with over 900 project applications over the first three cut-off dates of the call;
with funding only available for 46 projects. Any continuation of the FTI would need to
overcome this challenge of oversubscription; otherwise the very low chance of funding will
deter potentially attractive projects.
L.2. Effectiveness
The legal basis of FTI is that set out for Horizon 2020 more generally, and that for Horizon
2020 innovation actions more specifically. FTI is therefore delivered through a standard
Horizon 2020 project call, using a variation of the standard proposal template and required to
367 http://ec.europa.eu/smart-regulation/guidelines/tool_42_en.htm.

327
apply the legal framework that establishes the size of project (limited to EUR 3 million of
funding) and intervention rate, at a de facto rate of maximum 70% for private sector
organisations, and 100% for public sector entities. It also requires the same partnership
requirements (a minimum of three partners from three different Member States) as other
innovation actions funded through Horizon 2020. Project applications are assessed using
experts selected from the general pool of Horizon 2020 experts managed by the Research
Executive Agency (REA), but selected by the Executive Agency for Small and Medium-
sized Enterprises (EASME).
There is evidence that these requirements provide some limitation on the effectiveness of the
FTI, especially in the partner requirements (which for near market ready projects are less
relevant since they would have already been established).
There are also potential weaknesses in the appraisal process especially the potential lack of
commercial investment experience. The project appraisal process, although carried out
diligently, has not yet fully established the definition and interpretation of criteria that ensure
the highest quality of project. Consequently there is some evidence that:
Projects are at relatively early stages in developing innovations which is likely to
limit the ability to demonstrate the acceleration of innovation to market;
Some projects might be offering limited ‘breakthrough’ innovation, with limited
commercial risk and low levels of additionality associated with funding; and
Inadequate levels of business planning of some projects.
There is also some anecdotal evidence of the heavy use of bid writing contractors by project
sponsors, which also has the potential to undermine confidence in the commercial ‘buy-in’
of projects to the commercialisation process. In this context due diligence is especially
critical.
The real test of effectiveness in terms of the commercial results achieved cannot be known
yet. The maximum duration of projects is 36 months. However, against a target to reach full
commercialisation within 3 years of project start, only 25 per cent of projects responding
considered that they would achieve this target. This raises the concern that projects are
selected which have relatively immature innovation development and/or which lack adequate
preparation and planning for the commercialisation process. The strength of this concern
should be tested in the planned ex post evaluation of the FTI pilot.
The objective of attracting first time applicants to the FTI pilot has so far not been fully
translated into the selection process – it is not a distinct selection criterion, and only a few
national contact points advertise the programme specifically to new applicants.
L.3. Efficiency
A primary goal of the FTI was to reduce the time it takes to award grant decisions within six
months of the application. After some learning and adjustments to the appraisal and award
process for the first cut-off date, time to grant has been subsequently reduced throughout
2015 cut-off dates, even if clear challenges remain and the average time to grant for 2015
was at around eight calendar months (237 days).

328
The process of programme management is that used for all Horizon 2020 programmes. As
noted the main concern in this process is the reliance on the standard proposal template and
use of experts appointed from a general pool of Horizon 2020 experts, the question being
whether sufficient competent expert evaluators in the domain of risk finance or investment
are at hand to assess the 'bankability' of FTI proposals. As a result there must be potential to
improve the quality of awarded projects.
In terms of the additionality associated with the funded projects, the majority of projects
considered when asked what would have happened in the absence said that they would have
continued with the project, albeit at a smaller and/or slower scale. In 25 per cent of cases the
project would not have gone ahead.
L.4. Coherence
There is a small number of applicants for Horizon 2020 funding – especially concentrated
with those who have applied under the SME Instrument – who find it difficult to understand
the differentiating features of the FTI. In practice, given the focus on piloting a bottom-up
approach through FTI, in contrast to the fragmented approach of the SME instrument, the
risk of overlap and policy incoherence is small.
The focus of FTI on accelerating the commercial uptake of a number of innovations and the
ability of larger firms to access the FTI pilot subject to confirming the additionality of
funding provides a distinguishing character within Horizon 2020.
Were the FTI to expand to attract substantially larger projects (say over €5 million), these
might be potentially better suited to funding through a financial instrument. The FTI, by
focusing on smaller projects up to €3 million, could complement financial instruments
directed at the same objectives.
L.5. EU added value
EU added value derives principally from bringing to market innovations that would
otherwise remain in the development phase for longer periods of time, and in some potential
cases being overtaken by innovations by competitor regions. In this context the instrument is
highly supportive of the agenda being discussed by the proposed European Innovation
Council (EIC).
The FTI as a Pilot has an intrinsic value from having successfully demonstrated the
feasibility of, and demand for, a bottom-up approach to promoting innovation across a wide
spectrum of technologies.

329
M. IMPACT OF THE NEW MANAGEMENT MODES ON THE PERFORMANCE OF HORIZON 2020
– FOCUS ON EXECUTIVE AGENCIES
M.1. Background
New Management Modes are a new way to manage implementation activities in the field of
EU research and innovation. Their first major use was in the Seventh Framework
Programme (FP7) when two Executive Agencies368
and five Joint Undertakings were
established369
with the aim to support Commission activities with a more focused and
efficient toolset tailored specifically to the implementation of FP7. As the political
importance and budgetary weight of research programmes increased, the Commission began
looking into alternative methods of accomplishing these goals.
With the substantial increase in budget allocated to Horizon 2020 (EUR 74,8 billion
compared to EUR 55 billion for FP7) and with the available human resources becoming
more and more scarce over its duration (5% staff reduction over 2014-2020 period), the
Commission has to make the best use of reduced human resources by focusing on its core
institutional tasks, such as policy-making, implementation and monitoring of the application
of EU law, and strategic management, whilst guaranteeing the most effective and efficient
implementation of spending programmes for which it remains ultimately responsible.
These principles pursued by the Commission are fully reflected in the implementation of
Horizon 2020 where much greater recourse to management modes (i.e. Executive Agencies
and other external bodies), different from direct in-house management is made. Capitalizing
on the positive experience370
from FP7 when the two Executive Agencies (REA and
ERCEA) implemented almost 30% of FP7 budget, the New Management Modes are
expected to implement 65% of the Horizon 2020 budget (Executive Agencies 55% and Joint
Undertakings 10%) between 2014 and 2020.
Figure 91 Total Horizon 2020 budget: EUR 74,8 billion for the period 2014-2020
Source: Calculation by the Commission
368 Research Executive Agency (REA) and European Research Council Executive Agency (ERCEA) 369 Clean Sky, Fuel Cells and Hydrogen (FCH), Innovative Medicines Initiative (IMI), ARTEMIS, ENIAC and Single
European Sky Air Traffic Management Research (SESAR) 370 Evaluations of REA and ERCEA (2009-2012) and interim evaluations of the first generation Joint Undertakings under
FP7
EAs: 55%
JUs: 10%
EC: 25%
P2P; 2%
EIB;4% EIT; 4% Executive Agencies (EAs)
Joint Undertakings (JUs)
European Commission (EC)
Public - Public Partnerships (P2P)
European Investment bank (EIB)
European Institute of Technology (EIT)

330
New Management Modes are translated into a number of distinct structures created by the
Commission (Executive Agencies) or in cooperation with industry (Joint Undertakings).
Though separate legal entities, they are bound to the common objectives through legal
means (Council Regulations or Establishment and Delegation Acts), political and budgetary
arrangements (they implement parts of the Union budget and are accountable to the College
or to the Parliament) and internal management arrangements put in place to monitor and
supervise their activities.
Currently, there are six Executive Agencies of which four are part of the Research family
and implement delegated Horizon 2020 tasks, namely: the Executive Agency for Small and
Medium-sized Enterprises (EASME), the European Research Council Executive Agency
(ERCEA), the Innovation and Networks Executive Agency (INEA) and the Research
Executive Agency (REA). They all have a different mission, from supporting small and
medium-sized enterprises, to assisting with the construction of large trans-European
infrastructure networks, to managing big project portfolios of high visibility in Horizon
2020, to supporting the cutting edge research no matter where it comes from or in which
form (see table below).
Table 72 Four Executive Agencies and their role in Horizon 2020
ERCEA REA INEA EASME Horizon
2020
Horizon 2020 delegated tasks (number) 1 8 2 4 22
Delegated budget 2014-2020 (€ billion) 12,7 13,9 6,4 6,9 74,8
% of total Horizon 2020 budget 16.9% 18.1% 8.3% 8.9% 100%
Source: Delegation Acts
M.2. Setting up Executive Agencies under Horizon 2020
M.2.1. General framework
Since the very beginning of FP7, the Commission has been committed to ensuring good
coordination between the different Commission services implementing the programme. For
this purpose, the Commission has set up a range of mechanism (e.g. Research Enquiry
Service) for identifying and resolving instances of incoherent treatment by different
Commission services.
With the launch of Horizon 2020, the Commission decided to make more extensive use of
the existing Executive Agencies and entrusted the execution of 55% of the Horizon 2020
budget by delegating implementation tasks to them. The Commission has been conscious of
the potential risks associated with the more extensive recourse to Executive Agencies such
as, for example, increased fragmentation of Horizon 2020 implementation efforts and
ensuring a high level of transparency and effective coordination processes, clarity of roles
and responsibilities between the Commission and agencies as well as increased demand for
monitoring, governance and control arrangements. For these reasons, it introduced a number
of concrete rules and measures to ensure a coherent and harmonised implementation
process.

331
Under Horizon 2020, a single set of rules on reimbursement rates, evaluation and
grant management applies across the board, regardless of which implementing body
is managing the delegated parts of the programme. Simpler guidance and advisory
services to applicants and participants are provided through a unique IT portal, i.e.,
the Participant Portal.
Multi-annual Horizon 2020 work programmes are drafted with the participation of all
Horizon 2020 services designed to maximize the potential for synergies between
research and innovation programmes and minimize the risk for duplication of
research activities.
A Common Research Datawarehouse was set up, maintaining the complete Horizon
2020 historical data on submitted proposals and signed grant agreements, available to
and used by all Commission services.
Common rules have been developed relating to the feedback of results into policy
making as part of the 'Strategy for an Effective Dissemination and Exploitation of
Research Results in Horizon 2020'.
The Horizon 2020 Common Support Centre (CSC), hosted by DG RTD, is providing
services on legal support, business processes, IT systems and operations, programme
information and data, and ex-post audits. These services are provided to all DGs of
the Research and Innovation family and all Executive Agencies and Joint
Undertakings involved in the implementation of Horizon 2020.
Beside the CSC, the REA is providing common administrative and logistical support
services to the programme implementing actors, in particular support for the
evaluation of proposals, management of expert evaluators (contracting and paying)
and the validation of beneficiaries' legal status and financial data.
Both the CSC and REA's administrative and logistical support department are the
two facets of a centralised support aiming to provide a consistent application of the
single set of rules underpinning the implementation of Horizon 2020. Some of the
REA tasks have even been extended beyond Horizon 2020 to other programmes,
such as COSME, ERASMUS+, etc. as regards the validation of the legal entities and
verification of the financial capacity of participants.
M.2.2. Governance and division of responsibilities
The delimitation of responsibilities between the Executive Agencies and various parent DGs,
and the ERC Scientific Council (in the case of ERCEA371
) is clear. Governance of each of the
Agencies is based on a well-developed framework providing detailed guidance on its
operation372
, as explained below.
371 ERCEA is unique with respect to the rest of the other EAs in terms of mandate and the dual leadership under which the
Agency operates as the Dedicated Implementation Structure of the ERC. ERCEA is entrusted to handle the administrative
implementation and programme execution of the ERC actions and support the ERC Scientific Council in the conduct of all
its tasks.
372 The recent evaluations of REA and ERCEA concluded that no evidence regarding ‘micro-management’ was found. The
legal basis clearly distinguished the different roles of the Commission, the ERC Scientific Council in case of ERCEA and

332
Firstly, the political responsibility for the implementation of all parts of Horizon 2020
rests with the Commission which monitors the activities of the Executive Agencies on the
basis of the detailed legal provisions set inter alia in Council Regulation No 58/2003 and in
the respective Instruments of Delegation. More specifically, it is the Commission's
responsibility to strike the right balance between making sure that the Executive Agencies
are efficient and follow the instructions and objectives assigned to them as part of their
mandate while respecting the fact that they are separate legal entities with their own
leadership and management structures. Any attempt by the Commission to micro-manage by
interfering in the operation of an EA would be counter-productive, effectively leading to
duplication of roles and to a waste of resources and opportunities.
The Agencies are set up only to perform the tasks delegated by the Commission. The
division of tasks between the Commission services and the Agencies is clearly defined and
documented in the respective delegation acts;
The Commission’s departments perform tasks implying policy choices, in particular:
setting objectives and priorities, adopting work programmes (including financing
decisions), representing the Commission in the Programme Committees and adopting
award decisions subject to comitology.
The Agencies are responsible for implementing tasks, such as organising and carrying out
proposal evaluations, launching and concluding grant procedures, adopting, project
monitoring, financial control and accounting, and contributing to programme evaluation
and various support tasks.
The continuous coordination between the Commission and Executive Agencies on
procedures, tools and working arrangements ensures coherence and complementarities
and helps avoiding gaps in responsibilities or duplication of efforts. In addition, regular
contacts take place between the Executive Agencies and the parent DGs' services responsible
for the programmes that are implemented by the Executive Agencies These contacts take the
form of coordination meetings at Directors level, Head of Department/Head of Unit level
and contacts at working level. The Executive Agencies participate to the weekly Directors
meetings of their parent DGs. In addition, the Executive Agencies are involved in the
structures governing Horizon 2020 – challenge groups, cross-cutting issues groups, steering
committees and thematic working groups as well as in the governance of the Common
Support Centre (Executive Committee, Business Process steering committees and user
groups).
M.3. Assessment of implementation of Horizon 2020 activities delegated to the
Executive Agencies
M.3.1. Calls management
Since the start of Horizon 2020 in 2014, 148 calls launched by the Executive Agencies were
concluded by September 2016. The legal provisions along with the common rules,
procedures and IT tools catered by the CSC contributed significantly towards an increased
the agencies. The Steering Committees were efficiently used by the Commission as the key instrument for day-to-day
management of the Agencies.

333
harmonisation of project implementation practices and effective coordination among
Horizon 2020 implementing services, be them in Executive Agencies or in the Commission.
Table 73 Main statistics related to the main overall implementation of Horizon 2020
calls launched by the Executive Agencies in 2014-2016
Calls management ERCEA REA INEA EASME All calls in
Horizon
2020
Calls concluded 10 73 22 43 274
Eligible proposals 15,782 28,905 1,495 29,047 86,995
Retained proposals 2,080 3,970 306 2,304 10,460
Success rate (%) 13,2% 13,7% 20,5% 7.9% 12%
Grants signed373
2,091 3,733 261 2,323 9,913
EU contribution to grants
(millions)
3,355.1 3,472.5 1,754.7 1,709.8 17,246.8
Average EU contribution
(millions)
1.60 0.93 6.72 0.74 1.74
Total ongoing projects
(31/12/2016)
5.459 6.658 290 (1.220
total for EA)
1.644 (2.469
total for EA)
n.a.
Source: eCORDA release September 2016
The low number of redress procedures upheld provides an indication of the robustness of the
grant award process and assurance on the effectiveness of the internal control system.
The analysis of the Agencies' performance is based on analysis and interpretation of the Key
Performance Indicators (KPIs) related to:
Timely execution of the delegated functions;
Cost-efficiency of the management of delegated activities;
Budget execution of commitment and payment appropriations.
M.3.2. Timely execution of the delegated functions
The summary table below shows that the Agencies were effective in producing the planned
outputs (issuing calls, evaluation proposals and administering grants) and achieving good
results in terms of Key Performance Indicators (KPIs). The results achieved in terms of
'Time-To-Grant' and 'Time-To-Pay' are considered good as they remained below the defined
targets in most of the cases. In 2014 - 2015 all calls for proposals were published and closed
according to the plans of in the respective work programmes. The KPIs achieved in 2016
demonstrated an improvement compared to the results achieved in 2014 and 2015.
373 Most of the granting activity in 2015 related to the preparation of grant agreements from the 2014 calls and their
budgetary commitments. As regards INEA and EASME, the Commission handed over to the agencies the calls launched by
its services, therefore the number of grants signed are higher that resulting from the calls fully launched by these agencies.

334
Table 74 Summary tables for 2014, 2015 and 2016 on key indicators related to the
timely execution of the delegated functions – Executive Agencies
Call management (2016) ERCEA REA INEA EASME
Average Time to Inform (target -153 days) From 77 to
207 days
132 120 117
Average Time to Grant (target 245, ERCEA -
400)
399 193 226 224
Average Time to Pay (% on time within legal
deadlines)
98,8% 95,4% 100% 96%
Average evaluation cost per proposal - external
experts paid/ total number of proposals evaluated
€1.335 1.471 n.a. n.a.
Call management (2015) ERCEA REA INEA EASME
Average Time to Inform (target -153 days) From 94 to
164 days
142 139 131
Average Time to Grant (target 245, ERCEA -
390)
357,7 203 224 239
Average Time to Pay (% on time within legal
deadlines)
89,2% 96% 100% 94%
Average evaluation cost per proposal - external
experts paid/ total number of proposals evaluated
(% of the amount recommended for funding)
0,07% <2% 0,05% n.a.
Call management (2014) ERCEA REA INEA EASME
Average Time to Inform (target -153 days) From 118
to 133
141 152 n.a.
Average Time to Grant (target 245, ERCEA -
390)
173 217 238 240
Average Time to Pay (% on time within legal
deadlines)
91.4% 97% 100% 98%
Source : Annual Activity Reports 2014-2016, calculation by the Commission. Data refers to Horizon 2020
activities only
M.3.3. Cost-efficiency of the management of delegated activities
According to the financial regulation (Article 30), the principle of economy requires that the
resources used by the institution in pursuit of its activities shall be made available in due
time, in appropriate quantity and quality and the best price. The principle of efficiency
concerns the best relationship between resources employed and results achieved.
Efficiency for this analysis is defined as the ratio between inputs (staff) and outputs (the
budget managed by the Agency). The indicators for measuring efficiency are the ratio
between the administrative and operational budget (%) and the budget "per staff head" (€
million). The estimated average budget managed by 'head' for all Executive Agencies in the
Commission Communication374
was expected to increase from € 3,47 million in 2013 to
€4,6 million per staff member in 2020.
374 Communication to the Commission on the delegation of the management of the 2014-2020 programmes to executive
agencies (SEC(2013)493).

335
Table 75 – Overview of administrative efficiency in Executive Agencies
Administrative efficiency 2016 ERCEA REA INEA EASME
Programme management cost ratio
(administrative/ operational budget)
2.75 % 2,6% (3,6%
with CSS)
0.77% 2,7 %
Research project - budget 'per head' (EUR
million)
4,42 3,2375
11,4 5,2 (all EA
projects -3,8)
Average number of running research projects
per staff member (operational activities)
17 36 6,7 9 (all EA
projects -7,2)
Source: Annual Activity Reports 2016, calculation by the Commission.
The differences in the cost ratios, the overall number of running projects and the average
number of projects per staff can be explained by the different portfolios as well as nature of
projects of each agency which vary in terms of grant size, number of participants, duration
and number of transactions involved.
In order to allocate and mobilise human resources in a timely manner, REA developed a tool
for staff allocation based on workload measurement on the basis of the Cost Benefit
Analysis (CBA) model used at the time of the extension of REA's mandate in 2013. REA
runs the workload simulation every year at the time of establishing the Annual Work
Programme of the next year and allocates the resources accordingly.
In the same manner, ERCEA has developed workload indicators which are used on a yearly
basis for the purposes of establishing the staff allocation of the following year. The workload
estimations are revised annually taking into account the volume of transactions reported at
the end of the year.
As regards INEA, a workload analysis was prepared and revised each time the estimated
figures on the number of projects managed are updated. When necessary, the recruitment
and staffing plans are revised in order to balance the workload and temporary support can be
given from one unit to another.
Finally, based on the methodology of the recent common Cost Benefits Analyses, EASME
developed a pragmatic and cost-effective approach for a workload assessment that was first
performed in 2016. The assessment will serve as an input to the Agency staffing plans for
2017.
M.3.4. Budget execution of commitment and payment appropriations in 2014-
2015
All Agencies managed to execute their available budget almost at 100%, with the exception
of payments out of the administrative budget.
Table 76 Budget execution in Executive Agencies
Budget execution 2014-2016 ERCEA REA INEA EASME
Operational budget
Budget execution (% to Commitments) 99,90% 100% 100% 100%
375 This does not include the REA staff providing the administrative and logistical central support services

336
Budget execution (% to Payments) 100% 100% 100% 100%
Administrative budget
Budget execution (% to Commitments) 99,42% 99,40% 98.86% 99%
Budget execution (% to Payments) 93,45% 91,79% 96.14% 89,7%
Source: Annual Activity Reports 2014-2016, calculation by the Commission
M.3.5. Monitoring, dissemination and exploitation of research results
The existing monitoring arrangements and reporting obligations allow for an effective
provision of evidence for policy making. Specifically, supervision and monitoring of the
Executive Agencies is ensured by the drafting and submitting to the Commission of detailed
activity reports on a bi-annual basis. In order to harmonise the periodic reporting as much as
possible among the different Executive Agencies and Joint Undertakings, a set of common
KPIs and reporting templates have been designed.
The Strategy for an Effective Dissemination and Exploitation of Research Results in
Horizon 2020 was adopted in September 2015 and applies to all Horizon 2020 implementing
services including the Executive Agencies. The objective of the strategy is to increase the
availability of outputs stemming from EU funded research and innovation projects and thus,
increase their use in different contexts, such as having an impact on commercial markets,
helping create jobs and growth and supporting policies in tackling societal challenges.
Against this background, the strategy aims at outlining how the European Commission will
support and enhance the dissemination and exploitation activities of the project consortia,
and how it will benefit from the Horizon 2020 project results as input into its policy making
and programming activities.
Taking into account that the implementation of Horizon 2020 has been delegated to a large
extent to Executive Agencies, it is essential to ensure that there is no interruption in the flow
of research results from projects and programme implementation into policy making and
programming. The roles and competences of everyone involved have been defined in the
revised Memoranda of Understanding between parent DGs and the respective Executive
Agencies (signed in 2015).
M.3.6. Proximity to beneficiaries
The delegation of certain parts of Horizon 2020 has enabled the agencies to focus their
existing communication and outreach channels, which have developed over time to keep
them close to beneficiaries and to improve the EU's visibility as the promoter of the
programmes. In particular, the agencies provide an increased level of direct exchanges with
beneficiaries through info days, kick off meetings for larger and multi-annual projects, and
monitoring visits. At the same time, all potential beneficiaries have a single entry point.
In 2015 ERCEA continued its tailor-made services for ERC beneficiaries. Four training
conferences for Principal Investigators (PIs) have been organised (in Brussels, Sweden,
Spain and Austria). The aim of these conferences is primarily training PIs on procedures and
rules and facilitation of a dialogue amongst ERC grantees. Almost 200 PIs attended these
events and like in previous years, these training events were very well received.

337
The REA cooperates closely with the parent DGs on communication throughout its project
portfolio. It organise regular information days for proposers in Brussels and abroad,
coordinators' days for running projects and various other events related to the projects and
actions, in close collaboration with the parent DGs.
INEA mainly focused on two aspects. The first one is consolidating the stakeholders and
facilitating and preparing the communication aspects of project management relationships
with its key Horizon 2020 stakeholders – potential applicants and beneficiaries – to promote
funding opportunities. A total of 6.189 participants registered in Horizon 2020 events (e.g.
info days) organised by INEA in 2015 and 2016, and another 11.544 followed the events and
presentations online via web-streaming. 89,2% of the participants expressed their
satisfaction with these events. The events attracted 54,5% new participants in transport and
62% in energy sectors. The second is organising workshops with the representatives of the
ongoing projects on selected themes, such as geothermal energy, carbon capture and storage,
smart cities and communities, intelligent transport systems and urban mobility, in order to
encourage the projects to work together, to avoid duplication and promote synergies,
particularly in the dissemination and communication aspects of projects.
Three info days for Horizon 2020 beneficiaries were organised by EASME in 2015 and were
attended by close to 2.000 participants on site and several hundred on line, learning more
about upcoming calls for proposals. These events were very successful and had a very high
satisfaction rate. In addition, the Agency promoted the delegated programmes via
newsletters, on social media and during major events (such as, for example, the EU
Sustainable Energy week, Green Week, SME – instrument Innovation Summit).
M.4. Main findings and conclusions from the recent evaluations of ERCEA and
REA operations
The recently completed evaluations of the operations of ERCEA and REA cover the period
from July 2012 to July 2015, encompassing two different Framework Programmes (Seventh
Framework programme and Horizon 2020). The compulsory 3 year evaluations of the other
two Agencies that implement Horizon 2020 (INEA and EASME) will be carried out in 2017
and will cover the operations of these Agencies during the period 2014-2016. The main
conclusions drawn from the two parallel evaluation exercises are as follows.
The establishment of the two Executive Agencies resulted in significant savings to the EU
budget in comparison to the alternative options as shown by the retrospective CBAs (Cost-
Benefit Analyses) for 2012-2015. Overall, the results indicated that the Executive Agency
scenario remained considerably more cost-effective than the in-house scenario, generating
substantial savings to the EU budget.
As regards ERCEA, the analysis revealed that the actual costs of the Agency in 2012-2015
were by EUR 20.6 million (12%) lower than the initial estimation due to cost savings in
overheads. On the other hand, actual staff related expenditure exceeded estimations for the
period 2014-2015 because of higher than expected actual average staff costs. The actual
cost savings of the ERCEA scenario amounted to 23% in comparison to the in-house
Commission scenario. In real terms, the actual savings from the programme delegation to
the ERCEA in 2013 were very close to the initial CBA estimations, EUR 46.5 million
compared to EUR 44.6 million.

338
Similarly, the retrospective CBA analysis for REA revealed that the actual costs of the REA
in 2012-2015 were by EUR 34.8 million (15%) lower than the initial estimation due to cost
savings in the staff and infrastructure expenditure. The actual cost savings of the Executive
Agency scenario amounted to 21% in comparison to the in-house Commission scenario.
The actual savings from the programme delegation to the REA in 2013 were 24% higher
than the initial estimations, EUR 53.4 million compared to EUR 43.1 million.
The last evaluation of INEA (ex. TEN-EA) confirmed that the programme implementation
(TEN-T Programme) by the Agency during the period 2011-2013 proved to be better 'value
for money' in comparison to the DG MOVE in house scenario. The cost savings were
estimated to EUR 8.8 million.
The results of the CBA from the last evaluation of EASME (ex EACI) covering the 2011-
2013 period revealed considerable cost savings due to the Agency scenario, estimated
between EUR 27 million and EUR 36 million, depending on the extent to which the
Commission would use Contract Agents staff to carry out the delegated activities. The
evaluation concluded that the Agency effectively and efficiently implemented the
programmes entrusted to it.
The initial identification of tasks entrusted to the Executive Agencies and the produced
savings are still valid for justifying the outsourcing.
The mandates of ERCEA and REA remain highly relevant to the needs of the Commission
and the Agencies' applicants/beneficiaries for the remaining part of the programming period
(from mid-2015 to 2020).
The ERCEA and REA performed in an efficient and cost-effective way in implementing
the delegated programmes during the period 2012-2015.
The recent evaluations concluded that the process of grant management was judged to be
very efficient in ERCEA and efficient in REA. Both Executive Agencies were effective in
achieving objectives and producing planned outputs during the reference period (2012-
2015). Despite increases in the operational budget and the number of proposals, the ERCEA
and REA achieved good results in terms of main KPIs. The results achieved in terms of
'Time-To-Grant' and 'Time-To-Pay' are good and remained below the defined targets in most
cases.
The two Executive Agencies not only improved management of the programme, but also
rendered better services to the various stakeholders.
More specifically, the ERCEA beneficiaries' survey reported 93% of the respondents being
very satisfied or satisfied with the services provided by the ERCEA. The overall satisfaction
rate demonstrated an increasing trend during the 2011-2014 period (from 89% in 2011 to
93% in 2014). Moreover, an impressive 95% of independent experts were satisfied with the
services provided by the ERCEA. The REA beneficiaries' survey indicated 82% satisfaction
rate with regard to performance, up from 78% in 2011. In the area of support services (the
REA contracts and pays all expert evaluators), 98% of the independent experts were satisfied
with the service of the REA and expressed their willingness to work with REA as an
independent expert again in the future.

339
Externalisation of the research and development activities to the Executive Agencies allowed
the Commission services to better focus on policy-making by freeing up resources for
policy-related tasks and enabling a greater emphasis on their exercise. The benefits of
outsourcing that have been actually realised would not have occurred had Commission staff
worked on both policy-related issues and programme and project management at the same
time.
In conclusion, the ERC has become a recognised success of the FP7, having established
itself as an indispensable component of the European Research Area highly regarded for the
quality and efficiency of its operations. The level of competition in Horizon 2020 guarantees
excellence (success rate barely superior to 10%) and ERC grant is synonymous of Scientific
Excellence for the worldwide scientific community.
As regards REA, the largest Executive Agency in terms of staff, it delivered a high quality
and effective service to FP7 and Horizon 2020 participants and other stakeholders through
its central support services, contributing significantly to a more consistent application of the
Horizon 2020 rules.
As regards the other two agencies, INEA and EASME, during 2014-2015 the agencies grew
considerably in size and were heading towards cruising speed. In 2015 the Executive
Agency demonstrated their readiness to perform and implement the delegated activities and
have in place the necessary arrangements to accommodate the new programmes. The main
success would be the launch of Horizon 2020 calls in areas where no pre-existing research
expertise or base existed and full project cycle management of the delegated programmes
following the end of transitional arrangements when certain phases of the project life cycle
were managed in house by parent DGs.

340
N. THE IMPACT OF SIMPLIFICATION AND THE NEW FUNDING MODEL
N.1. Context and legal requirements – Horizon 2020 new funding model
The funding model of Horizon 2020 comprises major simplification compared to the model
used in the predecessor programme. In FP7, the reimbursement to which a project is entitled
is determined via a complex matrix of organisation categories and activity types, making the
financial management of the grant difficult and restricting the flexibility of the consortium in
the implementation of the project. Moreover, for the calculation of indirect costs (overheads)
in FP7, four different methods exist (two flat rate models, depending on the organisation
categories; real indirect costs and a simplified method of determining real indirect costs). In
particular, the real indirect cost options are a considerable source of financial errors.
The policy rationale for the Commission's proposal for the Horizon 2020 funding model was
the following:
To put the focus on the costs that are directly related to the project
To simplify the financial management of projects, by a reduced complexity of the
financial rules
To reduce the financial error rate detected in ex-post audits
To increase legal certainty for beneficiaries
To increase the attractiveness and ease of access to the programme, in particular for
newcomers, smaller actors, SMEs and industry
To contribute to the acceleration of the granting processes
Consequently, the funding model of Horizon 2020 is based on two main features:
A single reimbursement rate in a given project, without differentiation between
organisation categories or types of activities. The reimbursement rate is up to 100%
of the eligible costs for Research and Innovation Actions and up to 70% for
Innovation Actions (with one exception: non-profit organisations are reimbursed
100% also in Innovation Actions).
A single flat rate for contributing to the indirect costs. This flat rate of 25% is
applied to the direct costs376
.
The results of a survey, addressed to all participants of signed Horizon 2020 grants in
September 2015, show that an overwhelming majority of the respondents having experience
with FP7 appreciate the new simplified funding model of Horizon 2020.
376 Except costs for subcontracting, costs of financial support to third parties and in-kind contributions not used on the
beneficiary's premises

341
Figure 92 How beneficial is the introduction of a single reimbursement rate for the
project?
Figure 93 How beneficial is the introduction of a single flat rate for indirect costs?
More than 77% of the respondents consider the single reimbursement rate in a project as a
beneficial simplification. More than 74% welcome the single flat rate for indirect costs.
Another feature of the Horizon 2020 funding model is the additional remuneration scheme
(Article 27.2 of the Rules for Participation) introduced during the legislative process by the
legislator. The feedback received from Member States' representatives and stakeholders
indicates that its implementation is complex. Besides, it has a negative financial effect on
those beneficiaries whose usual remuneration practices are based on very variable levels of
remuneration.
In some Member States the salaries of researchers in the public sector are strongly dependent
on availability of external funding. Under those remuneration schemes, project-triggered
remuneration may count, for example, for as much as two third thirds of the total salary of
the employee. That leads to situations where the cap of EUR 8 000 results in the ineligibility
of a substantial part of the personnel costs. For certain groups of beneficiaries the provisions
on additional remuneration imply that the eligible personnel costs for the same person for the
same work are lower in a Horizon 2020 action than in a FP7 project.

342
N.2. The impacts of the new model on attractiveness, accessibility and
participation in Horizon 2020
While a direct causal relationship between the funding model and the observed participation
figures cannot be established, the statistics on participation show clearly that Horizon 2020
is highly attractive. About 120,000 proposals were submitted so far. The oversubscription
rate (in terms of requested EU budget) is more than 8:1.
The programme attracts many newcomers (see Section R.3. Analysis of newcomers to
Framework Programme). Similarly, the programme attracts SMEs (see Section O. Analysis
of the companies participating in Horizon 2020). This shows the attractiveness of Horizon
2020 (including its funding model) for SMEs and newcomers.
Responding to the concerns of some large research organisations on the single flat rate for
indirect costs, the Horizon 2020 Rules for Participation provide for the "Large Research
Infrastructure" (LRI) scheme. To date, 13 entities (nine research organisations, three higher
education establishments, and one enterprise) have lodged a request for an ex-ante
assessment of the methodology for LRI.
Four entities (research organisations) have received a positive ex-ante assessment while 2
(research organisation) have been found not compliant. For five entities, the work is
ongoing. Two entities have voluntarily withdrawn their application.
In conclusion, the number of applicants for the LRI scheme remains modest – reflecting the
fact that overall only a few potential candidates comply with the set thresholds (minimum
value of the infrastructure of 20 M€; at least 75% of the asset value in the balance sheet is
research infrastructure).
This confirms that the thresholds as initially designed (i.e. targeting "large" infrastructure)
have achieved their objective: targeting large research organisations with expensive research
infrastructure and doing research as their core business.
N.3. The impacts of the new model on funding levels
The effective funding levels (EU contribution versus real project costs) in Horizon 2020 are
determined by the nominal reimbursement rates (100% or 70%) and the flat rate for indirect
costs (covering, on average, only a part of the real indirect costs). In FP7, the funding level is
a function of the organisation categories, the mix of types of activities in a project and the
choice by beneficiaries of the method for charging indirect cost (among the four existing
options).
In FP7, around 90% of participating universities and more than half of research
organisations use the 60% flat rate method for indirect costs and their reimbursement rate is
75%. For such organisations, the funding model of Horizon 2020 represents no major
change. Their funding levels, compared to FP7, are slightly increased (by about 4%). The
same applies to participations in projects under the European Research Council, for which
the only change from FP7 to Horizon 2020 is the increase of the flat rate for indirect costs
from 20% to 25%.
For industry and other organisations using in FP7 the real indirect cost option, the Horizon
2020 funding model represents a major change. A direct comparison of funding levels is not

343
possible. The average nominal funding level (EU contribution/ (direct costs + 25%) +
subcontracting)) for non-SME industry in Horizon 2020 is 64% (compared to 54% in FP7).
But this nominal funding level does not represent the effective funding level, as for these
entities the real indirect costs on average are higher than 25%.
An estimation of the effective funding level was made, based on the known real indirect
costs of the most frequent FP7 industry participants (non-SMEs) using the real indirect cost
option. This results in an estimated average real funding level for (non-SME) industry in
Horizon 2020 in the area of 58%, i.e. an increase of 4 percentage points compared to FP7
for this population of beneficiaries.
This moderate increase of the average effective funding level for non-SME industry did not
lead to a higher share of the total funding going to big industry. While overall industry
participation (including SMEs) has increased, the share in number of participations of non-
SME industry has decreased by 12% compared to FP7. The respective share in EU
contribution decreased even stronger by 28% compared to FP7. This is clear evidence that
the nominal increase of the reimbursement rate for (non-SME) industry, from 50% (35% for
demonstration activities) in FP7 to 100% (70% for Innovation Actions) in Horizon 2020, has
not lead to an increase of the share of EU funding going to this category of participants.
An overall direct comparison of funding levels on a programme level between FP7 and
Horizon 2020 is not possible, however estimations show that the average real funding level
in Horizon 2020 remains at the 70%, the same as in FP7.
N.4. Lessons learnt and areas for improvement
The expected benefits of the new funding model have largely materialised. A big majority of
the stakeholders appreciate the related simplification effects. The funding model is attractive
for newcomers and SMEs. Its reduced complexity contributes to the acceleration of the
granting process (88% of the grants in Pillars 2 and 3 are signed within 8 months from the
call deadline). The effects on the simplification of financial management in the projects and
on the error rate cannot yet be assessed, as very few financial reports were yet submitted and
no ex-post audits were yet finished.
During the inter-institutional negotiations on the Horizon 2020 Rules for Participation some
stakeholders raised concerns on potential detrimental effects of the proposed funding model
on certain categories of organisations:
The single 25% flat rate for indirect costs would deter organisations running big and
expensive research infrastructures, because their real costs would not be adequately
covered;
The 100% reimbursement rate would massively increase the share of EU contribution
going to big (non-SME) industry.
Concluding from the analysis of the data on the Horizon 2020 grants signed so far, these
effects have not materialised.
One area for improvement is the broader acceptance of beneficiaries' usual accounting
practice. Stakeholders indicate that there are still too many instances where they have to
collect data and information specifically for obligations in their Horizon 2020 grants, in

344
parallel to their usual accounting system. This concerns in particular the obligations on staff
time recording, the accounting for depreciation of equipment and for internally provided
consumables and services, the handling of personnel costs outside closed financial years and
some accounting detail for beneficiaries outside the Euro zone. The Commission has already
reacted to these concerns and adapted the Horizon 2020 model grant agreements accordingly
Another area for improvement concerns the unintended effects of the additional
remuneration scheme (Article 27.2 of the Rules for Participation) with the eur 8000 capping.
A change to the Horizon 2020 model grant agreement, providing that personnel costs for
researchers taking part in Horizon 2020 will be eligible at least at the level accepted in
national projects, is under preparation for providing a quick intermediate solution. For the
longer term, one could also consider a change to the Horizon 2020 rules for participation,
requiring a legislative procedure involving Parliament and Council.
As concerns more substantial changes, the European Court of Auditors has suggested that
the Commission should lean towards a trust-based approach in research funding and in this
respect should consider moving away from its current system of reimbursing beneficiaries
for proven costs, towards lump sum financing based on performance/results. The wider use
of output-based funding with lump sums has the potential to reduce drastically the financial
error rate and is also in line with the Commission's priority on Budget Focused on Results.
Such forms of funding aim to shift the focus from checking inputs (i.e. costs incurred) to
monitoring performance and outcome, covering the entire project life cycle, including new
ways of ex-post audits. The revised Financial Regulation provides a fresh opportunity for an
extended use of such simplified forms of funding (flat rates, unit costs, lump sums) and in
particular for funding based on results/output/performance/fulfilment of conditions. In
Horizon 2020 output-based funding with a lump sum is currently used only for the SME
instrument phase 1 and there are only very few R&I funding programmes worldwide with
similar schemes that could serve as an example. The challenge with funding based on
output/results/performance in the field of research is to define the conditions for the payment
of the lump sum. These conditions must take into account the intrinsically risky nature of
research and innovation projects (i.e. unexpected scientific results or no results despite
honest effort or the falsification of a scientific hypothesis must not be a reason for not paying
the lump sum).
On this basis, the Commission is reflecting on some pilot actions on output-based lump sum
funding within the last Horizon 2020 work programme (2018-2020), in view of the
preparation of the next R&I Framework Programme.

345
O. ANALYSIS OF THE COMPANIES PARTICIPATING IN HORIZON 2020
A summary of the main findings on companies participating in Horizon 2020 is as follows:
12,324 private for profit companies (PRC) take part in Horizon 2020, making up 62.5
% of all participants (02/2017).
EUR 6.841 billion or 28 % of the total Horizon 2020 granted budget was awarded
to companies (02/2017).
An average Horizon 2020 company has 1,715 employees and EUR 708 million
revenue a year (2014). However, most of the companies have revenue around EUR
4.5 million.
The most frequent Horizon 2020 company was created in 2012 and the average
company in 1997.
The average EC contribution to a unique Horizon 2020 company amounts EUR
555,125. The most frequent grant amounts EUR 50,000.
Bigger companies (in terms of revenues and number of employees) receive larger
grants.
Most of the Horizon 2020 companies are from the Professional, Scientific and
Technical activities sector (33 %), the Manufacturing sector (27 %) and the
Information and communication sector (17 %).
Start-ups: 23 % of Horizon 2020 companies are less than 5 years old.
SMEs: 77 % of Horizon 2020 companies have less than 250 employees and 74 %
have revenues up to EUR 50 million.
More than half of the Horizon 2020 companies come from Germany, Spain, the
United Kingdom, Italy, and France, while Czech Republic, Romania, Estonia,
Slovakia, Cyprus, Bulgaria, Luxemburg, Lithuania, Croatia, Latvia, and Malta
each contribute less than1 %of Horizon 2020 companies.
83 % of companies are from EU15 (89 % of grants), 9 % from EU13 (6 % of
grants) and 8 % from outside EU (5 % of grants).
Horizon 2020 private for profit companies (further referred to as Horizon 2020 companies)
were analysed on their country, age, employment, revenue, and economic sector. For this,
companies from the CORDA database were matched with their data in ORBIS, a database of
company data377
. The analysis is based on 10,128 successful matches for companies in the
28 EU Member States. Since the data on the country of origin and grants originates from
CORDA, non-Member States' participation is included.
As of mid-February 2017, 12,324 unique companies take part in Horizon 2020, making up
62.5 % of all distinct Horizon 2020 participants. 1,848 companies participated in more than
one project. Overall, EUR 6.841 billion or 28 % of total so far granted Horizon 2020 budget
377 Cut-off 16 January 2017. OrbisEurope was used, covering 38 countries: the EU-28 plus countries in Europe that are
associated to Horizon 2020 (such as Norway, Iceland, Switzerland, Turkey). Countries outside Europe, such as Israel, are
not covered in OrbisEurope. For the matching, companies' names were used as an identifier, using the batch search option
of OrbisEurope. Out of the 12,324 companies in Horizon 2020, 10,128 companies were successfully matched to their Orbis
data.

346
went to companies.378
An average grant per company amounts EUR 555,125 and most
frequent amount granted is EUR 50,000, what indicates that the companies frequently obtain
the SME Instrument phase I support.
Figure 94 Horizon 2020 distinct participants by type and EC contributions (N = 19,796)
Source: European Commission, based on Corda data 15/02/2017
O.1. Company sectors by age and grants
Horizon 2020 companies were sorted on their sector, using the main NACE code379
. This
classification comes with a caveat: companies can operate in more than one sector,
especially big companies but also new companies that combine e.g. finance and ICT.
However, it is the only classification available.
Younger Horizon 2020 companies come from more sectors than older ones. Companies set
up since 1990 are active mainly in Professional, scientific and technical activities and
Information and communication, next to Manufacturing sector. Additionally, slowly rising
are Construction, wholesale and retail trade and Administrative sectors. Older companies are
mainly active in Manufacturing. In the last decade, their share has decreased compared to
2000s, while the share of Professional, scientific and technical activities sector and
Information and communication sector stayed relatively unchanged Figure 95.
378 Taking into regard total number of participations rather than distinct participants, companies (PRC) and higher and
secondary education (HES) each represents 33 % of participations, research organisation (REC) 22 %, public bodies (PUB)
6 % and others (OTH) 5 % of participations. 379 NACE 2.0 main sections: the single letter code, as registered in the national registrations used by Orbis.

347
Figure 95 Companies by sector and decade (N = 9,763 companies)
Source: OrbisEurope, Corda16/01/2017.
More than two-thirds of Horizon 2020 companies come from only three sectors – 33 % are
in Professional, scientific and technical activities (e.g. Siemens Healthcare GmbH, Wiener
Stadtwerke Holding, The Vision Belgium, Sol Voltaics, Solar Polar), 27 % are in
Manufacturing (e.g. Daimler, Basf, BMW, Safran, Lithoz GmbH, Adidas, Nokia) and 17 %
in Information and communication (e.g. Deutsche Telekom, Telefonica Sa, Alten
Netherland, Global Robots). The remaining one-third comes from 17 other sectors.
Figure 96 Horizon 2020 companies by sector (N = 9,908 companies)
Source: OrbisEurope, Corda16/01/2017.

348
Figure 97 Professional, scientific and technical activities sector by subsectors(N = 3,020)
Source: OrbisEurope, Corda 11/01/2017.
Figure 98 Manufacturing activities sector by subsectors (N = 1,251)
Source: OrbisEurope, Corda, 11/01/2017.
More than three quarters of the biggest Horizon 2020 sector in terms of number of
companies - Professional, scientific and research activities - consist of scientific research
development, architectural engineering activities and activities of head offices. Veterinary,
legal accounting and advertising present relatively small share of the sector (Figure 97). Out
of the biggest ten grant recipients from the sector, 5 are specialized in technological
innovation, focused on R&D and transformation of industry to 4.0 (Telefonica Investigacion
Y Desarrollo, Philips Electronics Nederland, Innovacio I Recerca Industrial I Sostenible,
Fonroche Geothermie, Marine Current Turbines), while the other five offer consulting,
project management & control services and of special studies (D'appolonia S, Esteyco,
GeoSea, Arttic, Amec Foster Wheeler Energy). Arttic's main activity in preparation of

349
customers' Horizon 2020 roadmaps and has been so far participating in 19 Horizon 2020
projects and received more than EUR 7 million.
The second biggest sector - Manufacturing, is more diverse, although more than half of it
consists of only three subcategories, manufacture of computer, electronic and optical
products, manufacture of machinery and equipment and manufacture of chemicals (Figure
98). The smallest share represents companies producing furniture, petroleum products,
textile and basic metal.
In contrast to manufacturing, the third biggest Horizon 2020 sector - Information and
communication - is less diverse. More than three quarters of companies are in computer
programming consultancy. Since there is no data on subsectors for all Horizon 2020
companies, the three analysed sectors are smaller than their respective shares.
80% of total grants to Horizon 2020 companies go to the three biggest sectors; 30 % to
Professional, Scientific and Technical Activities, 35% to Manufacturing and 16% to
Information and communication sector. The amount of grants awarded to each sector
roughly follows the number of companies: money seems to be not sector-specific (Figure
99). The only slight exceptions are Manufacturing (relatively more money) and Professional,
scientific and technical activities (less). This may be because of equipment costs in
manufacturing and relatively smaller grants to consultancy companies.
Figure 99 Company grants by sector (N = 9,748 companies)
Source: OrbisEurope, Corda, 16/01/2017.
O.2. Company age and grants
The majority (60 %) of companies taking part in Horizon 2020 companies were created after
2000, 27 % after 2010, and 23 % since 2012 (‘start-ups’). The oldest companies were created
well before 1900 (Figure 100). The most frequent Horizon 2020 company was created in
2012. The share of grants roughly corresponds to the share of companies created in each
decade, though the oldest and most established companies get the highest grants, while the

350
average amount decreases for the younger companies. They probably have smaller shares in
the projects.
Figure 100 Companies by decade of incorporation and grants (N = 9,959 companies)
Source: OrbisEurope, Corda16/01/2017.
Figure 101 zooms into the 8,128 companies that were set up in 1990 or later. It shows that
the share of Horizon 2020 companies was more or less increasing since 1990, with the
largest cohort starting in 2010. The cohorts 2015 and 2016 are smaller, since they could not
take part in the first calls of Horizon 2020, but these numbers are expected to go up in the
years to come when more grants are awarded.
Figure 101 Companies by year of incorporation and grants since 1990 (N = 8,128
companies)
Source: OrbisEurope,Corda 16/01/2017.

351
O.3. Company employment and grants
Based on 2014 data, most of Horizon 2020 companies are small in terms of number of
employees: 31 % have 10 or less employees (micro-enterprises), 57 % have 50 or less (small
enterprises) and 67 % have 100 or less employees (Figure 102). This is in line with the
majority of Horizon 2020 companies being young (see section 2 on age). According to the
micro, small and medium size-sized enterprises (SMEs)380
employment criterion of
maximum 250 employees, almost 80 % of Horizon 2020 companies are SMEs. Average
number of employees per Horizon 2020 company is 1,715, most frequent number of
employees being only 1 and median at 31.
Figure 102 Companies by number of employees (N = 6,607 companies)
Source: OrbisEurope,Corda 16/01/2017.
Companies with 250 or less employees represent 77 % of all companies and receive 59 % of
grants. Bigger companies represent 23 % of all Horizon 2020 companies and get more than
41 % of grants. Bigger companies get bigger grants on average (Figure 103).
380 SMEs are identified as having less than 250 employees, a turnover not exceeding € 50 million and/or a balance sheet not
exceeding € 43 million. In addition, in order to assure SMEs' autonomy, not more than 25 % of their capital or voting rights
could be given to partner entities (Council Regulation (EC) No 859/2003 of 14 May 2003).

352
Figure 103 Companies by number of employees and grants (N = 6,738 companies)
Source: OrbisEurope,Corda 16/01/2017.
O.4. Company revenues and grants
Based on 2014 data, 30% of the Horizon 2020 companies have revenues up to EUR 1
million, 58% have revenues up to EUR 10 million and 73% have revenues up to EUR 50
million, the maximum amount for SMEs in the EC definition (the balance sheet and
ownership criteria were not taken into account). Almost a quarter of the Horizon 2020
companies (23%) have revenues higher than EUR 50 million. 4% of the Horizon 2020
companies have revenues higher than EUR 1 billion (Figure 104). The latter is the reason for
the relatively high average revenue of Horizon 2020 companies at EUR 708 million, with
the most companies have revenues of around € 4 million (median at EUR 4.77 million and
mode at € 4.16 million).
74 % of Horizon 2020 SMEs in terms of revenues receive 54% of all grants. 46% of grants
go to larger companies. The participation is the highest among companies with revenues up
to EUR 1 million (30 % of all Horizon 2020 companies that receive 18% of all grants) on
one side and the biggest companies with revenues above EUR 150 million (17% of Horizon
2020 companies that receive 37% of all grants) (Figure 105
Bigger companies
SMEs

353
Figure 104 Companies by revenue (N = 6,222 companies)
Source: OrbisEurope,Corda 16/01/2017.
Figure 105 Companies by revenue and grants (N = 6,222 companies)
Source: OrbisEurope,Corda 16/01/2017.
Many of the Horizon 2020 companies are young. On average, they have a smaller turnover
than older companies (Figure 106).
bigger
companies
SMEs
bigge

354
Figure 106 Companies by decade of incorporation and turnover (N = 6,108 companies)
Source: OrbisEurope,Corda 16/01/2017.
Figure 107 EC contributions to SMEs and bigger companies (N = 5,276 companies)
Source: OrbisEurope, Corda 16/01/2017.
Taking into account both considered SME criteria, revenue and employment, 68% of all
Horizon 2020 companies are SMEs based on 2014 data and receive 49% of all granted EC
contributions to Horizon 2020 companies. Larger companies represent 32% of all Horizon
2020 companies and receive 51% of company contributions. However, if it was possible to

355
apply the rest of the SME criteria, the SME proportion would likely decrease. The average
grant for larger companies is over EUR 1 million and more than twice of an average SME
grant, which is below EUR 0.5 million.
O.5. Companies by Member State
More than half of the Horizon 2020 companies are based in five large countries: DE, ES, IT,
GB and FR. Those countries have each more participant Horizon 2020 companies and
receive greater shares of EC contributions than companies of new Member States put
together. The shares of companies from 10 countries (CZ, RO, EE, SK, CY, BG, LU, LT,
HR, LV and MT) are all lower than 1%. 83% of the Horizon 2020 companies come from
EU15. They receive 89% of the total grant amounts. 9% of the Horizon 2020 companies
come from the new Member States (EU13) and they receive 6% of the grants. 8 % of
Horizon 2020 companies come from outside the EU and receive 5% of total grant amount.
The average grant of the EU15 companies is higher than the average grant of the EU13
companies and companies from outside EU.
Per capita performance could be categorized in four groups (see circles in Figure 108).
Although most Horizon 2020 companies come from EU15 countries, their per capita
performance is rather low. Front-runners from DE, ES, IT, GB, FR and GR are followed by
better per capita performance fast followers from the rest of the EU15 countries (NL, BE,
SE, AT, GR, FI, DK, IE). The best per capita performers are High Fliers: LU (78 Horizon
2020 companies per million citizens) and SI (64), followed by CY (61) and EE (55). The
lowest company participation per capita is in the group of Slow Followers: RO (5), PL (6),
BG (7) and HR (8).
Figure 108 Companies and their grants by Member State (N = 12,410 companies)
Source: European Commission, based on Corda 10/02/2017, Eurostat 03/01/2017.
EU-15 -IE EU-13+
IE
High-Fliers
Former Front-
runners Slow Followers
Fast Followers

356
P. POSITION IN INTERNATIONAL RANKINGS
P.1. Companies
An analysis of 10 international rankings of top performing or innovating companies was
undertaken in order to assess the percentage of those funded by Horizon 2020. The
distinction between those which have headquarters in the EU and those with headquarters
outside the EU was also considered.
The analysis revealed that the majority of the top companies have headquarters outside the
EU, with those participating in Horizon 2020 usually doing so through their subsidiary units
located in the EU.
Figure 109 Best performing companies according to different international rankings,
according to the location of their with headquarters (HQ) within or outside the EU
Source: European Commission services compilation based on published rankings
Concentrating on top companies that benefited from Horizon 2020 reveals a diverse picture
as presented in the following figure.
Figure 110 Best performing companies according to different international rankings,
according to whether they received Horizon 2020 support or not
Source: European Commission services compilation based on published rankings
18
100 91 80
21 30 17 21 16 3
158 9 20
79 70 83 29 34 47
0
50
100
150
200
CB InsightUnicorns
EU R&DScoreboard
DELOITTE 100European fastgrowing techcompanies
WIRED 100Europe'shotteststartups
FORBES 100most
innovativecompanies
IndustrialR&D
InvestmentworldwideScoreboard
THOMSONREUTERS 100
top globalinnovators
EPO top 50European
PatentApplicants
FORTUNE 50most
innovativecompanies
MIT SmartestCompanies
HQ in EU HQ in not in EU
0
64 52 39 3 2 2
38 17 6
176 36 48 61 97 98 98 12 33 44
0
50
100
150
200
CB InsightUnicorns
EU R&DScoreboard
IndustrialR&D
InvestmentworldwideScoreboard
THOMSONREUTERS 100
top globalinnovators
FORBES 100most
innovativecompanies
DELOITTE 100European fastgrowing techcompanies
WIRED 100Europe'shotteststartups
EPO top 50European
PatentApplicants
FORTUNE 50most
innovativecompanies
MIT SmartestCompanies
Horizon 2020 funded Not Horizon 2020 funded

357
Bigger companies and established innovators included in the European Patent Organisation
(EPO), the R&D Scoreboards, and Thomson Reuters top global innovators rankings are
greater beneficiaries of Horizon 2020 funds than younger innovators from the Wired
Europe's hottest start-ups, Deloitte's fastest growing European tech companies, Forbes' most
innovative companies, and CB Insights' Unicorns list.
The top-50 applicants for the European Patent Office often take part in Horizon 2020, with a
large majority of those participating through their divisions inside the EU. For example, the
Japanese Honda Motor participates in Horizon 2020 with its subsidiaries Honda Research
Institute Europe and Honda R&D Europe, both based in Germany. This again shows that
Horizon 2020 attracts frequent participation of non-EU based companies and organisations
often through their EU based subsidiaries and evinces the open innovation nature of the
programme.
As expected, most of the companies in the EU R&D Scoreboard take part in Horizon 2020,
such as Volkswagen, Daimler, Bosch, Sanofi, BMW, Siemens or Philips. Out of those which
are not participating in Horizon 2020, the banking and financial sector is the most
significant.
Wired Europe's hottest start-ups and Deloitte's fastest growing European tech companies
rankings reveal that these companies hardly take part in Horizon 2020. Out of the first
ranking, only two benefited from Horizon 2020 funding thus far: Portugal's Beta-i and
Unbabel. This is underlying the gap in reaching out to these young companies. Additionally,
CB Insight's list of unicorns or young fast growing companies reaching a capitalisation of $1
billion indicates that 18 out of the 176 are EU-based, including names such as Spotify or
Delivery Hero. Yet, no company in this list is currently benefiting from Horizon 2020.
In similar lines, only 12% of the MIT smartest companies and 3% of the Forbes most
innovative companies rankings participate in Horizon 2020, with notable examples such as
Huawei, Toyota, Oxford Nanopore, Movidius, Bosch, IBM, and Intel.
Several of the well-known companies are newcomers to Horizon 2020 and did not
participate in FP7, including: Panasonic, Cisco, Mitsubishi Electric or Caterpillar. Attracting
top performing companies (e.g. 3M Deutschland, Sumitomo, Unbabel, AlphaSense Oy,
Bluelinea, Syngenta, Interdigital or Johnson Controls) demonstrates that Horizon 2020
manages to attract newcomers even from the top companies.
P.2. Universities and research institutions
An analysis of nine international rankings of the best universities and research institutions
was undertaken in order to assess the percentage of those funded by Horizon 2020. The
distinction between those that have headquarters in the EU and those outside was made.
The Shanghai, Leiden International Rankings, QS Top World's Universities and the Times
Higher Education World University rankings show that around a quarter of the worlds' top
universities are based in the EU.

358
Figure 111 Best performing universities according to different international rankings,
according to the location of their with headquarters (HQ) within or outside the EU
Source: European Commission services compilation based on published rankings, Cut-off date: 01/11/2016.
All rankings represent their latest version by this date
As shown in the figure below, almost all of EU-based top universities participate in Horizon
2020. Among the top performing non-EU universities, more than half of them are also
participating in Horizon 2020. Even though Horizon 2020 already includes a significant base
of excellent universities worldwide, there are also newcomers to Horizon 2020, which did
not participate in FP7, the most notable example being the New York University or the
University of Utah.
Looking specifically at the participation in Horizon 2020 of the World's Most Innovative
Research Institutions, 8 out of the 25 top research institutions (32%) are based in the EU,
including the world's top 2: the Alternative Energies and Atomic Energy Commission in
France and the Fraunhofer Society in Germany. Almost all European institutions ranked here
take part in Horizon 2020, as do a third of the world's best research institutions which are not
based in the EU, such as Korea's Institute of Science & Technology, RIKEN - Japan's largest
comprehensive research institution and the Russian Academy of Science.
Figure 112 Best performing universities according to different international rankings,
according to whether they received Horizon 2020 support or not
Source: European Commission services compilation based on published rankings; Cut-off date: 01/11/2016.
All rankings represent their latest version by this date
95 91 93 90
35 30 24 22 8
5 9 7 8
65 70 76 78
17
0
20
40
60
80
100
REUTERSEurope's Most
InnovativeUniversities
Times HigherEducationEuropeanUniversityRankings
LEIDENEuropeanRankings
QS TopEuropean
UniversitiesRankings
Times HigherEducation
WorldUniversityRankings
QS Top World'sUniversities
Rankings
Shanghairankings
LEIDENInternational
Rankings
World's 25most
InnovativeResearch
Institutions
HQ in EU HQ in not in EU
100 99 97 92 73 72 68 63
13
1 3 8 27 28 32 37
12
0
20
40
60
80
100
REUTERSEurope's Most
InnovativeUniversities
Times HigherEducationEuropeanUniversityRankings
QS TopEuropean
UniversitiesRankings
LEIDENEuropeanRankings
Times HigherEducation
WorldUniversityRankings
QS Top World'sUniversities
Rankings
LEIDENInternational
Rankings
Shanghairankings
World's 25most
InnovativeResearch
Institutions
Horizon 2020 funded Not Horizon 2020 funded

359
Q. PARTICIPATION PATTERNS AND BALANCE BETWEEN LARGE AND SMALL PROJECTS
Q.1. Introduction and background
This Annex provides an overview of two methods developed by the Commission (DG RTD)
to assess participation patterns in large versus small projects in Horizon 2020 and their
findings.
This analysis is conducted as a result of the Regulation establishing Horizon 2020 (Recital
23) and the Council Decision establishing the Specific Programme implementing Horizon
2020 (Recital 13) stating that there should be an appropriate balance between small and large
projects, notably within the priority "Societal challenges" and the specific objective "LEIT".
However, the definitions of ‘project size’ as well as definition of ‘appropriate balance’ were
not spelled out.
A previous study looking into the optimal project size conducted under FP7381
concluded
there is no optimal size for collaborative research projects to maximise their impact and
"finding an ideal number of participants, disciplines, sectors, NUTS 3 regions or countries is
elusive". The appropriate balance between large and small projects is also a continuous
priority of the European Parliament382
. Yet, based on their analysis383
, there are currently no
bottlenecks in terms of programme implementation in relation to project size (a EUR 5
million threshold was used for the assessment).
However, based on results of the stakeholder consultation carried out for the interim
evaluation of Horizon 2020, stakeholders seem to support the concept of the need for an
appropriate balance within the programme. Respondents noted that the balance between
small and large projects in calls for proposals is “good” or “very good” (57%), whereas 24%
foundnd it poor or very poor. In their open comments, some respondents asked for more
opportunities for small projects. Others commented in their position papers that a better
balance between small, medium and large projects should be achieved. In particular it was
mentioned that the effectiveness of very large size consortia should be reviewed while at the
same time smaller projects were argued to allow for higher participation of SMEs and
newcomers.
Given the complexity of the issue, two separate analysis were undertaken by Commission
services (DG RTD) in the framework of the interim evaluation of Horizon 2020. The
methods and results are presented in the sections below.
Q.2. Analysis 1 – Descriptive overview of participation in different-size projects
based on budget data
Key finding: Entities from EU-13 countries participate more in larger projects (i.e. projects
above EUR 5 million), but coordinate very small projects (i.e. project below EUR 200,000).
381 European Commission, DG-RTD, Study on Network Analysis of the 7th Framework Programme Participation, 2015,
p.118
https://ec.europa.eu/research/evaluations/pdf/archive/other_reports_studies_and_documents/network_analysis_of_fp7_parti
cipation_-_final_report.pdf 382 European Parliament, Scrutiny in Horizon 2020 focusing on the European Parliament's priorities, 2016, 383 Ibid, p. 17

360
The current funding going towards entities from EU-13 countries is spread between very
large projects (i.e. above EUR 5 million) and very small projects (i.e. below EUR 200,000).
Scope of the analysis: The analysis was carried out on all actions related to "Societal
challenges" and "LEIT". The analysis does not make a comparison with FP7.
Identification of threshold for large and small projects: A threshold was not identified.
Instead, the project size was analysed based on six budget categories (from EUR 1 – 0.2
million to EUR 10+ million).
Analysis: In terms of budget, a disproportionate share of funding went to projects larger than
EUR 5 million (92% of the total budget). The budget and grant allocation to projects below
EUR 5 million is relatively low.
The highest share of entities from EU-13 countries participate and receive EC contribution
from larger projects (projects above EUR 5 million). However, when looking at the
participation of entities from EU-13 countries within different project sizes, these seem to
coordinate and lead more if projects are smaller (but the current sample size is too low to
draw conclusions). At the same time, EU-13 entities seem to participate best in the EUR 1 –
5 million bracket. The share of EU-13 participants is significantly higher than in other
brackets and there is no significant differences between the share of participation in very
small projects under EUR 1 million or very big projects above EUR 5 million.
Figure 113 Project size (budget) and participation of EU13 (%)
Source: European Commission, DG RTD/A5 based on CORDA data extracted on 1.1.17

361
Figure 114 Share of total EU13 coordinators, grants, participants and EC Contribution
by project size
Source: European Commission, DG RTD/A5 based on CORDA data extracted on 1.1.17
Q.3. Analysis 2 – Composite threshold and comparison Horizon 2020 - FP7
Key finding: The share of participants from EU-13 countries and of newcomers is higher in
large than in small projects. There is a more balanced situation between large and small
projects in Horizon 2020 if compared to FP7 in terms of number of proposals, EC
contribution and number of participants.
Scope of analysis: The analysis was carried out only on 'Research and Innovation Actions'
and 'Innovation Actions' in LEIT and in three Societal Challenges of Horizon 2020. For FP7,
only collaborative projects in any priority where included in the analysis.
Identification of threshold: The identification of small or large projects was based on the
number of participants. The number of participants in each project was normalised by EUR
million of EC contribution to allow for comparisons between types of action and with FP7.
For each type of action or instrument, the average was estimated on the normalised number
of participants. If the number in a project was below or equal to the average, the project was
considered "small", if it was above the average, the project was considered "large".
Table 77 Ratio between large and small projects (1= perfect balance)
Average number of participants by EUR million
Horizon 2020 - Innovation actions 3.1
Horizon 2020 - Research and Innovation actions 2.93
FP7 - Collaborative Projects 3.6
Source: European Commission, DG RTD/A5 based on CORDA data extracted on 11.8.16

362
Identification of an appropriate balance: Based on the definition of the thresholds, the
method identified the appropriate balance both in terms of ratio between large and small
projects384
and in terms of ratio between the normalised number of participations in large
and small projects385
. A value that is close to 1 indicates that there is approximately the same
number of projects or participations between large and small projects. The same reasoning
was applied in other variables, such as a differentiation between different Societal
Challenges and LEIT areas, differences among country groups, newcomer participations, etc.
Analysis: The situation in Horizon 2020 both at aggregated and disaggregated level per
programme part takes into account that the overall average size of projects is 2.5 participants
per EUR million. At aggregated level, the balance between large and small projects tends
slightly towards a higher number of large projects compared to small projects: as a result, the
number of participations in large projects is 40% higher than in small projects.
Table 78 Ratio between large and small projects (1= perfect balance)
Programme
Part
Nr
Large
Projects
Nr of
Small
Projects
Ratio
Large vs
Small
Projects
Nr of
Participations
in Large
Projects
Nr of
Participations
in Small
Projects
Ratio
Participations
in Large vs
Small
Projects
LEIT-ICT 280 261 1,1 3.087 2.689 1,1
LEIT-NMBP 86 142 0,6 1.393 1.673 0,8
LEI-SPACE 101 20 5,1 822 140 5,9
SC1 88 150 0,6 1.368 1.633 0,8
SC2 81 28 2,9 1.600 369 4,3
SC3 93 109 0,9 1.132 1.531 0,7
SC4 200 126 1,6 2.116 1.279 1,7
SC5 66 40 1,7 1.326 556 2,4
SC6 84 4 21,0 955 26 36,7
SC7 50 24 2,1 760 276 2,8
Total 1.129 904 1,2 14.559 10.172 1,4
Source: European Commission, DG RTD/A5 based on CORDA data extracted on 11.8.16
Nonetheless, it can be observed that certain programme parts have ratio values that deviate
significantly from a perfect balance (value of 1). In LEIT-Space, for instance, large projects
account for more than five times the number of small projects and for six times in terms of
number of participations. In Societal Challenge 2, the number of large projects is almost
three times as big as the number of small projects and the number of participations in large
projects is more than four times higher than those in small projects.
In LEIT-Space, this deviation from the balance is explained by the fact that projects under
this programme part tend to be carried out in relatively small consortia in term of
participants (numerator) with high project costs (denominator). Despite the relative low
number of small projects, these account for 60% of the LEIT-Space budget.
384 A ratio above 1 implies that more large than small projects were financed; conversely a ratio below 1 indicate that more
small projects than large were financed. 385 If the ratio between the weighted number of participants is above 1, this implies that there is a predominance of
participants in large projects; whilst the opposite (a ratio below 1) implies a predominance of participants in small projects.

363
Results show a more balanced situation between large and small projects in Horizon 2020 in
case of Research and Innovation actions than in FP7 collaborative projects in terms of
number of proposals, EC contribution and number of participants. The share of participants
from EU-13 and newcomers is higher in large than in small projects. The following tables
summarize the results in more details.
Table 79 Ratio between large and small projects (1= perfect balance)
Number
of
proposals
EC
contribution
Number of
participants
Share of
participants
from EU-13
Share of
participants which
are newcomers
Horizon 2020 -
Innovation actions
0.54 0.22 0.50 1.21 1.13
Horizon 2020 -
Research and
Innovation actions
0.59 0.38 0.77 1.73 1.20
FP7 - Collaborative
Projects
0.58 0.31 0.68 1.46 N/A
Source: RTD/A5 based on CORDA data extracted on 11.8.16
Type of
project
Catego
ry
Number
of
projects
Total EC
contribution in
EUR
Particip
ants
EU
13
Share
EU13
New
comers
Share
Newcom
ers
FP7 -
Collaborative
Projects
Large 2204 5,880,664,597 29056 2281 7.9% N/A
Small 3794 18,776,147,693 42808 2295 5.4% N/A
Horizon 2020
- Research
and
Innovation
actions
Large 527 1,943,476,742 7894 751 9.5% 1561 19.8%
Small 899 5,120,568,745 10207 561.
0
5.5% 1676 16.4%
Horizon 2020
- Innovation
actions
Large 201 542,737,120 2290 181 7.9% 797 34.8%
Small 371 2,420,000,653 4618 302 6.5% 1424 30.8%
Source: European Commission, DG RTD/A5 based on CORDA data extracted on 11.8.16

364
R. HORIZON 2020 NETWORKS - COUNTRIES AND GATEWAYS FOR NEWCOMERS
R.1. Trans-national collaboration in projects
The figure below showcases Horizon 2020 cooperation networks between countries based on
the number of collaborative projects they participate in. The size of each node represents the
collaborative projects of a country with each link, or edge, indicating that partners from the
two countries have collaborated on one or more projects.
This figure shows a centralisation around larger and older Member States such as the United
Kingdom, Germany, Spain, Italy and France, with Third Countries and newer Member
States in the periphery of the network. The figure includes countries with over 20 projects
and over 20 collaborations.
Figure 115 Collaborative Horizon 2020 networks between countries based on projects’
participations
Source: JRC Technology Innovation Monitoring. Cut-off date: 01/01/2017
This is consistent with the measures of centrality386
by country group, as can be seen from
the below figures, where EU-15 countries are overall more central than other countries in the
network of FP7 and Horizon 2020 projects. EU-13 countries and associated countries are
386 Eigencentrality measures the extent to which a node is connected to important nodes in the network. Closeness centrality
provides an average closeness measure to other nodes based on minimum path length between nodes.

365
more or less equivalent in terms of centrality, with very large difference in the group of
associated countries, in which Switzerland is as central as most EU-15 countries for
example.
Figure 116 Average eigencentrality by country group in FP7 and Horizon 2020, based
on projects’ participations
Source: European Commission – DG RTD
Figure 117 Average closeness centrality by country group in FP7 and Horizon 2020,
based on projects’ participations
Source: European Commission – DG RTD
There is no significant change from FP7 to Horizon 2020 in terms of average centrality of
the country groups.
The rate of collaboration with EU-13 countries is similar for all EU-15 countries, with an
average of 9% of international collaborations of EU-15 countries performed with EU-13
LU
LU
MT EE
BA
AL BN GT
FR,DE UK,IT
HU PL
CH CH
IN US
0.00
0.20
0.40
0.60
0.80
1.00
1.20
FP7 H2020 FP7 H2020 FP7 H2020 FP7 H2020
EU15 EU13 Ass.coun. Third coun.
Min to Max range Average centrality of countries
LU LU
MT EE BA AL
BN LS
FR UK
HU PL CH CH
IN US
0.00
0.10
0.20
0.30
0.40
0.50
0.60
0.70
0.80
0.90
1.00
FP7 H2020 FP7 H2020 FP7 H2020 FP7 H2020
EU15 EU13 Ass.coun. Third coun.
Min to Max range Average centrality of countries

366
countries. On the other hand, 74% of the total collaborations of EU-13 countries is
performed with EU-15.
Table 80 Share of co-participations in Horizon 2020 projects
EU-15 EU-13 Associated countries Third countries Total
EU-15 77% 9% 11% 4% 100%
EU-13 74% 11% 12% 3% 100%
Associated countries 77% 10% 9% 5% 100%
Third countries 65% 6% 12% 18% 100%
All 76% 9% 11% 4% 100%
Source: European Commission – DG RTD
R.2. Geographic collaboration networks in publications from the Framework
Programmes
Co-publications in Horizon 2020 are strongly dominated by international collaborations.
Figure 118Error! Reference source not found. presents the shares of publications from
Horizon 2020 by collaboration type and by geographical group.
Shares of single-authored publications are low (just under 3%) for each group of countries.
Collaborations within the same institution range from 0.9% for Japan to 22% for EU-28.
Collaboration shares between EU-28 countries and between EU-13 countries are high.
For non-EU groups, third countries and associated countries, the share of collaborations with
partners outside their country group is very high with over 80% of all publications.
Figure 118 Horizon 2020 share of publications by collaboration type and by
geographical group
Source: Elsevier, based on Scopus
EU28 EU15 EU13 AC TC CHN KOR JPN USA
single author 2.5% 2.4% 2.8% 0.5% 0.5% 1.7% 0.0% 0.0% 0.2%
collaboration within same institution
only22.1% 21.2% 14.6% 12.8% 2.4% 6.9% 2.8% 0.9% 1.8%
collaboration with other institutions in
the same country group40.9% 36.5% 9.4% 5.4% 2.6% 4.0% 0.0% 3.7% 0.7%
collaboration with partners outside
country group34.4% 40.0% 73.3% 81.2% 94.5% 87.3% 97.2% 95.4% 97.4%
0%
20%
40%
60%
80%
100%
120%
Sh
are
of
Hori
zon
20
20
pu
bli
cati
on
s

367
Collaborations between the EU-28 geographical group and countries around the world are
shown in the network map in Error! Reference source not found.. To draw attention to
ntities that collaborate frequently and repeatedly with the same partners, nodes are coloured
to represent these clusters. Clusters are designated algorithmically. The degree of the nodes,
that is to say the number of links from or to a node, and the volume of these links, generally
indicated by the thickness of the links, are used to calculate which nodes show historically
strong grouping characteristics.387
The EU 28 group is very central with its core
collaborators in close proximity. Many countries appear to collaborate in publications with
only authors in the same country and in EU-28 countries. These countries are shown as the
single-linked nodes in the top left of the figure. The most frequent collaborations occur
between the EU-28, the US, Japan, Canada, China, Russia and Switzerland.
Figure 119 FP7-funded collaborations between EU-28 geographical group and non-EU-
28 countries, 2007-2016
Source: Scopus. Node colour is determined algorithmically to designate clusters. Nodes that have similar
collaboration patterns and volume of collaborations have the same colour. Node size is number of FP7
publications. Edge thickness is number of collaboration publications between entities. Collaborations with less
than 100 publications have been removed to improve readability
Collaboration patterns for Horizon 2020-funded research occurs in a different pattern to
FP7-funded research. This, however, is likely due to the lower number of publications in
general so far from Horizon 2020. The network map of Horizon 2020-funded collaborations
between the EU-28 group and non-EU-28 countries is presented in Error! Reference source
ot found.. As with FP7-funded collaborations, the most frequent collaborations occur
387 The mechanics and process of the clustering algorithm can be found in ‘Fast unfolding of communities in large
networks’, Vincent D Blondel, Jean-Loup Guillaume, Renaud Lambiotte, Etienne Lefebvre, Journal of Statistical
Mechanics: Theory and Experiment 2008 (10), P10008 (12pp).

368
between the EU-28, the US, Japan, Canada, China, Russia and Switzerland. More noticeable
in this network map is the prominent role that the US has in collaborations with the EU-28.
Figure 120 Horizon 2020-funded collaborations between EU-28 geographical group
and non-EU-28 countries, 2015-2016
Source: Scopus. Node colour is determined algorithmically to designate clusters. Nodes that have similar
collaborations and volume of collaborations have the same colour. Node size is number of Horizon 2020
publications. Edge thickness is number of collaboration publications between entities. Edge labels are number
of collaborations
The intra-EU-28 collaborations for FP7-funded publications are shown in Error! Reference
ource not found.Error! Reference source not found.. For clarity, only collaborations with
more than 100 publications are shown. The most frequent collaborations occur between the
larger and more R&D-intensive countries. Collaboration frequencies are highest between
these countries, but the smaller research nations do collaborate often with each other and
with at least one of the R&D-intensive nations. The UK, Netherlands and Germany form one
cluster of countries, and Spain, Italy and France form another cluster. Two smaller clusters
can be identified: a first one with the Nordic countries, Belgium and Ireland, and a second
one with eastern European countries.

369
Figure 121 FP7-funded intra-EU-28 collaboration, 2007-2016
Source: Scopus. Node colour is determined algorithmically to designate clusters. Nodes that have similar
collaborations and volume of collaborations have the same colour. Node size is number of FP7 publications.
Edge thickness is number of collaboration publications between entities. Collaborations with less than 100
publications have been removed to improve readability. LV, MT and LU have less than 100 collaboration
publications with any one partner
Error! Reference source not found.Error! Reference source not found. presents the
rizon 2020-funded intra-collaboration map of EU-28 countries. For this figure,
collaborations with less than 100 publications are also shown. The position of the nodes is
the same as in Error! Reference source not found. to facilitate the comparison between the
wo Framework Programmes. However, the clusters identified in both figures are different.
Belgium and France are now part of the same cluster as Germany, the Netherlands and the
UK. Spain and Italy remain together in a cluster that now also includes smaller countries.
While the Nordics and Ireland formed their own distinct cluster in FP7, they are now joined
by several eastern European countries.

370
Figure 122 Horizon 2020 intra-EU-28 collaboration, 2015-2016
Source: Scopus. Node colour is determined algorithmically to designate clusters. Nodes that have similar
collaborations and volume of collaborations have the same colour. Node size is number of Horizon 2020
publications. Edge thickness is number of collaboration publications between entities. Node position has been
preserved between this figure and Figure 4.2 to compare FP7 and Horizon 2020 collaborations. MT has no
Horizon 2020 collaborations with any other EU-28 member.
R.3. Analysis of newcomers to the Framework Programme
The purpose of this analysis is to examine how newcomers (defined as participants in
Horizon 2020 that did not participate in FP7) are integrated in Horizon 2020 and which are
the main knowledge brokers they use in order to enter the network.
R.3.1. Main groups of newcomers
Given the increased accent on open innovation in Horizon 2020, almost three quarters (73%)
of the newcomers are private firms according to Corda data. Other institutions represent
12%, while Public bodies account for 8%. With respect to Research Organisations and the
Higher and Secondary Education Sector, these represent barely 7% of participations
altogether.
Out of all the groups of newcomers (defined by the type of institution and country)
registering more than 100 collaborative projects, all of them are companies. Spanish
newcomer companies collaborate the most (662 projects), followed by German (621
projects) and British ones (612 projects). There is one EU-13 representative in this top 100,
namely Polish newcomer companies (113 projects). Swiss newcomer companies are outside
the top (85 collaborative projects).

371
The EU-13 Members States account for a much higher share of participations in
collaborative projects (11%) in terms of newcomers than in terms of returning participants
(3%). This suggests that the Framework Programme is opening up the "clubs", with EU-13
entities recording a significant increase in terms of new participants. To a lesser degree, the
same applies for Associated and Third Countries.
Figure 123 Geographical distribution of participations in collaborative projects
Source: European Commission – DG RTD
R.3.2. Main collaborations of newcomers
The majority of collaborations involving newcomers occur between companies and different
types of institutions. Most of the collaborations involving the largest categories of
newcomers (based on institutional and geographic distribution) occur between the
newcomers and returning participants from the same country.
Only few of the most frequent types of collaborations involving newcomers in Horizon 2020
are trans-national and 4 of them involve German newcomer companies which collaborate
with British (174 projects) and Italian (127 projects) universities, Spanish research
organisations (131 projects) and French companies (124 projects). Other frequent trans-
national collaborations involving newcomers are between Spanish newcomer companies and
British universities (133 projects), between British newcomer companies and German
companies (123 projects) and between British newcomer companies and German research
centers (120 projects).
92%
80%
3%
11%
3%
5%
1%
3%
Returningparticipants
Newcomers
EU-15 EU-13 Associated countries Third countries

372
Figure 124 Most frequent types of collaborations involving newcomers in Horizon 2020
Source: JRC Technology Innovation Monitoring. Cut-off date: 01/01/2017, Graph: European Commission –
DG RTD, Note: PRC stands for Private for profit, HES for Higher and secondary education and REC for
Research organisations. Categories of returning participants and newcomers are shown respectively in violet
and green
Though British universities typically act as the main knowledge brokers, the situation is very
different when looking at EU-13 newcomer patterns. We observe that the main collaborators
for EU-13 newcomers are companies (in 9 out of 13 countries), without any clear gateway
(albeit a slight propensity for collaborating with Spanish companies).
Figure 125 Top Horizon 2020 collaborators for EU-13 Newcomers
Source: JRC Technology Innovation Monitoring. Cut-off date: 01/01/2017, Graph: European Commission –
DG RTD, Note: PRC stands for Private for profit, HES for Higher and secondary education and REC for
Research organisations
0
10
20
30
40
50
IT -PRC
ES -PRC
DE -REC
DE -PRC
ES -PRC
ES -PRC
FR -PRC
ES -REC
PT -PRC
BE -REC
GB -PRC
EL -HES
RO
BG HR
PL
HU CZ
SK SI
LV
LT
MT
CY
Nu
mb
er
of
colla
bo
rati
ve
pro
ject
s
Main collaborator

373
In order to study the gateways used by new Member States to enter in Horizon 2020, EU-13
newcomers were analysed separately by type of institution to determine the dependency of
participants from EU-13 countries on established players.
Firstly, the relationship between academia in EU-13 countries and different institution types
was investigated. Universities from EU-13 countries collaborate the most with British
universities, with 10 countries out of 13 Member States having as their main academic
collaborator the British academic sector. On the other hand, universities from EU-13
countries have a slight propensity for collaborating with both German research organisations
as well as private firms, with universities from 7 out of 13 countries preferring Germany as
their main research organisation partner or company partner
Figure 126 Main collaborators in Horizon 2020 for each EU-13 higher education sector
by types of institutions
Source: JRC Technology Innovation Monitoring. Cut-off date: 01/01/2017, Graph: European Commission –
DG RTD, Note: PRC stands for Private for profit, HES for Higher and secondary education and REC for
Research organisations
Secondly, the relationship between the research sector (excluding education) in EU-13
countries and different institution types was investigated. Research organisations from EU13
countries exhibit a systematic pattern of collaborating mainly with British universities (9 out
of 13 countries), German research organisations (10 out of 13 countries) and with French
companies (6 out of 13 countries).
DE
GB IT
GB
GB
GB
GB
GB
GB DE
GB GB
GB
DE ES ES
FR
DE
DE
DE ES
DE DE
DE IT
IT NL
DE
DE
DE
ES
DE
DE DE
FR DE IT FR
CY
0
10
20
30
40
50
60
70
80
90
100
RO BG HR PL HU CZ SK SI LV LT ET MT CY
Nu
mb
er
of
colla
bo
rati
ve p
roje
ctS
Higher education sector of EU-13 countries
HES
REC
PRC

374
Figure 127 Main collaborators in Horizon 2020 for each EU-13 research organisation
sector by types of institutions
Source: JRC Technology Innovation Monitoring. Cut-off date: 01/01/2017, Graph: European Commission –
DG RTD, Note: PRC stands for Private for profit, HES for Higher and secondary education and REC for
Research organisations
Thirdly, the relationship between the private-for-profit sector in EU-13 countries and
different institution types was examined. British universities are the first academic partner of
private firms from EU-13 countries, with the private firms sector of 9 countries out of 13
having as their main academic collaborator British universities.
Private firms from EU-13 countries present a more heterogeneous pattern of collaborations
with other companies without a clear hub of partner countries.
Figure 128 Main collaborators in Horizon 2020 for each EU-13 private-for-profit sector
by types of institutions
Source: JRC Technology Innovation Monitoring. Cut-off date: 01/01/2017, Graph: European Commission –
DG RTD, Note: PRC stands for Private for profit, HES for Higher and secondary education and REC for
Research organisations
GB
GB
GB
GB
GB
GB
GB
GB
IT DE
IT LT
DE
DE
DE
DE
DE
DE
ES
DE
DE DE
MT
FR
FR
DE
FR
FR
DE
SK
DE
DE FR
IT FR
0
10
20
30
40
50
60
70
RO BG HR PL HU CZ SK SI LV LT MT CY
Nu
mb
er
of
colla
bo
rati
ve p
roje
ctS
Research organisations of EU-13 countries
HES
REC
PRC
GB
GB
GB
GB
GB
GB
DE
GB
IT DE
IT GB
GB DE, ES
DE, ES
ES
DE
DE DE
DE, ES
ES
FR DE DE,
ES
DE
IT, DE
ES
GB
DE
IT
DE
IT
ES
DE DE
IT/ES
IT, FR
ES
0
10
20
30
40
50
60
70
RO BG HR PL HU CZ SK SI LV LT ET MT CY
Nu
mb
er
of
colla
bo
rati
ve p
roje
ctS
Private-for-profit sector of EU-13 countries
HES
REC
PRC
Top Related
Copyright © 2022 FDOKUMEN

