


Bahasa
Halaman
Hukum


Analysis of Exchange Rate Movements:A Case Study of Singapore
Alisan Chia&
John G Bauer
Nanyang Business School, Nanyang Technological University, Nanyang Avenue, Singapore 2263Fax: +(65) 792.4217, Tel: +(65) 799.5676, Email: [email protected]
Abstract This study provides a holistic perspective of Singapore’s exchange rate determination byintegrating theory, econometrics and institutional realities. We show how external conditions, economicfundamentals and MAS intervention have affected the Singapore dollar. Because the Singapore dollar isstrongly managed, it is difficult to forecast exchange rate trends using an ARIMA model. Therefore, one hasto turn to more judgmental methods to ‘predict’ exchange rate trends.
1 INTRODUCTIONSingapore is an open economy undergoing intense globalisation, hence an understandingof its exchange rate is important. This study attempts to give a holistic perspective ofSingapore’s exchange rate determination by integrating theory, econometrics andinstitutional realities. It attempts to provide guidance as to what factors need to beconsidered when attempting to understand and forecast Singapore’s exchange rate trends.
Most of the paper focuses on the nominal bilateral US$/Singapore$ exchange rate becausethis is the rate most relevant to businesses. The nominal US$/S$ exchange rate is criticalsince the US is Singapore’s major trading partner. Moreover, this rate is vital to thefinancial sector. Capital flows in and out of Singapore and transactions in the Asian-dollarmarket and Asian-bond market typically involve US dollars.
The period under study is from 1975 to 1994, and the data for the figures presented and forthe econometrics performed are from the International Financial Statistics (IFS). Quarterlydata series are used wherever possible, but we face data constraints as some of the seriesare only available annually.
There is a wealth of literature touching on the different aspects of exchange ratedetermination, and this literature is addressed when relevant in the body of the paper. Webriefly mention here, however, the few sources which are particularly useful. Duc-ThoNguyen and Yao Chye Chiang (1989) demonstrate that a synthesised monetary andportfolio balance model is most suited for Singapore. Hence, we examine the impacts ofthe variables which are pertinent to these models. Also, Abeysinghe and Lee Kok Hong(1992) found that purchasing power parity (PPP) holds for the Singapore to US dollarexchange rate, so an extensive discussion of PPP is also included in the study. PPP iscalculated using the ‘long run averaging’ method based on a paper by Kenichi Ohno(1990).
Our discussion of factors that are difficult to model is culled from various MonetaryAuthority of Singapore (MAS) Annual Reports as well as the volume Public Policies inSingapore edited by Linda Low and Toh Mun Heng (1992). Finally, our regressionanalysis is modeled after Pilbeam (1992).
4 Chia and Bauer
The paper begins with a short summary of the evolution of Singapore’s exchange rateregimes. This is followed by a summary of Singapore’s exchange rate movements duringthe past two decades. Attempts are then made to explain these movements. Explanationsare made by considering time honoured exchange rate theories such as purchasing powerparity. The role of the Monetary Authority of Singapore in influencing exchange ratemovements is also considered. Next the paper looks at the impact external economicconditions have on the exchange rate. Economic fundamentals are also included as part ofthe explanation of Singapore’s exchange rate trends. Finally we attempt to forecast thenominal US$/S$ exchange rate with an ARIMA model.
2 BACKGROUND: EVOLUTION OF SINGAPORE’S EXCHANGE RATEREGIME 1
The fixed exchange rate regime which Singapore chose to adopt after gainingindependence from the British in 1965 was based on previous ties with Britain. Under thissystem the Singapore dollar was pegged to the pound sterling, and this parity to the poundwas maintained through strict exchange controls. Capital flows out of the Sterling AreaCountries/ Scheduled Territories (of which Singapore was a member country) were heavilyregulated.
Parity was maintained until the devaluation of the pound in November 1967. Thisdevaluation prompted the government’s decision to peg the Singapore dollar to the USdollar and gold. In June 1972, following the floating of the pound, the Monetary Authorityof Singapore (MAS) replaced the pound with the US dollar as Singapore’s interventioncurrency (Lim & Associates (1988)).
The year 1973 marked a turning point in the history of Singapore’s exchange rate regime.In February 1973, there was a heavy inflow of US dollars into Singapore. Under the fixedexchange rate regime, Singapore had to mop up this excess of US dollars at the ‘floorrate’. This was equivalent to a devaluation of the Singapore dollar—a devaluation whichleft the country vulnerable to inflation. As a result of this, in June of 1973, MAS made thedecision to replace Singapore’s fixed exchange rate regime with a managed float (Lim &Associates (1988)).
From June 1973 to September 1975, the Singapore dollar was devalued by approximately5.6% against the US dollar. But from September 1975 onwards, the Singapore dollar hasbeen managed by relating it to an undisclosed basket of trade-weighted currencies (withthe weights varying from time to time). MAS keeps the exchange rate within a set targetband by intervening in the foreign exchange market. These interventions are usuallyconducted with US dollars.
In June 1978, Singapore’s exchange controls were ‘completely liberalised’. This move wassparked off by the devaluation of the pound and Singapore’s exclusion from the SterlingArea Countries.
1 Lim Chong Yah and Associates (1988), Chapter 11.
Analysis of Exchange Rate Movements: A Case Study of Singapore 5
3 BRIEF DESCRIPTION OF EXCHANGE RATE TRENDS: NOMINALUS$/S$, REER, NEER, REAL US$/S$
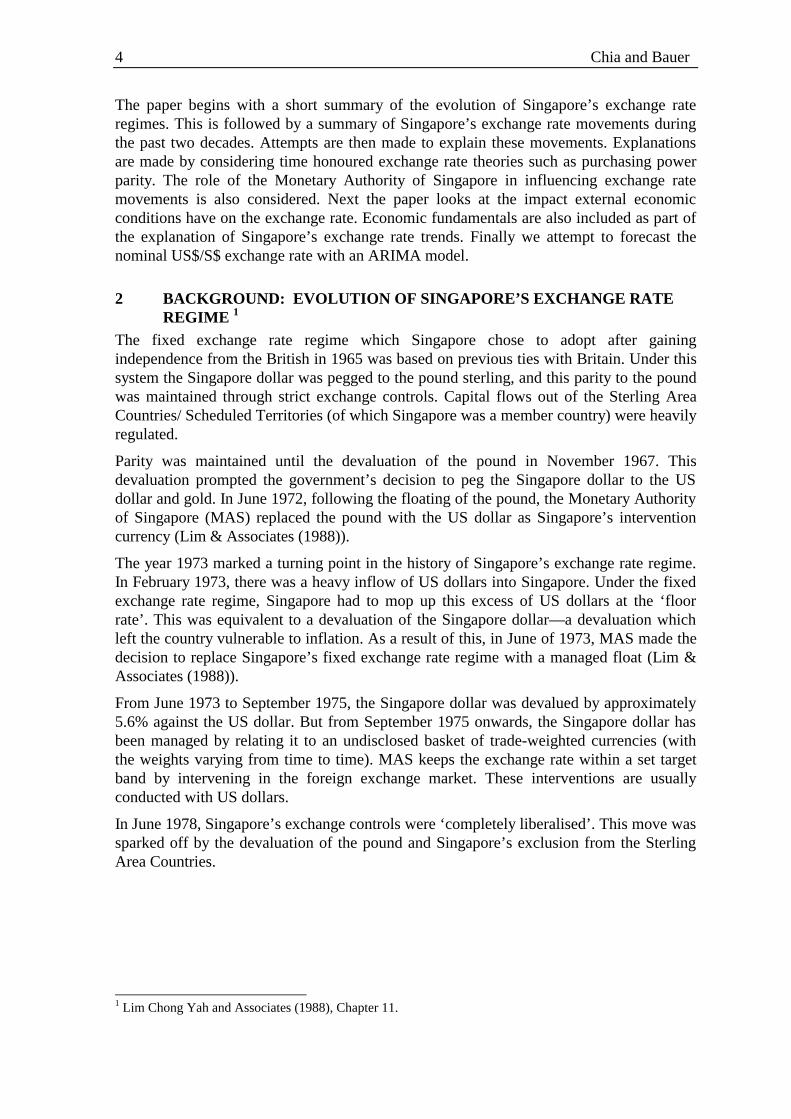
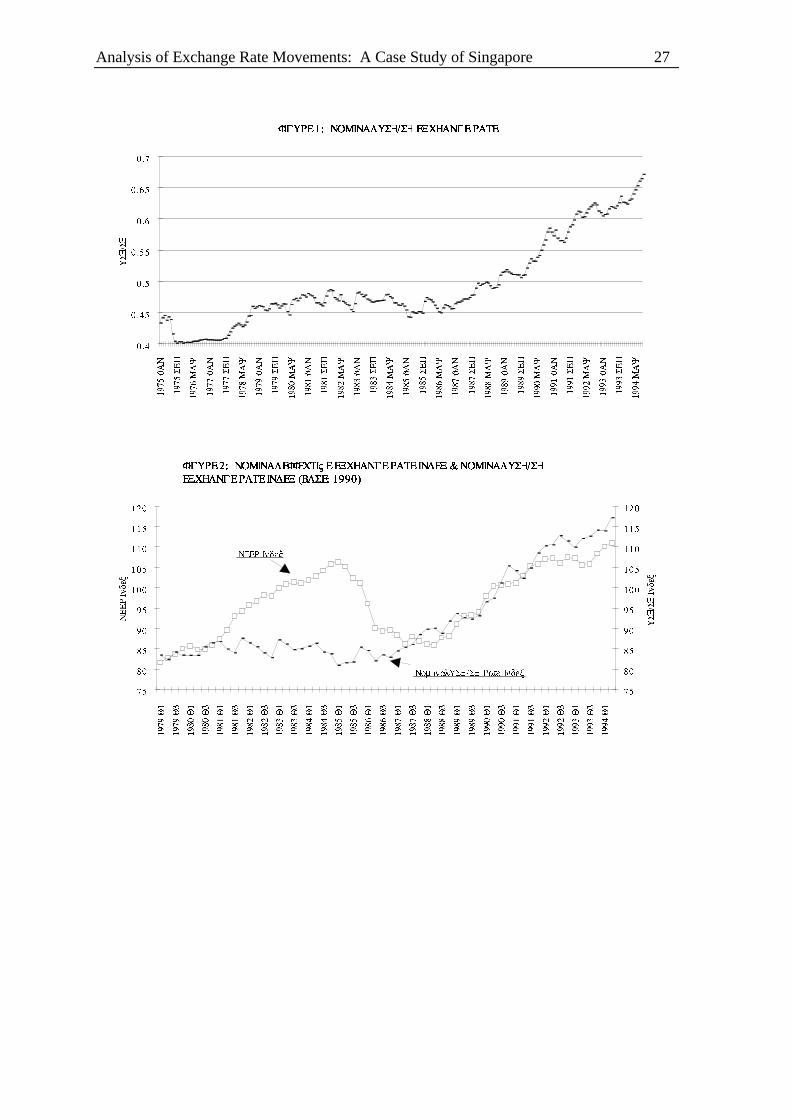
3.1 NOMINAL BILATERAL RATE (US$/S$): FIGURE 1This study focuses on the Singapore-US bilateral exchange rate because the United Statesis a major trading partner of Singapore. Moreover the US$/S$ rate is critical to thefinancial sector, since capital flows in and out of Singapore and transactions in the Asian-dollar market and Asian-bond markets typically involve US dollars. MAS intervention inthe foreign exchange market is also carried out with US dollars.
3.1.1 Trends in Exchange Rate
The US$/S$ exchange rate was stable from the beginning of 1975 through mid-1975(Figure 1).2 This was followed by a depreciation in the middle of 1975. After which therewas relative stability until 1977. An appreciation of approximately 10% was recordedbetween September 1977 to the January of 1979. The period from 1979 to 1986 wascharacterised by slight fluctuations within the band of 0.45 to 0.48. Appreciation beganagain in earnest from January 1987, and this rise of the Singapore dollar has continued tothe present.
3.1.2 Points of Interest
An analysis of the US$/S$ exchange rate should, therefore, explain three things. First, isthe appreciation of the Singapore dollar during 1977 and 1978. Second, is the strong andsteady appreciation since 1987, and third are the fluctuations (within the band of 0.45 -0.48) of the exchange rate from 1979 to 1986. These fluctuations are of particular interestbecause the US dollar was appreciating during the early 80’s, yet the US$/S$ rate was heldwithin these rather narrow bands.
3.2 REAL EFFECTIVE EXCHANGE RATE (REER)The REER is important because it defines Singapore’s overall competitiveness as affectedby changes in Singapore’s exchange rates with major trading partners as well as relativeprice movements. It is therefore unfortunate that data on the REER is not readily available.Calculation of the REER is not possible given data constraints. Teh Kok Peng andTharman Shanmugaratnam (1992) provide a brief summary of REER estimates. Theseestimates were obtained by deflating the nominal effective exchange rate (NEER) usingunit labour costs, rather than price levels. Their summary suggests that the broad trends inthe REER are similar to those of the NEER, except that the degrees of appreciation/depreciation of the REER are more pronounced.
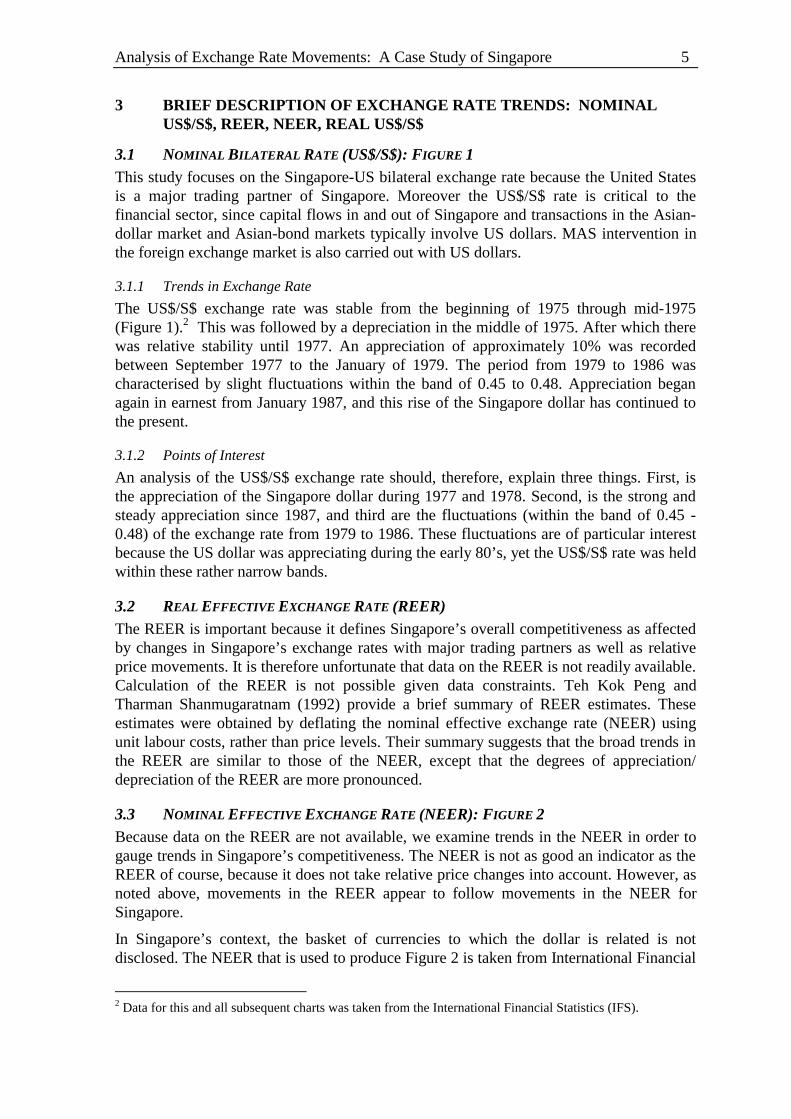
3.3 NOMINAL EFFECTIVE EXCHANGE RATE (NEER): FIGURE 2Because data on the REER are not available, we examine trends in the NEER in order togauge trends in Singapore’s competitiveness. The NEER is not as good an indicator as theREER of course, because it does not take relative price changes into account. However, asnoted above, movements in the REER appear to follow movements in the NEER forSingapore.
In Singapore’s context, the basket of currencies to which the dollar is related is notdisclosed. The NEER that is used to produce Figure 2 is taken from International Financial
2 Data for this and all subsequent charts was taken from the International Financial Statistics (IFS).
6 Chia and Bauer
Statistics (IFS) estimates, rather than the official MAS rate. Figure 2 plots movements inthe NEER and the bilateral US$/S$ rate.
3.3.1 Trends in the Exchange Rate
The NEER began appreciating in the first quarter of 1981 and peaked around the firstquarter of 1985. This was followed by a depreciation that lasted till the end of 1987. Sincethe first quarter of 1987 the appreciation of the NEER has been tracked by an appreciationof the nominal bilateral rate (US$/S$). This indicates the importance of the Singapore-USbilateral exchange rate.
3.3.2 Points of Interest
As noted above, we would expect the NEER and the US$/S$ rate to move togetherbecause of the heavy weight that must be allocated to the US in the basket of currencies onwhich the NEER is based. The divergence between the two rates during the early 1980s,therefore, is of interest. The reason for the divergence must be that the Singapore dollarwas appreciating by more, relative to the other currencies in the basket than to the USdollar. The Singapore dollar did appreciate against the yen during this period. In 1981, forexample, it appreciated by 11% against the yen, whereas it appreciated only 2% against theUS dollar.
The fact that the NEER appreciated strongly during the early 1980’s, while the US$/S$rate remained more stable suggests that the MAS was maintaining some kind of paritywith the US dollar.
In any case, the NEER and the US$/S$ rates converged during 1985-86, and have tendedto move together since 1987. Since 1991, the bilateral rate has appreciated more rapidlythan the NEER. Once again, the explanation for the disparity must be that some othercurrency in the NEER has tempered the appreciation in the US dollar. The yen wasdepreciating against the Singapore dollar from 1992-93. This might have slowed down theappreciation of the NEER.
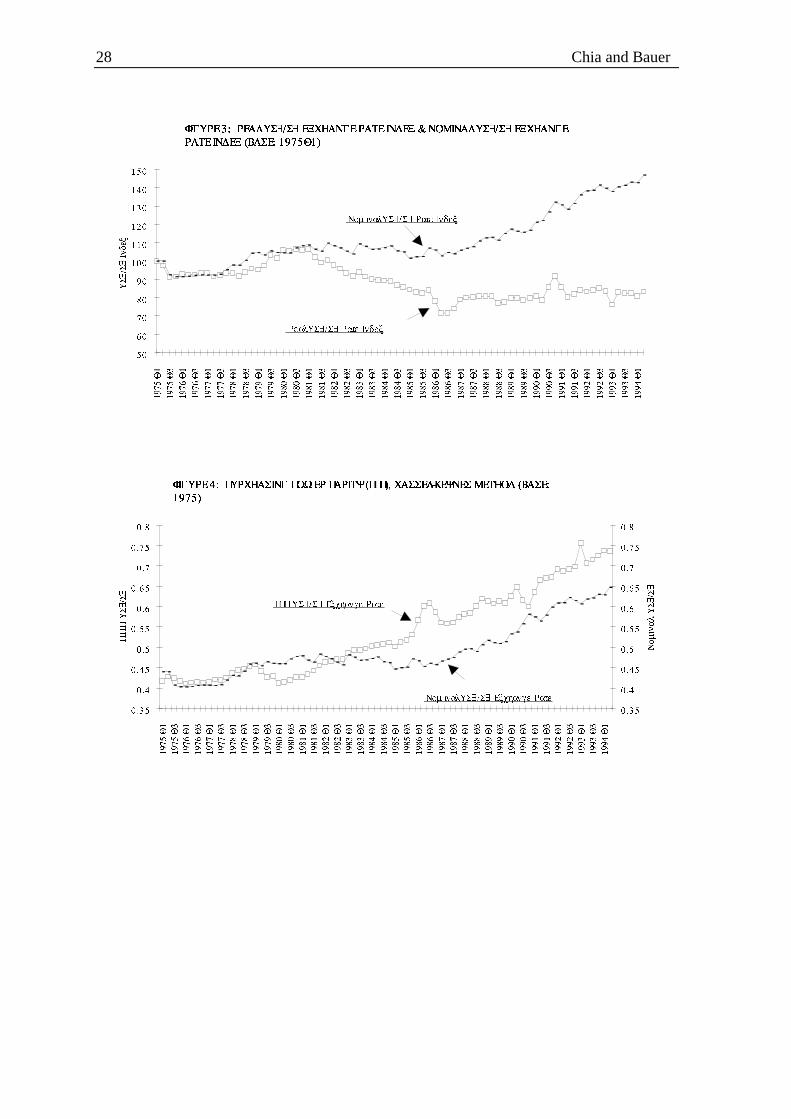
3.4 REAL BILATERAL EXCHANGE RATE (US$/S$): FIGURE 3Because data on the REER are not available we estimate the real bilateral US$/S$ rate anduse it as an indicator of Singapore’s competitiveness. This may be problematic duringperiods when the NEER and the US$/S$ rates diverged (in the early 1980’s), however thisdivergence was temporary. In any case, the real US$/S$ rate is of obvious importancegiven that the US is Singapore’s major trading partner and investor.
3.4.1 Calculation of the Real Bilateral Exchange Rate
The real exchange rate was calculated based on the following equation:
(US$/S$)real = (US$/S$)nominal * [PriceS’pore / PriceUS] (1)
The wholesale price indices (WPI) for the two countries were used, rather than the CPIs,since the WPIs are more pertinent to trade competitiveness.
3.4.2 Trends in the Exchange Rate (Figure 3)
From 1975 to the first quarter of 1981 the nominal and the real bilateral exchange ratestracked each other relatively well. In the period beginning the first quarter of 1981 to thesecond quarter of 1986, the nominal exchange rate was fairly stable while the real bilateral
Analysis of Exchange Rate Movements: A Case Study of Singapore 7
rate fell sharply. Despite the strong appreciation in the nominal rate since the first quarterof 1987, the real bilateral rate has remained fairly stable.
3.4.3 Points of Interest
Deviations of the nominal exchange rate from the real exchange rate can be explained bymovements in relative prices. For instance, the depreciation of the real rate from 1981 Q1to 1986 Q2 was a result of rising prices in the US.
The deviations in the real and the nominal bilateral rates suggest that the nominal bilateralrates do not always determine competitiveness. Although the nominal rate was relativelystable from 1981 Q1 to 1986 Q2, for example, the real exchange rate fell, resulting in anincrease in Singapore’s competitiveness. Also because the real exchange rate has beenstable since 1987, the appreciation of the nominal exchange rate has not erodedSingapore’s competitiveness.
4 THE MONETARY AUTHORITY OF SINGAPORE (MAS)
4.1 BACKGROUND
The Authority was established in January 1971 and serves as Singapore’s central bank.One of its primary objectives is to maintain a reasonably stable exchange rate for non-inflationary economic growth. Prior to 1981, MAS targeted money supply and interestrates to keep inflation at bay. In 1981, however, exchange rate policy replaced monetarypolicy as the Authority’s main anti-inflationary tool (MAS Annual Report, 1981/1982).
Given the Authority’s objective, MAS intervenes in the foreign exchange marketwhenever there is a threat that Singapore’s exchange rate may move out of an undisclosedtarget band. The setting of the target band is subject to policy considerations and notmarket forces. Market forces do, however, play an indirect role in the setting of the band.If the band were set too high, for instance, then Singapore’s exports and investments fromabroad would suffer. Market forces are allowed to prevail within the target band (MASAnnual Report 1984/1985).
In order to understand movements in the Singapore dollar, one must understand theobjectives and actions of the MAS; the following sections provide some relevantbackground.
4.2 COSTS OF INFLATION
The MAS is very much concerned with guarding against inflation, this concern arises forseveral reasons. First of all, inflation is socially divisive because it results in an arbitraryredistribution of income and wealth. Debtors gain as they pay back less in real terms, andcreditors lose out as a result. Individuals drawing a fixed income (e.g.; pensioners) sufferas the purchasing power of the dollar falls. Low income earners who do not make enoughto invest in assets to hedge against inflation also suffer (Teh and Shanmugaratnam (1992)).
Secondly, inflation distorts prices. This leads to economic inefficiency because prices arean integral part of market signaling. Inflation could also lead to more frequent re-negotiation of wages, as workers fight to keep their real wages from falling. Inflation alsomakes investment decisions more difficult. Inflation, especially high rates of inflation,generates a high level of uncertainty in terms of costs and prices. A wage-price spiralmight be sparked off by high rates of inflation as workers bid up wages in anticipation offuture price rises.

8 Chia and Bauer
Thirdly, interest rates will be bid up to compensate for expected inflation. Higher interestrates represent higher investment costs. Also because of the uncertainty of the dollar’svalue investors will opt for short term instead of long term investments. This may lead tolesser income-generating investment and greater investments that yield gains in aninflationary environment (e.g.; property and real estate).
Finally, ‘persistent inflation leads to an overvalued exchange rate’ (MAS Annual Report,1991/1992, p. 18). The real exchange rate is determined by the nominal exchange rate andrelative prices. Hence, inflation leads to an appreciation in the real exchange rate and thisdampens export growth. The currency would then have to be devalued, and this wouldinduce capital outflows and cause a slow down in foreign direct investments. Inflationgenerally results in a loss of confidence in the economy.
4.3 EXCHANGE RATE POLICY AS AN ANTI-INFLATIONARY TOOL
The MAS replaced monetary policy with exchange rate policy as the main anti-inflationarytool (Teh and Shanmugaratnam (1992)). Singapore has virtually no control over capitalflows, because in addition to not having exchange controls, it also has a liberal policytowards foreign direct investment. Moreover, capital movements are very sensitive tointerest differentials, especially to that of the United States.
This makes it difficult for MAS to target the interest rate. Interest rates are largelydetermined by foreign interest rates and expectations of the future appreciation of theSingapore dollar. If the Authority attempts to raise or lower interest rates while worldinterest rates remain unchanged, then capital flows will return interest rates to theiroriginal level. High capital mobility suggests that the MAS can seek to influence either theexchange rate or interest rates, but not both.
It is also difficult for MAS to target money supply. This is because changes in moneysupply are determined mainly by the net flow of funds from accounts from ‘abroad’ (Tehand Shanmugaratnam (1992)). Also, because of Singapore’s ‘openness,’ money supply andinterest rates do not affect price stability as directly as does the exchange rate. In manydeveloped countries interest rates play an important role in determining the level ofinvestment but in Singapore, because of the large external sector, the cost of domesticborrowing is less important. For all these reasons, MAS turned to exchange-rate ‘targeting’as an anti-inflationary tool.
Singapore is a price taker in the international market. It is unable to influence pricesbecause of its small size. This and the country’s heavy reliance on trade makes theeconomy vulnerable to imported inflation. The high import content in Singapore’smanufactured goods makes it especially susceptible to cost-push inflation. Estimates showthat for every 1 percent increase in import prices, Singapore’s consumer price index (CPI)goes up by 0.5 percent (Teh and Shanmugaratnam (1992)). The effect of rising importprices, however, can be offset by allowing the Singapore dollar to strengthen.
The exchange rate also has an impact on internally generated inflation. Because a largeproportion of demand in Singapore is made up of imports, the exchange rate has aconsiderable impact on domestic demand (at least in the short term). By influencingdemand, the exchange rate also influences the demand for resources; in particular thedemand for labour. A weak exchange rate could lead to an overheated economy, and atight labour market, bidding up wages and other costs of production.
Analysis of Exchange Rate Movements: A Case Study of Singapore 9
4.4 THE EXCHANGE RATE & EXPORT COMPETITIVENESS
It would seem that a strong Singapore dollar, while being an anti-inflationary tool mighthurt exports. An appreciation of the exchange rate to offset imported inflation might resultin a loss of competitiveness as Singapore’s exports become relatively more expensive.
The MAS argues, however, that this would only be true in the short run, and that theexchange rate is not a good tool for maintaining export competitiveness (MAS AnnualReport, 1991/1992, p. 3). Consider a depreciation of the Singapore dollar. In the short runSingapore’s exports become cheaper since relative unit labour costs are cheaper. However,Singapore’s exports have a high import content, and the cost of imported inputs rise as theexchange rate depreciates. Also over the middle term, wages increase as consumer pricesincrease and the labour market tightens because of the exchange rate depreciation.Therefore, there is less reason to consider export competitiveness when formulatingmedium to long term exchange rate policies.
It should also be remembered that other factors besides price of exports (as determined bythe exchange rate) determine export competitiveness. These factors include, for example,after sales service and good product quality.
4.5 WORKINGS OF EXCHANGE RATE POLICY
The Singapore dollar is managed by relating it to an undisclosed trade-weighted basket ofexchange rates. It is important to note that, strictly speaking, the Singapore-US bilateralexchange rate alone does not determine the rate of imported inflation. However since theUS is such an important trading partner with Singapore it is safe to say that it must have ahigh weighting in determining the country’s nominal effective exchange rate (NEER).Officially, MAS does not maintain a parity either against the US dollar or a basket ofcurrencies. Instead the NEER is allowed to float within an undisclosed target band.
CPF funds and government surpluses are deposited with MAS. This reduces liquidity inthe banking system, and there is constant pressure on the Singapore dollar to appreciate.MAS neutralises this pressure by restoring the liquidity in the banking system by buyingUS dollars through the creation of reserves. The extent of intervention depends on thetarget band and the prevailing exchange rate, and the target band is based on projected andprevailing rates of external and domestic inflation. A major objective, is to keep CPIinflation low and stable.
4.6 EXCHANGE RATE POLICY IN ACTION
It is useful to observe how MAS has reacted under different conditions. Since theAuthority began using exchange rate policy as an anti-inflationary tool in 1981, we focuson its reactions during the 1980’s and 90’s
4.6.1 1981 - 1985: Second Oil Shock and the 1985 Recession
The shift in the focus of monetary policy from money supply and interest rate targeting toexchange rate ‘targeting’ took place in the inflationary environment of 1981. The secondoil shock in 1979 led to the world inflation rate being over 8 percent in 1981-1982. Astrong exchange rate was adopted to relieve inflationary pressures and to further thegovernment policy of upgrading and restructuring the economy (MAS Annual Report,1981/1982).
Rapid increases in nominal wages contributed to domestic inflation. During 1979 - 1981the government initiated a ‘high wage policy’ to encourage industries to move to more
10 Chia and Bauer
capital and skill- intensive activities. The policy resulted in productivity growth but thisgrowth did not completely offset wage increases, and unit labour costs (ULC) rose. Theappreciation of the NEER in 1981 did not prevent the inflation rate from rising. It did,however, curb import inflation, and the inflation rate in 1981 - 1982 was lower inSingapore than in OECD countries.
As world inflation came down and the NEER continued to appreciate, Singaporeexperienced negative import inflation in 1982. Wages, however, continued to increaseafter 1981 because of the increase in CPF contribution rates and a tighter labour market.Unit labour costs increased. Inflation in the early 80’s, after 1981, was the result ofdomestic factors. If the exchange rate had not appreciated, inflation would have been muchworse since import inflation would have contributed to the inflation in Singapore (MASAnnual Report, 1990/1991).
Because ULCs increased more rapidly than those of competitors and as a result of theappreciating NEER, the real effective exchange rate (REER) also appreciated. Singapore’scompetitiveness declined and contributed to the recession in 1985. A fall in external anddomestic demand were other contributing factors.
4.6.2 1985 - 1988: Era of Deflation
Domestic inflationary pressures were relieved by the effects of economic recession and aseries of costs and tax cuts. In 1986 there was a 15 percent reduction in the CPFcontribution rate. Wage restraint was practised and ULCs declined. Meanwhile, world oiland commodity prices began to fall from late 1985 onwards bringing down world inflation.Hence during 1985 -1987, MAS could allow the exchange rate to ease without worryingabout inflation. The fall in ULCs and the NEER laid the ground for economic recovery in1986 (Teh and Shanmugaratnam (1992)).
4.6.3 1988 - 1991: An Overheated Economy
In mid-1988 the NEER began to appreciate again, reflecting worries of both internal andexternal inflationary pressures. Faced with a strong external demand, Singapore’s economybegan to overheat. In 1989 unemployment fell below 2.5 percent, well below what isnormally regarded as full-employment. The labour market tightened and wage growthgrew to a rate that was above productivity growth. By the end of the decade, ULCs wereincreasing by 6 percent per annum. This resulted in domestic inflationary pressures.
During the late 1980’s foreign inflationary pressures had also increased. However, theappreciation of the exchange rate since 1988 offset this. Exchange rate policy was soeffective that by 1991 import prices had a dampening effect on CPI inflation. The strongerexchange rate also cooled the tight labour market. Simulations that have been performedusing the MAS econometric model suggest that if the exchange rate had not appreciatedsince 1988, inflation would have averaged 6 percent per annum from 1989 to 1991, insteadof the actual rate of 3 percent (Teh and Shanmugaratnam (1992)).
It is also claimed that any competitive enhancement brought about by a weaker exchangerate would have been temporary, being eroded by eventual inflation in the long term. TheMAS stance is that a loss of competitiveness in the face of an overheated labour marketcannot be relieved by weakening the exchange rate, since an appreciation of the REERwould be inevitable. The alternative to an appreciation of the nominal exchange rate wouldbe an increase in ULCs.
Analysis of Exchange Rate Movements: A Case Study of Singapore 11
4.6.4 1990’s: Slow Down in Labor Force Growth
As Singapore’s labour force growth slows, the economy’s potential economic growth willprobably fall to 5 percent - 6 percent over the 90’s. Supply-side growth will become morelimited and the economy will become more vulnerable to ‘demand induced overheatingand inflationary pressures’ (MAS Annual Report 1991/1992, p. 14). There is therefore aneed to moderate growth in GDP such that it does not exceed its sustainable level. Bydoing so inflationary pressures will be relieved thereby ensuring a more sustainablegrowth. Therefore a strong exchange rate policy could be followed to ensure moderateGDP growth and keep inflation at bay. ‘If price stability were traded off for the purpose ofsustaining short-term economic growth above the economy’s potential, growth itself willultimately be lowered’ (Teh and Shanmugaratnam, 1992, p. 301).
5 PURCHASING POWER PARITYThis section looks at the purchasing power parity between Singapore and the UnitedStates. PPP is an important model of exchange rate determination and it is often used topredict long run movements in exchange rates. We focus on the Singapore - US dollar PPPbecause of the importance of this bilateral rate. Also it has been verified by Abeysingheand Lee (1992) that PPP between the Singapore and US dollars does hold.
5.1 THEORY
PPP theory is based on the law of one price; i.e.; ‘arbitrage forces will lead to theequalisation of goods prices internationally once the prices of goods are measured in thesame currency’ (Pilbeam, 1992, p. 142). Assumptions made under the theory are: (1)perfect competition and (2) no transaction costs (e.g.; transportation costs, barriers to tradeand imperfect information).
There are two basic forms of PPP: absolute PPP (strong form) and relative PPP (weakform). Absolute PPP states that the prices of a similar good A in two countries are equalwhen denoted in the same currency. Absolute PPP can be expressed algebraically as,
S = P / P* (2)
where S is the exchange rate (domestic currency units per unit of foreign currency); P isthe price of a bundle of goods denoted in the domestic currency and P* is the price of abundle of goods denoted in the foreign currency.
The strong form is not likely to hold since the assumptions made are unlikely to hold.Relative PPP states that the exchange rate adjusts according to the difference in the
inflation rates of the 2 countries. Relative PPP can be expressed algebraically as,
%∆S = %∆P - %∆P* (3)
where %∆S is the percentage change in the exchange rate; %∆P is the domestic inflationrate and %∆P* is the foreign inflation rate.
A weakness of relative PPP is that it does not take into consideration the differencebetween tradables and non-tradables. Inflation rates do not distinguish between the two.But PPP is more applicable to tradable goods since they are open to internationalcompetition.
12 Chia and Bauer
5.2 MEASUREMENT PROBLEMS IN PPPThere are several problems associated with estimating PPP exchange rates. These issuesare discussed below.
5.2.1 Distinction Between Tradable and Non-Tradable
The distinction between tradable an non-tradable goods is blurred because of the linkagesbetween the two prices. Imported inputs are sometimes used in the production of non-tradable goods and non-traded goods are sometimes used in the production of tradables.Therefore PPP may be applicable, to some extent, to both tradable and non-tradable goodsand there may be cause to use a more general price level (Pilbeam (1992)).
The wholesale price index (WPI) is generally used when PPP is expected to hold fortradables. The consumer price index (CPI) is used when it is expected to hold for bothtradable and non-tradable goods. In our calculations of the PPP, WPI was used since webelieve that PPP should assert itself more strongly for tradables.
5.2.2 Time Required for PPP to Assert Itself
There is disagreement over the period when PPP can be expected to prevail. Strongversions of PPP suggest that PPP might hold on a monthly basis whilst progressivelyweaker versions would suggest a longer period of time. Because of Singapore’s opennessand relative price flexibility we chose to calculate PPP on a quarterly basis.
5.2.3 The ‘Base Year’ Problem
This is perhaps the most pressing problem faced by those who wish to calculate PPP. Itwould be ideal if we had the absolute Singapore dollar and US dollar prices (Pa and Pa*respectively) for an identical basket of goods, since PPP is expected to hold only foridentical baskets of goods (Ohno (1990)). Then the absolute PPP exchange rate would
be:
SPPP = Pa / Pa* (4)
Such uniformity is, however, not found in the real world.
Ohno (1990) discusses the problem as follows. Consider the ‘relative’ PPP:
SPPP ≈ θP / P* (5)
where SPPP is the ‘relative’ PPP exchange rate (domestic currency units per unit of foreigncurrency) and θ is an unknown scale factor that links the relative prices P and P*. P and P*
are domestic and foreign prices of baskets of goods that are similar in content but ofdifferent sizes (i.e., the base year of the two prices could be different). Note that this isonly an approximation because the two baskets need not have the same weights. The baseyear ‘problem’ is essentially to find the right value for θ. The problem is illustrated below.
5.3 CALCULATION OF PPPThere are different methods that are used to solve the base year problem (and hencecalculate PPP). We present two methods: (1) the Cassel-Keynes Method and (2) Long-RunAveraging.
5.3.1 Cassel-Keynes Method
This method begins by choosing a base year when the exchange rate can be assumed to beat PPP. Then later movements in the relative prices are used to update the base period’s
Analysis of Exchange Rate Movements: A Case Study of Singapore 13
exchange rate in order to obtain the new estimate of PPP. There are however several baseyears that may be chosen. We chose 1975 as our base year since Singapore’s currentaccount deficit in that year roughly in balance. Note, however that the resulting PPPestimates are sensitive to the choice of the base year.
5.3.1.1 Calculation
We estimated PPP rates, using the following equation:
EPPP = E0[(Pt* / P0*) / (Pt / P0)] (6)
where E0 is the actual and PPP exchange rate (foreign currency units per unit of domesticcurrency) at time = 0 (1975). P denotes prices (in this context WPI), * denotes foreignvariables (US) and the subscript following P denotes time period. Note that in thisformula, θ = E0 (P0 / P0*).
The WPIs for Singapore and US were indexed at 1990. An index with 1975 as the baseyear was achieved by dividing WPIt with WPI1975 for the US and Singapore priceindices.
5.3.1.2 Trend and Analysis
Our estimates in Figure 4 suggest that the nominal exchange rate was over-valued from1979 to 1981, and that it has been undervalued since 1983. But the degree ofundervaluation has been fairly stable. This implies that whereas there may be pressure onthe Singapore dollar to appreciate because of the undervaluation, this pressure has not beenincreasing. The appreciation of the Singapore dollar since 1986 is roughly in line withPPP.
5.3.2 Long-Run Averaging
Another way to solve the ‘base year’ problem is to take the long run average of pastrelative prices instead of a single base year as in the Cassel-Keynes Method. Theassumption is that there is an equal chance of the exchange rate being over or undervaluedin the long run. Although there may be times when the exchange rate is under orovervalued for a long period of time, it is doubtful if this could continue for long. This isbecause the exchange rate would be under pressure to appreciate or depreciate accordingly.Hence we may assume that over the long run exchange rates are aligned with PPP.
Ohno (1990) suggests that the long run average PPP could be calculated as far back as1975 (when general floating began). 1973-1974 should be left out since they weretransitional periods.
Note that there may be a problem in using the long run averaging method since differentcountries use different ways to adjust for quality changes, etc. This would result in apermanent measurement bias.
5.3.2.1 Calculation
The calculation of the long-run average PPP is similar to the calculation for the Cassel-Keynes Method. The same equation is used with the exception that instead of using theexchange rate and prices prevailing in the base year, their average values are used. The
long-run average PPP was calculated from 1975 to 1994.
5.3.2.2 Trend and Analysis
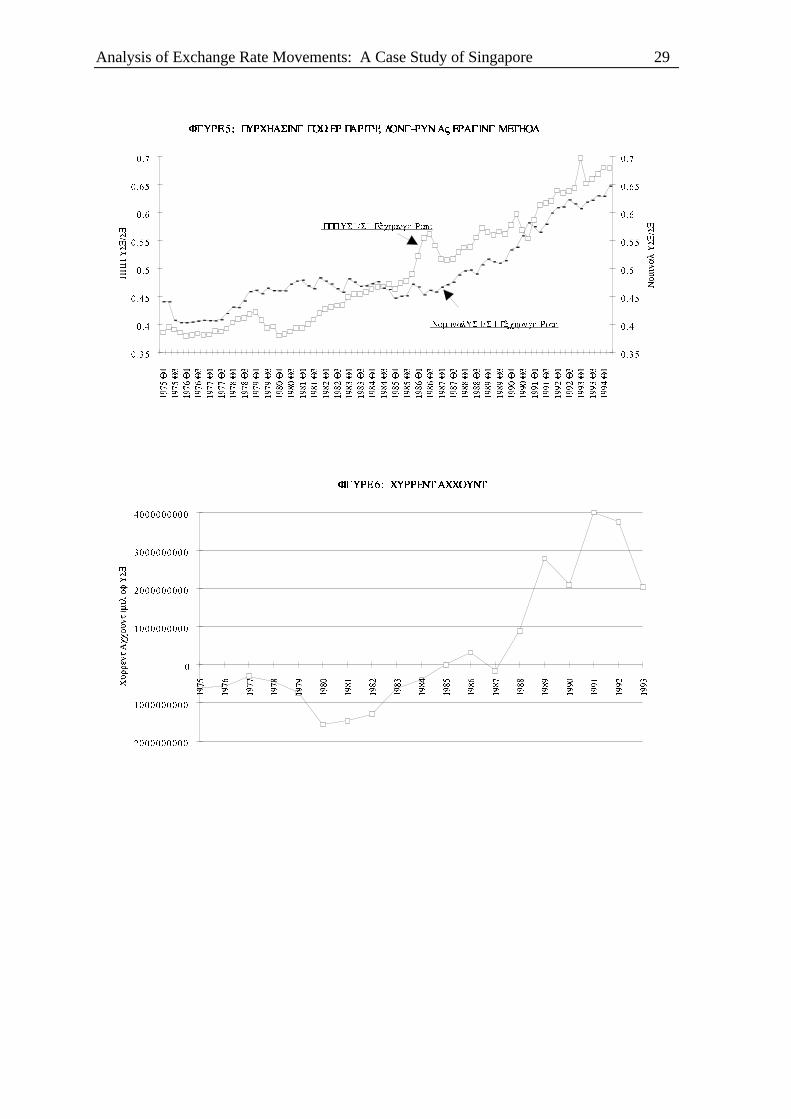
Our estimates presented in Figure 5 suggest that the Singapore dollar was overvalued from1975 to the mid-80’s, especially in 1979-1981. The currency has been undervalued since

14 Chia and Bauer
1985. The degree of undervaluation varies. Whereas there has not been a general trendtowards convergence, it would seem that the undervaluation in recent years is not as largeas it used to be. Also, the nominal and PPP rates have moved together since the mid-80’s,suggesting that relative price changes have played an important role in the Singaporedollar’s appreciation.
6 EXCHANGE RATES AND THE EXTERNAL SECTORThis section examines trends in the current account, exports, capital account, balance ofpayments and foreign exchange reserves and their relationships with the various exchangerates. The focus is on the period from the early 1980’s onwards, since this is when MASbegan exchange rate ‘targeting’.
6.1 SUMMARY OF EXCHANGE RATE TRENDS
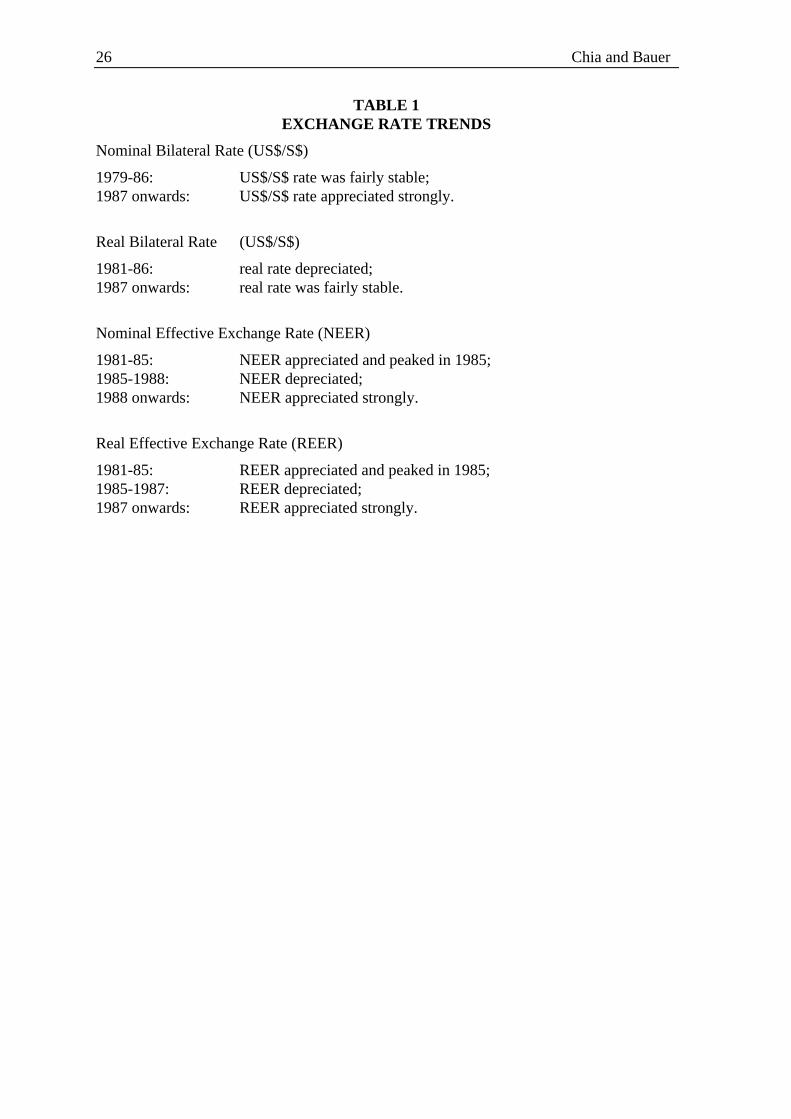
It may be useful to summarise trends in the bilateral and effective exchange rates beforeexamining the external sector. Table 1 provides this summary.
6.2 CURRENT ACCOUNT: FIGURE 6Broadly speaking, the current account is made up of the trade balance, the service balanceand net transfer payments. But because net transfer payments are a relatively smallcomponent, they do not have much of an impact on the general movements in the currentaccount.
We would expect the current account to respond to movements in the REER, since theREER is an indicator of a country’s overall competitiveness. The current account shouldworsen as the REER appreciates and improve as it depreciates. From the summary ofexchange rate trends given above, we see that during the 1981-1993 period, the REERexperienced a series of appreciations and depreciations. However, the current account ingeneral improved through out this period. This runs contrary to our expectations, and theremainder of this section attempts to explain why the current account continued to improveeven during periods of REER appreciation.
6.2.1 Appreciation in 1981Q1-1985Q1
6.2.1.1 Improvement in Net Service Earnings
An improvement in net service earnings can explain part of the rise in the current accountdespite the REER appreciation. In 1981, net earnings from services financed 73 percent ofthe trade deficit compared with 64 percent in 1980 and 53 percent in 1972. These earningswere from: provision of transportation, technical and financial services; oil processing andother professional services. In 1982 net earnings from services expanded by a further 20percent (MAS Annual Report, 1982/1983).
It can be argued that competitiveness in services is less based on low prices than is exportcompetitiveness. The level of expertise and service is more important. Besides there arecertain services, such as financial services, in which Singapore may have comparativeadvantage. Therefore, the improvement in the current account despite the REER,appreciation could be partially explained by the rising importance of the service sector.
6.2.1.2 Importance of the United States
The importance of the US as a major importer of Singapore’s exports could also help toexplain the improvement in the current account. While the REER was appreciating during

Analysis of Exchange Rate Movements: A Case Study of Singapore 15
1981-85, the Singapore-US bilateral exchange rate was depreciating. Moreover, incomegrowth in the US was strong, as was US demand for imports.
Consider the situation in 1983. Whereas earnings from services fell by 12 percent,Singapore’s current account improved because of rising exports and falling imports. Thismight seem inconsistent with the rising REER. Note, however, that the recovery in exportswas uneven. Exports to the US grew by 50 percent, while exports to Japan, Hong Kong,West Asia and Australia declined. The rise in exports to the US was encouraged by boththe depreciating real bilateral exchange rate and the strong economic growth in the US.
6.2.2 Appreciation from 1987
6.2.2.1 Improvement in Net Service Earnings
As before, net service earnings help to explain the improvement in the current accountdespite the appreciation of the REER. The service balance began to recover in 1987,following a decline during 1983-1986. In 1987, travel receipts alone rose by 21 percent. Infact the surplus in the current account in 1987 can be attributed to the improvement in theservice balance. The service balance also accounted for the improvement of the currentaccount in 1989. And in 1990 ‘the widening of the merchandise deficit was cushioned by aburgeoning of net service receipts to $14.2 billion’ (MAS Annual Report, 1990/1991, p.27).
So once again, the dramatic increase in the current account, despite the rise in REER andnominal bilateral rate, can to a large extent be explained by the growing importance of theservice sector.
6.2.2.2 Reduction in the Import Content of the Export Sector
In the last decade there has also been an increase in the domestic value-added per unit ofexports. This has reduced the import content of the export sector and helped to improvethe trade balance. In addition, non-oil domestic export growth has been more powerfulthan oil or entreport exports, which have relatively low domestic value-added margins.
6.2.2.3 Exports
We expect a worsening of the current account when the REER appreciates largely becauseof the resulting fall in exports. This section has attempted to explain why the currentaccount has improved, despite the REER appreciation by discussing service earnings.However, there have been periods when a rise in exports helped to improve the currentaccount. Therefore, the next section examines the relationship between exports andexchange rates more closely.
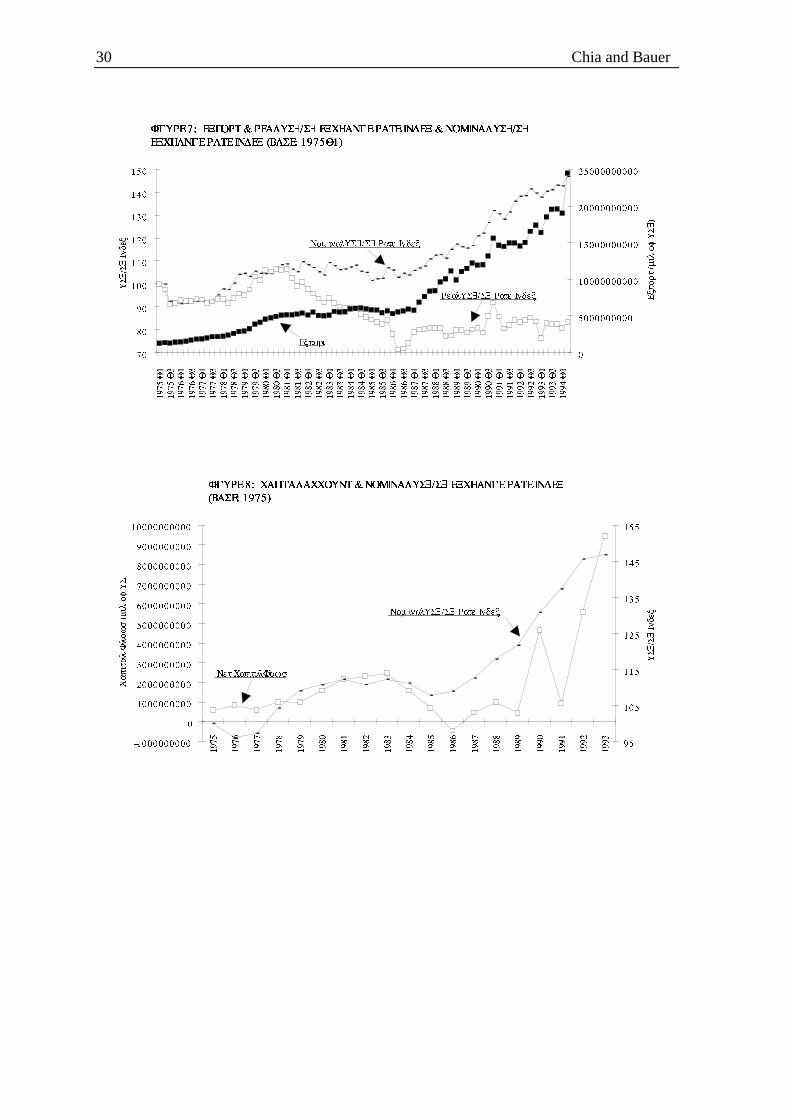
6.3 EXPORTS: FIGURE 7We would expect total exports to increase when there is a depreciation in the REER andvice versa. Moreover, we would expect exports to the US to be affected by the realSingapore-US bilateral rate. To some extent this is what we see in Figure 7.
6.3.1 Appreciation in 1981Q1-1985Q1
Exports remained relatively stable despite the appreciation of the REER. In 1981, exportgrowth moderated to 7 percent from a high of 34 percent in 1980. The moderation ofexport growth continued into 1982. But non-oil exports and domestic exports reboundedgrowing by 14 percent and 20 percent respectively in 1983. The depreciating real bilateralUS$/S$ exchange rate should have also encouraged exports to the US.
16 Chia and Bauer
In 1985, when the REER peaked, total exports fell by 2 percent. The situation might nothave been as bad if electronics exports to the US had held up. However, although theSingapore-US bilateral rate was still depreciating, electronic exports to the US could notbe sustained because of the global overproduction of electronic components (MAS AnnualReport, 1985/1986).
6.3.2 Appreciation from 1987
The REER and nominal US$/S$ rates have appreciated since 1987, though the realbilateral US$/S$ rate has remained fairly stable. Exports, however, have grown stronglysince the late 1980’s. Hence, we conclude that the rise in exports must have been forreasons other than exchange rate movements.
One major reason seems to be the rapidly growing demand from the Asia-Pacific regionsince the mid-1980’s. The share of Asia-Pacific markets in Singapore’s non-oil domesticexports has increased from 28 percent in 1986 to 36 percent by 1992 (MAS AnnualReport, 1992/1993). Singapore has become an increasingly important supplier of inputs forthe production of manufactured exports in the regional economies. These exports in turndepend to a large degree on final demand from the US. Therefore, the relatively low andstable Singapore-US real bilateral rate gives inputs supplied by Singapore (for US boundexports) a competitive advantage.
6.3.3 Summary
A strong exchange rate policy is constrained by the ‘detrimental’ effects such a policymight have on exports. We see this happening in 1985 when the strong exchange ratepolicy was abandoned to stimulate export growth. The easing of the exchange ratehappened to coincide with a period of deflationary pressure. Export growth has beenhealthy since 1987. There has, therefore, been little or no pressure on the MAS tosubordinate their primary objective of price stability to stimulate export growth.
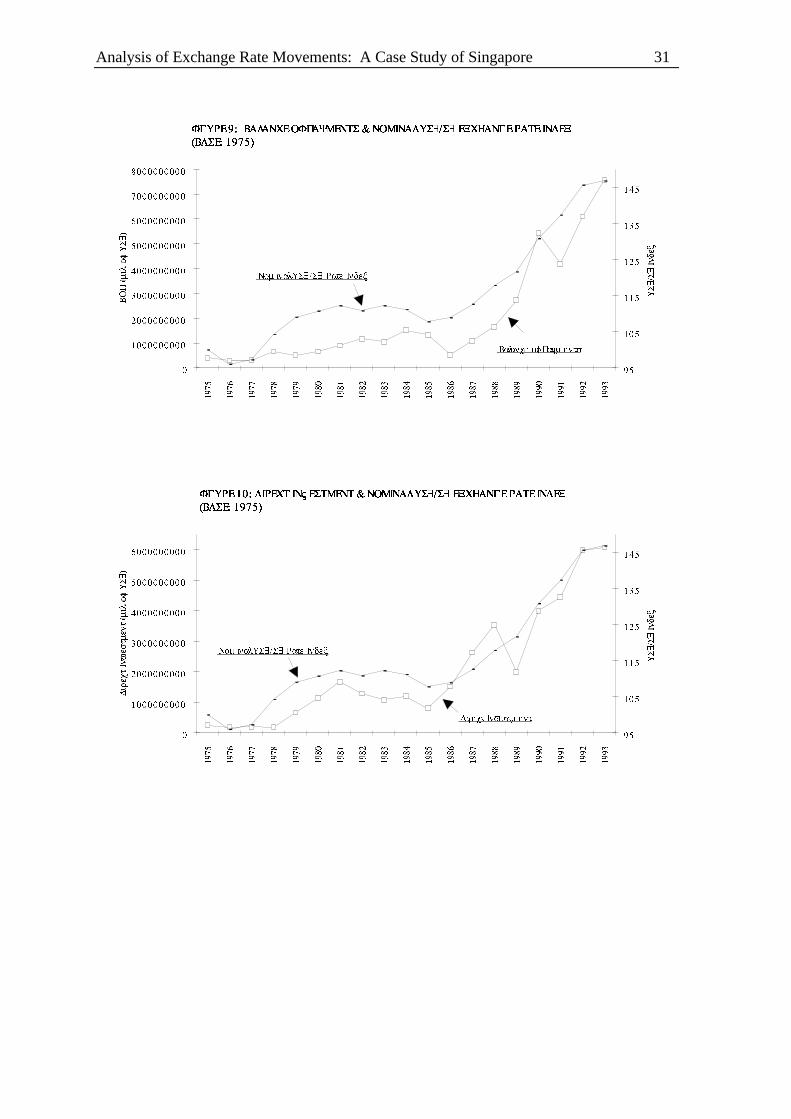
6.4 CAPITAL ACCOUNT & BALANCE OF PAYMENTS: FIGURES 8 TO 14Capital flows should have a strong impact on exchange rates. This appears to be the casein Singapore. Movements in the capital account largely determine Balance of Payments(BOP) patterns for Singapore, and BOP trends put pressure on a currency. As we will seebelow there is a very close relationship between movements in capital flows and thenominal bilateral US$/S$ exchange rate.
From Figure 8, we see that from the late 70’s to the early 80’s, large capital inflows wereassociated with an appreciation of the Singapore dollar. And the worsening in the capitalaccount during 1984-1985 was associated with a depreciation. The dramatic surge ofcapital inflows from 1986 onwards appears to have been an important cause of the increasein nominal bilateral exchange rate.
Figure 9, indicates that trends in the BOP are, on the whole, similar to those of the capitalaccount and hence relate to the exchange rate in much the same way. This is what wewould expect, since the capital account largely determines Singapore’s BOP.
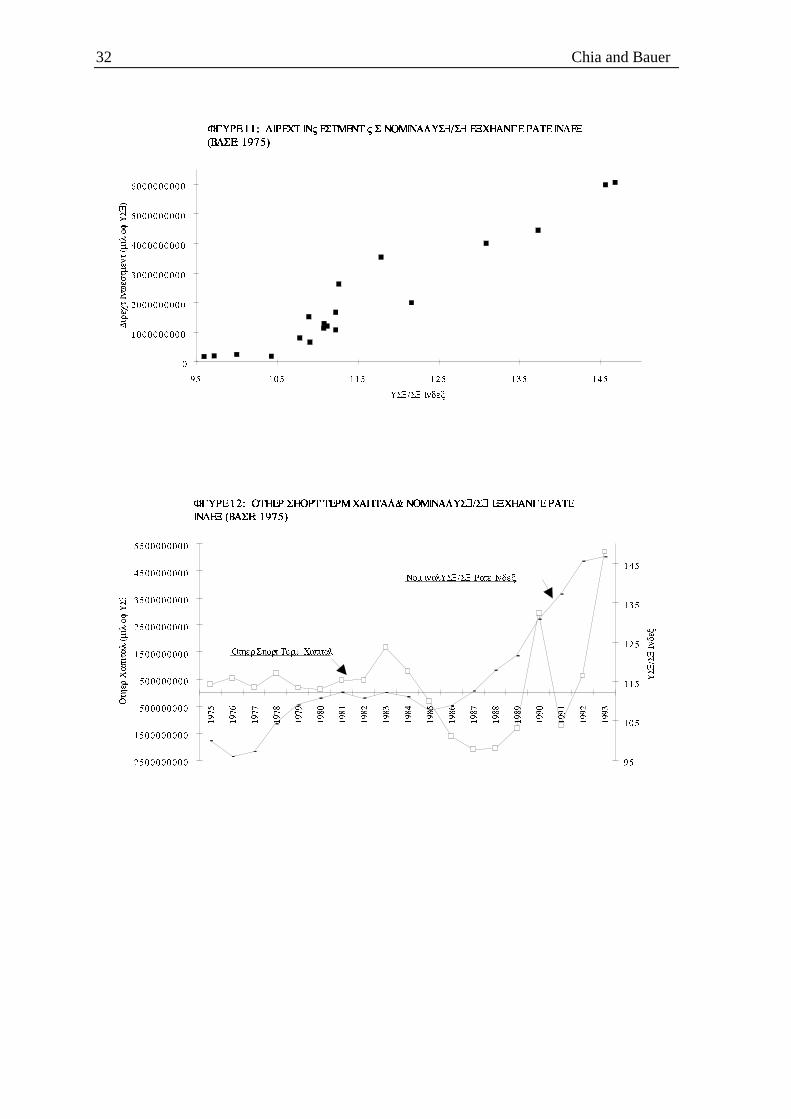
Singapore’s capital account includes four categories of capital flows: direct investment,portfolio investment, other long term capital and other short term capital. Directinvestment has been the largest component of the capital account (save for a few years).Moreover, direct investment is the flow that seems to be the most closely associated withmovements in the exchange rate. Trends in direct investment flows track movements in the
Analysis of Exchange Rate Movements: A Case Study of Singapore 17
bilateral exchange rate very closely (Figure 10). Figure 11 shows the strong positiverelation between direct investment and the US$/S$ rate. An increase in direct investmentexerts strong pressure on the Singapore dollar to appreciate.
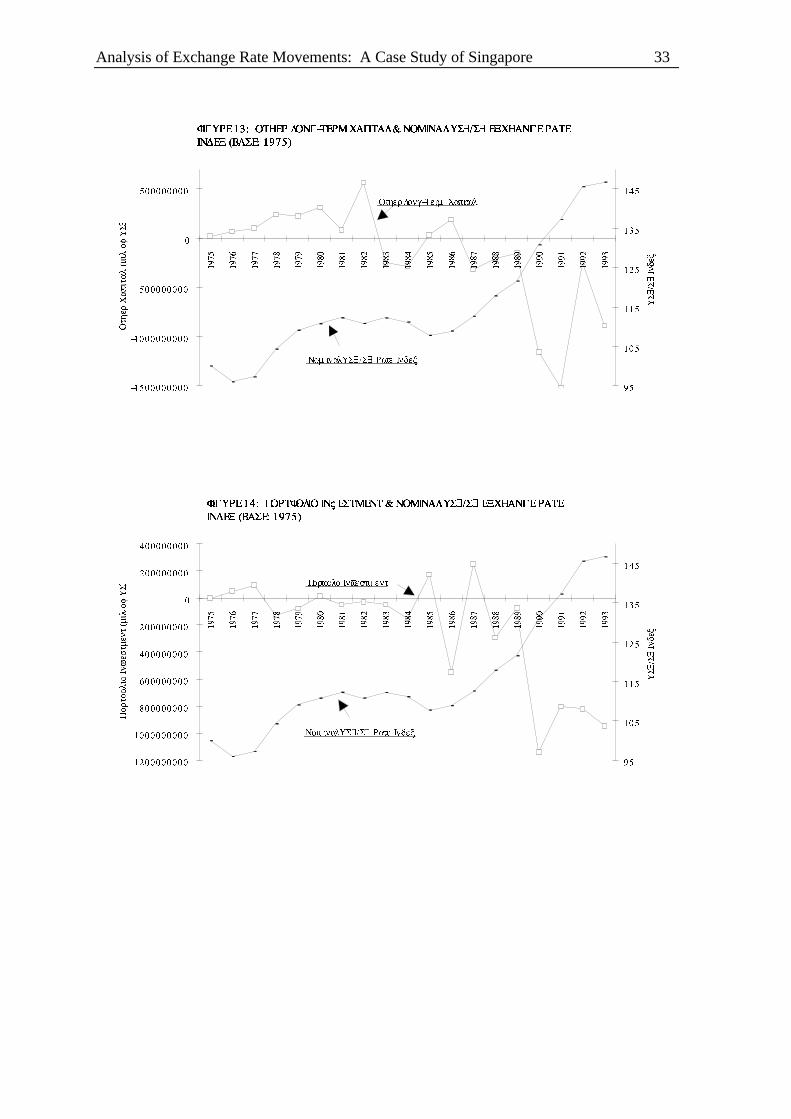
The relationships between the exchange rate and the other categories of capital flows arenot as strong. From Figure 12, we see that other short-term capital does fairly well intracking the movements in the nominal bilateral exchange rate, but it does not do as wellas direct investment. From Figures 13 and 14, we see that other long term capital andportfolio investment do not do well in tracking movements in the nominal bilateralexchange rate. For example, both of these capital flows declined in the late 80’s, whereasthe Singapore dollar appreciated strongly.
6.4.1 Summary
It appears that capital flows do have a strong impact on the nominal bilateral US$/S$exchange rate. Levels of direct investment appear to have been especially important.
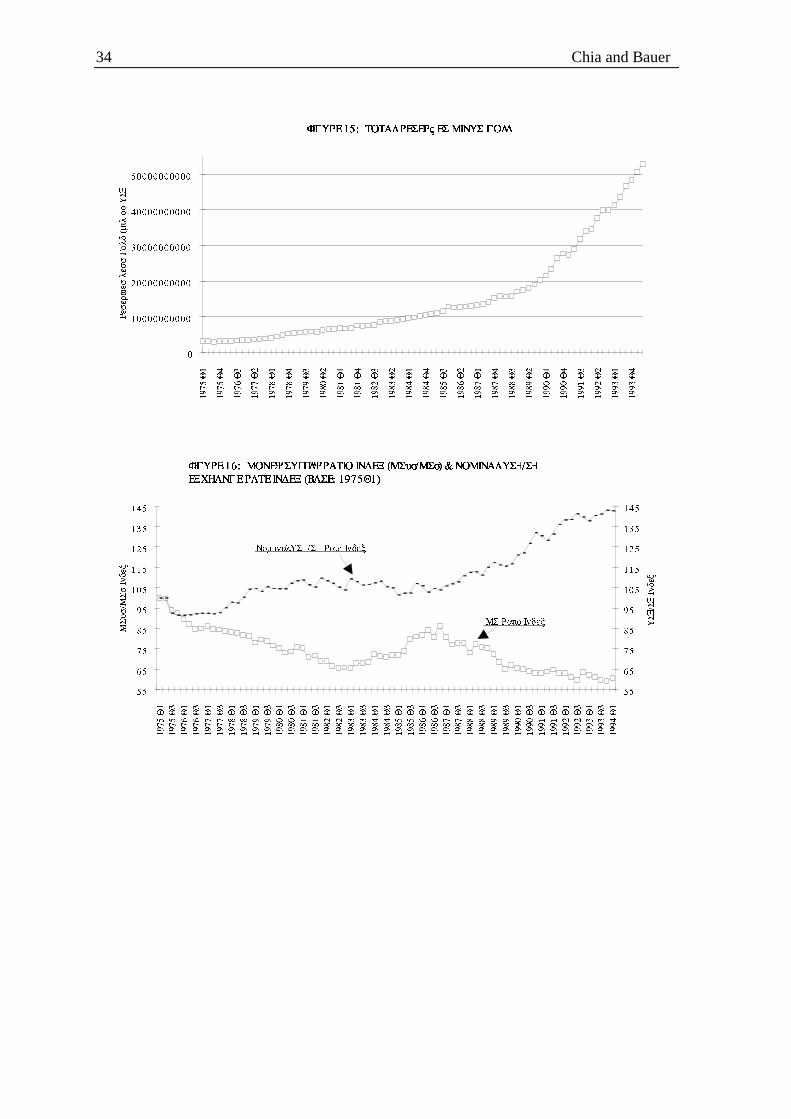
6.5 FOREIGN EXCHANGE RESERVES: FIGURE 15The level of a country’s foreign exchange reserves could limit a central bank’s ability tointervene in the foreign exchange market. This is especially so when the bank is attemptingto maintain an exchange rate when the currency is overvalued. But this does not appear tobe the case in Singapore. Foreign exchange rate reserves have risen steadily since the mid-70’s. And they have increased dramatically since the late 1980’s (Figure 15).
Singapore’s budgetary surplus and the accumulation of funds from the CPF (CentralProvident Fund) have contributed to the growth in reserves. Budgetary surpluses and CPFfunds are deposited in the MAS. This results in a loss of liquidity from the private bankingsector, and results in a constant pressure on the Singapore dollar to appreciate. In order tomoderate the loss of liquidity and the pressure on the dollar, the MAS intervenes by sellingSingapore dollars and buying US dollars. Foreign exchange reserves rise in the process.
7 ECONOMIC FUNDAMENTALS
7.1 INTRODUCTION
Standard models of exchange rate determination, such as various versions of the monetarymodel, state that four variables influence exchange rate movements.
They are:
1. relative inflation levels;2. relative interest rates;3. relative rates of economic growth and4. relative growth in money supply.
This section examines the impact of these variables on the nominal bilateral US$/S$ rate.We begin with a brief description of two common monetary models: the flexible pricemonetary model and the Dornbusch sticky price monetarist model (see Pilbeam, 1992, fora more extensive discussion).
7.2 MONETARY MODELS
In monetary models the key determinants of exchange rate movements are money supplyand money demand. Monetary models also share a common assumption: that domestic and

18 Chia and Bauer
foreign bonds are homogenous and, therefore, that the Uncovered Interest Parity (UIP)condition holds.
7.2.1 The Flexible Price Monetary Model
This model also makes the following assumptions: (1) PPP holds continuously and (2)prices are flexible. The premise of the model is that relative money stocks determinerelative prices which in turn determine the exchange rate via PPP.
An increase in the domestic money supply leads to an increase in domestic prices. Andbecause PPP holds continuously, this leads to a depreciation of the domestic currency. Arise in foreign money supply leads to an appreciation of the domestic currency.
A rise in domestic income leads to a rise in transactionary money demand. With moneysupply and interest rates held constant, the increased demand for real money balances canonly be met by a fall in prices. To maintain PPP, the home currency must appreciate.Conversely, an increase in foreign income leads to a fall in foreign prices and therefore adepreciation of the home currency to maintain PPP.
The equation linking real and nominal interest rates is as follows:
r = i + Pe (7)
where r is the nominal interest rate, i is the real interest rate and Pe is the expected rate ofprice inflation. Note that under UIP, real interest rates are equated across countries(i = i* ).
An increase in domestic inflation expectations leads to a corresponding rise in r. Theincrease in domestic inflation expectations leads to a fall in money demand and a rise inspending. Both these factors serve to drive up prices. To maintain PPP, the home currencywould have to depreciate. Monetary models, therefore, predict an increase in nominalinterest rates to be associated with a depreciation of the currency. Note that this runscounter to the more conventional prediction—higher interest rates result in capital inflowsand a currency appreciation.
7.2.2 The Dornbusch Sticky Price Monetarist Model
This model explains large and prolonged deviations of the exchange rate from PPP. It onlyassumes that PPP holds in the long run. The premise for the sticky price model is thatprices in the goods and labour markets are sticky while prices in the exchange rate marketsare flexible. This leads to exchange rate ‘overshooting’ which explains deviations fromPPP.
The model assumes that UIP holds. If the domestic interest rate is less than the foreign ratethen there must be a proportionate expected rate of appreciation of the home currency tocompensate for the lower interest.
An increase in domestic money supply, with prices unchanged, implies that interest rateswould have to fall to equilibrate the money market. The decline in the domestic interestrate requires a proportionate expected rate of appreciation of the home currency tocompensate for the lower interest rate. Therefore the exchange rate overshoots in the shortrun (i.e., it depreciates to a level lower than that required to maintain PPP) in order togenerate an expected rate of appreciation.
Analysis of Exchange Rate Movements: A Case Study of Singapore 19
A rise in home income leads to an increase in transactionary demand for money. Thiswould cause the domestic currency to appreciate, as in the flexible price model. Theeffects of a rise in domestic interest rates have already been described above.
7.3 TREND ANALYSIS
We begin with a brief graphical examination of the monetary model variables, beforepresenting a regression analysis.
7.3.1 Money Growth and the Nominal US$/S$ Exchange Rate: Figure 16
Theory suggests that more rapid money supply growth in Singapore relative to the USshould lead to a depreciation of the Singapore dollar. This does not appear to be the case.Instead, we see in Figure 16 that, as Singapore’s money supply growth increases, theexchange rate tends to appreciate.
The observation may be due to the nature of monetary policy in Singapore. As a result ofCPF and government surpluses being deposited with the MAS and the large capitalinflows, the Singapore dollar is under constant pressure to appreciate. To keep theexchange rate within the target band, the MAS sells Singapore dollars and buys USdollars. This necessarily leads to an increase in the monetary base. Hence, we tend to see arise in the money supply when the Singapore dollar is under strong pressure to appreciate.
7.3.2 Interest Rates and the Nominal US$/S$ Exchange Rate: Figures 17-18
Monetary models suggest that an increase in the nominal interest rate will cause a currencyto depreciate. The more conventional view is that higher interest rates will generate capitalinflows and a currency appreciation. Our graphical analysis, unfortunately, does not tend tosupport either view. There are times when the interest rate (and the interest ratedifferential) moves together with the exchange rate and there are times when they do not(Figures 17 and 18). We also generated scatter plots of interest rate differentials (i.e., USbank prime loan rate less Singapore’s minimum lending rate) and the currency’sappreciation/depreciation rate. These plots also showed no clear relationship betweenmovements in the Singapore dollar and relative interest rates.
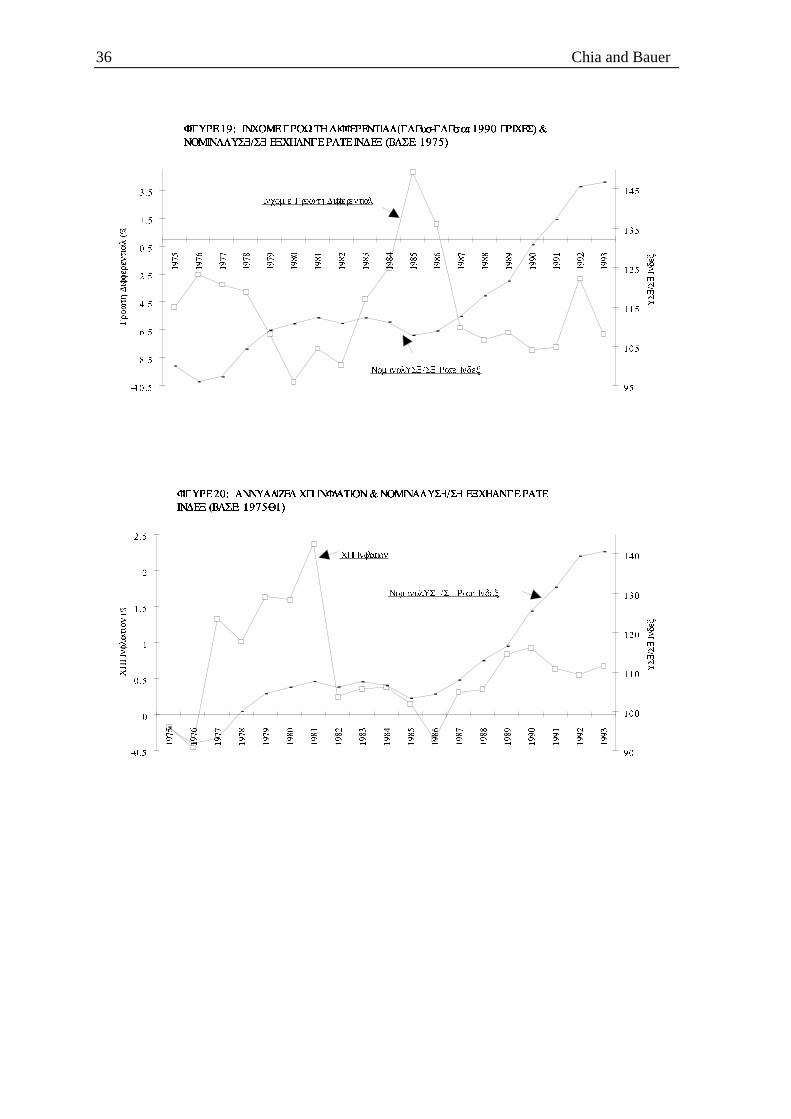
7.3.3 Income Growth and the Nominal US$/S$ Exchange Rate: Figure 19
Standard theory predicts that higher domestic income growth leads to an appreciation ofthe domestic currency. In Figure 19, we define the income growth differential as the USGDP growth rate less Singapore’s GDP growth rate. Hence, we expect there to be aninverse relation between the growth differential and the US$/S$ rate.
Figure 19 suggests that, in general, this relationship is observed. The more rapid growth inSingapore during the late 1970s was associated with an appreciation of the Singaporedollar. The US$/S$ rate stopped appreciating in the early 1980s and depreciated in themid-1980s as relative GDP growth in Singapore declined. Singapore’s relative GDPgrowth increased after 1986 and the Singapore dollar started to appreciate once again.
7.3.4 Inflation and the Nominal US$/S$ Exchange Rate: Figures 20
Standard theory predicts that a higher domestic inflation leads to a depreciation of thedomestic currency. We may not observe this in Singapore, however. Since the exchangerate has been used as an anti-inflationary tool by the MAS since 1981, MAS interventionmay result in the exchange rate appreciating whenever inflationary pressures mount.
20 Chia and Bauer
Indeed, Figure 20 suggests that from 1976 to mid-1981 the exchange rate appreciated asinflationary pressure increased. However, since MAS did not begin exchange rate targetinguntil 1981, it is difficult to attribute this deviation from theory to MAS intervention. From1981 to 1990, the figure does suggest that the US$/S$ rate depreciated as inflationarypressures eased and appreciated when inflationary pressures were strong. Since 1990, thestrong appreciation in the Singapore dollar appears to have dampened inflation.
7.4 REGRESSION ANALYSIS
In order to examine the impacts of money supply growth, income growth, interest ratedifferentials and inflation on the US$/S$ exchange rate, we estimate the followingequation using annual data from 1975 to 1993. The hope is that this multivariate analysiswill uncover these relationships more completely than the trend analysis.
The regression equation is as follows:
lnER = β0 + β1ln(Mus/Ms) + β2ln(Ys/Yus) + β3(rs-rus) + β4(Pus-Ps) (8)
where: lnER is the log of the nominal US$/S$ exchange rate
ln(Mus/Ms) is the log of relative money supplies;
ln(Ys/Yus) is the log of relative income (GDP);
rs-rus is the nominal interest rate differential and
Pus-Ps is the inflation rate differential.
The interest rates used to calculate rs-rus are Singapore’s 3 month inter-bank rate and theUS prime loan rate. The CPIs are used to calculate Pus-Ps. Income (GDP) is at 1990constant prices. Note that the monetary model estimates often include expected inflation,rather than actual inflation. For simplicity, we assume rational expectations and take theactual inflation rates to approximate expectations.
We expect, based on monetary models, the signs of the coefficients to be as follows: β1 > 0; β2 > 0; β3 < 0; β4 > 0 (or β4 = 0 in the Dornbusch sticky- price model). TheOLS estimates of equation (8) are as follows:
lnER = -0.961 - 0.357ln(Mus/Ms) +0.363ln(Ys/Yus) + 0.013(rs-rus) + 0.0095(Pus-Ps)
t-ratio: (-1.01) (-2.43) (4.59) (1.63) (1.16)
R2 = 0.9118; R2adj = 0.8866
Judging by the R2, the model represents a fairly good fit of the data.3
The estimated coefficient for ln(Mus/Ms) was negative rather than positive as theorywould suggest. A potential reason for this result, as discussed in the previous section, isthe nature of MAS intervention.
The coefficient on ln(Ys/Yus) is positive and significant as expected. More rapid GDPgrowth in Singapore is associated with an appreciation of the Singapore dollar.
3 The model was also run without the relative price variable, as suggested by the Dornbusch sticky-pricemodel. This did not change the coefficients or significance levels of the other variables substantially.Omitting the constant term also had little effect. Note that this regression was not the primary focus of ourstudy, and we did not attempt to estimate more complicated error correction models.
Analysis of Exchange Rate Movements: A Case Study of Singapore 21
The coefficient on (rs-rus) is positive, though not significant. This is not in line withmonetary model predictions, but it is consistent with the general view that higher interestrates induce capital flows and a currency appreciation. Given that Singapore is a low-inflation environment, it is not that surprising that the monetary model expectation doesnot hold.
The inflation rate differential does not appear to have a significant effect, although thecoefficient is positive as expected. The insignificance of the coefficient is consistent withthe Dornbusch model.
8 FORECASTING—ARIMAA simple time series forecasting model of the nominal US$/S$ exchange rate is developedin this section.4
8.1 DATA
Monthly data for the nominal US$/S$ exchange rate from January 1975 to September1994 was used to estimate an ARIMA model. All data were taken from the InternationalFinancial Statistics (IFS).
8.2 ORDER OF INTEGRATION
The autocorrelation function of the exchange rate data series does not rapidly decline tozero, suggesting that the series is non-stationary. A Dickey-Fuller test confirmed the non-stationarity of the series.
Having decided that the original series was non-stationary, the data were differenced once.A plot of the autocorrelation function of the first differenced series was then generated.This time the function fell rapidly to zero after one lag. The unit root test was thenperformed again. The results of the test are as follows:
Null Hypothesis Test Statistic Critical Value 10%No constant, no trend rho = 0.3319
A(1) = 0 (I) -157.00 -5.68A(1) = 0 (II) -10.855 -1.62
Both the Z and t test statistics (denoted by (I) and (II) respectively) reject the nullhypothesis of non-stationarity. Based on the preliminary examination of theautocorrelation function and the Dickey-Fuller test, we proceed with a model of integrationorder 1.
8.3 DEGREE OF MOVING AVERAGE (MA) AND AUTOREGRESSION (AR)The moving average and autoregressive structures were determined by looking at the plotsof the autocorrelation and partial autocorrelation functions generated from the firstdifferenced series. These plots suggest the model to be an ARIMA (1,1,1).
8.4 MODEL EVALUATION—DIAGNOSTIC CHECKING
The final model choice, however, was based on a comparison of t and Q statistics. Westarted with a model structure of (1,1,1) based on our preliminary examination. But
4 All computations were done with the software package, Shazam.
22 Chia and Bauer
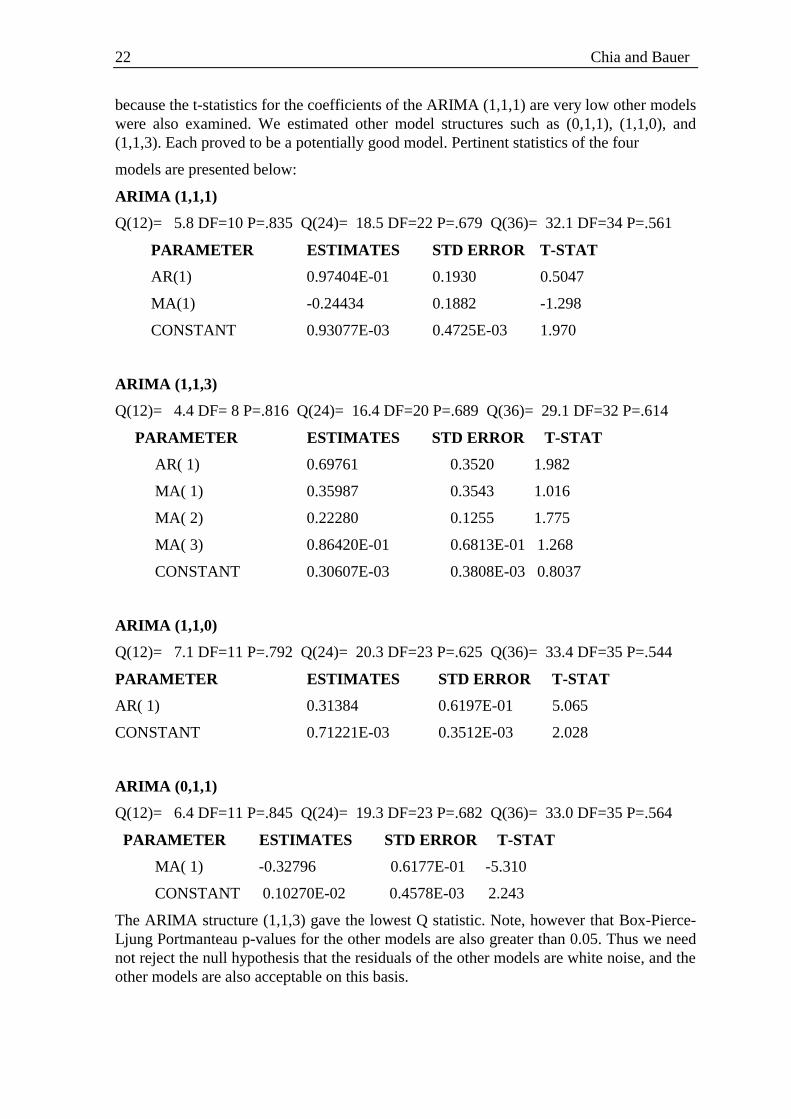
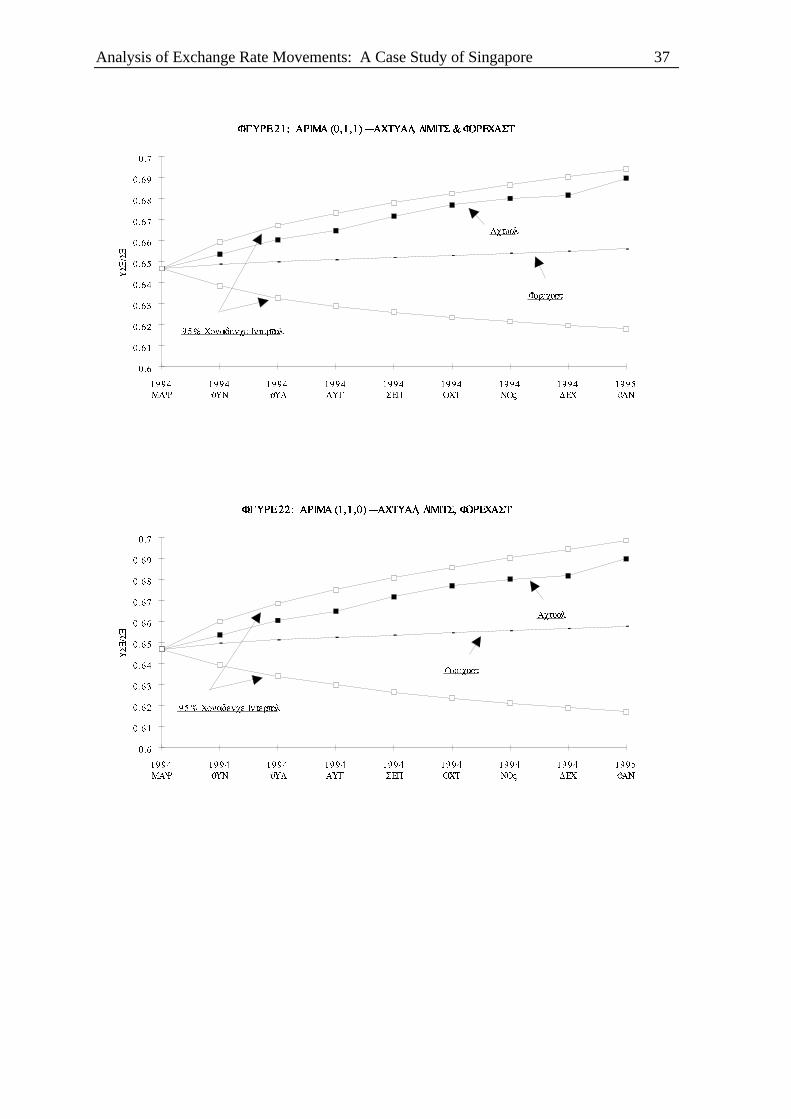
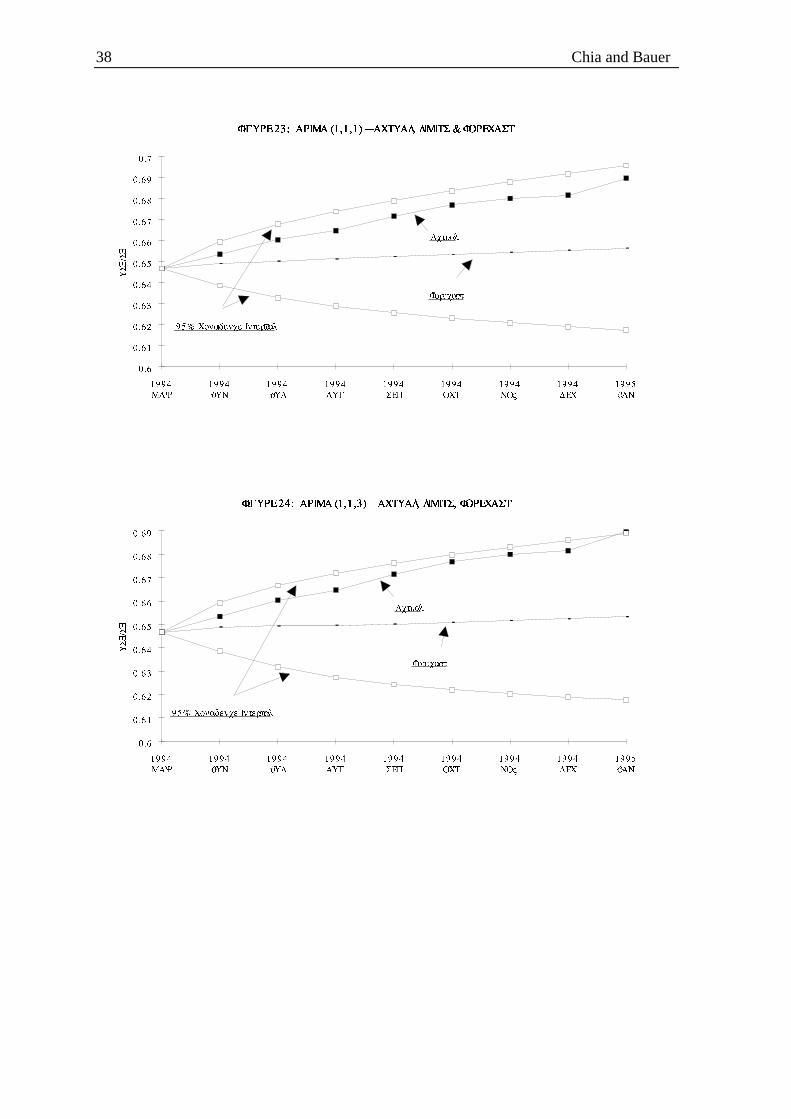
because the t-statistics for the coefficients of the ARIMA (1,1,1) are very low other modelswere also examined. We estimated other model structures such as (0,1,1), (1,1,0), and(1,1,3). Each proved to be a potentially good model. Pertinent statistics of the four
models are presented below:
ARIMA (1,1,1)
Q(12)= 5.8 DF=10 P=.835 Q(24)= 18.5 DF=22 P=.679 Q(36)= 32.1 DF=34 P=.561
PARAMETER ESTIMATES STD ERROR T-STAT
AR(1) 0.97404E-01 0.1930 0.5047
MA(1) -0.24434 0.1882 -1.298
CONSTANT 0.93077E-03 0.4725E-03 1.970
ARIMA (1,1,3)
Q(12)= 4.4 DF= 8 P=.816 Q(24)= 16.4 DF=20 P=.689 Q(36)= 29.1 DF=32 P=.614
PARAMETER ESTIMATES STD ERROR T-STAT
AR( 1) 0.69761 0.3520 1.982
MA( 1) 0.35987 0.3543 1.016
MA( 2) 0.22280 0.1255 1.775
MA( 3) 0.86420E-01 0.6813E-01 1.268
CONSTANT 0.30607E-03 0.3808E-03 0.8037
ARIMA (1,1,0)
Q(12)= 7.1 DF=11 P=.792 Q(24)= 20.3 DF=23 P=.625 Q(36)= 33.4 DF=35 P=.544
PARAMETER ESTIMATES STD ERROR T-STAT
AR( 1) 0.31384 0.6197E-01 5.065
CONSTANT 0.71221E-03 0.3512E-03 2.028
ARIMA (0,1,1)
Q(12)= 6.4 DF=11 P=.845 Q(24)= 19.3 DF=23 P=.682 Q(36)= 33.0 DF=35 P=.564
PARAMETER ESTIMATES STD ERROR T-STAT
MA( 1) -0.32796 0.6177E-01 -5.310
CONSTANT 0.10270E-02 0.4578E-03 2.243
The ARIMA structure (1,1,3) gave the lowest Q statistic. Note, however that Box-Pierce-Ljung Portmanteau p-values for the other models are also greater than 0.05. Thus we neednot reject the null hypothesis that the residuals of the other models are white noise, and theother models are also acceptable on this basis.
Analysis of Exchange Rate Movements: A Case Study of Singapore 23
Our next selection criteria was the t-statistics of the coefficients. Models (1,1,0) and(0,1,1) are better models than models (1,1,3) and (1,1,1) since their coefficients are morestatistically significant.
But the acid test for the best model is to look at how well the models perform inforecasting. Figures 21-24 show how the models perform. In fact we see that the forecastsfrom all four models are fairly constant. The predicted values do not vary about the mean.Hence, we conclude that there is no one model amongst the four that is superior.
The lackluster performance of the forecasts might be due to MAS intervention in theforeign exchange market to keep the exchange rate within its target band, thereby reducingexchange rate volatility. Hence the exchange rate series may contain very little usefulARIMA structure, and time series techniques may not be especially useful for predictingexchange rate trends. When an exchange rate is strongly managed there is less‘information’ available to formulate a time series model.
Therefore more judgmental methods of forecasting would seem to provide a better meansof predicting Singapore’s exchange rate trends. In other words, one should concentratemore on factors that might trigger MAS intervention and other economic factors outside ofMAS control that might affect the exchange rate.
9 SUMMARY & CONCLUSIONSIn this study, we have seen how external conditions, economic fundamentals and MASintervention have affected the Singapore dollar. Because the Singapore dollar is stronglymanaged, it is difficult to forecast exchange rate trends using an ARIMA model.Therefore, one has to turn to more judgmental methods to ‘predict’ exchange rate trends.One should certainly try to anticipate MAS’s responses to various stimuli.
We know that the Authority’s primary objective is to maintain price stability. Hence, intimes of strong inflationary pressures (either internally or externally generated) we canexpect MAS to maintain a strong Singapore dollar. The Authority is not likely tosubordinate its primary objective even if export growth suffers. The MAS views thebeneficial impact of a depreciation, under inflationary conditions, to be only temporary.Rising wages and higher costs of imported inputs would erode export competitiveness inthe long term.
If, however, the threat of inflation is low the Authority is willing to weaken the exchangerate to boost the exports when necessary, as it did during the mid-1980s. This is not likelyin the foreseeable future. Supply-side constraints, strong export growth and the resultantoverheating of the economy are concerns. Therefore, we expect the Singapore dollar tocontinue appreciating.
Other findings of this study include the following. The real US$/S$ exchange rate hasremained fairly stable since 1987, despite the nominal appreciation of the Singapore dollar.According to our estimates, the nominal bilateral US-Singapore exchange rate has tendedto move in accordance with PPP trends.
The relationship between trends in the current account and movements in both the bilateraland real effective exchange rates are not always consistent with the predictions of standardtheory. For example, the current account has improved strongly since 1987 despite theappreciation of the REER. Factors accounting for this apparent inconsistency include
24 Chia and Bauer
growth in net service earnings, a reduction in the import content of exports, and risingdemand for Singapore’s exports in the Asia-Pacific region.
Trends in the capital account do appear to have had an impact on the US$/S$ exchangerate. The large capital inflows from 1977 to 1982 and since 1987 have been associatedwith appreciations in the Singapore dollar. Among the various components of the capitalaccount, levels of direct investment appear to have had the strongest impact on thecurrency. These capital flows, along with CPF savings and government surpluses, have putstrong upward pressure on the Singapore dollar.
Monetary models suggest that differentials in inflation rates, money supply growth rates,interest rates, and income growth rates determine movements in the exchange rate. Ouranalysis does not tend to support these models. Money supply growth and interest ratedifferentials do not seem to be useful indicators of movements in the US$/S$ exchangerate. The Singapore dollar, as noted above, tends to appreciate more rapidly wheninflationary pressures are high. Relative GDP growth, on the other hand, does have theexpected impact on the bilateral rate. The Singapore dollar tends to appreciate whenincome growth in Singapore is relatively stronger.
Analysis of Exchange Rate Movements: A Case Study of Singapore 25
REFERENCES
Abeysinghe, Tilak and Lee Kok Hong (1992), “Singapore’s Strong Dollar Policy andPurchasing Power Parity”, Singapore Economic Review, Vol 37 No. 1, April 70-79.
Duc-Tho, Nguyen and Yao Chye Chiang (1989), “Exchange Rate Determination: the Caseof Singapore”, (Adelaide, University of Adelaide).
Lim Chong Yah and Associates (1988), Policy Options for the Singapore Economy,McGraw Hill.
Monetary Authority of Singapore, MAS Annual Report: 1975/76 to 1993/94.
Ohno, Kenichi (1990), “Estimating Yen/Dollar and Mark/Dollar Purchasing PowerParities”, International Monetary Fund Staff Papers, Vol 37, No. 3 September,International Monetary Fund, 700-705.
Pilbeam, Keith (1992), International Finance, Macmillian, (London, City University).
Pindyck, S. Robert and Rubinfeld, L. Daniel (1991), Econometric Models and EconomicForecasts, McGraw Hill, (New York).
Teh Kok Peng and Shanmugaratnam, Tharman (1992), “Exchange Rate Policy:Philosophy and Conduct over the Past Decade”, in Linda Low and Toh Mun Hengeds., Public Policies in Singapore—Changes in the 1980’s and Future of Singapore,Times Academic Press, 285-314.
26 Chia and Bauer
TABLE 1EXCHANGE RATE TRENDS
Nominal Bilateral Rate (US$/S$)
1979-86: US$/S$ rate was fairly stable;1987 onwards: US$/S$ rate appreciated strongly.
Real Bilateral Rate (US$/S$)
1981-86: real rate depreciated;1987 onwards: real rate was fairly stable.
Nominal Effective Exchange Rate (NEER)
1981-85: NEER appreciated and peaked in 1985;1985-1988: NEER depreciated;1988 onwards: NEER appreciated strongly.
Real Effective Exchange Rate (REER)
1981-85: REER appreciated and peaked in 1985;1985-1987: REER depreciated;1987 onwards: REER appreciated strongly.
Analysis of Exchange Rate Movements: A Case Study of Singapore 27
FIGURE 1: NOMINAL US$/S$ EXCHANGE RATE
0.4
0.4 5
0.5
0.5 5
0.6
0.6 5
0.7
FIGURE 2: NOMINAL EFFECTIV E EXCHANGE RATE INDEX & NOMINAL US$/S$
EXCHANGE RATE INDEX (BASE: 1990)
75
80
85
90
95
10 0
10 5
11 0
11 5
12 0
75
80
85
90
95
10 0
10 5
11 0
11 5
12 0
NEER Index
Nom inal US$/S$ Rate Index
28 Chia and Bauer
FIGURE 3: REAL US$/S$ EXCHANGE RATE INDEX & NOMINAL US$/S$ EXCHANGE
RATE INDEX (BASE: 1975Q1)
50
60
70
80
90
10 0
11 0
12 0
13 0
14 0
15 0
Real US$/S$ Rate Index
Nom inal US$/S$ Rate Index
FIGURE 4: PURCHASING POWER PARITY (PPP), CASSEL-KEYNES METHOD (BASE:
1975)
0.3 5
0.4
0.4 5
0.5
0.5 5
0.6
0.6 5
0.7
0.7 5
0.8
0.3 5
0.4
0.4 5
0.5
0.5 5
0.6
0.6 5
0.7
0.7 5
0.8
PPP US$/S$ Exchang e Rate
Nom inal US$/S$ Exchang e Rate
Analysis of Exchange Rate Movements: A Case Study of Singapore 29
FIGURE 5: PURCHASING POWER PARITY, LONG-RUN AV ERAGING METHOD
0.3 5
0.4
0.4 5
0.5
0.5 5
0.6
0.6 5
0.7
0.3 5
0.4
0.4 5
0.5
0.5 5
0.6
0.6 5
0.7
PPP US$/S$ Exchang e Rate
Nom inal US$/S$ Exchang e Rate
FIGURE 6: CURRENT ACCOUNT
-20 00 000 00 0
-10 00 000 00 0
0
10 00 00 000 0
20 00 00 000 0
30 00 00 000 0
40 00 00 000 0
30 Chia and Bauer
FIGURE 7: EXPORT & REAL US$/S$ EXCHANGE RATE INDEX & NOMINAL US$/S$
EXCHANGE RATE INDEX (BASE: 1975Q1)
70
80
90
10 0
11 0
12 0
13 0
14 0
15 0
0
50 00 00 000 0
10 00 00 000 00
15 00 00 000 00
20 00 00 000 00
25 00 00 000 00
Export
Real US$/S$ Rate Index
Nom inal US$/S$ Rate Index
FIGURE 8: CAPITAL ACCOUNT & NOMINAL US$/S$ EXCHANGE RATE INDEX
(BASE: 1975)
-10 00 000 00 0
0
10 00 00 000 0
20 00 00 000 0
30 00 00 000 0
40 00 00 000 0
50 00 00 000 0
60 00 00 000 0
70 00 00 000 0
80 00 00 000 0
90 00 00 000 0
10 00 00 000 00
95
10 5
11 5
12 5
13 5
14 5
15 5
Nom inal US$/S$ Rate Index
Net Capital Flow s
Analysis of Exchange Rate Movements: A Case Study of Singapore 31
FIGURE 9: BALANCE OF PAYMENTS & NOMINAL US$/S$ EXCHANGE RATE INDEX
(BASE: 1975)
0
10 00 00 000 0
20 00 00 000 0
30 00 00 000 0
40 00 00 000 0
50 00 00 000 0
60 00 00 000 0
70 00 00 000 0
80 00 00 000 0
95
10 5
11 5
12 5
13 5
14 5
Nom inal US$/S$ Rate Index
Balance of Paym ents
FIGURE 10: DIRECT INV ESTMENT & NOMINAL US$/S$ EXCHANGE RATE INDEX
(BASE: 1975)
0
10 00 00 000 0
20 00 00 000 0
30 00 00 000 0
40 00 00 000 0
50 00 00 000 0
60 00 00 000 0
95
10 5
11 5
12 5
13 5
14 5
Nom inal US$/S$ Rate Index
Direct Investm ent
32 Chia and Bauer
FIGURE 11: DIRECT INV ESTMENT V S NOMINAL US$/S$ EXCHANGE RATE INDEX
(BASE: 1975)
US$/S$ Index
0
10 00 00 000 0
20 00 00 000 0
30 00 00 000 0
40 00 00 000 0
50 00 00 000 0
60 00 00 000 0
95 10 5 11 5 12 5 13 5 14 5
FIGURE 12: OTHER SHORT-TERM CAPITAL & NOMINAL US$/S$ EXCHANGE RATE
INDEX (BASE: 1975)
-25 00 000 00 0
-15 00 000 00 0
-50 00 000 00
50 00 00 000
15 00 00 000 0
25 00 00 000 0
35 00 00 000 0
45 00 00 000 0
55 00 00 000 0
95
10 5
11 5
12 5
13 5
14 5
Other Short-Term Capital
Nom inal US$/S$ Rate Index
Analysis of Exchange Rate Movements: A Case Study of Singapore 33
FIGURE 13: OTHER LONG-TERM CAPITAL & NOMINAL US$/S$ EXCHANGE RATE
INDEX (BASE: 1975)
-15 00 000 00 0
-10 00 000 00 0
-50 00 000 00
0
50 00 00 000
95
10 5
11 5
12 5
13 5
14 5
Nom inal US$/S$ Rate Index
Other Long -Term Capital
FIGURE 14: PORTFOLIO INV ESTMENT & NOMINAL US$/S$ EXCHANGE RATE
INDEX (BASE: 1975)
-12 00 000 00 0
-10 00 000 00 0
-80 00 000 00
-60 00 000 00
-40 00 000 00
-20 00 000 00
0
20 00 00 000
40 00 00 000
95
10 5
11 5
12 5
13 5
14 5
Portfolio Investm ent
Nom inal US$/S$ Rate Index
34 Chia and Bauer
FIGURE 15: TOTAL RESERV ES MINUS GOLD
0
10 00 00 000 00
20 00 00 000 00
30 00 00 000 00
40 00 00 000 00
50 00 00 000 00
FIGURE 16: MONEY SUPPLY RATIO INDEX (MSus/MSs) & NOMINAL US$/S$
EXCHANGE RATE INDEX (BASE: 1975Q1)
55
65
75
85
95
10 5
11 5
12 5
13 5
14 5
55
65
75
85
95
10 5
11 5
12 5
13 5
14 5
MS Ratio Index
Nom inal US$/S$ Rate Index

Analysis of Exchange Rate Movements: A Case Study of Singapore 35
FIGURE 17: SINGAPORE'S MINIMUM LENDING RATE & NOMINAL US$/S$
EXCHANGE RATE INDEX (BASE: 1975Q1)
5
6
7
8
9
10
11
12
13
14
15
95
10 0
10 5
11 0
11 5
12 0
12 5
13 0
13 5
14 0
14 5Minim um Lending Rate
Nom inal US$/S$ Rate Index
FIGURE 18: INTEREST RATE DIFFERENTIAL (US: BANK PRIME LOAN RATE-
S'PORE: MINIMUM LENDING RATE) & NOMINAL US$/S$ EXCHANGE RATE INDEX
(BASE: 1975Q1)
0
1
2
3
4
5
6
7
90
10 0
11 0
12 0
13 0
14 0
15 0
Interest Rate Differential
Nom inal US$/S$ Rate Index
36 Chia and Bauer
FIGURE 19: INCOME GROWTH DIFFERENTIAL (GDPus-GDPs at 1990 PRICES) &
NOMINAL US$/S$ EXCHANGE RATE INDEX (BASE: 1975)
-10 .5
-8.5
-6.5
-4.5
-2.5
-0.5
1.5
3.5
95
10 5
11 5
12 5
13 5
14 5Incom e G row th Differential
Nom inal US$/S$ Rate Index
FIGURE 20: ANNUALIZED CPI INFLATION & NOMINAL US$/S$ EXCHANGE RATE
INDEX (BASE: 1975Q1)
-0.5
0
0.5
1
1.5
2
2.5
90
10 0
11 0
12 0
13 0
14 0CPI Inflation
Nom inal US$/S$ Rate Index
Analysis of Exchange Rate Movements: A Case Study of Singapore 37
FIGURE 21: ARIMA (0,1,1) -- ACTUAL, LIMITS & FORECAST
0.6
0.6 1
0.6 2
0.6 3
0.6 4
0.6 5
0.6 6
0.6 7
0.6 8
0.6 9
0.7
19 94
MAY
19 94
JUN
19 94
JUL
19 94
AUG
19 94
SEP
19 94
OCT
19 94
NOV
19 94
DEC
19 95
JAN
Forecast
Actual
95 % Confidence Interval
FIGURE 22: ARIMA (1,1,0) -- ACTUAL, LIMITS, FORECAST
0.6
0.6 1
0.6 2
0.6 3
0.6 4
0.6 5
0.6 6
0.6 7
0.6 8
0.6 9
0.7
19 94
MAY
19 94
JUN
19 94
JUL
19 94
AUG
19 94
SEP
19 94
OCT
19 94
NOV
19 94
DEC
19 95
JAN
95 % Confidence Interval
Actual
Forecast
38 Chia and Bauer
FIGURE 23: ARIMA (1,1,1) -- ACTUAL, LIMITS & FORECAST
0.6
0.6 1
0.6 2
0.6 3
0.6 4
0.6 5
0.6 6
0.6 7
0.6 8
0.6 9
0.7
19 94
MAY
19 94
JUN
19 94
JUL
19 94
AUG
19 94
SEP
19 94
OCT
19 94
NOV
19 94
DEC
19 95
JAN
Forecast
Actual
95 % Confidence Interval
FIGURE 24: ARIMA (1,1,3) -- ACTUAL, LIMITS, FORECAST
0.6
0.6 1
0.6 2
0.6 3
0.6 4
0.6 5
0.6 6
0.6 7
0.6 8
0.6 9
19 94
MAY
19 94
JUN
19 94
JUL
19 94
AUG
19 94
SEP
19 94
OCT
19 94
NOV
19 94
DEC
19 95
JAN
95 % Confidence Interval
Actual
Forecast
Top Related
Copyright © 2022 FDOKUMEN

