


Bahasa
Halaman
Hukum

AN EMPIRICAL ANALYSIS OF COMPETITIVE ADVANTAGE IN UK
RETAILING: IMPACT OF TIIE EXTENDED RBV ON THE MARKETING
CHANNEL FOR WHITE GOODS
by W. J. R. Canagasuriam MBA. ACMA. ACIS.
Thesis submitted to the University of Nottingham
For the degree of Doctor of Business Administration
August 2002
Nottingham Business School
University of Nottingham
GZ, `FRS1TY
I. e
ýßPPQ

ACKNOWLEDGEMENTS
First of all I would like to thank my supervisors Professor Donald Siegel and Sally
McKechnie for guiding me through the most gruelling hurdles I have ever encountered.
Secondly, I thank my family for their support. I owe a special thanks to my good
friend M. B. E. Rudden whose support has been unabated throughout this study. I also
thank my employers for their assistance.
Finally and most importantly this dissertation is dedicated to my children John
and Michelle and to the memory of my parents John and Pearl Canagasuriam.

ABSTRACT
AN EMPIRICAL ANALYSIS OF COMPETITIVE ADVANTAGE IN UK
RETAILING: IMPACT OF THE EXTENDED RIJV ON THE MARKETING CHANNEL
FOR WHITE GOODS.
This dissertation accomplishes several tasks. First it surveys the literature in the
resource-based theory of a firm and retailing for establishing the vital links necessary for
fine heterogeneity in the retail channel for white goods. The review depicts not only the
various dimensions of the concepts of resources, capabilities and competitive behaviour
on competitive advantage but also the specific organisational/inter-organisational and
strategic adaptation capabilities that direct some firms to outperform other firms in this
retail channel.
The empirical analysis for testing competitive advantages included a main survey
analysis that consisted of all retailers and another for the small retailers. A model was
constructed to diffuse simultaneously the critical resources, capabilities and competitive
behaviour to competitive advantages pertaining to this retail channel in the UK.
Furthermore, this method of linking and ranking of key resources and capabilities to
competitive advantages is expected to encourage managers to leverage existing resource
positions into superior future positions. Additionally it is also expected to help regulators
address competitive issues accordingly.
The results indicate that in this retail channel competitive advantages were
associated to key resources and key capabilities. In this study the linking of strategic
adaptive capabilities to key resources highlight retailer branding enhancements from non-

product activities. These non-product activities were a basis for setting ex ante limits to
future competition in this retail channel.
The outcome of the analysis illustrates that efficiency and/or effectiveness of
outlets (key resources) were subject to delivery of customer values from product
portfolios that increased market shares (proxy for competitive advantage) for the retailer
organisations. This study also demonstrates how retailer outlets became a source of
competitive advantage by fulfilling the conditions of value, rarity, inimitability and in-
substitutability.
Finally, this study also reviews the current retail structure of this retail channel to
understand why it could be efficient and effective than its counterparts in Europe. The
result of the two surveys suggests some evidence of imperfect competition and directs
attention not to the concentration of firms but to the imbalances of outlet classes
prevailing in this retail channel. Moreover this study also reveals that the number of small
retailer outlets prevalent in this retail channel may indirectly control to a certain degree
the extent of the advantages of economies of scale/scope that is available to the larger
retailers.
TABLE OF CONTENTS
ACKNOWLEDGEMENTS ...................................................................................... i
ABSTRACT ............................................................................................................. ii
TABLE OF CONTENTS ........................................................................................ iv
LIST OF TABLES ............................................................................................... viii
LIST OF FIGURES ................................................................................................ ix
CHAPTER 1 INTRODUCTION .................................................................. 1
1.1 Overview ............................................................................................................
1
1.2 Aim of study ...................................................................................................... 2
1.3 Contribution .......................................................................................................
6
1.4 Test Area ............................................................................................................ 8
1.5 Organisation of thesis ........................................................................................ 9
CHAPTER 2 INDUSTRY ANALYSIS ....................................................... 11
2.1 Introduction ...................................................................................................... 11
2.2 The nature of the arena in which the competitive activity takes place ............ 13
2.2.1 Industry background .................................................................................. 13
2.2.2 Retail Channel for White Goods ............................................................... 14
2.2.3 Conclusion ................................................................................................. 32
2.2.4 White Goods Industry ................................................................................ 33
2.2.5 Market size ................................................................................................ 35
2.2.6 Market segmentation ................................................................................. 35
2.2.7 Major suppliers .......................................................................................... 37
2.2.8 Conclusion ................................................................................................. 38
2.3 The structure or rules which govern the behaviour of the participants............ 39
2.3.1 Economic Factors ...................................................................................... 39
2.3.2 Environmental Analysis ............................................................................ 40
2.3.3 Trade Associations .................................................................................... 41
2.4 The options available in terms of competitor behaviour ................................. 42
2.4.1 Introduction ............................................................................................... 42
2.4.2 Services Offered by retailers ..................................................................... 43
2.4.2.1 Store Locations - Outlets ........................................................................
43
iv
2.4.2.2 Stocking policy ....................................................................................... 45
2.4.2.3 Own Label brands and exclusive models ............................................... 46
2.4.2.4 Differentiation of product offerings ....................................................... 47
2.4.2.5 Pricing ..................................................................................... .... .... ... 48 ... . . 2.4.2.6 In store service and staff training ........................................................... 49
2.4.2.7 Consumer credit ...................................................................................... 50
2.4.2.8 Promotional credit .................................................................................. 50
2.4.2.9 Delivery and installation of goods .......................................................... 51
2.4.2.10 Non price promotions ........................................................................... 52
2.4.2.11 After sales service ................................................................................. 53 2.4.2.12 Extended warranties ............................................................................. 53
2.4.2.13 Advertising by Retailers ....................................................................... 54 2.4.3 Conclusion ................................................................................................. 54
CHAPTER 3 LITERATURE REVIEW ..................................................... 56
3.1 Introduction ...................................................................................................... 56
3.2 Sources of Competitive advantage ................................................................ ... 57
3.3 Resources and Competitive advantage ......................................................... ... 62
3.4 Competitive Behaviour and Competitive advantage .................................... ... 71
3.5 Capabilities and Competitive advantage .......................................................... 79
3.6 Hypothesis ........................................................................................................ 89 3.6.1 Introduction ............................................................................................... 89
3.6.2 Sources of Competitive Advantage ........................................................... 90
3.6.3 Issues ......................................................................................................... 91
3.6.4 Independent variable: Key resources: ........................................................ 92
3.6.5 Independent variables: Competitive behaviour variables .......................... 94
3.6.6 Independent variable: Inter-organisational capability ............................... 97
3.6.7 Independent variable: Organisational capabilities ..................................... 98
3.6.8 Independent variables: Strategic adaptation capabilities ........................... 99
3.7 Conclusion ..................................................................................................... 105
CHAPTER 4 METHODOLOGY ............................................................. 107
4.1 Introduction .................................................................................................... 107
V

4.2 Scope .............................................................................................................. 107
4.3 Data collection ............................................................................................... 113
4.4 Data and Measures ......................................................................................... 116
4.4.1 Measuring competitive advantage ........................................................... 116
4.4.2 Independent variable: Key resources: ...................................................... 125
4.5 Model construction ........................................................................................ 127
4.6 Conclusion ..................................................................................................... 134
CHAPTER 5 RESULTS AND ANALYSIS ............................................... 136
5.1 Introduction ....................................................................................................
136
5.2 Main Survey ................................................................................................... 137
5.2.1 Regression Results ................................................................................... 137
5.2.2 Multicollinearity ...................................................................................... 141
5.2.3 Testing Regression Assumptions ............................................................. 141
5.3 Small retailer survey ...................................................................................... 144
5.4 Validation of results ....................................................................................... 145
5.5 Variable Analysis ........................................................................................... 147
5.5.1 Independent variable: Key resources ....................................................... 147
5.5.2 Independent variables: Competitive behaviour variables ........................ 148
5.5.3 Independent variable: Inter-organisational capability. ............ 0 ............. 0. 150
5.5.4 Independent variable: Organisational capabilities ................................... 151
5.5.5 Independent variables: Strategic adaptation variables, ............ o- ..... o ...... 152
5.6 Conclusion ..................................................................................................... 154
CHAPTER 6 DISCUSSION ..................................................................... 158
6.1 Introduction .................................................................................................... 15 8
6.2 Contributions of the study .............................................................................. 160
6.2.1 Value and Rarity ...................................................................................... 164
6.2.2 Inimitability ............................................................................................. 168
6.2.3 In-substitutability ..................................................................................... 176
6.2.4 Small retailers .......................................................................................... 179
6.3 Directions for future research ........................................................................ 186
6.4 Managerial implications ................................................................................. 187
vi

6.4.1 Developing retailer strategies .................................................................. 187
6.4.2 Manufacturer / Supplier strategies ........................................................... 192
6.4.3 Regulator ................................................................................................. 196
6.4.4 Other competitive models ........................................................................ 197
6.5 Limitations ..................................................................................................... 198
6.6 Future use of model ....................................................................................... 201
APPENDICES ......................................................................................... 203
Appendix -A........................................................................................................ 204
Appendix -B........................................................................................................ 205
Appendix -C........................................................................................................ 206
Appendix -D........................................................................................................ 207
Appendix -E........................................................................................................ 208
Appendix -F........................................................................................................ 209
Appendix -F........................................................................................................ 210
BIBLIOGRAPHY ................................................................................... 211
VII
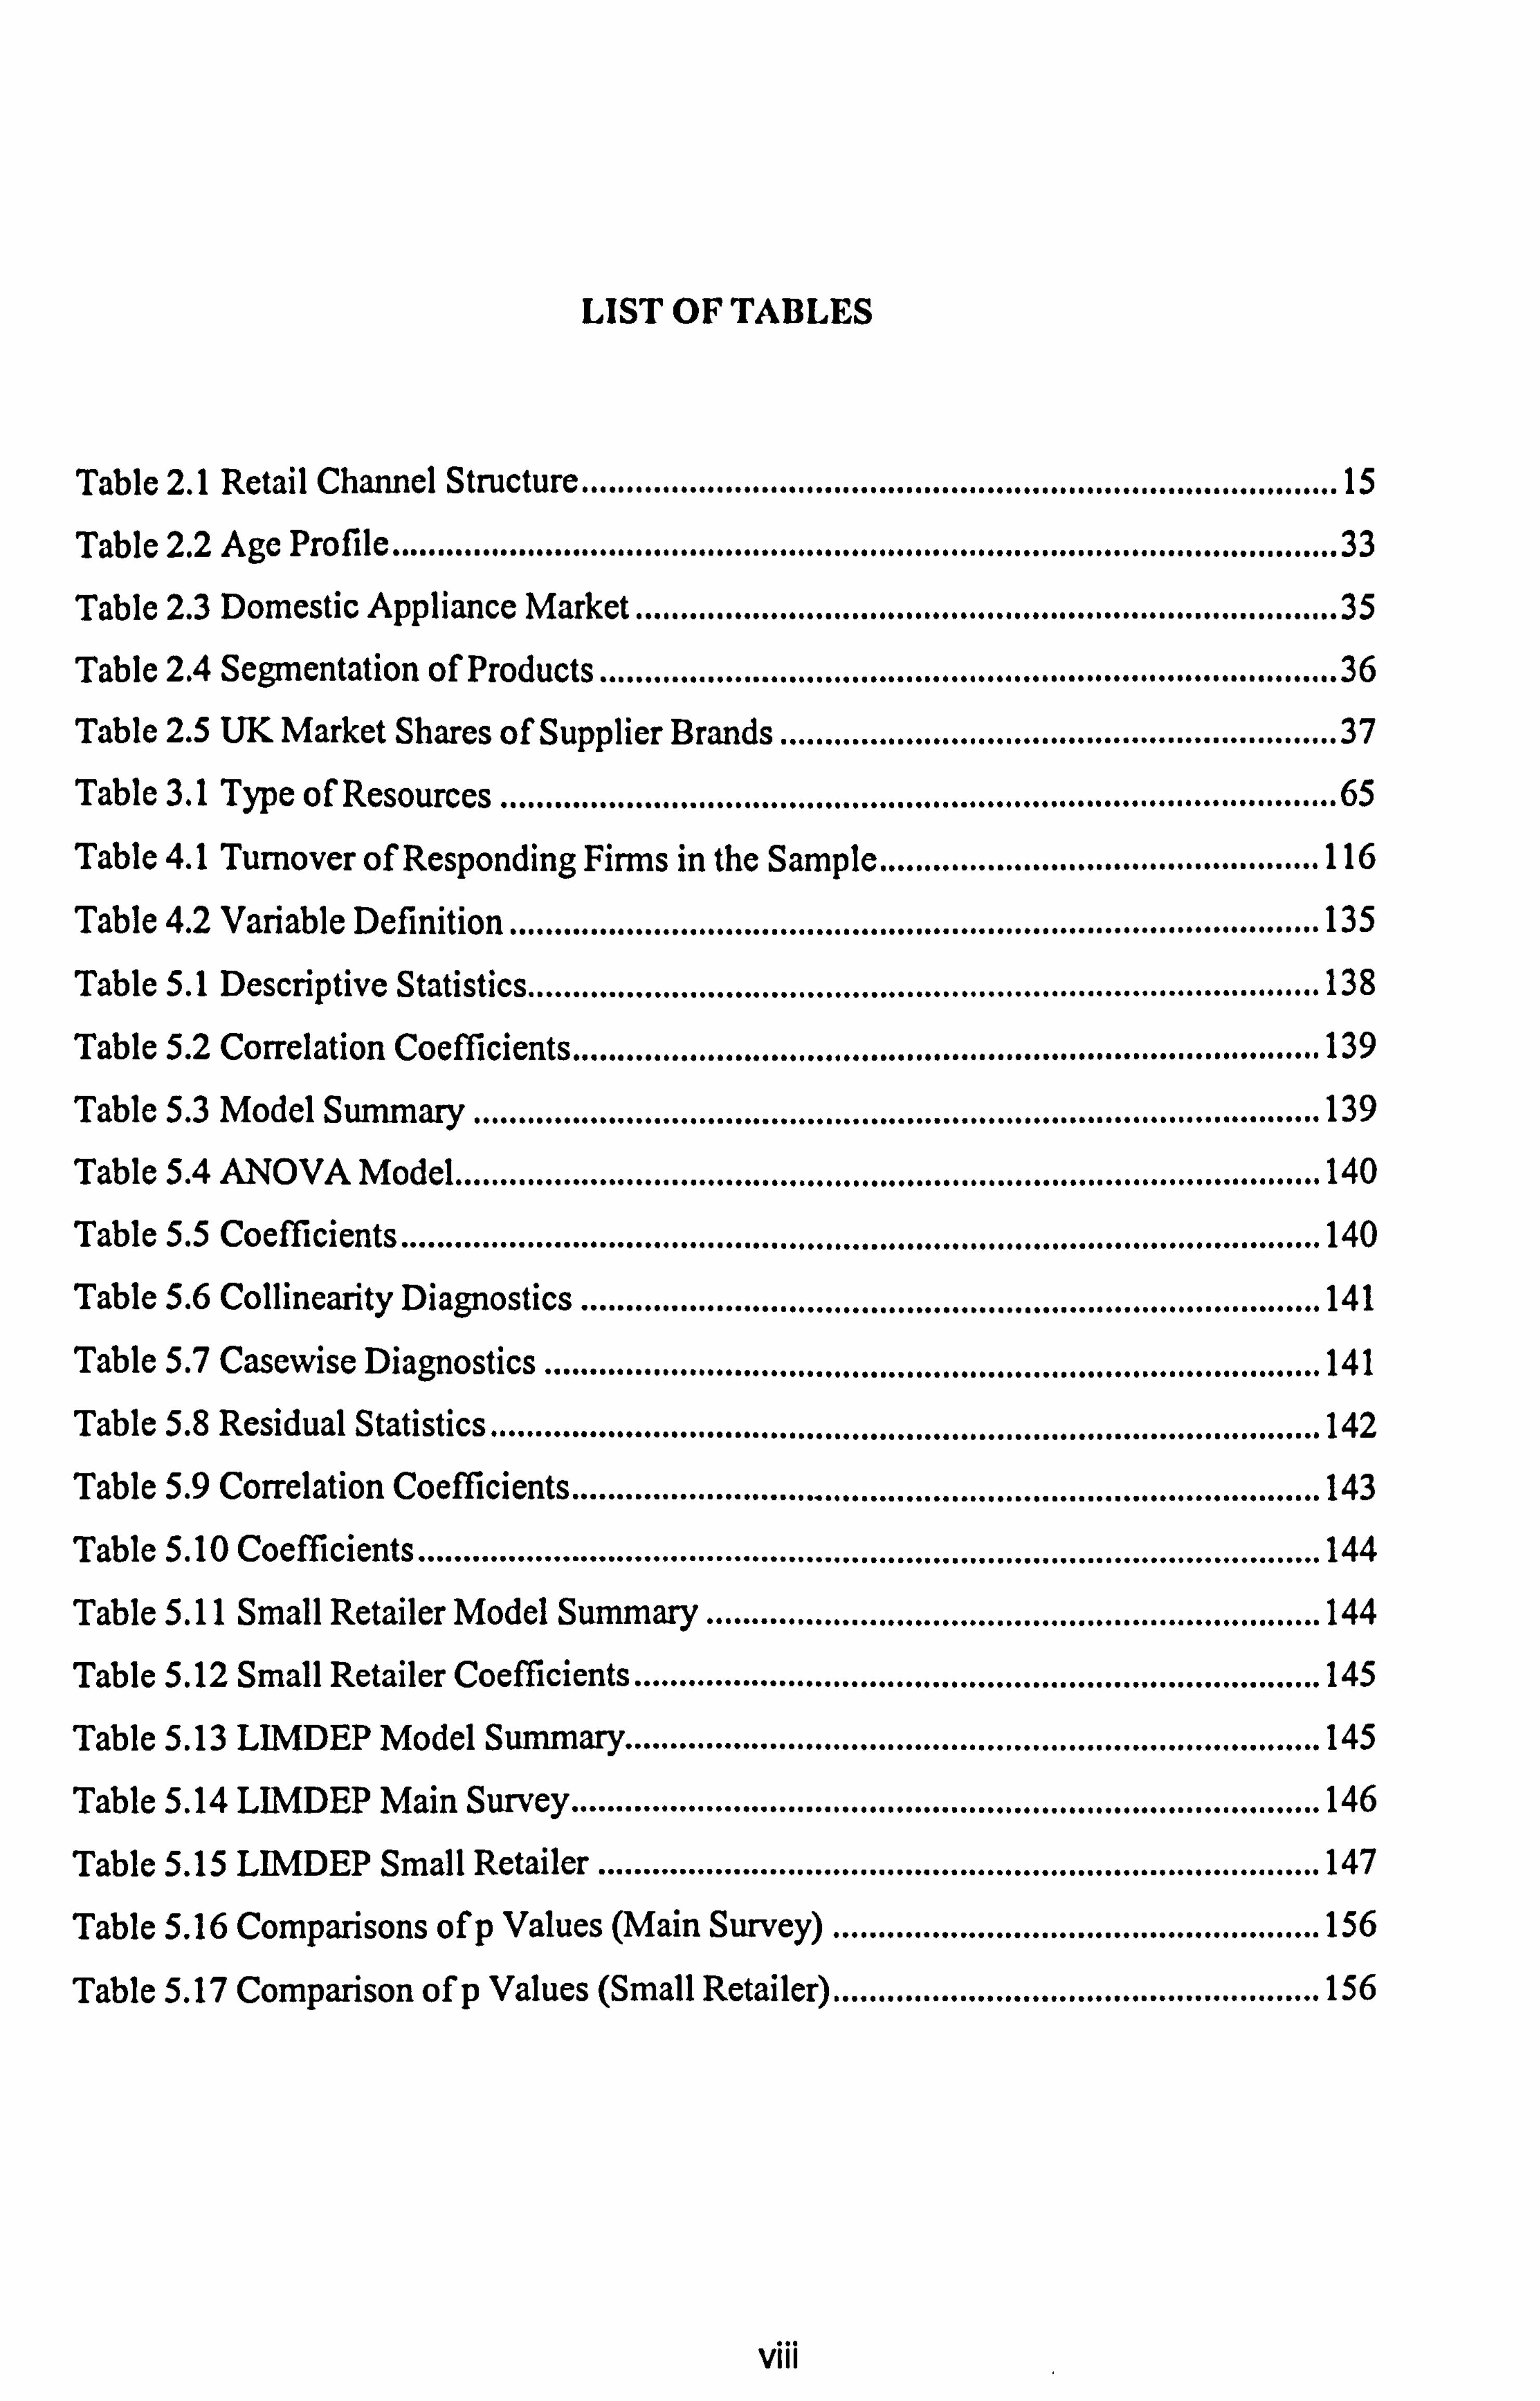
LIST OF TABLES
Table 2.1 Retail Channel Structure .................................................................................... 15
Table 2.2 Age Profile ....................................................................................................... .. 33
Table 2.3 Domestic Appliance Market ............................................................................ .. 35
Table 2.4 Segmentation of Products ................................................................................ .. 36
Table 2.5 UK Market Shares of Supplier Brands ............................................................ .. 37
Table 3.1 Type of Resources ........................................................................................... .. 65
Table 4.1 Turnover of Responding Firms in the Sample ................................................. 116
Table 4.2 Variable Definition .......................................................................................... 135
Table 5.1 Descriptive Statistics ........................................................................................ 138
Table 5.2 Correlation Coefficients ................................................................................... 139
Table 5.3 Model Summary .............................................................................................. 139
Table 5.4 ANOVA Model ................................................................................................ 140
Table 5.5 Coefficients ...................................................................................................... 140 Table 5.6 Collinearity Diagnostics .................................................................................. 141
Table 5.7 Casewise Diagnostics ...................................................................................... 141
Table 5.8 Residual Statistics ............................................................................................ 142
Table 5.9 Correlation Coefficients ................................................................................... 143 Table 5.10 Coefficients .................................................................................................... 144
Table 5.11 Small Retailer Model Summary .................................................................... 144
Table 5.12 Small Retailer Coefficients ............................................................................ 145
Table 5.13 LIMDEP Model Summary ............................................................................. 145
Table 5.14 LIMDEP Main Survey ................................................................................... 146
Table 5.15 LIMDEP Small Retailer ................................................................................ 147
Table 5.16 Comparisons of p Values (Main Survey) ...................................................... 156
Table 5.17 Comparison of p Values (Small Retailer) ...................................................... 156
viii

LIST OF FIGURES
Figure 1. A competition model .......................................................................................... 91
Figure 2. RBV Flow Model ............................................................................................. 105
Figure 3. Framework for competitive advantage ............................................................. 119
Figure 4. A Resource Based Model ................................................................................. 130
ix

Chapter One Introduction
Chapter 1
Introduction
1.1 Overview
The proclamation that resources and capabilities of a firm are the sources of
abnormal rent generation and sustainable competitive advantage is a resource-based view
(RBV) of strategic management (Wernerfelt, 1984; Barney, 1986; Amit and Schoemaker,
1993). Several researchers have examined and contributed to this theory which has an
`inside-out' view compared to Porter's `outside-in' view (Mintzberg et al., 1998). It is an
internal focus within which a firm looks to exploit the properties of its resources and
strategic factor market imperfections.
Although the RBV has been the centrepiece in recent literature, its application in
industry has raised uncertainty in its current framework. RBV appears to have failed to
demonstrate how firms make or do not make rational resource choices in the pursuit of
economic rent and/or sustainable competitive advantage (Oliver, 1997). This may be due
to the difficulties associated in the identification and measurement of valuable resources
and capabilities of an industry's specific assets, as there are a few empirical studies based
on this perspective at present. The dissatisfaction of the current frameworks seems to
point to possible ambiguities associated with firm's resources and the equation of
strategic advantages with organisational uniqueness (Mintzberg et al., 1998). Oliver
(1997) also states that resource based researchers have not gone beyond resource
properties and resource markets to explain firm heterogeneity.
On the other hand, some researchers were calling for organisational based theory
of competitive advantage (Barney and Zajac, 1994), and a convergence between
1

Chapter One Introduction
Institutional theory and RBV (Rao, 1994). A paper on dynamic capabilities (Eisenhardt
and Martin, 2000) concluded that traditional RBV misidentifies the locus of long term
competitive advantage in dynamic markets. Recently the RBV came under further attack.
Priem and Butler (2001) state that RBV is tautological and argue that the external
determination of value as defined by Barney (1991) is enough by itself to limit RBV's
prescriptive ability for practitioners. Coincidentally despite this attack, in the recent past
many theorists have assessed the impact the diffusion of RBV has had on the field of
strategy and cognate business activities and have reacted positively. The growing
popularity of RBV linked with entrepreneurship (Alvarez and Busenitz, 2001), marketing
(Srivastava, 2001) and economics (Lockett and Thompson, 2001) is to name just a few
and an opportunity presents itself here to link retailing with RBV.
In retailing Dobson and Waterson (1996) state that the influences of small
independent establishments have substantially diminished in recent times as the
exploitation of economies have led to a few firms controlling a considerable slice of the
market. A recent study by Miller et al. (1999), however, implies that there are mutually
beneficial relationships among different types of retailers rather than an overwhelming
competitive advantage for larger stores. Finally, in the MMC investigation in 1995, it was
claimed that the retail channel for white goods was much more efficient than its
counterparts in Europe (MMC 1997, Volume 11, pp. 109). This study provides the
opportunity to test this claim by probing into the structure of this retail channel and its
workings.
1.2 Aim of study
Based on the positive impact the diffusion of RBV has had on the field of strategy
and cognate business activities it was appropriate to look beyond a singular view using
2

Chapter One Introduction
multiple theoretical approaches to extract the richer descriptions of organisational actions,
their antecedents, and their consequences (Gray and Wood, 1991). Encouraged by this
thought I have set about to test competitive advantage in a specific retail channel that
links RBV to retailing for explanations for firm heterogeneity in terms of firm efficiencies
and effectiveness. A resource based view of a firm claims competitive advantage as an
offshoot of the reaction caused by a team of deployed resources that produce unique
capabilities of corporation and co-ordination within such teams (Grant, 1991).
In order to investigate firm differences, two separate analysis will be conducted
on key resources and key capabilities related to the retail channel for white goods in the
UK. The analysis for the main survey will include all retailers followed by another for the
small retailers with less than 5 outlets. This will be followed by testing competitive
advantage in which a model will be proposed to facilitate not only the inclusion of key
variables predicted by RBV but also variables relating to retailing. For this retail channel
I propose that resources and capabilities are associated with competitive advantage.
The research questions are therefore:
a) Is competitive advantage in the retail channel for white goods associated with key
resources and capabilities?
b) Does the ability of the key resource(s) to manipulate other resources and capabilities
result in product portfolios that maximise returns and/or increase market shares for its
shareholders?
The testing of the association of competitive advantages with resources and
capabilities will be based on the following premise. A firm is said to have competitive
advantage when it is implementing a value creating strategy not simultaneously
implemented by current or potential competitors (Barney, 1991). Firms become efficient
and effective from firm activities driven by key resource(s) and facilitated by
3

Chapter One Introduction
organisational relationships that manipulate firms resource bases ensuring the potential
for the key resource is fulfilled over time. In this retail channel, the delivery of customer
values is connected to holding product portfolios that maximise returns and/or increase
market shares for the shareholders. Market shares are used as a proxy for competitive
advantages in this study. Value maximisation of key resources is internal to the firm and
increases over time, subsequently making outlets valuable, rare, inimitable, non-
substitutable, non-transferable, and highly marketable.
The model developed in this study is driven primarily by firm key resource(s) and
is set on the following premise: competitor strategies and the origins of competitor
behaviour depict why firms are where they are today and how they got there. Strategy
implementations are steered by both organisational and inter organisational relationships
and are path driven.
To develop strategic assets firms require working capital. The elements of
working capital provide short-term resources and the activities i. e. strategic adaptation
capabilities, within the composition of working capital may be related to the product
and/or non-product activities of the firm. These activities have the potential for setting ex
ante limits to future competition.
Furthermore, one of the conclusions of the 1969 MMC report on RRPs
(recommended retail prices) was that the recommendations of resale prices, in
conjunction with factors such as restriction of outlets and monopoly in the supply
industry, might prevent price competition in retailing (MMC 1997, Vol. 1 pp. 49). This
study intends to review the current retail structure not in terms of concentration of firms
within this retail channel but in terms of outlets in order to verify the 1969 MMC
recommendations on the restrictions of outlets.
4

Chapter One Introduction
White goods were chosen in preference to electrical goods for various reasons.
White goods are the largest product line with a turnover of about £2.2 billion pounds
within the total domestic appliance market. The total turnover of this market was about
£2.8 billion pounds in which about 80% were accounted by white goods. White goods are
household appliances that include home laundry products, cold storage products, cooking
products and dishwashers. However the retail channel for white goods is also the channel
for brown goods and some retailers trade in both product lines.
Furthermore, the Chicago approach considers retailing function to be basically
perfectly competitive. However, Dobson and Waterson, (1996) contend that perfect
competition is not evident in most areas of retailing and that market power in a limited
form is the more likely norm. They further state that the sources of market power are:
barriers to entry, economies of scale / scope, national / local market power and retailer
differentiation of services. Therefore the use of white goods may serve the purpose of
testing whether the domestic appliance market is perfectly or imperfectly competitive
bearing in mind that white goods are the largest product line accounting for nearly 80% of
the total domestic appliance market. Likewise other markets could also be tested for the
type of competition that prevails by comparing the results against the model of perfect
competition.
Moreover if the sources of market power were detected i. e. especially economies
of scale/scope it may present an opportunity for other retailers to enter this retail channel
in order to take advantage of these benefits. This may be beneficial to competition on the
whole. Additionally, white goods, is not the only product line that flows through this
retail channel. The composition of electrical goods contains both white and brown goods
and the retailers could be participating in both to utilise the synergies triggered by their
shared resources and capability profiles. Therefore the retailer selection of an efficient
5

Chapter One Introduction
and effective portfolio of product lines feeding different markets could result in multiple
economies of scale/scope. Hence this dichotomy is expected to reveal whether the
retailers could exploit multiple economies of scale/scope in a retail channel. The
understanding of white goods retailing may be a stepping stone for better understanding
of electrical goods retailing in the UK.
Finally, the empirical analysis in the retail channel for white goods and use of the
extended RBV initiate the opportunity to investigate how the current market leaders
arrived and maintained their market positions in this retail channel. Dixon and Comet
have held on to their market positions for over a decade. The study of their resources and
capability profiles together with those of other retailers may also contribute towards
understanding how competitive advantage is sustained in a retail channel.
1.3 Contribution
It should be emphasised from the outset that this study offers a partial analysis of
the resource based view of firms in an industry. It does not purport to examine the
resources of firms collectively operating in an industry instead it looks at resources of
firms applied to the retail channel in an industry. Thus this study nevertheless attempts to
stretch the understanding of the RBV by linking competitive advantage with resources
and capabilities relevant to the retail channel for white goods. The inclusion of the
organisational perspective within the RBV indicates that it is empirically valid and non-
tautological as it illustrates that resource values are internal to the firm and were subject
to managerial manipulation of other resources and capabilities.
A model was constructed to diffuse simultaneously the critical resources,
capabilities and competitive behaviour to competitive advantages pertaining to this retail
channel in the UK. This model was put to the test via two individual surveys i. e. the main
6

Chapter One Introduction
survey and the small retailer survey. The results of both surveys were facilitated by the
SPSS and LIMDEP software packages. Five out of the nine hypotheses were significant.
The linking and ranking of key resources and key capabilities to competitive advantage is
expected to encourage managers to leverage existing resource positions into superior
future positions (Winter, 1995; Dierickx and Cool, 1989), but also help regulators to
address competitive issues accordingly. Additionally it is also expected to help regulators
address competitive issues accordingly.
This study demonstrates that for sustaining competitive advantage the
implementation of a value creating strategy that is not simultaneously implemented by
current or potential competitors is important. These value creating, strategies correspond
to the prevailing market structure at that time. Furthermore it also highlights the
conditions and namely the linking of value, rarity, inimitability and insubstitutability
factors that are essential for a resource to be a source of competitive advantage. This
study provides the evidence that the retail channel for white goods is primarily driven by
key resources and supplemented by inter organisational and organisational capabilities.
Moreover the key resources were the outlets and traces of imperfect competition were
detected in this retail channel.
For outlets to be valuable in this retail channel, superior firms had to have the
capacity to display and deliver customer values. Effective and efficient capacity
utilisation of outlets equates to delivering customer values from product portfolios that
maximise returns and/or increase market shares for retailer organisations. For the large
retailers exclusive deals were important as it ensured economies of scale/scope, whilst for
the small retailer the listing of efficient product portfolios was significant.
Two of the four strategic adaptation capability variables were tested: namely, third
party credit card usage; and promotions displayed heterogeneity between firms and their
7

Chapter One Introduction
linking with resources demonstrated the enhancement of retail branding from non-product
activities. These non-product activities depicted how ex ante limits to competition were
set in this retail channel.
The competitor behaviour variable age explained the importance of early mover
advantages and the location effects for the small retailers. The analysis indicated that
several small retailers (r-strategists) had occupied the product market space earlier,
followed by the entry of the current market leaders i. e. national multiples (k-generalists)
latter into the retail channel. Moreover the strategies of quicker deliveries were more
important to smaller retailers.
Finally, this study reviewed the current retail structure of this retail channel here
in the UK to understand why it could be efficient and effective than its counterparts in
Europe. The result of the two surveys suggests some evidence of imperfect competition
and directs attention not to the concentration of firms but to the imbalances of outlet
classes prevailing in this retail channel. Moreover, this study also reveals that the number
of small retailer outlets prevalent in this retail channel may to a certain degree control the
extent of the advantages of economies of scale/scope that is available to the larger
retailers. Furthermore, based on the results of this study, it is questionable whether the
1969 MMC recommendations on the restrictions of outlets still stand.
1.4 Test Area
I intend to test competitive advantage by analysing firstly the white goods industry
in the UK. The white goods industry is a mature industry dealing in domestic appliances.
The appliances are said to be mature and continual improvements are made on reliability,
usage and appearance of these products. Appliances manufactured are sold mainly
through retailers. The structure of the suppliers mirrors that of the retailers i. e. few
8

Chapter One Introduction
retailers/suppliers hold major market shares. There is excess capacity in this industry and
is believed to be a deterrent for new entrants into this industry.
The area tested is the retail channel for white goods in the UK, where white goods
are specified as electrical goods. The use of white goods as a single trade line is
consistent with previous research. Retailing is a very competitive and any successful
innovation or exploitable differential advantage is quickly analysed, avoided and/or
adopted by rival retailing concerns (Oliver, 1990).
1.5 Organisation of thesis
Chapter 2 is an industry analysis chapter that ponders on research design and is
intended to direct the researcher towards a choice of research strategy required for the
present study. The focus will be on the research question in hand, the possible degree of
investigator control and the contemporary events. This chapter contains information on
the structures of both the white goods industry and the retail channel for white goods
followed by sections that describes the rules and options open for competitive behaviour
in the retail channel for white goods.
Chapter 3 reviews the literature and lays the theoretical foundations that links
RBV with retailing. The main purpose of this chapter is to highlight the researchers
understanding of the interplay between competitive advantage and its main components,
namely resources, capabilities, and competitive behaviour in the retail channel for white
goods. In this chapter, nine hypotheses will be proposed to facilitate the testing of
competitive advantages in this retail channel.
Chapter 4 explains the methodological and empirical considerations. This chapter
describes how the research was conducted and implemented together with some
justifications of the approach used in this survey. The contents of this chapter also
9

Chapter One Introduction
describe how data and measures of data were selected establishing links with the retail
channel, the results and analysis chapters. Furthermore in this chapter a model will be
constructed to diffuse simultaneously the critical resources, capabilities and competitive
behaviour to competitive advantages. This model is expected to facilitate the testing of
the associations of competitive advantage with key resources and capabilities pertaining
to the retail channel in the UK
The results and analysis covered in chapter 5 contemplates on multiple regression
analysis of the variables selected for analysis. A confirmatory model inclusive of all the
independent variables will be tested using SPSS in the first instance to test the effects of
the overall model fit before and after any violations for the main survey as well as for the
small retailer survey. The results will then be validated using LIMDEP selected for its
inbuilt facility to adjust for issues relating to heteroskedasticity. The
significance/insignificance of the variables selected is expected to demonstrate the
associations and also their ranking with competitive advantages.
The final chapter 6 is directed mainly to discussions of the findings of the enquiry.
The survey has attempted to demonstrate how firms can make resource selections using
RBV and the importance of organisational influences that manage these resource
decisions in their search for competitive advantages. In this chapter the use of the model
constructed for this survey will also be put to the test in addressing some of the issues
raised in the MMC survey of the suppliers of white goods. The limitations of the study
together with the managerial implications and recommendations for future research will
draw the thesis to a close.
10

Chapter Two Industry Analysis
Chapter 2
Industry Analysis
2.1 Introduction
The area tested is the retail channel for white goods in the UK, where white goods
are specified as electrical goods. Retailing is a very competitive and any successful
innovation or exploitable differential advantage is quickly analysed, avoided and/or
adopted by rival retailing concerns (Oliver, 1990). It is an important channel in which the
linking of RBV and retailing can give insights to how fines go about transforming their
resources and capabilities into competitive advantages.
The industrial organisations dominant paradigm, known as structure-conduct-
performance (SCP), suggests that a firm's performance is the result of competitive
interaction. The conduct of firms in an industry is determined by the structure of the
industry, which identifies a set of industry conditions that impact on behaviour and
performance of firms. The SCP nevertheless separates competition from competitors but
RBV suggests that the structural features of an industry are the results of the
organisational capabilities of its constituent firms, which have accumulated over time
(Cockburn et al., 2000). For this study, the linking of RBV, SCP and retailing brings
together the firms value creation processes in a retail channel in which the identification
of strategic investments that activate these internal activities are imperative for firm
heterogeneity.
The aim of this study was to demonstrate the associations of resources and
capabilities with competitive advantage in a specific retail channel. The research
questions for this study were identified as:
11

Chapter Two Industry Analysis
a) Is competitive advantage in the retail channel for white goods associated with key
resources and capabilities?
b) Does the ability of the key resource(s) to manipulate other resources and capabilities
result in product portfolio's that maximise returns and/or increase market shares for
its shareholders?
In order to achieve this objective it is necessary to explain firm heterogeneity in
terms of firm activities that lead to firm efficiencies/effectiveness. This chapter contains
the information needed for research design in which factors (variables) relevant to both
large and small retailers would be considered. Factors can have a range of values and can
be examined at many levels. If all the factors are varied across the same number of levels,
the research design will be simpler. In this study an opportunity presents itself to conduct
two surveys i. e. one for the whole population and one for the small retailers. This
approach was thought to be important as competitive advantages may be appropriate to
local markets and furthermore the understanding of the survival patterns of small retailers
was also important for this study.
The selection of the response variable is crucial. Care should be taken to ensure
that the selected response variable provides useful information about the process under
study. This chapter contains information that has direct links to methodology, results and
analysis chapters. Initially it also identifies the structures of the white goods industry and
the retail channel for white goods followed by the description of the rules that govern the
behaviour of participants and the options open for competitive behaviour in the retail
channel for white goods. Furthermore, the research design results will be analysed in this
study by using established statistical methods to draw objective conclusions rather than
subjective ones. This means the qualities of statistical conclusions will depend on the
quality of the information extracted from the research itself.
12

Chapter Two Industry Analysis
Most of the information relating to the retail channel for white goods was obtained
from the extensive research material produced by The Monopolies and Mergers
Commission (MMC 1997, Volume 11) report on the supply of Domestic Electrical Goods
in the UK. The domestic electrical goods considered in this study are washing machines,
tumble dryers, dishwashers, cold food storage equipment, cookers and microwave ovens.
The information relating to warehousing was obtained from the databases of a large
supplier. Whilst some information produced below may have changed, every effort has
been made to keep it up to date where possible.
2.2 The nature of the arena in which the competitive activity takes place
2.2.1 Industry background
Individual firms may own the resources that grant market power. A prerequisite
for market power is barriers to entry (Grant, 1991). A firms market share will not only
indicate its relative powers, but also indicate the time span and the resources and
capabilities required for reaching desired heights. In this retail channel scale economies
and experience advantages may be significant contributors to competitive advantage and
it is imperative to understand the structure of the retail channel concerned.
The process for determining efficiencies and/or effectiveness internal to the firm
is nevertheless subject to some rules. The industry regulations give rise to what options
there are for competition in this retail channel. The structure-conduct-performance (SCP)
paradigm suggests a firm performance is the result of competitive interactions and that
the conduct of firms is determined by the structure of the industry where a firm competes
and identifies a set of industry conditions that have impacts on both behaviour and
performance of firms.
13

Chapter Two Industry Analysis
The conduct is determined by the structure of the industry where the firms
compete. Conduct is based on the decisions made by an individual firm on, for example,
prices, building capacity, advertising capacity and the investments in research and
development. The structure is measured by the properties of the industry, which for
example, are number and size of firms (concentration), advertising intensity, capital
intensity, concentration of suppliers and customers, the extent of product differentiation
and barriers to entry.
The environment could suit a dynamic market, a moderately dynamic market or a
volatile market. In each of these markets, firms compete to achieve competitive positions
in order to earn superior profits and/or increased market share through a single strategy
i. e. cost focus, product differentiation, market focus or a mix of strategies. Therefore in
order to capture a customer base, each firm would choose a strategy based on its
foundations (Stinchcombe, 2000) and/or gain competitive position based on a selected
strategy or a mix of strategies applicable for both current or future environments
(Cockburn et al., 2000). The r-strategists enter a new resource space at an early stage
when few firms are present in the product-market space. They are flexible and inefficient
due to lack of experience, whereas k-generalists join later after several r-strategists have
entered a new environment. The k-generalists enter this new environment with their
extensive experience and exploit their advantage of greater efficiency.
2.2.2 Retail Channel for White Goods
The sampling frame in this study relates to the retail channel for white goods.
Retailing is a very competitive and highly imitative industry in the UK, and any
successful innovation or exploitable differential advantage is quickly analysed, avoided
14
Chapter Two Industry Analysis
and/or adopted by rival retailing concerns (Oliver, 1990). White goods are sold mainly
through retailers and are an important intermediary in the UK.
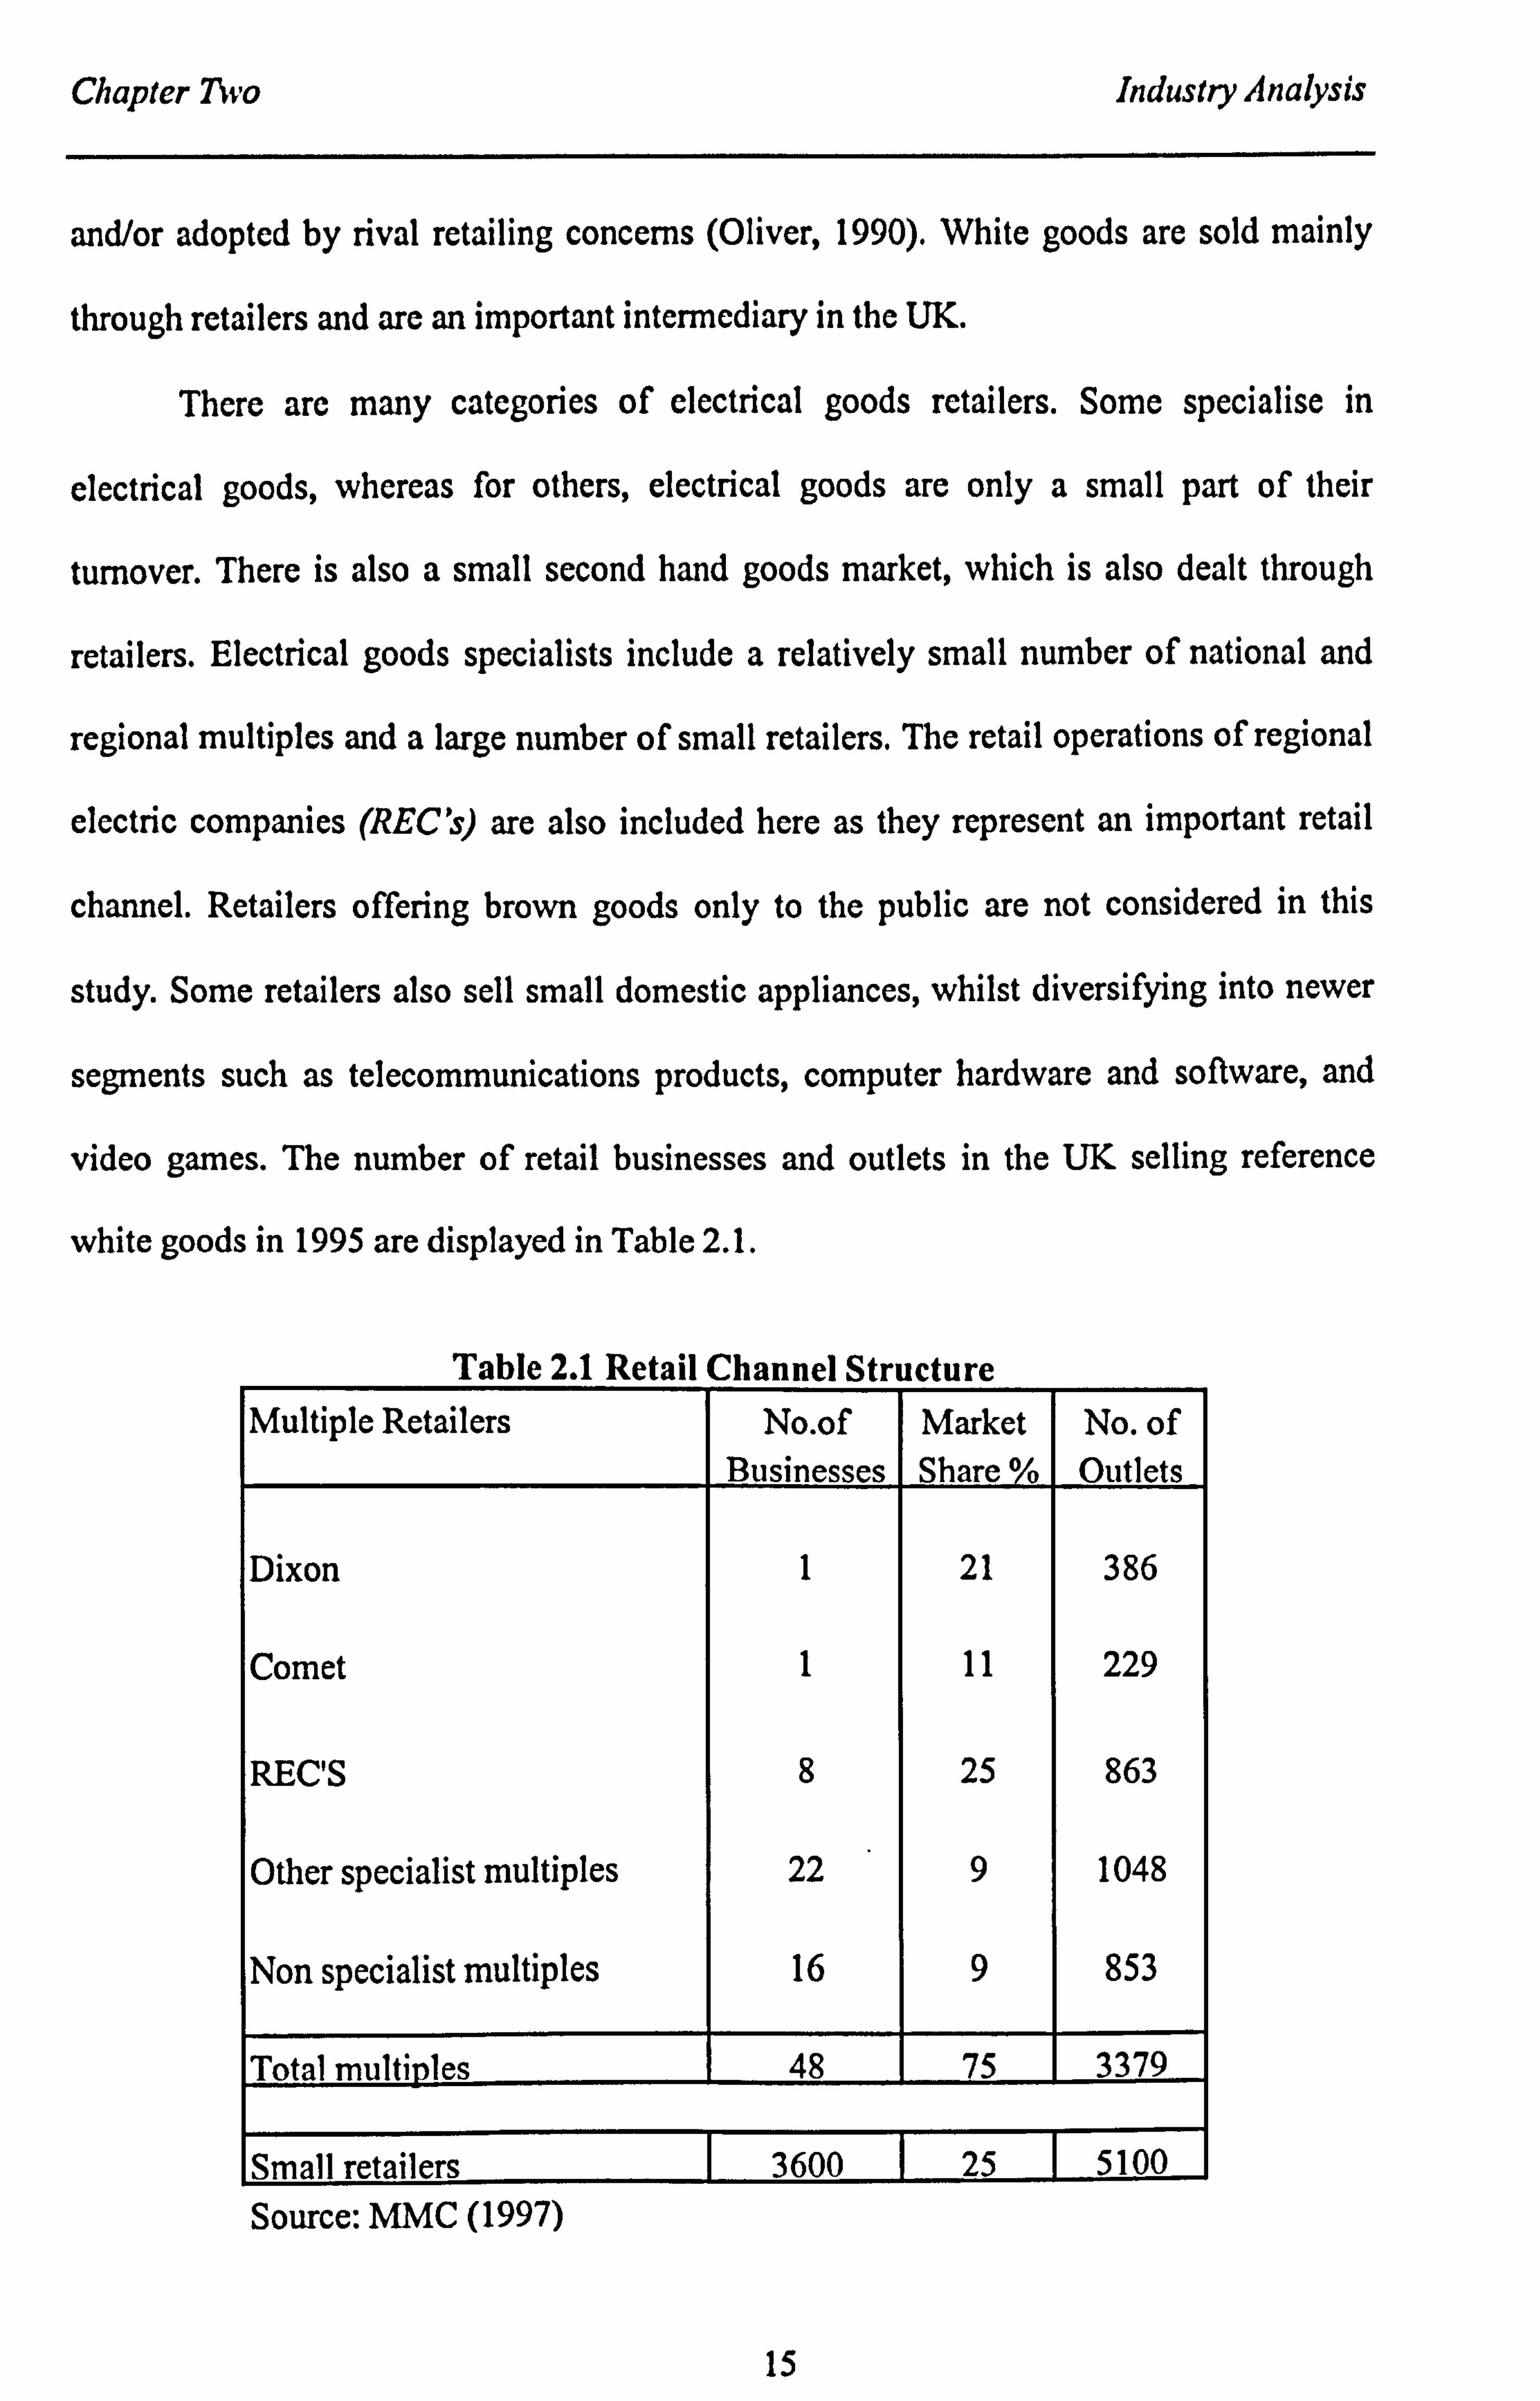
There are many categories of electrical goods retailers. Some specialise in
electrical goods, whereas for others, electrical goods are only a small part of their
turnover. There is also a small second hand goods market, which is also dealt through
retailers. Electrical goods specialists include a relatively small number of national and
regional multiples and a large number of small retailers. The retail operations of regional
electric companies (REC's) are also included here as they represent an important retail
channel. Retailers offering brown goods only to the public are not considered in this
study. Some retailers also sell small domestic appliances, whilst diversifying into newer
segments such as telecommunications products, computer hardware and software, and
video games. The number of retail businesses and outlets in the UK selling reference
white goods in 1995 are displayed in Table 2.1.
Table 2.1 Retail Channel Structure
Multiple Retailers No. of Market No. of Businesses Share %o Outlets
Dixon 1 21 386
Comet 1 11 229
REC'S 8 25 863
Other specialist multiples 22 9 1048
Non specialist multiples 16 9 853
Total multi les 48 75 3379
Small retailers 3600 25 5100 Source: MMC (1997)
15

Chapter Two Industry Analysis
Therefore, in order to test firm efficiencies and/or effectiveness it is necessary to draw
boundaries so that those firms competing in this product-market space can be captured. A
collection of firms with similar activities in this allocated space thus forms the retail
channel structure and is described below.
National multiples
There are only two specialist electrical goods retailers with operations across UK.
Dixons Group plc
Dixons was incorporated in 1937 under the name Dixon Studios Ltd. The original
business was in portrait photography. In the mid 1940s the main activity was the retail
sale of photographic equipment and optical products. The company gained listing on the
London Stock Exchange in 1962 and expanded rapidly through organic growth and
acquisitions, diversifying into audio and television, extending its range into VCRs, hi-fi,
microwave-ovens, computers and other electronic products.
In 1984 Dixons acquired Curry's Group plc, a national retailer of white and brown
goods and Mastercare Ltd (Mastercare), its servicing subsidiary. In 1988 it bought
Wigfalls plc, a chain of 106 electrical stores mainly in northern England, which were then
integrated into the Dixons and Curry's organisations. In 1993 Dixons sold its retail
operations in the USA and its UK property divisions, leaving a European property
division and UK retail division. The main arm of the UK Retail division is DSG Retail
Ltd (DSG) which is the principal operating division. DSG operates the Dixons and
Curry's stores and has limited mail order operations made under the names of Partmaste,
and Dixons Direct. DSG also owns the PC World and The Link chains selling computer
and telecommunications products. The other operating units include Mastercare, which
16

Chapter Two Industry Analysis
provides a repair and after-sales service for products supplied by DSG stores and
Coverplan Insurance Services plc, which provides extended warranty insurance and
manages consumer credit. DSG (Far East) provides quality control for exclusive brands
supplied by Far Eastern suppliers.
In 1995 there were 353 Dixons high street stores which did not stock white goods
and is expected that they will remain as a high street store for many years carrying out
personal electronics sales. There were 386 Curry's stores of which 195 were in the high
streets and 191 out of town in Great Britain and Northern Ireland. The market was
developing for out of town stores as customers wanted choice and hence the space to
display a variety of models has increased. Curry's carry both white and brown goods. 19
warehouses service both chains, and a central department within DSG, has responsibilities
for buying, advertising, merchandising, security etc. There was also a single management
information system, a common distribution network and integrated after service support.
Bulk purchasing backs supply arrangements. Dixons has one own-label reference white
goods brand - Nova Scotia (CFS products), and home-laundry products manufactured and
sold under the Currys label.
Comet Group plc
In 1933 Comet began as Comet Battery Service (Hull) renting out charged
accumulators for radio receivers. It then moved on into the sale and rental of radio-sets
and televisions. The main purpose of Comets activities was aggressive price discounting
backed up by extensive advertising. Comet was the pioneer of the edge of town discount
stores.
In 1983 it was selling the full range of white and brown goods from 180
warehouses, making it the largest retailer of domestic electrical goods ahead of Curry's.
17

Chapter Two Industry Analysis
In 1984 Kingfisher then known as Woolworth Holdings acquired Comet. The acquisition
of other multiple retailers such as Ultimate in 1987, Connect Chain in Northern Ireland in
1988 and Laskys in 1989 reinforced Comet's activities, thereby enabling it to be the
second largest UK retailer of electrical goods after Dixons. Comet is one of the principal
subsidiaries of Kingfisher, which is also the parent company of B&Q plc and operates
the leading chain of DIY centres in the UK and stocks some white goods. In 1993
Kingfisher acquired Etablissements Darty et Fils SA (Darty), the leading specialist retailer
of domestic electrical goods in France. This enabled Kingfisher to become the second
largest specialist domestic electrical retailing group in Europe. Darcy and Coniet are
managed as separate entities because of differences in product specifications between the
UK and France and there is little common purchasing between the two entities. In 1996
Comet purchased NORWEB, and integrated some of NORWEB's out of town stores with
its own facilities. NORWEB's 57 high street shops were closed as a result of this deal.
Comet has moved away from sales proposition based purely on discount prices and offers
not only white and brown goods but also telecommunications and computer products.
Comet has supply agreements, which gives it exclusive use of brand names in the
UK and exclusive distribution rights for products. VestFrost and Blomberg AG supply
products under their own names. There are also other arrangements regarding supply with
the option that some manufacturers retain the right to sell the same product under
different brand names to other UK customers. There are 3 warehouses to store Comet's
bulk purchases.
The Regional Electricity Companies (REC)
The structure of REC is important to all suppliers because of the Electra brand it
owns through Electra Brands Ltd (EBL). Each individual shareholder is free to
18

Chapter Two Industry Analysis
commission products under the Electra brand and orders them directly from any supplier.
EBL has the power to reject an application to become an EBL licensee and a shareholder
based on material change in the ultimate control or ownership of the user.
Before privatisation there were 12 English and Welsh Regional Electricity
Companies, the 2 Scottish Electricity Companies and Northern Ireland Electric
Companies (NIE plc) and they all had retail operations. The REC's refer to these retail
operations and also to those companies that acquired the businesses of regional
companies.
The retail outlets of the regional companies were set up for two purposes:
a) to sell appliances that consumed large quantities of electricity and,
b) to act as payment centres for electricity bills.
These premises were situated mostly in traditional high street locations and a few
in out of town locations. The 12 regional electricity companies in England and Wales
were privatised in December 1990 followed by the two Scottish electricity companies in
April 1991 and NIE in June 1993.
After privatisation, these quoted companies came under increased pressure to
improve their financial performance, which led to reviewing their retail operations. The
RECs product ranges resembled those of electrical retailers and their income from their
affiliated supply businesses was thereby reduced or removed. Several RFC's expanded
their retail operations into additional out of town locations and beyond their traditional
boundaries, which were the authorised areas designated in their Public Electricity Supply
licence. This expansion was facilitated by the acquisition of retail operations of other
RECs in their territories and a few mergers. The overall result was that only a few
prospered whilst others withdrew from retailing electrical goods altogether.
19
Chapter Two Industry Analysis
ScottishPower expanded by acquiring superstores from other retailers which were
in either liquidation or were withdrawing from electrical goods retailing altogether. These
acquisitions led to 75 shops and 17 superstores trading as ScottishPower in Scotland and
46 superstores trading as Electricity plus in England and Wales.
NOR WEB expanded its operations by opening new out of town stores moving
outside the borders of its parent's authorised area to cover the Midlands, Yorkshire and
parts of the Southeast. In 1995 South Wester: Electricity plc withdrew from retailing and
NOR WEB acquired part of its business with 18 superstores and 16 high street shops
thereby coming closer to covering the whole of England and Wales. In 1995 NOR WEB
was acquired by Northwest Water plc and from 1996 the combined company traded as
United Utilities plc. In November 1996 United Utilities sold the loan portfolio to
Lombard Tricity Finance ltd and then sold the rest of the business to Comet.
Southern Electricity plc, and Eastern Electricity plc merged their retail operations
into Powerhouse in April 1992. A year later Midland Electricity was also merged into
Powerhouse. The operation losses at that time led the parents to put it up for sale in June
1995. Hanson plc acquired Eastern Electricity and also bought the interests in
Powerhouse of Southern and Midland and soon afterwards they announced their intention
to close 195 of the 317 stores. In June 1996 a management buy out team acquired the
remaining 122 stores in the Midlands, Southern and Eastern England.
Powerstore was formed in 1993 through the purchases of 14 stores from London
Electricity plc. It also acquired the concessions, which were being operated inside 45
Debenham department stores, but these were terminated 10 months later. In 1993
Homepower Retail Ltd was formed from the acquisions of the retail operations of both
Yorkshire Electricity group plc and East Midlands Electricity plc. In 1995 Homepower
Stores Ltd, a newly formed subsidiary of Powerstore, bought the electrical goods retailing
20

Chapter Two Industry Analysis
business and the assets of Homepower Retail Ltd and in April 1996 both Powerstore and
Homepower Stores Ltd went into administration.
SEEBOARD plc has retained a retail operation, closing quite a few high street
stores and opening 15 out of town superstores. Only the retail businesses of Northern
Electric plc (NIE Retail Ltd trades as ShopElectric), and SHE have continued with little
change.
Scottish Power is the biggest Electricity Company in the UK in year 2000,
followed by Powerhouse. They are the third and fourth largest retailers of white goods in
the UK. Both electricity companies participate in bulk buying and have 4 and 3
warehouses respectively.
Regional multiples
These are specialist electrical goods multiples with outlets in particular regions.
They have significant market shares in the areas they operate. The largest are Tempo and
Miller Bros. Other important regional multiples include Bennetts (Retail) Ltd, a
subsidiary of Berry's Group Ltd, operating from Norwich, Hughes (Lowestoft) Ltd, and
Apollo 2000 Ltd., both operating from Birmingham.
Tempo
Tempo is the trading name of KF Group plc's retail operation. In 1996 it had 8
high street stores and 22 superstores mostly located in the Southeast. Stores are also
located in the Midlands and the South. Tempo sells both white and brown goods whilst
having a high proportion of computers in its product mix. Tempo however went into
liquidation in 2001.
21

Chapter Two
Miller Bros. (Doncaster) Ltd
Industry Analysis
Miller Bros. is a family owned business based in Doncaster operating from 16
superstores and one high street site. Most of its outlets are located in Eastern England and
the East Midlands. They sell both white and brown goods and they specialise in carrying
a wide range of white goods. EPOS systems are used in all stores, which are not
integrated with its accounting systems. This means extracting turnover details by products
is difficult.
Other Retailers
The other outlets, apart from the specialist, are Retail Co-operatives, Department
stores, Mail Order companies and Specialist dealers in built in units and DIY specialists.
Other Multiples
Retail co-operatives
The Co-operative Wholesale Society Ltd (CWT'S) is the provider of buying,
marketing, distribution and other services to co-operative retailers. CWVS also operates its
own retail outlets, of which about 45 outlets stock white goods and is the largest co-
operative retailer in the UK. Several independent societies also sell white goods but
purchase stock from CWWS, giving it a dual role as a retailer and a wholesaler.
The Co-operative Retail Society (CRS) trades simply as Co-operative. CRS has
about 56 stores and about 26 stores sell white goods. Homeworld is the name it uses for
its superstores. The notable feature of CRS is that it purchases its white goods directly
from suppliers rather than from the CWYS.
22

Chapter Two
Iceland Croup plc
Industry Analysis
The main subsidiary of Iceland is Iceland Frozen Foods plc, which has about 760
outlets trading under the name of Iceland. About two thirds are high street stores. The 330
showrooms display a wide range of refrigerators, freezers and microwave ovens. Iceland
is price competitive and offers own-label or exclusive lines to differentiate itself from its
competitors. The principal own brand is Iceline.
Departmental stores
Departmental stores display stock of both white and brown goods. The
Departmental store chains who offer goods from five or more outlets worthy of note
include Allders, House of Fraser and John Lewis Partnership plc.
Allders Department Stores Ltd.
This is the principal subsidiary of Allders plc., operating from 20 Allders
department stores and 10 Allders Home shops in Greater London, central, southern and
northern England. White goods are sold from all these locations, of which 8 are out of
town and 2 are edge of town. Allders is managed centrally and includes buying and
pricing.
House of Fraser
This is the principal subsidiary of House of Fraser plc. Trading takes place under
several names, which includes Rackhams, Binns, Army & Navy, Dickins & Jones as well
as its own name. Most of their stores are located in high street locations throughout Great
Britain.
23

Chapter Two
John Lewis Partnership plc
Industry Analysis
The principal subsidiary is John Lewis plc. It operates about 23 departmental
stores in England and Wales under a variety of names. The majority of their stores sells
white goods. The stores differentiate themselves from competitors by accepting the stores
debit cards instead of credit cards. They also offer a free one-year extension to the
supplier's warranty on appliances purchased and prefer this arrangement to promotions.
Small retailers
In this study firms with less than 5 outlets are considered as small retailers. The
MMC report indicates that the total number of small retailers in the UK is expected to be
greater than 3000. Small retailers appear not to compete on prices but project customer
values through free delivery and installation, favourable credit terms and free warranties
to counter balance price differentials.
Many small retailers are members of retail buying groups and, as members, they
use the buying power of these organisations to gain access to leading brands and also for
purchasing at competitive prices. However, the listing in the small retailer outlets seems
to favour products from the bottom/ middle end of the market with low margins.
Retailer buying groups
The difficulties in obtaining goods from suppliers have led the way for some small
retailers to form buying groups. The purpose is to exploit favourable buying terms from
suppliers who preferred to sell large quantities. The total turnover was about £83 million
in 1995 (MMC, 1997 pp. 46)
24

Chapter Two Industry Analysis
The largest of these is the Combined Independent Holdings (CIII) which are
owned by 21 local groups. The local groups are CIH shareholders and CIH takes title to
goods purchased by their members. There are five local groups worthy of note. These are,
Birmingham Combined Independents; LITER (males & West); Cl (CNS) covering
Cambridgeshire, Norfolk and Suffolk; CI North and CIR (NI). Some of these local groups
do take title to the goods they purchase for their members.
CIH facilitates and guarantees payments to suppliers for orders placed by
individual suppliers. About 80% of CIH turnover consist of retailers ordering direct from
suppliers using CIH headed paper and the supplier delivers direct to the retailer. All
transactions are thus recorded in CIH books for monthly settlement with the supplier,
whilst billing the retailer concerned for the goods he has received. CIH does not handle
these goods physically. The remaining 20% of the turnover consist of buying goods in
bulk from suppliers for resale to individual retailers. Thus CIH not only takes title and
physical possession of this ' central stock', but also takes responsibility for distributing
them to retailers and is a member of Euronics, a Europe wide buying group. This group
can, in its own right negotiates discounts or promotional offers with the suppliers on
behalf of its members. There are other retailer groups such as Scottish Independent
Television Dealers Association with about 50 members and Combined Independents of
Ulster who do not take title to goods purchased by its members.
Mail order companies
Shops and stores are locations where most retail trade for electrical goods takes
place. However, there is a large amount of trade that is taking place where there are no
retail premises. The public is contacted directly through advertisements contained in
catalogues and leaflets. This type of trade is known as mail order.
25

Chapter Two Industry Analysis
The term mail order is connected to companies that send out large catalogues
advertising a wide range of merchandise including electrical goods. These are known as
general catalogue mail order traders, where the customers are contacted directly by them.
There is also another category where trade is conducted through agents. Catalogues are
sent to these agents in the first instance and the mail order company deals with the
customer through its agent. This is the most popular practice.
There are typically two catalogue issues per annum with several promotional
updates. These catalogues display a wide range of merchandise where prices are fixed for
this term. To facilitate this price setting, suppliers also review their prices twice a year for
mail order companies.
The prices charged by the mail order companies are typically between 10 to 15 per
cent higher than those charged in the high street. The high costs associated with their
method of operation, for example, Agents commission, free credit, delivery costs, bad
debts, cost of returns, and installations, are some reasons for high prices.
The mail order companies dispatch these catalogues to their agents who in turn
take orders by post or telephone. Most goods are sent on approval. The agent passes
goods to the customer, but bulky items are despatched directly to the customer. The
customer is given 14 days to accept or return goods before payments begin. Goods not
accepted are returned via agent's arrangements.
Payment is usually made by weekly instalments to the agent. The mail order
companies make no charge for granting credit, say for a 20-week term. The agent
deposits cash instalments into the mail order companies bank account. For their services
the agents receive a commission of 10% in cash or 12.5% discount on goods purchased.
26
Chapter Two Industry Analysis
Mail order companies provide customer help lines. The advice in most cases is on
the descriptions only. Mail order companies have also stated that it is unlikely the staff
offering advice have the expertise in all white goods and are not technically qualified.
Five companies dominate the mail order segment. These are:
GUS (Great Universal), Littlewoods, Empire, Freeman, and Grattan.
Other Dealers
Several other types of dealers sell white goods. These include Wholesalers,
Warehouse clubs and rental companies.
Wholesalers
A wholesaler has been defined as a person, other than a manufacturer or importer,
who buys white goods to hold in stock in the ordinary course of business with the
intention of resale to retailers or other wholesalers of similar goods. In other words a
wholesaler is considered here as a person who sells several brands. Some wholesalers,
particularly in Northern Ireland, may be classed as distributors, since they have exclusive
rights to certain brands in a given territory. Most suppliers supply white goods directly to
their retailers, or to their final customers, with the exception of Northern Ireland where
the supply is to the wholesaler. Only a few supplier's use this channel i. e. distributors to
supplement their direct supply systems or to cater to small retailers whose volume does
not justify direct supply. There may be more than 100 wholesalers with less than
£500,000 of turnover and about 9 with turnover greater than half a million pounds.
The main wholesalers of white goods are:
Bridisco Ltd, Swift Electrical Wholesalers Ltd, Owenmore Distributors -
Northern Ireland, Portway Domestic Appliances Ltd, Stearn Electric Co Ltd, Harris &
27

Chapter Two Industry Analysis
Russell Ltd, Newey & Eyre Ltd, Inman & Co (Electrical) Ltd, and V. Leonard & Co Ltd. -
Northern Ireland.
Their total turnover in 1995 was about £32million (MMC, 1997 pp. 46). The
market is also served by builder's merchants and DIY multiples referred to as kitchen
specialists who are also installers of fitted kitchens.
Warehouse clubs
These are dealers who operate clubs with members and sell only to their members.
This membership also extends to retailers. Trading takes place in the cash and carry
format. Warehouse clubs are classified as wholesalers for planning law purposes. Their
housing structures can resemble both traditional warehouses and conventional retail
outlets. They also sell to non-retailers. There are about 3 warehouse clubs of some
significance in terms of their small market share in white goods.
They are:
N&P - Nurdin & Peacock Cash and Carry Ltd, Makro Self Service Wholesalers
Limited. - Makro and, PriceCostco Europe (UK) Limited.
An important source of supply is that provided by diverters. These are firms or
individuals that buy up batches of surplus white goods from manufacturers, importers or
retailers in the UK and abroad. This channel may be the only venue for those who have
been refused supply through a normal trading channel. These white goods carry the
normal manufacturers guarantees.
N&P
N&P is a traditional cash and carry business of food and tobacco. In 1994 it
diversified its business under the name of Trade & Business Warehouse, to sell a wider
28

Chapter Two Industry Analysis
range of goods including electrical goods. It has more than 50 outlets but only the largest
outlet sells white goods. In 1995 14% of N&P shares were held by SHV Makro and in
1996 N&P's parent - Nurdin Peacock plc was acquired by Booker plc which does not sell
white goods. The membership is open to retailers, caterers and many categories of sole
traders. There are no membership fees.
Makro
Makro is a wholly owned subsidiary of a Dutch company, Holding Maatschappij
Ukadema NV. SHV Makro NV holds 60% and Metro Holdings AG of Zug in Switzerland
holds the other 40%. SHV Makro is owned by SHV Holdings NV, a privately owned
company with its head office in Utrecht and is one of the largest cash and carry,
wholesale groups in Europe with world wide sales.
Makro holds 35% of the share capital of Chip Shop (Business to Business) Ltd.,
which trades as Business to Business and is the joint venture partner for the management
of Office Equipment centres and Sound and Vision centres in Makro outlets. There are
about 27 outlets of which some carry white goods intermittently and some display and
sell white goods. Makro does not charge a membership fee and limits its membership to
trade customers.
PriceCostco
In 1992 The Price Company Inc (Price) formed a 50: 50 joint venture with the
Littlewoods Organisation plc to develop a warehouse club business in the UK. North
America was the first place where the concept of warehouse club operation was
introduced and Price was a leading operator. Also in 1992 Costco Wholesale Corporation
(Costco) another leading warehouse club operator, established a wholly owned UK
29

Chapter Two Industry Analysis
subsidiary. In 1993 Price and Costco merged to form a new company in the US.
PriceCosto Ltc, and the UH subsidiaries were then combined to form a single
organisation. The US parent companies holding is 60% and the remaining holdings is
shared equally by both The Littlewoods Organisation plc and Carrefour SA, the French
supermarket group.
PriceCostco has major outlets in Thurrock, Watford, Glasgow, Liverpool and
Manchester. Its main aim is to sell high quality nationally branded merchandise at low
prices to businesses purchasing for commercial use or resale and also to individuals who
are members of selected employee groups. There is a basic annual membership fee for
both business membership and also individual members.
65% of PriceCostco's turnover is with trade customers and the remainder is with
individual customers. Their main aim is to achieve high sales volumes through rapid
inventory turnover, based on competitive pricing, which is 15 to 20 % below
recommended retail prices.
Their product policy is to offer a limited assortment of merchandise in a wide
variety of product categories, which includes white goods. However, at present the
breadth of coverage (variants of the same product) is not available, as Pricecostco is
dependent on diverters for white goods supply. This restriction on supplies thus forces
Pricecostco to continually change the range of brands and models which, it makes
available for sale to its customers. It is believed that the prices charged by the diverters to
PriceCostco are about 5 to 10 % higher than their cost.
Rentals
The consumer rental business is a small portion of the total business in white
goods. This scheme is aimed at customers having cash or credit restrictions and there are
30

Chapter Two Industry Analysis
no deposits or credit checks (usually). Most rental transactions involve televisions, and
VCRs. Two companies that dominate the rental market are Thorn and Granada. With the
entry of Granada, the growing volumes of white goods have been experienced by
suppliers especially the Hotpoint brand supplied by GDA Ltd to Granada. Thorn's white
goods are supplied by Whirlpool and it conducts its rental business through it Radio
Rental subsidiary. Thorn launched its Crazy George operation where ownership of the
product passes to the customer with the payment of the final instalment. One of the
conditions of the rental of white goods is that they can be returned at any time. Hence the
little or no residual value of white goods thus returned has forced many rental outlets to
concentrate on Televisions and or VCRs as they are easy to handle and deliver, and do
not require much display space.
Dealers in Northern Ireland
In Northern Ireland, a large proportion of electrical goods, which includes white
goods, are distributed through wholesalers rather than retailers. The general consensus is
that 75% of this market accounted for small retailers who were unable to meet the
minimum turnover requirements of the suppliers for direct supplies to them. Furthermore
the high freight cost and long lead times were at a disadvantage to the small retailer. The
political environment was not satisfactory for some suppliers to set up local operations.
However, the recent improvement in the political health has given way to a further
problem i. e. the refusal of some suppliers to have their products stocked by the same
wholesaler as their competitors.
CIR (NI), a local group which is a shareholder of CIH, has a significant presence
in Northern Ireland with 14 members. It obtains white goods directly from suppliers and
local wholesalers. Its operations also include warehouse facilities and a procurement
31

Chapter Two Industry Analysis
service for its members. Combined Independents of Ulster has 34 members for whom it
negotiates favourable terms of supply and arranges direct delivery as it does not take title
to goods.
There are also 9 branches of Dixons in Northern Ireland. NIR Retail is the largest
retailer with 33 branches. Makro has 1 outlet in Belfast.
2.2.3 Conclusion
The year in which trading of the white goods first took place is unknown. The
present market leaders are national multiples and these firms were involved in relative
businesses before moving into white goods retailing. The regional electricity companies
also diversified from established outlets throughout the UK, collecting electricity
revenues to selling white goods from the same outlets. The firms mentioned above
account for more than 50% of the market shares in this retail channel. There are a large
numbers of small retailers mostly family owned with four or more outlets accounting for
about 25% of trading of white goods. Hence it is possible that some of the small retailers
were r-strategists at the birth of the retail channel followed by more small retailers,
regional multiples, mail order companies and departmental stores. The k-generalists came
later into the retail channel in the form of national multiples and regional electricity
companies. Table 2.2 below depicts the age profile of firms in this retail channel and it is
interesting to note that both current market leaders are national multiples (Dixon and
Comet) and have been trading in white goods for about 14 years.
32

Chapter Two
Table 2.2 Asse Profile
No Of Years
(trading)
No of Firms
in surve
<10 17 10<20 16 20<30 12
30<40 10 40<50 8 50<60 2 60<70 2
70<80 1
80<90 0 90<100 1 >100 0
Source: Compiled by author
2.2.4 White Goods Industry
Industry Analysis
In order to understand when a resource becomes valuable it is necessary to find
out the conditions under which it becomes valuable. White goods are sold to consumers
in a traditional way i. e. through retailers in the UK and are an important consideration.
Markets can be volatile, dynamic or moderately dynamic. The causes for such states are
driven by technology that can make a stable environment become unstable overnight.
Volatility in this industry is based on how the product behaves i. e. whether technology
can change it swiftly.
In high velocity markets, changes become non- linear and less predictable. The
overall industry structure is unclear, market boundaries are blurred and market players are
ambiguous and shifting. Furthermore the predictability plus the reliability of successful
business models become redundant (Eisenhardt and Martin, 2000).
On the other hand in moderately dynamic markets, change occurs frequently along
roughly predictable linear paths. The industry structures are stable, market boundaries are
clear and the players are well known. In these markets management capabilities rely on
33

Chapter Two Industry Analysis
existing capabilities (Eisenhardt and Martin, 2000). Therefore, the process below is a
means of examining market dynamism in order to extract the factors that drive the value
of key resource(s).
The white goods industry in the UK is a mature industry, which supplies domestic
appliances to the retail channel for white goods. White goods are in the mature stage of
their life cycle and continual improvements are made only on quality and appearance. The
structure of the suppliers mirrors the retailer's i. e. few retailers/suppliers hold major
market shares. There is excess capacity in the white goods industry and this is believed to
be a deterrent for new entrants into this industry. The retail channel for domestic
electrical goods in the UK is the customer of the white goods industry and is also the
main suppliers of electrical goods to the domestic appliance market.
White goods are well-established consumer durable and the products are in a
mature stage experiencing static annual consumer demand. Products undergo incremental
improvements in quality and appearance and very little changes have taken place in the
last 10 years. Suppliers have also commented that they did not envisage major technical
innovations in the foreseeable future (MMC 1997, Vol. 11, Chapter7).
Most white goods retailers acquire appliances directly from the suppliers, whilst
only limited volumes are purchased from wholesalers or distributors. Some small retailers
of white goods have formed buying groups to take advantage of buying power. Electrical
goods are classified into two categories i. e. white goods and brown goods. White goods
sales are seasonal, for example, more tumble dryers are demanded during winter months
and cold food storage equipment in the summer months.
34

Chapter Two
2.2.5 Market size
Industry Analysis
White goods are a product line within the total domestic appliances market
(Housing Market). Key Note Ltd in 1997 surveyed white goods as the largest product line
accounting for more than 79.5 % of the total domestic appliance market by value (Table
2.3). The domestic appliance market includes white goods, vacuum cleaners, installable
heating, space heating, water heating and electric blankets. White Goods are household
appliances, which include washing machines, tumble dryers, spin dryers, washer dryers,
refrigerators, fridge freezers, deep freezers, gas cookers, electric cookers, microwave
ovens and dishwashers.
Table 2.3 Domestic Annliance Market Product groups Value
£000's
White goods 2223
Vacuum cleaners 301
Installed heating 86
Space heating 61
Water heating 96
Electric blankets 30
Total 2797 Source: Key Note Ltd. (1997)
2.2.6 Market segmentation
Segmentation of the white goods market is by product - home laundry products,
refrigerators and fridge freezers, cookers and dishwashers. Table 2.4 displays the volumes
of 3 categories of white goods. The white goods technology is mature and changes are
35

Chapter Two Industry Analysis
relatively slow. Brand names are of importance in this industry as it signals quality and
reliability to the consumer. The quality and reliability of the above products vary and the
ranges are categorised as low, medium and high. The margins for products in the bottom
end of the market (low range) are low, and the products in the middle, and upper end of
the market enjoy relatively high margins. There is also a high degree of product
differentiation and as already mentioned the sale of white goods is seasonal.
Table 2.4 Segmentation of Products
Products Volume Units 000's
%
Washing machines 1754.1 33.18
Tumble Dryers 555.7 10.51
Cold food storage 2556.7 48.37 products
Dishwashers 419.4 7.93 Total 5285.9 100.00 Source: MMC (1997)
Home Laundry Products
Home laundry products include washing machines, tumble dryers and washer
dryers accounting for about 31% of the total white goods market. Washing machines
make up the largest sector within the white goods market, accounting for about 23% of
sales by value. In the recent past washer dryer growth has been less encouraging due to
their poor performance in the drying area compared to tumble dryers. Customers have
found it cumbersome to unload the wash-load before drying could begin. The washer
dryer cannot dry a full wash-load and drying recommendations are for two drying loads.
36

Chapter Two
Refrigerators and Fridge Freezers
Industry Analysis
The market for refrigerators and fridge freezers are more dependent on the
weather than on economics. Hot summers seem to encourage buying. Concern for food
safety and refrigerator temperatures, along with energy labelling, has encouraged
manufacturers to produce high performance machines for example, frost free, ozone
friendly machines and lower energy consumption levels at higher prices.
Dishwashers
The market for dishwashers has not grown as fast as anticipated. The reduction in
prices has helped with slower growth. Consumers still perceive a dishwasher as a luxury.
Manufacturers are countering this claim by encouraging first time buyers to own a
dishwasher at a lower price. Builders on the other hand are closing house deals with the
offer of a free dishwasher.
2.2.7 Major suppliers
Mainly large company groups supply the UK white goods market. A small
number of specialised manufacturers are also involved in the supply activity. There is
concentration in the industry and the details are shown in Table 2.5 below. The details of
the firms and firm activities are not considered in this study.
37

Chapter Two Industry Analysis
Table 2.5 UK Market Shares of Sunnlier ßrnndc Suppliers Washing
Machines Tumble Dryers
Dishwashers Cold Food
Stora e
GDA 31.8 44.1 21.6 22.1 Emaco 20.7 16.2 27.6 21.4 MDA 12.1 7.7 2.6 Candy/CDA 13.5 5.1 6.2 Crosslee 22.7 BSDA 20.6 5.1 Lee 10.9 Other 21.9 17.0 17.4 31.7 Total 100.0 100.0 100.0 100.0 Source: MMC (1997)
2.2.8 Conclusion
The white goods industry is highly concentrated as the supplies of goods are in the
hands of few suppliers. Likewise it has been demonstrated that the retail channel is also
highly concentrated, depicting that major trading takes place between strategic groups.
The competitive strategies deployed by these groups may vary depending on their
individual endowments of resources and capabilities. Brand names are of importance in
this industry as they signal quality and reliability to the consumer. In the UK major
brands are well established and the loyalty attached makes it very difficult for new entrant
to this market. There is also a high degree of product differentiation and the sale of white
goods is seasonal, products at the upper/middle end of the market command higher
margins.
Retailer organisations are the most important intermediary in the UK for the
display and sale of white goods. Numerous outlets scattered throughout the UK facilitate
the display and selling process. For outlets to be valuable in this retail channel superior
firms must have the capacity to display and deliver customer needs. Effective and
38

Chapter Two Industry Analysis
efficient capacity utilisation of outlets equates to holding product portfolios that maximise
returns and/or increase market shares for its shareholders.
2.3 The structure or rules which govern the behaviour of the participants
2.3.1 Economic Factors
The housing market dictates the growth or decline of the domestic appliance
market. In the UK house moves are the key factor in the purchase of household
appliances. Households are purchased using mortgage facilities supplied by the financial
institutions in the UK. The cost of borrowing money (mortgage rate) plays a significant
part in the decision making process where house purchases are concerned. High mortgage
rates can depress the housing market and a lower rate can stimulate movement between
houses. However the lower mortgage rates do not always stimulate movement because
consumers need to have confidence in the economic policies of the ruling government at
the time the decision is to be taken. People are aware of the pitfalls of the short-term
measures taken by various governments and are now very cautious with their long-term
commitments.
The lack of consumer confidence means that long-term investments can be
postponed to a future date. The effect on the appliance markets has been to trade down in
terms of price, reducing the average price of appliances. Some consumers on the other
hand have been lengthening the replacement cycles for existing appliances with
replacements taking place between 4 to 5 years on average. This was possible because,
with lower levels of product innovation in white goods compared to that of audio-visual
products, it was easier for consumers to put off purchases. However this situation has
created pent -up demand and its release in the future may result in consumers replacing
their existing appliances and some trading up to better, more expensive, specified
39

Chapter Two Industry Analysis
products. Rental companies have also joined in by offering ownership through high
purchase schemes. There appears to be potential for further growth as consumers have the
opportunity to change appliances as and when in exchange for new models.
2.3.2 Environmental Analysis
The Housing market
After the boom in the 1980's the housing industry in the UK has undergone
considerable changes mainly due to house prices falling resulting in negative equity for
many householders. Consumer confidence was dented and spending on new appliances
slowed down dramatically. However, The National Council of Building Materials
Producers (BMP) - Statistical Bulletin, - Dec 1996 reported that there has been an overall
increase of 6.06% in new housing starts since 1991 (163400 units), despite the recovery
faltering between 1994 (200000 Units), and 1995 (167300 units), when it fell back by
16.06%. In 1996 the new housing starts increased to (174200 units) with a growth of
4.1% over 1995, figures indicating the slump had slowed down and the future prospects
were good. The steady increase in house prices since 1996 has boosted consumer
confidence in relation to spending on new appliances enhanced by more choices in
appliance selection in the market place and vigorous competition between suppliers. The
sale of council owned properties has also played a significant role in the housing market.
Household Size
One of the key factors affecting many consumer markets is the increase in the
number of households in the UK, creating a potentially larger and diverse market for
companies to target. The new housing stock is on average smaller than those built in
previous years. The Office for National Statistics/Key Note has reported that the number
40

Chapter Two Industry Analysis
of households in the UK has risen by 7.5% between 1991 and 1996, bringing the housing
stock to 24.1 million units in 1996. Key Note Ltd in 1997 predicted further steady
increases in the future.
The increase in housing stock was partly due to the rising population and partly
due to the increased divorce rates in the UK. Divorces have created a situation where the
number of people living alone by choice has increased resulting in the strong growth in
single person households.
Furthermore a key demographic trend during the last decade has been the increase
in the proportions of women in full time and part time employment. The traditional
family role of the women has changed bringing in time constraints for normal household
chores and offsetting this discomfort through increased household income. This in turn
has boosted the demand for labour saving appliances such as a washing machine, which is
easy to use, reliable and cost effective. The increasingly busy life of men and women
caused through different working shifts has had an effect on eating habits too. The
availability of convenience foods has supported irregular meal times, creating demand for
products such as microwave ovens, fridge freezers and dishwashers.
The extra households therefore have created considerable potential for
exploitation, as there may be demand for more and more white goods. However, there
are constraints as well. These constraints may be on space for appliances. The demand
therefore, could be for slimline appliances. Most extra households are single person
households with Key Note reporting 7 million households in 1996 - an increase of 27 5%
since 1990.
2.3.3 Trade Associations
The Radio, Electrical and Television Retailers' Association (RETRA) is the
dominant organisation with about 1400 members in England, Scotland, and Wales. The
41

Chapter Two Industry Analysis
membership consists of small retailers -independent businesses and two large member
organisations in Thorn and Granada and a retailer-buying group. RETRA is primarily a
brown goods association with a growing white goods arm. Membership of RETRA was
conditional on agreeing to abide by a long standing code of practice, developed in
conjunction with the Offices of Fair Trading -OFT on the sales and after sales service of
the products that RETRA members sold and rented. RETRA itself has no involvement in
buying but is a self-regulating body.
RETRA acts as a lobbying group representing the interests of its members both
large and small players with the British Government and also the European Commission.
The services it provides which are worthy of note to its members are: clearing house
schemes, a range of standard forms complying with legal requirements on hire purchase
and rental agreements, special terms with credit card processors. RETRA also provides the
secretariat for the retailers forum, a less formal organisation which brings together the big
players such as Dixons, REC's and the small players too, to discuss matters of mutual
interest of all electrical businesses. Some large retailers i. e. Dixon are members of the
British Retail Consortium - (BRC), whilst agency mail order companies are members of
the mail order traders associations.
2.4 The options available in terms of competitor behaviour
2.4.1 Introduction
The aim of this study is to test competitive advantages in a specific retail channel
by explaining that firm heterogeneity is caused by firm activities, which lead to firm
efficiencies/effectiveness. In order to achieve this objective it is necessary to choose
factors (variables) relevant to the problem in hand. The factors in question here are
resources and capabilities of the retail channel for white goods. The identification and the
42
Chapter Two Industry Analysis
screening of key resources and capabilities take into consideration the key resources and
capabilities that drive other resource bases in pursuit of firm objectives. Managerial
manipulation ensures firm efficiency and effectiveness and is path lead. The resources
that need manipulating in the retail channel for white goods are primarily connected to
product portfolios that maximise returns and/or increases market shares for its
shareholders. The key point for managerial decision making here is that of economic
rationality. Rationality implies a link between actions and intentions, but not common
intentions between competitors and includes profit from each competitive action, the time
pattern of actions and the nature of information about competitive activity. However, it
was noted earlier that human behaviour stretches beyond economic rationality to social
justifications and obligations and the management of normative rationality is an important
source of competitive advantage.
The information depicted in the following paragraphs are for identifying and
screening independent key factors and their measures, which will result in the best
explanations for firm heterogeneity in the retail channel. Furthermore it is also a process
that helps decide how the response variable can be measured accurately for the testing of
competitive advantages in the retail channel for white goods.
2.4.2 Services Offered by retailers
2.4.2.1 Store Locations - Outlets
One of the most important changes in electrical goods retailing has been the move
from high street locations to out of town locations. The increase in size has thus requires
the renaming of stores to superstores. With so many models and variants available today,
it is not surprising that such a move has happened. Displaying models to the public is an
important feature of retailing and is a competitive advantage. The most successful
43

Chapter Two Industry Analysis
retailers have spent heavily on improving their existing outlets and have also relocated to
better sites.
The traditional performance measures were the sales per square foot of space.
With the move to larger outlets this measure has been switched to sales per store. This is
to accommodate far higher sales of bulky, high-ticket items, which would not be possible
otherwise. The idea was to increase the turnover values per store but instead has resulted
in lower sales per square foot. The compensating fact of higher margins on the more
expensive products gave the out of town stores a better margin performance per outlet.
Some stores have suffered from increased out of town competition, whereas turnover for
those with a mixed portfolio of high street, shopping centre and out of town shops have
not been adversely affected by the growth of out of town outlets.
The 1996 Verdict report showed that the number of electrical superstores grew
from 200 in 1986 to 743 in 1996. Of these 670 were operated by 8 of the largest retailers,
indicating that smaller dealers have not been able to move out of town. The larger
retailers therefore appear to have a competitive advantage selling bulky white goods.
Furthermore, the withdrawal of many REC's has resulted in closures of about 700 of their
high street stores. Other retailers had acquired some of these stores. The larger retailers
have also reviewed their position on high street stores and this has resulted in closure of
some of their bad performers. Whether this move has increased or decreased the overall
space available for white goods is unknown. Competition for space between white goods
and other electrical goods may also be a factor based on shop margins or sales per square
foot. Therefore, if the total area had increased now compared to previous years and the
units demanded remained was fairly constant, then market growth can only be at the
expense of competition.
44

Chapter Two Industry Analysis
2.4.2.2 Stocking policy
White goods have in general a life span of several years. Modifications come
through cosmetic changes every one or two years and have very little technical changes.
Suppliers usually inform retailers of new model details between 2 to 6 months before the
launch date. The product reviews are held outside the UK and one of the famous
exhibition venues is in Germany. Both the larger and smaller retailers attend this
exhibition not only to find out what is offered in the European market but also to have
discussions on the intended positioning - (price) of these products in the UK market.
Product selection is one of the principal means by which retailers can differentiate
themselves from their competitors. This is possible because there are several
manufacturers of white goods, who have one or more brands in production. These
manufacturers build a large number of models and model variants offering choices from
low, medium, high-quality/price to serve the mass markets. It is this choice of products
which enables retailers to stock a range that is different from their competitors.
Larger retailers have the storage capacity to choose a range of models with a good
spread to meet both the price and quality demands of their customers. Most models are
chosen from what is available on the basis of their perceived marketability. Medium sized
retailers favour major brand names and appear to go for brand leaders basing their stock
selection on quality.
Some suppliers regarded the small retailers as an important distribution channel
for their brands. MMC investigations also indicate that some brands that are widely
stocked by some small retailers achieved relatively low market shares compared to those
retailers who infrequently stocked but achieved higher market shares. For example Creda
washing machines were listed by 41% of the small retailers surveyed yet had only 2.6%
of the market shares when compared to AEG listed by only 17% of respondents achieved
45

Chapter Two Industry Analysis
a share of 2.8%. GDA Ltd. uses about 1000 small retailers who guarantee about 60,000
unit sales per annum of medium to low quality products.
The stocking policy of the mail order companies is based on exclusivity. The
catalogues may not display all the models that are available for the brands selected. Only
a small proportion of models is listed and restricted to maybe one brand.
2.4.2.3 Own Label brands and exclusive models
Own label brands are products offered under a brand name, which is owned or has
been licensed usually by a large retailer. These products are built to the brand owner's
specification or they may be a supplier's products, which are labelled with the name of
lof the retailer brands for example, the Electra brand. MMC data that depicts about 16-
17% of the total sales of white goods are from selective distribution deals.
Retailers can obtain branded products from some suppliers on an exclusive basis.
Exclusivity may be available in return for a large order through both domestic and
overseas manufacturers. There are also situations where a manufacturer may have over-
produced and is prepared to sell to the retailers the remaining stock at favourable prices
exclusively in order to improve their cash flows. Some suppliers may also import
excessive quantities, which may end up as surplus to market requirements and they may
be forced to adopt the same tactics. This process is not exclusive, as similar products
would have been sold to other retailers.
In some cases exclusivity can arise through retailers displaying a distinct model
number for a product. Certain features may be added or taken away in this situation or
there may be some cosmetic difference to the product specification. It is also possible to
find products with only a different label.
46

Chapter Two Industry Analysis
The main feature in the stocking policy of own label and exclusive models is that
of price flexibility. The gross margin on these products is usually lower than that of
branded products and the retailers may use this flexibility to increase their turnover
whenever it suits them.
2.4.2.4 Differentiation of product offerings
There is are wide variety of products with a range of quality options. In 1995 the
biggest retailer Dixons listed for example 110 washing machine variants from different
brand names. With the inclusion of own brand labels there could be atleast 13 brands in
the market fighting each other for market share. Other retailers may list according to the
number of outlets available to them and may or may not prefer leading brands. For
business reasons it is unlikely that the biggest retailer would stock or even list all the
brands that are available. According to major retailers, listings are based on the perceived
marketability of the products. However, the most appropriate form of competitive
strategy will depend on the type of products the retailer is offering. A survey carried out
by Comet on buyer behaviour has revealed that about 30% of consumers only visited the
outlet they made the purchase from and between 55-64% either bought at their normal
shop without shopping around or had visited only one or two other shops before arriving
at their purchasing decision.
Retailers may, therefore hold/list product portfolios sufficient to gather the
expected returns and/or market shares on a national basis, based on available outlets.
Some retailers may decide to follow the leader in strategy selection and others may have a
focus strategy - concentrating on one or more particular segments or niches of the market,
whilst, not trying to serve the entire market with a single product or brand.
47

Chapter Two IndustryAnalysis
The MMC survey in 1995 on the six best selling models based on retailer sales
turnover depicted even sales and could not identify a single model that was a best seller.
This indicates the competitive strategy followed in this retail channel is mainly the
product differentiation strategy and that there could be close substitutes. This is because
there were marked differences in the models and variants chosen, confirming retailers
distinctive ranges and prices.
2.4.2.5 Pricing
The major retailers hold discussions and negotiations with the main suppliers on
an annual basis to determine the level of net buying prices with a view to agreeing trade
prices. These trade prices are based on retailer perception of the market for the year
ahead. Catalogue sales are, however, set twice a year. The retailers also agree terms and
conditions with suppliers regarding discounts, margin maintenance support and other
incentives based on sales targets. Negotiations and discussions by both large suppliers
and retailers take place at a very senior level. With small retailers the above take place
with suppliers area representatives.
The main policy of the retail channel is to price their product competitively, to
match competitors prices or to price products lower than their competitors. Small retailers
are generally not involved in price matching/or cutting but use other incentives instead for
example, free deliveries, free warranties etc, and only larger retailers are involved in price
cutting or price matching at present. Price competition between retailers is affected by the
availability of particular brands or models in the various outlets. For this reason it is
suggested that retailers often select different models from those chosen by their
competitors in order to make price comparisons difficult for customers. This process
avoids head to head confrontation with other competitors (MMC 1997, Voll, pp. 88) and
48

Chapter Two Industry Analysis
protects product margins. The 'Which' magazine survey of standards of service in
electrical goods in 1996 also found that, despite widely publicised claims of price cuts
and special deals, the larger chains not only matched each other on price, but were the
most expensive. The independents and smaller chains tended to be cheaper.
2.4.2.6 In store service and staff training
Another feature of white goods retailing is that it is generally not practicable to
demonstrate most of the features of the appliances. The absence of practical
demonstrations however has not deterred customers from purchasing for example, a
washing machine, as they were already familiar with its basic features. However, the
accelerating technology of some of the products has shown growing importance to
customer service.
Suppliers as well as retailers recognise the importance of in-store service, which
has to be provided by suitably trained staff. Although the quality of service in stores has
improved considerably over the years it is still a problem. Retailers can provide high
quality general sales training, but high quality product training is necessary to sell highly
priced brands. For cost reasons, retailers are finding it difficult to employ suitably
qualified staff with technical background. However, many suppliers are now expending
their useful resources through retailer staff training programmes to address this problem.
`Which' magazine conducted a survey in 1996 into the standards of service in electrical
goods and found only 15% of sales assistants were deemed to be excellent in customer
services, whilst 53% were found to be poor.
49
Chapter Two Industry Analysis
2.4.2.7 Consumer credit
White goods are expensive items and not all consumers readily pay cash for
purchases made at outlets. On average these purchases happen once in four or five years
and are never planned. In order to facilitate instant purchasing and payment by
instalment, several multiple retailers issue their own store cards, which offer an interest
bearing account facility. Most retailers also accept third party debit/credit cards. With all
cards the consumer can settle the account within one month of purchase or pay the
balance by instalments incurring interest.
Most retailers arrange their consumer credit and promotional credit through an
outside finance house, which takes over the responsibility for approving credit and
collecting instalments. The retailer, on the other hand, receives commission for the
business transacted. Two finance houses worthy of note for white goods businesses are
Lombard Tricity Finance and Time Retail Finance Ltd (Wholly owned subsidiary of
Kingfisher). There are some retailers who finance credit transactions themselves, taking
on the expense of administration and the risk of bad debts. For this facility they earn
additional interest income.
Most RECs and mail order companies finance their own credit facilities, whilst the
provision of credit is the key strategy of a few smaller multiples. With credit facilities the
debtors in a balance sheet would be high, thus reflecting extended credit terms. These
companies therefore need to have strong balance sheets to survive.
2.4.2.8 Promotional credit
This is when credit offered is either interest free or a deferred payment - `buy now
pay later'. With interest free credit, the purchaser usually pays a deposit and pays the
balance on the purchase price in equal monthly instalments. The `buy now pay later'
50

Chapter Two Industry Analysis
scheme operates on a deposit payment now and several months grace before the balance
on the purchase price is paid. There are also situations where a `buy now pay later'
customer can opt for further periods of interest bearing credit, earning commission for the
retailer from a finance company.
Retailers through finance companies or their own finance credit facility arrange
the cost of funding promotional credit. The type of consumer who uses these credit
facilities are normally well off customers, who really do not need credit and are
creditworthy. This scheme simply enables them to gain extended payment terms. On the
other hand, if customers were influenced by weekly or monthly payment terms, then they
would seek mail order companies for their transactions. The strategy used by retailers
offering promotional credit is also to weaken the competitive advantage of mail order
companies. The growth of interest free credit has led to increased competition, which has
resulted in the erosion of the mail order companies volume of business.
Promotional credit is normally borne by manufacturers or suppliers on the certain
lines they wish to promote. It takes the form of subsidised sales. The retailer however
would subsidise other lines not subsidised by suppliers. It is believed that the actual cost
of subsidy to the retailer is small as most of the subsidy comes from the supplier. To the
consumer the benefit is the high interest charges avoided on credit cards.
2.4.2.9 Delivery and installation of goods
Many large retailers make a charge for the above service. Due to the increasing
duty levied on fuel prices some retailers do not always cover the cost of delivery and
therefore charging for delivery of white goods to the customer homes is essential. On top
of this delivery charge the retailers also offer choices for in-house installation of
appliances. There is a charge for connection of an appliance to an existing supply.
51

Chapter Two Industry Analysis
Dixons, the biggest retailer, uses its subsidiary, Mastercare to carry out this work. Comet,
on the other hand, sub contracts this part of the work.
Smaller multiple retailers and some RECs offer free delivery and installation as
part of service led position in the market. Again due to escalating transport costs some or
even all have begun charging for these services. At present only small retailers offer free
delivery, which is their strategy to counter price-cutting. Mail order companies, however,
arrange delivery to their customers homes directly from their suppliers, whilst some have
their own delivery fleet.
Recently, some suppliers have reported an increased level of demand for their
direct delivery service. This is not very surprising. The advantage to the retailer comes
from reduced level of stocks, with its associated storage and financing costs and the risk
of obsolescence. The other additional benefits to the customer are the removal of old
appliances and packaging which may or may not incur a charge, 24 hour delivery service
and am/pm deliveries, plus a telephone service for confirmation of delivery dates.
2.4.2.10 Non price promotions
A wide range of promotional devices is used to stimulate interest and encourage
sales from different type of customers. The diversity of offerings triggers different
appeals, which may be partly or wholly funded by suppliers. These offers are aimed to
inject value for money into customer minds. Offerings include trade-ins, free gifts, free
accessories, competitions and package deals. However, some suppliers have been
reluctant to offer non-price promotions due to their logistical complexities.
52

Chapter Two Industry Analysis
2.4.2.11 After sales service
Suppliers usually arrange servicing for white goods and some use their own
facilities throughout the UK. Those who do not have these facilities sub contract the work
to nominated service organisations. Retailers do not take responsibility for repair work
but they may in certain circumstances take responsibility for the after care servicing of
their own label white goods. After sales service could be an important feature for
customers purchasing white goods.
2.4.2.12 Extended warranties
A manufacturer under normal trading situations provides the customer with a
warranty for the goods purchased from a retailer. The period covered by the warranty is
usually one year for parts and labour. However, most retailers sell extended warranties for
all white goods which come into effect when the manufacturers warranty expires. This
provision is normally an extension for a further four years. Retailers will source their
extended warranties from a single insurer, who undertakes the administration of the
policy and the handling of claims. In some cases the customer is able to buy off the shelf
policies from both large and small retailers.
Some policies are not insured and some large retailers take a substantial part of the
risk themselves, by having the insurer reinsure part of the risk with another insurance
company. A few retailers are known to tempt customers with free extended warranties,
which is an alternative to price-cutting.
53

Chapter Two Industry Analysis
2.4.2.13 Advertising by Retailers
Advertising spend is an important feature of trading for both the supplier and the
retailer. A supplier will target advertising to strengthen the brand, whereas the retailers
advertise a variety of products. Only large retailers advertise nationally and the small
retailers advertise locally.
2.4.3 Conclusion
Some important information has emerged from the review of the industry chapter.
The review indicates that the market is moderately dynamic as changes occur frequently
but only in terms of quality variations. This means it is relatively predictable as it follows
a linear path. The retail channel for white goods has relatively stable structures with a
handful of firms dominating the retail channel and it is almost a mirror image of its
suppliers. There is a portfolio of white goods made available from a portfolio of high
street, shopping centre and out of town retailer outlets. Some retailers have moved to
larger outlets to accommodate far higher sales of bulky, high-ticket items. The
compensating fact is higher margins on the more expensive products gave the out of town
stores a better margin performance per outlet. The traditional performance measures of
sales per square foot of space has been replaced by sales per outlet and this change
depicts that the listing of products in outlets will depend on product portfolios that
maximise returns and/or increase market shares for their shareholders.
The market leaders i. e. Dixon and Coniet both switched into the white goods
business about the same time (early 1980s) and appear to have resources and experiences
gathered from the businesses at birth. Growth has been through organic processes as well
as acquisition and mergers. Dixon main competitive strategy appears to be that of
differentiation whereas Comet initially based their strategies on cost cutting before
54

Chapter Two Industry Analysis
switching to differentiation. White goods are well-established consumer durable products,
which are highly differentiated due to quality variations. The white goods industry has
reached its mature stages and any major innovations are not expected in the next few
years.
The key resource appears to be the outlets. Organisational skills are needed to
ensure the availability of leading brands of high medium, and low ranges of white goods
at these outlets. Inter-firm relationships i. e. exclusive deals and inventory management
facilitates economic exchange and is important for this retail channel. Information on
bulk buying and warehousing is limited. Activities relating both product/non-product
activities rely on marketing strategies that are fairly predictable for example, promotion
schemes, free warranties, free gifts, consumer credit, free deliveries etc. and may be
exploitable in the short term and quickly analysed and imitated on the long term.
To summarise, the value of key resource(s) can only be enhanced and sustained by
delivering customer values from product portfolios that maximise returns and/or increase
market shares for its shareholders.
55

Chapter Three Literature Review
Chapter 3
Literature Review
3.1 Introduction
Resources and capabilities are foundation stones upon which a firm's long term
strategy is built, and provides both the basic direction and a primary source of profit for
the firm (Grant, 1991). A resource based view of a firm claims competitive advantage as
an offshoot of the reaction caused by a team of deployed resources that produce unique
capabilities of corporation and co-ordination within such teams (Grant, 1991).
Given the positive impact the diffusion of RBV has had on the field of strategy
and cognate business activities, it was appropriate to look beyond a singular view using
multiple theoretical approaches to extract the richer descriptions of organisational actions,
their antecedents, and their consequences (Gray and Wood, 1991). Encouraged by this
thought I have set about to test competitive advantage in a specific retail channel that
links RBV to retailing for explanations for firm heterogeneity in terms of firm efficiencies
and effectiveness. To this extent this chapter reviews the literature on competitive
advantage from the perspectives of RBV and retailing.
The hypotheses for this study are based on Penrose's (1959) observation that a
firm may achieve above-normal rents not because it has better resources, but rather the
firm's distinctive competence involves making better use of its resources. The hypothesis
also took into consideration the sources of competitive advantages in terms of retailer
differentiation of scale/scope and services respectively. To this extent retailer
differentiation of scaletscope was represented by key resources and retailer differentiation
56

Chapter Three Literature Review
of services included organisational, inter organisational, competitive behaviour and
strategic adaptive capabilities.
The testing of the association of competitive advantage with resources and
capabilities are based on the following premise. A firm is said to have competitive
advantage when it is implementing a value creating strategy not simultaneously
implemented by current or potential competitors (Barney, 1991). Firms become efficient
and effective from firm activities driven by key resource(s) and facilitated by
organisational capabilities that manipulate firm resource bases ensuring the potential for
the key resource is fulfilled over time. The effective utilisation of the key resource is
nevertheless dependent on how it reacts with the market factors within the market
structure in question that either creates or impede demand for the retailers.
In the retail channel for white goods, the main value creating strategy is the
delivery of customer values that maximise returns and/or increase market shares for the
shareholders. Market shares are used as a proxy for competitive advantages in this study.
Value maximisation of key resources is internal to the firm and increases over time,
subsequently making those resources valuable, rare, inimitable, non-substitutable, non-
transferable, and highly marketable.
3.2 Sources of Competitive advantage
Barney (1991) provides the most detailed and formalised representation of the
business level resource based perspective (Priem and Butler, 2001). In his article a firm is
said to have a competitive advantage when it is implementing a value creating strategy
not simultaneously implemented by current or potential competitors. He further defines a
sustainable advantage, as the benefits of that value creating strategy that other firms
cannot duplicate. Barney (1991,1992) asserts that if a resource is valuable and rare and
57

Chapter Three Literature Review
imperfectly inimitable, then it can be a source of competitive advantage. Value is created
as goods move along the vertical chain and this is referred to as the value chain (Porter,
1985). The search for competitive advantage involves scrutinising the value chain and
identifying the key resources that drive capabilities within and outside the firm that create
more value when compared to those of the competitors.
Besanko et al. (2000) explain the resource-based theory of a firm as a framework
used in strategy based on resource heterogeneity. They posit that for competitive
advantage to be sustainable, it must be underpinned by resource capabilities that are
scarce and imperfectly mobile, which means that well-functioning markets for resources
and capabilities do not or cannot exit.
Heterogeneity across firms can only materialise if there are factor market
imperfections under the resource-based view. These imperfections take the form of
barriers to acquisition, imitation, and substitutability of key resources (Barney, 1986,
1991,1994; Penrose, 1959; Amit and Shoemaker, 1993). The function of these barriers is
to restrict and/or inhibit the ability of firms to purchase or duplicate critical resources,
which contribute to sustainable rent advantages over a period of time. However, the
resource selection and deployment tend also to create resource mobility problems, as
strategic factor markets can be imperfect or incomplete. This creates barriers to resource
mobility depicting unequal distribution of resources within the industry (Barney, 1986;
Dierickx and Cool, 1989).
Neo-classical microeconomics focuses on how market forces determine the
quantity, quality, and price of goods and services sold in a market. In equilibrium,
industry demand and supply conditions determine the minimum efficiency levels required
for firms to break even. The Ricardian rent theory depicts that firms will enter the
industry and the output of firms in that industry will increase, so long as prices exceed
58

Chapter Three Literature Review
marginal costs. In the long run, some firms will become more economical in their
consumption of productive factors creating efficiencies that result in lower marginal
costs. These firms then reap the benefits of supernormal profits. Moreover, the perfect
competition theory assumes that the factors of production are elastic in supply. In reality,
some factors of production may be inelastic in supply as the time factor involved in
developing capabilities may be unknown. Furthermore some capabilities cannot be
bought and sold thus making some factors of production inelastic in supply (Dierickx &
Cool, 1989; Barney 1991). Supply in-elasticity can thus become a source of sustained
competitive advantage (Peteraf, 1993).
In the retail world the Chicago approach considers the retailing function to be
essentially perfectly competitive. However, Dobson & Waterson (1999) contend that
perfect competition is not evident in most areas of retailing with retailer power in a
limited form being the likely norm. They argue that retailer heterogeneity is created from
barriers to entry, economies of size and scope, national and local market powers,
exclusivity arrangements and retailer differentiation. They have also demonstrated that
retailer firm concentration in most sectors has increased substantially throughout the
1980s and that the movement of gross margins followed the direction of the concentration
levels. The cause of concentration is characterised by strong economies of scale, which
depicts a market structure that is imperfectly competitive. However, a model perfect
competition predicts a market structure with the following characteristics:
1. Many small sellers of a homogenous product.
2. Many small buyers.
3. Free entry and exit.
4. Free mobility of economic resources.
5. Perfect information.
59

Chapter Three Literature Review
6. The firm is a price taker and quantity adjuster.
The use of the perfectly competitive model has increased in recent time as it is an ideal
yardstick for comparison and evaluation against all other models that relate to the types of
competition in the market place (Sio, 1991).
Miller et aL (1999) suggests that the patterns of competition among different types
of retailers are complex. Their findings indicate a relationship between competition and
retail structure for different types of retailers. This implies a mutually beneficial
relationship among different types of retailers instead of overwhelming competitive
advantages for larger stores. Their study also suggested that regardless of whether scale or
saturation is examined, the size of the competitive effects is greater when store types are
adjacent in the degree of end use consistency of product line, undirectional from the
lowest to the highest consistency.
Winter (1993) proposes a customer heterogeneity theory in which retailers
compete on price and service, which reduce the time it takes to purchase a good. The mix
of these instruments that maximises the profits of retailers is based on tastes of consumers
on product margins and also the interretailer margins. Retailers create markets both
locally and/or nationally, and markets with the greatest dispersion of incomes are
assumed to have the greatest variation in opportunity cost of time (Winter, 1993). In the
multipurpose shopping theory Ghosh (1986) states that the agglomeration of dissimilar
types of retailers results in more than double the profits of stores in independent locations.
Evolutionary ecology is another means of describing the competitive processes
(Henderson, 1983) and is useful for understanding the types of competitive strategies and
the types of firms in an environment. Organisational theorists and sociologists have
formulated a model describing the growth of a specie in an ecology, to describe the types
of firms in an environment. The population of a specie is small, the effects of the carrying
60
Chapter Yhree Literature Review
capacity are small and the growth is an exponential function of the natural growth rate.
This theory denotes competitive advantages emerging as a result of first mover
advantages initially followed by the entry of other firms into this resource space for
exploitation of efficiencies gathered from related areas. Hcnce, firm heterogeneity is a
function of history or initial firm endowments.
The most influential work in evolutionary economics was produced by Nelson and
Winter (1982). They examined the implications of the processes of variation, selection
and retention. In their framework the unit of analysis was routines and the most efficient
and effective routines generate competitive advantages for firms.
Under the Institutional theory it is stated that managers make value maximising
decisions based on choices available to them. However these choices can be constrained
by surrounding institutional factors which affect the potential for economic rents (Oliver,
1997). The institutional context refers to rules, norms, and beliefs surrounding economic
activity that either define or enforce socially acceptable economic behaviour. The
decisions made through economic rationality at industry, inter-firm, individual levels
must then be balanced with the ability to manage the institutional context if a firm is to
sustain competitive advantage (Oliver, 1997). Therefore, the institutional determinants of
sustainable competitive advantage are normative rationality, institutional factors, and
isomorphism.
Marketing theories along with RBV theorists directly address the most
fundamental challenge of organisational survival by what gives rise to competitive
advantage and how it can be sustained (Srivastava et aL, 2001). The role of marketing is
value creation and is by definition externally focused. It attempts to determine what
value is perceived, experienced and understood by customers by determining what
customer needs are and it is ex ante. Furthermore marketing generates multiple forms of
61

Chapter Yhree Literature Review
resources through customer perceptions. Although brand names, customer and
distribution relationships are helpful in gaining and sustaining competitive advantages,
leading marketing theorists have not fully articulated processes by which internal and
market based resources are converted into competitive advantages (Srivastava et aL,
2001).
The entrepreneurship theory bases its unit of analysis on the cognitive ability of
individual entrepreneurs. Entrepreneurs have individual-spcciflc resources that recognisc
new opportunities and the assembling of resources is also individualistic (Alvarez and
Busenitz, 2001). Accordingly they argue that the entrepreneurship theory focuses on
heterogeneity of beliefs about the value of resources that ultimately leads to superior
performances i. e. competitive advantages between firms. They recognise that beliefs
about the value of resources are themselves resources.
Therefore the predominant feature of RBV is that it explains how competitive
advantage can be sustained whilst other theories mentioned above do not necessarily
explain sustainability of competitive advantages.
3.3 Resources and Competitive advantage
Firm resources are defined as stocks of available factors owned or controlled by
the firm. Resources are converted into final products or services using a wide range of
other firm assets and bonding mechanisms (Amit and Schoemaker, 1993). The resource-
based theory by Grant, (1991) identifies the key distinctions between resources and
capabilities. Resources being inputs of the production process and a capability as the
capacity for a team of resources to perform some tasks. Only few resources are
productive on their own. Productive activity requires the co-operation and co-ordination
of teams of resources. Resources are therefore a firms basic unit of analysis.
62

Chapter Three Literature Review
For perfonnance to be better, the firm has to possess resources and capabilities
that its competitors lack. Identification of such resources is important. Barney
(1991,1992) asserts that if a resource is valuable and rare and imperfectly inimitable, then
it can be a source of competitive advantage. This means a resource to be a source of
competitive advantage must meet three conditions. Firstly, the output from these valuable
resources is willingly purchased by buyers at a price far higher than the costs incurred in
bringing it to the saleable state. Secondly, it is scarce because it is subject to limited
supply. Thirdly, it is difficult for competitors to either imitate or purchase the resources.
In strategic analysis a finn's resources are strengths that firnis can use not only to
create wealth but also to implement their value creating strategies (Porter, 1980; Barney,
1991). The primary task here is strategy formulation for maximising rents over time.
These returns depend upon two key factors:
a) for sustainable competitive advantage durability, transparency, transferability and
replicability are important determinants and,
b) the appropriation of returns which is concerned with the allocation of rents where
property rights are not fully defined, for example, the relationship between individual
skills and organisational routines (Grant, 199 1).
The direct link between resources and profitability is twofold. The first looks at
what opportunities exist for economising on the use of resources. These resources are
tangible and maximising productivity is the key in this case. The other looks at the
possibilities of using existing assets more intensely and in more profitable employment.
Strategic industry factors such as barriers to entry, buyer/supplier power, intensity of
competition, and substitutes (Porter, 1980) impact on firms and influence the selection
and deployment of resources to use.
63

Chapter Three Literature Review
Features of the resources are important ingredients for above normal rent
generation potential of resources. The identification of characteristics, such as whether a
resource is scarce, unique, non-tradablc, inimitable, durable, idiosyncratic, and non-
substitutable (Rumelt, 1984; Barney, 1991; Mahoney and Pandian, 1992; Pcteraf, 1993;
Amit and Schoemaker, 1993), are important determinants for above normal profit
generation and sustainable competitive advantage.
A number of authors have generated lists of firms resources. Barney (1991)
classified three categories of firm resources: physical capital resources (Williamson
1975); human capital resources (Becker, 1964) and organisational capital resources
(Tomer, 1987). Physical resources include physical technology, plant and equipment,
geographic location, and access to raw material. Human resources include training,
experience, judgement, intelligence, relationships and insights of individual managers and
workers in a firm. Organisational resources include the firm's formal reporting structure,
together with its planning, controlling and co-ordination systems. Six major categories of
resources recognised by Hofer and Schendel (1977) are financial, physical, human,
technological, reputation, and organisational resources, indicating resources are tangible
and intangible in nature. A summary of resources is displayed in Table 3.1. However, not
all resources are strategically relevant resources. Only those attributes of physical, human,
and organisational resources that enable a firm to create and implement strategies which
help improve efficiency and effectiveness are classed as firms resources (Wemerfelt,
1984; Barney 1991). Moreover, recent literature on the possible links between RBV and
other disciplines has added more types of resources to the above list, for example, market
based assets of relational and intellectual (Srivastava et aL, 2001) and entrepreneurial
belief about the value of resources being resources (Alvarez and Busenitz, 2001).
64

Chapter Three Literature Review
The main purpose here is the selection and the conditions undcr which such firms
resources can be a source of sustainable competitive advantage for the firm. Thus the
firms resources must be heterogeneous and immobile. To exploit this potential Barney
(1991) has suggested resources must possess four attributes: they must be valuable; rare;
imperfectly imitable and without substitutes.
Table 3.1 Tvoe of Resources
Physical
Resources
Human
Resources 2 Organisational
-Resources 3
General
Resources 4
Technology Training Reporting Structure - Financial Plant & Experience Planning Physical
equipment Geographic Judgement Controlling Human Location Access to Intelligence Co-ordinating Technological Raw Materials
Relationships Reputation
Organisational
Source: 'Williamson (1975) 2 Becker (1964) 3 Torner (1987) 4 Hoffer and Schendell (1977)
According to Dobson & Waterson. (1996), economies of size and scope give larger
retailers a cost advantage over smaller rivals. This is due to falling fixed costs facilitated
by increases in sales and buying economies thereby reducing the variable costs of
purchases. Economies of scope arise from various product lines sharing fixed costs
through common display and storage facilities. However, both economies of size and
scope are generated from highly specific assets in the form of outlets. Miller et aL (1999)
suggested that regardless of whether scale or saturation is examined, the size of the
competitive effects is greater when store types are adjacent in the degree of end use 65

Chapter Three Literature Review
consistency of product line, undirectional from the lowest to the highest consistency.
Retailer outlets meet the first condition i. e. become valuable and a source of competitive
advantage as its outputs are willingly purchased by buyers at a price far higher than the
cost incurred in bringing it to the saleable state. Ilcavy investment in retailing has seen in
the recent past the rapid growth of outlets in the forni of supcnmarkcts and hypennarkcts,
the expansion of out of town and edge of town retail parks and the demise of some
smaller shops too. This means that these tangible specific assets are costly to redeploy to
alternative uses (Williamson, 199 1).
Resource specificity has also other uses in industry. This is particularly useful for
firms wishing to diversify (Grant, 1991). A resource used to produce only one product is
unsuitable for diversification. On the other hand, if this resource can be used in producing
more than one end product, its flexibility gives it the option of either more or less related
diversification. Hence it is this determinant that directs finns on deciding the type of
diversification to follow (Montgomery and Werrierfelt, 1988). The work carried out by
Chattedee and Wernerfelt (1991) on the links between resources and the type of
diversification considered three classes of resources: physical resources; intangible
resources and financial resources. Excess resources in physical, knowledge, and external
finance are associated with related diversification, whilst internal resources are related to
unrelated diversification.
Firms grow not only through internally generated slack but also from acquisitions
and mergers. When substantial expansion is not possible through organic change,
acquisition may be the answer. Acquisition is a way of rcconfiguring the capabilities of
both acquiring and acquired firms. For a path dependent change acquisitions deepen the
existing resource base of firms over long period of time. A path breaking change however
66

Chapter 7bree Literature Review
extends firm activities into areas that require very different resources (Karim and
Mitchell, 2000).
Retailer location effects permit supernormal returns to their locations but are not
sufficient to permit potential entrants to make believe they could push established firms
out of their lucrative locations. Carroll's (1985) resource partitioning model proposes that
intratype competition between larger generalists results in positive cffects on specialists
whilst minimum differentiation expanded from Hotelling (1929) works suggests that
similar firms benefit by forming aggolomeration. Ghosh (1986) on the other-hand
suggests intertype and intercategory competition enables customers to multipurpose
shopping. The multipurpose shopping theory suggests the agglomeration of dissimilar
types of retailers will result in double the profits of stores in independent locations. Good
locations can increase potential sales and a slight difference in location can have a
significant impact on market shares and profitability (Ghosh and McLafferty, 1987).
Hence the location effects enables consumers to:
a) make comparisons between shops,
b) reduce transaction costs,
c) maximise utility by locating an ideal bundle of goods rather than 'satisficing' on
limited selection availability.
The outlet performances are directly related to market demand. Capacity
utilisation is closely related to scale and is both a cost and value driver (Stabell and
Fjeldstat, 1998). Furthermore concentration levels in the UK retailing sector imply that
the number of firms that possess a bundle of valuable outlets is less than the number of
firms needed to generate perfect competition dynamics (Hirshleifer, 1980) thus making
outlets a rare resource.
67

Chapter Three Literature Review
A resource-based view proposes that resource selection and deployment are a
function of both internal firm decision making and external strategic factors. Economic
rationality and motivations guide managerial choices within the fin-n on profitability,
efliciency and effectiveness (Conner, 1991). Strategic industry factors i. e. buyer supplier
power, intensity of competition, industry and product market structure (Oliver, 1997) on
the other hand impact on firms and influence the selection and deployment of resources to
use. These two factors influence the rent generation potential of a finn. However a finn's
decision to select, accumulate and deploy resources and capabilities is based on economic
rationality constrained only by limited information, cognitive biases and causal ambiguity
(- Oliver, 1997; Ginsberg, 1994; Arnit and Schoemaker, 1993; Pcteraf, 1993). On the other
hand the firms ultimate strategies on heterogeneity or homogeneity could include what is
socially acceptable economic behaviour at that time. Oliver (1997) contends that although
the context and processes of resource selection is important to firm heterogeneity and
sustainable competitive advantage, a firm's ability to manage the social context of its
resource selection process is important to sustaining competitive advantage.
Value detennination is exogenous to RBV but the focus on heterogeneity in beliefs
about the value of resources by Alvarez and Busenitz (2001) suggests that value
maximisation. is internal to the firm. The recognition of opportunities and the ability to
organise resources into the firm and the creation of heterogeneous outputs through the
firm that are superior to the market will thus drive retailers to select and deliver values
appropriate to the firm. Aspirations regulate organisational investments in learning and
the firm's future capabilities may emerge as a result of various degrees of aspirations
between firms. However, once the learning process ends firms may experience poor
performances and refuelling may be needed. Hence the varying levels of firms aspirations
contribute to heterogeneity in firm capabilities, independent of the differences in learning
68

Chapter Yhree Literature Review
abilities or initial conditions. Winter (2000) argues that poorly positioned firm's move
fastest to adopt new techniques. Whilst Rosenbloom, (2000) on the subject of change
states that the individual leadership may be a central clement of dynamic capability. This
could be experienced when a firm is trying to adapt to revolutionary technological change
in its major line of business when it appoints a new managing director.
Managers make value maximising decisions based on choices available to them
constrained only by institutional factors (Oliver, 1997). The rules, nonns, and beliefs
surrounding economic activity define or enforce socially acceptable economic behaviour
at three levels:
a) at the individual level institutional context includes decision makers norms and
values,
b) at the firm level, it includes organisational cultures and politics,
c) at the inter-finn. level regulatory pressures and industry norms are prevalent.
Institutionalists claim that at the individual level the assumption is that managers
make non- rational choices influenced by force of habits, social judgement and historical
limitations. Normative rationality tends to lead to sub-optimal resource decisions and sub
optimal use of accumulated resources as human behaviour stretches beyond economic
rationality to social justifications and obligations (Zukin and DiMaggio, 1990). It is this
difference among firms in their management of normative rationality that creates a source
of competitive advantage (Oliver, 1997).
Conformity to social expectations contributes to organisational success and survival
(Baum and Oliver, 1991). Organisational success is the measure of the extent of
compliance to social expectations, and the rewards are increased legitimacy, resources,
and survival capabilities (Scott, 1987). The management of social constraints, which
affect resource optimisation, use and procurement, can vary between firms resulting in
69

Chapter Three Literature Review
firm heterogeneity. Institutional isolating mechanisms now act as barriers to imitations
stemming from the firm's reluctance to imitate or acquire resources incompatible with the
finns culture or political context. A firni thus foregoes the opportunity to own resources
and capabilities, that support a competitive advantage (Oliver, 1997).
The finn's objective is value maximisation i. e. maximisation of the net present value
of future profits. Value maximisation in retailing arrives through scale (size of stores),
saturation levels (number of stores per 1000 households), and personal service levels
(quantity and quality) (Miller et aL, 1999). The size and saturation levels will vary from
region to region as retailers form markets locally. The total number of outlets depicts the
total volumes traded and hence the market shares of retailers. Dobson & Waterson (1996)
have observed that concentration in retailing in the UK has increased in the recent past
mainly due to the capabilities of a handful of firms to dominate their respective industries
by controlling large slice of the market. They also provided some evidence of the
direction and upward movement of gross margins in line with concentration ratio i. e.
markets shares. This implies economic concentration through economies of scale and
scope are connected to market power at local and/or national markets (collection of local
markets). Superior gross margins are the result of:
a) volumes traded,
b) mix of products (portfolio) and,
c) prices charged.
Based on the capacity available to the firm, management can set standards for
computing variance analysis in order to capture variation in profits and/or market shares
of their value creating strategies. In this channel the variation in profit that emerges from
product portfolios individual to the firm can be analysed from the following formulae
70

Chapter Three Literature Review
which is based on variations of sales price, sales volume and sales mix (Wilson and Chua,
1988).
a) Sales price variance = Actual units sold* ( Actual price - Standard price),
b) Sales volume variance = Sales quantity variance + Sales mix variance,
c) Sales quantity variance = Budgeted profit on budgeted sales -Expected profit on
actual sales,
d) Sales mix variance = Expected profit on actual sales - Standard profit on actual sales.
The variance relating to sales volumes can be attributed to differences between:
1) Actual and anticipated total market size; and
2) Actual and anticipated market share
This takes into account the impact of market size and market penetration variations.
3) Market size variance = (Ma - Mp)* Sp * Cp
4) Market share variance = (Sa - Sp) * Ma* Cp
Volume variance = Market size variance + Market share variance
Where: Ma = actual total market in units
Mp = planned total market in units
Sa = actual market share
Sp = planned market share
Cp = actual contribution per unit.
Proposal 1: Competitive advantage is associated with key resource(s) (KR)
3.4 Competitive Behaviour and Competitive advantage
Examination of the nature of competitive behaviour is important to understanding
competitive advantage. For the purposes of valuing resources and capabilities it is
71

Chapter Yhree Literature Review
necessary to use theoretical tools that specify the market conditions under which different
resources will or will not be valuable (Barney, 2001). The RBV's role here is to look
inside the firms to establish how, why or what caused heterogeneity in the firni
performances. With this in mind, a formal approach to the modelling of competitive
behaviour is sought after for understanding the behaviour of free economic agents.
The development of a conceptual framework by Wensley, (1998) for modelling of
competitive behaviour approach suggest that the following areas should be defined:
firstly, the nature of the arena in which the competitive activity takes place; secondly, the
structure or rules which govern the behaviour of the participants; and finally, the options
available in terms of competitive behaviour.
There are four types of generic models of competition: game theory, evolutionary
ecology, sports games, and military conflict. They are all informative, but only game
theory and evolutionary ecology will be considered in the present study.
With all models describing competitive activities, economic rationality is the key
point for decision making. Some models assume weak rationality i. e. take actions in line
with their strategic plans, whilst others assume a stronger form where the intentions of
agents can be expressed in terms of various economic measures such as sales, growth,
profit, or market share objectives. Rationality thus implies a link between actions and
intentions, but not common intentions between competitors (Wensley, 1998).
Game theory models describe the evolution of competitive behaviour strategies. The
feature of a game theory model is that it is governed by a set of rules. These rules
describe:
a) the number of firms competing against each other,
b) the number of actions each firm can take at each point in time,
c) the profit each firm can achieve with each competitive action,
72

Chapter Three Literature Review
d) the time pattern of actions, where there is an early movcr or simultaneous action and,
e) the nature of information about competitive activity.
Moreover, the results of this model predict how a firm should behave and depend
on a given set of assumptions on alternatives strategies, their pay-off, and the prescription
for optimal solution (Kadane and Larkey, 1982).
In the Industrial Organisation (1/0) economics literature, basic game theory has
been extended to develop a greater understanding of the nature of competitive behaviour.
Assumptions of homogeneous firms and customers have been relaxed as neither the firms
nor the customers are alike. This has lead to the Industrial Organisations dominant
paradigm known, as structure-conduct-performance (SCP), which suggests a firms
performance is the result of competitive interactions. The conduct of firms is determined
by the structure of the industry where the firms compete and identifies a set of industry
conditions that have impacts on both behaviour and performance of firms. Hence it is the
industry structure and the industry conditions which are the sources of competitive
advantages.
The conduct is determined by the structure of the industry where the finns
compete and is based on the decisions made by the individual firni on for example, prices,
building capacity, advertising capacity, and the investments in research and development.
Structure is measured by the properties of the industry. These properties are for example
are, number and size of firms (concentration), advertising intensity, capital intensity,
concentration of suppliers and customers, the extent of product differentiation and
barriers to entry. The SCP paradigm thus identifies a set of industry conditions that affect
competitive behaviour and firm performance approaches, which separates competition
from competitors. Furthermore, Hunt (1972) has demonstrated that competition occurs
between strategic groups and that not all firms compete vigorously with each other.
73

Chapter Yhree Literature Review
Evolutionary Ecology is a means of describing the competitive process
(Hcnderson, 1983) and is uscful for undcrstanding the typcs of compctitivc stratcgics and
the type of firms in an environment. The two alternative strategies described arc tcrmed
as r and k strategies and are explained by Wensley (1998) as follows.
The r-strategists enter a new resource space at an early stage when few
competitors are present. They arc flexible and inefficient due to lack of experience,
whereas k-strategists join later after several r-strategists have entered a new environment.
The k-strategist enter this new enviromnent with their extensive experience and exploit
their advantage of greater efficiency. These environments have two dimensions, namely
variability and frequency of change. In a high velocity enviromnent changes are
spectacular and firms use different strategies for survival and is believed to be suitable for
a specialist strategist who can exploit high performance in a narrow portion of the
cnviromncnt. The r-spccialist are small organisations favouring first movcr advantages
than efficiencies whereas k-strategists are small but new organisations focusing on
exploiting stable narrow areas based on efficiencies. In a low velocity environment
strategic alterations are very minimal and infrequent thus suiting a generalist strategist to
exploit large scale efficiencies. The r-generalists are larger and established organisations
that can exploit new opportunities from either altering their current activities or by
making minor expansions to their existing business. Whereas, the k-generalists are large
organisations, competing on efficiencies on a large scale, based on their experiences in
related areas.
It was stated earlier that firm performances were the result of competitive
interactions and both structure and conduct of finns depend on industry conditions. In
retailing, market factors determine retail structures (Hirschman, 1978; Ingene, 1983;
Ingene & Brown, 1987). The market structure entails the demographic characteristics of
74

Chapter Yhree Literature Review
the customers and environmcntal factors in a trade area (Bucklin, 1972). The retail
structure is defined as the manner in which firms engage in the trade of a cornmoditY and
its construction includes retail stores by size, mix, and the distribution of retailers within a
geographic area (Bucklin, 1972). Retail structures associate consumers. Consumers adapt
their shopping habits to signal both time needs and mobility (Albaum and Hawkins 1983;
East et A, 1994). Retail structures are thus responsible for quality, price and selection of
products available to consumers (Miller et aL, 1999). Retailers fundamentally operate in
local markets and the relevant markets may be as large as a city or small region (Porter,
1976). The features of retail markets as per Winter (1993) are as follows:
a) The role of retailer's services is to reduce consumers opportunity costs especially the
time costs of obtaining the product.
b) The varying travel and search costs to and in outlct locations force retailer
diffcrcntiation.
c) Consumers are heterogeneous in their opportunity costs of time.
There are two schools of thought regarding competitive interactions and retail
structure. One school of thought relates to 'symbiosis' and the theories from this school
hold that retailers have mutual beneficial effects on each other. The other refers to
'darwinism' and suggests that retailers compete fiercely with each other on a survival of
the fittest basis. However Miller et aL (1999) contend that symbiosis and darwinian
schools predict contradictory outcomes depending on specific competitive situations.
The competitive interaction among retailers is commonly described as either intra-
type or intertype. Levy and Weitz (1998) define intratype competition as competition
between the same type of retailers selling similar merchandise and intertype as between
different types of retailers selling similar merchandise. Dunne and Lusch (1999) describe
intratype competition as between stores within the same (SIC) code. Mason, Mayer, and
75

Chapter Yhree Literature Review
Wilkinson (1993) define intratype competition according to the type of competition i. e.
retailers competing against each other for the same household goods. Hirschman (1978)
defines intratype competition based on product line similarity whereas Ingcnc (1983)
classification stretch to intraindustry, interindustry, intmgroup and intergroup.
Furthermore Miller et aL, (1999) state that researchers have yet to reach consensus
on various definitions of retail competition. They argue that the lack precise taxonomy on
retailer types leads to nonexclusive categorisation, of competitive interaction among
stores. For example they use an example of the competitive interaction between BO Peep
Books and a Bames and Noble bookstore to highlight the lack of precise classifications.
Under the existing definitions of retailer competition Hirshman (1978) and Dunne and
Lusch (1999) would have classified the above competition as intratype whilst Levy and
Weitz (1998), Ingene (1983) as intertype and intraindustry competition respectively.
The ambiguity in the definition of the retailer types has lead to yet another
definition of competitive interactions among stores. Miller et aL (1999) now define the
three types of retail stores using a product consistency approach, for example how closely
related product lines are to end use (Kotler & Armstrong, 1996). Their definitions are as
follows:
a) Limited-line specialists offer the highest level of consistency of product lines to fulfil
specific product market end use needs.
b) Broad-line specialists offer broader level of consistency of product lines to fulfil
complementary and more generic market end use needs.
c) General merchandisers offer relatively inconsistent product lines to fulfil non-
complementary and independent market end use.
Miller et A (1999) classify intratype as competition between the same types for
example, limited line versus limited line, broad line versus broad line selling similar
76
Chapter Yhree Literature Review
merchandise, intertype as between limited line and broad line selling similar merchandise
and intercategory as between specialist and general merchandisers selling similar
merchan ise.
The firms conduct in a market place is the result of competitive interactions,
whilst it has already been indicated that all finns are not alike. The concept used here is
that competition can be isolated by using three methods i. e. the strategies of
differentiation, cost efficiency, and collusion as not all f inn compete vigorously with each
other. Competitive advantage can take shape when strategic fit complements competitive
positioning. To this extent, firms follow competitive strategies such as cost focus, product
differentiation, market focus or a combination of competitive strategies (Porter, 1980).
The pre-requisites for cost advantage are scale efficient plants, superior process
technology, low cost sources of raw materials, and low cost labour. The presence of
differentiation advantage on the other hand relates to brand reputation, product
technology, marketing, distribution, and service capabilities (Grant, 1991). The main
variable relating a firm to its competitors is its relative market share (Buzzell et aL, 1975)
and this takes into account the competitive positioning effect, which explains 32 per cent
of the variation in profit between firms (McGahan and Porter, 1997).
When the industry advances through its life cycle, some firms experience the
concept of strategic groups and the concept of mobility barriers (Hunt, 1972; Caves and
Porter, 1977). Hunt (1972) suggested that not all firms within an industry compete
vigorously against each other. The ferocity of competition occurs between firms who
have similar strategies (Porter, 1980). Parallel strategies are the result of institutional
influences exerted on firms by governments, professional associations, and other external
bodies to confonn, define or prescribe socially acceptable behaviour (Oliver, 1997; Scott,
1995). Similarities happen over time as firms within a group conform to common
77

Chapter Three Literature Review
influences and relationships that diffuse common knowledge and understanding
(Jepperson, and Meyer, 1991; Oliver, 1988). The purpose of isomorphism pressure
(Meyer and Rowan, 1977) is to reduce firm heterogeneity.
In retailing Hirshman (1978), argues that stores arrange themselves in a three tier
price quality continuum in which direct competition remains within each tier. These firms
appear to have similar market powers, which bring out tangible barriers to entry through
scale economies, patents, experience advantages, brand reputation etc. These barriers can
only be acquired slowly over time or at an inconsistent expense (Grant, 199 1).
The Chicago approach considers the retailing function as perfectly competitive
whereas Dobson and Waterson (1996) argue that perfect competition is not evident in
most areas of retailing and that retailer market power, at least in a limited form is the
likely norm. The need for economies of size and scope, barriers to entry and national
market power has led to sharp increases in concentration. Concentration in the retail
channel in the UK has led to a handful of retailers holding large market shares and this
facilitates buying power with impacts on the producers/suppliers and is a concern for the
regulators. Generally, the volumes purchased by the retailers usually equals the volumes
purchased by other large buying groups but in some industries retailer purchases
outweigh other buyer groups. Such an imbalance triggers retailer power through
concentration thus implying increased ability to exercise buying and selling power in a
collection of markets.
In contrast smaller retailers may compete with larger retailers by competing in
local markets successfully differentiating themselves from their rivals and may have
greater market power than large retailers in direct competition with neighbouring retailers
(Dobson and Waterson, 1996). Moreover Dobson and Waterson (1996) state that the
influences of small independent establishments have substantially diminished in recent
78

Chapter Yhree Literature Review
times as the exploitation of economies have led to a few firms controlling a considerable
slice of the market. A recent study by Miller et aL (1999), however, implies that thcre arc
mutually beneficial relationships among different types of retailers rather than an
overwhelming competitive advantage for larger stores.
The pressure for manufacturers to gain access to the retail level is becoming
increasingly intense as manufacturers step up product proliferation. (Dobson &
Waterson, 1996). They further state that multiproduct retailers have now become
insulated from the threat of individual manufacturers extending vertically as the demand
for multiproduct retailing is on the increase and the replacement of individual suppliers
can take place with minimal disruption. This situation may lead to
manufacturers/suppliers seeking less efficient retailers
Proposal 2: Competitive advantage is associated with competitive behaviour
(CB).
3.5 Capabilities and Competitive advantage
Capabilities are defined as the firm's capacity to deploy resources in combination,
using organisational processes, to effect a desired end (Amit and Shoemaker, 1993). A
capability is the capacity for a team of resources to perform an activity. Creating
capabilities is not a simple process of assembling a team of resources. Capabilities
involve complex patterns of co-ordination between people and other resources.
Capabilities are the main source of its competitive advantage (Grant, 1991). Capabilities
are ' things firms have or are things firms do' or 'are activities a firm does better than
another firm' (Besanko, et aL, 2000). The ability of the finn to transform itself to meet
current and future challenges is the process through which capability profiles are
developed.
79

Chapter Yhree Literature Review
The transformation process pursued by a firm is classified into two broad
categories, namely adaptive specialisation and adaptive generalisation (Chakravarthy,
1982). Adaptive specialisation, is the process of improving the goodness of fit in a given
state of adaptation where established firms exploit profitable opportunities in their current
environment. Rationalisation of organisational processes and structures takes place to
ensure the use of both material and organisational capacities are moving to the nearest
adaptive fit. Firms will enter the industry and erode away the supernormal profits by
imitation. However firm strategies will be based on their capability profile and some
firms could experience difficulties of adoption and change in capabilities. Hannan and
Freeman (1989) argue that the initial conditions determine firm capabilities as
environmental changes favour some bundles of firm resources over others. Cockburn, et
al. (2000) on the other hand analysed that the starting conditions and the responses of
firms to environmental conditions affect the rate of adoption.
Competitors will emerge to erode heterogeneity through imitation. New firms
might enter the industry and established firms could just survive or even divest as the
industry progresses through its life cycle. The likelihood of entry, the amount of
innovation, and the exit from the industry are closely connected to the pre-cntry
experience of these firms. According to Klepper and Simons (2000) firms that dominate
the industry not only entered the industry early but also had pre-entry experience in
relatively similar businesses, for example, home radio producers entering the television
industry. However the first entrants into agglomeration will attempt to block similar
stores to protect the exclusivity of benefits. Ghosh (1986) states that although
multipurpose shopping supports 'symbiosis, for intcr-type and inter-catcgory
competition, it brings in 'darwinism' for intra-type competition.
80

Chapter Yhree Literature Review
There are two kinds of tangible isolating mechanisms namely impediments to
imitation and early mover advantages. Impediments to imitation are legal restrictions,
superior access to inputs or customers, market size and scale economics, intangible
barriers and strategic fit. Early mover advantages include the leaming curve, network
externalities, reputation and buyer uncertainty, and buyer switching costs (Besanko et aL,
2000).
There are also the conceptually distinct intangible barriers to imitation, such as
causal ambiguity, dependence on historical circumstances and social complexities. These
barriers are installed by a firm's causal ambiguities, dependence on historical
circumstances and social complexities become shields for protecting firm heterogeneity.
However these intangible barriers to imitation are erected over time by personal
relationships internal and external to the firm.
Finns invest in specific assets to promote co-operative arrangements with other
firms. These arrangements are meant to reduce opportunism, and are, subject to firm
dependency on the use of specific assets and thereby the cost of inter-firm co-operation.
Exclusive dealing facilitates superior access to inputs and is an impediment to imitation.
However if opportunism arises, the firm is faced with a choice of continuing to work with
the partner or foregoing the expected value of its specific assets (Combs and Ketchen,
1999). Additionally, investors in highly specific assets incur sunk costs and therefore face
exit costs too. Sunk investments are likely to be associated with different forms of assets
specificity in many retail markets (Williamson, 1986).
Recent economic analysis of exclusivity arrangements has revealed that such
practices can increase efficiency and reduce competition (Marvel, 1982; Steuer, 1983 and
Ornstein 1989). Exclusivity (EX) has practically unlimited capacity (Wernerfelt, 1989).
Exclusivity brings in the social element of inter firm relationships (Oliver, 1997). For
81

Chapter Three Literature Review
large retailers, exclusivity arrangements are necessary for ensuring supply and may
profitably dampen competition between retailers. This process allows retailers to
specialise in selling different brands or products in order to avoid head to head intrabrand
competition notably when economies of scope are low in retailing (Dobson and
Waterson, 1996a).
Exclusive dealing promotes supplier hierarchies through which risk elements
attached to quality and delivery are transferred to the preferred suppliers. Furthen-nore the
retailer controls the technology requirements without carrying the burden of ownership
and their extensive financial powers facilitates bulk buying with large discounts. These
differentiated service capabilities make large retailers inimitable and consumers are made
to view them as imperfect substitutes (Dobson and Waterson, 1999).
Exclusive dealing may also be an entry barrier into retailing and arises when at-
least one manufacturer has low marginal coks of production. The entry deterrence model
of Comanor and French (1985) indicates that the foreclosing manufacturer purchases the
retailing barrier to entry and converts it into a manufacturing barrier to entry. By contrast
Mathewson and Winter (1987) point out that the retailing barrier allows the manufacturer
to exercise its low cost advantages to exclude other manufacturers.
Proposal 3: Competitive advantage is associated with inter-organisational
capabilities (10C).
Valued resources and capabilities can be built up through cumulative leaming
within the firm (Cool and Dierickx, 1994). A firm can accumulate specialised capabilities
over time (Barney, 1991) creating intangible barriers to imitation. Intangible barriers exist
when the firms advantages, which lie in their distinctive organisational capabilities,
cannot be explained easily. Capabilities may reside within a business function;
alternatively they may be linked to technologies or product designs. They may also reside
82

Chapter Three Literature Review
in the firms ability to manage linkages between elements of the value chain (Besanko et
aL, 2000).
Experiences gained from learning and the reputation gathered by retailers on
experience/credence products together with the location effects, lead to incumbency
advantages (Dobson and Waterson, 1996). For retail outlets one of the key activities is the
time taken to accomplish exchange from the time point of placing an order. It includes
several activities within the product channel and is driven by teams of resources (Grant,
1991). The functions of the product channel comprises of. a) inventory management, b)
material handling, c) communication and order processing, d) transportation (Stash,
1972). The workings of the four functions collectively indicate how well the flow for
exchange is accomplished i. e. logistics policy and support.
Strategic fit creates a powerful barrier to imitation (Porter, 1990). Strategic fit
exists when firm activities form a coherent, mutually reinforcing whole. To successfully
imitate a firm with activities driven by strategic fit, a rival has to align their entire system
of activities (Besanko et A, 2000). Rumelt (1984) coined the term 'isolating mechanism'
which refer to the extent to which the economic forces can limit the duplication or the
neutralising of competitive advantage by a firm's resource creating activities.
Proposal 4: Competitive advantage is associated with key organisational
capabilities (OC).
Adaptive generalisation on the other hand refers to the process that improves the
survival potential of the organisation. It is the aim of adaptive generalisation to enhance
the material and/or organisational capacity of a firm as required moving it to the next
higher state of adaptation (Chakravarthy, 1982). The localized competition model by
Baum and Singh (1994), suggests that lower failure rates amongst organisations is present
when there is less overlap of resource bases. The potential for adverse competition among
83

Chapter Three Literature Review
organisations is the function of the overlap of resource bases for example customer
demand, labour and financial needs. Based on resource partitioning and localiscd
competition models, Miller et aL (1999) propose that different types of retailers will
thrive in each other's presence due to the lack of competition for resources. A successful
finn adaptively fitted with its enviromnent will generate a surplus of contributions over
the inducements. It is te investment of this surplus slack (Cyert and March, 1963) in the
improvement of its ability to counter uncertain futures that is the main concern of
adaptive generalisation. Some established firms will use this slack to invest heavily on
research and development of key assets with the future in mind, whilst other firms may
pursue adaptive specialisation. i. e. short-terin profitability distributing slack to keep
shareholders happy. The difference between the two policies is that one grows into the
next state of fit, whereas the other stagnates into the homogeneous state. What creates
heterogeneity is finding the balance between short-tcn-n profitability and the investment
of slack for longevity. However firm investment of slack is hard to identify and
profitability ratios do not always tell the whole story. A better indicator of a firm path
may be found by scrutinising the elements of working capital. This is where the
importance of the inclusion of working capital (short-term resources) comes into play.
The working capital capabilities are the capacity that is available to a firm to
compete. These capabilities facilitate the key role of strategic management which is to
adapt, integrate, and reconfigure internal and external organisational skills, resources,
functional competencies to match the requirements of a changing environment using
systems of learning that constitutes dynamic capabilities (Teece et aL, 1997).
Dynamic capabilities are a set of specific and identifiable processes relating to a
firm and are path dependent in their emergence and have significant commonalities across
firms. This means they are more homogeneous, fungible, equifinal and substitutable
84

Chapter Three Literature Review
(Eisenhardt and Martin, 2000). Superior dynamic capabilities are likely to have
competitive advantage over other firms in the short term, and are not a sufficient
condition for competitive advantage. Dynamic capabilities are not a source of long term
competitive advantage but they are tools available to managers to manipulate existing
resource configurations to build new resource configurations depending on what
competitive position a firm is experiencing at that time (Eisenhardt and Martin, 2000).
To develop strategic assets firms require working capital. The outlet performances
are directly related to market demand and capacity utilisation is closely related to scale
and is both a cost and value driver (Stabell and Fjeldstat, 1998). To this extent value
maximisation is one of the prime targets of management and sustaining value requires
that the condition of heterogeneity be preserved. In order to achieve this status firms must
set ex ante limits to competition as competitive forces could limit competition for those
values (Peteraf, 1993). Moreover Pcteraf (1993) also argues that prior to a firm
establishing a superior resource position there must be limited competition for that
position. This means there must be ex ante limits to competition and the cost of
implementing strategies via other resources should not erode away the anticipated returns.
This is where the hidden firm is at work, planning its future in meeting its desired end.
Elements of working capital include short-term resources for example stock,
debtors, cash whilst creditors provide the short term funding for the firms. However
policy decisions relating to the size of these resources and funds have long-term
implications for retailers and may be subject to activities within the elements of working
capital. These product/non-product activities will relate not only to the capabilities of key
resources installed by the firm, but also to the industrial economics central concern of
identifying actions that minimises the cost of governance and economic exchange which
in turn maximise performance. In other words, if a firm is to have competitive advantage,
85

Chapter Three Literature Review
it has to implement a value creating strategy not simultaneously implemented by current
or potential competitors.
The firm's strategy in this case links up to products on offer. If, for example, a
retailer delivering customer values from efficient product portfolios that maximise returns
and/or increase market shares may have stock turn ratios far higher than those delivering
customer values from inefficient product portfolios. On the other hand Besanko ct aL
(2000) state that products could be close substitutes if they can meet three conditions
namely:
a) They have the same or similar product performance characteristics.
b) They have the same or similar occasions for use.
C) They are sold in the sarne geographic market.
Close substitutes however have the potential to reduce rents.
The pressure for manufacturers to gain access to the retail level is becoming
increasingly intense as manufacturers step up product proliferation (Dobson & Waterson
1996). The authors state further that for example in food retailing, the number of products
sold through supermarkets has doubled since the 1980s and the number of new products
launched has increased at an even faster rate as manufacturers step up the extent of
product proliferation. In such circumstances, manufacturers have little alternative but to
offer substantial discounts to large retailers. Vertical extensions thus become difficult for
the manufacturers due to the high number of product lines and fixed cost diffusion. This
connotation highlights not only the shifting of the balance of power but also the extent to
which retailers can threaten to replace existing suppliers with minimal disruption.
On the other hand retailer differentiation could be created from value creating
strategies that relate to non-product activities. The characteristics of manufactured goods
may be relatively straightforward to specify, but the factors that differentiate retailer
86

Chapter Three Literature Review
services are less obvious and yet, the retailers are viewed by consumers, as imperfect
substitutes (Dobson and Waterson, 1996). The task of the marketing manager is to
develop and execute a marketing plan that makes the firm's product offering different to
competitive offerings allowing the firm to shield itself from competition (Boulding and
Lee, 1994). The authors also state that once the product design with desired attributes is
introduced into the market, any subsequent design changes would be costly and time
consuming. Accordingly, marketing managers often attempt to alter customer perceptions
regarding uniqueness and desirability of their existing product offerings by means of
other elements of the marketing mix for example advertising, promotions, personal
selling and these non-product activities lead to differentiation and also reduce price
competition (Boulding and Lee, 1994).
To this extent retailer strategies may be pointed at retail branding as multiproduct
retailing is on the increase. Retail branding has the double benefit of differentiating
services on the selling side as well as from the buying side too. The main aim of this
strategy is to countervail the selling power of the supplier brand (Dobson and Waterson,
1996). Furthermore Ghemawat (1986) argues that inimitable positions derive from size
advantages, preferred access to resources and/or restrictions on competitors options. This
means if close substitutes were present in an industry, retailers may wish to implement
strategies that could restrict competitor ability to dissipate anticipated returns.
The stocks held in warehouses/stores need to be converted into cash as soon as
possible. The facilitation of instant purchases, especially for expensive consumer durables
may require a method of payment that is suitable for customers for example consumer
credit. To this extent firms may use their healthy balance sheets to fund consumer credit.
On the other hand if the trading is on a large-scale firms may even set up subsidiary
companies for the provision and management of consumer credit. Given this situation the
87
Chapter Yhree Literature Review
retailers may be interested in capturing customers by implementing a value creating
strategy that does not rely on the selling power of supplier brands.
The role of retailers stretches to other features of the retail market especially the
services that reduces consumers opportunity cost of getting the product where consumers
are heterogeneous in their opportunity cost of time. According to the consumer
heterogeneity theory the mix of these instruments that maximises collective profit is
determined by the tastes of consumers on the 'product margin, ' and their own
margins/'interretailer' margins (Winter, 1993). Retailer preferences are based on factors
such as the respective instore services, merchandise mix, quality of goods, and methods
of doing business (Hotelling, 1929).
Moreover Winter, (2001) argues that retailers rely on low prices to attract any given
number of customers. Finns that charge above average prices are assumed to have a
unique, sustainable price advantage. For these firms, promotional activities focus
consumers attention on price, an attribute inherent to all brands. The provision of such
information by the seller lowers the customers search costs and is believed to lead to
lower differentiation (Nelson, 1974). On the other hand Boulding and Lee (1994) suggest
that for firms pricing above the industry average, the current advertising and sales force
activities increase future differentiation and decrease future price competition, whereas
current promotional activities decrease future differentiation and increase future price
competition.
However having set up the consumer credit facilities the retailer then needs to
implement a value creating strategy that would entice the customers into their stores. For
these purposes the implementation of a strategy that is independent of the selling power
of the supplier brand may be required. The facilitation of such a strategy may be aimed at
weakening the selling power of some popular supplier brands especially if the retailer has
88
Chapter 7hree Literature Review
the opportunity to purchase cheaper brands for example cheaper foreign imports that can
perform the same task.
Proposal 5: Competitive advantage is associated with strategic adaptive
capabilities (SAC).
3.6 Hypothesis
3.6.1 Introduction
Strategic complexity requires general models and the strategist job is to find a
match between the environment, organisational resources and capabilities (Pricm &
Butler, 2001). Finding a match requires the understanding of the structural features of an
industry. The RBV indicates that the industries structural features arc the result of the
organisational capabilities of its constituent firms, which have accumulated over time
(Cockburn et al., 2000). On the other hand the SCP suggests the conduct of firms is
determined by the structure of the industry where the firrns compete. The structure is
measured by the properties of the industry for example, the number and size of firms,
advertising intensity, capital intensity, concentration of suppliers and customers, the
extent of product differentiation and barriers to entry. The conduct is thus determined by
the decisions made by the individual firm for example, prices, building capacity,
advertising capacity and the investments in research and development.
In order to determine the sources of competitive advantage it is necessary to probe
into the market structure of the domestic appliance market in which retailers attempt to
deliver customer values from product portfolios of white goods that maximises their
returns and / or increase market shares. The market structure involves the demographic
characteristics of consumers and the environmental factors that facilitate that structure
(Bucklin, 1972). Furthermore the market factors within the market structure thus
89
Chapter 7hree Literature Review
determine the retail structure that meets the needs of the consumcrs (Bucklin, 1972;
Hirschman, 1978).
3.6.2 Sources of Competitive Advantage
Dobson & Waterson (1999) contend that perfect competition is not evident in
most areas of retailing and that retailer market power at least in a limited form is the
likely norm. Moreover they argue that retailer heterogeneity is created from barriers to
entry, economies of scale/scope, national and local market powers exclusivity
arrangements and retailer differentiation of services.
Therefore it is necessary to examine the type of competition that exists in the
domestic appliance market in order to determine whether there are any sources of
competitive advantage that could be exploited if the market was imperfectly competitive.
As stated earlier a model of perfect competition could facilitate comparison.
Having established the possible sources of competitive advantage in the domestic
appliance market it is important to scrutinise the shared resources and capabilities of
firms that are associated with competitive advantages in the retail channel for white
goods. Based on the sources of competitive advantages mentioned above it is now
necessary to identify key resources that have the ability to manipulate other resources and
capabilities that deliver customer values from product portfolios that maximise returns
and / or increase market shares for the shareholders. Figure I below depicts a competition
model that would facilitate scrutiny.
90

Chapter 77iree Literature Review
A Competition Model
3.6.3 Issues
Retail Structure Market Structure
Market ! actors reate or Impede Resources
Demand Capabilities
Perfect / Imperfect I Valuable, rare, Competition Context inimitable and
Market Power Measure Customer Values I (Product Portfolios)
Figure LA competition model
It is the retail channel and not the retail industry that is of interest for this study.
The retail channel reflects the retail structure that directly involves the consumers.
Consumers adapt their shopping habits to signal both time needs and mobility (Albaum.
and Hawkins 1983; East et aL, 1994). Retail structure is defined as the manner in which
f'mns engage in the trade of a commodity (Bucklin, 1972). The construct depicts the
composition of retail stores by size, mix and the distribution of retailers within a
geographic area. The retail structure is thus responsible for quality, price and selection of
products available to consumers (Miller et aL, 1999).
Furthermore retailing involves multiproduct trading in a retail channel compared
to single business firms where most of the RBV research has taken place to date. A single
retail channel facilitates the flow of several streams of product lines. A mix of product
lines with technical similarities may directly correlate to their endowments of resources
91

Chapter 77iree Literaturc Review
and capabilities. This indicates that these endowments of resources and capabilities may
be shared between the selected product lines in order to maximisc, the delivery of
customer values. Such value creating strategies may have the potential to exploit
synergies that could result from the sharing of resources and capabilities unique to those
retailer outfits. The retailers selling white goods also sell brown goods in this retail
channel. The selection of white goods for this study may be an indicator as to whether it
is possible for retailers to enjoy the benefits of multiple economies of scale.
3.6.4 Independent variable: Key resources:
The review of the rctail channel for white goods suggested the key physical
resource in the retail channel could be the outlets (OU). Outlets being a key tangible
resource were well supported in the telephone interviews and also in the MMC (1995)
survey of small retailers in which the effects of large outlcts/retail parks were ranked as
the highest factor worsening competition in this retail channel. Value maximisation takes
the shape of delivering customer values from product portfolios that maximise returns
and/or increase market shares for the retailer.
To exploit the full potential of outlets i. e. value maximisation, it is necessary to
ensure delivery of customer values through product portfolios that maximise retums per
outlet and/or increase in market shares for the retailers. Capacity utilisation is closely
related to scale and is both a cost and value driver (Stabell and Fjeldstat, 1998). Value
determination is exogenous to RBV and the focus on heterogeneity of beliefs about the
value of outlets by Alvarez & Busenitz (2001) suggest value maximisation is intemal to
the finn.
Miller et aL (1999), suggest that regardless of whether scale or saturation is
cxamined the size of the competitive effects is greater when store types are adjacent in the
92

Chapter Yhree Literature Review
degree of end use consistency of product line, and undircctional from the lowest to the
highest consistency. In order to capture the maximum effect of competition and its
relative competitive advantages, especially the economies of scale, market power and
barriers to entry (Dobson and Waterson, 1996), the volumes passing through the outlets
were considered instead of store sizes and or store mixes. This is a mature retail channel
and growth in sales are expected to be around I to 2% and any changes to market share
was expected to be at the expense of competition.
Scale based barriers to imitation and entry is likely to be powerful in markets for
spccialised products. Scale economies can prevent smaller retailers already in the market
from growing larger as the demand for products in this mature channel is fairly constant
and can only probably support larger retailers already in the market. Moreover as markets
are formed locally, larger retailers could force scale-bascd barriers to imitation and entry
through a substantial geographical spread of outlets. On the other hand it was stated
earlier that r-specialists are small organisations favouring first mover advantages than
efficiencies.
Retailer differentiation from good locations can increase potential sales and a
slight difference in location can have significant impact on market shares and profitability
(Ghosh and McLafferty, 1987). Retailer preferences on respective instore services,
merchandise mix, quality of goods, and methods of doing business is based not only on
the size of the market but also on the location of outlets. The agglomeration of dissimilar
types of retailers for example in retail parks could promote multipurpose shopping (Gosh,
1986). Consumers maximise utility by locating an ideal bundle of goods for themselves
for example purchasing kitchen units from one retailer and domestic appliances from
another both located in the same retail-park. Carroll's (1985) resource partitioning model
93

Chapter Three Literature Review
on the other hand proposes that intra-type competition between larger generalist results in
positive effects on specialists.
White goods are in the mature state and modifications are infrequent and are
usually cosmetic. The markets are also moderately dynamic. The minimum efficient scale
in the retail channel is assumed to be large relative to market demand and it is expcctcd
that larger firms with experience would exploit their advantage of greater efficiency. A
small number of established retailers i. e. Dixons, Coinct, and the electricity companies
hold substantial slices of the market shares and once secured it becomes an impcdimcnt to
imitations. Furthermore concentration levels in the retail channel for white goods implies
that the number of firms that possess a bundle of valuable outlets is less than the number
of firms needed to generate perfect competition dynamics (Hirshleifer, 1980). Outlets
therefore become rare resources.
The sign expected is positive (+).
H 1: Competitive Advantage is positively associated with Outlets (OU).
3.6.5 Independent variables: Competitive behaviour variables
in this retail channel it was noted the market leaders arrived later i. e. k-generalists
entered later to exploit their advantages of greater efficiency. Dobson and Watcrson
(1996) observe that some retailers viewed by consumers as imperfcct substitutes and
incumbency advantages arise through location, experiences and reputation. Age is used as
an independent variable to capture advantages of reputation and experiences.
Several past studies use the measures of age (AG) and size as proxies for resource
availability (Carney and Gedajlovic, 1991; Lafontaine, 1992) and are used to bring in the
concept of life cycle. Resources tend to grow as a firm matures and to this extent the
isolating mechanisms such as the early mover advantages are also considered here.
94

Chapter Yhree Literature Review
Furthermore the inclusion of age as an independent variable is an ideal starting
point to consider the origins of competitive advantage. Stinchcombc (2000) suggests firin
pcrfon-nance heterogeneity may arise from the degree to which firms resources and/or
capabilities match the competitive environment. The condition attached to this suggestion
is that on introduction resources are randomly distributed and the strategy selection and
the investments to pursue the chosen strategies are made under uncertain environmental
conditions. This means only some strategies together with some resource bundles will be
relevant to a chosen market position. In other words the overall bundles of resources and
capabilities acquired and gathered by a firm from introduction may be more profitable if
it matches the needs of another competitive environment.
The sign expected be (+) to bring in the effects of growth in outlets over time.
H 2: Competitive Advantage is positively associated with Age (AG).
Retailers create markets locally and/or nationally and markets with the greatest
dispersion of incomes are assumed to have the greatest variation in opportunity cost of
time (Winter, 1993). The author also states that the role of retailers is to compete on price
and services which reduce the time it takes to purchase a good and the mix of instruments
offered is based on tastes of consumers on the product margins and also inter-retailer
margins.
Generation of rent is dependent on volume of sales, prices charged and the mix of
products made available to the consumer. Product choices and availability to customer
can vary depending on the competitive strategies a firm employs for example cost focus,
product differentiation, market focus (Porter, 1980). There was a choice of testing either
cost focus (price and volume), differentiation (specialisation) or both. It is the
differentiation strategy (mix) that is tested here.
95

Chapter Yhree Literature Review
The reason for selecting specialisation was based on the statistics produccd in the
MMC report (MMC Vol. 2 pp. 68). Statistics on the MMC sample of 14-rctailer sample
revealed spccialisation in excess of 61%. The data was gathered from 14 retailcrs, which
comprised mostly the top players of this retail sector. The retail channel is experiencing
several market leading models instead of the usual single model domination in each
product tier (Best selling models - MMC 1997, Vol. 2, pp. 68).
The examination of white goods from a product line consistency approach is
consistent with previous research (Miller et aL, 1999; Ingene and Brown, 1987). White
goods are classified as home-laundry, cookers, dishwashers, microwave ovens and
refrigeration products. There are numerous brands/models and a three tier of price-quality
continuum in this retail channel and direct competition is assumed to remain within each
tier (Hirshman, 1978). The large retailers compete on all three levels and the small
retailers on the middle to low price/quality tiers and listings are expected to reflect these
strategies. The industry analysis chapter revealed that the margins on the bottom tier is
low and the middle to upper tiers attractive. Small retailers listed mainly for the lower and
middle tiers whereas the large retailer listings included products for all three tiers.
The composition of the product portfolios may be made from one brand or several
brands. For example, if the listing included a portfolio that comprised of two different
models of washing machines, one model of tumble dryer and one model of cooker of the
Hotpoint brand then the total number of brands listed would equal to four in total.
Similarly the same portfolio could be made up of several brands for example Zanuzi,
H001, er and Indesit and the total listed would also be four. The key to success is the
delivery of customer values from product portfolios that maximisc returns and/or market
shares for the shareholder.
96
Chapter 77iree Literature Review
The measurement is based on number of brands listed (B) and the expected sign
be (+).
113: Competitive Advantage is positively associated with Number of Brands
listed (B).
3.6.6 Independent variable: Inter-organisational capability
Recent economic analysis of exclusivity arrangements has revealed that such
practices can increase eff iciency Marvel (1982); Steuer (1983); Ornstein (1989). It is also
stated that exclusivity reduces intra-brand competition when economies of scope are low
in retailing (Dobson and Waterson, 1996a). Exclusivity brings in the social element of
inter firm relationships (Oliver, 1997). These arc contractual arrangements between firms
facilitating access to products.
MMC data depict that about 16-20% of total sales of white goods in this retail
channel is based on exclusivity deals, and they include own brand labels also. RECs
Electra for example, has significant market shares in some domestic appliances. Some of
the leading players in this retail channel not only use their brand nwncs but also offcr
products licensed to them. Nevertheless, a fairly large proportion of sales under own
brand names is manufactured under retailer instructions. The power to facilitate such
arrangements may be dependent on retail branding and the capacity it generates.
Exclusive dealing may also be an entry barrier into retailing and arises when at-
least one manufacturer has low marginal costs of production. The entry deterrence model
of Comanor and French (1985) indicate that the foreclosing manufacturer purchases the
retailing barrier to entry and converts it into a manufacturing barrier to entry. By contrast
Mathewson and Winter (1987), point out that the retailing barrier allows the manufacturer
to exercise its low cost advantages to exclude other manufacturers. Exclusivity in the
97

Chapter Yhree Literature Review
form of own brand labels or licences ensures inimitability for the key resource i. e. outlets.
The large volumes of product availability for outlets facilitates continuous movements of
desired products from the supplier. These arrangements arc necessary for retailer
organisations intending to exploit the market by obtaining product portfolios that
maximise returns and/or increases market shares for its shareholders. Product portfolios
offered may vary from one local market to another. Failure to establish such relationships
can result in infcrior product portfolios that are less efficient and/or effective. Hcnce the
performance of outlet is directly linked to arrangements for product portfolio performance
and a positive sign is expected.
H 4: Competitive Advantage is positively associated with Exclusivity (EXý.
3.6.7 Independent variable: Organisational capabilities
In this retail channel, retailers appear to rely on free or extended warranties, next
day deliveries, after sales services and in-store services to entice customers. As stated
earlier, retailers compete on a three-tier price and quality continuum and the above offers
arc correlated to these tiers. In this survey, next day delivery competitive advantage will
be explored at the expense of others as funding details relating to wan-antics is not
accessible and after sale services are mainly provided by manufacturers.
it was stated earlier that small retailers in this retail channel replenished stock
from the suppliers as and when it was needed and were offering next day deliveries. The
larger retailers however, had warehousing facilities and controlled their own distribution
systems. Time advantages are to be captured using the variable order to delivery (OTD)
and is measured in days. This is the time taken, to accomplish exchange. It includes
several activities within the product channel (Stash, 1972) and is driven by teams of
resources (Grant, 1991). The functions of the product channel comprise of the following:
98

Chapter 77iree Literature Review
inventory management; material handling; communication and order processing; and
transportation. The workings of the four functions collectively indicate how well the flow
for cxchange is accomplished. Time measures promised for example, the days taken will
rcflcct strategic fit i. e. organisational uniqueness of getting the entire system of activities
, right'. Furthermore to successfully imitate a firm with activities driven by strategic fit, a
rival has to align their entire system of activities (Besanko et aL, 2000).
A negative sign is expected here, as consumers would prefer to receive their
cxpensive bulky appliances sooner than later.
H 5: Competitive Advantage is negatively associated with Order to delivery
(OTD).
3.6.8 Independent variables: Strategic adaptation capabilities
Value maximisation is one of the prime targets for management and sustaining
values requires that the condition of heterogeneity to be preserved. In order to achieve
this status firms must set ex ante limits to competition in order to counter competitive
forces which limit competition for those rents (Peteraf, 1993). To this extent scale based
competition facilitated by organisational/inter-organisationaI capabilities were considered
above. However Peteraf (1993) also argues that prior to a firm establishing a superior
resource position there must be limited competition for that position. This means that
there must be ex ante limits to competition and the cost of implementing strategies via
other resources should not erode away the anticipated returns.
The strategic adaptation capabilities are activities within the composition of
working capital that could set ex ante linifts to future competition for the firm. These
activities could relate to the product and/or non-product activities of the firm. Strategic
adaptation capabilities are tools available to manipulate existing resources conrigurations
99

Chaptcr 77irce Litcrature Rcviciv
or to build new resource configurations that satisfy the capacity requirements of the key
rcsource(s).
The localised competition model by Baum and Singh (1994) suggests lower
failure rates among firms are present when there is less of an overlap of resource bases.
The potential for adverse competition among firms is a function of the overlap of resource
bases such as customer demand, labour and financial needs.
The strategic adaptation capabilities within the elements of working capital tcstcd
here are stock-turns, average credit days, third party credit card usage and promotion.
The main purpose of these tests in this study is to test the ability of the retailers to set ex
ante limits to future competition from value-crcating strategies that are triggcrcd by
product/non-product activities of the firm. These strategies are also expected to satisfy the
conditions inimitability and insubtitutability for the key resource i. e. outlets.
Dobson and Waterson (1996) state that the pressure for manufacturers to gain
access to the retail level is becoming increasingly intense as manufacturers step up
product proliferations. Furthermore the MMC findings on the best selling models were
found to be inconclusive indicating that products could be close substitutes.
If a firm is to have competitive advantage, it has to implement a value creating
strategy not simultaneously implemented by current or potential competitors. In this case
these strategies could relate to activities that relate to products on offer. For example, a
retailer delivering customer values from efficient product portfolios that maximise returns
and/or increase market shares may have stock turn ratios far higher than those delivering
customer values from inefficient product Portfolios. High turnovers are an indication of
access to popular brands and good management whilst low turnover could indicate over
100

Chapter 71ree Literature Review
investment in stock. The standards for stock turn are individual to the f inn and may be set
in conncction with the scalc of opcrations.
On the other hand Besanko et aL (2000) state that products could be close
substitutes if they can meet three conditions of similar performance, similar occasion and
same geographic market. In this situation stock turns would relate to retail channel
averages and there will not be any competitive advantages as retailers in this retail
channel are able to access other brands. Substitutes however have the potential to reduce
potential rents. If this is the case this process gives the retailer the opportunity to look at
non-product activities that complements ex ante limits to future competition.
A positive sign is expected here.
H 6: Competitive Advantage is positively associated with Stock-turns (ST).
Dobson and Waterson (1996) state that for example in food retailing, the number
of products sold through supen-narkcts has doubled since the 1980s and the number of
new products launched has increased at an even faster rate as manufacturers step up the
extent of product proliferation. In such circumstances, manufacturers have little
alternative but to offer substantial discounts to large retailers. In the industry analysis
chapter it was found that suppliers preferred bulk buying and that the retailers were
offered bulk buying discounts and also extended credit.
The variable average days of credit (CD) offered and used in this survey is a
measure of creditworthiness. This form of short term funding is a product activity and the
size of the funding would relate to scale of operations. Credit tenns are negotiable and is
enhanced through social and professional relationships between firms. Extended credit
tenns based on bulk buying is of particular interest here, as the outlet (resource)
perfonnance is associated with exclusivity. Exclusivity on the other hand ensures stock
101

Chapter Yhree Literature Review
availability at preferential tcrrns, which in turn ensures continuous flows for the supplier.
The sign for this variable is expected to be positive.
11 7: Competitive Advantage is positively associated with Creditworthiness
(CD).
Ghemawat (1986) argues that inimitable positions derive from size advantages,
preferred access to resources and/or restrictions on competitor options. Retail branding is
an important feature for multiproduct retailers and has the potential to restrict competitor
options. Retail branding has the double benefit of differentiating services from both the
buying and selling sides and is a means of countervailing the selling power of brand
suppliers (Dobson & Waterson, 1996). Moreover the communication effects on a brands
positioning could be affected by the desirability of the brand relative to other competitive
offerings and also the brands price sensitivity (Boulding and Lee, 1994).
The work carried out by Chattedee and Wernerfelt (1991) on the links between
resources and the type of diversification considered three classes of resources: physical
resources, intangible resources and financial resources. Excess resources in physical,
knowledge, and external finance are associated with related diversification.
it was stated in the industry analysis chapter that some retailers had set up
subsidiaries to manage consumer credit and warranty insurance whilst a few took on the
risks by relying on their healthy balance sheets. Furthermore consumer credit, and/or
warranty insurance are related diversification strategies funded by extemal/intemal
finance. These are value creating strategies could be aimed at enhancing retail branding
and for countervailing the selling power of supplier brands.
Credit card usage was selected as a variable to capture the effects of consumer
credit. In other words if the volume of payments going through credit cards is known by
deduction the remaining balances indicate the extent of retailer funding of credit. White
102
Chapter 77iree Literature Review
goods are expensive and not all consumers readily pay cash as purchasing takes place
once in three or four years usually and is never planned. The third party credit card usage
facilitates instant purchases so does the provision of a firms consumer credit service.
Several retailers issue their own credit cards which allows settlement on a monthly basis
and thereby offering an interest bearing facility, whilst the facility to accept third party
credit cards/debit cards is also available.
It was noted in the industry analysis chapter that some retailers arrange consumer
credit through an outside finance house and are rewarded by commission payments. The
larger retailers take on the associated risks and administration through internal
facilities/subsidiaries set up for these purposes. In the industry analysis chapter it was also
revealed that the market shares of the retailers mentioned above accounted for more than
55% of the total market indicating that the financial power was in the hands of a
privileged few in this retail channel.
It is expected that payment by third party credit cards to be small and consumer
credit funding to be high in this retail channel and a negative sign is expected here.
H 8: Competitive Advantage is negatively associated with Third party credit
cards (CC).
Winter (1993) states the mix of instruments i. e. price and services offered to
customers were dependent on the collective maximisation of profits to the retailers.
Consumers are heterogeneous in their opportunity cost of time and will forego the
opportunity of some added values in preference to others.
Boulding and Lee (1994) suggest that for finns pricing above the industry average the
current advertising and sales force activities increase future differentiation and decrease
future price competition, whereas current promotional activities decrease future
103

Chapter 77iree Literature Review
differentiation and increase future price competition. Non-product activities may also be
aimed at reducing customer search costs.
Price Competition appears to be very fierce in this retail channel resulting in price
dcflation over the last few years. The ability to reduce prices is dependent on whether the
retailer can fund such price cuts themselves. There is also an arrangement whereby
suppliers provide margin support when prices are initially negotiated. This enables
retailer margins to be protected when price-cutting becomes necessary. If support was not
forthcoming negative returns may result with some retailers exiting the retail channel.
However the retailers may leave the brand positioning strategies to the suppliers and may
prefer to implement strategies that enhances their own reputation.
Sales on promotional credit (P) - (interest free credit/ buy now pay later schemes)
is an indicator for reputation gathered through not only healthy balance sheets, consumer
credit facilities and also the unique marketing skills of the firm. This process facilitates
the keeping and capturing of both the old and new customers. Suppliers are also known to
participate in this scheme in order to promote sales of their brands and they compensate
the retailer by offering extended credit. It was noted from the MMC report that purchases
through promotion schemes may trigger more purchases in the future. Promotion schemes
have the potential to increase revenues through interest payments from existing debtors
i. e. postponed payments. The facilitation of consumer credit service requires funding as
well as the application of unique marketing skills of the firm. To this extent buy now and
pay later schemes are expected to entice customers into the retail stores.
H 9: Competitive Advantage is positively associated with promotional credit
(P).
104

Chapter 77irce Literature Review
Summary
General Nfodcl (Proposal)
CA-f ( KRS + CB + IOR + OC + SAC) Key Competitive Inter Orgaubstional Straittle Rcmxsrccs Behaviour Orgambationall Capability Adaptive
I Capability Capability
CAP ABI LIT IES
Retail Channel Model (Variables)
Key -ot
compaitive ...... ... . !! I 1,113P MIS
] Prtuc' C Working - -[týE Resource
I Strateg , Charind Ca ital
Outlets 1. Age
I I j
1. Stock Turns Exclusivity Order to
Delivery 2. Creditworthiness
Nvhlte Goods 2. Brands 3. Payment Facility Listings 4. Promotions
Figure 2. RBV Flow Model
3.7 Conclusion
Capabilities whether tacit / transparent, key /ordinary are activities created by
resources employed by the firm in the search for rents and are summariscd in figure 2
above. In other words the performance of a firm is the measure of the performance of the
total resources (assets) of the firm and competitive advantage being the offshoot of
superior performances. However, the total assets that are made up of both strategic and
working tangible and intangible assets may be shared between multi-product lines.
Working capital is a requirement for developing strategic resources and continuity over
time and is supplemented by organisational and inter-organisational capabilities. Working
capital elements contain strategic adaptation capabilities, which could set cx-ante limits to
future competition and are a necessary source for competitive advantage. These
capabilities may relate to the product and/or non-product activities of the firm. Firm
performance is the result of competitive interactions, where the conduct of firms is
105

Chapter Yhree Literature Review
dctcnnincd by the structure of the industry, and the structure is measured by the
properties of the industry. Industry conditions have impacts on both behaviour and
performance of firms. In this study the firm's performance is considered in terms of its
structure and conduct in the retail channel.
The hypotheses for this study are based on Penrose's, (1959) observation that a
firm may achieve above normal rents not because it has better resources, but rather the
firms distinctive competence involves making better use of its resources. Dierickx and
Cool (1989) also argue that it is the finn's unique capability to deploy or transforni its
resources that result in sustainable competitive advantage. Hence, in the retail channel for
white goods the efficient and effective deployment of outlets is dependent on the firni's
ability to deliver customer values from product portfolios that maximise returns and/or
market shares for its shareholders. The type of value creating strategies that emerge relate
to the sources of market power prevalent in the retail channel for white goods in the UK.
106
Chapter Four Methodology
Chapter 4
Methodology
4.1 Introduction
This chapter explains methodological and empirical considerations and details the
process of testing competitive advantage in the retail channel for white goods. It describes
how the research was conducted and implemented together with some justifications of the
approach used in this study. The chapter also describes how data and measures of data
were selected establishing links with industry analysis, literature review, and also the
results and analysis chapters. The analytical approach used here is concerned with
producing explanations of empirical connections as a relationship of observable to
observable using a resource based theory that is already established.
4.2 Scope
Quantitative research is depicted as linked to the positivist tradition of the natural
sciences, with an objectivist view of the world and science and a view that reality is a
concrete structure which can be defined and understood as a sum of its parts. The present
study is an attempt to test the associations of competitive advantage with key resources
and capabilities using the RBV pertaining to the retail channel for white goods. Whilst
there are numerous theories relating to the determination of competitive advantages, the
RBV was preferred as it explains much more clearly, at this stage, the selection and the
conditions under which firm resources can be a source of sustainable competitive
advantage. Barney (1991) suggests for firm resources to be heterogeneous and immobile
107
Chapter Four Methodology
they must possess four attributes namely: they must be valuable, rare, impcrfcctly
imitable and without substitutes.
In MMC report (MMC 1997, Volume 11, pp. 109) it was revealed that the level of
retailer concentration in the UK and France was at its highest, whilst somewhat less in the
USA and lowest in Italy, and Japan. The prevalence of small retailers in parts of Europe is
believed to be a reason for their markets to be less competitive than in the UK.
International comparisons on prices indicated that the prices in the UK are generally
lower than elsewhere in the European Union. The study of competition in the irctail
channel for white goods in the UK is expected to provide vital clues as to why the currcnt
retail structure in the UK could be efficient and effective relative to those in other
countries.
White goods retailing includes a relatively small number of national, regional and
non-electrical multiples, regional electric companies, and a large numbcr of small
retailers. The high levels of retailer concentration in this retail channel may suggest that
some retailers may be benefiting from economics of scalc/scope. The total market for
domestic appliances was about E2.797 billion pounds of which the market for white
goods equalled E2.223 billion pounds (Key Note Ltd, 1997). Furthermore in comparison
to other retailing industries especially grocery retailing, the market values may
nevertheless be small, but its contribution to the gross national product in the UK is
thought to be important.
Retailers operate in local markets and the size of the markets largely depends on
the type of product offered and is a significant factor in retailing (Dobson and Waterson,
1996). This study focuses on a single trade line - White goods, and is consistent with
previous research (Ingene and Brown, 1987; Ingene and Lusch, 1981and Miller et
aL 1999). The reason for choosing white goods for this survey is based on the explanation
108

Chapter Four Methodology
of the vagueness of the existing definitions of retailer types i. e. inter-type and intra-type
competition. Miller et al (1999) state that researchers have yet to reach consensus on
various definitions of retail competition. They argue that the lack precise taxonomy on
retailcr typcs Icads to nonexclusive categorisation of competitivc intcraction among
stores. Their proposed typologies of retail competition i. e. inter-typc, intra-typc or inter-
category are thus based on product line consistency and are defined in the literature
review chapter. Moreover the product line consistency approach is suitable for white
goods (experience products) as it includes competition from limited line specialists, broad
line specialists and general merchandisers.
Competition in the retail channel for white goods follow a three tier pricc-quality
continuum (Hirschman, 1978). For this survey limited line sPccialists are small retailers
competing on low to middle price/quality product ranges, whilst broad line specialists arc
national/ regional multiples, and electricity companies competing on all three tiers.
General merchandisers included mail order companies and other multiples for example
Iceland competing on selected tiers.
The objective of this study is suited to a quantitative research approach as it plans
to employ a cross - sectional surveying technique designed to explain phenomena through
the discovery and testing of general causal principles as information for longitudinal
survey was not available. A surveying technique was preferred for economy of survey
design, a rapid turnaround in data collection, and the ability to identify attributes of a
population from a small group of individuals (Fowler, 1988; Babbie, 1990). This study
uses the information provided by the MMC as a platform to understand the workings of
the retail channel for white goods. The reason for this approach is driven by whether the
sampling design for this population is single stage or multistage (Creswell, 1994).
109

Chapter Four Methodology
The MMC had gathered their evidence initially from fact finding visits to large
suppliers, II multiple retailers, small retailers, warehouse clubs and other connected
parties. These visits were followed by postal questionnaires and later the provisional
findings were sent to larger suppliers and larger multiple retailers and a summary of the
provisional findings was sent to smaller suppliers and smaller retailers. Interview surveys
were also conducted on 625 small retailers of white and brown electrical goods and
followed up by further visits to survey appropriate respondents (MMC 1997, Volumci 1,
pp. 2). The interview survey was designed on questions based on a ycs/no response.
Clearly the above approach is well beyond the capabilities of a single rcscarchcr with
resource constraints and an opportunity presents itself to progress from a multistage
procedure to a single stage sampling procedure armed with reliable infon-nation. This
study, however, is in pursuit of associations of key resources and capabilities with
competitive advantages in the retail channel for white goods and is deemed to be an
cxtension of the work already carried out by the MMC.
Table 2.1 displayed a summarised version of the structure of the retail channel for
white goods. However, the sampling frame for this study took into consideration the
detailed structure of the retail channel as depicted in the MMC report (MMC 1997,
Volumell, pp. 31). All national multiples (2 firms) and all the regional electricity
companies (4 firms) were included in the sample as these 6 firms between them had a
market share in excess of 50%. Furthermore, other named retailers i. e. all departmental
stores (4 firms), mail order companies (5 firms), non electrical multiples (3 firms) were
also included in the sample. The overall market shares of all firms mentioned above
accounted for more than 70% of the total market shares. The remaining 30% market
shares comprised regional multiples and small retailers from which a random sample was
taken. A directory supplied by Combined Independent Holdings (CIH) was used for these
110

Chapter Four Methodology
purposes. For admission to membership with CIII, small retailers had to produce three
years of audited accounts and have a turnover of over E75,000 of electrical goods
retailing. This criterion was acceptable to this study, as the sampling frame was to include
a broad spectrum of firms within the retail channel for white goods where variations in
the profiles of resources and capabilities were expected to result in competitive
advantages for the finn.
In order to find the sources of competitive advantages in the retail channel for
white goods the work carried out by the MMC was explored in the first instance. The
only exploratory work undertaken in the retail channel for white goods was in 1995 when
the MMC investigated the supply of domestic electrical goods in the UK. 711is
infonnation was found to be invaluable as the nature of the investigations were found to
be extensive and facilitated a single stage design that would thrust out some key resources
and capabilities relevant to this study.
Moreover telephone interviews were also conducted on white goods retailers
randomly to find out what they thought the competitive advantages were in this retail
channel. The information obtained from the telephone interviews indicated that the retail
channel had not undergone major changes and sources of competitive advantages were
similar to those extracted from the ratings of the factors worsening competition for small
retailers (MMC 1997, Q9 pp. 31 1). The ratings in the order of importance were as follows:
a) effects of large outlets/retail parks,
b) intensified competition for e. g. availability of leading models, frcc/extendcd
warranties, next day deliveries, credit facilities, sales promotions, after sales
services, reputation, exclusivity and experiences were predominant.
c) price competition from other retailers especially in the low price - quality tier,
III

Chapter Four Methodology
d) aggressive competition by regional electricity companies for e. g. buy now pay
later schemes.
Several sales executives of a leading manufacturer were also consulted to verify
whether the above situation had changed since 1995. The executives infonncd that there
were no significant changes in this retail channel since 1995 and therefore the use of the
abovc factors was relcvant for this survcy.
This study examines competitive advantages from a RBV perspective.
Competitive advantage was measured by the market status of finns in the retail channcl
for white goods. The preferred option was to use profitability but the gathcring of
sensitive data was found to be impractical, especially as the white goods industry had
undergone recent investigations from the regulators. However the use of market share as a
proxy for competitive advantage was found to be useful as it provided the necessary links
between competitive advantage, resources and capabilities.
Although many previous studies may have used profitability for measuring
competitive advantages (Buzzell and Gale, 1987; Porter, 1985; Buzzcll, Gale and Sultan,
1975; Besanko et al., 2000) recent studies have nevertheless demonstrated the use of
other measures of competitive advantages. The component selected for a pharmaceutical
firm to measure sustained competitive advantages in the pharmaceutical industry was
through therapeutic differentiation (Yeoh and Roth, 1999). This measure was based on
the total number of NCEs to total number of NCEs introduced. NCE was defined as a
new molecular compound not previously tested in humans. Cock-bum et aL (2000) in
testing the origins of competitive advantages used the rates of adoption of science driven
discoveries. Furthermore Dobson and Waterson (1996) argue that the increasing number
of UK markets for retailing may be better approximated by oligopoly, with the
development of large retail chains possessing substantial market share and earning
112

Chapter Four Methodology
substantial profits. Therefore it is assumed that the main value creating strategy for this
retail channel is the delivery of customer values from product portfolios that maximise
returns and/or increase market shares for the shareholder. A firm is said to have
competitivc advantagc whcn it is implcmcnting a valuc crcating stratcgy not
simultaneously implemented by current or potential competitors (Bamcy, 1991).
In retailing market factors determine retail structures (11irschman 1978; Ingene
1983; Ingcnc & Brown 1987). The market structure entails the demographic
characteristics of the customers and enviromnental factors in a trade area (Bucklin, 1972).
The retail structure is defined as the manner in which firms engage in the trade of a
commodity and its construction includes retail stores by size, mix, and the distribution of
retailers within a geographic area (Bucklin, 1972). Retail structures associate consumers.
Consumers adapt their shopping habits to signal both time needs and mobility (Albaum
and Hawkins 1983; East et aL, 1994). Retail structures are thus responsible for quality,
price and selection of products available to consumers (Miller et aL, 1999). Hcnce the
efficiency and the effectiveness of these structures is a manifestation on the retailer
utilisation of key resources and capabilities that lead to competitive advantages in this
retail channel.
4.3 Data collection
The survey instnunent chosen was a self-designed questionnaire. The fonnat of
some of the questions planned for this survey was similar to those already presented by
the MMC in their survey. The questionnaire contained 10 items of operational data
relating to key resources and capabilities and the reasons for choosing this data is
explained in section 4.4. The measures for data selected contained a mix of actual to
113
Chapter Four Methodology
ordinal scales. Only one measure was based on a dummy variable and the details are
displayed in Table 4.2.
A preliminary version of this survey instrument was pre-testcd for content, and
face validity on 6 executives of a leading manufacturing organisation. These executives
havc, had daily dealings in the supply of domestic appliances to the retail channel. This
was found to be significant as the relationship between supplier and buyer was imperative
for good perfon-nances in the channel. A few changes were made to the original version in
order to keep the questionnaire simple and user friendly (Appendix F). A cover letter
assuring confidentiality was attached to the questionnaire, which highlighted the
requirement for the understanding of retail competition in the retail channel for white
goods. The cover letter also included an arrangement for a prize draw containing a
magnum of champagne to facilitate response.
The data was collected from single respondents namely a purchasing manager for
large firms or the managing director of a smaller firm. The names of purchasing managers
of large firms were obtained by telephone and were addressed accordingly. A response
rate of 20-25% was anticipated for this retail channel and this gave 285 respondents 4
weeks to complete and return their questionnaires. The survey was carried out by
despatching questionnaires by mail with a fixed closing date - 21" of July 2000.
The number of retailers who responded amounted to 67 for a response rate of
approximately 24%. Four questionnaires were returned of which 2 contained insuff icicnt
data and two were refusals. One famous departmental store refused to participate whilst
the two market leaders declined to send in their questionnaires. However it was decided
that the two national multiples and one other regional electricity company were to be
included in the sample as they would complete representations of all retail outfits. For
these questionnaires sales executives of a leading manufacturing organisation of white
114

Chapter Four Methodology
goods provided surrogate values. These sales executives had frequent dealings with the
rclative organisations.
Furthermore 35 out of the 70 questionnaires were incomplete with missing data
that was mainly related to the promotion variable. The telephone intcrvicws helped
resolve this problem for 22 questionnaires. For the remaining 13 questionnaires the SPSS
programme was instructed to insert mean values for the missing data on promotions.
Table 4.1 shows the distribution of responding finns and their respective turnover per
annum. The turnover totals of responding firms represent more than 40% of the total
market for white goods. At the point of survey the total market for white goods was
valued at E2083 billion (GfK, July 2000) and the descriptive statistics arc displayed in
Table 5.1.
In this sample 59 out of the 70 fin-ns registered less than 5 outlets and were
considered as small retailers. The MMC had defined small retailers as those with 4 outlets
or less (MMC 1997, Vol. 1 1. pp. 35). Moreover an opportunity presents itself to conduct
two surveys i. e. the main survey included all retailers in the sample and the one for small
retailers included retailers holding less than 5 outlets. This approach was thought to be
important as competitive advantages may be appropriate to local markets and furthermore
the understanding of the survival patterns of small retailers was also important for this
study. The mean values of variables used in this survey are displayed in Table 5.14.
in this study the arrival of a logical deduction is to hypothesise that firm
heterogeneity measured by firm performance in the market place, was the result of
varying firm resources and capabilities. Information on the options available for
competition in the industry analysis chapter indicates the use of operational measures as
appropriate for testing competitive advantages in this retail channel, bearing in mind the
importance of firm efficiencies and effectiveness as contributors to firni heterogeneity.
115

Chapter Four Afahodology
The advantage of using operational measures was convenient, as those conncctcd with the
rctail channel were aware of these measures. Furthermore, some very important
financial/pcrfonnancc data rclating to the rctail cbanncl for wilitc goods was not rcadi y
available through secondary sources.
Table 4.1 Turnover of Responding Firms In the Sample Turnover No. of Firms
(resp nded) >E250 million I
>EI50 million I
>EIOO million 3
>E50 million 3
>E10 million 2
>E5 million 4
>EI million 19
>EO. 5 million 24
>EO. I million 9
<EO. 1 million 4
Source: Compiled by author
4.4 Data and Measures
4.4.1 Measuring competitive advantage
In this study the means of testing competitive advantage is bascd on Barney
(1991) definition. A firm engaging in activities that increase its cfficiency or cffcctiveness
in ways that competing firms are not, regardless of whether other firms are in a particular
firms industry. It was stated earlier that operational data was used for measurement
purposes and the concepts used are explained in the following paragraphs.
Efficiency refers to the ratio of outputs to inputs. The type of efficiency
considered here is economic efficiency, where the aim is to minimise the input costs for a
given level of output (Wilson & Chua, 1994).
116

Chaptcr Four Afcthodology
Effectiveness refers to the extent of goal achievement i. e. the state or outcome that
matcrialises after the implementations of organisational plans (goals) (Wilson & Chua,
1994).
Organisational. goals emphasiscs the purpose of an organisation is to satisfy the
need of shareholders in the long run. Organisation control ensures its activities attain the
purpose (Wilson & Chua, 1994).
In the retail channel for white goods the key activity is the dclivery of customer
values, from a formulation of product portfolios that maximise returns and/or increase
market shares (organisational goals) for the shareholders. The measurement of the
perfonnance (efficiency) of product portfolios, individual to the organisation will
determine whether a given level of input (resources and capabilities) achieves a desircd
level of output for example sales revenues. Portfolios of products for outIcts thus become
value-creating strategies for the firm and are individual to the fin-n. The firms competitive
advantage is hence created by the implementation of value creating strategies that are
based on market imperfections and not simultaneously implemented by current or
potcntial competitors.
Besanko et aL (2000) on the other hand define competitive advantage as when a
firm or business unit within a multi - business firm earris a higher rate of economic profit
than the average rate of economic profit of other firms competing within the same market.
They base their definition of competitive advantage on a economically sensible definition
of the firm's market. They state that exccpt for perfectly competitive markets a group of
firms are said to be in the same market if one firms production, pricing, and marketing
decisions materially affect the prices the other finns in that group can charge. Similar
assumptions are made in this study for firms competing in the retail channel for white
goods but the key resources are the unit of analysis instead of the firm. It is the ability of
117

Chapter Four Methodology
the key resource to manipulate other resources and capabilities that rcsult in the dclivcry
of customer values from product portfolios that maximisc rents and / or increase market
shares for the shareholders is the objective of this study.
Besanko et al. (2000) further develop, a framework to explain why some firms
achieve competitive advantage and others do not. Figure 3 below explains that a firni's
profitability within a particular market depends jointly on the economics of its market for
example five - force analysis and its success in creating more value rclativc to its
competition. Therefore the amount of value the firm creates in comparison to competitors
must also depend on its cost and benefit position relative to its competitors. Value
maximisation is individual to the firm and is dependent on the effective intcraction. of its
profiles of resources and capabilities. Whilst it was stated above that the delivery of
customer values in the retail channel for white goods concerns product portfolios that
maximise returns and /or increases market shares for the shareholder. Furthennore it was
also stated earlier that if the domestic appliance market for white goods were impcrfcct
then there could be market power for the retailers in this channel. The sources of market
power were barriers to entry, economies of scaletscope, national/ local market power and
retailer differentiation of services. The above sources thus explain the context in which
both firm resources and capabilities can contribute to competitive advantage.
118
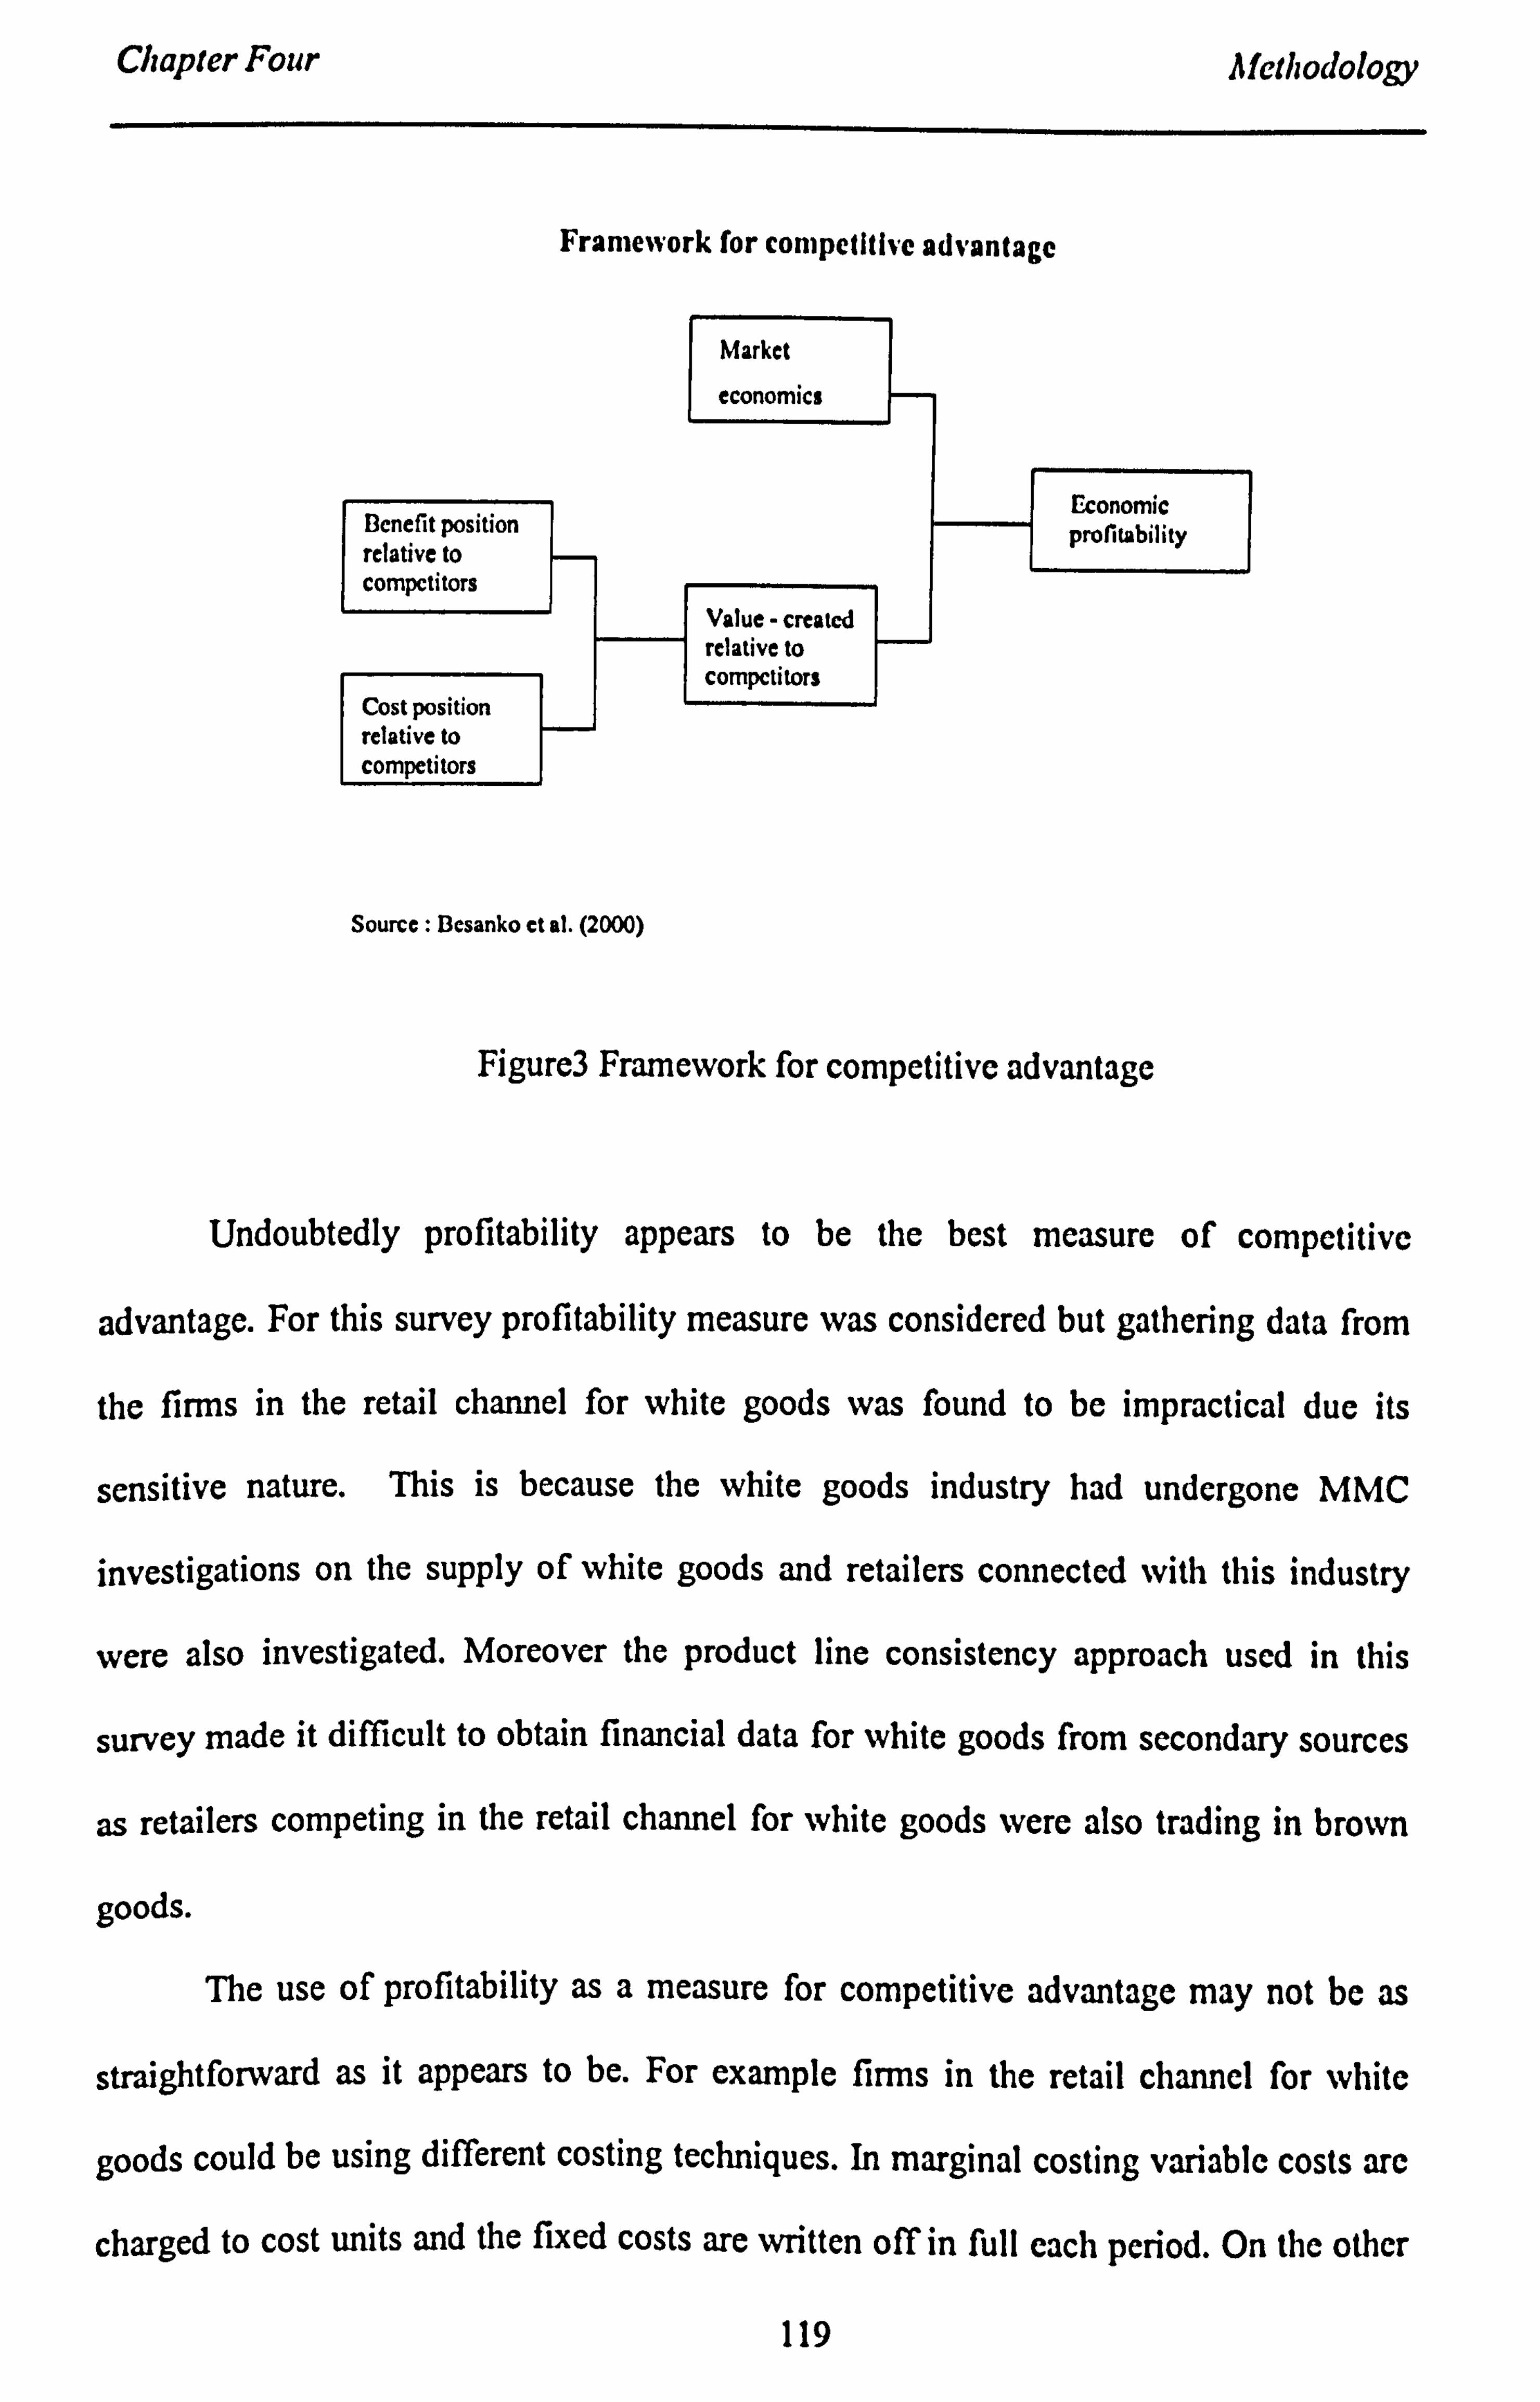
Chapter Four Methodology
Framework for competitive advantage
Market
economics
Bcnef it position relative to CompctitoTs
Value - created relative to compctitors
Cost position rclative to
Source: Bcsanko ct al. (2000)
Economic proritability
Figure3 Framework for competitive advantage
Undoubtedly profitability appears to be the best measure of competitive
advantage. For this survey profitability measure was considered but gathering data from
the firms in the retail channel for white goods was found to be impractical due its
sensitive nature. This is because the white goods industry had undergone MMC
investigations on the supply of white goods and retailers connected with this industry
were also investigated. Moreover the product line consistency approach used in this
survey made it difficult to obtain financial data for white goods from secondary sources
as retailers competing in the retail channel for white goods were also trading in brown
goods.
The use of profitability as a measure for competitive advantage may not be as
straightforward as it appears to be. For example firms in the retail channel for white
goods could be using different costing techniques. In marginal costing variable costs are
charged to cost units and the fixed costs are written off in full each period. On the other
119

Chapter Four Methodology
hand absorption costing incorporates both fixed and variable costs into production and
consequently into stock valuation. Stocks under marginal costs arc valucd at cost only.
The different methods of stock valuation from the two approaches produce diffcrcnt prorit
figures when stocks exist at the beginning or the end of a period. The retailers in the UK
may use similar stock valuation techniques. Furthermore the retailer profile of resources
and capabilities could be shared between white and brown goods and the sharing extends
the difficulties of apportioning fixed costs between white and brown goods. Additionally
the measure of competitive advantage looks at economic profit whilst retailer profit and
loss accounts depict accounting profits and the determination of opportunity costs in the
retail channel for white goods could be an arduous task. Moreover the accounting profits
are after charging depreciation for the assets in use and may be subject to a straight-line
method or an accelerated method of depreciation. The above profitability problems
further extends to corporation tax issues where capital allowances differ for different
classes of assets and the amounts that can be offset against a form of tax liability is also
subject to variation. Therefore the question of which profitability measure to use in the
analysis generate more questions than answers.
The use of market share as a proxy for competitive advantage in this study may
also have serious limitations when used in the wrong context. Increases in market shares
do not automatically increase profits, as the economic mechanism underlying the
correlation is more likely to be inconspicuous. A competitor may attempt to buy market
share by cutting its price or raising advertising levels and may find it that it is unable to
achieve the same level of profits as the market leader. The under performance may be due
to the quality of products offered to consumers or because it is unable to catch up to the
initial advantage of the leader. The key point being a strategy designed to exploit the
positive relationship between market share and profitability has no hope of succeeding
120

Chapter Four Methodology
unless the linkages between market share and profitability is impcrfcctly understood by
the participants of an industry (Bcsanko et al., 2000). Moreover market shares in an
industry must by definition add up to 100 percent and it is impossible for firms in an
industry to increase market shares simultaneously. Furthermore the total market for white
goods was measurable and at the point of survey the value was registered at E2083 billion
(Gfk, July 2000). This valuation facilitates future comparison of the current system in
play.
The scrutiny began with what matters, more for profitability: The market or the
firm? Besanko et al. (2000) contend that if there are great variations of profit across
industries and a little variation in profit among f inns within the industry the market effect
becomes more important than the position effect and vice versa. Nevertheless the market
and positioning can explain profitability. On the other hand research by McGahan and
porter, (1997) suggests that the industry accounts for 18 percent of the variation in profit
across firms while competitive position accounts for about 32 percent of the variation in
profits. This study is about the variation of profits within a retail channel and not the
industry and it is assumed that the resources and capabilities competing within the retail
channel are owned or controlled by firm's produce the same effects.
Hence the next best alternative for measuring economic profit was to measure the
competitive position effects that trigger economic profitability. For these purposes in this
survey a sample that contained all retailers and another which contained the small
retailers were analysed to extricate value creating strategies that related to competitive
strategies of cost focus, differentiation of product and market focus. The independent
variable relating to product differentiation was tested for competitive advantages in the
retail channel bearing in mind if this variable was insignificant then it would be by
deduction the cost focus strategy that was creating values for customers in the national
121
Chapter Four Methodology
market. The small retailer survey facilitated the testing of competitive advantage in local
markets. In other words the competition in the national and local markets was cxpcctcd to
demonstrate creation of values from superior/inferior retailer resources and capability
profiles. Moreover the interaction and the simultaneous diffusion of multiple cffccts of
the key resource (outlets) with competitive behaviour, inter organisational/organisational,
strategic adaptive variables is expected to explain how competitive advantage can be
sustained.
Many economists argue that the vast majority of business firms large or small
operate under the market structure of oligopoly (Sio, 1991). Oligopolies display the
following characteristics:
1. A small number of firms.
2. Products may be homogenous or differentiated.
I interdependence
Furthermore economists have used a market share model to explain pricing behaviour of
firms in an oligopoly. The market share model explains that prices tend to be similar for
products sold by oligopolists even when competing firms costs are different no matter
what their market shares or cost structures might be (Sio, 199 1). The variables tested were
prices, costs and revenues against outputs. Moreover Porter (1976) also implies that retail
markets are likely to be highly concentrated oligopolies. In the retail channel for white
goods oligopolists may prevail in national markets and also in local markets too. Market
structure is a major determinant of retail structure as it consists of environmental
variables and socio-economic variables that either create or impede retailer demand
(Miller et aL, 1999). Market share of a firm is thus a reflection of the efficiencies and
cffectiveness of a firin's value creating strategies.
122

Chapter Four Methodology
The research on the exploitation of economies of scale/scope by some firms has
suggested positive correlation between firm's market share and profitability. Relative
market share has been used in strategy as a perfonnance mcasure and has bccn
cmphasised as the main variable relating a firm to its competitors. Market share position
is widely believed to be a determinant of profitability and is positively corrclatcd with
profitability (Buzzell et A, 1975). It has also been used as a proxy for some firm spcciric
competitive advantage(s), resulting from learning effects and other specific asscts
(Hansen and Wcmcrfelt, 1989; Kamani, 1984).
Many studies vcrify the link between economies of scale and market structure
suggesting that some underlying factor such economics of scale determines market
structure (Besanko., 2000). The research on the measure of the magnitude of scale
economics depict that the industries in which the minimum efficient scale of production is
large relative to the size of the market tend to be more concentrated than industries with
minimal scale economics (Besanko., 2000). For the retail trade as a whole government
statistics show that concentration in most sectors increased substantially throughout the
1980s. Concentration of firms in the retail sectors are, thought to be characteriscd by
strong economies of scale and the movements of gross margins may follow the direction
of concentration levels (Dobson and Waterson, 1996). Concentration levels in this retail
channel for white goods demonstrate that the national multiples and the electricity
companies between them hold more than 50% of the market shares. Table 2.1 also depicts
substantial use of outlets by a handful of retailers in this retail channel and this could
facilitate economies of scale/scope, barriers to entry, market power and retailer
differentiation of services.
Therefore the context in which market shares were used as a proxy for
competitive advantage arc linked to market economics and the value creating ability of a
123
Chapter Four Afcthodoloýy
firm's profile of resources and capabilities. The relative market share explains the extent
of goal achievement (effectiveness) in retail competition for white goods and is measurcd
as a ratio of the firm's sales revenues against the total sales revenues in the total market.
Sales values are the output of product portfolios and is measured in this survey on an
ordinal scale (1-11) in the first instance and then converted into market share. At the point
of survey the total market for white goods was E2083 billion (GfK, July 2000).
However if the context was not defined the market share used as a proxy for
competitive advantage could be subject to other interpretations. A firm could have high or
low market shares. The gap between the leader and the follower will vary from industry
to industry and the distribution of shares among firms will relate to stability requirements
of that industry. However Porter (1985) suggests that industry stability is critically
dependent on industry structure and whether competitors are good or bad. The most
important structural variable determining the ideal pattern of shares are the degree of
differentiation or switching costs and a number of structural characteristics could
influence a leaders optimal share. He further suggests that high optimal market share for
leaders could imply that there arc significant economies of scale facilitated by a steeper
leaming curve. There may be few industry segments and a preference to a single source
of supply. Moreover multi brand distribution channels is non - existent and competitors
share value activities with related business units. There are high entry barriers and the
small competitor share positions are an effective base from which to attack a leader.
On the other hand if the leader had lower optimal share this could indicate that
there are unattractive segments, a few economies of scale and a modest learning curve.
The channels have bargaining power and desire multiple suppliers. The followers are
necessary credible entry deterrents and the industry has a history of antitrust problems or
is vulnerable to them.
124
Chapter Four
4.4.2 Independent variable: Key resources:
Methodology
There are nine independent variables and are defined in Table 4.2 below.
125

Chapter Four
Table 4.2 Variable Definition
Afcthodology
Variable Dcrinition Dependent variable Market share (MS) % Market share
(sales/total market value* 100) Independent variables Outlets (OU) Ordinal
Scale of 1-5 1= <2 outlets 2= >2 outlets 3= <5 outlets 4= >I 0 outlets 5= >50 outlets
Age (AG) Actual years
Number of brands listed(B) Actual number
Exclusivity (EX) Dummy variable 0= no 1= yes
Order to delivery (OTD) Actual days
Promotions (PR) Proportion of annual sales on promotions 3rd party credit card usage (CC) Proportion of annual sales on 3rd party credit cards Supplier Credit (CC) Actual days
Stocktum, (ST) Actual number Sales Ordinal
Scale of 1-11 1= >L250 million 2= >L150 million 3= >; C100 million 4= >00 million 5= >L25 million 6= >L10 million 7= >0million 8= >; E1 million 9= >000,000 10 = >L 100,000 I 1= < El 00.000
Source: Compiled bv author
126

Chapter Four Methodology
4.5 Model construction
In the MMC investigations of 1995 the retail channel for white goods was claimed
to be efflicient and effective compared to other retail industries in Europe. In order to
capture the cfficiency and effectiveness of this retail channel's retail structure, it is
proposed that the key resources and capabilities were associated with competitive
advantage.
The research questions for this study were therefore:
a) is competitive advantage in the retail channel for white goods associated to key
resources and capabilities?
b) Does the ability of the key resource(s) to manipulate other resources and capabilities
result in product portfolios that maximise returns and/or increase market shares for its
shareholders?
In the retail channel for white goods the main value creating strategy for the
retailer is the delivery of customer values that maximise returns and/or increase market
shares for its shareholders. In order to create a value creating strategy a firrn has to
possess resources and capabilities (causes) that its competitors lack. Not all resources arc
sources of competitive advantages. Resources (outlets) are factor stocks that are
employed through a firms capabilities (Competitive behaviour, organisational, inter.
organisational, strategic adaptive) which are firm specific and it is a basis by which
productivity of resources can be enhanced. Capabilities are the means by which the
resources are deployed to cffect a desired end (Amit and Schoemaker, 1993). Therefore,
resources represents what can be done by the firm and capabilities represent what must be
done to compete efficiently and effectively in satisfying customer needs in a competitive
environment (Priem and Butler, 2001). The desired end being competitive advantages
127

Chapter Four Methodology
(cffect) is thus produced from implementing value creating strategies not simultancously
implemented by current or potential competitors (Barney, 199 1).
Therefore the model for the retail channel for white goods was formulated as,
CA =f (R, Q or CA= f (Resources, Capabilities)
The dependent variable CA is the measure of the extent of value maximisation in
delivering customer values from product portfolios that maximisc returns and/or increases
market shares for its shareholders at a point in time. The explanatory variables are chosen
to illustrate the various competing hypotheses where R is the measure of key resources at
a point in time and C being the key capabilities at that point in time.
The data captured included different perspectives on the sources of competitive
advantages pertaining in the retail channel of white goods. The choices about the
requirements of a suitable functional fonn or about which explanatory variables to use
were similar to those suggested by (Cockburn et aL, 2000). In their analysis of the origins
of competitive advantages they suggest that an empirical model that considered the
dynamics of diffusion was required. The reasoning behind this suggestion is that the
effects needed to work simultaneously in order to assess the relative salience of 'initial
conditions' and environmental heterogeneity in driving patterns of adoption of a
performance enhancing practice. Likewise the choosing of a model based on multiple
regression analysis in this study recognises competitive advantages at a point in time.
There are several ways of analysing the data using multiple regression analysis.
The simplest model will involve regression of competitive advantage on independent
variables individually i. e. key resources, competitive behaviour, inter-organisational
resources, organisational capabilities and strategic adaptive capabilities making up a total
of 5 equations. Then there are also the permutations and combinations of 2,3,4,5
independent variables. To include all the independent variables together however brings
128

Chapter Four Methodology
in all the effects to work simultaneously. The latter method was prefcffcd as linkages
between resources and capabilities with competitive advantages wcrc necessary for this
study, bearing in mind the diffusion of the conditions required for a resource to be a
source of competitive advantage namely value, rarity, in-imitability and in-substitutability
(Barney, 1991). Undoubtedly there may be other efficient methods for analysing data but
the use of this method in this survey may be interpreted as a type of empirical approach.
The key resources and capabilities can be expanded further to include the types of
resources and capabilities used in this study as in Fig 1.
CA =f (KRS + CB+ IOR + OC+SAC)
I Vh ere,
CA = competitive advantage
KRS = key resource(s)
CB = key competitive behaviours
IOR = key inter-organisational capabilities
OC= key organisational. capabilities
SAC= key strategic adaptive capabilities
129

Chapter Four Methodology
Resources Capabilities No Competitive
Competitive Behaviour Advantage
outlets K -PI Organ i sational/Inter Organisational 10 Product Portfolios
Strategic Adaptive
Figure 4. A Resource Based Model
Dobson & Waterson (1996), state retailer power is on the increase and firni
heterogeneity is created from barriers to entry, economies of size and scope, national/
local market power and retailer differentiation. Additionally, they also state that the
influences of small independent establishments have substantially diminished in recent
times as the exploitation of economies have led to a few firms controlling a considerable
slice of the market. A recent study by Miller et aL (1999), however, implies that there arc
mutually beneficial relationships among different types of retailers rather than an
overwhelming competitive advantage for larger stores.
Bearing in mind the differing views, this study modifies and uses the model of
retail structure designed by Miller et aL (1999), to understand the roles of both the large
and small retailers in this retail channel. Their model consisted of 3 components namely
personal service levels (quality and quantity), scale (size of stores) and saturation levels
(number of stores per 1000 households). In this study scale and saturation levels were
combined to include competitive advantages of scale/scope i. e. economies of scale/scope
created by the total number of outlets (resources) in use. This takes into consideration the
130

Chapter Four Methodology
conditions necessary for a resource to be a source of competitive advantage: namcly,
valuc; rarity; inimitability; and in-substitutability.
Customer preferences for stores apart from prices are likely to include, location
cffects, layout, ambience, product range, sales personnel and pre and post sales services
(Dobson and Waterson, 1996). Moreover Winter (1993) suggests that the role of rctailer
services is to reduce consumers opportunity costs, especially time costs of obtaining the
product. Superior capabilities were split to include competitor behaviour,
organisational/inter-organisationaI and strategic adaptive capabilities pcrtaining to this
retail channel. The competitive advantages from retailer differentiation of services
(capabilities) replaces personal services and, together with resources outlined above,
captures the total competitive advantages in this retail channel.
CA =f (Retailer resources, Retailer capabilities)
Furthermore if the extent of the economics of scale were known, then by
deduction the remaining advantages must relate to retailer differentiation in services.
Therefore the mix of competitive advantages of economies of scale and retailer
differentiation of services may serve as a measure of the efficiency and effectiveness of
competition in the retail channel for white goods. Hence if competitive advantages were a
function of resources and capabilities in the retail channel for white goods this could be
modified to include total competitive advantages in the form of retailer differentiation of
scale/scope and services respectively.
CA =f (Retailer differentiation of scale/scope, Retailer differentiation of
services)
The theoretical model suggests that the following equation can be used for the
determination of market share (MS) which is the proxy for competitive advantage.
MS =+ OU+EX +B+ AG+EX- OTD + (ST + CD+P- CC)
131

Chapter Four
And the equation that is actually estimated at a point in time (t) is:
Afcthodology
MS, =ßo. ßOU+ß2 EX +ß3B +ß4 AG -ßiOTD + ß6ST+ßCD+ßsP-ß9CC+e
Where,
Do is a constant and is also a parameter.
p, to Pq are the other respective parameters.
e is a stochastic error tenn.
Dependent Variable
(MSO = Market share (proxy for competitive advantage)
Independent Variables
Retailer resources (Retailer differentiation of scale/scope)
(OU) outlets = Key resource
Retailer capabilities (Retailer differentiation in services)
(EX) exclusivity = Inter-organisational capability
(B) No. Of brands listed, (AG) Age = Competitor behaviour capabilities
(OTD) order to delivery = Organisational capability
(ST) stock-turns, (CD) credit days, (P) promotions, (CC) credit cards are Strategic
adaptive capabilities
The analysis for the main survey and the small retailer survey will be conducted
separately and the ordinary least square (OLS) method was used for these purposes. In
order to facilitate multiple regression analysis both SPSS and LIMDEP software packages
were considered. The SPSS software package is a popular package and will be used for
the initial output analysis for both the main survey as well as the small retailer survey. An
example in the SPSS 7.5 'Application Guide' was used as a guideline. Initially all the
variables were entered for output analysis. The purpose of following this procedure was
132

Chapter Four Afcthodology
based on the statement that, the moderate violations of parametric assumptions have little
or no effect on substantive conclusions in most instances (Cohen, 1969).
However in the second stage of output analysis the descriptive statistics table was
refereed to and variables that exceed + or- 3 range on both Skewness and Kurlosis
readings were to be transformed using power transformations. The purpose of
transforming the variables was to address the potential problems relating to norniality,
linearity and heteroskcdasticity. Moreover it is stated that the hcteroskedasti city variables
can be remedied through data transformations and that this process will also correct for
non-linearity and non-nomality also (Hair et aL, 1998).
The problem of heteroskedasticity is likely to be more common in cross-scctional
data as information is collected at one point in time. In the cross-scctional data gathered
for this study the members of the population of different sizes such as small medium and
large firms. The variables thus have dissimilar orders of magnitude and the problem
facing the researcher is how to detect hetcroskedasticity in a specific situation.
Unfortunately there are no hard and fast rules to detect hetcroskedasticity only a few rules
of thumb (Gujarati, 1995). This is because in economic studies there is only one sample
and it is almost impossible to know the standard deviation of the whole population. To
this extent detecting heteroskedasticity in econometric investigations may be a matter of
intuition, educated guesswork, prior empirical experience or sheer speculation (Gujarati,
1995). There are several formal methods suggested to examine hetcroskedasticity,
however these methods are based on the examination of the (OLS) residuals and a fairly
large sample is needed to detect heteroskcdasticity. However the LIAIDEP programme
has an inbuilt facility that corrects the issues of heteroskedasti city and the results are
produced after correcting for hetcroskedasticity. With this in mind it was decided that the
133

Chapter Four Methodology
use of LIMDEP programme would be most appropriate for the validation of the results for
the main survey as well as the small retailer survey.
4.6 Conclusion
A positivist approach employed in this study resulted in the invitation of 285
retailers to participate in a national survey of retailers of white goods. The purpose of this
survey was to test whether there were any associations between competitive advantagc,
rcsourccs and capabilitics pcrtaining to this rctail channcl. The mcans of tcsting
competitive advantage was based on a finn engaging in activities that increases its
cfficiency and efficctiveness in ways that competing finns are not, regardless of whether
those firms are in a particular firms industry (Barney, 1991). Firm. performances were
measured by the market status of the firm, a proxy for competitive advantage that was to
provide the necessary links between competitive advantage, resources and capabilities.
The information gathered in the NMC survey of retailers in 1995 was invaluable, as this
study is an extension to the work already carried out on competitive advantages in the
retail channel for white goods.
The response rate was approximately 25% and the market shares of the
responding firms exceeded 40% of the total market for white goods. The sampling framc
included 5 strategic groups of retailers and was well represented. In this sample 59 of the
70 firms registered 5 or less outlets and were considered as small retailers. Moreover an
opportunity presents itself to conduct two surveys i. e. one for the whole population and
one for the small retailers. This approach Was thought to be important as competitive
advantages may be appropriate to local markets and furthermore the understanding of the
survival patterns of small retailers was also important for this study.
The intra-type and intertype competition was tested through product line
consistency approach. A preliminary version of the questionnaire was pre-tested on 6 134

Chapter Four Methodology
executives of a leading manufacturing organisation. This was found to be significant as
the relationship between supplier and buyer was imperative for good performances in the
channel. The final questionnaire, after minor adjustments, was mailed to either purchasing
directors or managing directors who were considered best able to respond to questions on
resources and capabilities of their respective retail organisations and confidentiality was
assured.
The questionnaire was designed to include one dcpcndcnt variable and 9
independent variables. Some of the independent variables were included as non. metric
measures but were transfonned for analytical purposes. One independent variable was
coded as a dummy variable. Other variables were classified as metric and are summariscd
in Table 4.2. With several independent variables the main objcctive was to maximise the
explanation of the single dependent variable. All the independent variables were not on
the same scale and it was important that the relative contribution and direction of each
variable was understood in terms of the overall explanation in order to interpret the result
of the survey. Most importantly a simple statistical technique was required for the
purposes of repeatability and reproducibility. All in all it was decided that the most
suitable statistical technique to use in this study was that of multiple regression analysis.
135

Chapter Five Results & Analysis
Chapter 5
Results and Analysis
5.1 Introduction
At the firm level, Barney (1991) refcrs to sustainable competitive advantage as, a
firm engaging in activities that increase its efficiency and effectiveness in ways that
competing firms are not regardless of whether those firms arc in a particular finns
industry. The main aims of this study were not only to test but also to demonstrate that
competitive advantages were associated with key resources and key capabilities that
relate to the retail channel for white goods. To this extent an opportunity presents itself to
conduct a separate analysis for the main survey followed by one for the small retailer
survey also. The main survey will include all observations and the small retailer survey
will include only the observations relating to retailers with less than five outlets.
285 retailers were invited to participate in a national survey of retailers of white
goods in the UIC The response rate for questionnaires returned were 25% and represented
about 40% of the total market shares of the retail channel for white goods. 59 out of the
70 questionnaires returned contained information relating to small retailers (less than 5
outlets).
in this chapter the data on selected variables will be analysed using multiple
regression analysis as it provides the means of objectively assessing the degree and
character of associations between the dependent and independent variables. The SPSS
programme was used to facilitate multiple regression analysis in which an ordinary least
136
Chapter Five Results & Analysis
square regression method will be used. The missing values arc to be rcplaccd with mean
values. The procedure commenced with descriptive statistics of the variables followed by
the detennination of correlation coefficients in order to optimisc explanations. A
confirmatory model inclusive of all the independent variables will be used in the first
instance to test the effects of the overall model fit before and after any violations for the
main survey as well as the small retailer survey. The original results will then be validatcd
using LIAfDEP.
According to Hair et aL (1998) a sample size of 70 could detect reliably lcvcis of
relationship (R square) in excess of 22 percent at a significance level of 0.05. The
proposed multiple regression analysis model was deemed sufficient to identify not only
statistical significance but also relationships that had managerial significance.
5.2 Main Survey
5.2.1 Regression Results
To apply the rcgrcssion proccdurc, markct sharc (MS) a proxy for compctitivc
advantage was selected as the dependent variable to be predicted by independent
variables representing key resources and key capabilities. The following nine variables
were included as independent variables:
OU = outlets,
EX = exclusivity,
number of brands listed,
AG = age,
OTD = order to delivery,
ST = stock-tums,
CD = credit days,
137

Chapter Five Results & Analysis
P= promotions,
CC = credit card usage.
The equation to be estimated at a point in time t was:
MSI =ßo + ßi 0 U+ß2 EX +ß3 B +ß4A G -ßiOTD + ß6ST +ß7CD+ß8P-ß9CC+, ee
%Vhcrc,
PO is a constant and also a parameter,
PI to Pq are the respective parameters,
,E is a stochastic error term.
Table 5.1 and 5.2 provide the descriptive statistics and the correlation matrix for the
variables.
Table 5.1 Descriptive Statistics
Main Survey Mean Minumurn Maximum Std SaMDIC SOC - 70 Dev Dependent
.
Variable Market share M MS 0.63 0 17 1.92
Independent Variables
outlets (ordinal) OU 2.21 1 5 1.34 Age (years) AG 26.74 2 93 19.61 No of Brands Listed B 18.39 3 64 12.49 Excusivity(0,1) EX 0.14 0 1 0.35 order to delivery (days) OTD 2.99 1 10 2.61 Promotions (%) PR 21.76 1 100 19.87 3rd. Party credit card Usage (%) CC 30.84 0 100 21.65 Supplier credit (days) SC 34.5 30 90 12.8 Stockturn (no) ST 6.7 0 20 3.9
This was followed by the regression procedure that selects the independent
variables that optimises explanation. Correlation coefficients were then calculated and the
results are displayed in Table 5.2. Five out of the nine independent variables were found
to be significant (p<0.05), and the coefficients were as follows: Exclusivity 0.587, Outlets
0.567, number of brands listed 0.222, Promotions 0.369, credit cards 0.242.
138

Chapter Five
Tahle 5.2 Correlation Coefficients
Results & Analysis
Variables Market Outlets Are No Of Exclushity OnIcr to Promotioni 3 Party sup"Her Stock Share (ordinal) Years Brandi (0.11 Dcliverv NO CrLdit Card Credit Tum
Listed t0 (davsl (no) Dcocndrnt %IS ou Ar MIL rx OTD JPR cc IS r ST NqIq fol. )
-- 1 0.5720*0 -0.108 0,2220 0.597000 -0.025 0.3690*0 -01420 -OMI -0 036
. I odepeadcat Variables Key Remuce
.
ou (ordinal) 1 0.57200*
Cqmpetitive behaviour AG (Ycafz) -0.108
1 0.107 1 11 1 1 1 1 1 1
B (no) 0.2220 1 0.269000 1 0.060 1 11 1 -,
loter-orgamizational EX(O. 0 0.587*00 10.364000 1-0.156 1 0.2080 11 11111
Orgamisational OTD (days) -0.025
1,060 10055 1 -0.108
10.04R 11
Strategic adaptive ----- - PR (%) 0.36900
. 1166 - 0,053 1 -1
-0.0n. 0,171 1 0.116 1 1
cc (0/0 -0.242* -0.051 -0.07 -0.071 1 0.4- 1 0-10 1 1 -0-36 0
SC (days) -0.021 -0.095 -0.188 -0-014 1 0.000 1 -0.200
1 -0.097 1 . 0112
STf -0-036 0.187 -0.153 1
-0.0153 1 0.273 1 0.016 1
-0.068 1 0.144
op<o. os eop<0.01
At this stage it was assumed that the assumptions of linearity, normality,
homoskedasticity, and independence arc met for the purposes of regression analysis. With
this in mind a confirmatory model was produced with the inclusion of all 9 variables to
help judge the potential impacts of multicollinearity on the selection of independent
variables and the effects of the overall model fit before and after any violations, if any.
, irahle-5.3 Model Summarv
R R Square Adjusted R Sg.
Std. Error Est.
Model 0.758 0.575 0.512 1.334
A Predictors: (Constant)-OTD. ST. P. A(3. B. CD. E. CC. OU B Dependent Variable: MS
Table 5.3 is the model summary where R-Square is 0.575. This means 58% of the
variance, was explained by 3 independent variables namely outlets, exclusivity and
promotions. The adjusted R square falls to 51% reflecting the penalties for the inclusion
of 9 variables, i. e. more independent variables included, then the greater the adjustment
penalty. 139

Chapter Five
TnhIc 5.4 ANOVA Model
Results & Analysis
Sum of Df Mean F Sig.
-Square Sguare
Regression 146.53 9 16.281 9.004 0.000 Residual 108,49 60 1.808 Total 255.0161 69 1
A Predictors: (Constant). OTD. ST. P. AG. B. CD. r3. CC. OIJ B Denendent Variable: NIS
The model summary (ANOVA) tests the overall significance of the regression
equation displaying the significance of F in Table 5.4. F statistic displays 9.004 and is
significant.
Regression coefficients provided a means of assessing the importance of individual
variables in the prediction model only when variables are expressed on the same scale. In
this case they were not and standardiscd beta coefficients were used instcad. The three
independent variables listed in the order of importance are (Table 5.5): Exclusivity 0.426,
outlets 0.373, - both significant at the 1% level and promotions 0.210 significant at the
5% level. In this model the other variables were found to be insignificant. Howevcr, these
beta values at this stage could not be taken at face value, as there could be violations to
one or more of the regression assumptions.
nr-%. iý Cc rnpfflA*pntc
Model Coefficients Predicted Standardised t Sil!
Variables Sign Beta Constant ?
- -0.432 0.668 Ou + 0.373 3.759 0.000 AGE + -0.106 -1.199 0.235 B + 0.012 0.133 0.894 EX 0.426 4.283 0.000
OTD -0.038 -0.436 0.664
p + 0.21 2.292 0.025
cc -0.086 -0.957 , 0.342
SC + -0.006 -0.07 0.944
ST + -0.100 -1.053
1
_U"6 Dependent Variable: MS
140

Chapter Five
5.2.2 Alulticollinearity
Results &A nalysis
Testing for multicollinearity revealed a condition index of 16.538 which is below
30 and explain that there is some relationship between some of the independent variabics
but they were not large enough to reduce the predictive power of their association with
cach othcr.
, ir--, hip 44 ('nllinenritv Di29nosties
Model Dimension Eigenvalue Condition Tndex
1 1 6.933 1.000---- 2 0.882 2.804 3 0.541 . 1.579 4 0.445 . 946-- 5 0.343 4.498 6 0.267 5.097 7 0.237 5.414 8 0.188 6.073 9 1,39E-01 7.061 10 2.54E-02 16.538
Casewise Diagnostics as per Table 5.7 did identify an outlier. This was the largest
retailer in the retail channel and the readings were as follows.
-r-hl,. P. 17 racpwive Diapnostics
Case Number
Std. Residual Mar Shr
4 5.412 12.00 Dependent Variable: Mar Share
5.2.3 Testing Regression Assumptions
Table 5.8 contains the summary of the residual statistics. The standardized
residual depicts that there is at least one prediction greater than 3 standard deviations.
However standardised residuals also indicate a mean of 0 and the standard deviation
below I is indicative of an acceptable model. The studentized residuals too have an
acceptable mean and standard deviation.
141

Chaptcr Fivc Results &, Analysis
Table 5.8 Residual Statistics
Minimum Maximum -Mcan V T) v
Prcdicted Value -1.0657 5.0426 0.6321 1.4
Std. Predicted Value -1.165 3.027 0 0 1.00
Std. Error Predicted Value 0.2903 0,8464 0.4905 0.13
Adjusted Predicted Value -1.3976 5.092 0.6531 1.50
Residual -2.7753 7.2776 -1.04E-15 1.25
Std. Residual -2.064 5.412 0 0.933
Stud. Residual -2.319 5.844 -0.007 1.023
Deleted Residual -3.5023 8.486 -2.09E-02 1.5158
Stud. Deleted Residual -2.41 8.83 0.034 1.301 Mahal. Distance 2.231 26.354 8.871 5.608 Cook! s Distance 0
- 0.567 0.022 0.072
Irentered Leveraize Value f 0.032 0.382 . 0.129 0.081 [A Denendent Variable: Mar share
The maximum leverage value is under 0.5, which means cases are not unduly influential.
Cooks distance, which is a single measure of overall fit, records a maximum of 0.567,
which is below the rule of thumb figure of I and hence is supportive of the previous
statement on undue influence (Hair et aL, 1998).
The assumptions of normally distributed errors were tested by visually inspecting
a histogram (Appendix A). Regression is robust in the face of some deviation from this
assumption. There is some evidence of skewness. The normal probability plot was also
used to test normally distributed error. Under perfect normality, the plot will be a 45-
degree line. In this case observed plots are not on the diagonal but close to it (Appendix
B) and appear unsatisfactory indicating possible normality violations.
The scatterplot of studentised deleted residuals vs. standardiscd predicted values
should show that 95% of the residuals fall between -2 and +2, and only I in 1000 should
fall outside + or -3 (Appendix Q as per SPSS Application guide. This model displays
more than one residual falling outside the + or -3 band. The points do plot in a constant
horizontal band but there was a slight scattering of points, highlighting the tendencY of
142

Chapter Five Results & Analysis
the modcl to slightly ovcrcstimate the low prcdicted markct sharc valucs and
underestimate the high values.
In the plot of studentized residual values vs. observed values if 100% of the
variance was explained in a linear relationship, the points will fonn a straight line. Thcre
is clearly a trend here. A strong line (Appendix D) can be observed with not much of a
cloud and is indicative of the high, adjusted R square of 51%. Ovcrall, from the above
analysis it was unclear whether the model should be accepted in its current state.
In order to address the possible violations of regression assumptions the original
indcpcndent/dcpendent variablc rcadings wcrc subjccted to powcr transformation.
Furthermore it was also decided that the variables with p values less than 0.05
(correlation matrix) were to be included in the equation for regression analysis. Only four
variables passed this test and the results are displayed in Table 5.9.
qr. miki,. r%-() rarrelation Coefficients
Variables Market Share
DD ep engen t NIS - ms M Independent Variables Key Resource OU (ordinal) 0.641*** Inter-Organisational
1) EX (0 0.466*** ,
Strategic adaptive PR (%) 0.320**
cc M1 -0.242* *P<0.05 **P<0.01 ***P<0.001
143

Chapter Five Results & Analysis
The new model summary only changed very slightly with the adjusted R square
moving from 0.51 to 0.536 and the coefficients are displayed in Table 5.10 below.
Table 5.10 Coefficients
Model Coefficients Predicted Standardised t Sill
Variables Sigo Beta Constant ? 1.174 0.244 ou
-- + 0.561 6.393 0.000
EX 0.233 2.592 0.012 cc -0.176 -2.075 0.042.
Fp - 0.1251 1.4271 0.1581
Three variables were found to be significant and the order of ranking is as follows:
Outlets p<0.000
2. Exclusivity p<0.006
3. Credit card usage p<0.039
4. Promotions p<0.144
The point to note is that the normal P-P plot Appendix E is very much closer to the
diagonal (the 45degree line).
5.3 Small retailer survey
A similar analysis was undertaken with the smaller retailer and Tables 5.11, and 5.12
respectively display their results.
Tnhle 5.11 Small Retailer Model Summarv
R Square Adiusted Std. Error F Sig R Square ofthe Est --
0.433 _0.159
0.1557 6.56 0.003
144

Chapter Five Rcstilis & Analysis
Four variables were found to be significant with outlets carrying the highest
ranking. It is important to note that three of the variables notably age, numbcr of brands
listed and order to dclivery in Table 5.12 that were insignificant in the main analysis.
TAIP U2 Small Retailer Coefficients
Model Std. Coeff
Beta t Sig.
I (Constant) 7.15 0.000 Outlets 0.27 2.24 0.029 Me 0.20 1.71 0.093 Number of Brands 0.21 1.80 0.078 Order to delivery -0.23 ---2.01
0.050 Dependent Variable: Market Share
5.4 Validation of results
The validations of the above results were conducted in two stages using the
LiAfDEP software programme. The first stage related to the main survey where all
variables were included and in the second stage only observations relating to small
retailers with less than 5 outlets were considered. The main reason for using LIAIDEP
was because it had an in-built capability to correct the issues of heteroskcdasticity. An
ordinary least square regression analysis was carried out and the results demonstrate the
model to be significant (p = 0.000) and the results are displayed in Table 5.13.
, rahii- 4-11 T. TMDEP Model Summarv
Description Main Smaller Sample Retailer
samde
Sample size 70 59
R Square 0.5506 0.29923
Adjusted R Square 0.4998 0.20305
Prob Value 0.0000 0.00824
Breuscb-Paean cbi-sQuared -16.0723 1 23.4317
Compiled by Author
The dependent variable (market share) together with all independent variables was
entered into the LIMDEP software programme. Two variables namely stock turns, and
145

Chapter Five Results & Analysis
average credit days were excluded as their correlation coeflicients displayed
insignificance. In order to achieve a better-adjusted R square reading the market share and
promotion variables were transformed before they were entered into the programme. The
results corrected for hcteroskcdasticity arc displayed in Table 5.14 for the whole sample.
Table 5.14 LIMDEP Main Surve Variabk Coellicient Std Frror t-ratin SiLv Mean of X
-
Constant 7.53E-02 0.1835208 0.41 0.6829 OTD 8.14E-03 1.09E-02 -0-744 0.4599 2.9928571 Age 1.2 1 E-03 1.02F-03 1.187 0.2396. 26.742857 Brands 1.88E-03 2.05E-03 0.914 0.3643 18.385714 Promotion 0.2113224 0.1106058 1.911 0.0607 1.4927143 Credit Card -1.99E-03 1.12 E-03 -1.778 0.0803 30.842857 Ol cts 0.113548171 1.77E-021 6.40101 0.0000, 2.2142857 t
O 11 IS20731 7.71 E-021 1.4731 0.14591 0.14295711 Dependent Variable: Market Share
The results depict significance of three variables namely outlets, promotion and
credit card usage respectively but supports exclusivity (dummy variable) at the 85%
confidence level. In the SPSS results exclusivity was highly significant and promotions
were supported at the 84% confidence level.
similar analysis was carried out for the small retailer sample that had 59
observations and the results corrected for heteroskedasticity are displayed in Table 5.15.
Interestingly, apart from outlets, exclusivity, promotions and credit card usage were found
to be insignificant in the small retailer analysis. Those variables that wcre insignificant in
the main survey for example order to delivery (OTD), age (AG), number of brands listed
(NB), are now significant and there is agreement in both the SPSS and LIAfDEP results
despite slight vanations in the extent of significance.
146

Chapter Five
Table 5.15 LIMDEP Small Retailer
Rcsulls & Analysis
Variable- Coeflicient Std Error t-ratio SiL, Mean of X
Constant 4.59E-01 0.1510066 3.038 0.0037 OTD -1.41E-02 8.65E-03 -1.635 0.1082
-2.9152542 Age 1.85E-04 9.85E-04 1.878 0.0661 26.1189931
_B-rands 2.8 1 E-03 1-54E-04 1.823 0.0742 17.627119
Promofion -2.59E-02 8.5 1 E-02 -0.305 0.767 1.4535593 6edit Card -5.36E-04 8.99E-04 -0.596 0.5139,32.71186 Outlets I 4.97E-02 I 1.66E-021 2.9870
, 0.00431 1.8 --- I
IEUWIWIY- I -6.02E-021 8.63E-021 -0-698 0.48851 8.47F-07 -
Dependent Variable: Market Share
5.5 Variable Analysis
In the following sub sections the reasons for significance /insignificance of the
variables in the main survey as well as in the small retailer will be explored. The main
purpose of the exploration is twofold. The first would look at the fulfilmcnt of resources
as a source of competitive advantage followed by the associations of resources and
capabilities with competitive advantage.
5.5.1 Independent variable: Key resources
H 1: Competitive Advantage is positively associated with Outlets (OU).
Outlets were found to be the most significant resource at the 1% level carrying
with it the highest beta rating in the main survey, as well as in the smaller retailer survey.
This is in agreement with the MMC findings that rated the effects of large outicts/rctail
parks as the main factor worsening competition for the small retailer (MMC 1997, Q9 pp.
311). However for an outlet to be a source of competitive advantage it must meet the
three conditions of value, rarity, and inimitability.
Outlets meet the condition of value from economies of scale/scope, which
suggests that the delivery of customer values from product portfolios do increase market
shares for the shareholder. It also meets the condition of rarity from the imbalance of
147

Chapter Five Rcsults & Analysis
outlet classes constructed for this retail channel and is outlined in Table 2.1. For the
smaller retailers rarity emerges from early movcr advantages especially the location
cffects. The requirements for meeting the condition of inimitability is of course dcpcndcnt
on the capability profiles of the firm and is discussed in the following sections.
5.5.2 Independent variables: Competitive behaviour variables
H 2: Competitive Advantage is positively associated with Age (AG).
The reason for using the age variable was to consider bcnefits of learning curvc,
early mover advantages and network externalities which are impediments to imitation.
This variable was not found to be insignificant in the main survey but was significant in
the small retailer survey suggesting that the small retailers entered this product, market
space before the entry of the two market Icaders into this retail channel. Dixons was
incorporated in 1937 and Comet in 1933 and both firms had experiences of the radio and
television businesses initially, before moving into the retail channel for white goods in the
early 1980s. The late arrival of the larger and established firms into this retail channel was
to exploit new opportunities in the retail channel for white goods by competing on
efficiencies on a large scale based on their experiences in related areas. Table 3.2 depicts
the age profile of firms included in this survey.
The insignificance of this variable implies that the large retailer investments in
resources to match environmental demands at birth could be put to better use if there were
other investment opportunities with better returns later. ldcntirication of such
opportunities is important and the examples below depict how subsequent investments
favoured the entry into the competitive environment of the retail channel for white goods.
Comet ranked second in the share table in the retail channel for white goods were the
pioneers of out of town discount stores and were using aggressive pricing strategies
148

Chapter Five Results & Analysis
backed with extensive national advertising to boost their sales then. DLxons the market
Icadcr on the other-hand grew organically and also through acquisitions and mcrgcrs. The
common factor here is the move by both firms into white goods busincss in the carly
1980s and their resources and capabilities were better served in reaping the advantagcs of
economies of scale/scope in this retail channel.
In comparison the small retailer survey revealed the age variable to be significant
and indicates early mover advantages, location effects and reputation gathered from
trading in the white goods channel. Both surveys indicate a good fit of the misting
resources to the environment for example the suitability of large number of outIcts for
economics of scale/scope and early mover advantages for the smaller retailer and is in
line with the theory on the origins of competitor behaviour (Stinchcombe, 2000).
H 3: Competitive Advantage is positively associated with Number of Brands
listed (B).
Competitive strategy of product differentiation (number of brands listed) was
tested in both surveys. The main survey depicted insignificance whereas the small retailer
survey indicated significance.
It was stated earlier that retailers compete on the three-tier pricc/quality
continuum and the small retailer competed on the low to middle ticrs. The significance of
this variable in the small retailer survey suggests that an increase in market shares is
directly related to increases in the number of brands listed. This highlights that the
delivery of customer values is dependent on holding efficient product portfolios i. e. a
combination of products from both tiers that maximise shares for the retailer.
On the other hand the insignificance of this variable in the main survey indicates
that the large retailers have the potential to earn higher returns from their product
portfolios. For example, if 30 products were listed by both the large and the small
149

Chapter Five Results & Analysis
retailers, there would be no differences in listings. Howevcr if individual portfolios wcre
considered, the potential returns from the larger retailer portfolio could cxcccd that of the
smaller retailer because the large retailer competes on all thrce ticrs. Furtlicnnorc it was
stated earlier that products on the high/middle tiers commanded bcttcr margins. T'llis also
suggests that the large retailers are benefiting from cost advantagcs from bulk buying as
well as better margins from selling efficient portfolios that consists of products from all
three tiers.
5.5.3 Independent variable: Inter-organisational capability
H 4: Competitive Advantage is positively associated with Exclusivity (EXI.
This variable was found to be significant at the 1% level under SPSS and was
supported only at the 15% level under HAIDER This study however is in pursuit of
explanations and it was decided to accept these results with a view that the measures for
exclusivity could be improved by future research. Nevertheless some support was
experienced thus implying the delivery of customer values from product portfolios that
maximise returns per outlet and/or increase market shares were important contributors to
competitive advantages in this retail channel. Legal restrictions imposed via contracts, is a
powerful impediment to imitation. The significance of this variable highlights intcr-firm
relationships and may be linked to reputation. With exclusivity deals retailers could be
securing competitive advantage by having first call on popular supplier products that
maximise returns and/or increase market shares for the shareholder. Large suppliers have
also recognised this strategic advantage and their participation in exclusivity deals depicts
preferences for national coverage through a handful of retailers. In this survey exclusivity
deals were common among large retailers. However in the small retailer survey the
insignificance of this variable confirms that exclusivity is linked to scale and have to be
150

Chapter Five Results & Analysis
backed by sufficient financial power and the small retailers arc not suitably equipped to
do so. On the other hand, exclusivity dealing with larger suppliers can make way for other
suppliers to seek less efficient retailers.
5.5.4 Independent variable: Organisational capabilities
H 5: Competitive Advantage is negatively associated with Order to delivery
(OTD).
In the main survey this variable was found to be insignificant, which suggcsts that
for the larger retailer the consumers opportunity cost of getting the product i. e. the
opportunity cost of time was not an issue. Instead the larger retailers may be cnticing
consumers by offering other benefits for example consumer credit, promotions and
freelextended warranties.
On the other hand, the significance of this variable in the small rctailcr survey
indicates that quicker deliveries are important to the smaller retailer. The survey results
indicate that quicker deliveries could increase the market shares for the small retailer. It
also indicatcs that competitivc advantagc was crcatcd by the deploymcnt of othcr
resources that produced organisational. uniqueness. This variable represented four
functions: namely, inventory management; material handling management;
communications and order processing management and transportation management.
Hence competitive advantage was created by efficiencies and/or cffectivcncss of a
collection of activities linked directly or indirectly to each other (strategic fit) and is
suited to smaller retailers of this retail channel. Moreover individual strategies relating to
the above functions could also create further advantages for small retailer.
151

Chaptcr Fivc Roults & Analysis
5.5.5 Independent variables: Strategic adaptation variables
116: Competitive Advantage is positively associated with Stock-turns (ST).
The insignificance of this variable in the main survey as well as in the small
retailer survey shows that there is homogeneity among firms and stock turns are
consistent with retail channel averages. With so many models available in the market it is
not surprising to find several best selling models as per MMC investigations (Best selling
models - MMC, 1997 Vol. 11, pp. 68) in each product/quality tier at any point in time.
The insignificance of this variable in the small retailer survey sccms to confirm
that the price/quality differences between products are small and that the products could
be close substitutes especially in the low to middle price/quality ticrs. Furthermore it also
indicates that retailer access to products in the above mentioned tiers is relatively easy.
Moreover the insignificance of both the number of brands listed and stock turn
variables in the main survey signals that the large retailer product portfolios may be
weighted towards the high/medium tiers and better margins
11 7: Competitive Advantage Is positively associated with Creditworthiness
(CD).
The average days of credit given by suppliers to retailers were however found to
be insignificant indicating no direct effects on competitive advantage. This means there is
homogeneity among firms and there appears to be credit norms in this retail channel. The
purpose of using this strategic adaptation variable was to find out the extent of extended
credit as for example, a monopoly supplier may set credit terms in isolation to maximisc
profits. Bulk purchases not only demand preferential prices but also preferential credit
terms, which is a social issue. Furthermore the pricing strategy of the supplier may
152

Chapter Five Results & Analysis
include credit as an overall price package. A better measure may be the actual credit days
given to retailers obtained from the supplier ledgers.
118: Competitive Advantage is negatively associated with Third party credit
cards (CC).
Credit card usage was selected as a variable to capture the cffects of consumcr
credit. For example, if the volumes of transactions paid by credit cards were known then
the balance of transactions going through retailer outlets by deduction, indicates the
extent of retailer funding of credit. It has already been mentioned that white goods are
expensive, and not all customers readily pay cash for their purchases and that the link
between credit cards and outlets was to facilitate instant purchases.
The credit card usage measure was found to be significant in the main survey
suggesting that if the use of third party credit cards were increased thcn the market shares
would decrease. This means that there will be less demand for products. In other words if
credit card usage were to decrease market shares could increase suggesting that the
demand for consumer credit could facilitate increases in retailer market shares.
Furthermore based on volumes passing through larger retailer outlets it may be necessary
to retain sufficient financial power to fund consumer credits. Therefore it appears that a
payment facility could limit competition for rents and could also set tangible ex ante
limits to future competition (Peteraf, 1993).
The insignificance of this variable in the smaller retailer survey seems to suggest
that non-product activities for example the provision of consumer credit appears to be
unimportant to the small retailer. This suggests that there may be other non-product
activities that are relevant to small retailer scale of operations.
153

Chapter Five Rcsults & Analysis
119: Competitive Advantage is positively associated with promotional credit
(P).
This is another non-product activity that was found to be significant in the main
survey and insignificant in the small retailer survey. As mentioned above promotions arc
best applied when there are larger volumes at stake. Furthermore the main survey results
suggest that promotional activities are efficient as it helps to restrict competitor options.
In this survey payment facilities were the ex ante limit to competition and promotional
activities set in motion the limits to competition. Promotional activity is a non-product
activity that entices customers into the store independent of the selling power of supplier
brands.
The insignificance of the variable (promotions) in the smaller retailer survey
suggests that marketing skills of the small retailer may be best suited to promoting
supplier brands and those that link the benefits of location effects and gathered reputation
in local markets.
5.6 Conclusion
The purpose of this study was to test whether competitive advantages in the retail
channel for white goods were associated with key resources and key capabilities using the
extended resource based theory of a firm and its linking with retailing. In order to
investigate firm differences, a model was developed to facilitate not only the inclusion of
key variables predicted by the resource based theory of a firm but also variables from a
retail organisational perspective. Key resources and key capabilities relating to this retail
channel were identified and screened resulting in the selection of 9 independent variables
to predict/interpret associations with competitive advantages.
154

Chapter Five Results & Analysis
The proposed multiple regression analysis model was to diffuse the cffccts of all
variables simultaneously and was deemed sufficient to identify not only statistical
significance but also relationships that had managerial significance. The SPSS results in
the main survey, suggested 4 independent variables to be important. Outlets (p=0.000),
Cxclusivity (p=0.012), credit card usage (p=0.042) and promotions (p=0.158) which
cxplained 53% of the variance that caused firm heterogeneity in the rctail channel for
white goods. In the smaller retailer survey the model explained over 22% of the variation
between firms and had 4 independent variables namely outlets (p=0.029), age (p=0.093),
number of brands listed (p=0.078), and order to delivery (P=0.05) that were significant.
The above results were validated by using LIMDEP software programme that had
the facilities to address the issues of hetroskedasticity. The ordinary least square
regression results corrected for heteroskedasticity in the main analysis displayed
significance for outlets (p=0.000), promotions (p=0.061), credit card usage (P=0.0803)
and exclusivity was supported at the 15% level (p=O. 146).
in the small retailer survey LIMDEP results indicated significancc on four
variables that were similar to the SPSS but with different t values. Outlets (p--0.004) was
the most significant variable followcd by age (p=0.066), numbcr of brands listed
(p=0.074) and order to delivery (p=0.108) and the comparisons of the results more or less
depict agreement between the two programmes and are displayed in TableS. 16, and 5.17
below.
155

Chapter Five
Table 5.16 Comparisons of p Values (Main survey)
Description Main survey) (
SPSS R value
LIMDEP g) value
_ _ Sample size 70 70 Outlets 0.000 0.000
Exclusivity 0.006 0.146 Credit card usuage 0.039 0.080 Promotions
-1 0.144 0.061
Source: Compiled by author
Table 5.17 Comvarison of ID Values (Small Retailers)
Description (Small retailer survey).
SPSS p value
LINIDEP e
Sample size 50 so Outlets 0.029 0.004 Age 0.093 0.066 Brands 0.078 0.074 Order to delively 0.050 0.108 Source: Compiled by author
Rcsults & Analysis
In summary 5 out of the 9 hypotheses were supported and are listed below.
HI: Competitive advantage is positively associated with outlets (OU).
H 2: Competitive Advantage is positively associated with Age (AG).
H 3: Competitive Advantage is positively associated with Number of Brands
listed (B).
H5: Competitive advantage is negatively associated with order to delivery (OTD).
H 8: Competitive Advantage is negatively associated with Third party credit cards
(CC). The two software packages used for analysis displayed varying results for
exclusivity (the dummy variable) and promotions i. e. exclusivity (SPSS, p=0.01,
LjAfDEP, p=0.15) and promotions (SPSS, p--0.16, LIMDEP, p=0.06). Howcvcr as this
study was in pursuit of explanations it was found that accepting the results at 84%
confidence level was deemed sufficient for explanations.
H4: Competitive advantage is positively associated with exclusivitY (EX).
156

Chapter Five Results & Analysis
H 9: Competitive Advantage is positively associated with promotional crcdit (P).
The two hypotheses not supported are:
H 6: Competitive Advantage is positively associated with Stock-turns (ST).
H 7: Competitive Advantage is positively associated with Creditworthiness (CD).
157

Chapter Six Discussion
Chapter 6
Discussion
6.1 Introduction
This study sets out to demonstrate the association key resources and key
capabilities with sustainable competitive advantage from the extended rcsourcc-bascd
view. Two surveys were used for the following: one for the whole population and another
for the small retailers in the retail channel for white goods in the UK. Tile diffusion of
RBV has had a positive impact on the field of strategy and cognate business activities.
Likewise it was appropriate to link RBV with retailing in order to extract the richer
descriptions of organisational actions, their antecedents, and their consequences (Gray
and Wood, 1991). In this study a firm is said to have competitive advantage when it
engages in activities that increases the efficiency and/or effectiveness in ways that
competing firms in the retail channel for white goods are not (Barney, 1992). Value,
rarity, inimitability and in-substitutability were the basis for determining sustainable
competitive advantages in this retail channel.
In addressing the question of whether RBV is tautological (Pricm and Butler,
2000), 1 have assumed that it was not tautological. A similar approach to Eisenhardt and
Martin (2000) argument in dynamic capabilities has been undertaken to facilitate the
definition of resources in terms of its ability to force other resource manipulations in
delivering customer values independent of firm performance as this approach enables
empirical falsification.
The previous work carried out by the MMC was invaluable, as it facilitated not
only the understanding of the workings of the retail channel but also the idcntirication of
158

Chapter Six Discussion
key resources and capabilities for the retail channel for white goods. The white goods
industry is a low velocity environment and strategic alterations arc very minimal and
infrequent. Some of the activities used as examples in the MMC survey still prevail and is
also used for demonstration purposes in this study. Furthcnnorc in the MMC survey of
small retailers (MMC 1997, Vol. 11, Q9. pp. 31 1) approximately rive years ago rated the
cffccts of large outlets/retail parks as the highest factor worsening competition in this
retail channel. The evidence provided in this study gives support to MMC ratings of the
survey of small retailers and directs attention to business concentration in terms of outict
classes rather than finns.
The Chicago approach considers the retailing function as pcrfcctly competitive
based on the assumption that in response to small price changes there is easy entry, many
competitors and a high degree of buyer seller mobility. Dobson and Watcrson (1996)
however argue that perfect competition is not evident in most areas of retailing and that
retailer market power, at least in a limited form is the likely norm. This study provides
some evidence of barriers to entry, economies of scale and scope, national/local market
powers, and retailer differentiation of services that validates their argument at least from
the perspective of the retail channel for white goods.
The remainder of this chapter includes contributions of this study followed by
directions for future research, managerial implications, limitations and the future use of
the model designed for this study. The contribution section will notably contain two
sections. The first will utilise the main survey in which all rctailcrs are to be included to
demonstrate how outlets attained its status as a source of competitive advantage.
Furthermore this section will also scrutinise how large retailers go about setting ex ante
limits to future competition. The preceding section will attempt to explain the survival of
small retailers in this retail channel and will use the small retailer survey rcsults for these
159

Chaplcr Six Discussion
purposes. Overall, the performances of both large and small retailer arc expected to be
driven by firm's resources and is to provide insights into the claim that the retailers of
white goods in the UK are efficient compared to their counterparts in Europe.
6.2 Contributions of the study
The research into the workings of the retail channel for white goods was
facilitated by a model designed specifically to test firm efficiencies and/or cffcctivcncss
of firms based on the RBV and its links with retailing. The purpose bchind tile spcciric
design was to diffuse all the effects simultaneously in order to demonstrate the linking
and ranking of resources and capabilities to competitive advantages at a point in timc. The
model developed for this study is primarily driven by firms key resources and is sct on the
following premise: competitor strategies and competitor behaviour depict why firms are
where they are today and how they got there. Strategy implementations are stecrcd by
both organisational and inter organisational relationships and arc path driven. To dcvclop
strategic assets firms require working capital. The elements of working capital provide
short-term resources for the firm and the product/non-product activities within the
composition of working capital i. e. strategic adaptation capabilities have long-term effects
that have the potential for setting ex ante limits to future competition.
In the main survey that included all retailers the SPSS results demonstrate
agreements to the proposal that competitive advantages were associated with key
resources and capabilities. Three hypotheses were supported: namely, competitive
advantage was positively associated with key resources (outlets); positively associated
with the inter-organisational capability (exclusivity) and negatively associated to key
strategic adaptive capability (credit card usage). Additionally these results were validated
by LIMDEP that had inbuilt facilities to address the issues relating to hetroskedasticity.
160

Chapter Six Discussion
The results displayed signiricancc for outlets, promotion and credit card usage (strategic
adaptive capabilities). A comparison of the results is displayed in Table 15.6. Although
there were variation as to the cxtcnt of significancc of exclusivity (SPSS, p-0.01,
LIMDEP, p--O. 15) and promotions (SPSS, p=O. 16, LIAIDEP, p-0.06) it was decided that
the above variables were to be included for demonstration purposes. In summary the
variables above account forjust over 50% of the variances that caused finii hctcrogCncitY
in this retail channel.
The small rctailcr survey results illustratcd support for four variables narnClY
outlets, age, number of brands listed and order to delivery and were validatcd by
LIMDEP. The linking of resources and capabilities suggest that they arc not only
associated with competitive advantages but their ranking depict tile ordcr of importance
as sources of competitive advantages. The significant variables cxplaincd about 30% (best
estimate) of the variations created by the small retailer key resources and key capabilities.
The significance and insignificance of variables draws attention to the links
between industry and the resource as units of analysis. The uses of industry as an unit of
analysis points to the structural features of the industry that are external to tile firm.
Moreover it highlights the number and nature of sellcrs/buycrs, the nature of products, the
conditions of cntry and exit from the market. However, structural analysis although being
a powerful tool for understanding why a particular strategic action is associatcd with
supernormal returns but in itself says nothing about the role of senior managcmcnt or the
process of strategic choice that determines profitability (Cockburn cl aL, 2000). On the
other hand the use of resources as an unit of analysis does not considcr the firm just as a
contractual entity but directs attention to the necessary strategic invcstmcnts in internal
activities that could generate firm heterogeneity. In this study the combination of industry
and resources as units of analysis demonstrates not only tile naturc and dcgrcc of
161

Chapicr Six Discussion
competition bctwccn finns but also the nature and dCgrcC of competition bctwccn
resources (outlet classes).
The results indicated that outlets were the key resources with the highest ranking
in the retail channel for white goods. The results from SPSS indicatcd that the outIcts
alone accounted for approximately 40% of the variations between firms in this rctail
channel whilst by deduction competitive advantages from retailer differentiation in
services was assumed to be about 60%. Perhaps the competitive interactions among
retailers facilitated by the use of product line (white goods) consistency approach
highlights the presence of economies of scale/scopc and suggests impcrrcct compaition
in this retail channel. This may be a reason as to why the retail channel for white goods is
highly concentrated. The MMC report (MMC 1997, Volumell, pp. 109) rcvcalcd
international comparisons in concentration in the UK and France as most advanced,
whilst somewhat less in the USA and least in Italy, and Japan.
However, in the MMC survey of 1995 it was also noted that the total number of
outlets used by multiples were 3378 in number of which 1478 belonged to retailers who
specialised in white goods. The outlets belonging to small retailers amounted to 5100
(Table 2.1). Furthermore it was indicated earlier that &rorts and Comet the two markct
leaders entered this retail channel in the early 1980s and since the rcorganisation of
regional electrical companies in 1995 no major changes had taken place in this. The
absence of new entrants of significance indicates some form of barriers to entry and
thereby market power for the existing retailers. On the other hand, it could also be argued
that despite the advantages of location, size and mix of outlets of larger retailers, the
collective power of the smaller retailer outlets may appear to control indirectly the cxtcnt
of the benefits of economies of scale/scope that is available to the larger retailers.
162

Chapter Six Discussion
The MMC survey of the best selling models in each of the refcrcncc goods
investigated found no conclusive evidence on best selling models (Best selling models.
MMC 1997, Vol. 11, pp. 68). A wide spectrum of retailers were asked to list six best
selling models on washing machines, tumble dryers, refrigeration and dishwashers. The
replies reflected wide differences in best selling products between these retailers
indicating the products may not be perfectly elastic and may be close substitutes. I'lic
insignificance of stock turns in the small retailer survey suggests that products may be
close substitutes especially in the low to middle pricc/quality tiers. Additionally the
availability of too much information on a variety of models offered might also hindcr
consumers from making realistic price comparisons in this retail channel. On the other
hand the insignificance of number of brands listed suggest that the large rctailcrs havc the
potential to earn higher margins as their product portfolio's appear to be wcightcd
towards the high to middle price/quality tiers. Porter (1980) suggested that substitutcs
have the potential to reduce rents but in this retail channel the retailers may be countcring
this disadvantage by implementing value creating strategies that relate to stratcgic
adaptive capabilities i. e. non product activities such as payment facilities, promotional
credit that enhances retail branding.
In the industry analysis chapter it was stated that four major suppliers accountcd
for rnore than 50% of the supplies into the retail channel of which about 40% was to the
rnajor retailers. Moreover it was also revealed in the earlier chapters that C111 and
wholesalers in Northern Ireland represented the buying groups for this retail channel. The
share of these buying groups was small and suggests that only a handful of retailers were
the largest purchasers of white goods supporting the condition of oligopsony. Tile
information above appears to provide some evidence to validate Dobson and NVatcrson
163
Chapter Six Discussion
(1996) view that perfect competition is not evident in most areas of retailing and that
retailer market power, at least in a limited form is the likely norm.
It was stated earlier that a firm is said to have competitive advantage when it is
implementing a value creating strategy not simultaneously implemented by current or
potential competitors. It was also stated earlier that for a resource to be a source of
competitive advantage it must meet the conditions of value, rarity, inimitability and in-
substitutability. In the following sections it will be demonstrated how outlets became the
source of competitive advantage in this retail channel. To this extent the main survey
results depicts competitive interactions between all retailer types i. e. intratYPc, intcrtypc,
and intercategory and uses a product consistency to end use approach to discuss how the
key resource(s) meets the conditions of value, rarity, inimitability and in-substitutability.
The small retailer survey results discusses intratype competition in terms of key resources
and capabilities that drive their continued existence in this retail channel.
6.2.1 Value and arity
Outlets were ranked as the most important resource in this retail channel at the
time of this survey. For outlets to be valuable in this retail channel superior firms had to
have the capacity to display and deliver customer values. The effective and efficient
capacity utilisation of outlets thus equates to holding and delivering customer values from
product portfolio's that increase market shares for the retailer organisation. Miller el aL
(1999) contended that the size of the competitive effects is greater when store types arc
adjacent in the degree of end-use consistency of product line, regardless of whether scale
or saturation is examined. With this in mind all types of outlets were considered
regardless of scale or saturation in order to capture the competitive effects in terms of
economies of scale and scope. In this study market shares were used as a proxy for
164

Chapter Six Discussion
competitive advantages as market share position was widely believed to be a determinant
of profitability (Buzzell et aL, 1975). Furthermore market structure is a major detcrminant
of retail structure and is driven by environmental variables and socio-economic variables
that either create or impede retailer demand (Miller et A, 1999). The results indicate that
increases in market shares are directly associated with increases in outlets alone and
accounts for about 40% of the variation between finns. Moreover this variation rcinforccs
incumbency advantages due to economies of scale/scope (Dobson and Watcrson, 1996).
In the industry analysis chapter it was revealed that product differentiation was the
main competitive strategy in this retail channel. The insigniricancc of the number of
brands listed in the main survey signals a cost focus as an overall competitive strategy in
the retail channel for white goods whcreas market focus was the competitive strategy in
local markets. The insignificance of stock turns in both surveys suggests that the smaller
retailer is not deprived of access to a large variety of products in the lo%v/mcdium
price/quality tiers and proposes that the products within these tiers may be close
substitutes. The combination of number of brands listed and stock turn variables in the
main survey thus hints that the large retailer product portfolios may be weighted towards
the high/medium tiers and better margins. Furthermore the insignificance of the numbcr
of brands listed also suggests that the larger retailers were using scale-based barriers to
imitations and entry. Scale economies is a strategy that could prevent smaller retailers
already in the market from growing larger and the demand for popular brands may only
support larger retailers already in the market. On the other hand the small retailer survival
may depend on a listing of efficient product portfolios that contains infcrior and/or
superior supplier brands.
The major reorganisations in electrical retailing took place between the years of
1990 and 1995 when the regional electrical companies were privatised and these
165
Chapter Six Discussion
companies all had retail operations. This restructuring together with the closures of other
retailer shops resulted in the disappearance of more than 836 high street shops (MMC
1997, Vol 1 I, pp 69) and this was equal to half the number of closures in the previous ten
years. Moreover the Verdict report of 1996 (MMC 1997, Vol 11, pp. 68) indicated that
the number of electrical superstores grew from 200 in 1986 to 743 in 1996. The surplus
capacity that was available in this retail channel was absorbed by eight of the largest
retailers who accounted for about 670 of these supcrstorcs indicating that smallcr dealers
had not generally been able to move out of town. This suggests that in this retail channel
the larger retailers appear to have benefited more from economics of scale/scopc than the
small retailers.
What is also observed is that the two market leaders in the retail channel for white
goods were incorporated in the 1930s. Both firms had experiences of the radio and
television businesses (brown goods) before diversifying into the white goods in the carly
1980s. The diversification into white goods highlights the resource implications attached
to extending beyond brown goods and indicates that the resources at origination and the
subsequent acquisitions are shared between white and brown goods. This again points to
the value creation ability of the resource and the type of market entry that is suitable for
its use. Chattedee and Wcmerfclt, (1991) contend that if a resource produces just one
product it is unsuitable for diversification and the type of diversification triggered by the
resource depends on its specificity within a particular industry. They also argue that the
resources that are flexible regarding the end products have the option of either more or
less related diversification. They further considered the links of three classes of resources
namely: (a) physical resources, (b) intangible resources and (c) financial resources. The
physical and intangible resources are inflexible and can be used only to entcr closcly
related markets and financial resources due to its flexibility can be used for any type of
166

Chapter Six Discussion
diversification. This means the physical resource can only be used for other purposes if it
exceeds the capacity requirements of the current business. Intangible rcsources such as
brand names can however be repeatedly used with different products in the effectiveness
of the original operation and they are accrued over time and reside in the human capital of
the firm in the form of knowledge and expertise. The financial resources will be discusscd
under inimitability. Therefore based on the above infort-nation it could be argued that both
Dixon and Comets had similar divusification stratcgies rcgarding the typc of
diversification strategy i. e. into related products (white goods) that created more customer
values and was supplemented by retail branding. Information on the prof ilcs of these two
firms in the industry chapter thus satisfies the conditions necessary for the type of
diversification (related diversification) that would result in both Dixons and Comets
successes in their respective markets.
Nevertheless the presence of imperfect competition specifies that the scope for
potential returns (value) for some firms that are suitably endowed with key resources are
greater than those with limited resources. In this study the indications are that the value of
the resource (outlets) for the larger retailers lie mainly in its capacity to deliver customer
values, as economies of scale/scope are evident in this retail channel. For outlets to be
valuable it must have the capacity to meet the needs of its customers. Capacity means the
units outlets available to facilitate the delivery of customer values from a portfolio of
white goods that maximise returns and/or market shares for its shareholders. Therefore, if
the number of outlets in use reflect the volume of white goods passing through the outlets
and if the market growth in white goods is fairly constant then any increases in market
share is assumed to be at the expense of competition. Furthermore the concentration
levels in the UK retailing sector implies that the number and mix of outlet classes in use
is less than that is needed to generate the dynamics of perfect competition (Hirshleifer,
167

Chapter Six Discussion
1980). The current mix of outlets present in this retail channel for cxample retail parks,
high street shops, departmental stores, etc makes it unique and is therefore rare.
6.2.2 Inimitability
The survey results also depict that one strategic adaptive capability variable
namely credit card usage was negatively associated with competitive advantage and one
inter organisational capability of exclusivity was positively associated with competitive
advantages. It was suggested earlier that to develop strategic assets firms require working
capital. The elements of working capital provide short-term resources and the activities
i. e. strategic adaptation capabilities, within the composition of working capital that may
generate firm heterogeneity and have the potential for setting ex allic limits to future
competition. It was also suggested that these activities could relate to product and/or non.
product activities of the firm and that they were tools that were available to manipulate
existing resources configurations or to build new resource configurations for setting "
ante limits to future competition for the firm. Moreover it was already demonstrated that
economies of scale/ scope and the number/current mix of outlet classes met the conditions
of value and rarity for outlets to be a source of competitive advantage. The importance of
credit card usage and exclusivity variables are now considered as impediments to
imitation in the following sections in order to demonstrate how outlets maintained their
status as a source of competitive advantage in this retail channel.
It was stated earlier that retailer strategies may be pointed at retail branding as
multiproduct retailing is on the increase. Retail branding has the double benefit of
differentiating services on the selling side as well as from the buying side. The main aim
of this strategy was to countervail the selling power of the supplier brands (Dobson and
Waterson, 1996). It was also pointed out that an intangible resource for example brand
168

Chapter Six Discussion
name could be repeatedly used with different products Chattedcc and Wcmcrfelt (1991).
Credit card usage was selected as a variable to capture the effects of consumer credit. In
other words if the volume of payments going through credit cards is known by deduction
the remaining balances indicate the extent of retailer funding of credit. White goods arc
expensive and not all consumers readily pay cash as purchasing takes place once in three
or four years usually and is never planned. The link between outlets and credit card usage
is the facilitation of instant purchases.
Chattedee and Wcmerfelt (1991) contend that financial resources arc very flexible
and could be used for any type of diversification. What is observed here is that a specific
resource (outlet) is combining with a flexible resource and an intangible resource (retailer
brand name) to erect an impediment to imitation. It was also mentioned earlier that the
power to arrange exclusivity deals may be attached to retail branding and the capacity it
generates. Several retailers issue their own credit cards which allows settlement on a
monthly basis and thereby offering an interest bearing facility, whilst the facility to accept
third party credit cards/debit cards is also available. In this retail channel it appears that
some retailers are implementing a value creating strategy that complements scale based
competition and are ensuring the ex ante limits to competition is in place facilitated by
funding capabilities of the firm that limits competition for those rents (Pctcmf, 1993). A
payment facility is a value creating strategy that facilitates payments and is independent
of the selling power of the supplier brands thus giving the retailer the opportunity to erect
a tangible impediment to imitation.
it was noted in the industry analysis chapter that some retailers arrange consumer
credit, through an outside finance house and are rewarded by commission payments. The
larger retailers take on the associated risks and administration through subsidiaries set up
for these purposes for example, Dixons the leading retailer uses the services of Cowrplan
169

Chapter Six Discussion
Insurance Services p1c, a subsidiary that was principally set up for the provision of
warranty insurance and the management of consumer credit. Conict the second largest
retailer uses Time Retail Finance Ltd the wholly owned subsidiary of Kingfisher the
parent company for the same purpose. The above subsidiaries may have the facility to
raise external finance thus supporting that external financial resources are associatcd with
relative diversification into white goods (Chattedee and Wemerfclt, (1991). Furtliennorc
it could also be argued that the divcrsification into risk management is also rclatcd
diversification as it involves electrical goods. It was also stated earlier that financial
resources could be used for any type of diversification. Hence if there were surplus
capacities in the subsidiaries set up to manage warranty insurance and consumer credit
there is also the potential for further unrelated diversification for supporting other goods.
The regional electricity companies and mail order companies were large enough to fund
their own credit and insurance arrangements. In the industry analysis chapter it was also
revealed that the market shares of the retailers mentioned above accounted for more than
55% of the total market indicating that the financial power was in the hands of a few in
this retail channel. These firms had set up subsidiary companies to manage consumer
credit on a large scale enhanced by their brand name to complement the anticipated
volumes of white goods that would pass through their outlets.
The other retailers especially the small retailers arrange their consumer credit
from outside finance houses that takes the responsibility of approving credit, collection of
instalments for which the retailer gets commission. Lonibard Tricity Finance Ltd as it was
known in 1995 appeared to be a popular finance house choice among the small retailers
(MMC 1997, Vol. 11). The reconstruction of the electrical companies, especially
NORWEB provided Lombard Tricity Finance Ltd. the opportunity to acquire its debt
portfolio (customer base) and indirectly highlights the involvement of the regional
170

Chapter Six Discussion
electrical companies in the set up of consumer credit management for the small retailers.
The above arc examples of retailer financial power and is ensuring other resources in the
form of working capital requirements are adequate to meet the needs of their outlet
performances. This illustrates that a suitable payment facility for expensive goods can
enhance the sale of white goods and indirectly implies that it is the financial power to
fund consumer credit that facilitates increases in the market shares for the retailer in this
retail channel. The number of outlets provided the strategy to exploit the economics of
scale/scope that was prevalent in this retail channel and together with a suitable payment
facility ensured the ex ante limit to competition was in place (Petcraf, 1993). The
financial power of some retailers established the superior outlet positions by limiting
competition for those positions. Moreover the implementation of the strategy relating to
payment facility ensured that competition could not easily dissipate rents away as not
many retailers had the financial resources to do so in this retail channel. Additionally the
payment facility (consumer credit) has also the potential to cam extra revenues by means
of interest payments for the firm.
Oliver (1997) also suggested that the sources for competitive advantage should
look beyond the resource and market characteristics of firms to government, society, and
inter-finn relations as important influences of firm variation. Exclusivity, an intangible
capability, that promotes inter-firm relationships and is an intangible impediment to
imitation. The main objective of inter firm relationships in the retail channel for white
goods was to facilitate delivery of customer values from desired product portfolios that
maximises returns and/or increases market shares for shareholders. In this study
exclusivitY was positively associated to competitive advantage suggesting that the
increases in inter firm relationships could increase competitive advantages. Furthermore
171

Chapter Six Discussion
cxclusivity was positively associated with outlets also suggests that competitive
advantages are scale based.
What is observed in this study is that the white goods industry was trading with
the retail channel by pursuing strategies that minimise transaction costs nccdcd for
cconomic exchange under the prevailing exchange system here in the UK. Most supplicrs
in the white goods industry seem to prefer sales of large quantities of white goods to a
handful of retailers and their dependence on the retailers is an indication that vertical
integration is a restraint. Retailers on the other hand are making available their outlets as
the process for exchange. The carrying capacity of the outlets provides the opportunity for
displaying differentiated products and also the provision of differentiated retailer services.
However the benefits of inter firm relationships in this retail channel seem to tilt towards
the larger retailers enhanced by retail branding.
For exclusivity dealings to arise at-least one manufacturer must have low marginal
costs of production (Mathewson and Winter, 1987). GDA Ltd. was the main manufacturer
and a leading supplier of white goods in the UK. However competition for the UK supply
of white goods came principally from abroad. Well over half the products were imported.
Some of the low cost producers especially from Turkey, Hungary, Slovenia and other
suppliers were able to sell goods at marginal costs in order to earn hard currency and their
prices were substantially below those in their home markets (MMC 1997, Volume 11,
pp. 160).
The MMC 1997 ruling has outlawed the exclusivity arrangements in the white
goods industry (supplier). Furthermore, since the entry of DLrons, Comet, and the
rcorganisation of electricity companies no other strategic retailer of signiricancc had
entered this retail channel. Moreover it was demonstrated that in this retail channel
economics of scale/scope were present This means that only a handful of retailers arc
172

Chaplcr SLV Discussion
arranging exclusive dealings by means of contracts to manufacture own labcls, licences to
sell and bulk buying. Exclusive dealings may thus be an entry deterrent into the retail
channel for white goods.
In the MMC survey it was also revealed that the combination of the retailers
preoccupation with low prices offers and the substantial over capacity in the UK and
Europe had resulted in the average prices falling over the recent years (MMC 1997,
Vol. 11 pp. 166). Furthermore the insignificance of the number of brands listed in the main
survey also suggests that cost focus was the main competitive strategy in the retail
channel for white goods. This may indicate that the falling average prices had
repercussions on the manufacturer margin much more than that of the retailers. According
to Sharp (1985) manufacturers may be susceptible to the pressure of one or a few rctai Icrs
that have significant control over the market. In the retail channel for white goods similar
conditions prevail. General Domestic Appliances Ltd a leading manufacturer of white
goods claimed that the retailers were constantly seeking to protect thcir margins by
requesting additional margin support and were attempting to push costs back on to the
rnanufacturers (MMC 1997, Vol. II pp. 166). Aferloni Domestic Appliances Ltd another
, Supplier stated that the white goods industries ability to survive in the face of progressive
deterioration of price: cost ratios, had an impact on their margins. These examples
suggest that the suppliers are influenced to purchase the retailer barrier to entry and this in
turn is converted into a supplier barrier to entry (Comanor and French, 1985). Under
such circumstances the suppliers are forced to look for continual improvements in quality
and distribution that eventually results not only in efficiency gains for the suppliers but
can also the reduce of the retailers marginal costs of selling the product. With such cost
advantages and other advantages of location, experience and reputation of established
large retailers there is differentiation and new entrants into this retail charincl may find
173

Chapter Av Discussion
critry relatively easy but may find that it is not free (Bresnahan and Reiss, 1991).
Moreover the retailing barriers to entry allows some large suppliers to exercise their
existing cost advantages to leverage some market power from one market to another
whilst protecting larger retailer margins (Whinston, 1987).
The effects of bulk buying policies may constrain the movement of popular
products within the retail channel as not all retailers have either the warehousing facilities
or the financial power to facilitate stock movements. For example bulk buying of popular
niodels might have some repercussions on price levels taking into consideration the
seasonal effects. Perfect competition assumes factors of production arc elastic in supply.
Large purchases made by the larger retailers need it be on low, middle or upper
price/quality tiers, can limit the number of popular stock that is available to smaller
retailers as white goods sales are seasonal. As stated earlier, the largest retailer had 19
warehouses in comparison to the second, third, and fourth largest retailers who between
them had 8 warehouses altogether. Hence if there were surplus capacity in the supplier
industry and if the retailers had the capacity to hold stock, then the financial powcr to
facilitate cheaper bulk purchases could possibly fund the extra holding costs and could
also create in-elasticity in supplies of popular stock (Pcteraf, 1993). TIIC outlets were
demonstrated earlier as valuable and rare and inimitable. Likewise the same is assumed to
apply to warehouses as the development of this specific asset is time consuming and
expensive. Warehousing complements delivery systems and some larger retailers
controlled their delivery systems too. Other retailers either replenished stock at outlets as
and when required or arranged with suppliers for direct delivery into consumer homes.
Hence it appears that a handful of retailers have set up distribution systems that are hard
to imitate.
174

Chapier Six Discussion
Moreover it was mentioned earlier that four major retailers accountcd, for more
than 40% (Table 7.7 MMC 1997, Vol. II pp. 3 1) of sales in the domestic appliance market
and four major suppliers in the white goods industry accounted for more than 50% of tile
total supplies (Table 7.2 MMC Vol. 11 pp. 12). Suppliers normally prcfcr bulk purchases
to smaller purchases and there are more than 3000 small outlets with limited access to
popular stock depicting some form of market power for a few large rctailcrs.
Shaffer (1991) formally found that slotting allowances and rctail price
maintenance serve a strategic role in dampening downstream competition allowing retail
price and profits to rise. The effect of slotting allowances is up-front paymcnt and tile
indirect benefit of committing the retailer to take up a wholesale price above a
nlanufacturers marginal cost of production. This process is to induce tile retailer to raise
their retail prices. Comanor and French (1985) suggest that to secure an exclusive deal the
Inanufacturer/supplier needs to offer a wholesale price low enough to make it more
profitable to seal a contract with the retailer. It was stated earlier that in this retail channel
the buying groups market share was small and many retailers were buying directly from
the suppliers.
In the absence of wholesale /recommended retail prices in this retail channel the
individual supplier-retailer contracts become unobservable and the
nlanufacturers/supplicrs rely instead on their target market prices. These target market
prices are negotiated with the retailers and as a result a transfer price is agreed based on
their respective market powers and there are no up-front payments to the retailers.
iFurthermore with the removal of retailers recommended prices in this retail channel the
gap between the suppliers marginal cost and the retailers selling price is biggcr than it
would otherwise be under the wholesale system. This system gives the powerful retailer
the opportunity to select efficient suppliers and to keep the surplus arrived from the
175

Chapter Six Discussion
rcduction of the transfer price whilst keeping the selling priccs unchanged. Morcovcr
, double marginal isation' as observed by Spengler (1950) is avoided as joint profits are
mutually agreed between the retailer and the supplier and is only visible to the
participants.
The visibility of joint profits on the other hand also gives the larger retailer the
opportunity to scrutinisc the supplier product cost structures. Recent rctailcr attention has
been drawn on the manufacturer's warranty provision that is included in their cost
structures. The manufacturers usually provide between one to two years of free warranty
insurance for their products whilst the retailers offer extended warranties on top of the
rnanufacturers warranties for a price. Some large retailers are now using their buying
power to purchase the manufacturers warranty insurance costs and arc taking on the risks
ihemselves. The retailer benefits from further reductions in purchase price and also finds
an opportunity to reduce the selling prices also. The retailer strategy to reduce selling
prices year on year hence, may be directed towards reducing the consumer purchasing
cycle for example from an average 4 year to a2 year purchasing cycle. Consequently
such an action also has the effect of increasing yearly sales revenues for the retailer. On
the other hand if the retailer takes on the manufacturers warranty insurance there could be
rnore opportunities to generate extra revenues from extended warranties for their
subsidiary companies and/or the in-built internal facilities set up for these purposes.
6.2.3 In-substitutability
Peteraf (1993) also argues that prior to a firm establishing a superior resource
there must be limited competition for that position. This means there must be ex ante
limits to competition and the cost of implementing strategies via other resources should
not erode away the anticipated returns. Under in-imitability it was illustrated that credit
176

Chapter Six Discussion
card usage was an activity within the composition of working capital i. e. strategic
adaptive capability and its indirect connection with funding consumcr credit was
important for setting ex ante limits to competition (Pcteraf, 1993). The financial powcr of
the larger retailer extracted from the same variable can accomplish a dual role of
inimitability and in-substitutability as the barriers to imitation were scale bascd. Howcvcr
the use of the other strategic adaptive capability namely promotional crcdit which is a
non-product activity is also important. The promotion of buy now pay later schcmcs have
highlighted not only the need for marketing skills but also the exploitation of the
rnarketing economies of scale. The marketing economics of scale thus complement tile
cconomies of scale/scope created from clTicient product portfolios in this retail channel.
This study provides some support for the association of competitive advantages
-. vith promotional credit suggesting that increases in promotional activities would increase
rnarket shares. The purpose of sales on promotional credit (P) - (interest free credit/ buy
now Pay later schemes) is to keep hold of the existing customer base and also to capture
new customers. Moreover it was stated earlier that the communication effects on a brands
positioning could be affected by the desirability of the brand relative to other competitive
offerings and also the brands price sensitivity. The long term effects of both desirability/
price sensitivity affect the firm's ability to earn future profits and that promotional
activities decreases differentiation and increases future price competition (Boulding and
Lee, 1994).
In the retail channel for white goods the focus of some retailers appears mainly to
be on the enhancement of retailer branding and also appears to be scparatcd from
promoting the supplier brands. The promotional activities of buy now and pay later
schemes seem to complement consumer credit facilities that are already set up and the
purpose behind this strategy is to entice the customer into the stores. Morcovcr tile retailer
177

Cilapter Six Discussion
focus for capturing customers via this non-product activity appears to be bascd on
increasing the desirability element of retail branding in ordcr to dccrcascs the rctailcr
rcliancc on the selling power of the supplier brands. The survey results suggest that
promotional activities when linked to another value creating non-product strategy can
i, ncrcase retailer differentiation.
The Which' magazine survey of standards of service in electrical goods in 1996
found that, despite widely publicised claims of price cuts and special deals, the largcr
chains not only matched each other on price, but were the most cxpcnsivc. The
independents and smaller chains tended to be cheaper (MMC 1997, Vol. 11. pp69). This
implies that some larger chains were charging above average prices in this retail channel.
Furthermore it was mentioned before that more than 50% of the supplies into this retail
channel were imported and that some importing countries supplied below thcir marginal
cost. Additionally this may also suggests that strategies aimed at retail brand
cnhanccment are aimed at weakening the selling power of some popular supplier brands.
was noted from the MMC report (MMC 1997, Vol. 11 pp. 70) that promotional
crcdit took the form of interest free credit or of deferred payments. The Business Book
1996 has suggested that 30-40% of buy now, pay later transactions the customer opts for
a further period of interest bearing credit resulting in commission income from the
outside financing company. However under inimitability it was noted that larger rctailcrs
had set up subsidiary companies to manage warranty insurance, consumer credits and
Promotional credits whilst regional electricity companies funded their own. This process
thus enhances further the financial power of these retailers as the extra commission
earned is kept within their businesses. Additionally it was also noted that some supplicrs
furid part of the promotion costs in order to promote sales of their brands suggesting that
178

Chapter Six Discussion
some retailers were charging slotting allowances indirectly for funding tile promotion of
retail branding.
The type of credit offered to customers is of course dependent on customer credit
, worthiness. To this extent the buy now, pay later schemes is said to be aimed at well off
customers. On the other hand for less well off customers the outlet for purchases is
through mail order companies who had set up the facility of weekly instalmcnt schemes
whilst high street stores may offer interest free credit utilising the location effects to tile
full. Given that there is intratype competition between tile retailers the growing use of
interest free credit may be aimed at weakening the key advantages of other firrils for
example mail order companies. Thus the financial power of the larger retailers gained
from funding consumer credit and coupled with their marketing skills of promotional
credit make consumers perceive some retailers as in-substitutable.
6.2.4 Small retailers
Earlier studies on competitive effects on retail structures (Miller et al., 1999)
implied a mutually beneficial relationship among different types of retailers rather than an
overwhelming competitive advantage for larger stores. Furthermore their study revealed
the significance of personal service levels as antecedents to other retail structures but does
not explain the specific strategies that are successful for each competitive situation. In this
study some smaller retailer specific strategies are included to extract the cffccts of
collective competition. The survey results suggest the survival of small retailer to a larger
extent may depend on both the larger retailers and suppliers respectively.
In this survey retailers holding less than 5 outlets were considered as small
retailer. In the main survey, outlets were demonstrated as tile key resource that drove
other resources and capabilities in the in the retail channel for white goods. The small
179

Chaptcr Six Discussion
retailer survey results illustrate similar features where the outlets were the key rcsourccs
supported by the variables of age, number of brands listed, order to delivery and arc
displayed in Table 15.7. The significance of outlets may also suggest traces of imperfect
competition and local oligopoly as some small retailer outlets may have varied in size.
This illustrates that there is less of an overlap of resource bases bctwccn tile small and
large retailers in the retail channel for white goods in their traded areas (Baum and Singh,
1994). However the overall results indicate that the survival of the small retailers in this
retail channel arc dependent on strategies that relate to key resources, competitor
behaviour capabilities, and organisational capabilities.
Earlier analysis indicated some evidence of exclusive dealings of larger retailers
and in the smaller retailcr survey exclusivity was found to be insignificant. Exclusivity is
one of the restraints that foreclose other manufacturers from distributing their brands
through an efficient retailer. Manufacturers will attempt to reduce rival manufacturers
access to efficient retailers by imposing vertical restraints on them. Morcovcr this is
achieved by purchasing the exclusive rights to efficient retailers in order to increase the
rival manufacturer costs of distributing their products (Krattenmaker and Salop, 1986).
The purpose of a long-term exclusive contract is to tic up the best retailers and their
locations. Furthermore if there are brand inferiority's as well, a double disadvantage
incurs and forces other manufacturers/suppliers to seek retailers with inferior capability
profiles (Comanor and French, 1985).
In the retail channel for white goods it appears that the reverse effect is taking
place as exclusive dealing of manufacturers/suppliers is prohibited in the white goods
industry. Instead, the importance of exclusivity in the main survey results suggests that
the larger retailers arc taking on the manufacturers role of controlling the actions of rival
manufacturers by placing exclusive deals with selected manufacturcrstsupplicrs for
180

Chapter Six Discussion
distributing selected brands. Furthermore the insignificancc of exclusivity in the small
retailer survey indicates that the larger retailers are taking the initiative of purchasing the
cxclusive rights to a handful of efficicnt manufacturers/supplicrs making ways for othcr
manufacturers/suppliers to deal with retailers with inferior capability proriles. The ability
of the larger retailer to diverge some manufacturcrs/supplicrs towards infcrior retailcrs;
may also be another example of retailer power in this retail channel.
in the small retailer survey the variable number of brands listcd was positively
associated with competitive advantages and was significant. It was stated earlier that there
were more than 3000 small retailer outlets and the survey results indicate that the value
for the key resource (outlets) is created from listing efficient product portfolios that
niaximise revenues and/or increase market shares for the small retailers.
in the MMC investigations it was found that some brands that were widely
stocked by small retailers achieved relatively low market shares compared to thosc that
were infrequently stocked achieved higher shares. For example Creda washing machines
wcrc listcd by 41% of the small rctailcrs survcycd had only 2.6% of the mark-ct sharcs
when compared to AEG listed by only 17% of respondents achieved a share of 2.8%. The
Creda brand is one of the inferior washing machines listed by GDA Ltd the market leader
(supplier) and likewise AEG brand is one of the superior brands supplied by Entaco. The
above example suggests that the listing of some popular brands wcre an important
strategy for the smaller retailer. The retailers who were fortunate to stock the AEG brand
would increase the value provided by their outlets much more than those listing the
CREDA brand. This implies that the value element is enhanced from listing a portfolio of
brands that not only delivers customer values but also maximiscs market shares in the
traded area for the small retailer.
181

Chaptcr Six Discussion
Furthermore, the above example indicates that the smallcr retailers are
participating in intra-brand competition operating in similar tiers. Hirschman (1978,1979)
argues that speciality stores tend to thrive as they exhibit classification dominance within
their trade lines. She argues that stores arrange themselves in a three-tier pricc/quality
continuum in which direct competition remains within each tier. In the retail channel for
white goods similar conditions are experienced with larger rctailcrs competing on all
three levels whereas the smaller retailer was competing mainly in the lowcr to middle
price/quality tiers. Emaco's strategy seems to be much more efficient as they used fewer
retailers to obtain the same market shares suggesting the connection between brand image
and indeed the location effects. The 'Wdch' magazine survey of standards of service in
electrical goods in 1996 also found that, despite widely publiciscd claims of price cuts
and special deals, the larger chains not only matched each other on price, but were the
rnost expensive. The independents and smaller chains tcndcd to be cheaper (NIMC 1997,
Vol. 11, pp69) indicating that Entaco's pricing strategy may be a contributory factor as it
complements the profile of small retailer outlets. In either case Enzaco the less efficient
supplier appears to maximise the delivery of customer values by providing product
portfolios that maximise market shares for the smaller retailer in that traded area. On the
other hand the largest manufacturer, GDA Lid's strategy of selecting small retailers may
appear to be inefficient as it seems to use more retailers than Emarco for the same market
shares.
GDA's strategy compared to Entarco on the other hand may be related to scale
economics. The information provided in the industry analysis chapter states that GDA Lid
uses about 1000 small retailers who guarantee about 60000 units of sales per annum for
low and medium quality products. In order to entice these small retailers the larger
suppliers could be offering benefits that they cannot refuse. These benefits could take the
182

Chapter Sbc Discussion
fonn of for example, extended credit and/or extended manufacturers warrantics.
However, in the main survey it appeared that the larger rctailcrs strategy of scale
cconomies were to prevent smaller retailers from growing larger. On the other hand the
above example suggests that the larger suppliers may be seeking smaller rctailers to fill in
the gaps created by their production capacity requirements. Therefore it could be argued
that delivering customer values are subject to maximising market share values from
product portfolios that vary in popularity and value creation may be subject to listing one
brand or a combination of several brands. To this extent it is suggested that a portfolio of
brand(s) are contributing towards the value creating strategies of the small rctailcrs and
the suppliers are ensuring the survival of small retailers whilst pursuing their own
strategies of promoting their brands for fulfilling their need for market shares.
The smaller retailer contributions however stem from early movcr advantages in
this retail channel. In the small retailer survey age variable was found to be significant
and its association with competitive advantage suggests early mover advantages, which is
an impediment to imitation. In this survey the age profile of retailers in this rctail channel
indicated that 50% of the firms surveyed show trading in excess of 20 years. What is
observed is that the two market leaders in this retail channel were incorporated in the
1930s e. g. Comet in 1933 followed by DUons in 1937. Both firms had experiences of the
radio and television businesses initially before moving into the white goods businesses in
the early 1980s. This suggests that several small retailcrs; had entered this product-mark-ct
space well before the current market leaders and had located under unccrtain
cnvirorunental conditions (Stinchcombe, 2000). Not all-small rctailcrs wcre fortunatc
enough to exploit early mover advantages and only a privileged few were able to reap the
benefits of prime locations. On the other hand agglomeration of dissimilar types of
retailers for example in the same location may be promoting multipurpose shopping as it
183

Chapter Six Discussion
helps consumers to save shopping time and shopping energy (Ghosh, 1986). White goods
arc consumer durable and infrequently purchased and the location density of outlets for
these goods was expected to be low and selective. Tile agglomeration of dissimilar types
of retailers in that location may have facilitated better access to customers thereby making
this location more valuable fulfilling the condition of rarity over time. Furthermore it
could be argued that the cumulative experiences gained over time might have promoted
network externalities that resulted in the enhancement of the smaller rctailcr rcputation in
that location. The small retailer thus erects intangible impediments to imitation ovcr time
and this may be a reason why the factors differentiating retailer services are less
immediately obvious and that the consumers view some retailers as impcrfcct substitutes
(Dobson and Watcrson, 1996).
Customer preferences for small retailers are connected to customer nccds for
respective in-store services, merchandise mix, quality of goods, and the method of doing
business (Hotelling, 1929). The MMC survey revealed that customers valued the services
of small retailers in comparison to those offered in multiple stores (MMC 1997, Vol. 11,
pp. 59) and that the small retailers offered free delivery and installation, favourabic credit
terms and warranties as alternatives to price cutting. In this study the significance of the
Organisational capability suggests that the conduct of business, including the level and
type of pre or post sales services that is offered by the small retailer arc important to both
the consumer and the supplier. In this study the time taken to process and delivcr ordcrs
(order to delivery) was tested and was found to be significant. This variable represented
four functions: namely, inventory management; matcrial-handling management;
comrnunications/order processing management and transportation management.
Moreover the quicker delivery strategy indicates that the competitive advantage was
created by the deployment of other resources and capabilities that produced
184

Chaptcr Sir Discussion
organisational uniqueness (strategic fit) and seems to be best suited for smaller firms.
However this may also suggest that there may be some activities within the four functions
that are also sources of competitive advantages for the retailers. For example warranty
provision is linked to inventory management, free installation with material handling,
credit provision with order processing, and free deliveries with transportation. In the main
survey consumer credit and promotional credit (strategic adaptation capabilities)
outweighed the advantages of quicker deliveries. These strategic adaptation variables
were sources of competitive advantages in this retail channel suggesting they were
indirectly associated with the functional capabilities that have the potential to create finn
heterogeneity.
In the small retailer survey of white goods the strategic adaptation activities
within the elements of working capital were tested for financial power. The variables of
stock-turns, average credit days, third party credit card usage and promotion wcrc used
for these purposes. These variables were considered as they represented activities within
the working capital that represented both the product and non-product activities rclating
to the small retailer firms. Stock-turns measured the cfficicncy and cffcctivcncss of how
quickly stock could be converted to cash whilst the average credit acquired from suppliers
was to highlight supplier funding. Both credit card usage and promotions were used for
testing the non-product activities that related to retailer management of a payment facility
and frcelextcnded wan-antics. All four strategic adaptive capability variables were found
to be insignificant explaining that the small retailers did not have the capabilities to set ex
ante lit"its to future competition. There was no support for intcr-organisational
capabilities also perhaps suggesting that the capability profiles that help set ex ante limits
to future competition in the retail channel for white goods arc mainly associatcd with
scale economics.
185
Chapicr Six Discussion
63 Directions for future research
This study has several implications for future research. First and foremost, it is a
step closer to measuring competitive advantages in a specific retail channel. The ranking
of resources and capabilities may facilitate computation of formulas to measure
competitive advantage in the future based on end use consistency of product line.
The ratio of small retailer outlets to large retailer outlets included all classes of
outlets and was a measure of the efficiency and effectiveness of the retail structure for
white goods in the UK. A future study on the actual mix of outlets in the UK may thus
provide answers to acceptable number of outlet classes that arc nccdcd to balances the
needs of the consumers, manufacturcrs/supplicrs and the retailers. Similar retailing
studies in Europe may provide international comparisons necessary for not only the
structuring of an cfficient retail channel but also for analysing the concentration cffects of
frMs within that retail channel.
About eight firms supply approximately 80% of products to the rctail channel for
white goods dominate the supply industry. The understanding of the types of competition
in the white goods industry may also be important. The intcr-organisational relationships
, %vith either a perfect or imperfcct supplier competition may provide other reasons for why
the retail channel for white goods is imperfect but efficicnt. The dimensions of situation,
structure, process and outcome are important elements for intcr-organisational
relationships (Van de Ven, 1980).
The areas of particular interest arc in the structural and processes as they rcfcr to
governing mechanisms that charactcrise intcr-organisational relationships and activities
promoting flows of product and information between organisations. With this in mind it
has been rccogniscd that using the product line consistency approach used in this study
may have its limitations. The focus on the retail channel as opposed to firm level analysis
186

Chapter SLr Discussion
may have opened up new avenues for the understanding of retailing cspccially the
competitive interactions among retailers. The lack of prccise taxonomy on retailer types
has lead to non - exclusive categorisation of competitive interaction among stores. It was
rccognised that the ambiguity in the definition of retailer typcs cncouragcd Millcr ct al.
(1999) to define the three types of retail stores using a product consistency approach. 11iis
study however goes a step further recommending competitive interactions between outlet
classes for example high street, shopping ccntrcs and out of town outlets ctc for c1cadcal
goods. The two streams i. e. white and brown goods that flow out of these outict typcs
rnake up the retail channel for electrical goods. The testing of portfolios of clcctrical
goods by outlet types may be the way forward and may be another way of explaining the
cfficiency and effectiveness of value creating strategies that maximise returns and / or
increase market shares for the retailers in the retail channel for electrical goods.
6.4 Managerial implications
The extended RBV approach used in this survey has several implications for
managers, practitioners and regulators involved in the retail channel for white goods.
Perhaps most importantly the analysis identified competitive advantages in the retail
channel and provides a basis for ranking important resources and capabilities at the firm
level. The linking and ranking of resources and capabilities is also expected to bcncfit
regulators, as they would be in a better position to address competitive issues accordingly.
6.4.1 Developing retailer strategies
The initial task for all practitioners is the idcntirication of key resources and
capabilities that lead to competitive advantages in the marketing channel. The above
jalowledge can help finns to leverage existing resource positions into supcrior future
187

Chapter Six Discussion
positions (Winter, 1994; Dierickx and Cool, 1989). The linking and ranking of valuable
resources and capabilities to competitive advantage may be of importance to retailers
searching for value creating strategies whilst competing in national and / or local markcts.
In this study the ability of the key resource (outicts) to manipulatc othcr rcsourccs and
capabilities resulted in delivery of customer values from product portfolios that maximise
returns and / or increase market shares for their shareholders. It was also dcmonstratcd
that for a resource to be a source of competitive advantage and for sustainability of
competitive advantage the resource had to meet the conditions of value, rarity,
inimitability and insubstitutability.
Value is created from market factors as well as from mark-ct impcrfcctions. A
firm's value creating strategies should take into consideration market factors that drive
retail structures as the market structure is a major determinant of retail structurc and
consists of variables that create or impede demand for retailers (Miller ct al., 1999). I'lle
value creation in the national market stcms from cost focus stratcgies whilst in the local
markets, market focus was significant. Furthermore the imperfection of the market may
also highlight the sources of competitive advantages in that that market. In the market for
domestic appliances market power was detected from barriers to entry, economics of
scale, national/local market power and retailer differentiation of services.
Value maximisation. is individual to the firni and is dcpcndcnt on the dccisions it
takes to marshal its resources and capabilities and allocate scarce resources to compaing
activities. The finn directs the transformation process in order to deliver customer values
from product (s) and / or services in the market place where the competitive forccs reward
efficiency. This study has digessed from the firm level analysis to a resource as an unit
of analysis in a retail channel. In other words a firm may be competing in one retail
channel or in several retail channels as it divcrsirics it customer values and the sharing of
188

Chapter Six Discussion
its resources and capabilities may cause problems relating to allocation of costs and
efficiency measures for multiproducts.
The sharing of retailer resources and capabilities however resulted in significant
retailer economies of scale triggered by efficient product portfolios in the national and
local markets. Moreover significant economics of scale from marketing was also achieved
and activated through promotion in the national market. The advantage of using the retail
channel approach helps with the identification of competitive advantage in each market as
demonstrated in this study i. e. national / local markets. For example this study detected
economies of scale from one product line (white goods). It is also known that sevcral
retailers compete in white and brown goods suggesting that there are possibilities of
exploiting multiple economies of scale from product portfolios and marketing skills in
national markets. The ability to convert retailer barriers to entry into an entry barrier for
the manufacturer/supplier may be imperative for controlling prices and therefore the
profits available for these retailers. Margin support to retailers was the method used by
retailers for conversion of entry barriers. In the local markets the combination of market
focus strategies brought together the competitive advantages that emerge from small
retailer location and reputation effects and their linking with logistics.
For retailer outfits that wish to diversify across the retailing of a wide rangc of
domestic electrical goods it has also been demonstrated how diversification into related
products might be a successful value creating strategy. In this case it was highlighted that
the surplus capacity of a specific resource could be put to bcttcr use if the type of
diversification can be identified. The combinations of the physical rcsourcc (outicts),
intangible resource (exclusivity arrangements), financial resource (paymcnt facility)
together with marketing skills (promotions) were responsible for sustaining compctitivc
advantage in the retail channel for white goods. The type of divcrsification was rclatcd
189

Chapter Six Disciasion
and this study demonstrated that the current market leaders divcrsiricd into white goods
from brown goods. Furthermore it was also observed that for exclusive arrangcrncnt i. c.
the power to arrange product access, and the power to set up a payment facility required
retail branding. For the larger retailers the ability to enhance retail branding by means or
non-product activities is important for countervailing the selling power of supplier brands
and also for setting ax ante limits to competition
However the downside to related diversification needs consideration. The firms
current core competencies in the product channel facilitated by its shared resources and
capabilities may have an impact on current cfficicncy levels. The measurement and the
maintenance of efficiency levels expose the limitations of this analysis in respect of the
focus on the retail channel as opposed to a firm level analysis. It was previously stated
that some retailer's trade in both white and brown goods. The major issues may relate to
activities connected with order processing and coramunication, material handling and
warehousing, inventory management and transportation. For example white goods are
bulky items whereas brown goods are smaller and therefore may require the application
of different storing and handling techniques. The same applies to delivery systems too
and as a consequence diversifying into related products may require additional training
and control systems. The cost of setting up individual control systems for each retail
channel may be expensive and the allocation of resource and capability costs may also be
difficult and counter-productive. On the other hand a firm-levcl. analysis may use
performance measures based on weighted averages. A similar approach may be
undertaken in the retail channel but its usefulness may depend on the magnitude of the
icaming benefits and how easily resource and capability costs can be allocated to each
retail channel.
190

Chapicr Sbc Discussion
The issues may also concern the after sales care for white and brown goods. At
present it appears that a large proportion of repair works and after sales services for white
goods were carried out by established manufacturcrs/supplicrs. Sonic retailers
subcontracted the repair and service work to local experts. Dixons however uses
Afastcrcare Ltd its servicing subsidiary for repairs and after sales service for products
supplied by its stores. The after sales care services for brown goods arc mainly the
responsibility of the retailers. What this means is apart from having access to related
products firms wishing to diversify into related products must also have in place rcliablc
warehousing, delivery and after sales care systems if they were to succeed.
The mix of instruments that maximiscs profits and / or market shares for the
retailer should therefore vary from market to market for example, markets with the
greatest dispersion of time have the greatest variation in opportunity cost of time (Winter,
1993). The optimal mix of competitive instruments for example price and services the
retailers select must be aimed at attracting the consumers into the market and away from
the other retailers. Moreover in this study the time cost of obtaining the product was not
important in national markets and was significant in local markets. This indicating that in
national markets for example the provision of credit facilities, warranty insurance and
after sales services together with pride competition may be of significance. The
competitive effects stemming from the application of a mix of instruments may have an
impact on performance measures. This means setting performance targets for each market
may be appropriate for those retailers competing on a local and/or national basis.
For retail management experiencing strategic advantagestdisadvantages, it is
important to understand how to address the problem connected with value maximisation.
It was previously stated that capacity utilisation is closely related to scale and is both a
cost and value driver (Stabell and Fjeldstat, 1998). Based on the capacity available to the
191

Chapter SU Discussion
firm, management can influence both scale and service value maximisation. The
cffliciency and cffectivcncss of value maximisation strategies for scale and scrviccs which
is the intended strategy can be tested by setting rcalisablc standards on priccs, volumes
and mix of appliances that is offered to consumers. I'lic variance analysis between the
intended and the realised strategies could point to both dclibcratc/cmcrging stratcgics that
are required to reach finn objectives (Mintzbcrg et aL, 1998). An approach to finding the
differences in the intended and realised strategies as stated earlier is to compute variance
analysis on profit margins of product portfolios in terms of prices, volumes, and the mix
of products (Wilson and Chua, 1994). This is an important tool that is available to retailer
management and it is imperative that the retailer management information systcms
provide this information as a daily routine.
6.4.2 Manufacturer / Supplier strategies
The knowledge of linking and ranking resources and capabilitics to compctitivc
advantage can help firms to leverage existing resource positions into supcrior future
positions (Winter, 1994; Dierickx and Cool, 1989). The ranking of valuable rcsourccs and
capabilities may be of importance to both manufacturcr/supplicr and retailers. For
example the knowledge of key retailer resources and capabilities may be useful for the
manufacturer/supplier for determining effective vertical restraints for appropriate markets
in order to bring dealer interests into line with their own as national restraints arc unlikely
to be totally effective. The benefits of using such an approach would be to manipulate
externalities for example retailer independence cffccts, retailer (intrabrand) competitive
cffects, dealer free riding effects and retailer location effects so that value maximisation
can take into consideration retailer power in local markets. Dobson and Watcrson (1996)
192

Chapter Six Discussion
explain that there are a number of empirical studies that show retail prices are positively
related to local retailing concentration levels.
Moreover the results of this study suggests that that the manufacturcr/supplicr
must promote brand loyalty at the national level. The provision of support scrviccs for
larger retailers who carry other brands should be selective and relate to the respcctivc
location effects as retailers may use activities relating to retail branding to countcrvail the
selling power of supplier brands. However if the manufacturers/supplicrs can provide
delivery and after sales care services on a national level an opportunity may present itself
to exploit multiple economies of scale/scope triggered by servicing multiproducts. In this
study it was also revealed that economics of scale/scope were present in local markets for
the retailers. Hence a national and / or local network of delivery and aftercarc systems
may be sources of competitive advantage for the manufacturcrs/suppliers and may be
used to countervail some of the selling power of retail branding in the retail channel.
The small retailer appears to attract customers from the location effects and their
reputation in local markets. It was also demonstrated that the listing of popular supplier
brands was also important to the small retailer. This means that the supplier branding was
important to the smaller retailers of this retail channel. Suppliers must give due
consideration to trading with small retailers as it was demonstrated that larger retailers
attract customers from non-product activities that related to retail branding and that the
small retailer did not. Dealing with a large number of small retailers may have the
advantages of preventing for example free riding, maintenance of product quality,
switching to rival brands and the protection of manufacturers property rights in product
innovation and design (Marvel, 1982; Steuer, 1983; and Ornstein, 1989). Providing more
support for the small retailer could be a small expense compared to those provided for the
large retailer as indicated in this study for example margin support. The suppliers on the
193

Chapter Six Discussion
other hand must balance these benefits against the extra administration and transportation
costs that could be incurred in the process.
This study has already demonstrated how inferior retailer resources (small
retailers) survive against superior retailer resources (larger retailers). This study also
revealed that a large proportion of supplies to this retail channel was imported. The largcr
retailers had the resources to import but may be clocking in transportation costs both
inward and outwards whereas the transportation costs for the small retailer mayjust be on
the outward journeys to the consumer. It was also demonstrated that the smallcr retailer
gained competitive advantage from logistics and the effect of transportation cost on the
minimum efficient scale although not known at present may be of significance in the
retail channel for white goods. However the minimum efficient scale without
transportation costs are nonnally higher than it would be if transportation costs were
included. Long - term transportation costs may be expected to increase if the retailer
capacity was to increase. On the other hand the smaller retailer transportation costs may
be lower and the product costs higher due to the lack of purchasing power. However the
small retailers total costs may not be substantially higher than that of the larger retailers.
Hence this may be another reason how the smaller retailers co exists with giants and why
the collective power of small retailer resources could control the magnitude of the
economies of scale that is available for exploitation despite the view that minimum
efficient scale is a barrier to entry. Therefore the supplier strategy to increase the
transportation costs incurred in supplying to more small retailers may have the cffect of
reducing the retailer minimum efficient scale prevalent in the retail channel. Moreover
this strategy could result in bringing in new retailers to the channel and also better
rnargins for the suppliers.
194

Chapter SU Discussion
Nevertheless the smaller retailers transportation costs may be lower whilst tile
larger retailer importing large quantities of goods may be benefiting from quantity
discounts on haulage. Furtherniore it was noted in the industry analysis chapter that the
largest retailer had 19 warehouses and the other leading players had 8 warehouses
between them and controlled their own delivery systems. The smaller retailers
replenished stock as and when and depcnded on supplier delivery systems for delivery of
products into their stores. The diversification strategy of manufacturcr/supplicr into
delivery and after sales care systems may be subject to competition from haulicrs and
other finns already set up for these purposes. However the question that needs to bc
answered relates to which system is better? An in house system or sub contracting.
The advantage of using a haulier may reflect on cheaper cost of delivery and the
disadvantage display loss of control through product damage due to the nature of
packaging. In most cases the responsibility for damage falls on the manufacturer /
supplier as the damaged product is only exposed on delivery to customer homes aflcr it
has been handled a few times. Therefore the larger retailers whilst enjoying the benefits
of lower product costs are also able to avoid product damage costs incurred by their
delivery systems. Earlier sections indicated that the larger retailers had warehousing
facilities and furthermore the suppliers margin support influenced the conversion of
retailer's barrier to entry into a supplier's barrier to entry. A similar process is
experienced in this case and the conversion into a supplier barrier to entry is influenced
this time by the supplier's nature of packaging. The dual benefits enjoyed by the retailers
especially the retailer ability to transfer product damage costs to the supplier further
enhances retailer power and directs attention to the nature of packaging of supplier
products.
195

Chapter Six Discussion
In the absence of wholesale prices in this retail channel there is also the scope for
the suppliers to earn better margins. It was also stated earlier that the proportion of
supplies to buying groups was very small and there may be scope for growth in this
particular area. Moreover the research on grocery markets divulged retailing as most
concentrated in the UK with the buyer group share being equal to the rctailcr share.
Whereas in other countries in Europe the buyer share was significantly more concentrated
than the retailer share. Furthermore it was also stated that UK retailers simultaneously
enjoy selling power and buying power and may primarily explain why UK supermarket
chains are so highly priced and profitable to European average (Dobson and Watcrson,
1999). The presence of powerful buyer groups may on the other hand restrain otherwise
powerful sellers.
6.4.3 Regulator
One of the conclusions of the 1969 MMC report on RRPs (recommended retail
prices) was that the recommendations of resale prices, in conjunction with factors such as
restriction of outlets and monopoly in the supply industry, might prevent price
competition in retailing (MMC 1997, Vol. 1 pp. 49). Moreover it has already been
suggested that retail developers and community planners should concentrate on providing
a mix of stores rather than an agglomeration of stores (Miller et A, 1999).
In this study an attempt has been made to demonstrate that in most areas of
retailing in the UK may be imperfectly competitive and as a result there appears to be
benefits of lower prices for the consumers. On the other hand the current retail structure
may provide lower prices which in turn could have the effect of reducing the consumers
purchasing cycle from an average four years to two years and thereby increasing
196

Chapter Six Discussion
consumer spending. Against these benefits there are the effects of inflation and rccycling
issues to consider.
Furthermore in this study it was explained earlier that the inclusion of all outlets
irrespective of its scale or saturation detected some of the variation between the smaller
retailers too. However, despite the advantages of location and size of outlets of larger
multiples, under the existing retail structure the collective power of the smaller rctailer
outlets supported by the suppliers may appear to indirectly balance the extent of the
benefits of economies of scale available to the larger retailers. On the other hand the
insignificance of stock turns in both surveys seem to suggest that products are close
substitutes and may also support 'symbiosis' in this retail channel i. e. retailers have
mutual beneficial effects on each other.
It was also stated earlier that the total number and the mix of outlets used by
multiples that specialised in white goods were 1478 in number and the outlets belonging
to small retailers amounted to about 5100 (Table 2.1). Hence the strategy of the larger
retailer to locate into retail parks may be to exploit further the advantages of economics of
scale/scope and thereby to weaken this collective power of the smaller retailers.
Therefore, with the existence of possible traces of imperfect competition in this retail
channel, it is questionable whether the 1969 MMC ruling on restrictions on outlets as one
of the component preventing price competition in the UK still hold?
6.4.4 Other competitive models
Competitive models such as SCP are important in isolating competition applicable
to a particular industry condition. Likewise, both SWOT analysis and value chain analysis
explains how value of the firm can be enhanced. The extended RBV on the other hand,
explains how and why a particular resource is more valuable than other resources and
197

Chapter Six Discussion
directs attention to strategic investments in internal activities that could set ex atiti limits
to future competition. Furthermore the linking and ranking of resources and capabilities
to competitive advantages produce better explanations at present as to how competitive
advantages can be sustained over a period of time. Coincidentally, in the recent past many
theorists have assessed the impact the diffusion of RBV has had upon the field of strategy
and cognate business activities and are very enthusiastic with the prospects of furthcring
their interests with RBV.
6.5 Limitations
This study has focused on resources as an unit of analysis in the retail channel as
opposed to a firm level analysis and has several limitations. The structure - conduct -
performance paradigm suggests that firm's performance is the result of competitive
interaction. The conduct of firms is determined by the structure of the industry, which
identifies a set of industry conditions that impact on the behaviour and pcrformance of
firms. The RBV on the other hand suggests that the industries structural features are the
result of the organisational capabilities of its constituent firms, which have accumulated
over time (Cockburn et al., 2000). Hence in this study it is assumed that the retail
structures features that exist for the retail channel are similar to those in industries
structural features and that the RBV could be applied to both structures. Furthermore only
the conditions of value, rarity, inimitability and insubstitutability are considered for a
resource to be a source of competitive advantage. In this study the use of resource as an
unit of analysis also exposes the limitations regarding the allocation of costs and
efficiency measures when resources and capabilities are shared in related diversification.
For links between resources and the type of diversification just three resources i. e.
physical, intangible and financial resources were considered with the knowledge that
198

Chapter Six Discussion
there could be other resources that could contribute to competitive advantages from
related diversification. Furthermore for retailers wishing to extend the range of goods
sold beyond white electrical goods i. e. unrelated diversification this analysis has
identified how ex ante limits to competition could be set in this channel from the use of
financial resources. Once again there could be other resources or resource combinations
that can do the same job.
The survey was conducted at one point in time using cross scctional data that
relates to a static resource base logic. This was considered as a useful starting point in the
absence of longitudinal data. The data for the study was collected from single respondents
namely either a purchasing director or the managing director of their respective firms.
Collecting data from two informants within the same firm had been considered but was
found to be impractical, especially as the white goods industry had undergone
investigations from the regulators recently.
Similar reasons apply to some important variables not considered in this study
especially the firm profitability, as it may have been an ideal measure for competitive
advantages. The limitations attached to using market share as a proxy for competitive
advantage was discussed in section 4.4.1. There may be other variables of importance for
example free/ extended warranties, after sales services that may account for variation
between firms in this retail channel. The measuring problem attached to these variables is
a reason why they were not considered.
The approach used in this study may also have generalisability limitations as it
applied mainly to the retail channel for white goods. However, the use of white goods as a
single trade line is consistent with previous research (Ingene & Brown 1987; Miller et aL,
1999), and its uses have been highlighted in this study.
199

Chapter SLx Discussion
Every effort was made to design a model that facilitated not only the gcncralising
of relationships but also a process for testing competitive advantages in local/national
markets. It is also acknowledged that the dynamics of diffusion employed to extricate the
effects simultaneously in a functional format may also be subject to more questions than
the answers. The model used in this study has at-Icast facilitated the use of spccific
strategies relating to competitive advantages that resulted from retailer competition.
Two sets of results were used for analysis. One set had hctcroskcdastic consistcnt
standard errors whilst the other did not. However in this study the moderate violations of
parametric assumptions seems to have had little effect on substantive conclusions (Cohen,
1969). It is now quite common to report such results, although not so much in
management and the preference is for hetroskedastic consistent crrors.
It is also assumed that managerial behaviour patterns are the same for both white
and brown goods sold from some retailer outlets. The responsibility for example, for after
sales services is sub contracted by retailers of white goods to manufacturers and/or
specialist firms. On the other hand, after sales services for brown goods is the
responsibility of the retailers whilst some large retailers provided after sales services for
both white and brown goods. Once again extracting after sales costs for white goods from
consolidated accounts was a problem.
Although there could be slight differences in the various strategies used by the
retailers, it was assumed that there would be no major differences in their management of
both social constraints and normative rationality as these are sources of competitive
advantage (Oliver, 1997). Then again, managers of some firms may have had the
opportunity to enhance their management skills through experiences gained from dealing
with a customer base with different needs which may then result in cffcctive management
of both social constraints and normative rationality.
200

Chapter Six Discussion
Some small retailers included in the survey traded in both white and brown goods
and were also selling other small domestic appliances of low value. These values may
have been included in the turnover figures requested in the questionnaire. The small
retailer tumover was so small, compared to the total domestic appliances market, their
inclusion was considered to be insignificant.
6.6 Future use of model
The model used in this survey is imperfect, but it does have some uscs. Resource,
capability ambiguities have prevailed for a long time but this demonstration may be a stcp
forward in at-least reducing ambiguities in order to establish finn identity and its strategy
frameworks which maximises firm uniqueness. An insight to this study and the
performance of the model for future uses are demonstrated below by addressing some of
the issues raised in the MMC investigations.
Lexecon Ltd (MMC 1997, Vol. 11 pp. 138,139) who defended a major supplier
raised several issues relating to MMC decision on the two complex monopoly situations.
One of the issues related to the failure of the MAX to demonstrate the link betwccn price
variability and competitivencss.
The link between price variability and competitiveness can be demonstrated by
including a price influence variable (competitor behaviour variable) in the equation used
in this study. A dichotomous (dummy) variable testing for price influence worded as 'do
you use suppliers RRPs (yes or no) could provide either the significance or
insignificance and therefore the link. If links were evident a further analysis could take
place in more detail using a logistic regression approach. In their survey the AIAIC
examined the modal price charged for any given model (appliance), the proportion of
sales within a given percentage of the RRP and the covar (a measure based on the
201

Chapter Six Discussion
standard deviation of the distribution that summarises the spread of prices relative to the
mean) (MMC, 1997. Vol II pp. 117).
Le-xecon Ltd. also claimed that the MAX failed to consider non-pricc bcncfits such
as interest free credit, free delivery of appliances and free gifts. The inclusion of the
promotion variable demonstrated significance and establishes links to competitive
advantages. Likewise non-price benefits mentioned above could also be applied to the
white goods industry in a similar fashion.
202

Appendices
203

A pp i 'I It I/('( 's
30
20
10
0
r-) I-
0
Appell(lix -A
IIi stogram
Dependcilt Variable: Mar share
-2.00 -1.00 0.00 1.00 2.00 3.00 4.00 5.00
-1.50 -. 50 . 50 1.50 2.50 3.50 4.50 5.50
Regression Standardized ResidLial
204
Std. Dev = . 93
Mean = 0.00
N= 70.00
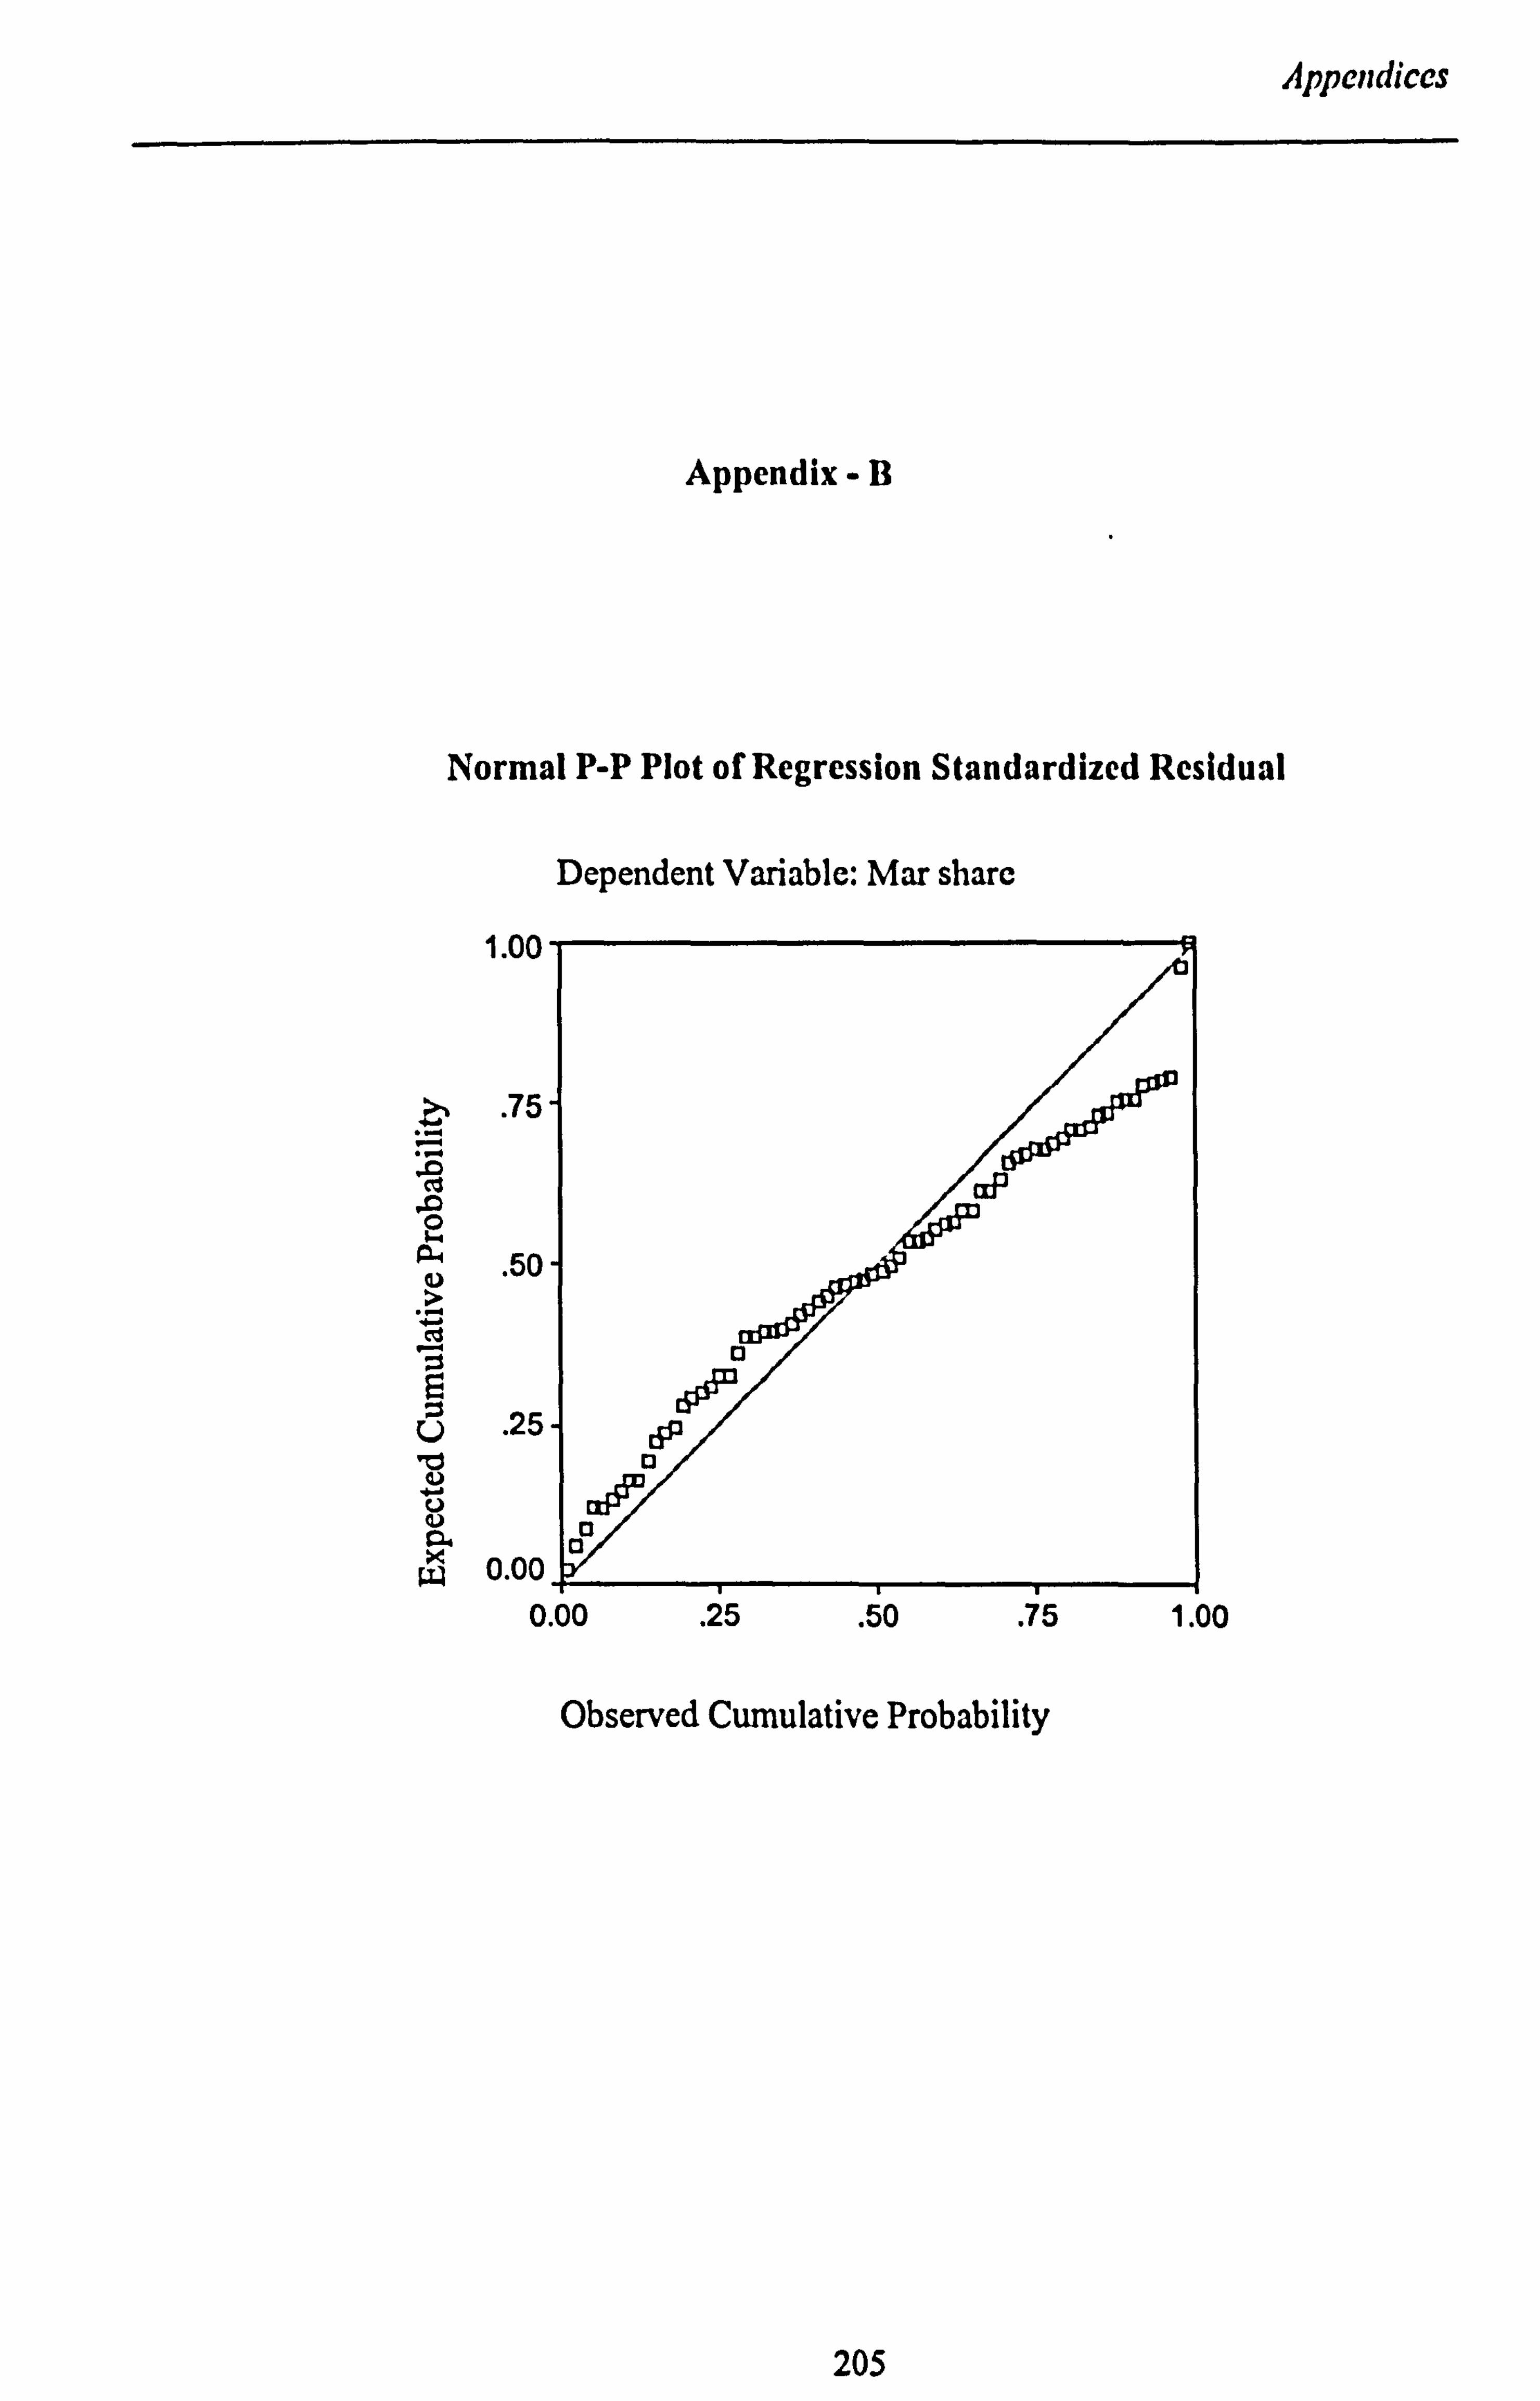
Appendices
Appendix -B
Normal P-P Plot of Regression Standardized Residual
Dependent Variable: Mar share
1.0
. 75-
-0
. 50-
U . 25- r
u
0.00
0.00 . 25 . 50 . 75
Observcd Cumulativc Probability
1.00
205

Appendices
ppendix -C
10
8
4
2 l=
0
-2
-4
Scatterplot
Dependent Variable: Market share
a
a
D Coo
13
-4 -2 0246
Regression Standardized Residual
206

Appendices
Appendix -D
14
12
10
8
6
4
2
Scatterplot
Dependent Variable: Market share
al
0
En D
0 13 0
a 13 M= 13 013MUSAStibM
-4 -2 0246
Regression Studentized Residual
207
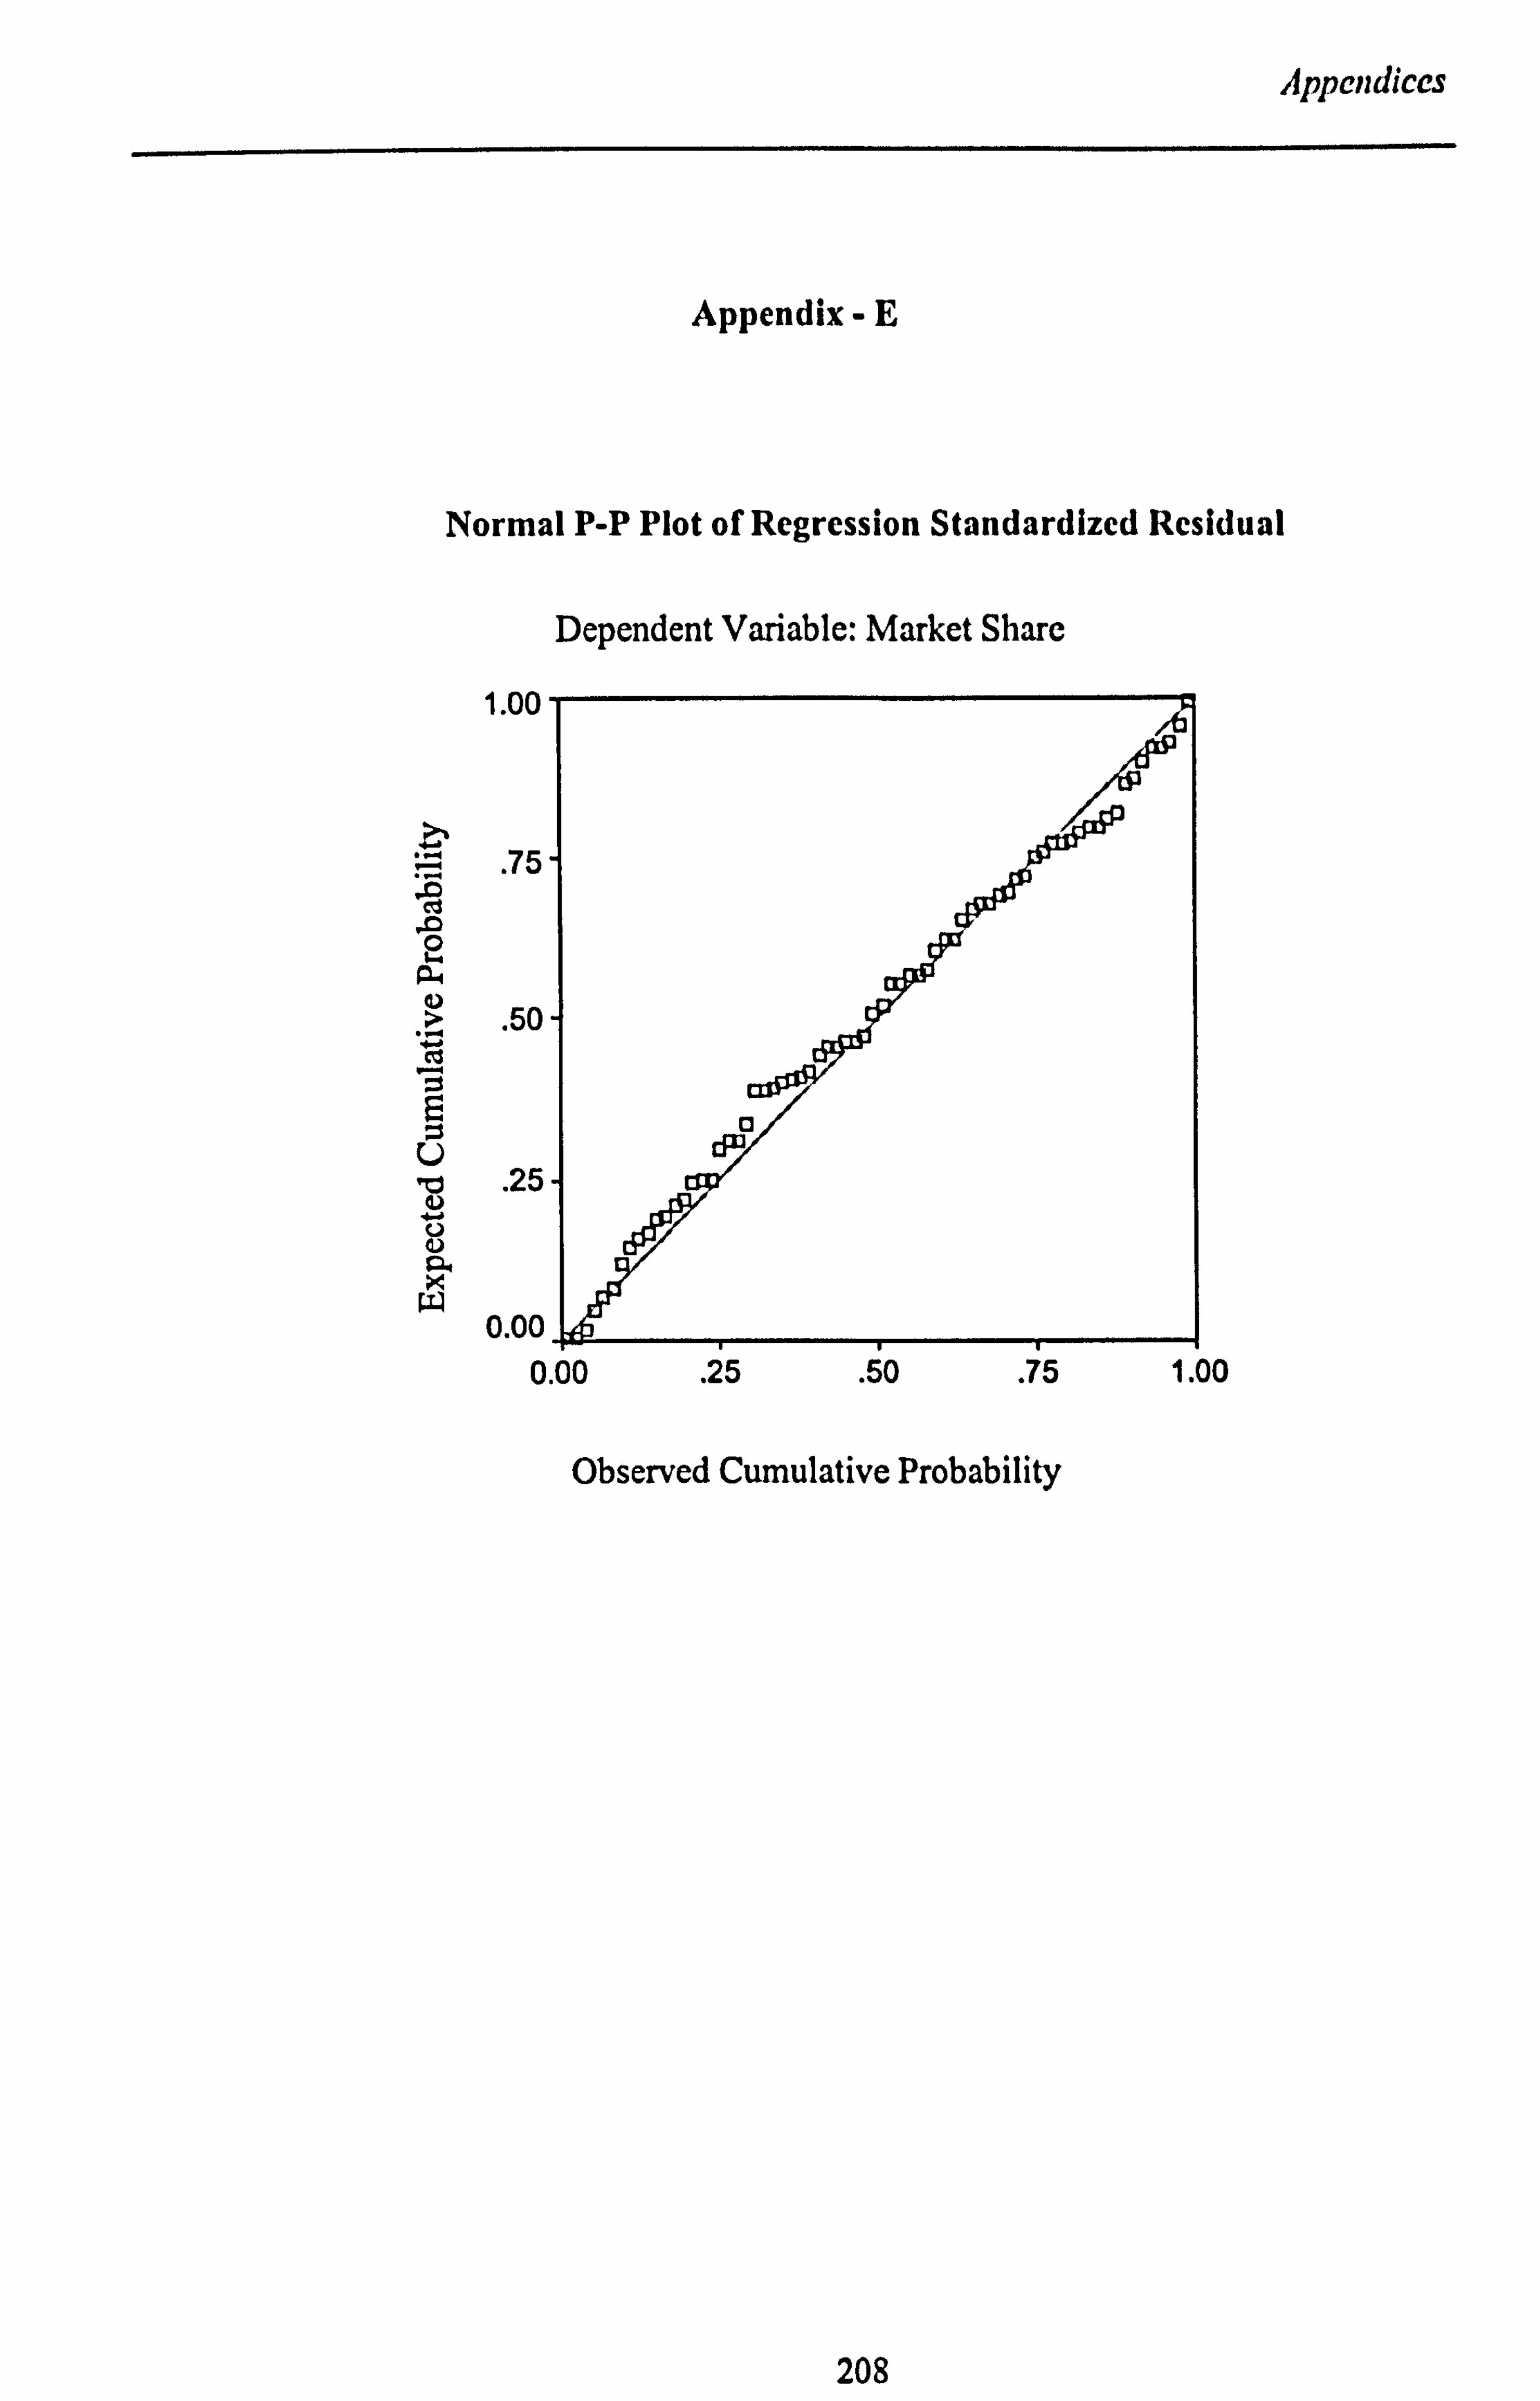
Appendices
Appendix -E
Normal P-P Plot of Regression Standardized Residual
Dependent Variable: Market Share
1.00
? hl . 75
-0 m .0 2
> . 50
10 . 25
0.00 0.00 . 25 . 50 . 75 1.00
Observed Cumulative Probability
208
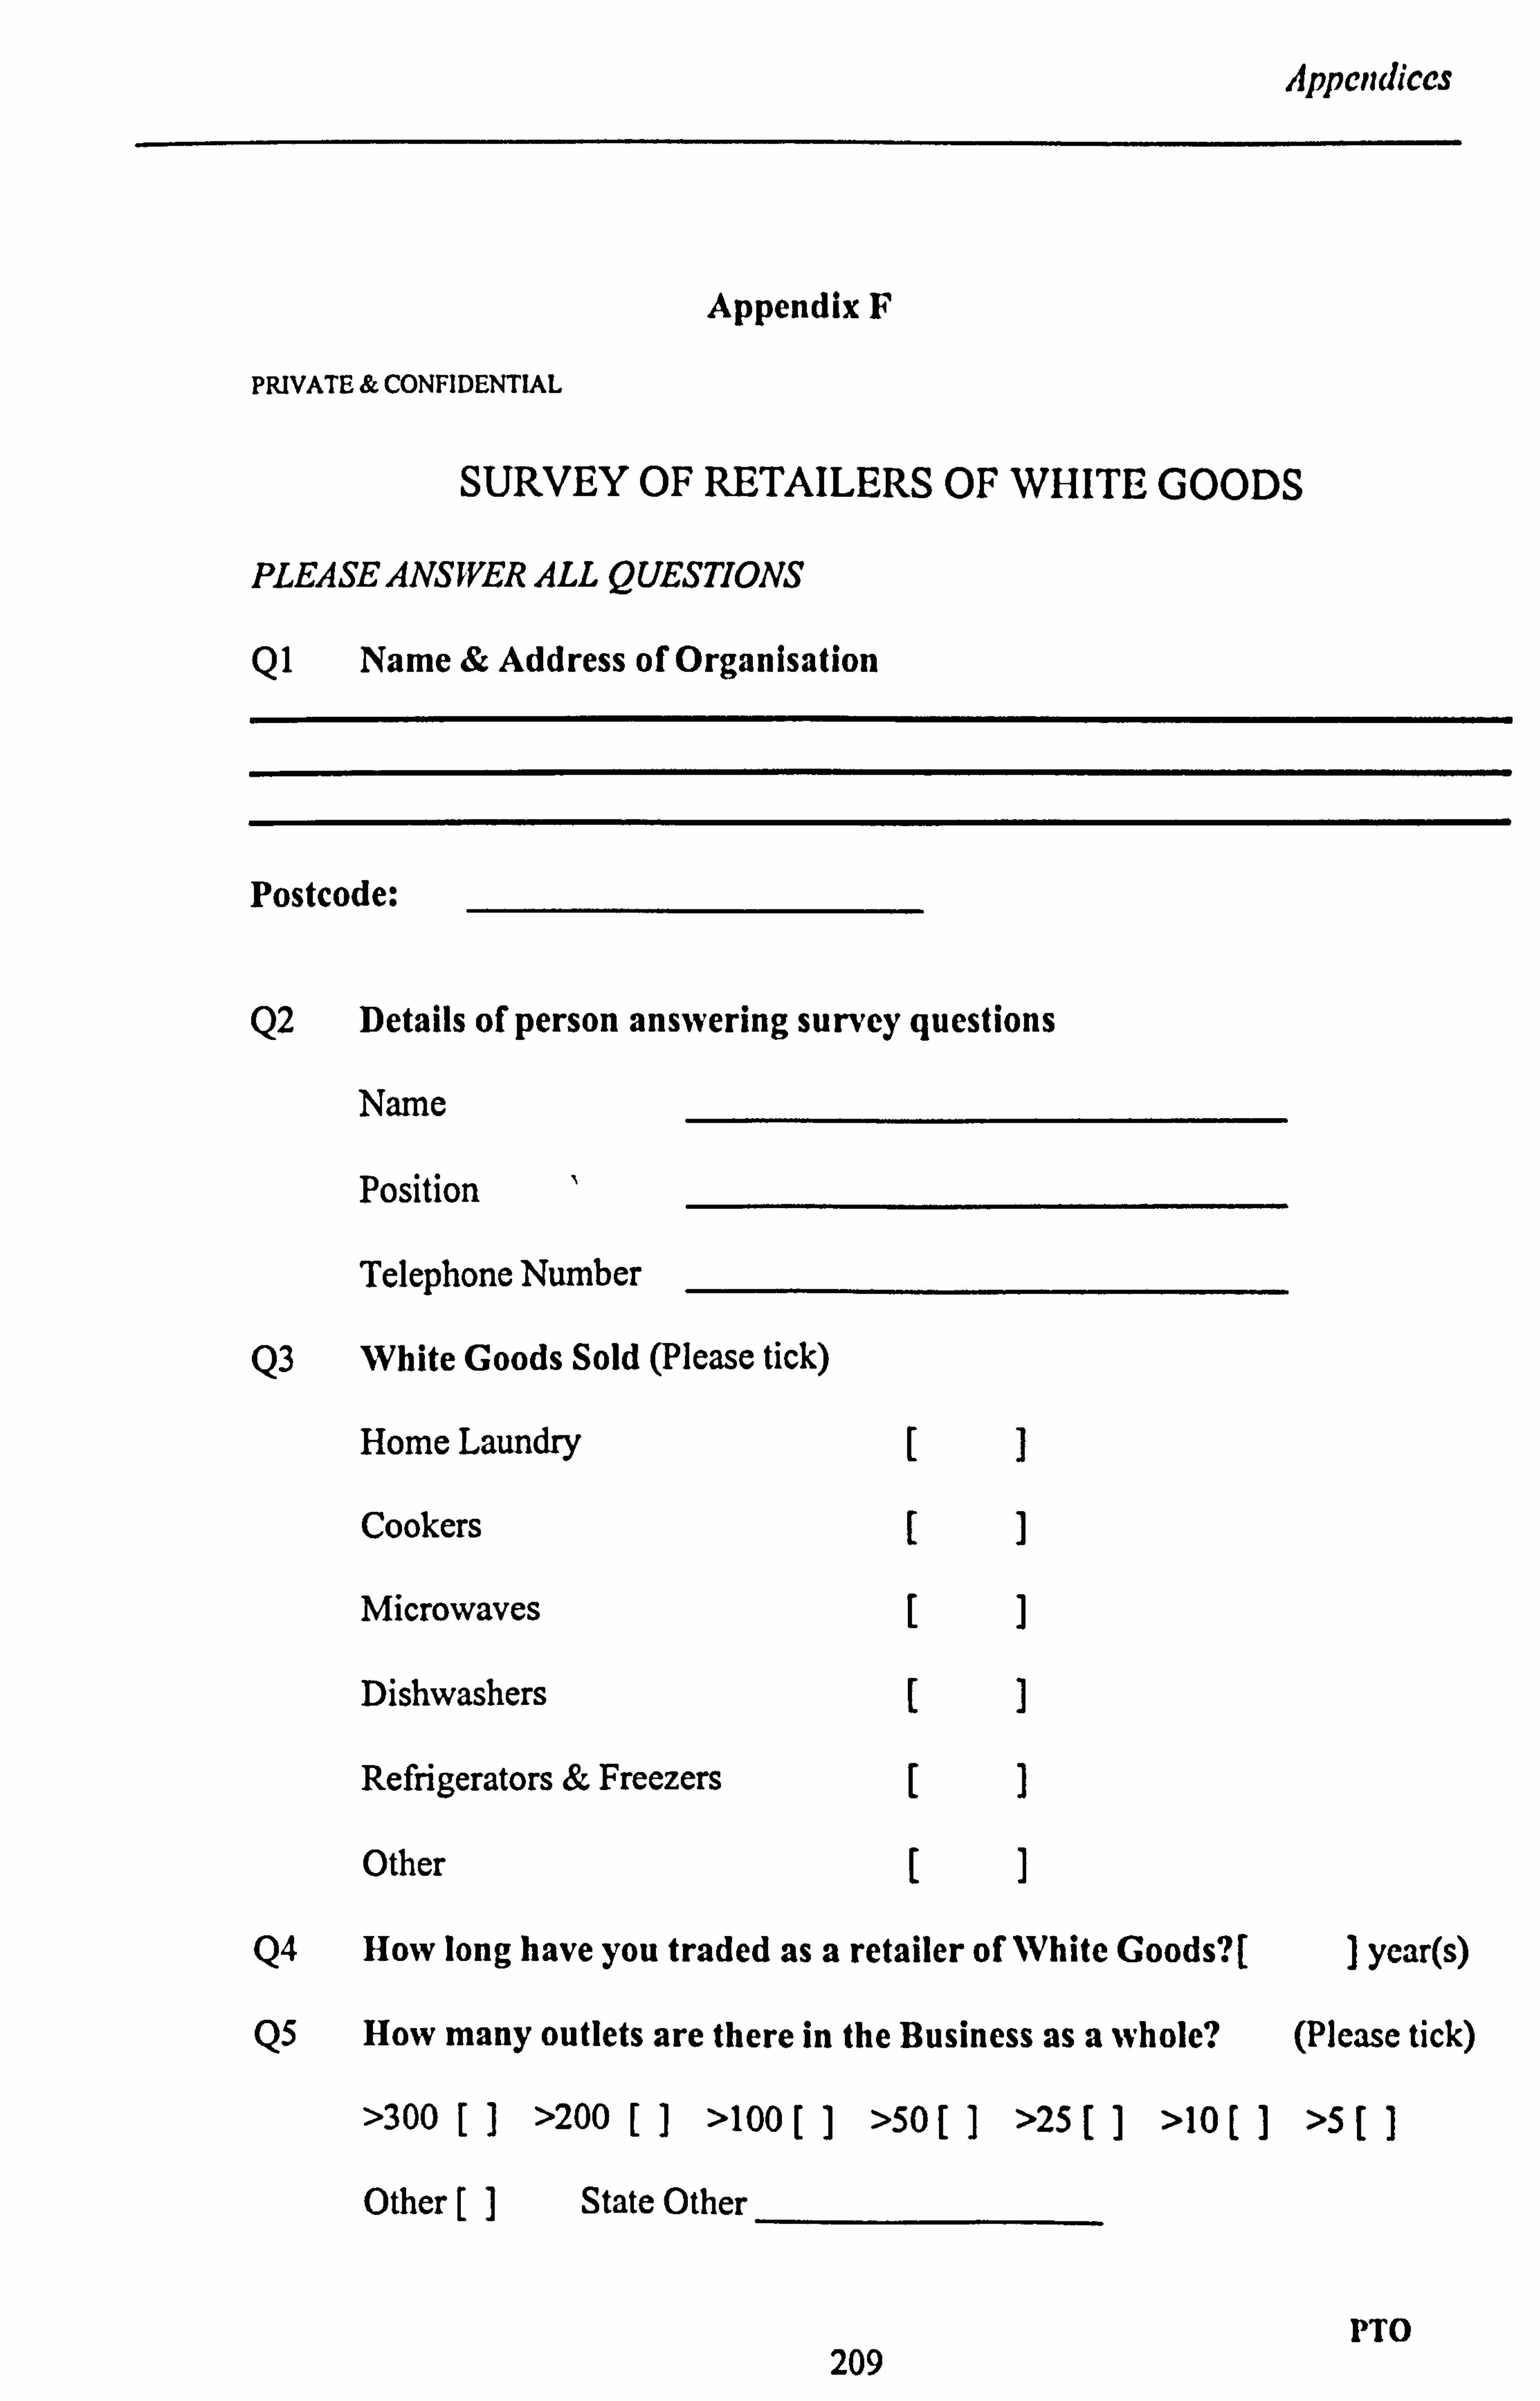
Appendices
PRIVATE & CONFIDENTIAL
Appendix F
SURVEY OF RETAILERS OF WHITE GOODS
PLEASEANSTPER ALL QUESTIONS
Ql Name & Address of Organisation
Postcode:
Q2
Q3
Details of person answering survey questions
Name
Position
Telephone Number
White Goods Sold (Please tick)
Home Laundry
Cookers
Microwaves
Dishwashers
Refrigerators & Freezers
Other
Q4 How long have you traded as a retailer of White Goods? [ year(s)
Q5 How many outlets are there in the Business as a whole? (Please tick)
>300 >200 [] >100 >50 >25 >10 >5
Other State Other
PTO 209

Appendices
Appendix F
PRIVATE & CONFIDENTIAL
Q6 How many brands of White Goods: -
a. Are currently listed in your Business? II
b. Does your Business have exclusive Distribution rights to? (Please include own Label Brands and Suppliers Brands)
Q7 For the year ending 1999/2000
a. What is your Sales Revenue per annum for White Goods? (please lick) (m-millions, k-thousands)
(E) >250m [] >150m [] >100m [] >50m [] >25m []
>lOm [1 >5m [1 >Im [1 >500k [] >100k []
Other[ ] State Other:
b. What proportion of your Sales Revenue Is on Promotional Credit? (Interest Free Credit and/or Buy Now Pay Latcr) II%
c. What proportion of your Sales Revenue is on Third Party Credit
Cards? I
Q8 What are the average days credit you receive from your suppliers of White Goods? (please tick)
0[] 30[] 60[] 90[ ] 180[ 1 Other[] StateOther
Q9 What is the frequency of your White Goods stock turnover? [] Number of times per year (value ofAnnual SaleslAveragc value ofStock- Held)
QIO What is the total time taken from Receipt of order for White Goods from Customer, to delivery of Appliances to Consumer? [] days
THA NK YO U FOR YO UR CO- OPERA TION
210

Bibliography
Bibliography
Albaurn, Gerald and Del 1. Hawkins (1983), 'Geographic Mobility and
Demographic and Socioeconomic Market Segmentation', Journal of the Acadciny of
Marketing Science, 11 (Winter/Spring), pp. 97-113.
Alvarez, S. and Busenitz, L. (2001). 'The entrepreneurship of rcsourcc-bascd
theory'. Journal ofManagement, 27, pp. 755-775.
Amit, R. and Schoemaker, P. J. (1993). "Strategic assets and organisational rcnt'.
Strategic Management Journal, 14, Vol. 1, pp. 33-46.
Babbie, E. (1990). Survey Research inethods (2 nd ed. ), Behnont, Wadsworth.
Barney, J. B. (1986). 'Strategic factor markets: Expectations, luck and business
strategy', Management Science, 3 1, pp. 1231-124 1.
Barney, J. B. (1991). 'Firm resources and sustained competitive advantage',
Journal ofManagement, 17, pp. 99-120.
Barney, J. B. (1992). 'Integrating organisational behaviour and strategy
fonnulation research: A resource based analysis', In Shrivastava, P., Huff, A. and Dutton,
J. (eds. ), Advances in Strategic Management, Vol. 8, JAI Prcss, Grecnwich, CT, pp. 39-
61.
Barney, J. B. (1994). 'Commentary: A hierarchy of corporate resources'. In
Shrivastava, P., Huff, A. and Dutton, J. (eds. ), Advances in Strategic Management, Vol.
8, JAI Press, Greenwich, CT, pp. 113-125.
Barney, J. B. and Zajac, E. J. (1994). 'Competitive organisational behaviour:
Toward an organisationally - based theory of competitive advantage. Strategic
Management Journal, Winter Special Issue, 15, pp. 5-9.
211

Bibliography
Barney, J. B. (2001). 'Resource-based theories of competitive advantage: A ten
year retrospective on the resource -based view', JournalofAfanagement, Vol. 27, pp. 643-
650.
Baum, J. A. C. and Oliver, C. (1991). 'Institutional linkages and organisational
morality', Administrative Science Quarterly, 36, pp. 187-218.
Baum, J. A. C. and Singh, J. (1994). 'Organizational Nichcs and the Dynamics of
Organizational Founding', Organization Science, 5 (4), pp. 483-501.
Beckcr, G. Human Capital, New York: Columbia, 1964.
Bcsanko, D., Dranove, D. and Shanicy, M. (2000). Economics of Strategy. (2"d
edn). Willey, New York.
Boulding, W., Lee, E (1994). Mastering the mix: Do advertising, promotion, and
sales force activities lead to differentiation? Jountal ofMarketing Research, Vol. 31 Issue
2, pp-159.
Bresnahan, T. Fand Reiss, P. C. (1991). 'Entry and Competition in Concentrated
Markets', Journal ofPolitical Economy, Vol-99, pp. 977-1009.
Bucklin, L. (1972). Competition and Evolution in the Distributive Trades.
Englewood Cliffs, NJ: Prentice Hall.
Buzzell, R., Gale, B. and Sultan, R. (1975). "Market Share: A Key to
Profitability', Harvard Business Review, January-February 1975: pp. 97-106.
Buzzell, R. and Gale, B. (1987). '77ze PIMS principle: Linking Strategy to
Performance', The Free Press.
Camey, M. and Gedajlovic, E. (1991). 'Vertical integration in franchise systems:
Agency theory and resource explanations', Strategic Management Journal, Vol. 12 (8).,
pp. 607-629.
212

Bibliography
Carroll, G. (1985). 'Concentration and Specialization: Dynamics of Niche Width
in Populations of Organizations', American Journal qfSociology, 90 (6), pp. 1262-83.
Caves, R. and Porter, M. (1977). 'From Entry Barriers to Mobility Barriers',
Quarterly Journal ofEconomics, 9 1, pp. 241-26 1.
Chakravarthy, B. S. (1982). 'Adaptation: A promising mctaphor for stratcgic
managcment'. Academy ofManagement Review, Vol. 7, No. 1, pp. 35-44.
Chattedee, S. and Wernerfelt, B. (1991). 'The link between resources and the type
of diversification: Theory and evidence'. Strategic Management Jountal, Vol. 12, pp. 33-
48.
Cockburn, I., Henderson, R. and Stem, S. (2000). 'Untangling the Origins of
Competitive Advantage', Strategic Management Jounial, Special Issue, Vol. 2 1, pp. 1123-
1145.
Cohen, J. (1969). Statistical power analysis for the behavioural sciences. NY:
Academic Press.
Combs, J. and Ketchen, J. (1999). 'Explaining Interfirm Co-opcration and
Performance: Toward a Reconciliation of Predictions from the Resource-based view and
Organizational Economics', Strategic Afatiageniew Jourtial, Vol. 20, pp. 867-8 8 8.
Comanor, W. S. and Frech 111, H. E. (1985), ' The Competitive Effects of Vertical
Agreements', Anierican Econondc Review, Vol. 75, pp. 539-546.
Conner, K. R. (199 1). 'A historical comparison of resource - based theory and five
schools of thought within industrial organisational economics: Do we have a new theory
of the finn? 'Jounial ofManagement, 17, pp. 121-154.
Cool, K. and Dierickx, 1. (1994). 'Commentary: Investments in strategic assets;
Industry and finn-level perspectives'. In Shrivastava, P., Huff, A. and Dutton, J. (cds. ),
Advances in Strategic Management, Vol. 8, JAI Press, Greenwich, CT, pp. 35-44.
213
Bibliography
Cresswell, J. (1994) Research Design: Qualitative and Quantitative Approaches,
Sage Publications, London
Cyert, R. and March, J. A Behavioural Aeory of the Firm, Prcnticc Hall,
Englcwood Cliffs, NJ, 1963.
Dierickx, I. and Cool, K. (1989). 'Asset stock accumulation and sustainability of
competitive advantage', Management Science, 35, pp-1504-1511.
Dobson, P. W. and Waterson, M. (1996). Vertical Restraints and Competitive
Policy. 82+vi pp, Research Paper 12, Office of Fair Trading, London.
Dobson, P. W. and Waterson, M. (1999). 'Retailer Power: Recent developments
and policy Implications', Economic Policy, 14(l), April 1999, pp 135-164, ISSN 0266-
4658.
Dunne, P and Lusch, R. (1999), Retailing, (3d cd. ). Fort Worth, TX: The Dryden
Press.
East, R. Lomax, W. Willson, G. and Harris, P. (1994). 'Decision Making and
Habit in Shopping Times', European Journal ofMarketing, 28 (4), pp. 56-71.
Eisenhardt, K. and Martin, J. (2000). 'Dynamic Capabilities: What Arc They?,
Strategic Management Journal, Special Issue, Vol. 2 1, pp. 1105-112 1.
Fowler, F. (1988). Survey research methods. Newbury Park, CA: Sage.
Ghemawat, P. (Sept-Oct 1986). 'Sustainable advantage', Hanard Business
Review, pp. 53-58.
Ghosh, A., and McLafferty, S (1984), 'A model of Consumer Propensity for
Multipurpose Shopping, Geographical Analysis, 16,244-249
Ghosh, A. (1986), 'The Value of a Mall and Other Insights from a Revised
Central Place Model, Journal ofRetailing, 62 (spring), pp. 79-97.
214

Bibliography
Ginsberg, A. (1994). 'Minding the competition: From mapping to mastcry',
Strategic Management Journal, Winter Special Issue, IS, pp. 153-174.
Grant, R. M. (1991). 'The Resource-Based Theory of Competitive Advantage:
implications for Strategy Formulation'. California Afanagenient Review, pp. 119-145.
GfK Marketing Services Ltd. (GfK)
Gray, B. and Wood, D. J. (1991). 'Collaborative alliances: Moving from practice
to theory', Journal ofApplied Behavioural Science, Vol. 27 (1), pp. 3-22.
Gujarati, D. (1995). Basic Econometrics, (3 rd cdn). McGraw-Hill Inc: New York.
Hair, J., Anderson, R., Tatham., R. and Black, W. (1998). 'Afultivariate Data
Analysis', (5th edn), Prentice-Hall, U. S. A.
Hannan, M. and Freeman, J. (1989), Organizational Ecology. Harvard University
Press. Cambridge, MA.
Hansen, G. and Wernerfelt, B. (1989) 'Determinants of Fin-n Pcrfon-nancc: The
Relative Importance of Economic and Organizational Factors', Strategic Management
Jounial, Vol. 10, pp. 399-411.
Henderson, B. (1983). 'The anatomy of Competition', Jounial of Marketing,
Vol. 2, pp. 7-1 1.
Hirschman, E. (1978). 'A Descriptive Theory of Retail Market Structure', Jounial
ofRetailing', 54 (Winter), pp. 20-34.
Hirschman, E. (1979). 'Intratype Competition Among Department Stores',
Journal ofRetailing, 55 (Winter), pp. 20-34.
Hirshliefer, J. (1980). Price theory and applications (2 nd ed. ). Englewood Cliffs,
NJ: Prentice- Hall.
Hofer, C. and Schendel, D. (1977) 'Strategicformulation: Analytical concepts', St
Paul, MN: West.
215

Bibliography
Hotelling, H. (1929). 'Stability in Competition', Economic Journal, 39 (March),
pp. 41-57.
Hunt, M. (1972). Competition in the Major Home Appliance Industry, 1960-1970.
Unpublished doctoral dissertation, Harvard University.
Ingene, C. (1982). 'Labour Productivity in Rctailing', Jounial of Afark-cling, 46
(Fall), pp. 75-90.
Ingene, C. (1983). 'Intertype Competition: Restaurants Versus Grocery Stores',
Journal ofRetailing, 59 (Fall), pp. 49-75.
Ingene, C and Brown, J. (1987). 'The Structure of Gasoline Retailing', Jounial of
Retailing, 63 (Winter), pp. 365-392.
Jaccard, J. and Choi K. Wan. (1996). LISREL approaches to interaction effects in
multiple regression. Thousand Oaks, CA: Sage Publications.
Jepperson, R. L. and Meyer. J. W. (1991). 'The public order and the construction of
formal organisations'. In Powell, W. W. and DiMaggio, P. J. (eds. ), 77ie New
Institutionalism in Organisational Analysis. University of Chicago Press, Chicago, IL,
pp. 204-23 1.
Kadane, B. and Larkey, P. (1982), 'Subjective Probability and the Theory of
Games', Management Science Journal, Vol. 28, pp. 1 13-120.
Karim, S. and Mitchell, W. (2000) 'Path-Dcpendant and Path Breaking Change:
Reconfiguring Business Resources Following Acquistions in the U. S. Medical Sector,
1978-1995 ', Strategic Management Jounial, Special Issue, Vol. 2 1, pp. 1061-108 1.
Karnani, A. (1984) 'Generic competitive strategies - an analytical approach',
Strategic Management Journal, 5, VoIA pp. 367-280
Key Note Ltd, (1997). Report on Household appliances (lPhite Goods).
216

Bibliography
Klepper, S. and Simons, K. (2000) 'Dominance by Birthright: Entry of Prior
Radio Producers and Competitive Ramifications in the U. S. Tclevision Rcccivcr
Industry', Strategic Management Journal, Special Issue, Vol. 2 1, pp. 997-1016.
Kotlcr, P. and Armstrong, G. (1996), Principle ofAfark-eling, (& cd. ), Englcwood
Cliffs, NJ: Prentice Ha .
Lafontaine, F. (1992). 'Agency theory and franchising: Some cmpirical results',
RAND Journal ofEconomics, Vol. 23. pp. 263-283.
Lcvy, M. and Wcitz, B. (1998). Retailing Management (3rd. cd), Boston, Invin
and McGraw-Hill.
Lockett, A. and Thompson, S. (2001). The rcsource-based view and economics,
Journal ofManagement, Vol. 27, pp. 723-754.
Mahoney, J. T. and Pandian, J. R. (1992). 'The resource - based view within the
conversation of strategic management', Strategic inanagenient Journal, 13(5), pp. 363-
380.
Marvel, H. P. (1982). 'Exclusive Dealing', Journal ofLaiv and Economics, Vol. 25,
pp. 1-25.
Mason, B. Mayer, M. and Wilkinson, J. (1993). Modem Retailing: Yheory and
Practice, (6h ed). Homewood, IL: Richard Irwin.
Mathewson, G. F. and Winter, R. A. (1987), ' The Competitive effects of Vertical
Agreements: Comment', American Economic Review, Vol. 77, pp. 1057-1062.
Mayer, B. M. and Wilkinson, M. J. (1993), Modern Retailing: 71cory wid Practice,
(6'h ed. ), Homewood, IL: Richard D. Irwin.
McGahan, A. M. and Porter, M. E. (1997). 'How much does industry matter
reallyT Strategic Management Journal, Vol. 18, pp. 15-30.
217

Bibliography
Mcycr, J. W. and Rowan, B. (1977). 'Institutional organisations: Formal structurc
as myth and ceremony', American Journal qfSociology, 80, pp. 340-363.
Miller, C. E., Reardon, J. and McCorkle, D. E. (1999). The cffccts of compctition on
retail structure: An examination of Intratype, Intcrtype, and Intcrcatcgory competition.
Journal ofMarketing, 63, pp. 107-120.
Mintzberg, H., AhIstrand, B. and Lampel, J (1998). Strategy safari. Prcnticc Hal I
Europe, Hertfordshire, U. K.
Montgomery, C. A. and Werrierfelt, B. (1988). 'Diversification, Ricardian rcnts,
and Tobin's q',, Rand Journal ofEcononzics, 19, pp. 623-632.
Monopolies and Mergers Commission. (1997), Vol. 1, 'Dot? icsfic clectrical goods:
11'. The Stationery Office Limited, U. K.
Monopolies and Mergers Commission. (1997), Vol. 1l, ' Domestic electrical
goods: 11'. The Stationery Office Limited, U. K.
Oliver, C. (1997). 'Sustainable competitive advantage: Combining institutional and
resource based views', Strategic Management Jounial, Vol. 18(9), pp. 697-713.
Oliver, C. (1988). 'The collective strategy framework: An application to
competing predictions of isomorphism'. Adniinistralive Scietice Quarterly, 33, pp. 543-
561.
Oliver, G. (1990). Marketing Today, (Yd edn). Prentice Hall, Cambridge, U. K.
Ornstein, S. I. (1989), ' Exclusive Dealing and Antitrust', Antitrust Bulletin, Vol.
34, pp. 65-98.
Penrose, E. T. (1959). The Yheory ofthe Growth ofthe Firm. Wiley, New York.
Peteraf, M. A. (1993). 'The cornerstones of competitive advantage: A resource -
based view', Strategic Management Jounial, 14(3), pp. 179-19 1.
218

Bibliography
Porter, M. E. (1976). Interbrand Choice, Strategy, and Bilateral Market Power,
Harvard University Press: Cambridge, MA.
Porter, M. E. (1980). Competitive Strategy. Free Press, New York.
Porter, M. E. (1985). Competitive Advantage. Free Prcss, Ncw York.
Porter, M. E. (1990). 77te Competitive Advantage of Nations, Free Press, Ncw
York.
Priem, R. and Butler, J. (2001). 'Tautology in the Rcsourcc-Bascd View and the
implications of Externally Determined Resource Value: Further Comments', Ybe
Academy ofManagement Review, Vol. 26, No. 1, pp. 57-66.
Rao, H. (1994). 'The social construction of reputation: Certification contests,
legitimation, and the survival of organisations in the American automobile industry'.
1895-1912' , Strategic Management Journal, Winter Special Issue, 15, pp. 88-102.
Rosenbloom, R. (2000). 'Leadership, Capabilities, and Technological Change:
The Transformation of NCR in the Electronic Era', Strategic Management Jounial,
Special Issue, Vol. 21, pp. 1083-1103.
Rumelt, R. P. (1984). 'Towards a strategic theory of the firm'. In R. Lamb (ed. ),
Competitive Strategic Management.
Seo, K. K (1991). Managerial Economics. IRWIN, Homcwood, IL 60430
Scott, W. R. (1987). 'The adolescence of institutional theory', Administrative
Science Quarterly, 32, pp. 493-51 1.
Shaffer, G. (1991). ' Slotting Allowances and Resale Price Maintenance: A
Comparison of Facilitating Practices', Rand Jounial ofEcowndcs, Vol. 22. pp. 120-13 5.
Sharp, B. S. (1985). 'Comments on Marvel; how fair is fair tradeT, Conicinporary
Policy Issues, Vol. I 11 (3), pp. 3 7-42.
219

Bibliography
Spengler, J. J. (1950). 'Vertical Integration and Antitrust Policy', Journal pf
Political Economy, Vol. 58, pp. 347-352.
Srivastava, R, Fahey, L and Christensen, K. (2001). 'The rcsourcc-bascd view and
marketing: The role of market-based assets in gaining competitive advantage, Journal of
Management, 27, pp. 777-802
Stabell, C. and Fjeldstad, 0. (1998). 'Configuring Value For Compaitive
Advantage: On Chains, Shops, and Networks', Strategic Afatiagement Jounial, Vol. 19,
pp. 413-437.
Stasch, S. (1972). Systems Analysisfor Marketing Planning. Glenvicw, III.: Scott
Foresman.
Steuer, R. M. (1983), 'Exclusive Dealing in Distribution', ConicIl Law Rmiciv,
Vol. 69, pp. 10 1- 134.
Stinchcombe, A. (2000). Social Structure and organizations: a comment. In
Economics Meets Sociology in Strategic Management: Advances in Strategic
Management, Baum, J., Dobbin, F. (eds). JAI Press: Greenwich, CT.
Tccce, D., Pisano, G. and Shuen, A. (1997). 'Dynamic capabilities and strategic
management', Strategic Management Jounial, 18(7), pp. 509-533.
Tomer, J. (1987). Organizational capital: 71e path to higher productivity and
well-being. New York: Praeger.
Van de Ven, A. and Ferry, D. Measuring and Assessing Organizations, Wiley,
New York, 1980.
Wensley, R. (1998). 'The Basics of Marketing Strategy', In Baker, M. (ed), 7le
Marketing Book; Butterworth: Heinemann.
Wernerfelt, B. (1984). 'A resource - based view of the firm', Strategic
Management Journal, 5(2), pp. 171-180.
220
Bibliography
Wemerfelt, B. (1989). 'From critical resources to corporate strategy', Journal of
General Management, 14, pp. 4-12.
Whinston, M. D. (1990), 'Tying, Foreclosure, and Exclusion', American Economic
Review, Vol. 80, pp. 837-859.
Williamson, 0. (1975). 'Markets and Hierarchies: Analysis and Antitrust
Implications'. Free Press: New York.
Williamson, 0. (1986). 'Vertical Integration and Related Variations on a
Transaction Cost Economic Theme', in J. E. Stiglitz and G. F. Mathewson (eds. ) New
Developments in the Analysis ofMarket Structure, Macmillan: London.
Williamson, 0. (1991). 'Strategizing, economizing, and economic organization',
Strategic Management Journal, Winter Special Issue, 12, pp. 75-94.
Wilson, R. and Chua, W. (1993). Managerial Accounting: Method and Meaning,
(2 nd edn). Chapman & Hall: London.
Winter, R. A. (1993). 'Vertical Control and Price versus Non price Competition',
Quarterly Review of Economics, Vol. 108, pp. 61-76.
Winter, S. (1994). 'Organizing for continuous improvement: evolutionary theory
meets the quality revolution'. In Evolutionary Dynainics of Organizations, Baum, J. A.
and Singh, J. V. (eds). Oxford University Press: New York; 90-108.
Winter, S. (2000). 'The Satisficing Principle in Capability Leaming, Strategic
Management Journal', Special Issue, Vol. 2 1, pp. 981-996.
Yeoh, P. and Roth, K. (1999). 'An Empirical Analysis of Sustaincd Advantagc in
the U. S. Pharmaceutical Industry: Impact of Finn Resources and Capabilities", Strategic
Management Journal, Vol. 20, pp. 637-653.
I

Bibliography
Zukin, S. and DiMaggio, P. J. (1990). 'Introduction'. In Zukin, S and Dimaggio,
P. J. (eds. ), Structures of Capital: The Social Organisation of the Economy. Cambridgc
University Press, Cambridge, U. K, pp. 1-5 6.
222
Top Related
Copyright © 2022 FDOKUMEN

