


Bahasa
Halaman
Hukum

ORIGINAL PAPER
An effective dietary survey framework for the assessmentof total dietary arsenic intake in Bangladesh: Part-A—FFQdesign
Nasreen Islam Khan Æ Gary Owens ÆDavid Bruce Æ Ravi Naidu
Received: 7 March 2008 / Accepted: 17 September 2008 / Published online: 27 January 2009
� Springer Science+Business Media B.V. 2009
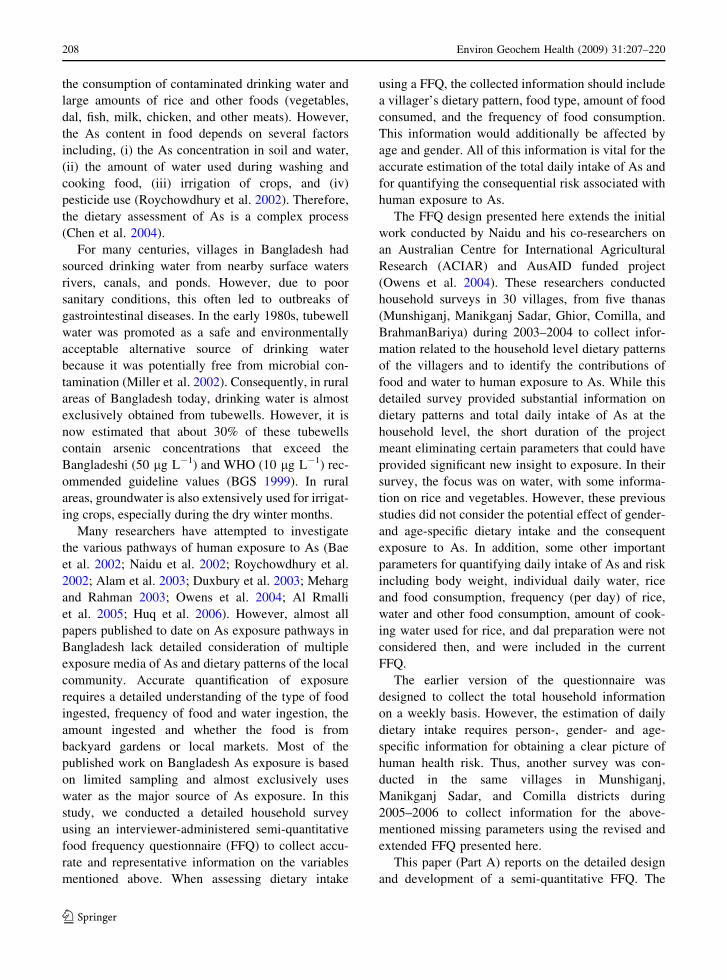
Abstract The accurate assessment of dietary intake
patterns is important for the determination of total
dietary arsenic (As) exposure in As-contaminated
regions of Bangladesh. Food intake questionnaires are
a common means of assessing food intake. A food
frequency questionnaire (FFQ) was designed to assess
the daily intake of frequently consumed food items
and was successfully implemented to assess dietary
patterns and intake of the rural populations in 18
villages from three Districts of Bangladesh (Comilla,
Manikganj Sadar, and Munshiganj). The FFQ pre-
sented in this paper comprises a complete set of tools
which allowed not only collection of information on
dietary patterns but also information on the spatial
characteristics of the landscape, socio-demographic
indicators, and geographic locations of the identified
environmental media of the contaminants, which
resulted in As exposure to humans. The FFQ was
designed in three sections: (1) general household
information, (2) household water and rice information,
and (3) individual dietary intake of other foods. The
dietary intake of other food was then further subdi-
vided into five different food subgroups: (i) grain
intake, (ii) protein intake, (iii) fruit intake (iv),
vegetable intake, and (v) dal (pulse) intake. During
the design and development of the FFQ, emphasis was
given to the source of food, the frequency (day/week/
month) of consumption, and the daily amount of food
consumed by each adult male, adult female, and child
to accurately determine the dietary pattern and intake
of arsenic in the rural population of Bangladesh.
Keywords Food frequency questionnaire (FFQ) �Dietary intake � Dietary pattern � Bangladesh �Arsenic
Introduction
The presence of significant concentrations of arsenic
(As) in groundwater and in the crops grown using this
contaminated water poses major health risks to an
estimated 30 million people in Bangladesh (Chow-
dhury et al. 2001). It is now well recognized that
people in Bangladesh are exposed to As mainly
through the food ingestion pathway, that is through
N. I. Khan (&) � G. Owens � R. Naidu
Centre for Environmental Risk Assessment and
Remediation (CERAR), University of South Australia,
Mawson Lakes Campus, Mawson Lakes, SA 5095,
Australia
e-mail: [email protected];
N. I. Khan
Department of Geography and Environment,
Dhaka University, Dhaka 1000, Bangladesh
D. Bruce
The Barbara Hardy Centre for Sustainable Urban
Environments, School of Natural and Built Environments,
University of South Australia, City East Campus,
Adelaide, SA 5095, Australia
123
Environ Geochem Health (2009) 31:207–220
DOI 10.1007/s10653-008-9234-1
the consumption of contaminated drinking water and
large amounts of rice and other foods (vegetables,
dal, fish, milk, chicken, and other meats). However,
the As content in food depends on several factors
including, (i) the As concentration in soil and water,
(ii) the amount of water used during washing and
cooking food, (iii) irrigation of crops, and (iv)
pesticide use (Roychowdhury et al. 2002). Therefore,
the dietary assessment of As is a complex process
(Chen et al. 2004).
For many centuries, villages in Bangladesh had
sourced drinking water from nearby surface waters
rivers, canals, and ponds. However, due to poor
sanitary conditions, this often led to outbreaks of
gastrointestinal diseases. In the early 1980s, tubewell
water was promoted as a safe and environmentally
acceptable alternative source of drinking water
because it was potentially free from microbial con-
tamination (Miller et al. 2002). Consequently, in rural
areas of Bangladesh today, drinking water is almost
exclusively obtained from tubewells. However, it is
now estimated that about 30% of these tubewells
contain arsenic concentrations that exceed the
Bangladeshi (50 lg L-1) and WHO (10 lg L-1) rec-
ommended guideline values (BGS 1999). In rural
areas, groundwater is also extensively used for irrigat-
ing crops, especially during the dry winter months.
Many researchers have attempted to investigate
the various pathways of human exposure to As (Bae
et al. 2002; Naidu et al. 2002; Roychowdhury et al.
2002; Alam et al. 2003; Duxbury et al. 2003; Meharg
and Rahman 2003; Owens et al. 2004; Al Rmalli
et al. 2005; Huq et al. 2006). However, almost all
papers published to date on As exposure pathways in
Bangladesh lack detailed consideration of multiple
exposure media of As and dietary patterns of the local
community. Accurate quantification of exposure
requires a detailed understanding of the type of food
ingested, frequency of food and water ingestion, the
amount ingested and whether the food is from
backyard gardens or local markets. Most of the
published work on Bangladesh As exposure is based
on limited sampling and almost exclusively uses
water as the major source of As exposure. In this
study, we conducted a detailed household survey
using an interviewer-administered semi-quantitative
food frequency questionnaire (FFQ) to collect accu-
rate and representative information on the variables
mentioned above. When assessing dietary intake
using a FFQ, the collected information should include
a villager’s dietary pattern, food type, amount of food
consumed, and the frequency of food consumption.
This information would additionally be affected by
age and gender. All of this information is vital for the
accurate estimation of the total daily intake of As and
for quantifying the consequential risk associated with
human exposure to As.
The FFQ design presented here extends the initial
work conducted by Naidu and his co-researchers on
an Australian Centre for International Agricultural
Research (ACIAR) and AusAID funded project
(Owens et al. 2004). These researchers conducted
household surveys in 30 villages, from five thanas
(Munshiganj, Manikganj Sadar, Ghior, Comilla, and
BrahmanBariya) during 2003–2004 to collect infor-
mation related to the household level dietary patterns
of the villagers and to identify the contributions of
food and water to human exposure to As. While this
detailed survey provided substantial information on
dietary patterns and total daily intake of As at the
household level, the short duration of the project
meant eliminating certain parameters that could have
provided significant new insight to exposure. In their
survey, the focus was on water, with some informa-
tion on rice and vegetables. However, these previous
studies did not consider the potential effect of gender-
and age-specific dietary intake and the consequent
exposure to As. In addition, some other important
parameters for quantifying daily intake of As and risk
including body weight, individual daily water, rice
and food consumption, frequency (per day) of rice,
water and other food consumption, amount of cook-
ing water used for rice, and dal preparation were not
considered then, and were included in the current
FFQ.
The earlier version of the questionnaire was
designed to collect the total household information
on a weekly basis. However, the estimation of daily
dietary intake requires person-, gender- and age-
specific information for obtaining a clear picture of
human health risk. Thus, another survey was con-
ducted in the same villages in Munshiganj,
Manikganj Sadar, and Comilla districts during
2005–2006 to collect information for the above-
mentioned missing parameters using the revised and
extended FFQ presented here.
This paper (Part A) reports on the detailed design
and development of a semi-quantitative FFQ. The
208 Environ Geochem Health (2009) 31:207–220
123
companion paper (Part B) addresses application of
FFQ as a dietary survey tool to collect a realistic
estimation of As exposure from the rural Bangladeshi
communities.
Study areas
An FFQ was designed for implementation in 18
different villages from Laksham, Sirajdikhan, and
Manikganj Sadar thanas in Bangladesh. The Laksham
thana is located in the Comilla district with an area of
429 km2 bounded by Dakatia and the Little Feni River.
The geographical location extends between 23�040 and
23�220 latitude and 90�590 and 91�140 longitude. The
Sirajdikhan thana is situated in the Munshiganj district
with an area of 180 km2 bounded by the Ichamati and
Dhaleshwari Rivers in the north. The geographical
extent of the thana is 23�300 and 23�410 latitude and
90�140 and 90�270 longitude. The Manikganj Sadar
thana is located in the Manikganj district and the total
land area is 215 km2 bounded by the Kaliganga,
Dhaleswari, Ichamati, and Gazikhali Rivers. The
geographic location of this thana extends between
23�420 and 23�560 latitude and 89�570 and 90�080
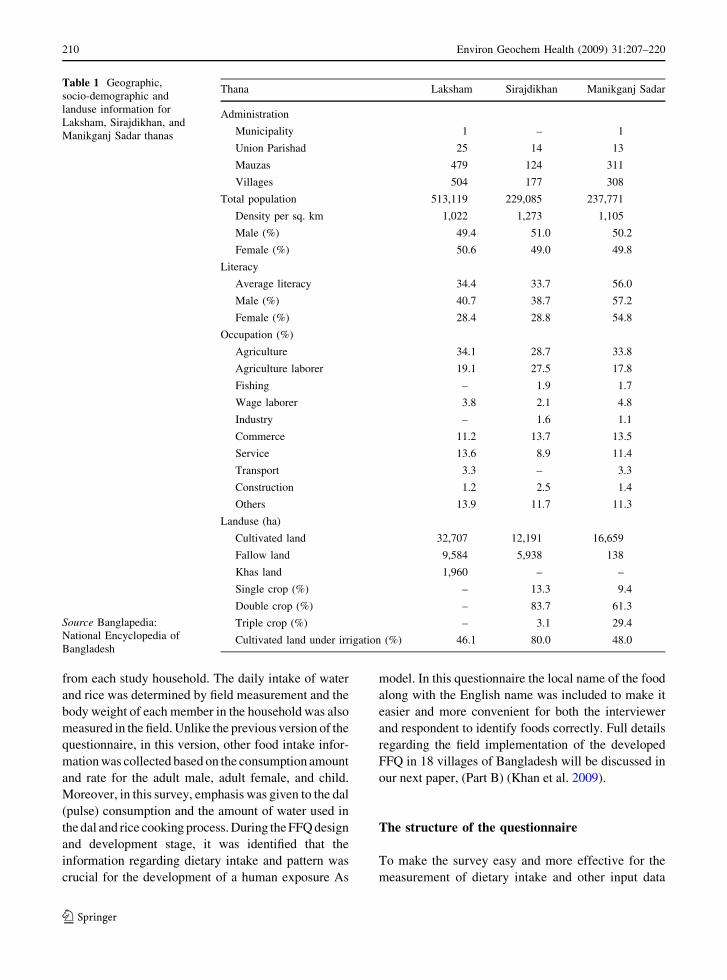
longitude. Table 1 summarizes the major socio-demo-
graphic and landuse characteristics of the three thanas
where the FFQ was implemented. The population is
evenly distributed between males and females, with
females being generally less literate than their male
counterparts. The main occupations of almost half the
population were related to agriculture, which is the
predominant landuse in the regions studied.
Potential As exposure pathways
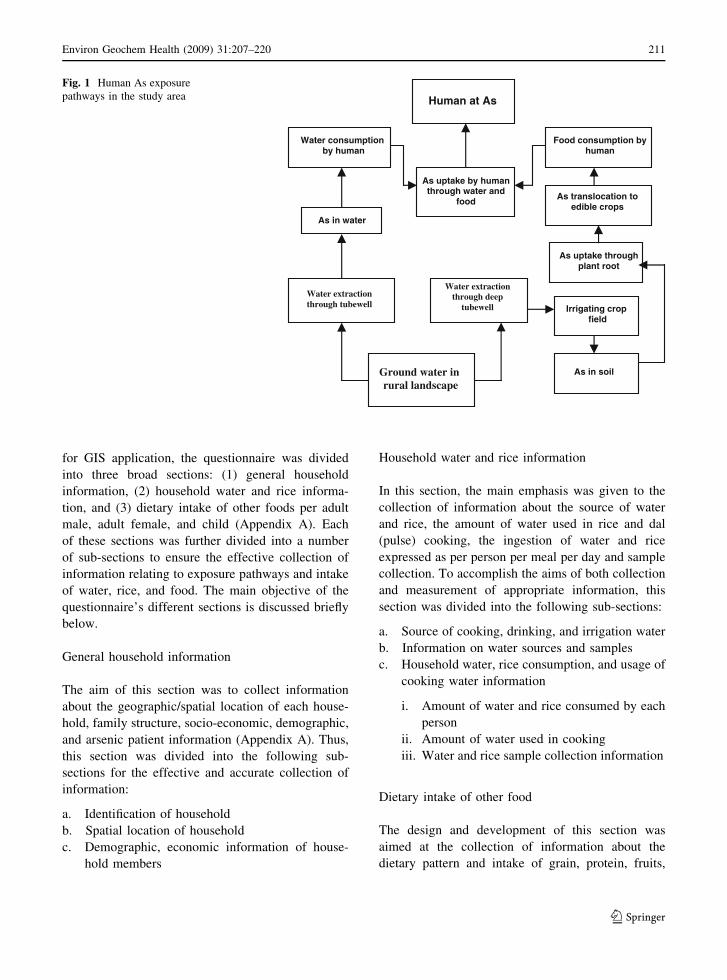
Identification of the potential exposure pathways and
exposure media in a landscape is an important first
step in assessing the intake of As that may pose a
potential human health risk. The potential exposure
pathways in the study areas considered were ground-
water, food, and soil (Fig. 1). As the main interest in
this study was to quantify human health risk associ-
ated with direct ingestion of drinking water and
consumption of rice and other foods, indirect expo-
sure pathways such as soil ingestion and inhalation of
dust were not considered in the risk assessment.
These indirect exposure pathways are not generally
significant in the study areas considered. Likewise,
secondary exposure pathways, such as the ingestion
of animals ingesting As-contaminated foods/grasses
was not considered in detail due to the potentially low
contribution of meat in total dietary intake. Rainwater
intake was not considered because it was not
commonly used in the studied villages and rainwater
is considered to be arsenic-free (Owens et al. 2004).
Thus after consideration of the major exposure
pathways, the direct food ingestion pathways, were
considered to be the most critical. Likewise, water,
rice, and other food (vegetables, dal) were considered
as the most important environmental media through
which a population experienced exposure to As in the
study areas. Therefore, in designing the survey, it was
considered essential to focus on water and rice intake
in detail and to support this by information on other
edible foods.
Questionnaire design
Inadequate dietary assessment of various foods can
produce negative or inconsistent association between
dietary exposure of various metals and health effects
(Chen et al. 2004). The design of the questionnaire for
the measurement of dietary pattern and daily intake of
As was based on an interviewer-administrated FFQ
method. Chen et al. (2004), has illustrated the applica-
bility of this method for the assessment of dietary intake
of rural Bangladeshi populations. The semi-quantita-
tive FFQ developed for this study was a substantially
modified version of an earlier questionnaire originally
developed for an ACIAR funded project. This ques-
tionnaire was subsequently revised by the AusAID
project team (Owens et al. 2004). The current ques-
tionnaire was designed to obtain information related to
dietary pattern and daily intake of As through direct
ingestion of food and water with the aim of developing a
Geographical Information System (GIS) based land-
scape level human health risk model. During the design
and development of the current FFQ, the AusAID
(Owens et al. 2004) questionnaire was critically
reviewed and missing variables identified and addi-
tional questions added to the questionnaire to enable
development of a GIS-based landscape level As
exposure risk scenario. In the current version of the
questionnaire, emphasis was given to the collection of
individual daily intake of water, rice, and other food
Environ Geochem Health (2009) 31:207–220 209
123
from each study household. The daily intake of water
and rice was determined by field measurement and the
body weight of each member in the household was also
measured in the field. Unlike the previous version of the
questionnaire, in this version, other food intake infor-
mation was collected based on the consumption amount
and rate for the adult male, adult female, and child.
Moreover, in this survey, emphasis was given to the dal
(pulse) consumption and the amount of water used in
the dal and rice cooking process. During the FFQ design
and development stage, it was identified that the
information regarding dietary intake and pattern was
crucial for the development of a human exposure As
model. In this questionnaire the local name of the food
along with the English name was included to make it
easier and more convenient for both the interviewer
and respondent to identify foods correctly. Full details
regarding the field implementation of the developed
FFQ in 18 villages of Bangladesh will be discussed in
our next paper, (Part B) (Khan et al. 2009).
The structure of the questionnaire
To make the survey easy and more effective for the
measurement of dietary intake and other input data
Table 1 Geographic,
socio-demographic and
landuse information for
Laksham, Sirajdikhan, and
Manikganj Sadar thanas
Source Banglapedia:
National Encyclopedia of
Bangladesh
Thana Laksham Sirajdikhan Manikganj Sadar
Administration
Municipality 1 – 1
Union Parishad 25 14 13
Mauzas 479 124 311
Villages 504 177 308
Total population 513,119 229,085 237,771
Density per sq. km 1,022 1,273 1,105
Male (%) 49.4 51.0 50.2
Female (%) 50.6 49.0 49.8
Literacy
Average literacy 34.4 33.7 56.0
Male (%) 40.7 38.7 57.2
Female (%) 28.4 28.8 54.8
Occupation (%)
Agriculture 34.1 28.7 33.8
Agriculture laborer 19.1 27.5 17.8
Fishing – 1.9 1.7
Wage laborer 3.8 2.1 4.8
Industry – 1.6 1.1
Commerce 11.2 13.7 13.5
Service 13.6 8.9 11.4
Transport 3.3 – 3.3
Construction 1.2 2.5 1.4
Others 13.9 11.7 11.3
Landuse (ha)
Cultivated land 32,707 12,191 16,659
Fallow land 9,584 5,938 138
Khas land 1,960 – –
Single crop (%) – 13.3 9.4
Double crop (%) – 83.7 61.3
Triple crop (%) – 3.1 29.4
Cultivated land under irrigation (%) 46.1 80.0 48.0
210 Environ Geochem Health (2009) 31:207–220
123
for GIS application, the questionnaire was divided
into three broad sections: (1) general household
information, (2) household water and rice informa-
tion, and (3) dietary intake of other foods per adult
male, adult female, and child (Appendix A). Each
of these sections was further divided into a number
of sub-sections to ensure the effective collection of
information relating to exposure pathways and intake
of water, rice, and food. The main objective of the
questionnaire’s different sections is discussed briefly
below.
General household information
The aim of this section was to collect information
about the geographic/spatial location of each house-
hold, family structure, socio-economic, demographic,
and arsenic patient information (Appendix A). Thus,
this section was divided into the following sub-
sections for the effective and accurate collection of
information:
a. Identification of household
b. Spatial location of household
c. Demographic, economic information of house-
hold members
Household water and rice information
In this section, the main emphasis was given to the
collection of information about the source of water
and rice, the amount of water used in rice and dal
(pulse) cooking, the ingestion of water and rice
expressed as per person per meal per day and sample
collection. To accomplish the aims of both collection
and measurement of appropriate information, this
section was divided into the following sub-sections:
a. Source of cooking, drinking, and irrigation water
b. Information on water sources and samples
c. Household water, rice consumption, and usage of
cooking water information
i. Amount of water and rice consumed by each
person
ii. Amount of water used in cooking
iii. Water and rice sample collection information
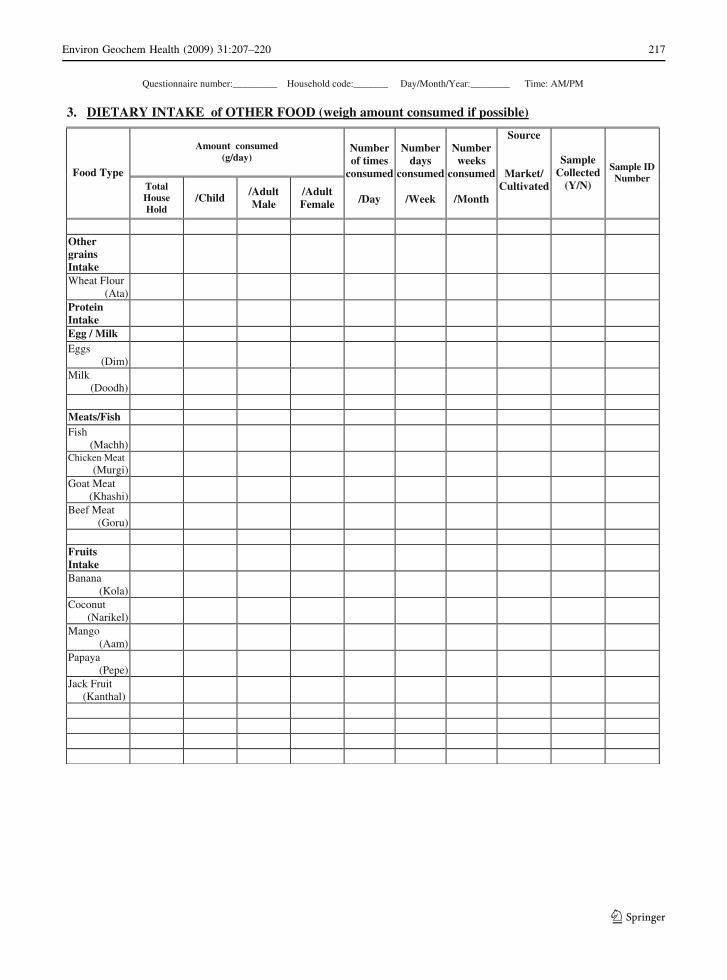
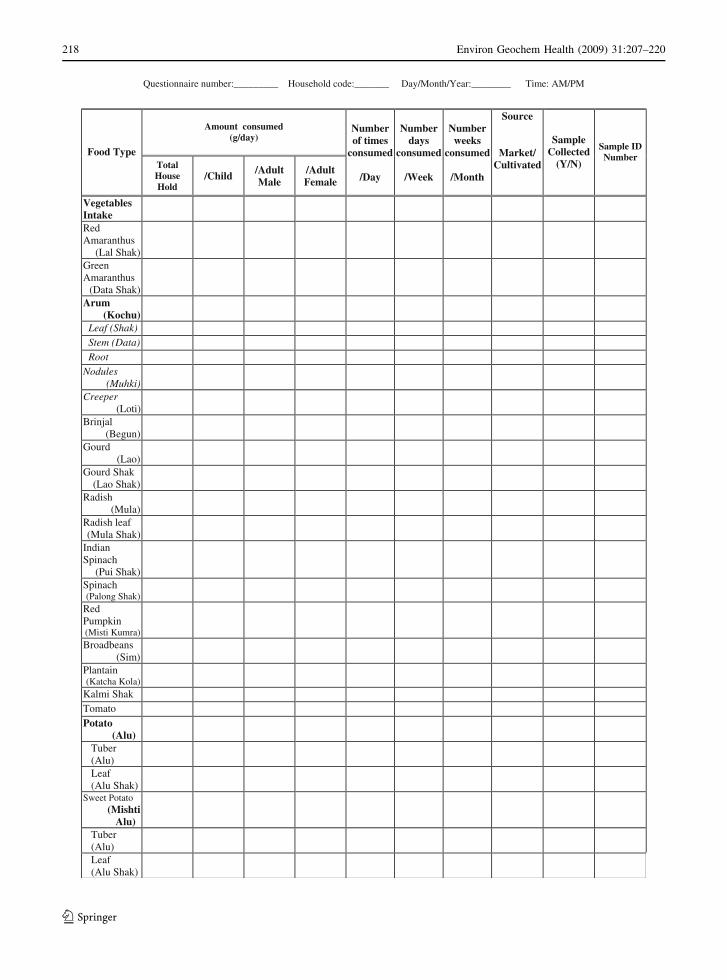
Dietary intake of other food
The design and development of this section was
aimed at the collection of information about the
dietary pattern and intake of grain, protein, fruits,
Ground water in rural landscape
Water extraction through tubewell
Water extraction through deep
tubewell
As in water
Water consumption by human
Irrigating crop field
As in soil
As uptake throughplant root
As translocation to edible crops
Food consumption by human
As uptake by human through water and
food
Human at As
Fig. 1 Human As exposure
pathways in the study area
Environ Geochem Health (2009) 31:207–220 211
123
vegetables and dal (pulses) of rural adult males, adult
females, and children. The selection of food items for
inclusion in the FFQ were based on As total
concentrations and whether the item was frequently
consumed and commonly available in the rural areas
in Bangladesh. The decision on final food item
selection was based on the arsenic concentrations in
food samples (Owens et al. 2004) and preliminary
dietary patterns identified by analyzing the AusAID
survey dataset. In this FFQ, we included various
types of dal and excluded some vegetables that had
shown very low or zero frequency of consumption as
well as food items having very low total As content
based on previous studies (Owens et al. 2004). This
section was divided into five different sub-section
based on food types (i) other grain intake, (ii) protein
intake, (iii) fruits intake, (iv) vegetable intake, and (v)
dal (pulse) intake. Each section included a number of
frequently eaten food items. The emphasis was
placed on the source of food, the frequency (day/
week/month) of consumption, and the daily amount
of food consumed by each adult male, adult female,
and child to obtain an accurate picture of the dietary
pattern. Information regarding sample collection for
laboratory analysis was included in this section.
Implementation of the FFQ
The semi-quantitative FFQ was successfully imple-
mented in 18 villages located in three different
districts (Comilla, Manikganj Sadar, and Munshiganj)
and different physiographic units of Bangladesh
during 2005–2006. FFQ techniques are often preferred
in highly literate communities because they can be
conducted as self-administrated surveys instead of
interviewer-administrated ones. This was not applica-
ble to rural Bangladeshi communities where the
literacy was low (Table 1) and therefore the FFQ
was conducted by trained interviewers. The main
disadvantage of this method of implementing a FFQ is
that it is time consuming and costs are involved in
processing data as well as the need for a well trained
interviewer to collect information effectively and
accurately. It took approximately 2 hours per house-
hold to complete the collection of dietary and other
information using the FFQ together with the collection
and labeling of water, food, and soil samples.
The FFQ was applied to collect information from a
total of 1,023 participants including 386 adult males,
397 adult females, and 240 children from 180 rural
households. Person-gender- and age-specific dietary
patterns and intakes of water, rice, and other food for
the estimation of total daily intake (TDI) of As and
risk of As exposure were collected. Apart from the
dietary pattern and intake of food related information
of the rural population, samples of environmental
exposure media (water, food, and soil) for later
laboratory analysis were also collected during the
FFQ survey. Spatial information relating to exposure
sources, household location, and village boundaries
were also collected for developing the input dataset
for the GIS-based risk model. Additional details
about the implementation and preliminary results
obtained from this interviewer administrated semi-
quantitative FFQ for rural Bangladeshi households
are discussed in a companion paper in this journal
(Part-B) (Khan et al. 2009).
Conclusions
The developed FFQ illustrates effective methods for
collecting dietary intake of rural populations together
with demographic, socio-economic, spatial, and field
samples-related data. The simple and homogeneous
nature of diet in rural areas in Bangladesh made it
possible to successfully implement the FFQ in three
different regions of Bangladesh without difficulty. Data
collected through the FFQ shows a promising means of
obtaining input data for the assessment of daily intake
of As which can provide the basis for the measurement
of human health risk associated with As exposure.
Acknowledgements The authors extend their thanks to DCH
for their support and assistance during field surveys and for
supplying laboratory facilities for sample pre-processing. The
authors also gratefully acknowledge the financial support
provided for this project by AusAID. The Centre for
Environmental Risk Assessment and Remediation (CERAR),
and the University of South Australia provided financial
support and the University of Dhaka provided study leave for
Nasreen Islam Khan while she pursued her PhD studies.
212 Environ Geochem Health (2009) 31:207–220
123
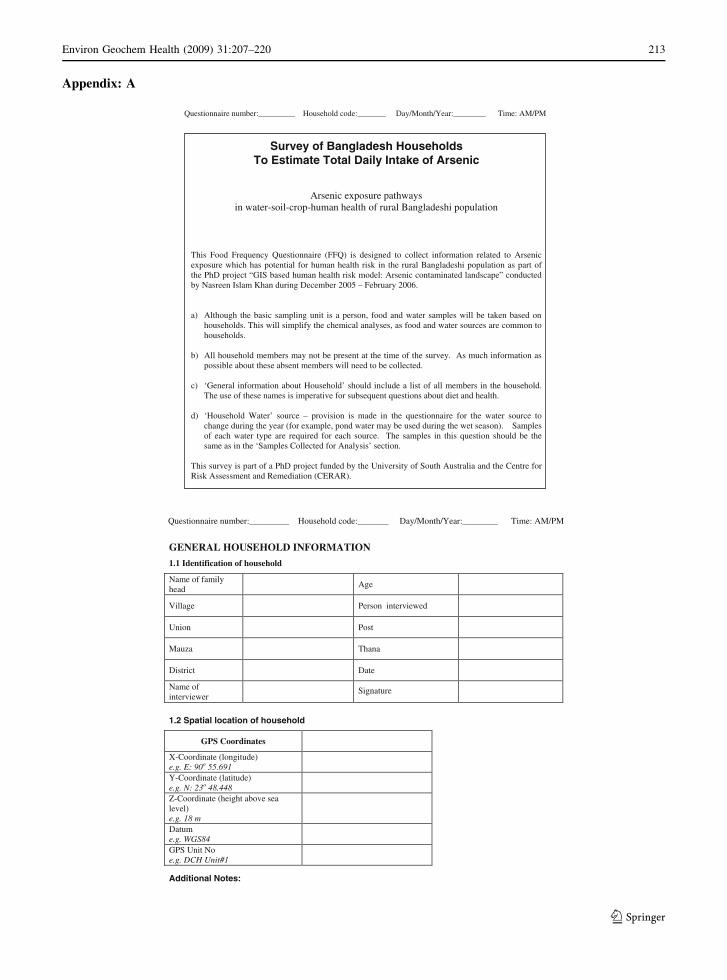
Appendix: A
Survey of Bangladesh Households To Estimate Total Daily Intake of Arsenic
Arsenic exposure pathwaysin water-soil-crop-human health of rural Bangladeshi population
This Food Frequency Questionnaire (FFQ) is designed to collect information related to Arsenic exposure which has potential for human health risk in the rural Bangladeshi population as part of the PhD project “GIS based human health risk model: Arsenic contaminated landscape” conducted by Nasreen Islam Khan during December 2005 – February 2006.
a) Although the basic sampling unit is a person, food and water samples will be taken based on households. This will simplify the chemical analyses, as food and water sources are common to households.
b) All household members may not be present at the time of the survey. As much information as possible about these absent members will need to be collected.
c) ‘General information about Household’ should include a list of all members in the household. The use of these names is imperative for subsequent questions about diet and health.
d) ‘Household Water’ source – provision is made in the questionnaire for the water source to change during the year (for example, pond water may be used during the wet season). Samples of each water type are required for each source. The samples in this question should be the same as in the ‘Samples Collected for Analysis’ section.
This survey is part of a PhD project funded by the University of South Australia and the Centre for Risk Assessment and Remediation (CERAR).
Questionnaire number:_________ Household code:_______ Day/Month/Year:________ Time: AM/PM
GENERAL HOUSEHOLD INFORMATION
1.1 Identification of household
Name of familyhead
Age
Village Person interviewed
Union Post
Mauza Thana
District Date
Name of interviewer
Signature
1.2 Spatial location of household
GPS Coordinates
X-Coordinate (longitude) e.g. E: 90o 55.691 Y-Coordinate (latitude) e.g. N: 23o 48.448 Z-Coordinate (height above sea level) e.g. 18 m Datume.g. WGS84GPS Unit Noe.g. DCH Unit#1
Additional Notes:
Questionnaire number:_________ Household code:_______ Day/Month/Year:________ Time: AM/PM
Environ Geochem Health (2009) 31:207–220 213
123
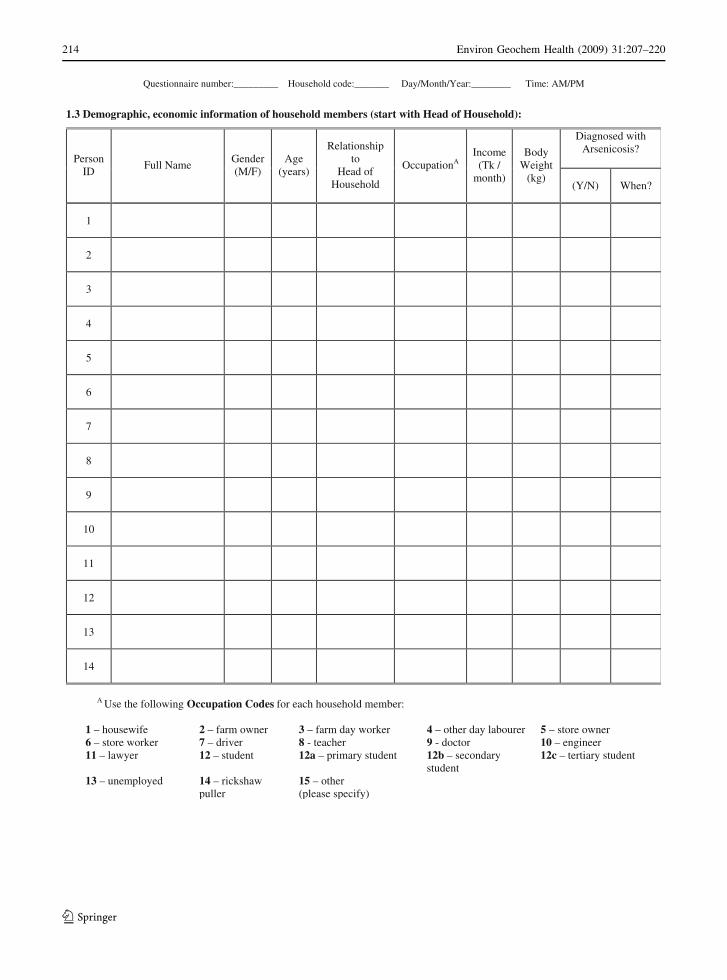
1.3 Demographic, economic information of household members (start with Head of Household):
Diagnosed with Arsenicosis?
Person ID
Full Name Gender (M/F)
Age(years)
Relationship to
Head of Household
OccupationAIncome
(Tk / month)
Body Weight
(kg) (Y/N) When?
1
2
3
4
5
6
7
8
9
10
11
12
13
14
A Use the following Occupation Codes for each household member:
1 – housewife 2 – farm owner 3 – farm day worker 4 – other day labourer 5 – store owner 6 – store worker 7 – driver 8 - teacher 9 - doctor 10 – engineer11 – lawyer 12 – student 12a – primary student 12b – secondary
student 12c – tertiary student
13 – unemployed 14 – rickshaw puller
15 – other (please specify)
Questionnaire number:_________ Household code:_______ Day/Month/Year:________ Time: AM/PM
214 Environ Geochem Health (2009) 31:207–220
123
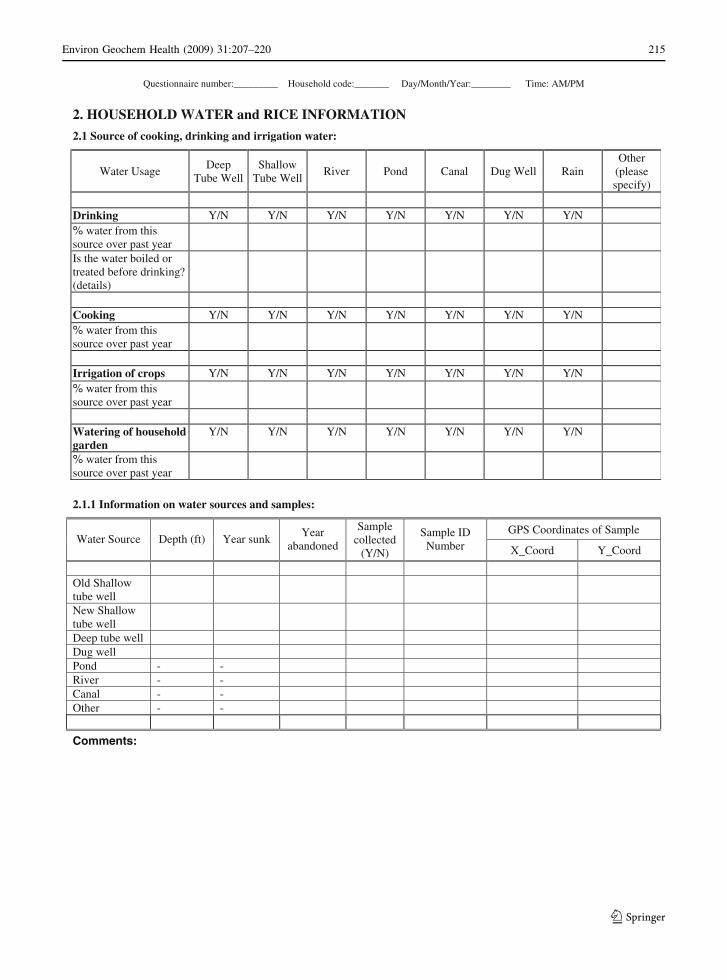
2. HOUSEHOLD WATER and RICE INFORMATION
2.1 Source of cooking, drinking and irrigation water:
Water Usage Deep
Tube Well Shallow
Tube WellRiver Pond Canal Dug Well Rain
Other (pleasespecify)
Drinking Y/N Y/N Y/N Y/N Y/N Y/N Y/N % water from this source over past year Is the water boiled or treated before drinking? (details) Cooking Y/N Y/N Y/N Y/N Y/N Y/N Y/N % water from this source over past year
Irrigation of crops Y/N Y/N Y/N Y/N Y/N Y/N Y/N % water from this source over past year
Watering of household garden
Y/N Y/N Y/N Y/N Y/N Y/N Y/N
% water from this source over past year
2.1.1 Information on water sources and samples:
GPS Coordinates of SampleWater Source Depth (ft) Year sunk
Yearabandoned
Sample collected
(Y/N)
Sample ID Number X_Coord Y_Coord
Old Shallow tube well
New Shallow tube well
Deep tube well Dug well Pond - - River - - Canal - - Other - -
Comments:
Questionnaire number:_________ Household code:_______ Day/Month/Year:________ Time: AM/PM
Environ Geochem Health (2009) 31:207–220 215
123
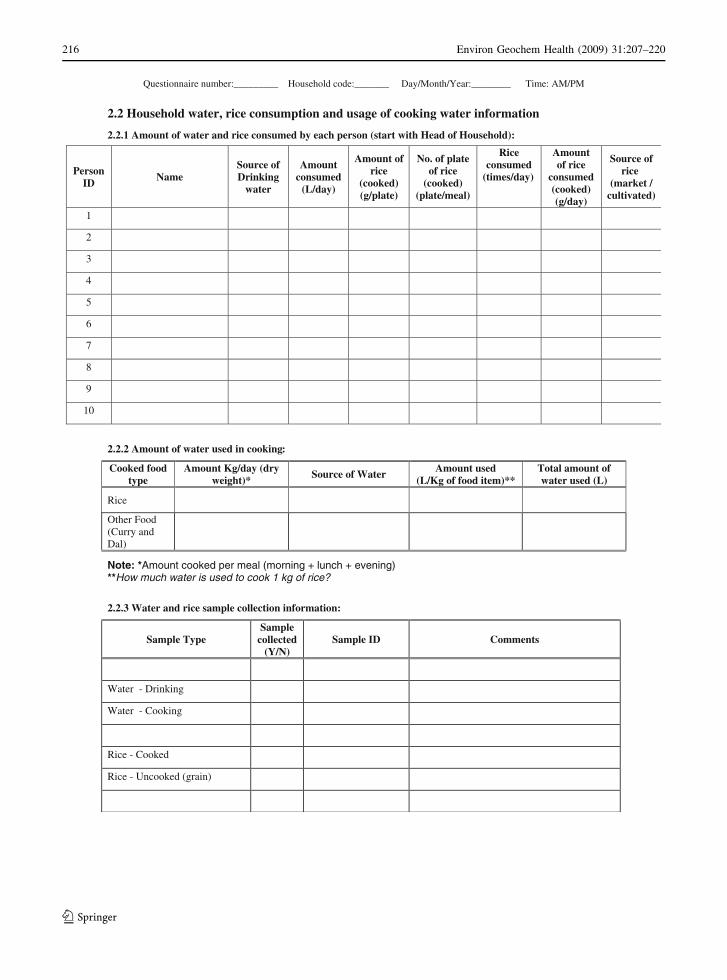
2.2 Household water, rice consumption and usage of cooking water information
2.2.1 Amount of water and rice consumed by each person (start with Head of Household):
PersonID
Name Source of Drinking
water
Amount consumed
(L/day)
Amount of rice
(cooked) (g/plate)
No. of plate of rice
(cooked) (plate/meal)
Riceconsumed
(times/day)
Amount of rice
consumed(cooked) (g/day)
Source of rice
(market / cultivated)
1
2
3
4
5
6
7
8
9
10
2.2.2 Amount of water used in cooking:
Cooked food type
Amount Kg/day (dry weight)*
Source of Water Amount used (L/Kg of food item)**
Total amount of water used (L)
Rice
Other Food (Curry and Dal)
Note: *Amount cooked per meal (morning + lunch + evening) **How much water is used to cook 1 kg of rice?
2.2.3 Water and rice sample collection information:
Sample Type Sample
collected(Y/N)
Sample ID Comments
Water - Drinking
Water - Cooking
Rice - Cooked
Rice - Uncooked (grain)
Questionnaire number:_________ Household code:_______ Day/Month/Year:________ Time: AM/PM
216 Environ Geochem Health (2009) 31:207–220
123
3. DIETARY INTAKE of OTHER FOOD (weigh amount consumed if possible)
Amount consumed (g/day)
Food Type TotalHouseHold
/Child /AdultMale
/AdultFemale
Number of times
consumed
/Day
Number days
consumed
/Week
Number weeks
consumed
/Month
Source
Market/ Cultivated
Sample Collected
(Y/N)
Sample ID Number
Other grains Intake
Wheat Flour (Ata)
Protein Intake
Egg / Milk Eggs
(Dim)
Milk (Doodh)
Meats/Fish Fish
(Machh)
Chicken Meat (Murgi)
Goat Meat (Khashi)
Beef Meat (Goru)
FruitsIntake
Banana (Kola)
Coconut (Narikel)
Mango (Aam)
Papaya(Pepe)
Jack Fruit (Kanthal)
Questionnaire number:_________ Household code:_______ Day/Month/Year:________ Time: AM/PM
Environ Geochem Health (2009) 31:207–220 217
123
Amount consumed (g/day)
Food Type TotalHouseHold
/Child /AdultMale
/AdultFemale
Numberof times
consumed
/Day
Numberdays
consumed
/Week
Numberweeks
consumed
/Month
Source
Market/ Cultivated
SampleCollected
(Y/N)
Sample ID Number
Vegetables IntakeRedAmaranthus
(Lal Shak) Green Amaranthus
(Data Shak)Arum
(Kochu) Leaf (Shak) Stem (Data) RootNodules
(Muhki)Creeper
(Loti) Brinjal
(Begun) Gourd
(Lao)Gourd Shak
(Lao Shak)Radish
(Mula)Radish leaf (Mula Shak)
IndianSpinach
(Pui Shak)Spinach (Palong Shak)
RedPumpkin (Misti Kumra)Broadbeans
(Sim)Plantain(Katcha Kola)
Kalmi Shak TomatoPotato
(Alu) Tuber (Alu) Leaf (Alu Shak)Sweet Potato
(Mishti Alu)
Tuber (Alu) Leaf (Alu Shak)
Questionnaire number:_________ Household code:_______ Day/Month/Year:________ Time: AM/PM
218 Environ Geochem Health (2009) 31:207–220
123
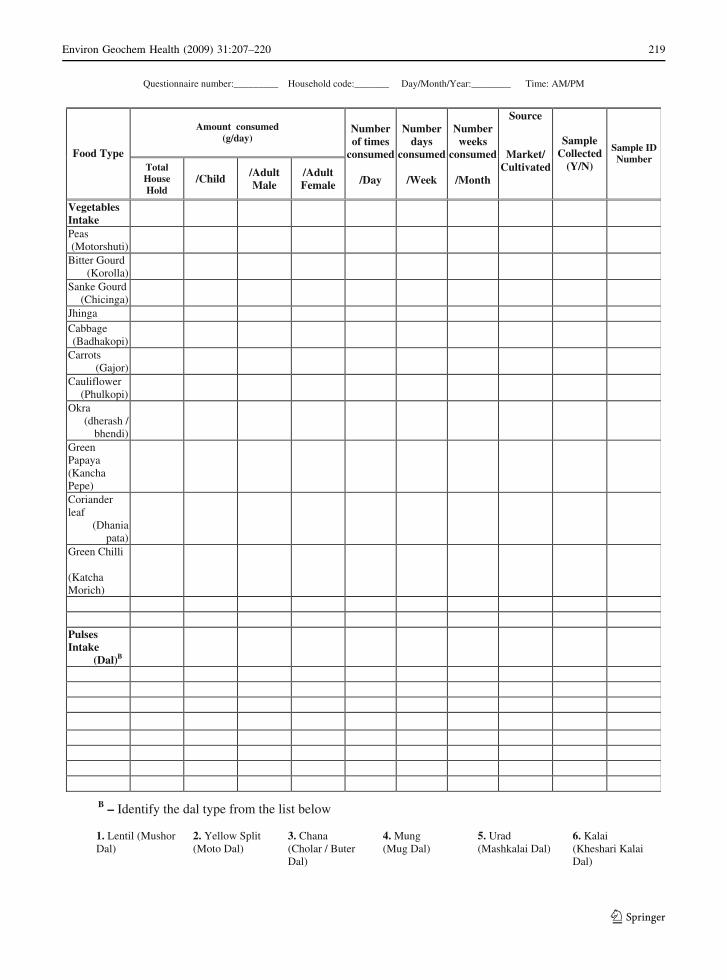
B – Identify the dal type from the list below
1. Lentil (Mushor Dal)
2. Yellow Split (Moto Dal)
3. Chana (Cholar / Buter Dal)
4. Mung (Mug Dal)
5. Urad (Mashkalai Dal)
6. Kalai (Kheshari Kalai Dal)
Amount consumed (g/day)
Food Type TotalHouseHold
/Child /AdultMale
/AdultFemale
Number of times
consumed
/Day
Number days
consumed
/Week
Number weeks
consumed
/Month
Source
Market/ Cultivated
Sample Collected
(Y/N)
Sample ID Number
Vegetables Intake
Peas(Motorshuti)
Bitter Gourd (Korolla)
Sanke Gourd (Chicinga)
Jhinga Cabbage (Badhakopi)
Carrots (Gajor)
Cauliflower (Phulkopi)
Okra (dherash /
bhendi)
Green Papaya(Kancha Pepe)
Coriander leaf
(Dhania pata)
Green Chilli (Katcha Morich)
PulsesIntake (Dal)B
Questionnaire number:_________ Household code:_______ Day/Month/Year:________ Time: AM/PM
Environ Geochem Health (2009) 31:207–220 219
123
References
Alam, M. G. M., Snow, E. T., & Tanaka, A. (2003). Arsenic
and heavy metal contamination of vegetables grown in
Samta village, Bangladesh. Science of the Total Envi-ronment, 308, 83–96.
Al Rmalli, S. W., Haris, P. I., Harrington, C. F., & Ayub, M.
(2005). A survey of arsenic in foodstuffs on sale in the
United Kingdom and imported from Bangladesh. Scienceof the Total Environment, 337(1–3), 23–30.
Bae, M., Wantanabe, C., Inaoka, T., Sekiyama, M., Sudo, N.,
Bokul, M. H., et al. (2002). Arsenic in cooked rice in
Bangladesh. The LANCET, 360(9348), 1839–1840.
BGS. (1999). Groundwater studies for arsenic contamination in
Bangladesh (Final Report). British Geological Survey and
Mott MacDonald Ltd (UK).
Chen, Y., Ahsan, H., Parvez, F., & Howe, G. R. (2004).
Validity of a food-frequency questionnaire for a large
prospective cohort study in Bangladesh. British Journal ofNutrition, 92, 851–859.
Chowdhury, U. K., Rahman, M. M., Mondal, B. K., Paul, K.,
Lodh, D., Biswas, B. K., et al. (2001). Groundwater
arsenic contamination and human suffering in West
Bengal, India and Bangladesh. Environmental Sciences,8(5), 393–415.
Duxbury, J. M., Mayer, A. B., Lauren, J. G., & Hassan, N.
(2003). Food chain aspects of arsenic contamination in
Bangladesh: Effects on quality and productivity of rice.
Journal of Environmental Science and Health, A38(1),
61–69.
Huq, S. I., Correll, R., & Naidu, R. (2006). Arsenic accumu-
lation in food sources in Bangladesh. In R. Naidu, E.
Smith, G. Owens, P. Bhattacharya, & P. Nadebaum
(Eds.), Managing arsenic in the environment: From soilto human health (pp. 283–293). Australia: CSIRO
Publishing.
Khan, N. I., Bruce, D., Naidu, R., & Owens, G. (2009).
Implementation of food frequency questionnaire for the
assessment of total dietary arsenic intake in Bangladesh:
Part-B—Preliminary findings. Environmental Geochem-istry and Health. doi:10.1007/s10653-008-9232-3.
Meharg, A. A., & Rahman, M. M. (2003). Arsenic contami-
nation of Bangladesh paddy field soils: Implications for
rice contribution to arsenic consumption. EnvironmentalScience Technology, 37(2), 229–234.
Miller, R., Correll, R., Dillon, P., & Kookana, R. (2002).
ASRRI: A predictive index of contaminant attenuation
during aquifer storage and recovery. In P. Dillon (Ed.),
Management of aquifer recharge for sustainability (pp.
69–76). Balkema Publishers: Australia.
Naidu, R., Huq, I., Smith, E., Correll, R., Smith, L., Smith, J.,
et al. (2002). Assessing potential arsenic exposure
pathways in Bangladesh. Paper presented at the 5th
International Conference on Arsenic Exposure and Health
Effects, San Diego, California, USA.
Owens G., Rahman M. M., Heinrich T. & Naidu R. (2004).
Bangladesh-Australia Centre for Arsenic Mitigation Pro-
gram (BACAMP): Program 3: Safe food, Section 1:
Arsenic food chain assessment, University of South
Australia, Consultancy report for GHD Pty Ltd.
Roychowdhury, T., Uchino, T., Tokunaga, H., & Ando, M.
(2002). Survey of arsenic in food composites from as
arsenic-affected area of West Bengal, India. FoodChemical Toxicology, 40, 1611–1621.
Measurement conversion:
1 bottle = 500 ml 1 foot = 0.3048 m
Abbreviation:
Deep Tube Well = DTW Shallow Tube Well = STD Dug Well = DW Pond Water = PW River Water = RW Canal Water = CW Rain Water = R
Market = M Cultivated = C
220 Environ Geochem Health (2009) 31:207–220
123
Top Related
Copyright © 2022 FDOKUMEN

