


Bahasa
Halaman
Hukum

FERMINA ROJO PEREZ, GLORIA FERNANDEZ-MAYORALASFERNANDEZ ENRIQUE POZO RIVERA and JOSE MANUEL ROJO ABUIN
AGEING IN PLACE: PREDICTORS OF THE RESIDENTIALSATISFACTION OF ELDERLY?
(Accepted 12 January, 2001)
ABSTRACT. This study aims to clarify the explanatory factors and the extentto which those factors help to predict the overall residential satisfaction amongelderly people, as one of the major elements or attributes of their quality oflife. The study seeks to address the residential environment from two differentperspectives: an objective reality and old people’s appraisal of this reality, onthe basis of a survey for a representative sample of people aged between 65and 84 years old who live in family housing in Madrid (Spain). In the analyticprocess, a Principal Component Analysis procedure is applied to reduce the dataset and to uncover the relationships between various aspects of the elderly resid-ential satisfaction. In the second step, a Multiple Linear Regression Analysiswas conducted to identify the overall residential satisfaction predictors and therelative importance of each one. Descriptive results show a high degree of satis-faction with each part of the residential environment (house, neighbourhood andneighbours), higher among women and the most elderly. The predictive regres-sion model accounts for 50% of the criterion variance based on 15 factors, butthe first six account for 44.8%: satisfaction with home attributes, perception ofthe neighbourhood’s environmental quality, agreement with positive aspects anddisagreement with negative aspects of the network of neighbours, the building’samenities and degree of satisfaction with such amenities.
INTRODUCTION
Ageing at home, without having to change residence (Pastalan,1990), as the commonest form of accommodation (Gonyea et al.,1990; Callahan, 1993; Silverstone and Horowitz, 1993; Harootyan,
? This research was supported by the CICYT (reference number SEC97-1374).The authors give thanks to Dr A. Abellan and Dr. V. Rodrıguez for their contri-bution to the questionary survey designing. An earlier version of this article waspresented to the Conference onStatus of the Older Population: Prelude to the 21stCentury(UN/ECE/PAU, Sion, Switzerland, December 1999).
Social Indicators Research54: 173–208, 2001.© 2001Kluwer Academic Publishers. Printed in the Netherlands.

174 FERMINA ROJO PEREZ ET AL.
1995) opposed to institutionalisation in an old people’s home, isthe residential strategy preferred by the elderly for living out theirageing time (Baker and Prince, 1990). In Spain, around 95% of theelderly population live in family homes (Abellán et al., 1996), eitherin their own house or in their children’s or other relatives’ house. Inthe municipality of Madrid, most of the elderly still live in the housethey had before retiring (Abellán and Rojo, 1997).
The home is more than a symbol of quality of life at all ages.It is the place that covers one of our basic needs, namely accom-modation. It can have certain benefits for one’s physical healthand psychological welfare (Fogel, 1993); it is the focal point ofintimate relationships (Grundy, 1989), relationships with friends andrelatives and, to a certain extent, leisure relationships.
The home and the area where it is located are the places that bindthe elderly most, because they lived there most of their working life(Law and Warnes, 1982), it is where they spend a good part of thetime and have more ties and binding memories than young people(Pynoos and Regnier, 1991). An unsuitable relationship betweenthe residential environment and an elderly person’s physical abilityand socio-economic level could result in a lack of independence,the disintegration and restriction of living space activities and, inextreme circumstances, a process of early institutionalisation.
These facts endorse such a study of elderly people’s assessmentor perception of the physical environment in which they live, andthe analysis of the interrelations between elderly people’s residentialneeds and the amenities/services offered in living space. There-fore this study aims to ascertain the level of residential satisfactionamong elderly people in Madrid to clarify the explanatory factorsand the extent to which those factors help to predict residentialsatisfaction as one of the outstanding elements or attributes of thispopulation group’s quality of life.
Quality of life is a highly important current issue, yet it is hardto define (Arnold, 1991; Birren and Dieckmann, 1991; FernándezBallesteros et al., 1997; Seed and Lloyd, 1997); it can be under-stood in very many different ways, all of which are possible becausequality of life is not a directly measurable aspect (Setién, 1993).Thus, the result of the balance between the population’s needs anddemands, and the personal evaluation or appraisal regarding the best
AGEING IN PLACE 175
level of satisfaction of such needs and demands is the objectiveof such a quality of life study. From this viewpoint, quality oflife involves subjective aspects since as it is an appraisal made byindividuals, as well as objective aspects about which they give anopinion or judgement.
The complexity of the definition also has to do with the lackof unified criteria or elements to be considered in the study.Depending on what bibliography is used, a quality of life analysiswould take in very many facets or dimensions (Gentile, 1991; Katzand Gurland, 1991; Lawton, 1991; Garland, 1993; Setién, 1993;Fernández Ballesteros et al., 1997; Seed and Lloyd, 1997). Thatis why Svensson (1991) believes that “qualities of life” must bedefined as specific areas that a person perceives as vital in the abilityto enjoy and take part in life, and feel that the commitment to parti-cipate has a meaning. However, despite quality of life having such awide range of dimensions, authors seem to be unanimous in consid-ering the home and the residential space, both from the objectiveviewpoint and when evaluated by opinions about the satisfactionsuggested by that space.
The termresidential satisfaction, used in studies of homes andtheir sphere of location, refers to individuals’ appraisal of the condi-tions of their residential environment, in relation to their needs,expectations and achievements (George and Bearon, 1980; Gentile,1991; Amérigo and Aragonés, 1997). The study aims to address theresidential issue from the dual perspective of objective reality andhow residents assess their residential environment. The two sets ofelements happen together in real life, so it does not seem plausibleto separate two issues that complement each other in the real world.
Studies in residential satisfaction must include both the space andpeople (Callahan, 1993) as users of this space. The residential areais not restricted to the home but also extends to the environmentwhere it is located (or neighbourhood) and the people who livethere (neighbours), because elderly people’s experience with theirneighbourhood and neighbours may be just as important as theirhome itself (Carp and Carp, 1982; Golant, 1984; Peace, 1987; Bond,1993).
In this respect, aspects such as the elderly person’s demographic,social and economic characteristics, the amenities and nature of
176 FERMINA ROJO PEREZ ET AL.
the home and the building where it is located, and the servicesand amenities available in the neighbourhood are considered theobjective attributes of the interrelationship between the elderly andtheir residential environment. The subjective aspects have to do withlevels of satisfaction with each component of the residential envir-onment: home, neighbourhood, neighbours, and lifestyle and placeof residence, with the inclination to move one’s place of residencealso being taken as an expression of satisfaction (Speare, 1974;Morris et al., 1976; Aragonés and Amérigo, 1987; Fokkema et al.,1996). As a feeling or opinion generated within a global domain(Francescato et al., 1987) residential satisfaction forms part of asystem whose components act together. Therefore overall satisfac-tion with the place of residence will be regarded as a dependent orcriterion variable.
MATERIAL AND METHODS
Source
The data comes from a telephone survey (using the ComputerAssisted Telephone Interviewing) conducted in March 1998 witha sample of 1148 respondents representing the people aged between65 and 84 years old who live in family housing in the municipality ofMadrid (465697 people according to the Municipal Census updatedin December 1997). Layered random sampling was used with allo-cation proportional to the size of each layer. The permitted error was3% for a confidence level of 95%.
The layers were established according to gender, age (65 to 74years old and 75 to 84 years old), household size (1, 2, 3 and moremembers) and residential zoning (the 21 municipal neighbourhoodswere grouped in 4 zones: Centre, New Suburbs, Northern Outskirtsand Southern Outskirts). The upper age limit was used for technicalpurposes; the fact that it was a telephone survey, and that physicaland mental weakness rises in line with age could increase the rateof non-response, which is especially significant among the elderly(Broese Van Groenou et al., 1995).
Using a telephone survey had no notable deviation on the sample,inasmuch as 99.98% of the population between 65 and 84 yearsold say that they have a telephone at home (Comunidad de Madrid,

AGEING IN PLACE 177
Censos de Población y Vivienda de 1991). Telephone surveys havebeen adopted as a method to obtain information by most profes-sionals (de Leeuw and Nicholls, 1996), and has also been used inother countries to interview the elderly population (Anderson andLongino, 1994).
The survey was divided into five blocks of information: way ofliving and place of residence, home and building, neighbourhoodand neighbours, change of residence and demographic and socio-economic characteristics.
Definition of the Independent Variables
In order to simplify the volume of data and understand the issuebetter, thePrincipal Components Analysismethod was used toconduct a factor analysis of each residential satisfaction attribute:
Population: four main factors or components accounted for theinformation of 9 variables, explaining 74% of the cumulative vari-ance: socio-economic status, degree of ageing in the household,structure of the household and conditions of health.
Home: the analysis of 20 variables resulted in a solution of eightcomponents that accounted for 68% of the variance: satisfactionwith the attributes of the house, adaptability and personalisation,availability of space, degree of control over decisions affecting thehome, comfort, basic and necessary levels of quality, inadaptabilityand privacy.
Building or estate: two components showed the information of 7variables, explaining 59% of the variance: satisfaction with specificelements and level of amenities.
District and neighbourhood: the factorial solution of 25 variablesbreaks down into seven components that explain 54% of the vari-ance: accessibility to neighbourhood services, integration throughpopular activities, close social network or neighbours (2 compon-ents), performance of activities that depend on external supply,perception of the environmental quality, and space in which onelives.
178 FERMINA ROJO PEREZ ET AL.
In addition to these 21 components, gender, marital status andposition in the household, and two original variables, namely timetaken to reach means of public transport and presence of relativesliving in the neighbourhood (which showed no correlation withothers to form part of the factors) were also used as independentvariables.
Dependent Variable: Overall Residential Satisfaction
Five of the survey’s questions address residential satisfaction fromdifferent perspectives: three of these variables address satisfactionwith one’s way of living and place of residence, with one’s houseand relations with the neighbours, and are expressed on a scaleof four levels: not at all satisfied, not very satisfied, quite satisfiedand very satisfied; perception of one’s neighbourhood is expressedin five levels: very bad, bad, not too bad, good and very good.Finally, the desire to move is expressed in three categories: doesnot know/no answer or hesitant, would change home and/or neigh-bourhood, would not change home or neighbourhood. These figureswere processed in an ordinal scale in numerical order.
These five variables of partial satisfaction were employed togenerate the overall residential satisfaction variable with aMultipleCorrespondences Analysis(MCA), using the HOMALS procedureof SPSS software. This technique measures the degree of associa-tion or Chi square distance between the categories of the variablesand calculates the co-ordinates or marks in the factorial spacewhich, displayed graphically, can be grouped in homogeneous types(Figure 1). This shows that there are four types of satisfaction: thefirst, formed by those that demonstrate zero satisfaction and theworst opinions about the neighbourhood, is not very compact anddoes not openly correspond to a tendency to residential mobility.The second set, formed by categories that express little satisfac-tion and an ordinary opinion about their neighbourhood, is moreconsistent and associated with a clear disposition to move. The thirdand fourth groups respectively, are formed by those who are quitesatisfied and happy with their neighbourhood and by those whoreport the highest levels of satisfaction and best opinions. Betweenthe two groups lie the elderly who would not change house or neigh-bourhood. The category of indecision (does not know/no answer)

AGEING IN PLACE 179
Figure 1. Multiple Correspondences Analysis among Residential SatisfactionVariables.
180 FERMINA ROJO PEREZ ET AL.
about residential mobility would be close to the category of limitedsatisfaction.
This analysis resulted in two factors that together account for79% of the variability of the categories. Factor or dimension 1 is theone that best expresses the different levels of satisfaction, assess-ment or desire to move, and accounts for the highest proportion ofjoint variance. Therefore the scores were added to the original datafile and used as dependent variable or overall residential satisfaction.
To check that the original figures had been reflected properly inthe scores of the dimensions obtained with the MCA, aDiscrimi-nant Analysiswas conducted for each of the 5 satisfaction variables.The results were satisfactory because more than 75% of the casesof satisfaction with the home, satisfaction with the way of livingand place of residence and the propensity to move were classifiedcorrectly, as were more than 64% of the cases of satisfaction withrelations with neighbours and opinions about the neighbourhood.
Analysis
Multiple Linear Regression Analysis(MLRA) has provided suitablesolutions in other research that has sought to identify residentialsatisfaction predictors. These include satisfaction with partial attrib-utes of the residential environment, such as the home and neigh-bourhood among the general population (Davis and Fine-Davis,1981; Fried, 1982), among low-income families (Bruin and Cook,1997), in council housing areas in several renovated neighbour-hoods of the municipality of Madrid (Amérigo, 1995), in limitedand protected spaces such as the so-called “exclusive condomi-niums in Brazil” or Gate-Guarded Neighbourhoods (Carvalho etal., 1997); housing satisfaction (Golant, 1982); satisfaction with thehome in line with four types of housing (Hourihan, 1984). Therehave also been studies of overall residential satisfaction (Jirovec etal., 1985), or overall residential satisfaction in multifamily dwellings(Francescato et al., 1979; Weidemann et al., 1982; Francescato et al.,1987); the perception of welfare (Mookherjee, 1992); satisfactionwith the home in line with residential mobility desire and expec-tations (Morris et al., 1976); satisfaction with several attributes ofthe residential environment (García Mira, 1997; Rohe and Basolo,1997).

AGEING IN PLACE 181
MLRA was used with the elderly population group to discoverthe predictors of residential satisfaction with the house and neigh-bourhood attributes among elderly women (Carp and Christensen,1986), the Perceived Environmental Quality Index, (PEQI) amongelderly women (Christensen and Carp, 1987), life satisfactionamong elderly women (Cutler Riddick, 1985), satisfaction with thehome among the over 60’s (Golant, 1982), and the residential satis-faction of elderly people who live in the city centre (Ginsberg,1987).
In this respect, MLRA was the statistical procedure used to tryto meet the main objective of this study, namely to identify thepredictors of residential satisfaction among the elderly of Madridand to determine the relative importance of each.
MLRA is a statistical technique that lets one study the relation-ship between multiple independent variables (or predictors) and adependent variable or criterion. The strength or intensity of the rela-tion, i.e., the extent to which the degree the dependent variable isexplained by the regression equation, is measured by the squaremultiple correlation coefficient (R2). The stepwise selection methodwas chosen for the MLRA, with a probability of F-to-enter≤ 0.05,and a probability of F-to-remove of 0.1.
It is hard to calculate each independent variable’s importance indetermining the criterion (Bisquerra, 1989; Norusis, 1990). Hencein the overall residential satisfaction model several parameters havebeen considered: the regression coefficients (B), which indicate theirweight in the equation to predict the result of the dependent vari-able; the correlation coefficients with the criterion (r), which help toestablish the importance of the relationship between the dependentand each independent variables; the standardised regression coeffi-cients (Beta), which permit comparison when the variables are notmeasured in the same units; the change or increment generated incorrelation coefficient R2 when a variable is entered in the equation;and the contribution coefficient as a product of the correlation r andthe beta coefficient (Bisquerra, 1989) to calculate the proportion ofthe dependent variable explained by each independent variable.

18
2F
ER
MIN
AR
OJO
PE
RE
ZE
TA
L.
TABLE I
Socio-demographic Features of Elderly People Living in Family Housing in Madrid(Figures are showed in %, except for member of valid cases in brackets)
Variables Labels Total Gender Age
Male Female 65–74 75–84
(N. of cases) (1148) (468) (680) (775) (373)
AGE Mean (years old) 72.24 71.75 72.56
MARITAL STATUS Single 6.80 2.36 (***) 9.85 6.59 (***) 7.24
(1147) Married 61.46 85.65 44.85 67.70 48.53
Widowed 30.60 10.71 44.26 24.29 43.70
Divorced/Separated 1.14 1.28 1.14 1.42 0.54
LEVEL OF EDUCATION Illiterate 4.01 1.28 (***) 5.88 3.74 (NS) 4.56
(1148) No formal studies, but ableto read and write
47.13 40.60 51.62 48.13 45.04
Finished at 14/15 years old 29.62 32.05 27.94 29.68 29.49
Finished at 16/19 years old 8.71 8.97 8.53 9.29 7.51
Post-Secondary(Non University Degree)
3.57 3.42 3.68 2.71 5.36
University Degree 6.97 13.68 2.35 6.45 8.04
AG
EIN
GIN
PLA
CE
18
3
TABLE I
Continued
Variables Labels Total Gender Age
Male Female 65–74 75–84
(N. of cases) (1148) (468) (680) (775) (373)
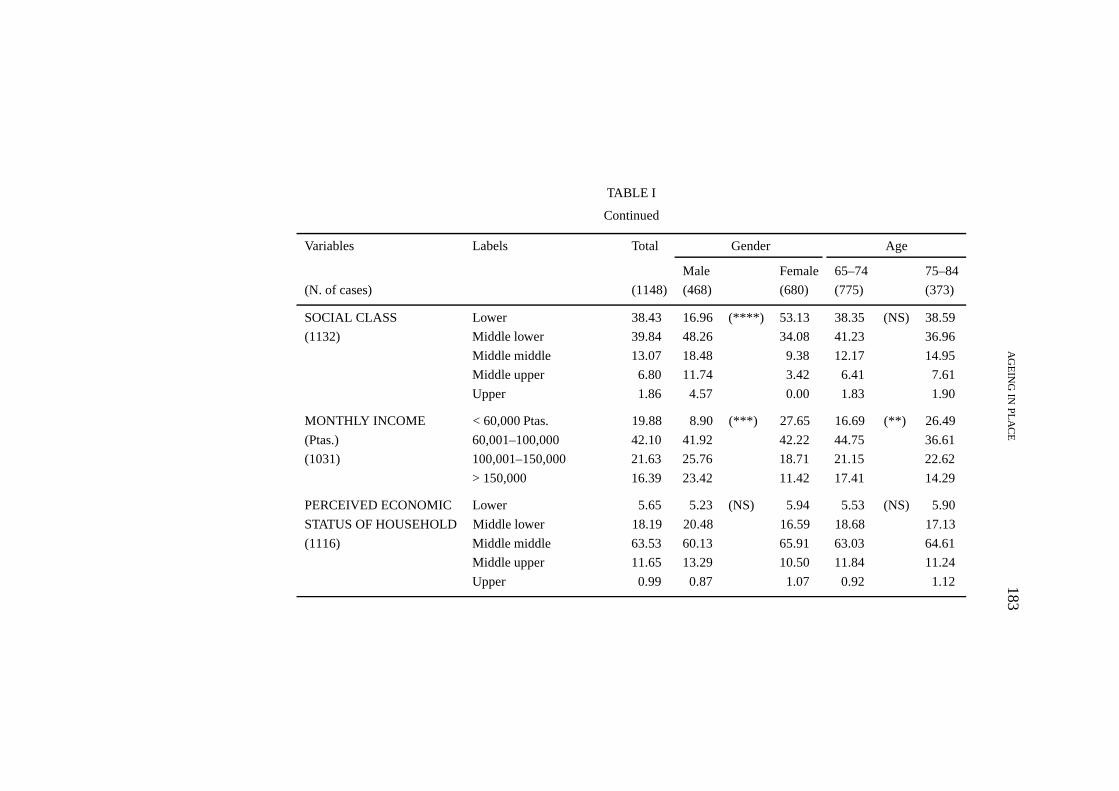
SOCIAL CLASS Lower 38.43 16.96 (****) 53.13 38.35 (NS) 38.59
(1132) Middle lower 39.84 48.26 34.08 41.23 36.96
Middle middle 13.07 18.48 9.38 12.17 14.95
Middle upper 6.80 11.74 3.42 6.41 7.61
Upper 1.86 4.57 0.00 1.83 1.90
MONTHLY INCOME < 60,000 Ptas. 19.88 8.90 (***) 27.65 16.69 (**) 26.49
(Ptas.) 60,001–100,000 42.10 41.92 42.22 44.75 36.61
(1031) 100,001–150,000 21.63 25.76 18.71 21.15 22.62
> 150,000 16.39 23.42 11.42 17.41 14.29
PERCEIVED ECONOMIC Lower 5.65 5.23 (NS) 5.94 5.53 (NS) 5.90
STATUS OF HOUSEHOLD Middle lower 18.19 20.48 16.59 18.68 17.13
(1116) Middle middle 63.53 60.13 65.91 63.03 64.61
Middle upper 11.65 13.29 10.50 11.84 11.24
Upper 0.99 0.87 1.07 0.92 1.12

18
4F
ER
MIN
AR
OJO
PE
RE
ZE
TA
L.
TABLE I
Continued
Variables Labels Total Gender Age
Male Female 65–74 75–84
(N. of cases) (1148) (468) (680) (775) (373)
PERCEIVED HEALTH Very bad 3.37 2.85 (*) 3.73 3.14 (*) 3.88
STATUS Bad 7.99 8.11 7.91 6.01 12.19
(1126) Fair 34.37 27.85 38.81 33.99 35.18
Good 38.10 43.64 34.33 39.74 34.63
Very good 16.16 17.54 15.22 17.12 14.13
WHO DOES THE Self 48.23 18.91 (MR) 68.30 46.94 (MR) 50.96
DOMESTIC WORK? Other person in household 24.38 50.43 6.55 25.95 21.10
(1132) Joint with other person inhousehold
23.06 29.78 18.45 25.29 18.36
Private domestic help(a salaried person)
15.55 11.96 18.01 13.56 19.73
Social home help forelderly people
1.06 0.22 1.64 0.65 1.92
A relative outside house-hold
1.68 1.09 2.08 0.91 3.29

AG
EIN
GIN
PLA
CE
18
5
TABLE I
Continued
Variables Labels Total Gender Age
Male Female 65–74 75–84
(N. of cases) (1148) (468) (680) (775) (373)
Other person outsidehousehold
1.06 0.87 1.19 0.78 1.64
Occasional help outsidehousehold (friend,
0.18 0.00 0.30 0.13 0.27
neighbour,. . . )
LIVING IN . . . Your own home 92.45 93.75 (NS) 91.56 93.65 (*) 89.92
(1139) Others’ home 7.55 6.25 8.44 6.35 10.08
IN THE HOUSEHOLD Household head 70.03 96.58 (***) 51.76 68.26 (*) 73.73
YOU ARE: Housewife 28.92 2.35 47.21 31.23 24.13
(1148) Other relative person’home
1.05 1.07 1.03 0.52 2.14
HOUSEHOLD Average number of people 2.20 2.42 2.05 2.31 1.98
(1148) Average age 66.46 65.40 67.16 63.12 73.40

18
6F
ER
MIN
AR
OJO
PE
RE
ZE
TA
L.
TABLE I
Continued
Variables Labels Total Gender Age
Male Female 65–74 75–84
(N. of cases) (1148) (468) (680) (775) (373)
LIVING . . . With spouse 39.73 56.21 (***) 28.38 40.78 (***) 37.54
(1148) With spouse, childrenand/or others
20.99 29.70 15.00 25.81 10.99
With children and/orothers
9.93 2.77 14.86 9.16 11.52
With others 6.01 3.20 7.94 5.80 6.43
Alone 23.34 8.12 33.82 18.45 33.52
Source: IEG,CSIC. (1998).Survey Aging in Place(Made by authors).(*) p < 0.005; (**) p < 0.001; (***) p < 0.0001; (NS) Non significant; (MR) Multiple response.
AGEING IN PLACE 187
RESULTS
Socio-Demographic Features of the Elderly
Ageing process in Madrid is characterised (Table I) by a consider-able internal ageing (1 out of 3 elderly aged 75 and over) as a resultof a general increase in the average life expectancy. Moreover, ahigh percentage of the elderly are female (sex ratio: 69%), due to ahigher male mortality at all ages.
With respect to marital status, 6 out of every 10 respondentsare married, 3 are widowed and 1 is single. Widowhood is notice-able among female, due once again to their longer life expectancy,and there are more unmarried woman, highlighting the genderimbalance on the marriage market as a consequence of the maleovermortality caused by historic events such as the 1918–1919 fluepidemic or the Spanish Civil War.
The data shows that many of these elderly have little level ofeducation. More than half have not had a proper education, althoughthe majority can read and write, and only 7% have a universitydegree. In general, the highest levels of education are found amongmen and the elderly aged 75 and over. This structure is the resultof the educational difficulties that arose in the 1930’s and 1940’s(around the time of the Civil War) and takes the form of a differentgender-based social category.
In social class terms, almost 8 out of every 10 elderly peopleare lower class, a better situation being observed among the men,because this variable has been calculated on the basis of their levelof education and profession before retirement.
62% of respondents declared a monthly income of less than100,000 pesetas, with 2 out of every 10 having less than 60,000pesetas/month. In 1998 in Spain, the average retirement pensionwas Ptas. 79700 a month (varying from 57500 for women to 90500for men) and the minimum wage was Ptas. 68040 (Ministerio deTrabajo y Asuntos Sociales, 1998). Due to the fact that pensionamounts depend on the type, with men accounting for most retire-ment pensions and women for most widow’s pensions (Ministeriode Trabajo y Asuntos Sociales, 1998), there are women and people75 and over in the lower income brackets.

188 FERMINA ROJO PEREZ ET AL.
Respondents’ subjective assessment of their household economywas more favourable than expected according to objective variablessuch as social class and level of income. The majority assignedtheir household to the middle-middle bracket and only 6% to thelower bracket. Gender and age does not seem to prompt significanteconomic self-assessment differences.
As for the perceived health status, more than half the elderlybetween 65 and 84 years old who live in Madrid said that theirhealth is good or very good; therefore this population group hasa better state of health than the one declared by the 65 and overnon-institutionalised Spanish elderly (42%, according to the Minis-terio de Sanidad y Consumo, 1999). Each gender’s social role alsoprompts differences in the performance of domestic chores, whichare traditionally women’s responsibility. However, a poorer stateof health among the female and oldest respondents would explainwhy they require home help to do the household chores in a greaterproportion than men and young-old.
The members of this population group usually live in their ownhome, where they are head of the household or else a housewife. Aloss of autonomy (due to health problems, drop in income, death ofthe spouse) would prompt a greater tendency among women and, inparticular, those aged 75 and over, to live in someone else’s house(normally their children’s).
The size of most households is barely more than 2 persons, albeita little larger among men and people aged under 75, most of whomshare their home with their spouse, with or without other people.In contrast, in smaller households one is more likely to find olderpeople and above all women, highlighting single-person householdsand any situations in which the elderly live with people other thantheir spouse.
As a result, the average age of the homes where younger elderlymen live is relatively lower than in homes where women and moreelderly people live.
Levels of Residential Satisfaction Reported by the Elderly
Elderly people of Madrid reported high levels of satisfaction (inexcess of 85%) with each of the issues about which they were asked(Figure 2). These results are supported by the fact that most of the
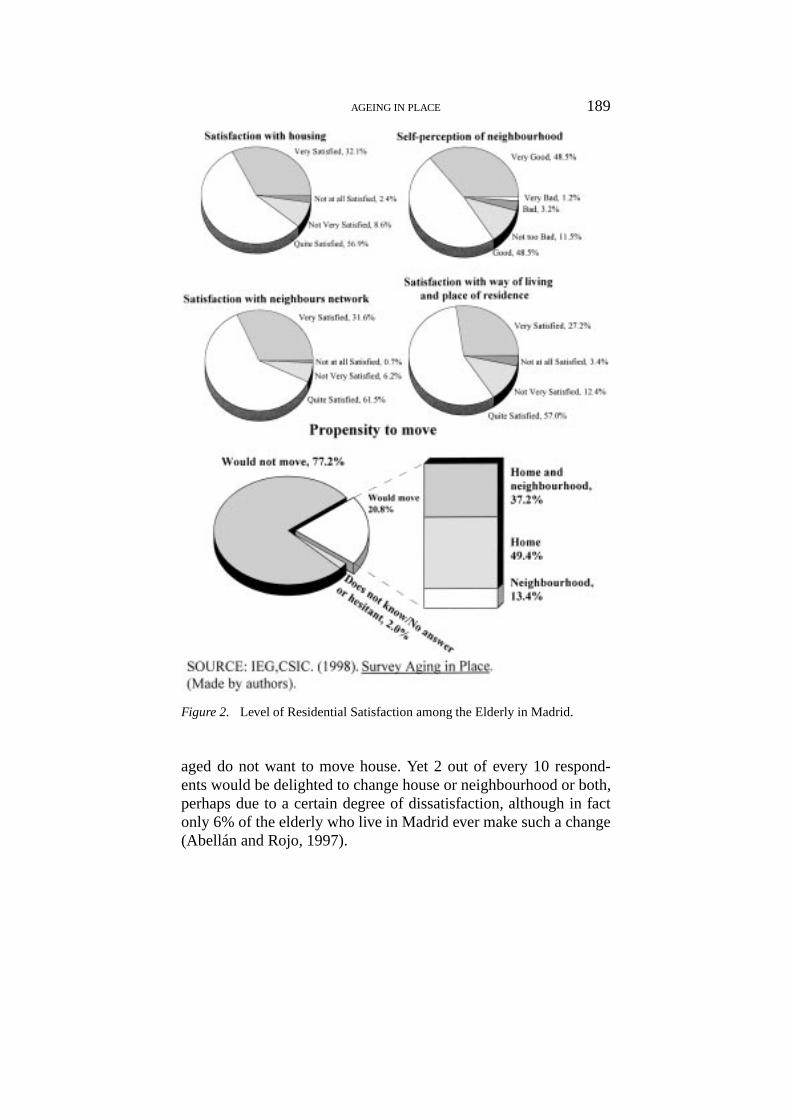
AGEING IN PLACE 189
Figure 2. Level of Residential Satisfaction among the Elderly in Madrid.
aged do not want to move house. Yet 2 out of every 10 respond-ents would be delighted to change house or neighbourhood or both,perhaps due to a certain degree of dissatisfaction, although in factonly 6% of the elderly who live in Madrid ever make such a change(Abellán and Rojo, 1997).

190 FERMINA ROJO PEREZ ET AL.
The highest-scoring issue is the relationship with neighbours,while the lowest-scoring issues are the neighbourhood and, overall,the way of life and the place of residence.
The degree of residential satisfaction varies according to gender.Women express the highest levels of satisfaction, although thedifferences are only statistically significant when respondents wereasked to rate their home or their neighbourhood. In both cases, thepercentage of very satisfied women is 10 points higher than thepercentage of men with the same opinion. This may be because,traditionally, women become more attached to their home andsurroundings (Fogel, 1993), on which they base their life and rela-tionships, whereas most men of these generations were more relatedto their working environment.
The level of residential satisfaction increases with age (Golant,1984; Gonyea et al., 1990) due to differing experiences with theresidential environment (Anderson and Longino, 1994), and alsothere are discrepancies within the elderly group. In this sense, thoseaged 75 and over reported a higher level of satisfaction, althoughthere were no significant differences in the field of neighbourlyrelations.
Consequently the desire or propensity to change home is moreevident among the younger elderly, while the oldest people prefernot to move or are more hesitant, perhaps due to their health status,and the fact that they are more vulnerable (Gonyea et al., 1990).
Predictors of Residential Satisfaction
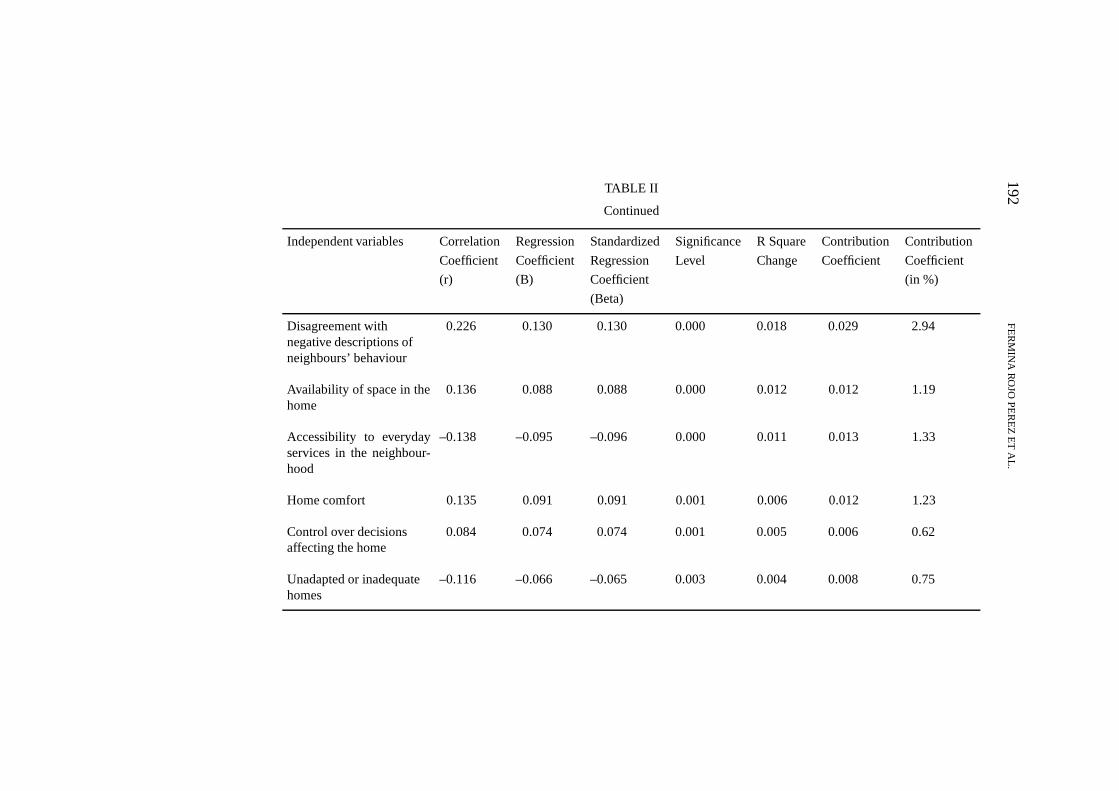
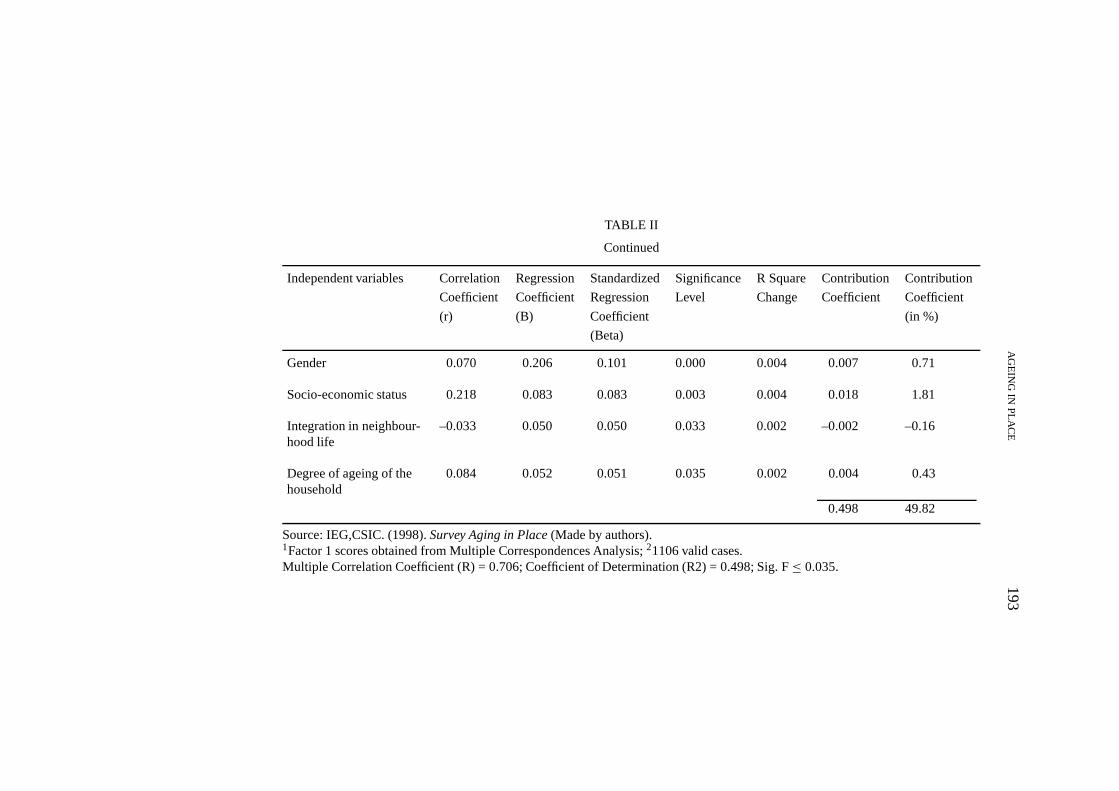
Of the information used to obtain the overall residential satisfactionpredictors from the multiple linear regression analysis, 14 principalcomponents or factors and 1 original variable were statisticallysignificant according to the criterion. The intensity or strength ofthe relationship between the independent and dependent variableswas 0.706, with a determination coefficient (or square multiplecorrelation coefficient, symbolised by R2) that explains 50% of thevariability of the overall residential satisfaction (Table II).
The first predictor of overall residential satisfaction issatisfactionwith home-related attributes(comfort, size, distribution, degree oflight, insulation), which accounts for 14.5% of the model’s contri-bution coefficient. Factor relating topeople’s perception of the envir-

AG
EIN
GIN
PLA
CE
19
1
TABLE II
Predictors of the Overall Residential Satisfaction (MCA scores)1 among the Elderly in Madrid2
Independent variables Correlation Regression Standardized Significance R Square Contribution Contribution
Coefficient Coefficient Regression Level Change Coefficient Coefficient
(r) (B) Coefficient (in %)
(Beta)
Constant –0.315
Satisfaction with home-related attributes
0.545 0.265 0.266 0.000 0.297 0.145 14.48
Perception of neighbour-hood environmentalquality
–0.434 –0.255 –0.256 0.000 0.052 0.111 11.12
Amenities in the building 0.257 0.117 0.117 0.000 0.029 0.030 3.01
Satisfaction with building-related attributes
0.502 0.145 0.145 0.000 0.031 0.073 7.28
Agreement with positiveaspects of neighbours
0.198 0.156 0.155 0.000 0.021 0.031 3.07
19
2F
ER
MIN
AR
OJO
PE
RE
ZE
TA
L.
TABLE II
Continued
Independent variables Correlation Regression Standardized Significance R Square Contribution Contribution
Coefficient Coefficient Regression Level Change Coefficient Coefficient
(r) (B) Coefficient (in %)
(Beta)
Disagreement withnegative descriptions ofneighbours’ behaviour
0.226 0.130 0.130 0.000 0.018 0.029 2.94
Availability of space in thehome
0.136 0.088 0.088 0.000 0.012 0.012 1.19
Accessibility to everydayservices in the neighbour-hood
–0.138 –0.095 –0.096 0.000 0.011 0.013 1.33
Home comfort 0.135 0.091 0.091 0.001 0.006 0.012 1.23
Control over decisionsaffecting the home
0.084 0.074 0.074 0.001 0.005 0.006 0.62
Unadapted or inadequatehomes
–0.116 –0.066 –0.065 0.003 0.004 0.008 0.75
AG
EIN
GIN
PLA
CE
19
3
TABLE II
Continued
Independent variables Correlation Regression Standardized Significance R Square Contribution Contribution
Coefficient Coefficient Regression Level Change Coefficient Coefficient
(r) (B) Coefficient (in %)
(Beta)
Gender 0.070 0.206 0.101 0.000 0.004 0.007 0.71
Socio-economic status 0.218 0.083 0.083 0.003 0.004 0.018 1.81
Integration in neighbour-hood life
–0.033 0.050 0.050 0.033 0.002 –0.002 –0.16
Degree of ageing of thehousehold
0.084 0.052 0.051 0.035 0.002 0.004 0.43
0.498 49.82
Source: IEG,CSIC. (1998).Survey Aging in Place(Made by authors).1Factor 1 scores obtained from Multiple Correspondences Analysis;21106 valid cases.Multiple Correlation Coefficient (R) = 0.706; Coefficient of Determination (R2) = 0.498; Sig. F≤ 0.035.
194 FERMINA ROJO PEREZ ET AL.
onmental quality of their neighbourhoodis the second predictor ofresidential satisfaction. This factor correlates the perception of alarger number of problems in the neighbourhood with two elements.Firstly, a lower level of satisfaction due to the existence of barriers(narrow pavements, streets in a poor state of repair, badly-parkedcars that make it hard for pedestrians to walk on pavements, road-works, etc.) that prevent obstacle-free mobility in the living spaceclosest to the place of residency. Second, a low level of satisfac-tion with the neighbourhood’s location inside the city, or with thedistance to relatives’ and/or friends’ homes, or even poor commu-nications. The fact that this factor appears with a negative signin the regression model indicates that the more negative elderlyMadrid residents feel about the environmental quality of theirneighbourhood, the lower their residential satisfaction will be.
The third and fourth predictors relate to thenumber and type ofamenities in buildingwhere the home is located and to the degreeof satisfaction with some of the building’s elements. Together thetwo factors account for 10.3% of the criterion variability, showingthe importance of the building in the prediction of residentialsatisfaction.
Factors related to theneighbours networkare the fifth and sixthparameters of the model. The former refers to aspects denoting thepositive aspects of neighbours: polite and friendly people who youcan ask for help in case of need, much like oneself or who even sharesimilar interests. The latter expresses the level of disagreement withnegative descriptions of neighbours’ behaviour: they do not meddlein other people’s private lives and are not troublesome, noisy, ordirty people. Each one accounts for 3% of the criterion variability.Yet what role do these two factors play in the prediction of overallresidential satisfaction? The higher the level of agreement aboutthe positive aspects of neighbours and the level of disagreementwith negative descriptions of neighbours’ behaviour, the higher theoverall residential satisfaction, respectively.
Availability of space in the homeis the seventh predictor ofoverall residential satisfaction, although it ranks eleventh in termsof the proportion of variance of the explained criterion (1.2%). Thisapparent digression of the regression parameters in the order of theindependent variables in explaining residential satisfaction shows

AGEING IN PLACE 195
how hard it is to calculate the relative importance of each one (cf.Bisquerra, 1989; Norusis, 1990; Hair et al., 1995). The inclusion ofthis factor in the model means that overall residential satisfactiondepends on the availability of space in the home, as an expressionof the relationship between variables such as the number of peopleper room or level of overcrowding, number of rooms, rating (large,small, etc.) and degree of satisfaction (very satisfied, quite satisfied,not very satisfied, . . . ) with the size of thehouse.
Predictor based on theaccessibility to everyday or local servicesin the neighbourhoodappears with negative sign in the regressionmodel, and accounts for 1.3% of the criterion variability. The lesstime respondents take reaching neighbourhood services, the highertheir satisfaction with the global residential environment will be.This factor defines accessibility, measured in walking time, to theservices that are used most frequently, and therefore termed “localor neighbourhood” services.
The degree ofhome comfortis another predictor of overallresidential satisfaction. This factor depends mainly on the numberof comfort amenities (air conditioning and dishwasher), but isalso affected by the amount of space available, measured by thenumber of rooms, any maintenance work done in the home and thenumber of necessary amenities (heating, bathtub, hot water, washingmachine, television, fridge). Therefore, the more comfort amenitiesand, secondly, necessary amenities are available, the more mainten-ance work done to the home and the more spacious the home, thehigher the residential satisfaction among the elderly will be.
Control over decisions affecting the homeis the tenth parameterof the equation. Home ownership and living in one’s own home (asopposed to living in ones’ children’s or another relative’s home) givethe elderly greater control over decisions regarding the home, thusincreasing their residential satisfaction. Home-related decisions maytake the form of the need or wish to renovate one’s home, and decideon a residential strategy (stay in the same house, or move and benefitfrom the economic advantages of selling the house). The inclusionof the predictor related to thelack of adaptability of the housein theregression model shows that the less degree of housing unadapted,the higher the overall residential satisfaction.
196 FERMINA ROJO PEREZ ET AL.
The housing unadapted factor is explained mainly by the main-tenance or refurbishing works that the home is though to need, but itis also affected by the variable that reports works performed already.Therefore the inverse relationship between the two indicates that themore urgent reforms are, the fewer the number of works alreadydone.
Gender predictorshow that being a woman propitiates anincrease in overall residential satisfaction. Meanwhile thesocio-economic statusfactor, despite entering the regression equationafter the gender variable, contributes to explain a larger proportionof the criterion and is more closely related to it. The higher thesocio-economic status, the higher the residential satisfaction.
The higher the degree ofintegration in neighbourhood life, meas-ured in terms of the frequency of participation in popular leisureactivities, the higher residential satisfaction will be.
The last significant predictor in the regression model is therelativedegree of ageing of the householdwhere the elderly peoplein Madrid live. The higher the average age of the members of thehousehold and of the elderly person, and the smaller the family,the higher the overall residential satisfaction. Thus age is a relevantfactor in satisfaction with the living space. The average age of thehouseholds that include an elderly person in Madrid is 66 years old,because 7 out of every 10 elderly people live in a 1 or 2-memberhousehold, and in the latter case, the spouse or partner also tends tobe elderly.
DISCUSSION
The present paper measures the level of residential satisfactionamong the population between 65–84 years old ageing in place.But the main purpose is to obtain the components of the residentialenvironment that predict the residential satisfaction. For first time inSpain and for this demographic group, these objectives are aimed.A multiple linear regression analysis is applied. According to thismodel, the R2 coefficient obtained (0.498) is much higher than thevalues obtained in other research into the issue (Fried, 1982; CutlerRiddick, 1985; Carp and Christensen, 1986; Christensen and Carp,1987; Mookherjee, 1992; Bruin and Cook, 1997; Rohe and Basolo,

AGEING IN PLACE 197
1997), and is exceeded slightly in very few cases (Jirovec et al.,1985; Amérigo, 1995; Carvalho et al., 1997).
The studies that have R2 values similar to the residential satisfac-tion of elderly people living in Madrid include Davis and Fine-Davis(1981) in relation to predictors of satisfaction with the home (R2
0.50) while the predictors of satisfaction with the neighbourhoodonly obtain an R2 of 0.23 from 18 variables. The same occurs withthe research carried out by Morris et al. (1976) into propensity tomove predictors; in this case, satisfaction with the home is explainedby an R2 of less than 0.20, the desire for mobility by an R2 of0.32, and the predictors of change of residence expectations explain49%. According to Weidemann et al. (1982), from 10 significantfactors account for 49.4% of the variance of residential satisfactionin multifamily dwellings. García Mira (1997) obtains an R2 of 0.52to explain satisfaction with the neighbourhood, 0.26 for satisfactionwith the home, 0.53 for satisfaction with the neighbours and 0.43 inoverall residential satisfaction.
Therefore the model used to predict overall residential satisfac-tion among the elderly in Madrid is acceptable when compared withthe aforementioned models, which achieve similar or even lowerlevels when explaining the variance of the dependent variable.
Attributes that exert more influence on the residential satisfac-tion are those related with housing and building where the houseis located as closer living areas. Housing attributes are related tothe comfort of the kitchen and bathroom, the distribution, size anddegree of insulation (in relation to noise, dampness and heat); it alsoreflects opinions about the level of light and ventilation. The highlevel of satisfaction with these physical aspects is also related tothe fact that most elderly people of Madrid consider their homes tobe free of physical obstacles or barriers, making it easier to movearound inside them.
Elderly people of Madrid live in spacious homes, both inobjective (number of rooms, number of people per room), andsubjective terms (rating and satisfaction with the size of the house).Overcrowding does not seem to be a problem among the elderly(Bromley, 1988; Cribier, 1988; Evandrou and Victor, 1989), and itwas observed that there is an average of 0.6 people per room, thatthey live in homes with an average of 3.9 rooms (excluding the bath-

198 FERMINA ROJO PEREZ ET AL.
room and kitchen), and this is helped by the fact that the average sizeof the household is 2.2 people, in most cases married or unmarriedcouples. Moreover, 60% of the elderly people think their home isnormal-sized (neither large nor small) and 66% are quite satisfiedwith the size of their home.
These figures could lead one to believe that the elderly enjoyprivacy in their homes, which is one of the principles that the resid-ential environment should satisfy (Pynoos and Regnier, 1991). Thus,most elderly people answered yes when asked if they have an inde-pendent bedroom or a room that is only used for sleeping in (95%),and those who do not have one, in other words, they share it withanother member who is not their spouse or partner, or use a roomthat is not only used for sleeping in, usually live in their children’sor another person’s home.
Home ownership, as tenancy giving a greater control overdecisions regarding the house, is the commonest among people ofall ages in Spain (Instituto Nacional de Estadística, 1995) and it ishigher among the elderly (Abellán et al., 1996). In Madrid, almost9 out of every 10 elderly people own the house in which they live,while 13% live in a rented home, and only a very small proportionin free housing (provided by their company or another institution).65% of the elderly people of Madrid who live in rented housing areancient sitting tenants who pay very low fixed rents (Abellán et al,1996). This situation will change steadily as a result of the 1994Urban Letting Act (Boletín Oficial del Estado, 1994), which allowslandlords to update leases and monthly rents. Nearly 4 out of every5 elderly people who lived in this kind of rented accommodation arehaving their rent brought up-to-date.
The ownership of the living house is higher among the youngerelderly, while the more elderly are more likely to update low fixedrental contracts. In terms of gender, men are more likely to livein a home that has been paid for in full or to live there free ofcharge, while women are more likely to rent their home or live ina home owned by relatives who may or may not live in the home.This situation could be a sign of the elderly’s level of competence,which perhaps is lower among women, due to their higher degreeof ageing, the larger proportion of widows and spinsters, tend moreto live alone, and have a higher level of residential dependency and,

AGEING IN PLACE 199
consequently, be more inclined than men to live in one’s children’sor other people’s home. Home ownership is also associated to highermonthly income.
Control over home-related decisions is also based on the fact thatmost Madrilenian elderly people live in their own home (92.5%),but the higher their age or the number of widows/widowers andspinsters/bachelors, the more likely they are to live elsewhere (intheir children’s home or other people’s home).
Home-related decisions may take the form of the need or wish torenovate one’s home, and decide about the place for ageing.
With regard to maintenance works, more than 9 out of every10 respondents have already had some type of works done in theirhome and around 28% say that they have 1 or more repair/renovationworks to do. The most frequent home maintenance and refurbishingworks include painting, plumbing and masonry work. Plumbinginclude the installation of new water pipes, heating and refurbishingthe kitchen. Plumbing and masonry is also involved in renovatingthe bathroom; indeed, this housing unadapted factor is supportednegatively by the bathroom comfort satisfaction variable. Tilingand changing the floor, installing built-in cupboards, closing off thebalcony to add more space to the home and installing or removingwalls are other reforms done or to be done in the home. To a lesserextent, respondents mention wiring and carpentry work.
These works are used not only to maintain antique or wornelements but also to renovate the home, sometimes to redistributethe surface area. Less than 1% of respondents said that they haveperformed or consider it necessary to perform works to adapt theirhome for disabled people.
One important aspect that has been related to home ownershipis the smaller tendency to residential mobility (Abellán and Rojo,1997). Therefore homeowners are the least likely of all elderlyMadrid residents to want to move home and/or neighbourhood,especially if the home has been paid for in full, giving them morefreedom when deciding whether to move house.
The building where the house is located is like a housingcontinuum and for this reason the elderly perceive it with a highsatisfaction. Number and type of amenities is an important featurein residential assessment. Thus, the higher the number of neces-
200 FERMINA ROJO PEREZ ET AL.
sary and comfort amenities in building the higher overall residentialsatisfaction will be. There are two types of building amenities:necessary (lift, central heating and central hot water) and comfort(city or natural gas facilities, a concierge, garden, garage and swim-ming pool). The high frequency of comfort amenities (more thanthree quarters of the elderly people of Madrid said they have oneof them) contrasts with the fact that this type of amenities seemnot to be strictly necessary in order for elderly people to go abouttheir everyday lives. However, 42% of respondents state that theyhave none of the necessary amenities, which are almost essential toelderly people’s life.
Residential satisfaction is also explained positively by satisfac-tion with certain aspects related to the building. These elements referto the appraisal of the quality of construction, and satisfaction withthe building’s amenities and how easy it is to enter the buildingwithout barriers or obstacles; also included is the satisfactionwith maintenance costs (the monthly fee, known as the “owners’community expenses”, which can include the cleaning of commonspaces, the concierge, lift, water, heating, etc.). The frequency tablesof these variables confirm a relatively high degree of satisfaction,albeit lower with regard to the amenities and maintenance costs.
Comparing the number of home comfort amenities (average of0.39) with the building’s number of amenities (average of 1.50) itseems clear that the level of quality and the degree of satisfactionwith the nearby residential space is based more on the building’samenities than on the home’s amenities. This is also borne out bythe regression analysis results, insofar as the predictor defined by thebuilding’s amenities (which ranks third) is relatively more importantin the regression equation than the home comfort factor.
The neighbourhood play an important role in residential satis-faction. For older people, the area around the house may be assignificant to wellbeing as the home itself (Carp and Carp, 1982).The more the elderly perceive a good environmental quality, feelthat the neighbourhood is free of barriers and note few problems,the higher their residential satisfaction will be. Indeed, more than aquarter of elderly respondents say that they do not note any (withan average of 1.15). The degree of satisfaction with the locationof the home and neighbourhood also appears as an element of the

AGEING IN PLACE 201
environmental quality factor. Indeed, of all the residential aspectsthat respondents were asked to report their degree of satisfaction,the highest marks went to the location of the neighbourhood, insofaras 94% of the elderly people in Madrid say they are quite or verysatisfied. There is a significant statistical association between satis-faction with the location and the time a respondent has lived in theneighbourhood, such that the most satisfied are those who have livedthere the longest.
Access to services and facilities in the neighbourhood areassessed by the elderly on the basis of their needs. In this respect,more frequently used services are those related to health. The out-patients specialist care, primary health care and senior citizens’leisure centres are the least accessible services. The average timetaken to reach these amenities is between 11 and 15 minutes, butaround a fifth of the elderly take up to 30 minutes. This may have anegative effect on those who need and use these services most, andcould even deter them from using such services.
On the other hand, the most accessible amenities are the localshops that sell everyday commodities (bakery, dairy, grocery, etc.),the parish council or other religious organisations and the neigh-bourhood supermarkets, with an intermediate degree of access togreen areas, parks and gardens, which are always less than 10minutes away.
To a certain extent, the time taken to reach an amenity dependson the number of amenities and their location, yet obviously it alsodepends on each individual’s physical ability. The analysis of therelationship between the variable perceived health status and thefactorial scores of the time spent reaching neighbourhood servicesconfirms that the better one’s state of health, the higher accessibility.
To carry out leisure activities is a way of integration in neigh-bourhood life. The commonest one is meeting other people (friends,neighbours, acquaintances, colleagues) in the street, square or park.It is a passive activity, in the sense that it requires no great physicaleffort and, moreover, it does not cost much. However, less than 2out of every 10 elderly persons say they go to a senior citizen’s club,and even fewer go to neighbourhood parties, sports facilities, or takepart in demonstrations or collecting signatures to solve problems inthe neighbourhood.

202 FERMINA ROJO PEREZ ET AL.
Among the elderly, irrelevant importance is given to children orother relatives living in the neighbourhood, and the overall resid-ential satisfaction is more related to network neighbours. In fact,having relatives in the neighbourhood is no significant in the model.Carp and Carp (1982) in a research on the residential environmentalquality among people aged 25 years old and over pointed out thathaving relatives and friends nearby was less important across agethan having friendly people in the area.
In residential system, less powerful elements in predicting satis-faction are those related to sociodemographic features of the elderly.But a highest level of satisfaction is pointed out among women andamong the aged. Due to the social and family role that aged womenhave played all their life, they assess their residential environmentin a different way to men, tending to be tied more closely to thehome and the neighbourhood. Their close relations with neighbourscould be another element that ties them to their living environment.In short, women are more strongly tied to their residential environ-ment due to the fact that they spend more time at home than men(Danermark and Ekström, 1990; Fogel, 1993).
There is a directly proportional relationship between the level ofeducation, social class, self-assessment of the household economyand monthly income, and the higher these parameters, the moresatisfied the elderly are with each of the residential environmentsconsidered and the less they want to move house.
CONCLUSIONS
Residential satisfaction among the elderly people living in Madrid isvery high, similar to the levels reported by other studies (Herzog andRodgers, 1981; Golant, 1984; Francescato et al., 1987; Cohn andSugar, 1991; Lawton, 1991), and is highest among the oldest people(Golant, 1984) and among women. An analysis of residential satis-faction literature shows that different researchers have sought a widevariety of objectives and used different questionnaires. According tothe bibliography, there is a long list of predictors to determining theresidential satisfaction (Amérigo and Aragonés, 1997), and there-fore a more in-depth comparison, rather than just a description oflevels of satisfaction, is not practicable (Canter and Rees, 1982).

AGEING IN PLACE 203
The overall residential satisfaction parameter is not an isolatedelement, nor does it depend on aspects that are only related to aresidential environment attribute, and it is affected by many factors.The results of the multiple linear regression analysis, used to obtainthe predictors of residential satisfaction among the elderly people ofMadrid, confirm the idea that it is a broad global construct.
According to the regression model, this investigation reveals thatoverall residential satisfaction results from the interaction of mostelements of the residential system, as shown by the fact that home-related aspects account for 18.3% of the criterion variability, whileneighbourhood-related aspects account for 18.2%, and 10.3% beingaccounted for by the building in which the home is located. Demo-graphic features are the least important attributes (2.9%), and areexpressed by the gender variable and the factors related to the degreeof ageing in the household and the socio-economic situation, thelatter having the biggest effect on satisfaction.
If the regression equation predicts half the variance of the overallresidential satisfaction, that means that other factors, together withthe intrinsic variability of the respondents, could help predictthe criterion in a larger proportion of variance. Therefore furtherresearch should be conducted to find other components of thephenomenon and achieve a more predictive model.
Among the 15 predictors selected, 5 are clearly subjective, andcontribute the highest amounts (41.9%) to the prediction of theoverall residential satisfaction, implying that satisfaction is a resultof the perceived life situation (Golant, 1982) as a reflection ofobjective and modifiable conditions.
Adapting the residential environment (in terms of amenities andaccessibility to services, both at home and the neighbourhood) couldplay an essential role in avoiding or mitigating a possible rupturebetween the elderly and their environment. Therefore there are tworeasons why this type of studies should be conducted in order tosupport theideal situation of ageing in place. Firstly, they wouldprovide the information required to carry out any changes neededto adapt the living space to residents’ needs; secondly, they wouldbe of interest as the basis for designing and developing anin situhousing policy for the elderly.

204 FERMINA ROJO PEREZ ET AL.
REFERENCES
Abellán, A., G. Fernández-Mayoralas, V. Rodríguez and F. Rojo: 1996, Envejeceren España. Manual Estadístico sobre el Envejecimiento de la Población(Fundación Caja de Madrid, Madrid).
Abellán, A. and F. Rojo: 1997, ‘Migración y movilidad residencial de las personasde edad en Madrid’, Anales de Geografía de la Universidad Complutense 17,pp. 175–193.
Amérigo, M.: 1995, Satisfacción residencial. Un análisis psicológico de lavivienda y su entorno (Alianza Editorial, Madrid).
Amérigo, M. and J. I. Aragonés: 1988, ‘Satisfacción residencial en un barrioremodelado: Predictores físicos y sociales’, Revista de Psicología Social 3,pp. 61–70.
Amérigo, M. and J. I. Aragonés: 1997, ‘A theoretical and methodologicalapproach to the study of residential satisfaction’, Journal of EnvironmentalPsychology 17, pp. 47–57.
Anderson, R. T. and Ch. F. Longino: 1994, ‘Concepts and measurement of thehousing quality of older adults: developing a public-health approach’, in E. W.Folts and D. E. Yeatts (eds.), Housing and the Aging Population: Options forthe New Century (Garland, New York).
Aragonés, J. I. and M. Amérigo: 1987, ‘Movilidad residencial en la ciudad:factores determinantes y consecuencias’, Estudios sobre Consumo 11, pp. 97–105.
Arnold, Sh. B.: 1991, ‘Measurement of quality of life in the frail elderly’, in J.E. Birren, J. E. Lubben, J. C. Rowe and D. E. Deutchman (eds.), The Conceptand Measurement of Quality of Life in the Frail Elderly (Academic Press, SanDiego).
Baker, P. M. and M. J. Prince: 1990, ‘Supportive housing preferences among theelderly’, in L. A. Pastalan (ed.) Optimizing Housing for the Elderly: Homes notHouses (The Haworth Press, New York) [also published in Journal of Housingfor the Elderly, 1990, 7].
Birren, J. E. and L. Dieckmann: 1991, ‘Concepts and Content of Quality of Lifein the Later Years: An Overview’, in J. E. Birren, J. E. Lubben, J. C. Rowe andD. E. Deutchman (eds.), The Concept and Measurement of Quality of Life inthe Frail Elderly (Academic Press, San Diego).
Bisquerra, R.: 1989, Introducción conceptual al análisis multivariable. Unenfoque informático con los paquetes SPSS-X, BMDP, LISREL y SPAD (PPU,Barcelona).
Boletín Oficial del Estado: 1994, ‘Ley 29/1994 de 24 de Noviembre de Arren-damientos Urbanos’, Boletín Oficial del Estado 282, pp. 36129–36146.
Bond, J.: 1993, ‘Living arrangements of elderly people’, in J. Bond, P. Colemanand Sh. Peace (eds.), Ageing in Society. An Introduction to Social Gerontology(Sage, London).
Broese Van Groenu, M., Th. Van Tilburg, E. de Leeuw and A. C. Liefbroer: 1995,‘Data collection’, in C. P. M. Knipscheer, J. de Jong Gierveld, T. G. Van Tilburg

AGEING IN PLACE 205
and P. A. Dykstra (eds.), Living Arrangements and Social Networks of OlderAdults (V. U. University Press, V. U. Boekhandel, Amsterdam).
Bromley, D. B.: 1988, Human Ageing. An Introduction to Gerontology (PenguinBookds, Harmondsworth).
Bruin, M. J. and Ch. C. Cook: 1997, ‘Understanding constraints and residen-tial satisfaction among low-income single-parent families’, Environment andBehavior 29, pp. 532–553.
Callahan, J. J. Jr.: 1993, ‘Introduction: Aging in Place’, in J. J. Jr. Callahan (ed.),Aging in Place (Baywood Publishing Company, Amityville, New York).
Canter, D. and K. Rees: 1982, ‘A multivariate model of housing satisfaction’,International Review of Applied Psychology 31, pp. 185–208.
Carp, F. M. and A. Carp: 1982, ‘The ideal residential area’, Research on Aging 4,pp. 411–439.
Carp, F. M. and D. L. Christensen: 1986, ‘Technical environmental assessmentpredictors of residential satisfaction. A study of elderly women living alone’,Research on Aging 8, pp. 269–287.
Carvalho, M., R. Varkki George and K. H. Anthony: 1997, ‘Residential satis-faction in condomínios exclusivos gate-guarded neighborhoods’, in Brazil,Environment and Behavior 29, pp. 734–768.
Cohn, J. and J. A. Sugar: 1991, ‘Determinants of quality of life in institu-tions: Perceptions of frail older residents, staff and families’, in J. E. Birren,J. E. Lubben, J. C. Rowe and D. E. Deutchman (eds.), The Concept andMeasurement of Quality of Life in the Frail Elderly (Academic Press, SanDiego).
Comunidad de Madrid. Censos de Población y Vivienda de 1991, Población de 65y más años residente en vivienda familiar en el municipio de Madrid (electronicfile).
Cribier, F.: 1988, ‘Le Logement à l’heure de la Retraite: l’example des Parisiens’,in C. Bonvalet and P. Merlin (eds.), Transformation de la Famille et Hátitat(INED: Travaux et Documents Cahier 120, Paris).
Cutler Riddick, C.: 1985, ‘Life satisfaction for older female homemakers, retireesand workers’, Research on Aging 7, pp. 383–393.
Christensen, D. L. and F. M. Carp: 1987, ‘PEQI-based environmental predictorsof the residential satisfaction of older women’, Journal of EnvironmentalPsychology 7, pp. 45–64.
Danermark, B. and M. Ekström: 1990, ‘Relocation and health effects on theelderly: a commented research review’, Journal of Sociology and Social Welfare17, pp. 25–49.
Davis, E. E. and M. Fine-Davis: 1981, ‘Predictors of satisfaction with housingand neighbourhood: a nationwide study in the Republic of Ireland’, SocialIndicators Research 9, pp. 477–494.
De Leeuw, E. D. and W. L. II Nicholls: 1996, ‘Technological innovations in datacollection: acceptance, data quality and costs’, Sociological Research Online1, 4.

206 FERMINA ROJO PEREZ ET AL.
Evandrou, M. and Ch. Victor: 1989, ‘Differentiation in later life: Social class andhousing tenure cleavages’, in B. Bytheway, T. Keil, P. Pallatt and A. Bryman(eds.), Becoming and Being Old. Sociological Approaches to Later Life (SagePublications, London).
Fernández-Ballesteros, R., M. D. Zamarrón and A. Madia: 1997, Calidad de vidaen la vejez en los distintos (Ministerio de Trabajo y Asuntos Sociales, InstitutoNacional de Servicios Sociales, Madrid).
Fogel, B. S.: 1993, ‘Psychological aspects of staying at home’, in J. J. Jr. Callahan(ed.) Aging in Place (Baywood Publishing Company, Amityville, New York).
Fokkema, T., J. de Jong Gierveld and P. Nijkamp: 1996, ‘Big cities, big problems:Reason for the elderly to move?’, Urban Studies 33, pp. 353–377.
Francescato, G., S. Weidemann, J. R. Anderson and R. Chenoweth: 1979, Resid-ents’ Satisfaction in HUD-Assisted Housing: Design and Management Factors(U.S. Government Printing Office Prepared for the Office of Policy Develop-ment and Research, U.S. Department of Housing and Urban Development,Washington D.C.), Prepared by the University of Illinois, Housing Researchand Development Program, under contract H-2653.
Francescato, G., S. Weidemann, J. R. Anderson: 1987, ‘Residential satisfaction:Its uses and limitations in housing research’, in W. Van Vliet, H. Choldin, W.Michelson and D. Popeone (eds.), Housing and Neighborhoods. Theoretical andEmpirical Contributions (Greenwood Press, London).
Fried, M.: 1982, ‘Residential attachment: Sources of residential and communitysatisfaction’, Journal of Social Issues 38, pp. 107–119.
García Mira, R.: 1997, La ciudad percibida. Una psicología ambiental de losbarrios de A Coruña (Universidade da Coruña, Servicio de Publicacións, ACoruña).
Garland, J.: 1993, ‘Environment and behaviour: A health psychologyperspective’, in J. Bond, P. Coleman and Sh. Peace (eds.), Ageing in Society.An Introduction to Social Gerontology (Sage, London).
Gentile, K. M.: 1991, ‘A review of the literature on interventions and quality oflife in the frail elderly’, in J. E. Birren, J. E. Lubben, J. C. Rowe and D. E.Deutchman (eds.), The Concept and Measurement of Quality of Life in theFrail Elderly (Academic Press, San Diego).
George, L. K. and L. B. Bearon: 1980, Quality of Life in Older Persons. Meaningand Measurement (Human Sciences Press, New York).
Ginsberg, Y.: 1987, ‘The elderly in central Tel Aviv’, in W. Van Vliet, H. Choldin,W. Michelson and D. Popeone (eds.), Housing and Neighborhoods. Theoreticaland Empirical Contributions (Greenwood Press, London).
Golant, St. M.: 1982, ‘Individual differences underlying the dwelling satisfactionof the elderly’, Journal of Social Issues 38, pp. 121–133.
Golant, St. M.: 1984, ‘The effects of residential and activity behaviors on oldpeople’s environmental experiences’, in I. Altman, M. P. Lawton and J. F. Wohl-will (eds.), Elderly People and the Environment (Plenum Press, Serie: HumanBehavior and Environment, Advances in Theory and Research, New York).
AGEING IN PLACE 207
Gonyea, J. G., R. B. Hudson and G. B. Seltzer: 1990, ‘Housing preferences ofvulnerable elders in suburbia’, in L. A. Pastalan (ed.), Optimizing Housing forthe Elderly: Homes not Houses (The Haworth Press, New York) [also publishedin Journal of Housing for the Elderly, 1990, 7].
Grundy, M.: 1989, ‘Living arrangements and social support in later life’, in A.M. Warnes (ed.), Human Ageing and Later Life. Multidisciplinary Perspectives(Edward Arnold, London).
Hair, J. F., R. E. Anderson, R. L. Tatham and W. C. Black: 1995, MultivariateData Analysis with Readings (New Jersey, Englewood Cliffs).
Harootyan, R. A.: 1995, ‘Las casas en que viviremos. Accesibilidad y adapt-abilidad’, Revista de Gerontología 5, pp. 118-125 [also published in AgeingInternational, 22, pp. 47–53].
Herzog, A. R. and W. L. Rodgers: 1981, ‘The structure of subjective well-beingin different age groups’, Journal of Gerontology 36, pp. 472–479.
Hourihan, K.: 1984, ‘Context-Dependent models of residential satisfaction. Ananalysis of housing groups in Cork, Ireland’, Environment and Behavior 16,pp. 369–393.
Instituto Nacional de Estadística: 1995, Censo de Viviendas de: 1991. Tomo I.Resultados Nacionales (Instituto Nacional de Estadística, Madrid).
Jirovec, R. L., M. M. Jirovec and R. Bosse: 1985, ‘Residential satisfaction asa function of micro and macro environmental conditions among urban elderlymen’, Research on Aging 7, pp. 601–616.
Katz, S. and B. J. Gurland: 1991, ‘Science of quality of life of elders: Challengeand opportunity’, in J. E. Birren, J. E. Lubben, J. C. Rowe and D. E. Deutchman(eds.), The Concept and Measurement of Quality of Life in the Frail Elderly(Academic Press, San Diego).
Law, C. M. and A. M. Warnes: 1982, ‘The destination decision in retirementmigration’, in A. M. Warnes (ed.), Geographical Perspectives on the Elderly(Wiley, London).
Lawton, M. P.: 1991, ‘A multidimensional view of quality of life in frail elders’, inJ. E. Birren, J. E. Lubben, J. C. Rowe and D. E. Deutchman (eds.), The Conceptand Measurement of Quality of Life in the Frail Elderly (Academic Press, SanDiego).
Ministerio de Sanidad y Consumo: 1999, Encuesta Nacional de Salud de España1997 (Ministerio de Sanidad y Consumo, Madrid).
Ministerio de Trabajo y Asuntos Sociales: 1998, Anuario de Estadísticas Labo-rales y Asuntos Sociales (Ministerio de Trabajo y Asuntos Sociales, Madrid).
Mookherjee, H. N.: 1992, ‘Perceptions of well-being by metropolitan andnonmetropolitan populations in the United States’, The Journal of SocialPsychology 132, pp. 513–524.
Morris, E. W., S. R. Crull and M. Winter: 1976, ‘Housing norms, housingsatisfaction and propensity to move’, Journal of Marriage and the Family 38,pp. 309–321.
Norusis, M. J.: 1990, SPSS/PC + Statistics 4.0 for the IBM PC/XT/AT and PS/2(SPSS Inc., Chicago).

208 FERMINA ROJO PEREZ ET AL.
Pastalan, L. A. (ed.): 1990, Aging in Place: The Role of Housing and SocialSupports (The Haworth Press. New York).
Peace, Sh. M.: 1987, ‘Residential accommodation for dependent elderly peoplein Britain: the relationship between spatial structure and individuals lifestyle’,Espaces-Populations-Sociétés 1, pp. 281–290.
Pynoos, J. and V. Regnier: 1991, ‘Improving residential environments for frailelderly: Bridging the gap between theory and application’, in J. E. Birren,J. E. Lubben, J. C. Rowe and D. E. Deutchman (eds.), The Concept andMeasurement of Quality of Life in the Frail Elderly (Academic Press, SanDiego).
Rohe, W. M. and V. Basolo: 1997, ‘Long-term effects of homeownership on theself-perceptions and social interaction of low-income persons’, Environmentand Behavior 29, pp. 793–819.
Seed, Ph. and G. Lloyd: 1997, Quality of Life (Jessica Kingsley Publishers,London).
Setién, M. L.: 1993, Indicadores Sociales de Calidad de Vida. Un Sistema deMedición Aplicado al País Vasco (Centro de Investigaciones Sociológicas,Siglo XXI, Madrid).
Silverstone, B. M. and A. Horowitz, A.: 1993, ‘Aging in place. The role offamilies’, in J. J. Jr. Callahan (ed.), Aging in Place. Amityville (BaywoodPublishing Company, New York).
Speare, A.: 1974, ‘Residential satisfaction as an intervening variable in residentialmobility’, Demography 11, pp. 173–188.
Svensson, T.: 1991, ‘Intellectual exercise and quality of life in the frail elderly’, inJ. E. Birren, J. E. Lubben, J. C. Rowe and D. E. Deutchman (eds.), The Conceptand Measurement of Quality of Life in the Frail Elderly (Academic Press, SanDiego).
Weidemann, S., J. R. Anderson, D. J. Butterfield and P. M. O’Donell: 1982,‘Residents’ perception of satisfaction and safety. A basis for change in multi-family housing’, Environment and Behavior 14, pp. 695–724.
Institute of Economics and GeographySpanish Council for Scientific ResearchC/ Pinar, n◦ 2528006 Madrid, SpainE-mail: [email protected]
Top Related
Copyright © 2022 FDOKUMEN

