


Bahasa
Halaman
Hukum

1
Adaptive Behaviour in Urban Space;
Residential Mobility in Response to
Social Distance
This paper has been accepted (Nov. 2014) for publication in Urban Studies
DOI: 10.1177/0042098014562344
Sako Musterd1, Wouter P.C. van Gent1, Marjolijn Das2 and Jan J. Latten1,2
1 Urban Geography, Centre for Urban Studies, University of Amsterdam 2 Statistics Netherlands
Corresponding author: Sako Musterd, Urban Geography, Centre for Urban
Studies, University of Amsterdam, P.O. Box 15629, 1001 NC Amsterdam Amsterdam, The Netherlands. Email: [email protected]
2
Adaptive Behaviour in Urban Space;
Residential Mobility in Response to
Social Distance
Abstract
The social relationship between an individual and their residential environment is shaped by a range of housing market rules and
regulations, by residential choice and by constraints. This paper elaborates on that relationship by focusing on the distance between an
individual’s (and his/her household) social position and the social position of the neighbourhood of residence. Through the analysis of large-scale
longitudinal register data for each resident in the four largest cities of the
Netherlands, we studied the relations mentioned, as well as the residential moves triggered by such relations, as well as the outcome effects on
individual-neighbourhood relations in the destination neighbourhoods. We found that the larger the social distance (positive or negative) between an
individual and the median social position of their residential neighbourhood, the higher the odds that the individual would move from
that neighbourhood. Those individuals that moved tended to select destination neighbourhoods that reduced their social distance. Our
findings offer new input for debates and policies relating to de-segregation and social mixing.
Introduction and research question
Urban populations are characterised by high levels of diversity (Glaeser,
2011), which is reflected in their social and spatial stratification. A familiar spatial expression of social strata is the differentiation between affluent
and poor neighbourhoods. Urban areas can also differ in other respects, such as household composition, or in the cultural backgrounds or lifestyles
of their residents. Classic studies of urban geography have addressed such patterns quite extensively (Brown and Horton, 1970; Robson, 1975;
Johnston, 1978). A century ago, Park and Burgess saw these developments mainly as ‘natural processes’, with parallels in biology
(‘urban ecology’). Current views are that social and economic segregation patterns within a city are produced and reproduced by a range of factors:
individual choices and limitations, the (local) economy, the structure of the housing market, flows of information across neighbourhoods and the
influence of institutions, with their rules and regulations (Wacquant, 1993; Burgers and Musterd, 2002; Atkinson, 2006; Sampson, 2012). With
3
regard to institutions, the welfare state regime is likely to play an
important role in the organisation of social spaces in the city. In classic social democratic welfare states with well-developed social housing
policies and firm spatial planning regulation, the physical separation of
residents in different social strata has often been cushioned. This could be seen as ‘early stage’ social mixing policy, which was genuinely meant to
mix different social strata. Conversely, more liberal regimes are less likely to redistribute wealth and regulate local housing markets. Consequently,
this gives greater freedom to these populations to choose their residential location. Deregulated markets generally lead to higher levels of
segregation and to homogenous local living environments (Musterd and Ostendorf, 1998; Reardon and Bischoff, 2011; Boterman and Van Gent,
2014). Segregation levels are higher because neighbourhood stratification is partly, yet substantially, structured by individual and household
preference and behaviour. Individual social-spatial preferences tend toward homogeneity (‘social homophily’) (McPherson et al., 2001;
Sampson, 2012): people prefer to live close to other people who are like themselves or, perhaps, who are in a slightly better social position. Even
weak individual preferences may lead to significant segregation at the
meso-level. Slight differences between neighbourhoods may lead to more selective residential and migration behaviour, which may lead to larger
differences between neighbourhoods, which may in turn lead to even more selective behaviour, thereby fuelling a positive feedback loop
(Schelling, 1971). In this paper we aim to add to the existing knowledge about the
extent to which individuals ‘match’ their own social position with the social composition of their living environment by focusing on residential mobility
behaviour. The key concept here is social distance. Social distance between people or groups indicates to what extent they are socially
similar (Fossett, 2006). In this study we focus on the social distance between a household and their neighbours. The notion of social distance
can be applied to all sorts of personal characteristics including affluence, family circumstances and education level. It may also be extended to
include ethnicity or culture. In this paper we focus on local social distance,
measured in terms of socio-economic position, or more specifically, the distance of the household income to the median income of all households
in its neighbourhood. To increase our understanding of social distance and homophily as
drivers of residential segregation, our paper will follow two lines of enquiry. First, we focus on households moving away from their
neighbourhood. We expect that when household incomes substantially differ from the neighbourhood median in positive or negative terms, they
are more likely to move out. We should note that for households with a relatively low income, the choice may not be a positive one. They may be
pushed out by households with higher incomes who have begun to dominate the area and transformed amenities in such a way that those
with lower income no longer feel at home or are not able to afford to live there anymore (Lees, 2008).
4
Secondly, we focus on the neighbourhoods which households move
into. We expect that households prefer to move to areas in which residents are not very different from themselves. Furthermore, it is
conceivable that households would like to live in a neighbourhood that is
slightly ‘higher on the social ladder’ (the aspiration category). These households perhaps prefer to live in a more respectable neighbourhood
because ‘a good postal code’ may have a positive effect in job interviews or result in a better choice of educational and civic resources. Indeed,
living in an area where the residents are slightly higher on the social ladder can be a means for individual upward social mobility (Musterd et
al., 2012). As such, we can make an analogy with Fielding’s escalator region hypothesis for the local level. He links individual social climbing
with moving physically “combining individual improvement with spatial manoeuvring” (Fielding, 1992, p. 3). This concept can equally be applied
to neighbourhoods within the greater urban region.
These two lines of enquiry translate into the following research questions:
Taking into account social and housing characteristics, what are the
odds of a household moving out of a neighbourhood when their social distance to that neighbourhood is increasingly higher or
lower?
To what degree do households reduce their social distance to the neighbourhood by moving to another neighbourhood, and to what
extent is there an aspiration category, i.e. households who move to neighbourhoods in which their neighbours generally have higher
incomes than they do?
We make use of integral data from Statistics Netherlands, comprising the entire population of the four major urban regions in the Netherlands. Our
study is conducted within one country and one time period, keeping the influence of legislation, the economy and the national housing market
context constant. Despite restructuring, The Netherlands has a strong
‘welfare state’ where there is a great deal of government involvement in the housing market and in the neighbourhoods, fairly little poverty (DNS,
2012) and limited social inequality compared to many other European countries (Korpi and Palme, 1998; Musterd and Ostendorf, 2012).
The next section will elaborate on some key conceptual issues and theoretical considerations regarding the relationship between the social
positions of individuals and households and social characteristics of living environments in urban regions. Here, we will also briefly pay attention to
the policy dimension of the key issues that are being addressed. Following this, we will explain our research methodology and data. This is followed
by the analyses and interpretation of the findings. Several robustness tests wrap up these analyses. We finish with a discussion and conclusion.
5
Theoretical background
Social distance
Social distance is a key concept in the social sciences that focusses on the
differences between groups. These can be social differences in education, profession or income, or differences in cultural background including
lifestyle, ethnicity, religion and origin. Here we will apply the concept of social distance in a geographical sense. This involves the distance of
individuals to the characteristics of their living environment, the basis of segregation (see for example Hamnett, 2003; Forrest et al., 2004;
Ostendorf and Musterd, 2012). There are studies about social dynamics in urban systems that deal with increasing social distance, which may lead to
increasing segregation (Atkinson and Flint, 2004; Fossett, 2006; Reardon and Bischoff, 2011). Most of these studies treat social distance as group
characteristic. Our approach adds to the literature because we treat social distance as a measure of the differences between a household’s social
position and the average social position of the neighbourhood population.
Homogenous neighbourhoods
Some research suggests that people prefer homogenous living environments in which most neighbours are similar to them. Hipp and
Boessen (2012), for example, found a negative relationship between the social distance amongst households in neighbourhoods and housing
demand: greater distance between households correlated with lower demand. In an earlier study Hipp and Perrin (2009) concluded that a
larger distance in terms of income, but also in terms of age, marital status, and the presence of children led to a decrease of the formation of
‘weak ties’ in their neighbourhoods. This supports other research findings. Blokland (2003), for example, noticed that different population strata
hardly interact with each other. A study in Bristol, England, showed that middle-class parents tended to move for schools they believed were better
for their children, even though they very much appreciated the diversity of the neighbourhood they left (Bridge, 2006). Apparently, the wish to
reproduce cultural capital via the educational system was stronger than
the wish to live in a diverse neighbourhood. Boterman (2013) came to a similar conclusion based on analysis of households in Amsterdam. A
French study suggests that the neighbours may have an effect on the school results of the children. The education level of adolescents is
influenced negatively by the presence of many poorly educated families in the neighbourhood (Goux and Maurin, 2007, p. 1210). Conversely, people
tend to dislike a situation in which their neighbours earn significantly more than they do (Luttmer, 2005).
Migration versus residential mobility
There are a fair number of studies on residential mobility motives, which show a clear difference between motives to move over a long distance and
motives to move over a short distance. Long-distance moves (migrations) are often economically motivated, such as those made for education or
6
employment reasons (De Jong and Fawcet, 1981). Nevertheless, young
people who enter university or college often end up in university towns and many stay there in later phases of life because of the economic
opportunities such environments offer (Kooiman and Latten, 2013). Short-
distance moves (residential moves) are influenced more by the housing market and by individual choices and constraints: people are searching for
a better quality home, as they might for example be entering a domestic partnership or starting a family (Boyle et al., 1998) or desiring a better
living environment. As a result of these findings we expect moves aimed at reducing social distance predominantly to be short-distance residential
moves.
Preferences to move to neighbourhoods with a social character that fits one’s own social position
Studies that pay specific attention to the relationship between social characteristics of residential movers and the social characteristics of living
environments are often classified within the field of gentrification. Part of the literature on gentrification suggests that poorer households are
replaced by socio-economically ‘stronger’ households in inner city
neighbourhoods (for example Smith, 1996; Lees, 2008; Slater, 2009). This literature posits that as socio-economically strong households would
move into an area they like, they create contrasts with socio-economically lower status residents already living there. The social distance between
them would eventually lead to displacement of the lower status residents. A different, although not conflictive, perspective on gentrification
processes emphasises upward social mobility of individual households; people would turn their own individual upward social mobility into a choice
for a home in a more fitting location (Hamnett, 2003; Freeman, 2005; Van Crieckingen, 2009). From this perspective, households are matching
their own rising social position to the neighbourhood’s status by moving to a neighbourhood with a (slightly) higher status. A variant of this process is
the household that has potential, but is not yet very strong in socio-economic terms and cannot move into a socio-economically stronger
neighbourhood with further upgrading potential, but which is able to move
to a neighbourhood that is socially not very distant from the household’s position. After settling, the household may realise upward social mobility,
which subsequently could contribute to further gentrification of the neighbourhood (McKinnish et al., 2010; Teernstra, 2014). These
processes may, of course, eventually create some new distances between the social level of the neighbourhood and some of its residents, which
indeed may trigger some new (forced or voluntary) out-migration as well. The empirical basis of the knowledge about the ‘social fit’ between
individuals and the neighbourhood they leave and enter is still rather limited, which is understandable, since such studies require linked
longitudinal individual and neighbourhood level data on social positions, combined with information on residential migration. These data are
scarce. We know of one study that comes close to the data requirements we mentioned, and that addressed elements of the questions we will
7
answer here. Clark et al. (2013) investigated spatial mobility and social
outcomes in the British context. They used the British Household Panel Survey and, based on a sample of 8,421 individuals they could follow
longitudinally, studied aspects that play a role in upward spatial mobility
(moving to more prosperous neighbourhoods, measured on the basis of the Index of Multiple Deprivation). They found that education and income
play a crucial role: people with a higher income and higher level of education move much more often to a neighbourhood of higher social
level than people living on a lower income. Those people with lower incomes and education levels stayed behind in deprived neighbourhoods.
Neighbourhood characteristics and tenure played a structuring role in the processes.
Apart from the study by Teernstra (2014), there is hardly any Dutch research linking the social position of individuals or households to the
neighbourhood average and to moving behaviour. Exceptions are studies that focus on ethnic segregation (Bolt et al., 2008; Doff and Kleinhans,
2011; Zorlu and Latten, 2010). A study by De Vries et al. (2007) ascertains that Amsterdam households who are moving up the economic
ladder and who move within Amsterdam tend to go to neighbourhoods
where the median income is higher. House prices and rents are also higher there. Those prices are apparently not determined by the physical
characteristics alone but also by the social characteristics of the people who are living there; both contribute to the neighbourhood’s reputation.
Neighbourhood housing values, quality of housing and economic prosperity of residents are intertwined in a complex way. In
neighbourhoods where the median income is higher, house price and rents are generally higher, too. People aim to live in the best quality dwellings
they can afford, so neighbourhoods with high-quality dwellings tend to be inhabited by people with high incomes whereas people with low incomes
tend to live in neighbourhoods with low-quality housing. However, the value of a house is not only determined by its physical quality, but also by
the socio-spatial characteristics of the neighbourhood, i.e. its location, amenities and residents.
Social mix policies and segregated homogeneous neighbourhoods Over the past decades social mixing policies appear to have taken centre
stage in many European cities. According to the literature there are several reasons why this type of intervention is so much in favour. First,
many politicians and some academics argue that in mixed communities ‘good’ role models would reduce the impact of ‘bad’ role models; because
‘positive’ socialisation processes will get a better chance; because social cohesion and social networks will become stronger; and because of a
reduction of segregation and stigmatisation of homogeneous poor urban neighbourhoods (see Wilson 1987, Friedrichs 1998; Kleinhans 2004).
Secondly, some argue that social mix policies are being developed out of fear for the development of ‘parallel societies’ and because concentrated
poverty is difficult to manage. Typically, this leads to policies where the integration of immigrants and poverty-related issues become obfuscated
8
(see Uitermark 2003, Phillips 2009). The two motives above indicate that
social mix policy may be developed on the basis of (practical) social motives. A more critical viewpoint is that social mixing policies are
promoted as part of a wider effort to facilitate middle class in the city, at
the expense of the urban poor. It is argued that increasing neo-liberalisation has led urban gentrification to have become an integral part
of housing and urban policies such as social mixing (see Lees 2008, Slater 2009; Van Gent 2013).
Obviously, social mix policies may have an important impact on the relationship between the social position of individual households and the
social composition of the neighbourhood. We should point out the importance of housing context here. In more liberal and deregulated
contexts, social mix policies may eventually lead to the development of socio-economically homogeneous neighbourhoods, as real estate
upgrading may affect property values in the neighbourhood and trigger gentrification. Conversely, in more regulated contexts, social mix policies
may result in a sustained social mix, as residents in social housing units will not be displaced. However, as hypothesised, we believe that the
impact of social mix policies is ultimately dependent on the opportunities
that households have to adapt their own situation to what they deem most suitable for themselves. We assume that even in contexts with a lot
of government intervention and regulation to maintain some degree of mixed population composition, a tendency towards a residential
environment that matches one’s own socio-economic position will be reflected in people’s mobility towards homogeneous environments. In this
study we will investigate that assumption.
Data and methods
The data we use are derived from the System of social statistical datasets (SSD). The database consists of longitudinal and integral data at the
individual level (i.e. not based on a sample) for each registered resident of
the Netherlands from 1999 onwards. This study used the data from September 2008 and 2009. This research analysed data relating to stable
households living in the four major urban regions of the Netherlands: Amsterdam, Rotterdam, The Hague and Utrecht in 2008. It included
people who did not move, people who moved within these regions and movers out of these regions. Per household, one adult reference person
was randomly selected for the analyses. Individuals living in institutions or in large non-family households such as student housing were excluded.
We limited the analysis to those aged 25-48 in order to capture the most economically-active portion of the population, especially in terms of
workforce participation and physical and social mobility. The expectation is that these individuals are most ‘sensitive’ to outside influences. The 48-
year age cut-off is related to data availability concerning education. We
9
opted to bound study areas according to urban regions rather than
municipalities because they better fit to the actual housing market areas. Within the urban regions included in this study, neighbourhood population
numbers varied greatly, ranging from 1 to 13,500 households, with an
average of 1,300 households per neighbourhood. Neighbourhoods with less than 100 households (20% of the neighbourhoods in this study) were
excluded from the analyses as we deemed them too sensitive to random fluctuations in the neighbourhood median of income.
The dependent variable, moving behaviour between 2008-2009, was split
into three categories:
- Moves outside the urban region. These are the long-distance moves (migrations) which are often economically motivated.
- Moves within the urban region but from the neighbourhood. These are the residential moves that are mainly influenced by residential
motives, household characteristics, housing quality, neighbourhood and housing market. Also, within the urban region, the existence of
local social ties and more knowledge and better perception of the
region’s neighbourhood structure may lead to different mobility flows between neighbourhoods (Sampson, 2012).
- Within the neighbourhood or not moving. This was used as a reference category.
We used multinomial logistic regression models for the analyses.
In the first analysis the main independent variable was the (2008) social distance, in this study measured as economic social distance, that is: the
distance between an individual’s household income and the median household income in the neighbourhood that person left. The household
income was calculated as the standardized incomes of households – the spendable income as defined by Statistics Netherlands. The incomes were
split into five classes:
- Much higher than the neighbourhood median (Individual income more than 75% higher than the median neighbourhood income)
- Higher than the neighbourhood median (Individual income 25%-75% higher than the median neighbourhood income)
- Around the neighbourhood median (Individual income between 25% lower than and 25% higher than the median neighbourhood
income) - Lower than the neighbourhood median (Individual income 25%-75%
lower than the median neighbourhood income) - Much lower than the neighbourhood median (Individual income
more than 75% lower than the median neighbourhood income).
We included a series of control variables that may play an important role in the residential mobility process and motives including demographic
10
dimensions such as age, sex, household type, ethnicity and social
dimensions, such as the level of education and yearly household income (corrected for number of household members). We also included labour
market transitions such as job changes from active to inactive or from
inactive to active between 2008-2009. Next we included two control variables regarding the position on the housing market: whether someone
owned or rented their home (in 2008); and whether someone lived in the municipality itself or in one of the surrounding areas within the urban
region (2008).
Household transitions during the life course (union formation and dissolution) are often a reason for a move (de Groot et al., 2011) but such
transitions are not the focus of this study. To rigorously control for these we decided to limit our population to individuals who had no household
transitions between September 2008 and September 2009 (so they remained a couple, a family or single). Yet we did include the transition of
households without a child to households with a child, and vice versa.
Lastly, we included a control variable that represented the level of
mismatch between the household income and the housing value (that value is available for both ownership and rental housing). People often
move in order to match the quality of their house to their income. This move is upward when they can afford a better house or downward when
they are forced to move to a cheaper dwelling after income loss. A mismatch of an individual’s housing quality and their income and a large
social distance with the neighbours may lead to very similar mobility patterns, since the value and the quality of housing in a neighbourhood
are highly related to the average income of its residents. Therefore, the variable ‘mismatch income/housing’ was included to control for moves
that were triggered by housing demands. It is defined as the household income divided by the value of the dwelling, in ten categories, with equal
numbers of individuals in each category (deciles). Households in the low deciles live in relatively expensive dwellings, compared to their household
income and when compared to the other households in our study
population. Households in the high deciles live in relatively cheap dwellings. We expect a higher probability of moving in both the low deciles
and the high deciles compared to the middle deciles: people in the high deciles may want a better quality house, whereas people in the low deciles
may be forced to move to a cheaper dwelling as they cannot afford to stay in a dwelling that is or has become too expensive for them.
The second analysis, in the form of a spatial mobility matrix, regards the social distance of the individual (and his or her household income) to
the level of the neighbourhood of destination in comparison to the social distance to the neighbourhood of origin.
Results
11
The first research question investigates whether a larger social distance
(between the household income and the median household income in the neighbourhood) leads to higher odds that stable households will move. To
answer this question we present two multinomial logistic regression
models: model 1 with background characteristics only and model 2 with background characteristics and the main explanatory variable (the social
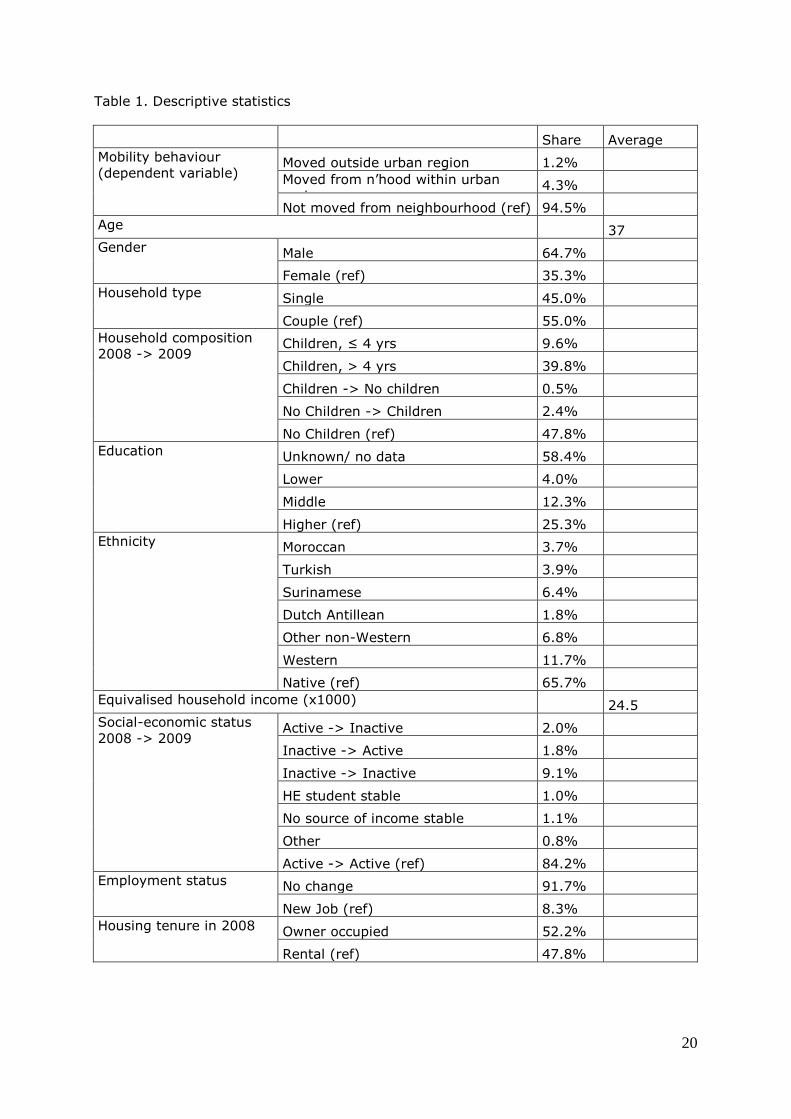
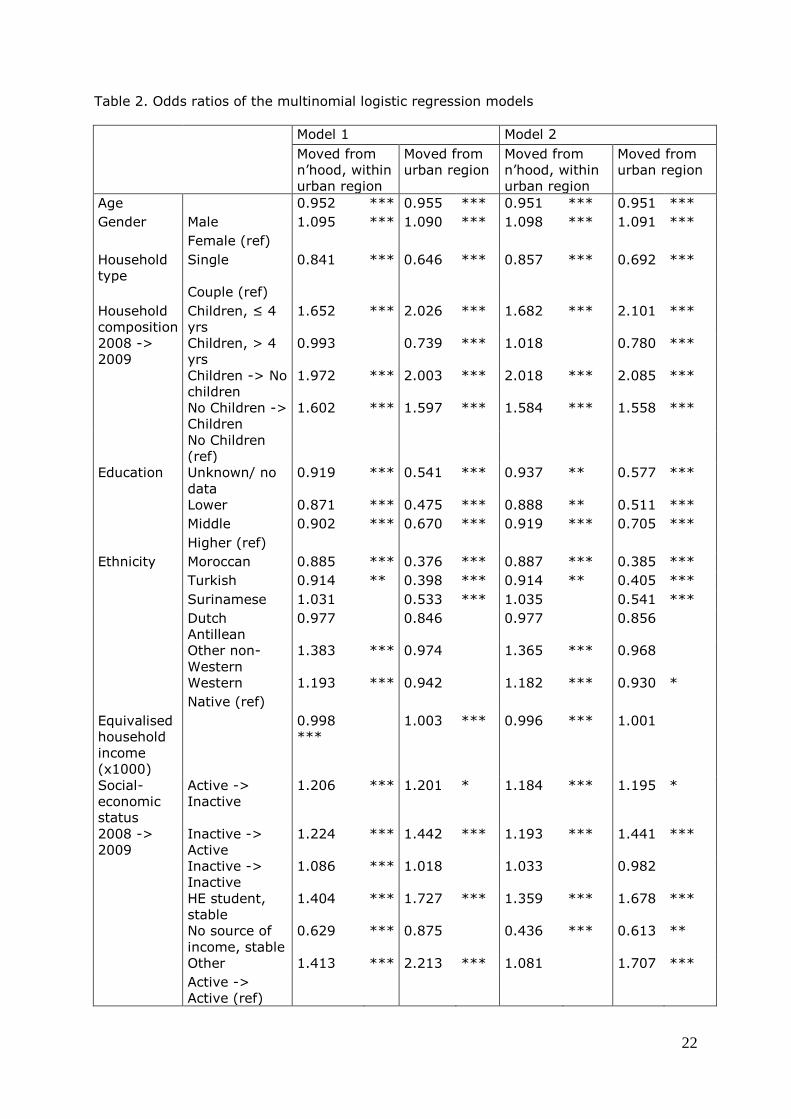
distance between the individual and their neighbourhood). Table 1 presents descriptive statistics of the variables used in the analysis. Table 2
shows the odds ratios, which can be interpreted as: less than 1: a smaller probability to move; more than 1 a higher probability to move for the
category under consideration compared to the reference category.
< Table 1 approx. here >
< Table 2 approx. here >
The influence of the control variables is as follows: older and single people are less likely to move, men move more often than women, and highly
educated people are more likely to move than less well educated people.
Households with young children and households that have undergone a major transformation (from a household with to a household without
children, and vice versa), are far more likely to move than stable households without children, whereas households with older children (over
four years old) are less likely to move. Native Dutch people are more likely to move outside the urban region than people with a Moroccan,
Turkish or Surinamese background. Turkish and Moroccans also move within the urban region less often than native Dutch, whereas people a
foreign background other than Moroccan, Turkish, Surinamese or Antillean do so more often.
Social transitions and changing jobs also raise the odds of moving; owners move less than people who rent their house, and people living in
the surrounding (suburban) municipalities move less than people living in the city. The (significance of the) effect of income is dependent on
whether or not social distance is included in the model. In the model
without social distance, a higher income is related to higher odds of moving out of the urban region, but there is no significant effect for
moving within the urban region. In the model with social distance, a higher income is related to lower odds of moving within the urban region,
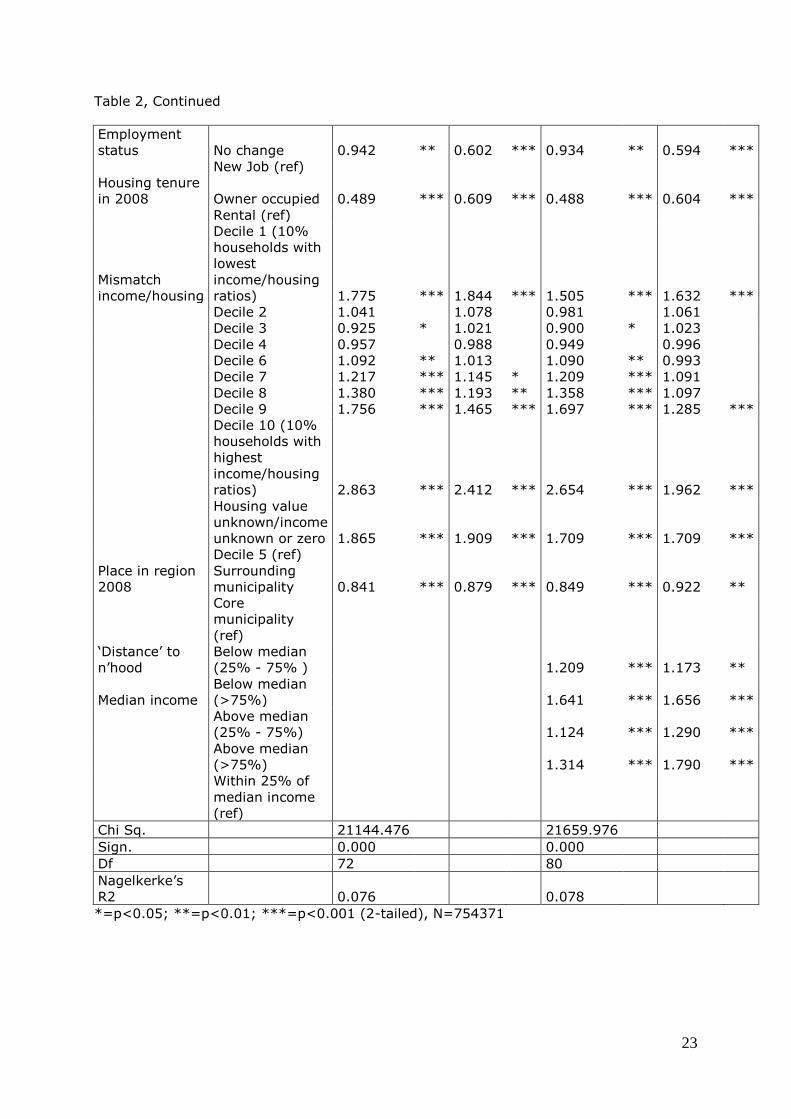
and there is no significant effect for moving out of the urban region. As expected, households with a relatively large mismatch between
their income and their housing move more often. Both households whose income is high compared to their housing value, and households with a
relatively low income, move more often. Households with a relatively high income probably ‘move to improve’ (Clark et al., 2013): they can afford a
better house. The moves of households that lived in (too) expensive dwellings may arise from financial necessity. The effect of mismatch on
moves within the urban region (residential mobility) is much stronger than its effect on moves out of the urban region. This is in accordance with
12
findings in the literature that residential mobility is often triggered by the
need for better housing. Our main finding is that when the variables just mentioned are kept
constant, the social distance between the individual and the
neighbourhood is significantly related to the odds of moving. In other words, the larger the social distance, the higher the odds of moving. The
striking aspect here is that both a positive and a negative social distance (being richer as well as being poorer than the neighbourhood median) is
related to a higher odds of moving. The conclusion is that a greater social distance to the neighbourhood indeed seems to be a reason to leave a
neighbourhood. We assumed that moving to a different living environment within the region would have more to do with neighbourhood
characteristics and characteristics of the dwelling than moves out of the region. Therefore, we expected that social distance would specifically
predict moving within the urban region, and not so much moving out of the urban region. This was not confirmed. In all cases the distinction
between moving within or outside the urban region hardly affects the odds ratios relating to the social distance between the individual and the
neighbourhood of departure.
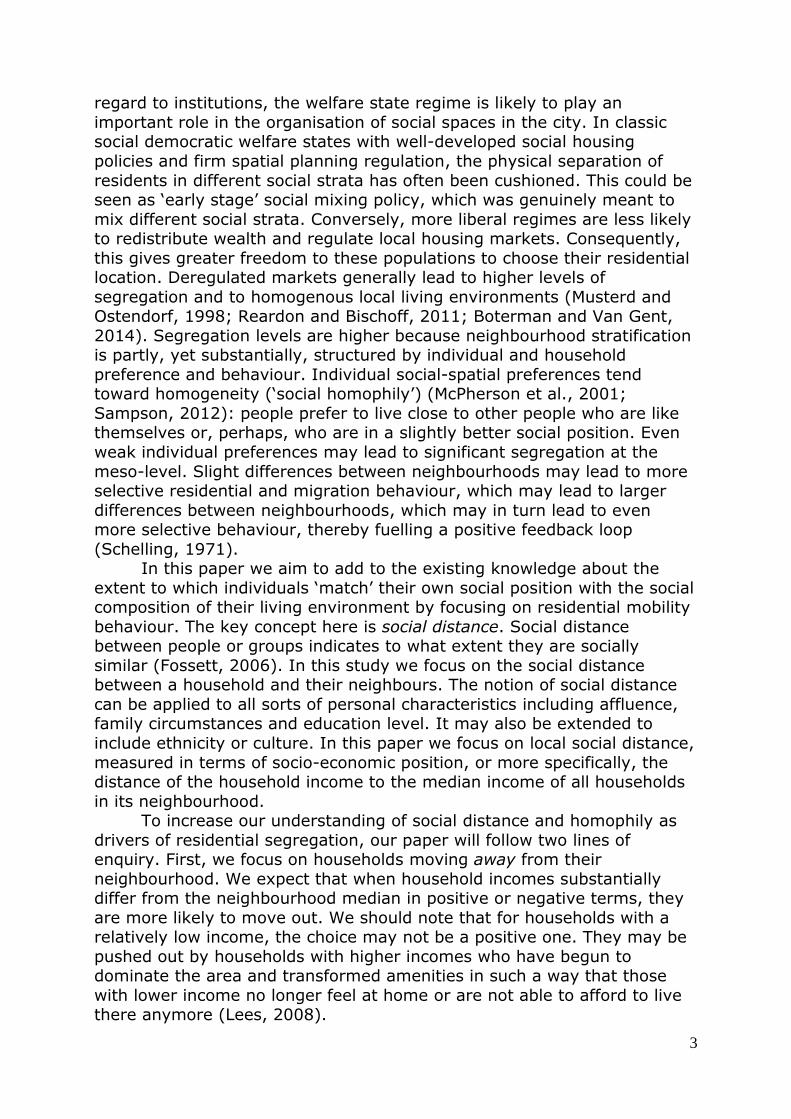
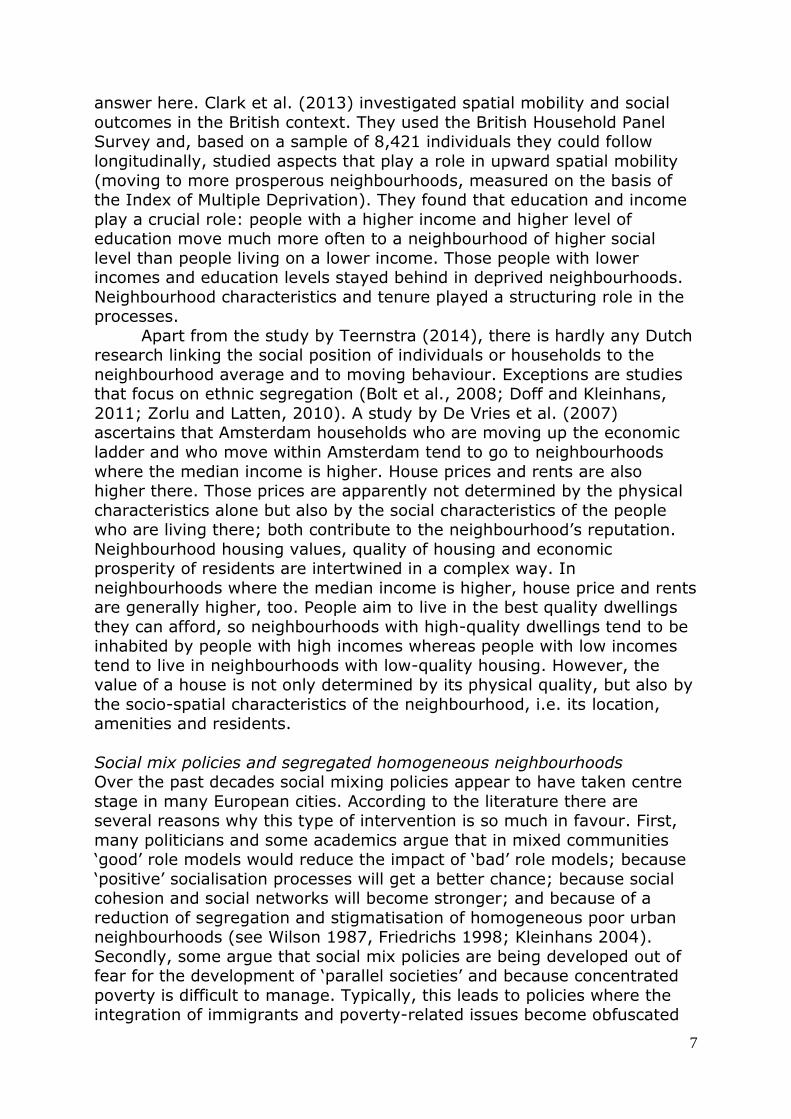
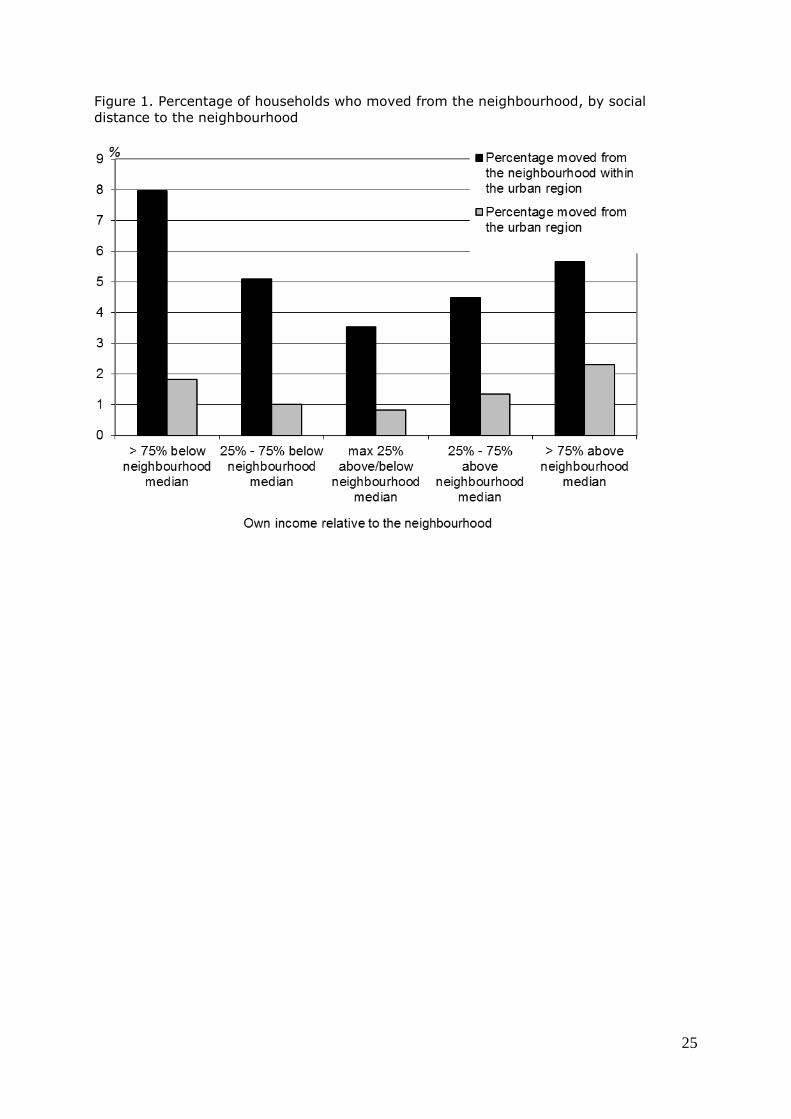
The patterns are robust and therefore also show up in bivariate analyses. Figure 1 shows that within a period of one year 8.0 percent of
the individuals earning a much lower income than the median income of the neighbourhood they lived in, moved to another neighbourhood within
the urban region and 1.8 percent to a neighbourhood outside the region. For individuals in households whose income is close to the median these
percentages are 3.5 and 0.8 percent respectively. For individuals with a much higher income this is 5.7 percent and 2.3 percent respectively.
< Figure 1 >
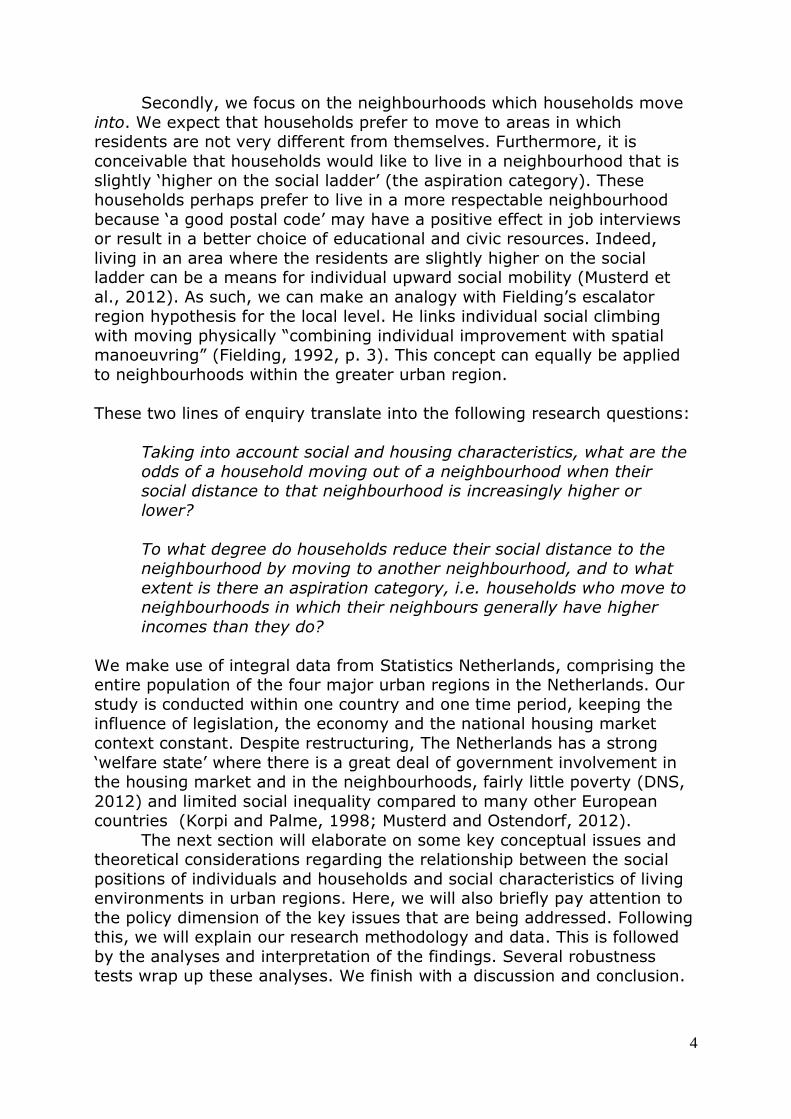
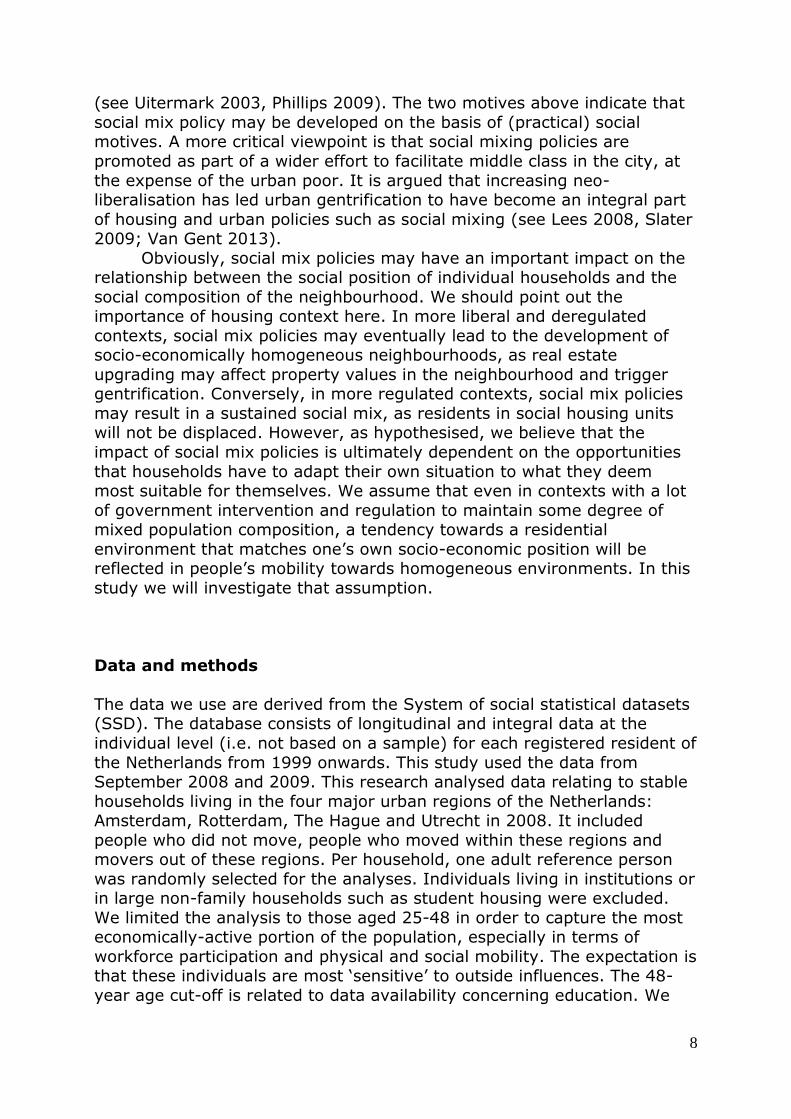
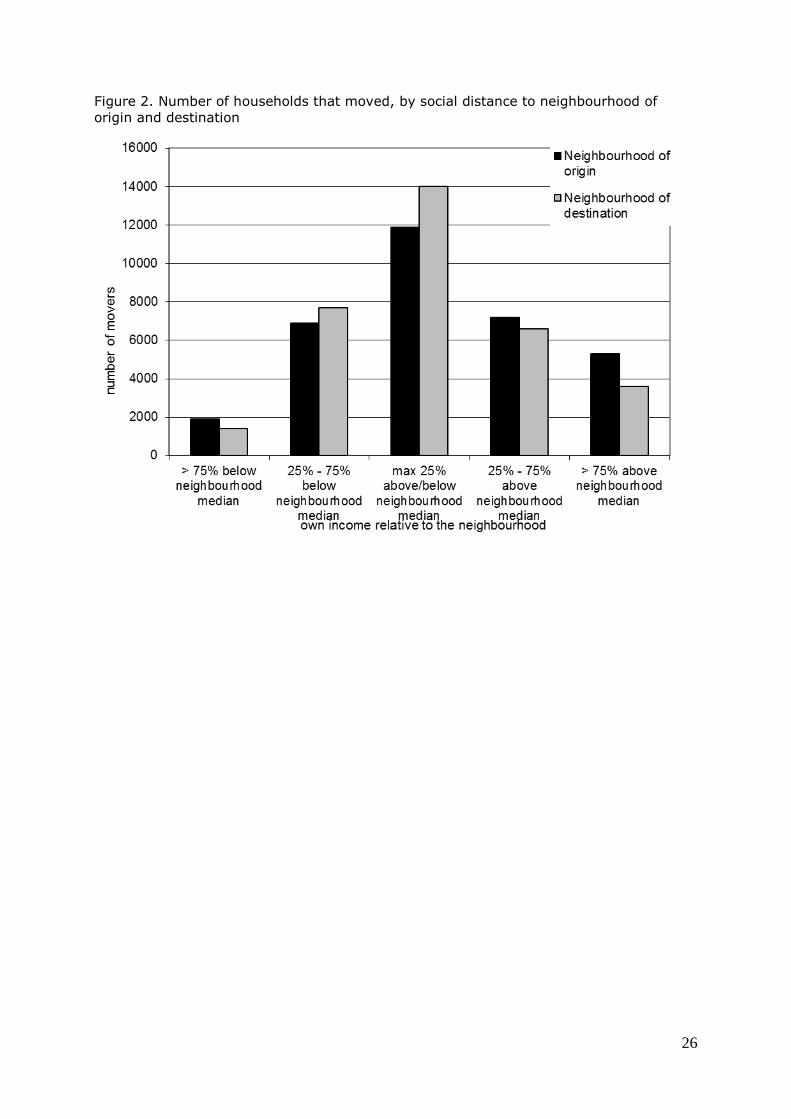
The second question asks how social distance between the individual and
their destination neighbourhood compares to that of the origin neighbourhood. Here, we did a cross table analysis for the households that
moved within the urban region (see Figure 2). Figure 2 shows that on
average, the social level of the neighbourhood of destination does indeed fit the household social position better than the social level of the
neighbourhood of departure. After the move, people’s household income was more often close to the neighbourhood’s median compared to before
the move (14,000 versus 11,900) It was also less often moderately above the neighbourhood median (6,600 versus 7,200) and more often
moderately below it (7,700 versus 6,900). The latter may demonstrate the inclination to maintain a level of aspiration in the destination
neighbourhood. About 1,900 individuals were ‘much poorer’ than the median of the neighbourhood of origin; after they moved their number
was reduced to 1,400. About 5,300 individuals were ‘much richer’ than the median of the neighbourhood of origin; after having moved they
numbered 3,600.
13
<Figure 2 here>
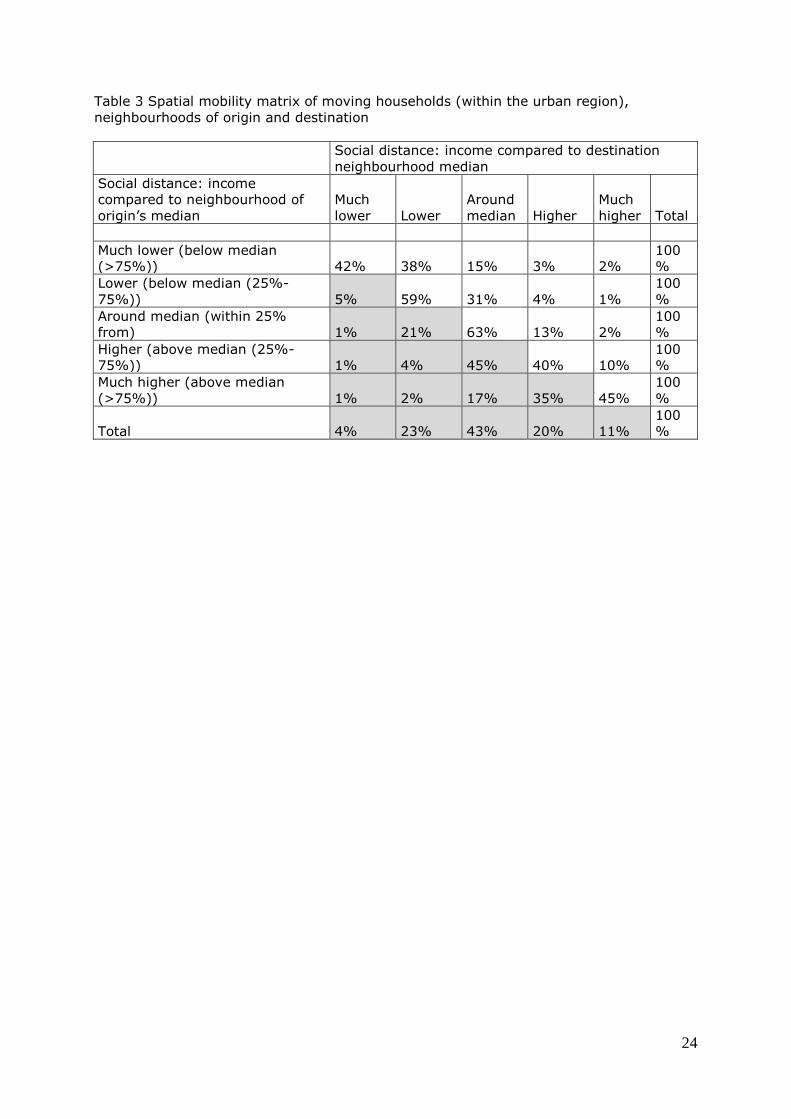
Table 3 shows the transitions between neighbourhoods of individual
moving households. Most moves take place between neighbourhoods that
are comparable in income (53%; the bold diagonal of the matrix). The majority of other movers, 28%, move to a neighbourhood that is more
compatible with their own income than the neighbourhood they left. Moving to wealthier neighbourhoods (below the diagonal) is 1.5 times
more common than moving to poorer neighbourhoods (above the diagonal). 22% of movers that were well matched with the neighbourhood
they left moved to a wealthier neighbourhood in which their income was below the median. Only 15% did the reverse and moved to a poorer
neighbourhood. This points at an aspiration effect where people strive to live among others with a slightly higher income or anticipating a better
economic position in the future.
< Table 3 approx. here >
Testing robustness
We carried out several robustness tests. For instance, we repeated the analyses for the inhabitants of the inner cities only, as well as for each
urban region separately. Patterns for social distance were very similar. We also ran separate analyses for singles and for couples. As the effects of
social distance on residential mobility turned out to be comparable we decided to include both together within one model.1
The education level of about 60 percent of the research population is unknown, and this is selective; the education level is more frequently
known for highly-educated people. To compensate, Statistics Netherlands has developed a weighting factor within the database. Yet, it is not always
necessary to use it in regression analyses. We carried out the analyses with and without weighting factors with virtually similar results; the
presented models include education level unweighted to get more mass:
individuals whose education level were not known are included in the category ‘unknown’.
Lastly, neighbourhood effects are dependent on scale and have been shown to be stronger on the very local level (Anderson and Musterd,
2010). Therefore the effect of social distance – being an ‘outsider’ – on mobility may be larger in such small or homogenous neighbourhoods
compared to neighbourhoods that are large, heterogeneous and composed of different social strata that might hardly interact with one another
(Blokland, 2003). For the interpretation of our results it is important to establish whether our findings are valid for different types of urban
neighbourhoods, rather than limited to a specific type of urban or suburban neighbourhood. To test this we performed two additional
sensitivity analyses, running separate analyses for small versus large neighbourhoods, and for heterogeneous versus homogeneous
14
neighbourhoods. All analyses show significant effects for the two most
extreme categories of social distance (more than 75% above or below the neighbourhood income median). In contrast to what might be expected,
the effect of social distance turned out to be less pronounced for residents
of small or homogeneous neighbourhoods than for residents of large or heterogeneous neighbourhoods. The tests indicate that the effect of social
distance on mobility is not limited to small, closely knit communities but represents a general pattern that also holds in large inner city
neighbourhoods in which the neighbourhood median is composed of a large number of residents, from a variety of social and cultural
backgrounds.
Discussion and conclusion
Using high-quality integral data, we were able to analyse four major city
regions and include a wide range of background variables without any
data limitations or response selectivity problems. Our aim was to shed light on the role of social distance to the neighbourhood in household’s
moving behaviour, which is one of the drivers of social segregation. Most studies have focused on neighbourhood status as such, while our study
exclusively focused on the individual match with or social distance to the neighbourhood, regardless whether the neighbourhood itself is rich or
poor. In addition, when high income households move from poor neighbourhoods, it is unclear whether they relocate because of the social
environment or simply because they seek a better quality dwelling. To our knowledge, this study is unique in its effort to unravel those two
motivations with regard to local social distance. Our analysis has shown that the odds to move is influenced by the
‘social distance’ between someone’s own position and their neighbourhood. The larger the difference in income the higher the
probability that a household will move. Local social distance is important
in two ways: for households whose position is (much) higher than that of the neighbourhood and for households whose position is (much) lower. In
both cases people are more inclined to move than people whose social position is close to the neighbourhood median.
In addition to moving from neighbourhoods that ‘do not fit well’ socially, households seem to reduce social distance when moving. Our
findings show that after moving a household’s income turns out to be closer to the neighbourhood median than before. Furthermore, our
findings show that more households move to neighbourhoods where the median is somewhat higher than their own income than to
neighbourhoods where the median is lower. This finding supports the idea that many demonstrate their upward aspirations in their housing
behaviour and neighbourhood choice (see also Teernstra, 2014). Based on the findings such aspirations may also be considered a possible motive for
15
moving. Alternatively, moving ‘down’ may also be instigated if someone
sees no chance for raising his or her income. Relatively higher earnings of neighbours are related to lower levels of self-reported happiness (Luttmer,
2005). This dissatisfaction may very well lead to households moving to
neighbourhoods with less discrepancy in terms of social position. Our results show that next to social distance quality and affordability
of housing clearly play a role in the decision to move out of a neighbourhood. The effect is larger for moves within the urban region
(residential mobility), than for moves across region boundaries (migration). This difference particularly corresponds to Sampson’s notion
that local knowledge and aggregated information flows are key to understanding sustained patterns of social segregation in a metropolitan
area (Sampson 2012). Additional research is needed to investigate the existence of neighbourhood networks of mobility per region. Furthermore,
residential mobility is not always a matter of individual choice. There are many limitations related to access and affordability when there is scarcity
and also regulations may produce several constraints. The socio-economically stronger households will more easily find a place that fits
their position. The socio-economically weaker may be more or less forced
to move, for instance when the character of a neighbourhood changes significantly, as some of the gentrification literature claims. Socio-
economically weaker households may no longer be able to afford to live in their old neighbourhood, possibly also because the available amenities
may no longer fit their lifestyle. Yet, also when a neighbourhood does not change, some residents may feel ‘forced’ to move as a result of downward
social mobility. In addition, households do not always have a choice when it comes to the exact neighbourhood they move into. Housing allocation
and affordability play a role in this as well, which may lead to a new ‘match’ or ‘mismatch’.
This research area still has many unanswered questions. Ideally, an indicator of social distance includes multiple dimensions: income distance,
cultural distances, ‘demographic’, and lifestyle distances between individuals and the neighbourhoods in which they live. Examining these
dimensions simultaneously may show that some dimensions weigh more
in the decision to move than others. More knowledge is also required to what extent social categories are involved in involuntary departures from
neighbourhoods. It is unclear under what conditions displacement is harmful for those who undergo them. Also, are they suffering from the
move to another area, or did it also provide new opportunities to re-fit their own position to the characteristics of their residential environment?
In addition, there is a need to further investigate how residents perceive the social distance between themselves and the neighbourhood.
Do they take their entire neighbourhood into account, or do they focus on a much more limited section, which includes only direct neighbours? How
does the (non-random) distribution of residents within their neighbourhood, at the very small local scale, affect mobility patterns?
Despite the need for further research, our findings offer input for the debates on policies aimed at desegregation and social mixing. Such
16
policies do not seem to be consistent with at least some of the processes
occurring in the urban region. There are strong indications that individuals and their households try to reduce the social distance between themselves
and their surroundings. This may be a forced choice for the socio-
economically weaker households, who are being pushed out of gentrifying areas, but might be a voluntary choice for the socio-economically stronger
households. In both cases the result of the sum of individual decisions is a more socially homogeneous milieu. This creates major challenges for
policy makers and politicians who believe that such collective outcomes eventually will have negative effects on the whole society. It may trigger
new investigations into the ‘functioning’ of neighbourhoods. Not every neighbourhood will function in the same way. Some neighbourhoods with
substantial social mix may stay attractive to a wide range of households. Therefore, it might be worth investigating under what circumstances
socially mixed neighbourhoods are sustainable (long-lasting), what the main characteristics of such neighbourhoods are in terms of location,
tenure, housing type, demographic, cultural and other compositions, and why individual households decide to stay in such environments.
Acknowledgments
We would like to thank Niels Kooiman (Statistics Netherlands) and the
three reviewers for their constructive comments on earlier versions of the paper, and Dr Aslan Zorlu (University of Amsterdam) for valuable
suggestions regarding some methodological issues.
Note 1 We ran a Hausman test (with Stata) to investigate the difference between the two models. The test showed that
the relationship between the independent variables and residential mobility are structurally different for singles
and couples, which is what we expected. Differences were largest for the three highest categories of ‘mismatch
income/ housing’ and particularly for ‘household composition’. Coefficient differences were smallest with
regard to ‘place in region’, ‘employment status’ and ‘social distance’. The effect of social distance on residential
mobility seems to apply to both singles and couples. The failure of the test seems particularly due to differences
in residential opportunities and choices of single-parent households versus two-parent households.
17
Literature
Andersson, R. and Musterd, S. (2010) What Scale Matters? Exploring the
Relationships between Individuals’ Social Position, Neighbourhood
Context and the Scale of Neighbourhood. Geografiska Annaler: Series B, Human Geography 92 (1), pp. 23-43.
Atkinson, R. (2006) Padding the bunker: Strategies of middle-class disaffiliation and colonisation in the city, Urban Studies 43(4), pp. 819-
832. Atkinson, R. and Flint, J. (2004) Fortress UK? Gated communities, the
spatial revolt of the elites and time-space trajectories of segregation, Housing Studies 19(6), pp. 875-892.
Blokland, T. (2003) Urban Bonds. Cambridge:Polity Press. Bolt, G., van Kempen, R., Van Ham, M. (2008) Minority Ethnic Groups in
the Dutch Housing Market: Spatial Segregation, Relocation Dynamics and Housing Policy, Urban Studies, 45(7), pp. 1359-1384.
Boterman, W. R. (2013) Dealing with Diversity. Middle-class family households and the issue of ‘black’ and ‘white’ schools in
Amsterdam, Urban Studies, 50(5), pp. 1130-1147.
Boterman, W.R. and Van Gent, W.P.C. (2014) Housing Liberalisation and Gentrification; the Social Effects of Tenure Conversions in Amsterdam,
Tijdschrift voor Economische en Sociale Geografie, 105(2), pp.140-160. Bridge, G. (2006) It’s not just a question of taste: Gentrification, the
neighbourhood and cultural capital. Environment and Planning A, 38(10), pp. 1965-1978.
Brown, L.A. and Horton, F.E. (1970) Social area change: An empirical analysis, Urban Studies, 7(3), pp. 271–288.
Burgers, J. and Musterd, S. (2002) Understanding Urban Inequality A model based on existing theories and an empirical illustration.
International Journal of Urban and Regional Research, 26(2), pp. 403-413.
De Jong, G. F., and Fawcett, J. T. (1981) Motivations for migration: an assessment and a value-expectancy research model, in: G. F. De Jong
and R. W. Gardner (Eds) Migration decision making. Multidisciplinary
approaches to microlevel studies in developed and developing countries, pp. 13-58. New York: Pergamon Press.
Clark, W.A.V., Van Ham, M. and Coulter, R. (2013) Spatial mobility and social outcomes. Journal of Housing and the Built Environment. Online
first. DOI 10.1007/s10901-013-9375-0. De Groot, C., Mulder, C.H., Das, M. and Manting, D. (2011) Life events
and the gap between intentions to move and actual mobility. Environment and Planning A, 43( ), pp. 48-66. Doi: 10.1068/a4318.
De Vries, B., Hamers, B, Manting, D and Latten, J. (2007) Stad uit balans: een grotere kloof tussen arme en rijke wijken? Bevolkingstrends nr. 3,
pp. 20-31. Fielding, A. J. (1992) Migration and social mobility: South East England as
an escalator region, Regional Studies, 26(1), pp. 1-15.
18
Forrest, R., La Grange, A. and Yip, N.M. (2004) Hong Kong as a global
city? Social distance and spatial differentiation. Urban Studies, 41(1), pp. 207-227.
Fossett, M. (2006) Ethnic preferences, social distance dynamics, and
residential segregation: Theoretical explorations using simulation analysis. Journal of Mathematical Sociology, 30 (3-4), pp. 185-274.
Freeman, L. (2005) Displacement or succession? Residential mobility in gentrifying neighborhoods, Urban Affairs Review, 40(4), pp. 463-91.
Friedrichs, J. (1998) Do poor neighbourhoods make their residents poorer? Context effects of poverty neighborhoods on their residents, in:
H. Andress (Ed.) Empirical Poverty Research in a Comparative Perspective, pp. 77–99. Aldershot:Ashgate.
Glaeser, E. (2011) Triumph of the City. How Our Greatest Invention Makes Us Richer, Smarter, Healthier, and Happier; New York: The
Penguin Press. Goux, D. and Maurin, E. (2007) Close neighbours matter: neighbourhood
effects on early performance at school. The Economic Journal, 117, pp. 1193-1215.
Hamnett, C. (2003) Gentrification and the middle class remaking of inner
London, 1961–2001, Urban Studies 40(12), pp. 2401–2426. Hipp, J.R. and Boessen, A. (2012) Immigrants and Social Distance:
Examining the Social Consequences of Immigration for Southern California Neighborhoods over Fifty Years. Annals of the American
Academy of Political and Social Science 641, pp. 192-219. Hipp, J.R. and Perrin, A.J. (2009) The Simultaneous Effect of Social
Distance and Physical Distance on the Formation of Neighborhood Ties. City and Community 8(1), pp. 5-25.
Johnston, R. (1978) Residential area characteristics: Research methods for identifying urban sub-areas – social area analysis and factorial
ecology, in: D. Herbert and R. Johnston (Eds) Social Areas in Cities, pp. 175–217. London: Wiley.
Kleinhans, R. (2004) Social implications of housing diversification in urban renewal: a review of recent literature, Journal of Housing and the Built
Environment, 19(4), pp. 367–390.
Kooiman. C. and Latten J. (2013) Steeds meer jonge kinderen groeien op in de grote stad. CBS Webmagazine, 15 februari.
Lees, L. (2008) Gentrification and Social Mixing: Towards an Inclusive Urban Renaissance? Urban Studies, 45(12), pp. 2449-2470.
Luttmer, E.F.P. (2005) Neighbors as negatives: relative earnings and well-being. The Quarterly Journal of Economics, 130 (3), pp. 963-1002.
McKinnish, T., Walsh, R. and White, T.K. (2010) Who Gentrifies Low-Income Neighborhoods? Journal of Urban Economics ,67, pp. 180-193.
McPherson, M., Smith-Lovin, L. and Cook, J.M. (2001) Birds of a Feather: Homophily in Social Networks, Annual Review of Sociology 27(1), pp.
415-444. Musterd, S. and Ostendorf W (eds.) (1998) Urban Segregation and the
Welfare State. Inequality and Exclusion in Western Cities. London, New York: Routledge.
19
Musterd S and Ostendorf W (2012) Inequalities in European Cities. In:
Susan J. Smith, Marja Elsinga, Lorna Fox O’Mahony, Ong Seow Eng, Susan Wachter, David Clapham, editors. International Encyclopedia of
Housing and Home, Vol 4. Oxford: Elsevier, pp. 49–55.
Musterd, S., Vos, S. de, Das, M. and Latten, J.J. (2012) Neighbourhood Composition and Economic Prospects: A Longitudinal Study in the
Netherlands. Tijdschrift voor Economische en Sociale Geografie, 103(1), pp. 85-100.
Ostendorf, W. and Musterd S (2012) Social Spaces and Urban Policies. In: Susan J. Smith, Marja Elsinga, Lorna Fox O’Mahony, Ong Seow Eng,
Susan Wachter,Montserrat Pareja Eastaway, editors. International Encyclopedia of Housing and Home, Vol 6. Oxford: Elsevier; pp. 489–
501. Phillips, D. (2009) Minority Ethnic Segregation, Integration and
Citizenship: A European Perspective. Journal of Ethnic and Migration Studies 36 (2), pp. 209–225.
Reardon, S.F. and Bischoff, K. (2011) Income Inequality and Income Segregation. American Journal of Sociology, 116(4), pp. 1092-1153.
Robson, B. (1975) Urban Social Areas. London: Oxford University Press.
Sampson, R.J. (2012) Great American city; Chicago and the enduring neighbourhood effect. Chicago: University of Chicago Press.
Slater T. (2009) Missing Marcuse: on gentrification and displacement. City 13 (2-3), pp. 292–311.
Smith, N. (1996) The New Urban Frontier: Gentrification and the Revanchist City Routledge, London.
Smits, J., Mulder, C.H. and Hooimeijer, P. (2003) Changing Gender Roles, Shifting Power Balance and Long-distance Migration of Couples. Urban
Studies, 40(3), pp. 603–613. Teernstra, A. (2014) Neighbourhood change, mobility and incumbent
processes: exploring income patterns of in-migrants, out-migrants and non-migrants of neighbourhoods, Urban Studies, 51(5), pp. 978-999.
Uitermark J. (2003) ‘Social mixing’ and the management of disadvantaged neighbourhoods: the Dutch policy of urban restructuring revisited.
Urban Studies 40(3), pp. 531–549.
Van Crieckingen, M. (2009) Moving In/Out of Brussels’ Historical Core in the Early 2000s: Migration and the Effects of Gentrification, Urban
Studies 46(4), pp. 825-848. Van Gent, W.P.C. (2013) Neo-liberalization, Housing Institutions and
Variegated Gentrification; How the 'Third Wave' Broke in Amsterdam, International Journal of Urban and Regional Research, 37 (2), pp. 503-
522. Wacquant, L. (1993) Urban Outcasts - Stigma and Division in the Black-
American Ghetto and The French Urban Periphery. International Journal of Urban and Regional Research, 17(3), pp. 366-83.
Wilson, W. J. (1987) The Truly Disadvantaged. Chicago, IL: University of Chicago Press.
Zorlu A. and Latten J. (2009) Ethnic Sorting in the Netherlands’, Urban Studies, 46(9), pp. 1899–1923.
20
Table 1. Descriptive statistics
Share Average
Mobility behaviour
(dependent variable) Moved outside urban region 1.2%
Moved from n’hood within urban
region 4.3%
Not moved from neighbourhood (ref) 94.5%
Age
37
Gender Male 64.7%
Female (ref) 35.3%
Household type Single 45.0%
Couple (ref) 55.0%
Household composition
2008 -> 2009 Children, ≤ 4 yrs 9.6%
Children, > 4 yrs 39.8%
Children -> No children 0.5%
No Children -> Children 2.4%
No Children (ref) 47.8%
Education Unknown/ no data 58.4%
Lower 4.0%
Middle 12.3%
Higher (ref) 25.3%
Ethnicity Moroccan 3.7%
Turkish 3.9%
Surinamese 6.4%
Dutch Antillean 1.8%
Other non-Western 6.8%
Western 11.7%
Native (ref) 65.7%
Equivalised household income (x1000) 24.5
Social-economic status
2008 -> 2009 Active -> Inactive 2.0%
Inactive -> Active 1.8%
Inactive -> Inactive 9.1%
HE student stable 1.0%
No source of income stable 1.1%
Other 0.8%
Active -> Active (ref) 84.2%
Employment status No change 91.7%
New Job (ref) 8.3%
Housing tenure in 2008 Owner occupied 52.2%
Rental (ref) 47.8%
21
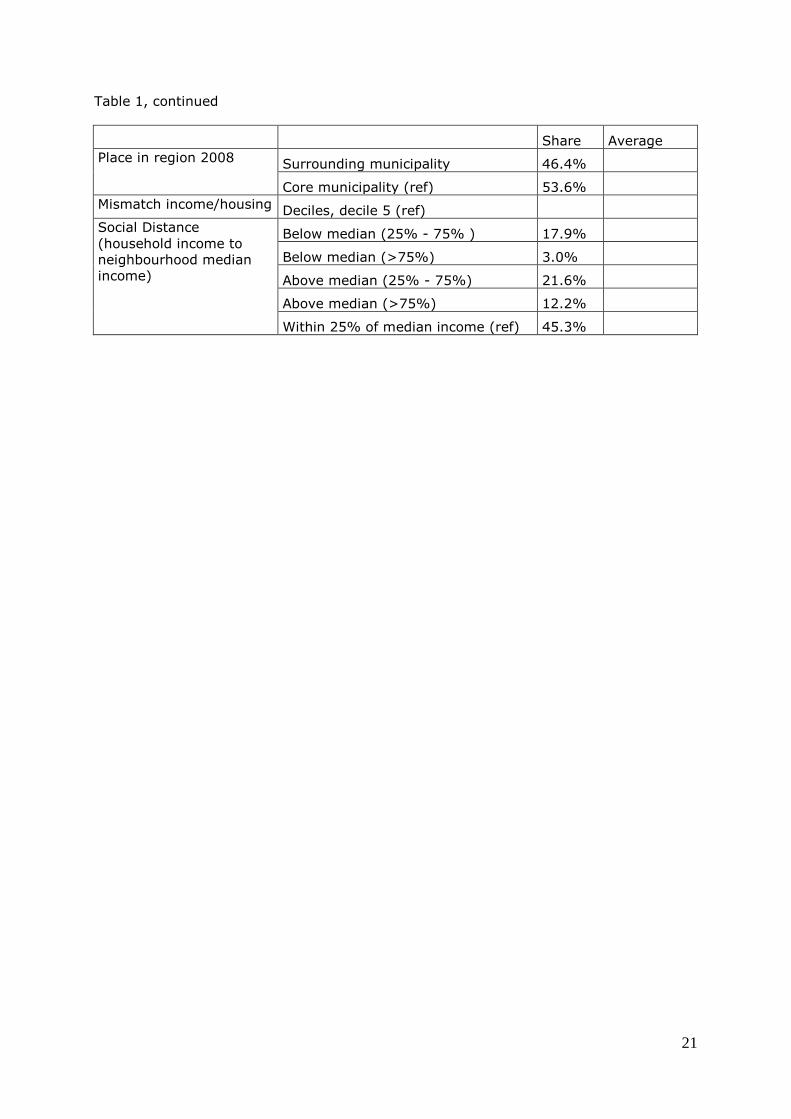
Table 1, continued
Share Average
Place in region 2008 Surrounding municipality 46.4%
Core municipality (ref) 53.6%
Mismatch income/housing Deciles, decile 5 (ref)
Social Distance
(household income to
neighbourhood median
income)
Below median (25% - 75% ) 17.9%
Below median (>75%) 3.0%
Above median (25% - 75%) 21.6%
Above median (>75%) 12.2%
Within 25% of median income (ref) 45.3%
22
Table 2. Odds ratios of the multinomial logistic regression models
Model 1 Model 2
Moved from
n’hood, within
urban region
Moved from
urban region
Moved from
n’hood, within
urban region
Moved from
urban region
Age 0.952 *** 0.955 *** 0.951 *** 0.951 ***
Gender Male 1.095 *** 1.090 *** 1.098 *** 1.091 ***
Female (ref)
Household
type
Single 0.841 *** 0.646 *** 0.857 *** 0.692 ***
Couple (ref)
Household
composition
Children, ≤ 4
yrs
1.652 *** 2.026 *** 1.682 *** 2.101 ***
2008 ->
2009
Children, > 4
yrs
0.993 0.739 *** 1.018 0.780 ***
Children -> No
children
1.972 *** 2.003 *** 2.018 *** 2.085 ***
No Children ->
Children
1.602 *** 1.597 *** 1.584 *** 1.558 ***
No Children
(ref)
Education Unknown/ no
data
0.919 *** 0.541 *** 0.937 ** 0.577 ***
Lower 0.871 *** 0.475 *** 0.888 ** 0.511 ***
Middle 0.902 *** 0.670 *** 0.919 *** 0.705 ***
Higher (ref)
Ethnicity Moroccan 0.885 *** 0.376 *** 0.887 *** 0.385 ***
Turkish 0.914 ** 0.398 *** 0.914 ** 0.405 ***
Surinamese 1.031 0.533 *** 1.035 0.541 ***
Dutch
Antillean
0.977 0.846 0.977 0.856
Other non-
Western
1.383 *** 0.974 1.365 *** 0.968
Western 1.193 *** 0.942 1.182 *** 0.930 *
Native (ref)
Equivalised
household
income
(x1000)
0.998
***
1.003 *** 0.996 *** 1.001
Social-
economic
status
Active ->
Inactive
1.206 *** 1.201 * 1.184 *** 1.195 *
2008 ->
2009
Inactive ->
Active
1.224 *** 1.442 *** 1.193 *** 1.441 ***
Inactive ->
Inactive
1.086 *** 1.018 1.033 0.982
HE student,
stable
1.404 *** 1.727 *** 1.359 *** 1.678 ***
No source of
income, stable
0.629 *** 0.875 0.436 *** 0.613 **
Other 1.413 *** 2.213 *** 1.081 1.707 ***
Active ->
Active (ref)
23
Table 2, Continued
Employment
status No change 0.942 ** 0.602 *** 0.934 ** 0.594 ***
New Job (ref)
Housing tenure
in 2008 Owner occupied 0.489 *** 0.609 *** 0.488 *** 0.604 ***
Rental (ref)
Mismatch
income/housing
Decile 1 (10%
households with
lowest
income/housing
ratios) 1.775 *** 1.844 *** 1.505 *** 1.632 ***
Decile 2 1.041
1.078
0.981
1.061
Decile 3 0.925 * 1.021
0.900 * 1.023
Decile 4 0.957
0.988
0.949
0.996
Decile 6 1.092 ** 1.013
1.090 ** 0.993
Decile 7 1.217 *** 1.145 * 1.209 *** 1.091
Decile 8 1.380 *** 1.193 ** 1.358 *** 1.097
Decile 9 1.756 *** 1.465 *** 1.697 *** 1.285 ***
Decile 10 (10%
households with
highest
income/housing
ratios) 2.863 *** 2.412 *** 2.654 *** 1.962 ***
Housing value
unknown/income
unknown or zero 1.865 *** 1.909 *** 1.709 *** 1.709 ***
Decile 5 (ref)
Place in region
2008
Surrounding
municipality 0.841 *** 0.879 *** 0.849 *** 0.922 **
Core
municipality
(ref)
‘Distance’ to
n’hood
Below median
(25% - 75% )
1.209 *** 1.173 **
Median income
Below median
(>75%)
1.641 *** 1.656 ***
Above median
(25% - 75%)
1.124 *** 1.290 ***
Above median
(>75%)
1.314 *** 1.790 ***
Within 25% of
median income
(ref)
Chi Sq. 21144.476
21659.976
Sign. 0.000
0.000
Df 72
80
Nagelkerke’s
R2 0.076
0.078
*=p<0.05; **=p<0.01; ***=p<0.001 (2-tailed), N=754371
24
Table 3 Spatial mobility matrix of moving households (within the urban region),
neighbourhoods of origin and destination
Social distance: income compared to destination
neighbourhood median
Social distance: income
compared to neighbourhood of
origin’s median
Much
lower Lower
Around
median Higher
Much
higher Total
Much lower (below median
(>75%)) 42% 38% 15% 3% 2%
100
%
Lower (below median (25%-
75%)) 5% 59% 31% 4% 1%
100
%
Around median (within 25%
from) 1% 21% 63% 13% 2%
100
%
Higher (above median (25%-
75%)) 1% 4% 45% 40% 10%
100
%
Much higher (above median
(>75%)) 1% 2% 17% 35% 45%
100
%
Total 4% 23% 43% 20% 11%
100
%
25
Figure 1. Percentage of households who moved from the neighbourhood, by social
distance to the neighbourhood
26
Figure 2. Number of households that moved, by social distance to neighbourhood of
origin and destination
Top Related
Copyright © 2022 FDOKUMEN

