


Bahasa
Halaman
Hukum

European Research Studies Journal
Volume XXIII, Issue 2, 2020
pp. 577-591
Access to Sport Facilities, Social and Intergenerational
Integration: A Case Study Submitted 11/02/20, 1st revision 13/03/20, 2nd revision 02/04/20, accepted 20/04/20
Mariola Mamcarczyk1, Łukasz Popławski2 Abstract:
Purpose: The paper aims at analysing the effects of the introduction of the “Moje Boisko-
Orlik 2012” program and its impact on the social and intergenerational integration of Polish
residents.
Design/Methodology/Approach: The implementation of “Moje Boisko-Orlik 2012” program
was an opportunity to increase the level of social and intergenerational integration. The
paper presents the main assumptions of the program, social and intergenerational
integration defined through the prism of the participation of communities and different age
groups in sporting activity. In addition, for the years 2009-2014, an analysis of the number
of beneficiaries of "Orliki" and indicators of their use in the cross-section of voivodships
were conducted.
Findings: Intergenerational relations are constantly changing, and the aging of society have
a major impact on them. Intergenerational integration occurs, e.g. in places such as
"Orliki”. The hypothesis on the positive impact of the program on the social and
intergenerational integration of the population was verified on the basis of available data on
the sporting activity of the population and the number of sports facilities created.
Practical Implications: The authors’ observations point to address the subject of sporting
activity of older people in a broader context. Sporting activity is an excellent platform for
communication between generations. It should be used as often as possible for the benefit of
the society.
Originality/Value: The value added of this paper is to draw attention to the role of physical
activity in shaping intergenerational relations and social integration. In addition, it seems
interesting to use conditional formatting as a method of data analysis.
Keywords: Social integration, intergenerational integration, sports facilities, "Moje Boisko-
Orlik 2012" program, sport in Poland.
JEL codes: I15, I24, I31, I38.
Paper type: Research case study.
1Cracow University of Economics, Cracow, Poland, [email protected] 2Cracow University of Economics, Cracow, Poland, [email protected]

Economic and Legal Instruments of Local Senior Policy
in the Level of Municipalities
578
1. Introduction
For a few decades, fashion has been created for a slim figure and healthy lifestyle,
and sports infrastructure seems to be an inseparable element of it. The organization
of the European Football Championship "Euro 2012" in Poland was a stimulus for
the construction of new stadiums meeting the highest standards and prepared for
crowds of supporters. The "Moje Boisko-Orlik 2012" program was also a chance to
fill the gaps in sports infrastructure. Modern sports facilities were meant to serve the
whole society, regardless of age. In addition to the sporting dimension of the
program, the social dimension was also important, involving the integration of
participants and organizers of various projects taking place on the premises of sports
facilities (Ministry Sport of Tourism, 2015). Thanks to the "Moje Boisko-Orlik
2012" program, the community could practice sport in comfortable conditions,
completely different than a few decades ago.
Access to the appropriate sport infrastructure should be equal for all, regardless of
age, social position, or property status. In creating attractive forms of popularizing
sport, as part of the development of social capital, it is not only about the “Orliki”
themselves, but also about the sport infrastructure in general, whose origin is to
encourage as many people as possible to sport. The objects themselves may be
insufficient motivation for various age groups of Poles. It is important that they are
adapted to the needs of all generations. In Poland, we have been taking care of
popular sport and active lifestyle for a good dozen of years. The "Moje Boisko-Orlik
2012" program is not the first to activate Polish society in area of sport. Another
example is: "construction of multifunctional sports fields generally available for
children and youth" (Ministry Sport of Tourism, 2009).
The issue of accessibility of sports infrastructure for the elderly people is in line with
the problem of an aging population, so current in the world at the beginning of the
21st century. Data presented by the Central Statistical Office for 2016 show that in
Poland men lived on average 73.9 years, while women 81.9 years, which is longer
by, respectively 7.7 and 6.7 years in comparison with 1990 (Central Statistical
Office, 2017).
The aim of the article is to verify the hypothesis about the positive impact of
“Orliki” on the social and intergenerational integration of the population. The data
available about sporting activity of the population and the number of sports facilities
created will be used for this purpose.
2. Social and Intergenerational Integration
The manifestation of the importance of intergenerational integration is implemented
by the Ministry of Sport and Tourism program for the development of small multi-
generation sports and recreational infrastructure - Open Activity Zones (OAZs). Its
task is to build publicly available, multi-functional, outdoor activity zones, which are

M. Mamcarczyk, Ł. Popławski
579
to be adapted to the needs of various age groups. In addition, it is about creating a
space for sporting activity that promotes intergenerational social integration. It is
assumed that in the so-called basic variant will be:
• outdoor gyms (minimum 6 different devices);
• relaxation zones (minimum 4 benches fixed to the ground, gaming
devices);
• educational installations permanently fixed to the ground, eg
chess/checkers, etc., greenery management - planting).
The extended option provides for the appearance of:
• outdoor gym (minimum 6 different devices);
• relaxation zones (minimum 4 benches fixed to the ground, gaming
devices;
• educational installations permanently installed, eg chess / checkers, etc.,
landscaping planting);
• playground of a fitness nature (minimum 3 devices) with a fence (it is
possible to use the existing area fencing) (Annex to decision No. 55 of the
Minister of Sport and Tourism, 2017).
The assumption of "Moje Boisko-Orlik 2012" was the creation of free-of-charge
complexes of sports fields, together with changing rooms and social facilities in all
Polish communes (Ministry Sport of Tourism, 2015). The creation of these multi-
functional facilities was also supposed to enable social and intergenerational
integration. It is not just about playing a match together. It is about instilling and
improving the principles of cooperation and co-creation of civil society.
One should mention the animators as people who influence the popularization of
sport within the local communities. They are employed as part of the "Animator-
Moje Boisko Orlik 2012" project. They encourage to act, educate, and organize
various activities (https://naszOrlik.pl/baza-wiedzy/kim-jest-animator-Orlika).
Animators can significantly increase the activity of the local community. This is
indicated in, among others, research carried out in Toruń in 2015 (Szark-Eckardt et
al., 2017). The authors also mentioned the cooperation of parents and grandparents
of children participating in classes. This is a perfect example of intergenerational
integration. The promotion of a healthy lifestyle through sporting activities has
combined several generations and confirmed the belief that the construction of the
"Orliks" was the right move (Szark-Eckardt et al., 2017) as well as employment of
professional animators (Mamcarczyk, 2013).
The "Moje Boisko – Orlik 2012" program can be evaluated in many respects. It is
possible to use the SWOT analysis to indicate the opportunities, threats and
strengths or weaknesses of the program (Gołdys et al., 2013). The main strength of
the program is creation of places where people can meet and integrate different

Economic and Legal Instruments of Local Senior Policy
in the Level of Municipalities
580
social groups. However, the basic assumption building an “Orlik” in each
municipality, has not been met. Only in the Małopolskie Voivodship there are no
"Orliki" in 58 communes. Varied willingness of local authorities to participate in this
program resulted in uneven distribution of “Orliki” across the country (Ujma-
Wąsowicz, 2012). That also indicates uneven access of polish citizens to those
facilities.
It should be also noted that when designing sports infrastructure intended for
intergenerational integration, it is necessary to remember people from all age groups
who may become users of these facilities. If you want to encourage older people to
be active, this age structure should be considered when creating or changing the
zoning plan, infrastructure development, but also public transport, which is used
even when reaching sports facilities. Looking at the issue of the activity of older
people from the point of view of local and regional development, one must use the
principle of universal design - design for everyone (Ministry of Labor and Social
Policy, National Action Plan for the European Year of Active Aging, 2012).
Possible vandalism and devastation of objects is one of the threats. The access to
objects is also problematic. In a situation when municipalities want to reduce
spending, the free use policy would be inadequate to a difficult financial situation.
3. Inclusion Mechanism in Sport Approach
Social exclusion has been the focus of the European Union since the 1970s. It is a
complex phenomenon that, due to its multidimensional character, is difficult to
interpret in a precise way, most often connected with poverty, which cannot be
correct (Rosa and Jakubowska, 2017). Often hearing about exclusion, one thinks
about poverty, hunger, extreme situations. There are cases in which poverty
interferes with the concept of exclusion. This is not only about the lack of income,
but also other numerous factors of deprivation or impossibility of participating in the
life of modern society (Broda-Wysocki, 2012). The diversified approach to social
exclusion in various European countries is also underlined. There is no influence on
cultural, economic, institutional, political, and sociological traditions (Broda-
Wysocki, 2012, pp. 47-48). The reasons for social exclusion were also seen in the
weakness of social bonds. They play an important role in social order i.e., protecting
against critical situations and controlling / checking. In the field of social order, an
important concept is social capital, which has an impact on the formation of bonds in
communities (Broda-Wysocki, 2012, p. 30).
According to EU social exclusion is a process in which some people are pushed to
the edge of society and cannot participate fully in it because of their poverty or lack
of basic educational competences. It pulls them away from work, income, and limits
educational opportunities. The excluded persons also do not participate in processes
in which important social decisions are taken, also affecting their daily lives
(Eurostat Statistical Books, 2010).

M. Mamcarczyk, Ł. Popławski
581
When analyzing the subject of exclusion, one must think how to fight it. It seems
helpful to consider the inclusion mechanism (i.e., inclusion of something, as well as
what is included, the Dictionary of Foreign Words PWN, 2002), that is social
inclusion. The dictionary of sociological terms in a more extended way presents the
interpretation of the concept of inclusion, or inclusivity, i.e. as inclusion, but also
one of the features of modern societies. This property is because more and more
social groups acquire new rights, which previously were only available to a small
group. These privileges apply especially to social, political, and cultural issues. The
transition from exclusion to inclusion is often adopted as an important discriminant
of contemporary societies (Dictionary of sociological concepts, 2001).
Ujma-Wąsowicz (2012) notes that contemporary sociological research is an
indispensable instrument in spatial planning, which may concern problems in a
holistic approach, for example, sociology of the city or social sympathies in each
field, e.g., leisure, sport. Researchers' effort is aimed at the general needs. They are
the result of a holistic approach, the influence of the environment or other people on
the behavior of an individual, but also understanding the situation of people with
certain physical and mental limitations in the sentence "I would like, but I cannot, I
cannot" (Ujma-Wąsowicz, 2012).
One cannot talk about exclusion only in relation to older people or people with
disabilities. Therefore, the concept of inclusive education seems to be interesting. Its
basis is the social participation of all. This concept fits in perfectly with the idea of
this study. The involvement of the whole community is important. To transform
standard inclusive learning, all education-related environments need to be involved.
Teachers and school heads play an important role in this matter.
This article aims to draw attention to the role of sport in intergenerational
integration, and the program "Moje Boisko-Orlik 2012" was to help in the fight for
social inclusion. Thanks to this program, sport facilities have been created, and it can
be an important tool for social inclusion. Those facilities should be used not only by
physical education teachers.
As mentioned above, "Moje Boisko-Orlik 2012" also aims at meeting needs of the
older generation. An older person, with more free time, can spend more time
exercising, walking, taking care of the right diet, that is, taking better care of their
health. It should be remembered that the sooner the society's aging process will take
place, the faster the total population will decrease, so the society will be extinct
(Ratyński, 2003). One may wonder why prevention is important in the context of
sports. It turns out that over the years, people have less and less ability to adapt to
physical efforts, modify their diet, temperature changes, etc., which is a fundamental
symptom of aging. The reduction of physical activity is one of several biological risk
factors that threaten the physical and mental health of a human being. Social factors
are equally important such as:

Economic and Legal Instruments of Local Senior Policy
in the Level of Municipalities
582
• social and psychological isolation;
• deterioration of the material situation;
• a change of environmental conditions;
• insufficient awareness in the field of health education and gerontological
prophylaxis3;
• lack of proper forms of recreation and active rest (Ratyński, 2003).
Using of sport for intergenerational integration is one of the solutions to problems
occurring in aging population. Sport is also an international language, a unifying
ground, facilitating finding common thread of understanding. It can be a stimulus to
various inclusion mechanisms.
Different and similar points of view presented by Sergi et al. (2019), Slender et al.
(2015), Skinner et al. (2008), Young and Okada (2014), Young et al. (2012; 2016),
Vail (2007), Custódio et al. (2018), Rhodes and Kaul (2014), Clutterbuck and
Doherty (2019), Whitley et al. (2019), Ekholm, and Holmlid (2020), Okada (2018),
Qerimi and Sergi (2015), Meir (2017), Halsall and Forneris (2016), Grima et al.
(2017; 2018).
4. Accessibility to Sports Facilities as an Example of Intergenerational
Integration
4.1 Methodology of Research
Conditional formatting was used in the research as a method of data visualization. It
is available in Excel and allows for an illustrative representation of certain
relationships between selected features. The presented information can thus become
more readable. Analyzes of available data on sporting activity of the population, the
number of sports facilities created are to help in answering the question about the
impact of the "Moje Boisko-Orlik 2012" program on the social and intergenerational
integration of population. The analysis distinguishes voivodships in which sports
facilities are the most and the least accessible to residents.
The study also uses demographic data for the years 2009-2014. It was necessary to
state how the number of "Orliki" users changed at the beginning of the program and
after its completion. The demographic database makes it possible to generate
statements regarding the state of the population for selected years in age groups
every 5 years. The analysis compared the availability of sports facilities in the cross-
section of two age groups: children and youth in the age group 5-19 and adults over
19 years, omitting the age group 0-4 years.
3Learning about aging processes. Something else is geriatrics - a science about diseases of
old age.

M. Mamcarczyk, Ł. Popławski
583
4.2 "Orliki" and their Availability
At the beginning of the analysis, the number of "Orliki" was presented in individual
voivodships and on this basis groups of similar voivodships were created in various
respects. Thanks to the use of conditional formatting, it is easier to draw the
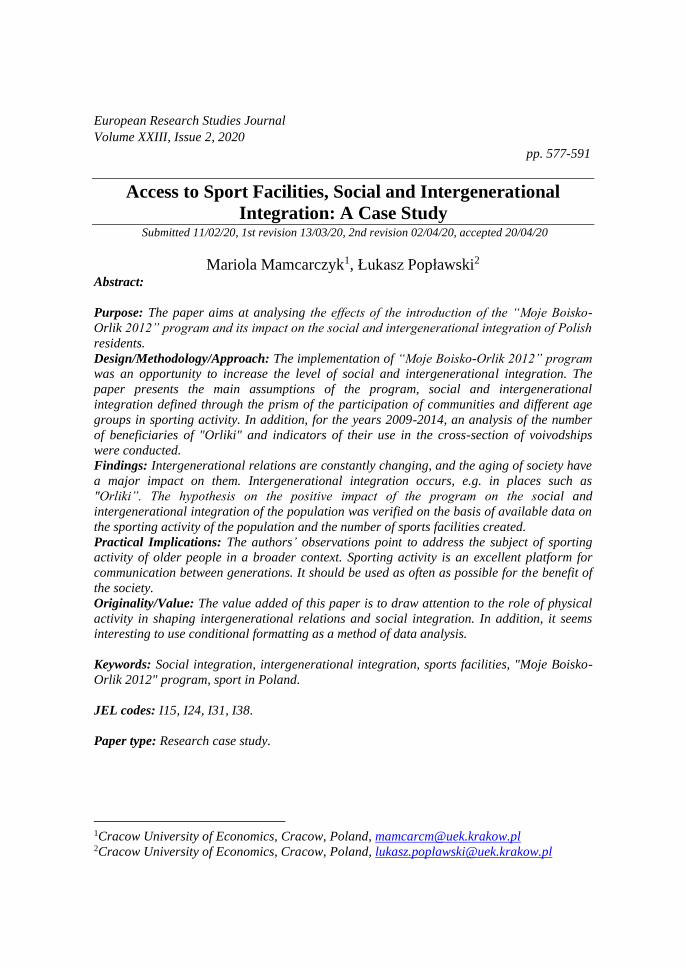
conclusions from Figure 1. Based on information on the number of ''Orlik'' objects
created in the years 2008-2012. Voivodships are arranged according to the growing
number of sports facilities. Differences between the number of objects for a given
pair of voivodships allowed their division into 4 categories i.e., from the smallest
(black) to the largest (green). The essence of this delimitation consists in separating
symbols of the same category along the main diagonal (black color). In the case
discussed, 6 groups of voivodships with a similar number of “Orliki” were
distinguished.
Figure 1. Delimitation of voivodships due to the number of sports facilities in 2014
świętokrzyskie
opol
skie
podl
aski
e
lubu
skie
lube
lski
e
pom
orsk
ie
warmińsko-mazur.
podk
arpa
ckie
śląskie
łódzkie
zach
odni
opom
.
małopolskie
dolnośląskie
kuja
wsk
o-po
m.
maz
owie
ckie
wie
lkop
olsk
ie
voivodship m. of objects 53 57 77 87 149 154 159 173 175 179 179 194 197 213 259 299
świętokrzyskie 53
opolskie 57
podlaskie 77
lubuskie 87
lubelskie 149
pomorskie 154
warmińsko-mazur. 159
podkarpackie 173
śląskie 175
łódzkie 179
zachodniopom. 179
małopolskie 194
dolnośląskie 197
kujawsko-pom. 213
mazowieckie 259
wielkopolskie 299 Source: Own study based on CSO data.
The first group with the lowest number of “Orliki” (about 50) includes 2
voivodeships: świętokrzyskie and opolskie. The next group consists of podlaskie,
lubuskie, lubelskie, pomorskie, and warmińsko-mazurskie with the number of
objects from 149 to 159. The most numerous is the fourth group containing 4
voivodships with the number of "Orliki" from 173 to 179. The last group consists of
voivodships with the largest number of objects, i.e., mazowieckie and wielkopolskie.
After analyzing the data on the number of "Orliki" in individual voivodships, the
participation of particular social groups in classes on their territory should be
examined and the division of provinces made in Figures 1 should be checked with
the division due to participation in classes (Table 1).

Economic and Legal Instruments of Local Senior Policy
in the Level of Municipalities
584
Table 1. Population, number of beneficiaries of the “Orliks” and their utilization
rates in 2009-2014 in the cross-section of voivodships Number of people
Voivodeship 2009 2010 2011 2012 2013 2014
Dolnośląskie 2 876 627 2 917 242 2 916 577 2 914 362 2 909 997 2 908 457
Kujawsko-pom. 2 069 083 2 098 711 2 098 370 2 096 404 2 092 564 2 089 992
Lubelskie 2 157 202 2 178 611 2 171 857 2 165 651 2 156 150 2 147 746
Lubuskie 1 010 047 1 023 215 1 023 158 1 023 317 1 021 470 1 020 307
Łódzkie 2 541 832 2 542 436 2 533 681 2 524 651 2 513 093 2 504 136
Małopolskie 3 298 270 3 336 699 3 346 796 3 354 077 3 360 581 3 368 336
Mazowieckie 5 222 167 5 267 072 5 285 604 5 301 760 5 316 840 5 334 511
Opolskie 1 031 097 1 017 241 1 013 950 1 010 203 1 004 416 1 000 858
Podkarpackie 2 101 732 2 127 948 2 128 687 2 129 951 2 129 294 2 129 187
Podlaskie 1 189 731 1 203 448 1 200 982 1 198 690 1 194 965 1 191 918
Pomorskie 2 230 099 2 275 494 2 283 500 2 290 070 2 295 811 2 302 077
Śląskie 4 640 725 4 634 935 4 626 357 4 615 870 4 599 447 4 585 924
Świętokrzyskie 1 270 120 1 282 546 1 278 116 1 273 995 1 268 239 1 263 176
Warmińsko-mazur. 1 427 118 1 453 782 1 452 596 1 450 697 1 446 915 1 443 967
Wielkopolskie 3 408 281 3 446 745 3 455 477 3 462 196 3 467 016 3 472 579
Zachodniopom. 1 693 198 1 723 741 1 722 739 1 721 405 1 718 861 1 715 431
Together 38 167 329 38 529 866 38 538 447 38 533 299 38 495 659 38 478 602
[R] - Users - all
Voivodeship 2009 2010 2011 2012 2013 2014
Dolnośląskie 250 300 621 400 1 107 096 1 627 433 1 753 311 1 567 606
Kujawsko-pom. 233 500 687 700 932 906 1 088 822 1 725 155 1 791 523
Lubelskie 106 600 340 300 534 638 702 650 1 046 883 1 668 565
Lubuskie 121 600 311 100 416 594 528 037 769 658 837 685
Łódzkie 279 200 660 300 996 563 1 273 465 1 212 545 1 663 700
Małopolskie 214 500 526 900 777 879 1 031 774 1 693 194 1 717 900
Mazowieckie 194 200 871 900 1 090 075 1 685 014 2 088 163 2 189 506
Opolskie 20 400 124 300 200 862 292 535 428 165 394 534
Podkarpackie 189 400 492 700 580 905 800 047 1 344 225 1 640 036
Podlaskie 109 000 349 600 564 529 600 699 578 194 680 644
Pomorskie 402 700 750 600 831 183 1 058 919 1 167 575 1 335 620
Śląskie 178 300 406 300 649 401 894 131 1 360 553 1 550 069
Świętokrzyskie 39 100 141 700 264 146 349 628 471 762 562 965
Warmińsko-mazur. 159 500 577 700 995 023 1 275 225 1 568 658 1 819 009
Wielkopolskie 262 000 1 041 800 1 696 999 2 181 318 2 664 775 2 819 726
Zachodniopom. 236 900 563 300 785 803 1 158 073 1 266 083 1 528 731
Together 2 997 100 8 467 500 12 424 602 16 547 770 21 138 899 23 767 819
Population using the Orliks in %
Voivodeship 2009 2010 2011 2012 2013 2014
Dolnośląskie 9% 21% 38% 56% 60% 54%
Kujawsko-pom. 11% 33% 44% 52% 82% 86%
Lubelskie 5% 16% 25% 32% 49% 78%
Lubuskie 12% 30% 41% 52% 75% 82%
Łódzkie 11% 26% 39% 50% 48% 66%
Małopolskie 7% 16% 23% 31% 50% 51%
Mazowieckie 4% 17% 21% 32% 39% 41%
Opolskie 2% 12% 20% 29% 43% 39%
Podkarpackie 9% 23% 27% 38% 63% 77%

M. Mamcarczyk, Ł. Popławski
585
Podlaskie 9% 29% 47% 50% 48% 57%
Pomorskie 18% 33% 36% 46% 51% 58%
Śląskie 4% 9% 14% 19% 30% 34%
Świętokrzyskie 3% 11% 21% 27% 37% 45%
Warmińsko-mazur. 11% 40% 68% 88% 108% 126%
Wielkopolskie 8% 30% 49% 63% 77% 81%
Zachodniopom. 14% 33% 46% 67% 74% 89%
Together 8% 22% 32% 43% 55% 62%
Source: Own calculations.
The above calculations indicate that 8% of the population of Poland used “Orlik”
facilities in 2009, and in 2014 it was over 60%. Please note here that the information
on the number of users applies to the "Moje Boisko - Orlik" complexes 2012, on
which the "Animator - Moje Boisko - ORLIK 2012" program was implemented; one
person is shown repeatedly if they used the facility more than once. Even
considering these assumptions, the program "Moje Boisko-Orlik 2012" had a
positive effect. The degree of use of sports facilities has increased. Most willingly, in
2009, inhabitants of the pomorskie (18%) used the "Orliki", and the least appeared
Opole residents (2%). Data for 2014 indicate an increase in interest in visiting the
"Orliki". The warmińsko-mazurskie voivodship deserves special attention, in which
11% of the population used the "Orliki" in 2009, and in 2014 it was 126%. The last
result indicates that, theoretically, every inhabitant of the province visited the
"Orlik" complex at least once. In order to find the confirmation of the thesis about
their positive impact on intergenerational integration in the functioning of the
"Orliki", it is necessary to examine how the number of people using them among
various age groups shaped. The information in Table 2 will help in this regard.
Table 2. Number of "spotted" objects and using them according to age groups in
2009-2014 Number of objects "Orlik"
voivodeship do 2009 do 2010 do 2011 do 2012 do 2012 do 2012
Dolnośląskie 104 147 173 197 197 197
Kujawsko-
pomorskie 99 145 181 213 213 213
Lubelskie 69 98 129 149 149 149
Lubuskie 45 66 78 87 87 87
Łódzkie 94 122 153 179 179 179
Małopolskie 88 124 166 194 194 194
Mazowieckie 118 159 220 259 259 259
Opolskie 21 38 47 57 57 57
Podkarpackie 70 89 125 173 173 173
Podlaskie 46 64 71 77 77 77
Pomorskie 106 124 144 154 154 154
Śląskie 86 114 149 175 175 175
Świętokrzyskie 26 39 49 53 53 53
Warmińsko-
mazurskie 61 110 145 159 159 159
Wielkopolskie 142 212 266 299 299 299
Zachodnio-
pomorskie 109 152 175 179 179 179
Poland 1284 1803 2271 2604 2604 2604 [M] - Users - children and teenagers (thousand) [D] - Users - adults (thousand)
voivodeship 2009 2010 2011 2012 2013 2014 2009 2010 2011 2012 2013 2014
Dolnośląskie 204,2 498,1 886,5 1 308,8 1 401,4 1 198,3 46,1 123,3 220,6 318,6 351,9 369,4
Kujawsko-
pomorskie 185,9 563,7 764,6 899,9 1 407,9 1 337,7 47,6 124 168,3 188,9 317,2 453,9
Lubelskie 88,4 276,1 420,4 567,0 818,6 1 231,2 18,2 64,2 114,3 135,7 228,2 437,4
Lubuskie 97,5 253,4 338,1 445,2 624,2 642,5 24,1 57,7 78,5 82,8 145,4 195,2
Łódzkie 222,8 519,7 766,9 982,1 975,1 1 148,2 56,4 140,6 229,6 291,4 237,5 515,5

Economic and Legal Instruments of Local Senior Policy
in the Level of Municipalities
586
Małopolskie 152,5 381,9 591,3 805,9 1 317,6 1 248,3 62 145 186,5 225,9 375,6 469,6
Mazowieckie 157,6 679,4 850,7 1 309,8 1 610,0 1 593,3 36,6 192,5 239,4 375,2 478,2 596,2
Opolskie 17,1 93,5 151,4 222,5 323,6 292,2 3,3 30,8 49,5 70,0 104,6 102,3
Podkarpackie 152,1 401,2 458,1 629,4 1 053,4 1 204,8 37,3 91,5 122,9 170,6 290,8 435,2
Podlaskie 90,8 286,4 447,0 471,2 449,2 495,8 18,2 63,2 117,5 129,5 129,0 184,9
Pomorskie 314,3 589,3 648,2 838,7 913,2 1 006,1 88,4 161,3 183,0 220,3 254,4 329,6
Śląskie 137,4 326,1 494,7 679,4 1 013,1 1 090,8 40,9 80,2 154,7 214,8 347,4 459,2
Świętokrzyskie 30,7 111,7 211,4 275,3 368,2 390,8 8,4 30 52,8 74,3 103,5 172,2
Warmińsko-
mazurskie 127,1 447,3 778,2 1 003,7 1 230,7 1 371,0 32,4 130,4 216,8 271,5 337,9 448,0
Wielkopolskie 237,4 902,6 1 349,2 1 707,8 2 065,5 2 027,5 24,6 139,2 347,8 473,5 599,2 792,2
Zachodnio-
pomorskie 193,6 446,4 639,8 941,3 1 007,3 1 129,3 43,3 116,9 146,0 216,8 258,8 399,5
Poland 2409,3 6776,8 9 796,6 13 087,9 16 579,3 17 407,9 587,8 1690,7 2 628,0 3 459,8 4 559,6 6 360,0
Source: Own study based on CSO data.
When interpreting the data contained in Table 2, attention should be paid to the
division that has been applied, i.e., to children, adolescents, and adults. Such a
distinction is necessary for the verification of the impact of the "Moje Boisko Orlik
2012" program on social and intergenerational integration. It can be noticed that the
number of users of the "Orlik" facilities grew not only when more and more objects
were being built.
The years 2013-2014 constituted the period in which, despite the end of the
program, children, adolescents, and adults more and more eagerly used the "Orliki".
A more detailed analysis will be possible after the review of the data contained in
Tables 3 and 4 due to a more thorough information distribution.
Table 3. Comparison of the number of inhabitants by age group with those using the
"Orliki" Number of inhabitants aged 5-19 (thousand) number of residents over 19 years (thousand)
Voivodeship 2009 2010 2011 2012 2013 2014 2009 2010 2011 2012 2013 2014
Dolnośląskie 440,6 430,8 420,0 415,0 412,4 410,6 2436,0 2486,5 2496,6 2499,4 2497,6 2497,8
Kujawsko-pom. 358,7 350,1 341,5 335,5 331,5 329,0 1710,4 1748,6 1756,9 1760,9 1761,0 1761,0
Lubelskie 379,1 369,2 358,2 348,9 342,3 336,9 1778,1 1809,4 1813,7 1816,8 1813,8 1810,8
Lubuskie 171,0 166,3 162,9 160,6 159,1 158,1 839,1 856,9 860,2 862,8 862,4 862,2
Łódzkie 392,8 382,7 373,2 365,7 361,0 358,0 2149,0 2159,7 2160,5 2159,0 2152,1 2146,2
Małopolskie 584,0 573,4 557,2 548,4 543,7 540,9 2714,2 2763,3 2789,6 2805,7 2816,8 2827,4
Mazowieckie 831,7 819,6 808,2 803,4 804,2 808,6 4390,5 4447,5 4477,4 4498,4 4512,7 4525,9
Opolskie 163,4 155,0 149,2 145,2 142,1 139,9 867,7 862,2 864,7 865,0 862,3 860,9
Podkarpackie 391,2 382,8 371,0 360,3 353,9 348,8 1710,5 1745,2 1757,6 1769,6 1775,4 1780,4
Podlaskie 208,6 203,4 196,8 191,0 186,6 183,4 981,1 1000,1 1004,2 1007,7 1008,4 1008,5
Pomorskie 388,9 383,4 376,0 372,9 372,6 373,4 1841,2 1892,1 1907,5 1917,2 1923,2 1928,6
Śląskie 707,5 683,6 666,0 653,9 647,4 643,3 3933,3 3951,3 3960,3 3961,9 3952,0 3942,6
Świętokrzyskie 212,8 207,6 200,8 195,2 191,1 187,9 1057,3 1075,0 1077,3 1078,8 1077,1 1075,3
Warmińsko-maz. 258,4 252,2 245,2 240,0 236,3 233,9 1168,7 1201,6 1207,4 1210,7 1210,6 1210,1
Wielkopolskie 590,7 579,2 566,7 559,4 556,5 555,8 2817,6 2867,6 2888,8 2902,8 2910,5 2916,8
Zachodnio-pom. 279,7 274,3 267,8 263,7 260,9 258,0 1413,5 1449,5 1454,9 1457,7 1457,9 1457,5
Poland 6359,0 6213,5 6060,9 5959,0 5901,6 5866,6 31808,3 32316,4 32477,5 32574,3 32594,0 32612,0
Number of children and teenagers using 1 object per year Number of adults using 1 object per year
Voivodeship 2009 2010 2011 2012 2013 2014 2009 2010 2011 2012 2013 2014
Dolnośląskie 1963 3388 5124 6644 7114 6083 443 839 1275 1617 1786 1875
Kujawsko-pom. 1878 3888 4224 4225 6610 6280 481 855 930 887 1489 2131
Lubelskie 1281 2817 3259 3805 5494 8263 264 655 886 911 1532 2935
Lubuskie 2167 3839 4335 5118 7175 7385 536 874 1006 952 1671 2243
Łódzkie 2370 4260 5013 5487 5447 6415 600 1152 1501 1628 1327 2880
Małopolskie 1733 3080 3562 4154 6792 6435 705 1169 1124 1164 1936 2420
Mazowieckie 1336 4273 3867 5057 6216 6152 310 1211 1088 1449 1846 2302
Opolskie 814 2461 3221 3904 5677 5126 157 811 1052 1228 1834 1796
Podkarpackie 2173 4508 3664 3638 6089 6964 533 1028 983 986 1681 2516
Podlaskie 1974 4475 6296 6119 5833 6439 396 988 1655 1682 1676 2401
Pomorskie 2965 4752 4501 5446 5930 6533 834 1301 1271 1430 1652 2140
Śląskie 1598 2861 3320 3882 5789 6233 476 704 1038 1227 1985 2624
Świętokrzyskie 1181 2864 4314 5194 6948 7374 323 769 1077 1403 1953 3248

M. Mamcarczyk, Ł. Popławski
587
Warmińsko-maz. 2084 4066 5367 6312 7741 8623 531 1185 1495 1708 2125 2817
Wielkopolskie 1672 4258 5072 5712 6908 6781 173 657 1308 1584 2004 2650
Zachodnio-pom. 1776 2937 3656 5259 5627 6309 397 769 834 1211 1446 2232
Poland 1876 3759 4314 5026 6367 6685 458 938 1157 1329 1751 2442
Source: Own study based on CSO data.
One may wonder whether the increase in interest in "Orlik" objects was not due to
changes in the population structure, i.e. an increase in the number of inhabitants in
the age groups examined. That is not the case, as in the 5-19 age bracket, an annual
decline in the number of residents in Poland can be observed. However, the number
of residents over 19 years of age grew only slightly. In individual voivodships the
situation varied. However, it can be stated that the changes in the number of
inhabitants did not have a great impact on increasing the share of population in the
use of "Orliki.
The "Orliki" will be used primarily by the young generation. However, an optimistic
trend can be observed as interest in using this multi-functional sport infrastructure is
growing among adults. Probably more and more parents, grandparents and other
relatives come with children to “Orliki”, first to supervise and then to take part in
outdoor activities. Participation in such group activities serve to exchange
experiences between adults, but also can be a platform that integrates generations. Figure 2. Voivodships like each other in terms of increasing the number of people
using the "Orlik" within one year (difference between 2009 and 2014)
Po
mo
rsk
ie
Dolnośląskie
Op
ols
kie
Ku
jaw
sko
-po
m.
Łódzkie
Zach
od
nio
po
m.
Małopolskie
Po
dla
skie
Po
dk
arp
ack
ie
Śląskie
Mazo
wie
ck
ie
Lu
bu
skie
Wie
lko
po
lsk
ie
Warm
ińsko-m
azur.
Świętokrzyskie
Lu
bels
kie
4 874 5 551 5 950 6 052 6 324 6 367 6 418 6 470 6 774 6 784 6 808 6 926 7 585 8 826 9 118 9 653
Pomorskie 4 874
Dolnośląskie 5 551
Opolskie 5 950
Kujawsko-pom. 6 052
Łódzkie 6 324
Zachodniopom. 6 367
Małopolskie 6 418
Podlaskie 6 470
Podkarpackie 6 774
Śląskie 6 784
Mazowieckie 6 808
Lubuskie 6 926
Wielkopolskie 7 585
Warmińsko-mazur. 8 826
Świętokrzyskie 9 118
Lubelskie 9 653 Source: Own study based on CSO data.

Economic and Legal Instruments of Local Senior Policy
in the Level of Municipalities
588
Figure 2 was carried out in the same way as the previous two figures. Due to it, one
can compare the similarity of voivodships in terms of increasing number of people
using "Orlik" facilities. The first group consists of pomorskie and dolnośląskie
voivodsip. Then, three internally consistent groups of voivodsips can be
distinguished:
• opolskie, kujawsko-pomorskie and łódzkie;
• zachodniopomorskie, małopolskie and podlaskie;
• podkarpackie, śląskie, mazowieckie and lubuskie.
It can be also noted that warmińsko-mazurskie and świętokrzyskie provinces are
similar. Individualities are wielkopolskie and lubelskie. That indicates that the
situation with the use of "Orlik" objects is diverse, although the increasing number
of users is optimistic for the future.
5. Conclusions
Caring for correct intergenerational relations and building mutual trust is essential
for the proper functioning of society. The role of the elderly was usually depreciated.
They were not treated properly. Meanwhile, one can learn a lot from older people,
including true values, respect for others, learn about the hardships of life several
decades ago. Most important is underline the value of elderly people, and attention
should be paid to the fact that soon they will be the most populous group of
inhabitants on the globe.
Efforts are needed to facilitate access to the public goods, especially sports
infrastructure, of the elderly. The impact of the social environment in which
individuals are located is important for its development and survival. Some
different and similar points of view have been presented by Sulich (2017;
2018), Sulich and Zema (2018), Prus and Marszewska (2009), Prus and
Wawrzyniak (2011), Prus and Grabowski (2016). Therefore, it is necessary to
ensure the right position of older people in society. Owing to "Orliki", the users
learn how life in public space should look like, because they do not smoke, drink, do
not curse, and the "fair play" rules apply. It is worth emphasizing that these objects
serve every age group.
The analysis of empirical data, as well as national and European documents
presented in the article, allow to familiarize with the subject of social and
intergenerational integration in the context of sports development and sports
infrastructure. Presentation of data proving the growing number of users of "Orliki"
allows to look optimistically in the future and hope that the community will be more
concerned about physical activity and thus about one’s health. It should be
remembered, however, that sports facilities, and all programs that promote
movement are only a part of a larger whole called health. It cannot be said that

M. Mamcarczyk, Ł. Popławski
589
physical activity in an unequivocal way will make old age lighter. It is important,
however, to look after oneself throughout entire life as one can avoid many diseases
or slow down own development.
References:
Annex to decision No. 55 of the Minister of Sport and Tourism of 15 December 2017,
Program for the development of small sports and recreation infrastructure with
multi-generational features - Open Activity Zones (OAZs) Edition 2018,
https://bip.msit.gov.pl/bip/finansowanie-
zadan/infrastruktura/2018rok/2180,Program
rozwoju-malej-infrastruktury-sportowo-rekreacyjnej-o-charakterze-wielopo.html,
3,5 [in polish].
Broda-Wysocki, P. 2012. Social exclusion and inclusion. Paradigms and definition attempts.
Institute of Labor and Social Affairs. Warsaw, 45 [in polish].
Central Statistical Office. 2017. Duration of life in 2016 year. Warsaw, 15 [in polish].
Clutterbuck, R., Doherty, A. 2019. Organizational capacity for domestic sport for
Development. Journal of Sport for Development, 7(12), 16-32.
Custódio, M.J.F., Azevedo, A., Pereira-Perna, F. 2018. Sport events and local communities:
a partnership for placemaking. Journal of Place Management and Development.
Dictionary of Foreign Words PWN .2002. Warsaw, 475 [in polish].
Dictionary of sociological. 2001. Publisher of the Cracow University of Economics, Cracow,
63-64 [in polish].
Ekholm, D., Holmlid, S. 2020. Formalizing sports-based interventions in cross-sectoral
cooperation: Governing and infra-structuring practice, program, and preconditions.
Journal of Sport for Development, 8(14), 1-20.
Eurostat Statistical Books. 2010. Combating Poverty and Social Exclusion. A statistical
portrait of the European Union,
https://ec.europa.eu/eurostat/documents/3217494/5723553/KS-EP-
09001EN.PDF/beb36abc-ff29-48a0-8518-32b64ad73ca5.
Gołdys, A., Stec, M., Wiśnicka, M., Wołoch, R. 2013. Orliki and Animators. Report on
research conducted as part of the Animator Academy, December 24,
http://sportimpakt.org/wp-content/uploads/2016/08/Nasz-Orlik-raport-2013.pdf [in
polish].
Grima, S., Grima, A., Thalassinos, I.E., Seychell, S., Spiteri, J.V. 2017. Theoretical Models
for Sport Participation: Literature Review. International Journal of Economics and
Business Administration, 5(3), 94-116.
Grima, S., Grima, A., Thalassinos, I.E., Seychell, S., Spiteri, J.V. 2018. A Study of the
Determinants of Sports Participation by Maltese Nationals. European Research
Studies Journal, 21(2), 110-133.
Halsall, T., Forneris, T. 2016. Challenges and strategies for success of a sport-for-
development programme for First Nations, Métis and Inuit youth. Journal of Sport
for Development, 4(7), 39-57.
Mamcarczyk, M. 2013. The Program “My Pitch-Orlik 2012” as an Element Supporting
Polish Labour Market. Economic Studies, vol. 161, Katowice [in polish].
Meir, D. 2017. Leadership and empowerment through sport: The intentions, hopes,
ambitions and reality of creating a sport-for development organization in Cape
Town. Journal of Sport for Development, 5(8), 19-29.

Economic and Legal Instruments of Local Senior Policy
in the Level of Municipalities
590
Ministry Sport of Tourism. 2015. Information of the Minister of Sport and Tourism on the
Implementation of the Programs “My Pitch - Orlik 2012” and “White Orlik” in
2008-2012. Warsaw, [in polish].
Ministry Sport of Tourism. 2009. Public Information Bulletin.
https://bip.msit.gov.pl/bip/finansowanie-zadan/infrastruktura/2009-rok/310,Nabor-
wnioskow-do-czwartej-edycji-programu-Budowa-wielofunkcyjnych-boisk-
sportow.html [in polish].
Ministry of Labor and Social Policy. 2012. National Action Plan for the European Year of
Active Aging and Solidarity between Generations 2012 in Poland, Warsaw, 30,
http://analizy.mpips.gov.pl/images/stories/publ_i_raporty/ER2012/PL_KPD%20ER
%202012.pdf [in polish].
Okada, C. 2018. Sport for development in Japan. Journal of Sport for Development,
6(11), 15-20.
Prus, P., Grabowski, A. 2016. Implementation of the concept of sustainable development on
the example of the Lubraniec commune - selected aspects. Scientific Annals of the
Association of Agricultural and Agribusiness Economists, 18(5), 212-217 [in
polish].
Prus, P., Marszewska, A. 2009. Prospects for Sustainable Development of Bytoń Commune
in Its Inhabitants' Opinion. Scientific Annals of the Association of Agricultural and
Agribusiness Economists, Volume 11, Issue 4, 267-271, [in polish].
Prus, P., Wawrzyniak, B.M. 2011. Project Management and Functions of the Municipalities
in the Field of Rural Development Programs. Studies and Proceedings Polish
Association for Knowledge Management, 44, 77-92, [in polish].
Qerimi, Q., Sergi, B.S. 2015. Development and social development in the global context.
International Journal of Business and Globalisation 14(4), 383. DOI:
10.1504/IJBG.2015.069682.
Ratyński, W. 2003. Problems and dilemmas of social policy in Poland, Volume 2. Difin,
Warsaw, 420-423, [in polish].
Rhodes, S., Kaul, S. 2014. Sporting events building local communities. Report by the
Commonwealth Local Government Forum launched at the pre-Commonwealth
Games reception hosted by the Lord Provost of Glasgow City Council.
Rosa, A., Jakubowska, A. 2017. Threat of Social Exclusion in Rural Areas of the European
Union. Scientific Annals of the Association of Agricultural and Agribusiness
Economists, Volume XIX, issue 3, 244-245, [in polish].
Sergi, B., Popkova, E., Bogoviz, A., Litvinova, T. 2019. Future Outlines of the Body Care
and Fitness Sector. Understanding Industry 4.0: AI, the Internet of Things, and
the Future of Work. Emerald Publishing Limited. DOI: https://doi.org/10.1108/978-
1-78973-311-220191025.
Skinner, J., Zakus, D.H., Cowell, J. 2008. Development through Sport: Building Social
Capital in Disadvantaged Communities. Sport Management Review, 11(3), 253-275.
Slender, H., Hover, P., Straatmeijer, J., Cevaal, A. 2015. Impact of sport events on local
communities: Dimensions and measures. Conference,
European Association for Sociology of Sport, vol. 12, Dublin.
Sulich, A. 2017. Sustainable development as a subject of measurement in New Public
Management context. 15th International Conference on Environmental Science and
Technology. Rhodes, Greece, 1-5.
Sulich, A. 2018. The meaning of the sustainable development economy. Market-Society-
Culture, 4(30), 24-27, [in polish].
Sulich, A., Zema, T. 2018. Green Jobs, A New Measure of Public Management

M. Mamcarczyk, Ł. Popławski
591
and Sustainable Development. European Journal of Environmental Sciences 8(1),
69-75.
Szark-Eckardt, M., Mazur, M., Augustyńska, B. 2017. Impact of sport animators on the
promotion of physical activity among the local community. Internal Trade,
4(369), 254-255, [in polish].
Ujma-Wąsowicz, K. 2012. Shaping sports and recreational spaces in the city. Problem
evolution. The Silesian Technical University, Gliwice, 178, [in polish].
Vail, S.E. 2007. Community Development and Sport Participation. Journal of Sport
Management, 21(4).
Whitley, M.A., Farrell, K., Wolff, E.A., Hillyer, S.J. 2019. Sport for development and peace:
Surveying actors in the field. Journal of Sport for Development, 7(11), 1-15.
Young, K., Okada, C. 2014. Sport, Social Development and Peace, Vol. 8. Emerald Group
Publishing Limited.
Young, K., Atkinson, M., Young, K. 2012. Qualitative Research on Sport and Physical
Culture, Vol. 6. Emerald Group Publishing Limited.
Young, K. 2016. Sociology of Sport: A Global Subdiscipline in Review, Vol. 9. Emerald
Group Publishing Limited.
Internet sources:
http://demografia.stat.gov.pl/bazademografia/CustomSelect.aspx.
https://naszOrlik.pl/baza-wiedzy/kim-jest-animator-Orlika.
Copyright © 2022 FDOKUMEN

