


Bahasa
Halaman
Hukum


ITcon Vol. 13 (2008), Breland et al, pg. 594
A STUDY OF USER PERCEPTIONS OF THE RELATIONSHIP
BETWEEN BUMP-MAPPED AND NON-BUMP-MAPPED
MATERIALS, AND LIGHTING INTENSITY IN A REAL-TIME
VIRTUAL ENVIRONMENT
SUBMITTED: January 2008
REVISED: July 2008
REVISED: November 2008
PUBLISHED: November 2008 at http://itcon.org/2008/38
EDITOR: John Messner
Jason S. Breland, Graduate Research Assistant,
School of Construction
The University of Southern Mississippi
Hattiesburg, MS 39406, USA
Mohd Fairuz Shiratuddin, Assistant Professor,
School of Construction
The University of Southern Mississippi
Hattiesburg, MS 39406, USA
Kevin M. Kitchens, Graduate Research Assistant,
School of Construction
The University of Southern Mississippi
Hattiesburg, MS 39406, USA
SUMMARY: The video and computer games industry has taken full advantage of the human sense of
vision by producing games that utilize complex high-resolution textures and materials, and lighting
technique. This results to the creation of an almost life-like real-time 3D virtual environment that can
immerse the end-users. One of the visual techniques used is real-time display of bump-mapped materials.
However, this sense of visual phenomenon has yet to be fully utilized for 3D design visualization in the
architecture and construction domain. Virtual environments developed in the architecture and construction
domain are often basic and use low-resolution images, which under represent the real physical
environment. Such virtual environment is seen as being non-realistic to the user resulting in a
misconception of the actual potential of it as a tool for 3D design visualization.
A study was conducted to evaluate whether subjects can see the difference between bump-mapped and non-
bump-mapped materials in different lighting conditions. The study utilized a real-time 3D virtual
environment that was created using a custom-developed software application tool called BuildITC4.
BuildITC4 was developed based upon the C4Engine which is classified as a next-generation 3D Game
Engine. A total of thirty-five subjects were exposed to the virtual environment and were asked to compare
the various types of material in different lighting conditions. The number of lights activated, the lighting
intensity, and the materials used in the virtual environment were all interactive and changeable in real-
time. The goal is to study how subjects perceived bump-mapped and non-bump mapped materials, and how
different lighting conditions affect realistic representation. Results from this study indicate that subjects
could tell the difference between the bump-mapped and non-bump mapped materials, and how different
material reacts to different lighting condition.
KEYWORDS: 3D game engine, bump-map, dynamic lighting, real-time, virtual environment.
ITcon Vol. 13 (2008), Breland et al, pg. 595
1. INTRODUCTION
The video and computer games industry has taken full advantage of the human sense of vision by
producing games that utilize complex high-resolution materials for 3D objects/images, and lighting
techniques. As a result, the game environment although virtual, creates an almost life-like real-time 3D
virtual environment (VE) that can immerse the end-users. One of the visual techniques used in game
environment is real-time display of bump-mapped materials. However, this sense of visual phenomenon
has yet to be fully utilized in the architecture and construction domain. Virtual environments developed in
the architecture and construction domain are often basic and use low-resolution images, which under
represent the real physical environment. Such virtual environment is seen as being non-realistic to the user
resulting in a misconception of the actual potential of it as a tool for 3D design visualization.
At present, professionals in the architecture and construction domain have started to use real-time VE as a
supplemental design tool. However, due to the lack of affordable real-time VE development tools and the
complexity of creating such environment, the use of VE as a tool for design visualization is hindered. Most
VEs developed for design visualization purposes falls short of the quality shown in many next-generation
video games. Basic primary colors such as red, green and blue (RGB) are still commonly used in
architecture and construction related VEs. Some of the design and construction related VEs use low-
resolution digital images as textures hence resulting in the lack of visual depth and realism.
On the other hand, the video and computer games industry has fully harnessed the capabilities of computer
processing and computer graphics technologies to create believable real-time VEs; VEs that are more
interactive, utilize high-resolution texture maps with more advanced methods of texture mapping such as
bump, parallax, specular etc. Texture mapping has been used to improve details of realism in video and
computer games environment. According to Heckbert (1986), texture mapping is “the mapping of a
function onto a surface in 3D. The domain of the function can be one, two or three dimensional, and it can
be represented by either an array or a mathematical function.” Texture mapping allows indefinite effects (or
shaders) for photorealism on textures of the objects in a VE. In physical reality, a texture or material refers
to the characteristics of a surface as it appears on an object. The surface of an object can be described as
smooth, rough, tiled or glossy. Some of the pioneer works on texture mapping and the parameters that were
texture mapped are; surface color (Catmull, 1974), specular reflection (Blinn & Newell, 1976), bump-
mapping (Blinn, 1978), diffuse reflection (Miller & Hoffman, 1984), and shadows and surface
displacement (Cook, 1984).James Blinn developed bump-mapping (or light-reflectivity) as a method of
rendering realistic shading on bumpy surfaces, without actually rendering a full 3D model of the bumps
(Blinn, 1978). By applying bump-mapping, a surface appears to have real depth, is more detailed and more
similar to objects in the real physical world. Bump-mapping also ensures that the appearance of the surface
changes as lights in the scene move around, or different intensity of light source is used.
There are many software tools dedicated to architectural design. One of the most popular is Autodesk
Architecture (used to be called Autodesk Architectural Desktop) which is known to be very complex and
expensive, yet still cannot be used as a good visualization tool. Autodesk Architecture rendering engine
produces poor quality images and the visualization computations are rather slow. Due to this, additional
programs such as Autodesk 3DS Max, Autodesk Maya etc. have to be used by designers to create photo-
realistic visualizations. These software tools use similar global illumination rendering algorithms, photon
mapping or radiosity methods supported by ray tracing and scanline algorithms that are capable of
rendering high quality images or movies. However, the main shortcoming of these tools is the long
computational time hence increasing the rendering time extensively (Wrobel, 2008). In addition, multitudes
of test renders have to be performed on small portion of the intended rendering area images before the
desired effect can be achieved. This calls for a method to shorten rendering time, and one method of
achieving this is to use a real-time rendering engine which is rooted in a 3D Game Engine.
One of the first real-time architectural visualization and walkthrough project using a 3D Game Engine was
the Virtual Notre Dame Project developed by Digitalo Studios (DeLeon, 2000). In this project, a photo-
realistic real-time rendering technology i.e. Epic Games‟ Unreal 3D Game Engine was used in the
reconstruction of the Notre Dame cathedral. The technology allows for the complex representation of the
ITcon Vol. 13 (2008), Breland et al, pg. 596
cathedral using textured polygons. As a result, end-users were able to experience interactive and real-time
navigation in the cathedral, with high-resolution visual effects that show lighting, shadows, and the actual
look of the textures in real-time, rendered at a high frame rate. The Virtual Notre Dame Project can be
viewed on a desktop PC and also in the CAVE system. Similar works using 3D Game Engine as a design
and construction visualization tool can be found from Shiratuddin & Thabet (2002), Moloney et al (2003),
Shiratuddin & Fletcher (2007), Kitchens & Shiratuddin (2007), and HKS Inc. (2008).
This paper presents the results from an experiment we conducted to study user perception of the
relationship between bump-mapped and non-bump-mapped materials, in different lighting conditions.
Subjects navigated in a real-time VE and determined whether they can see the difference between bump-
mapped and non-bump-mapped material in different lighting intensities, and also determined the best
possible combinations of materials and lighting intensities. After the experiment, subjects were given a set
of questions that evaluate each chosen material under various lighting intensities. The paper also describes
the software used to develop the VE, the development process of the VE itself, the methods used for the
experiment, the data analysis, and finally the conclusion and future work.
2. BUILDITC4 AND THE C4ENGINE
The software we used to develop the VE is called BuildITC4, which was developed based on Terathon‟s
C4Engine 3D Game Engine. The C4Engine is an affordable next-generation 3D Game Engine that is
commercially available in the market (DevMaster.net, 2008). Even though the C4Engine is primarily used
as a 3D games development tool, the engine‟s features, and its affordable licensing cost (that includes full-
access to the entire source code) allow us to develop BuildITC4 as a 3D architectural visualization tool. We
are enhancing BuiltITC4 from time to time and it is our goal to make it suitable as a 3D real-time
visualization tool for the AEC industry. We are currently using BuildITC4 for both teaching and research at
the School of Construction, at the University of Southern Mississippi.
In this study, an interactive virtual home design tool was developed using BuildITC4. Two of the important
features of the C4Engine were used; (1) the ability to display in real-time feature-rich and highly enhanced
texture mapping such as bump-mapping, parallax-mapping, specular-mapping, gloss-mapping etc. and (2)
the ability to turn dynamic lightings on and off in real-time. Through our collective experience in using
other 3D Game Engines (such as Unreal, Half-Life, Torque and OGRE) to develop VEs, we found that the
C4Engine is well-structured and provides relatively smaller learning curve compared to other engines. To
date, the author of the engine and the C4Engine‟s online community forum have been providing support.
The forum provides access to numerous documentations, tutorials and discussion threads.
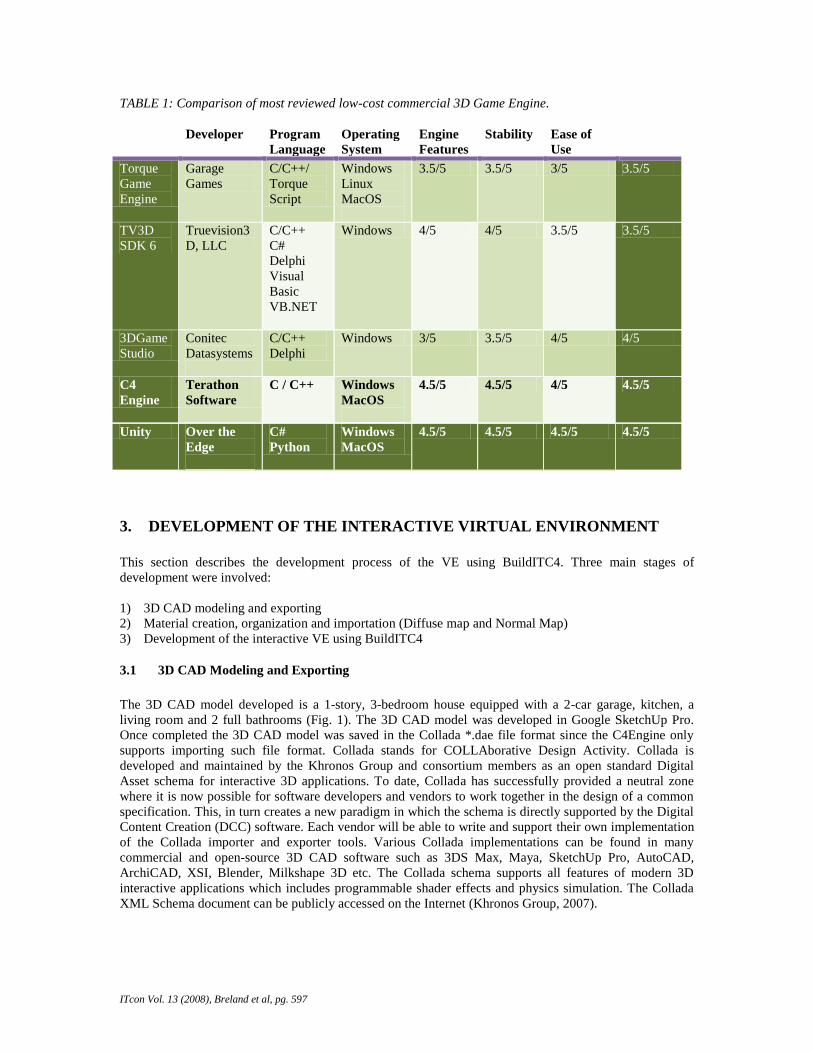
DevMaster.net is a website that provides information on some of the most reviewed low-cost commercial
3D Game Engines. Table 1 summarizes the features of the C4Engine to five other commercial 3D Game
Engines presently available on the market (DevMaster.net, 2008). The reviews were taken from opinions of
professional game designers and developers who use the engines. Besides the Unity game engine, the
almost perfect rating given to the C4Engine is one of the main reason BuildITC4 was developed upon and
used in this study. We did not use the Unity game engine because development has to be performed in an
Apple Macintosh OS-X environment.
ITcon Vol. 13 (2008), Breland et al, pg. 597
TABLE 1: Comparison of most reviewed low-cost commercial 3D Game Engine.
Game
Engine
Developer Program
Language
Operating
System
Engine
Features
Stability Ease of
Use
Support
Torque
Game
Engine
Garage
Games
C/C++/
Torque
Script
Windows
Linux
MacOS
3.5/5 3.5/5 3/5 3.5/5
TV3D
SDK 6
Truevision3
D, LLC
C/C++
C#
Delphi
Visual
Basic
VB.NET
Windows 4/5 4/5 3.5/5 3.5/5
3DGame
Studio
Conitec
Datasystems
C/C++
Delphi
Windows 3/5 3.5/5 4/5 4/5
C4
Engine
Terathon
Software
C / C++ Windows
MacOS
4.5/5 4.5/5 4/5 4.5/5
Unity Over the
Edge
C#
Python
Windows
MacOS
4.5/5 4.5/5 4.5/5 4.5/5
3. DEVELOPMENT OF THE INTERACTIVE VIRTUAL ENVIRONMENT
This section describes the development process of the VE using BuildITC4. Three main stages of
development were involved:
1) 3D CAD modeling and exporting
2) Material creation, organization and importation (Diffuse map and Normal Map)
3) Development of the interactive VE using BuildITC4
3.1 3D CAD Modeling and Exporting
The 3D CAD model developed is a 1-story, 3-bedroom house equipped with a 2-car garage, kitchen, a
living room and 2 full bathrooms (Fig. 1). The 3D CAD model was developed in Google SketchUp Pro.
Once completed the 3D CAD model was saved in the Collada *.dae file format since the C4Engine only
supports importing such file format. Collada stands for COLLAborative Design Activity. Collada is
developed and maintained by the Khronos Group and consortium members as an open standard Digital
Asset schema for interactive 3D applications. To date, Collada has successfully provided a neutral zone
where it is now possible for software developers and vendors to work together in the design of a common
specification. This, in turn creates a new paradigm in which the schema is directly supported by the Digital
Content Creation (DCC) software. Each vendor will be able to write and support their own implementation
of the Collada importer and exporter tools. Various Collada implementations can be found in many
commercial and open-source 3D CAD software such as 3DS Max, Maya, SketchUp Pro, AutoCAD,
ArchiCAD, XSI, Blender, Milkshape 3D etc. The Collada schema supports all features of modern 3D
interactive applications which includes programmable shader effects and physics simulation. The Collada
XML Schema document can be publicly accessed on the Internet (Khronos Group, 2007).

ITcon Vol. 13 (2008), Breland et al, pg. 598
FIG. 1: 2D CAD floor plan for the 3-bedroom house showing the placement of lights.
In this study, 3D objects were created in Google SketchUp Pro and a double-hull modeling technique was
used. This technique stresses that each room must be considered its own environment. Furthermore, the
floor, ceiling, and wall of each room (or space) of the house must have its own independent geometry (as in
the real-world whereby each component is a separate individual piece). Besides double-hulling, for easier
identification and organizational purposes, separate layers and groups were also created. During the
importation process these layers were identified by BuildITC4 as they were in Google SketchUp. For
example, the master bedroom walls was placed in the Master_Bedroom_Walls layer and in its own
independent group named as Master_Bedroom_Walls group.
Even though an entire 3-bedroom house was created (Fig. 2), the study only focused on the living room and
master bedroom area. In these two areas was where the Materials and Lightings evaluation took place. In
the living room, five lighting fixtures were used that represent incandescent light bulbs with dimming
capability. Furniture was added to give subjects a better understanding of the overall space of the living
room. The lighting fixtures for the master bedroom consisted of two dimmer incandescent lights; a bed-side
lamp and a ceiling fan light. Some generic bedroom furniture was also placed in the master bedroom.
FIG 2: 3D CAD model of the 3-bedroom house.
ITcon Vol. 13 (2008), Breland et al, pg. 599
3.2 Material Creation, Organization and Importation
During the study, each subject had the opportunity to choose and evaluate from six different materials for
the ceiling, walls and floor of both living and master bedroom. Each material had two slightly different
effects; one with bump-mapping and the other without-bump mapping. Therefore, a total of 18 diffuse
(color) materials and 9 height-map (black and white) materials had to be created in MapZone. They were
then organized and imported into BuildITC4. Each material‟s pixel size must be to the powers of 2 i.e.
128x128, 256x256, 512x256 etc. since the C4Engine only supports such pixel dimension size. Each
material was saved into the Targa (TGA) image file format.
In this study, materials of 1024x1024 pixels were used to ensure clarity and high quality resolution.
Although, different types of materials can be generated in using the built-in Material Manager, only diffuse
and normal map channels were used to generate the bump and non-bump mapped materials.
3.3 Development of the interactive VE using BuildITC4
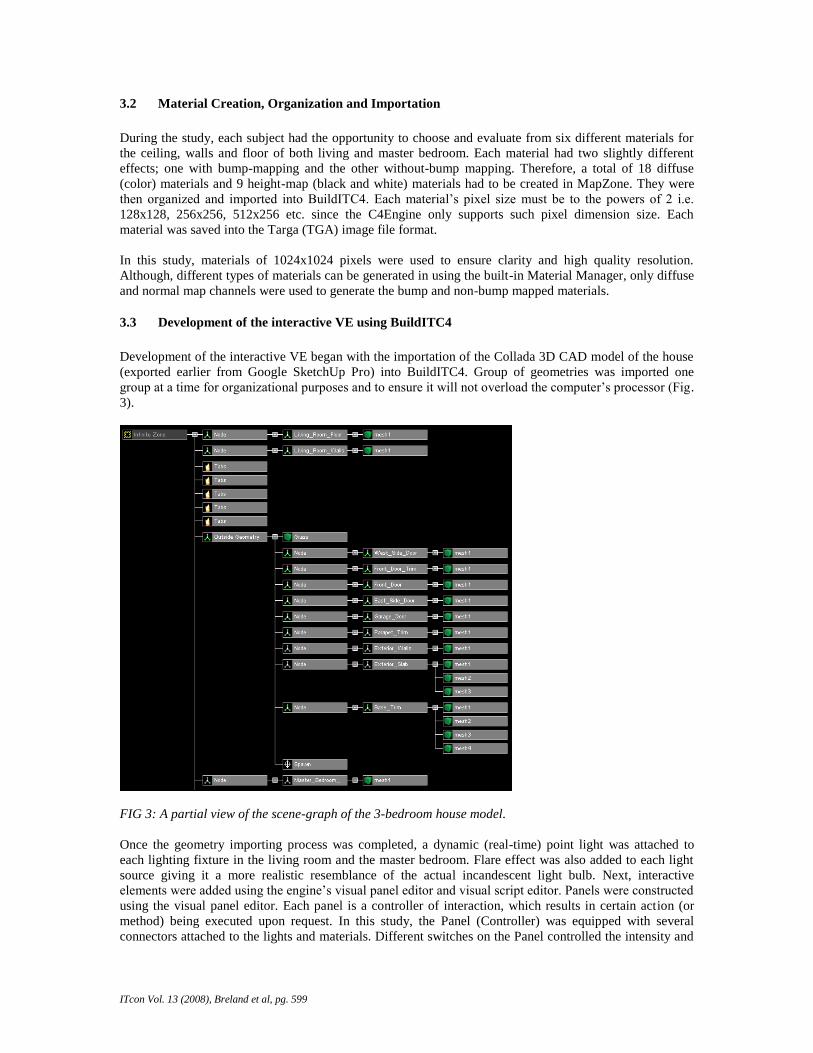
Development of the interactive VE began with the importation of the Collada 3D CAD model of the house
(exported earlier from Google SketchUp Pro) into BuildITC4. Group of geometries was imported one
group at a time for organizational purposes and to ensure it will not overload the computer‟s processor (Fig.
3).
FIG 3: A partial view of the scene-graph of the 3-bedroom house model.
Once the geometry importing process was completed, a dynamic (real-time) point light was attached to
each lighting fixture in the living room and the master bedroom. Flare effect was also added to each light
source giving it a more realistic resemblance of the actual incandescent light bulb. Next, interactive
elements were added using the engine‟s visual panel editor and visual script editor. Panels were constructed
using the visual panel editor. Each panel is a controller of interaction, which results in certain action (or
method) being executed upon request. In this study, the Panel (Controller) was equipped with several
connectors attached to the lights and materials. Different switches on the Panel controlled the intensity and
ITcon Vol. 13 (2008), Breland et al, pg. 600
number of light source, as well as the material being applied onto the surface of the ceilings, walls and
floors. Actions were assigned to each switch on the Panel using the visual script editor. The visual script
editor contains several pre-defined yet customizable functions such as calling a function for execution or
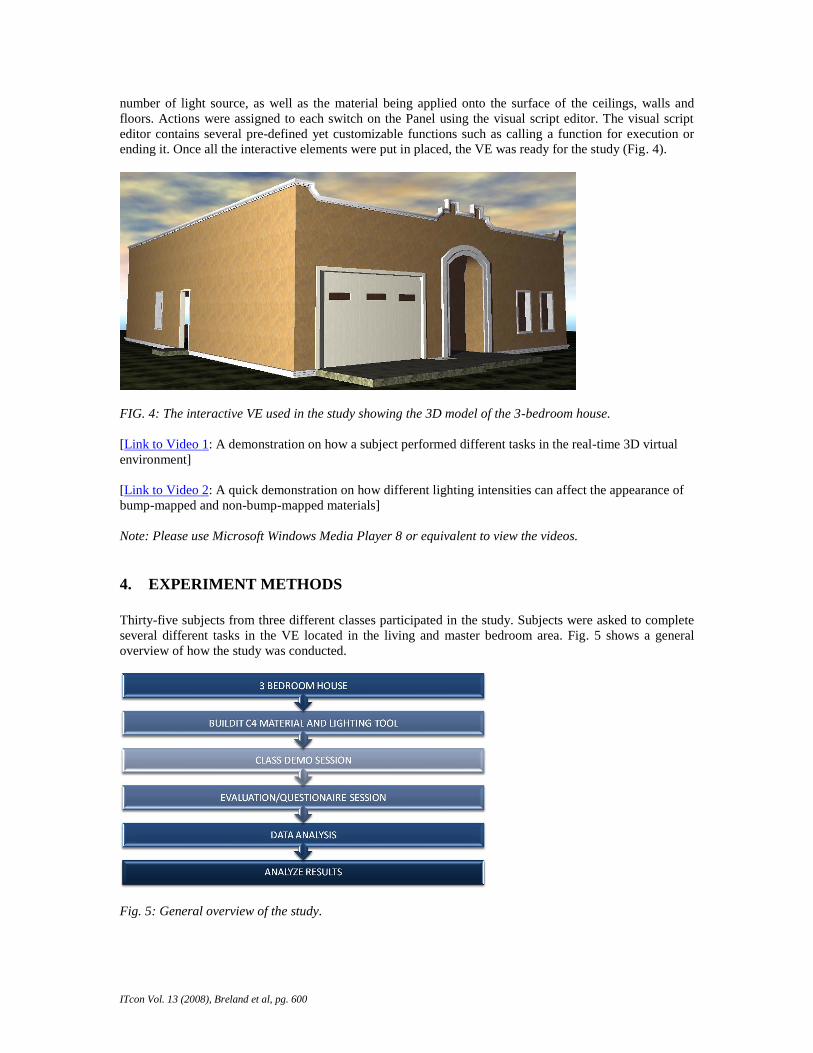
ending it. Once all the interactive elements were put in placed, the VE was ready for the study (Fig. 4).
FIG. 4: The interactive VE used in the study showing the 3D model of the 3-bedroom house.
[Link to Video 1: A demonstration on how a subject performed different tasks in the real-time 3D virtual
environment]
[Link to Video 2: A quick demonstration on how different lighting intensities can affect the appearance of
bump-mapped and non-bump-mapped materials]
Note: Please use Microsoft Windows Media Player 8 or equivalent to view the videos.
4. EXPERIMENT METHODS
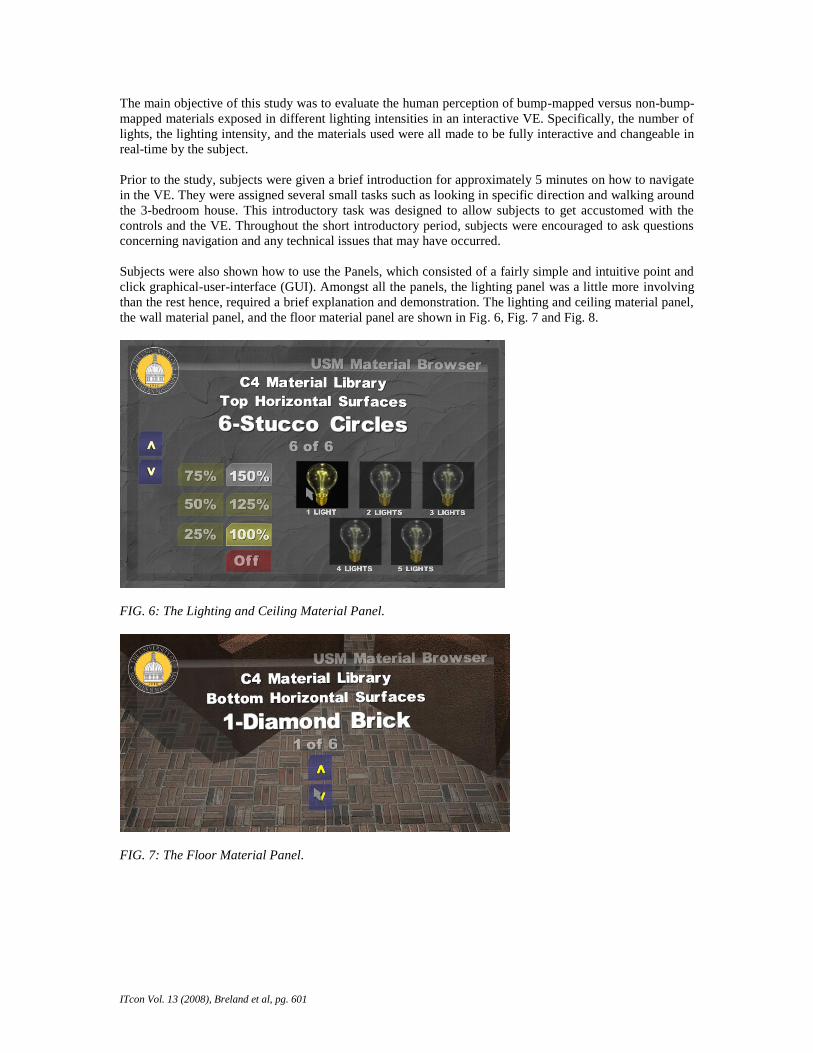
Thirty-five subjects from three different classes participated in the study. Subjects were asked to complete
several different tasks in the VE located in the living and master bedroom area. Fig. 5 shows a general
overview of how the study was conducted.
Fig. 5: General overview of the study.
ITcon Vol. 13 (2008), Breland et al, pg. 601
The main objective of this study was to evaluate the human perception of bump-mapped versus non-bump-
mapped materials exposed in different lighting intensities in an interactive VE. Specifically, the number of
lights, the lighting intensity, and the materials used were all made to be fully interactive and changeable in
real-time by the subject.
Prior to the study, subjects were given a brief introduction for approximately 5 minutes on how to navigate
in the VE. They were assigned several small tasks such as looking in specific direction and walking around
the 3-bedroom house. This introductory task was designed to allow subjects to get accustomed with the
controls and the VE. Throughout the short introductory period, subjects were encouraged to ask questions
concerning navigation and any technical issues that may have occurred.
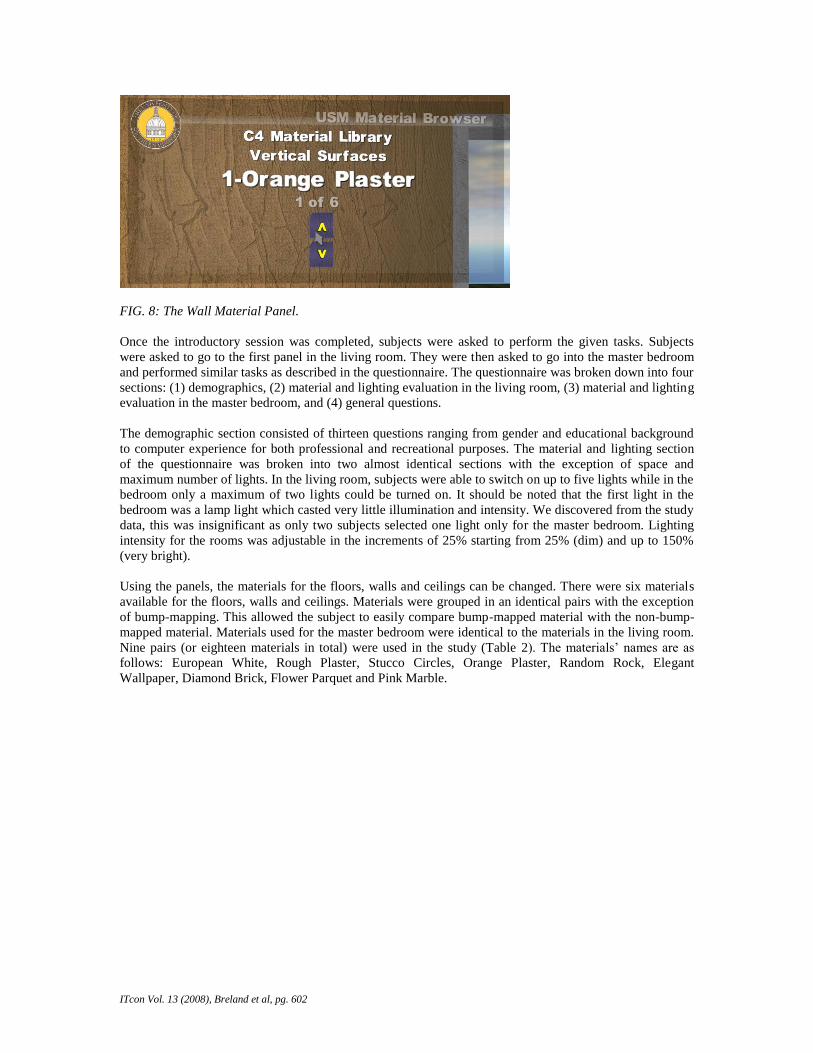
Subjects were also shown how to use the Panels, which consisted of a fairly simple and intuitive point and
click graphical-user-interface (GUI). Amongst all the panels, the lighting panel was a little more involving
than the rest hence, required a brief explanation and demonstration. The lighting and ceiling material panel,
the wall material panel, and the floor material panel are shown in Fig. 6, Fig. 7 and Fig. 8.
FIG. 6: The Lighting and Ceiling Material Panel.
FIG. 7: The Floor Material Panel.
ITcon Vol. 13 (2008), Breland et al, pg. 602
FIG. 8: The Wall Material Panel.
Once the introductory session was completed, subjects were asked to perform the given tasks. Subjects
were asked to go to the first panel in the living room. They were then asked to go into the master bedroom
and performed similar tasks as described in the questionnaire. The questionnaire was broken down into four
sections: (1) demographics, (2) material and lighting evaluation in the living room, (3) material and lighting
evaluation in the master bedroom, and (4) general questions.
The demographic section consisted of thirteen questions ranging from gender and educational background
to computer experience for both professional and recreational purposes. The material and lighting section
of the questionnaire was broken into two almost identical sections with the exception of space and
maximum number of lights. In the living room, subjects were able to switch on up to five lights while in the
bedroom only a maximum of two lights could be turned on. It should be noted that the first light in the
bedroom was a lamp light which casted very little illumination and intensity. We discovered from the study
data, this was insignificant as only two subjects selected one light only for the master bedroom. Lighting
intensity for the rooms was adjustable in the increments of 25% starting from 25% (dim) and up to 150%
(very bright).
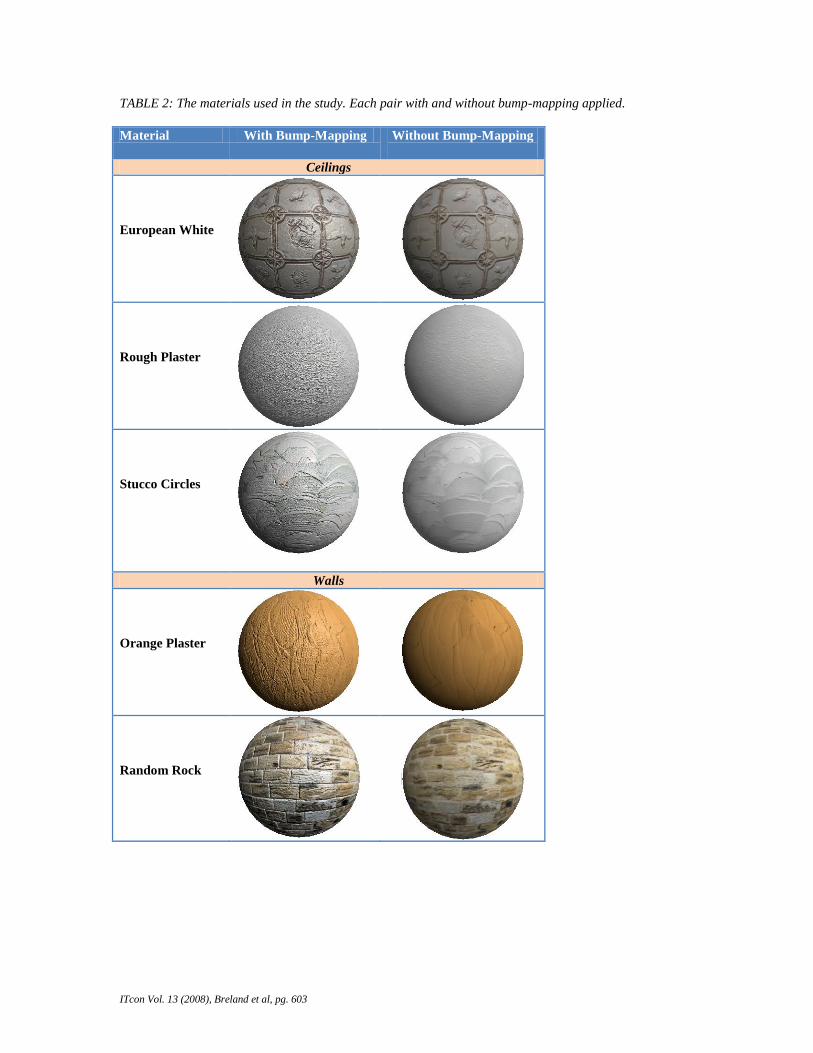
Using the panels, the materials for the floors, walls and ceilings can be changed. There were six materials
available for the floors, walls and ceilings. Materials were grouped in an identical pairs with the exception
of bump-mapping. This allowed the subject to easily compare bump-mapped material with the non-bump-
mapped material. Materials used for the master bedroom were identical to the materials in the living room.
Nine pairs (or eighteen materials in total) were used in the study (Table 2). The materials‟ names are as
follows: European White, Rough Plaster, Stucco Circles, Orange Plaster, Random Rock, Elegant
Wallpaper, Diamond Brick, Flower Parquet and Pink Marble.
ITcon Vol. 13 (2008), Breland et al, pg. 603
TABLE 2: The materials used in the study. Each pair with and without bump-mapping applied.
Material With Bump-Mapping Without Bump-Mapping
Ceilings
European White
Rough Plaster
Stucco Circles
Walls
Orange Plaster
Random Rock

ITcon Vol. 13 (2008), Breland et al, pg. 604
Elegant
Wallpaper
Floors
Diamond Brick
Flower Parquet
Pink Marble
In the living room, subjects were first asked to select an appropriate number of lights and lighting intensity.
After they made their selections, they were asked to rate each material on a Likert-scale consisting of five
possible options: Not Realistic, Slightly Realistic, Realistic, Very Realistic, and Life-Like. Once they rated
all the eighteen materials, they were asked to select and record the best possible combination of material
and lighting condition for the living room. The entire process was repeated for the master bedroom.
Table 3 shows some examples of the different levels of lighting intensity applied to a bump-mapped and
non-bump-mapped of the Stucco Circles material.

ITcon Vol. 13 (2008), Breland et al, pg. 605
TABLE 3: Examples of the different levels of lighting intensity applied to a bump-mapped and non-bump-
mapped of the Stucco Circles material.
Lighting Intensity
(%)
Bump-Mapped Non-Bump-Mapped
Off
25
50
75
100
125
150
ITcon Vol. 13 (2008), Breland et al, pg. 606
It is shown in Table 3 that as the lighting intensity increases, the details can be seen more clearly for the
bump-mapped materials as opposed to the non-bump-mapped. The non-bump-mapped shows almost no
improvement in showing the details of the respective material.
The general questions section consisted of a few YES or NO, and open-ended questions. Subjects were
asked if they saw any noticeable differences with the different combinations of material and lighting
intensity. This was then followed up questions asking them to explain what they saw. Finally they were
asked if they thought this tool would be useful in learning about materials and lighting condition, and then
concluded with a short section for any additional comments or thoughts.
5. DATA ANALYSIS
The data strongly supports our hypothesis that bump-mapped materials in combination with proper lighting
condition can significantly increase how realistic subjects perceive an object or material in the VE, on
average 0.738 steps on the 5-step Likert scale used. In addition, we found that this was significantly higher
for males at 0.819, and lower for females at 0.669. This also proven true for subjects who is used to playing
video or computer games as opposed to those who never played one, but the correlation was much weaker
with 0.751 and 0.713 respectively. The rest of the demographics data did not affect the study significantly.
The demographic distribution of the subjects is summarized in Table 4.
TABLE 4: Subjects‟ demographic information.
Sub-
Total
Sub-
Total
Sub-
Total
Gender Male 16 Female 19
Age group 19-22 21 23-26 7 27+ 7
Education level Freshman or
Sophomore
6 Junior or
Senior
28 Graduate 1
Major ACT 21 BCT 6 Interior
Design
7
# of years using
computer
0-5 6 6-10 23 11+ 6
Play video or
computer game
Yes 23 No 12
We also found that overused or the inappropriate used of bump-mapping on certain types of materials can
decrease the realism rating for that particular material. In the study, this was evident for the Elegant
Wallpaper material (refer to Table 2). The increase in realism from the bump-mapped materials appears to
have a direct link to the lighting condition of a particular space in the VE. As a result, all changes in rating
the realism between bump-mapped and non-bump-mapped materials have been organized based on the
number of lights present and the intensity of the lights.
5.1 Lighting
To properly light each room and make the materials as realistic as possible, we found that each room
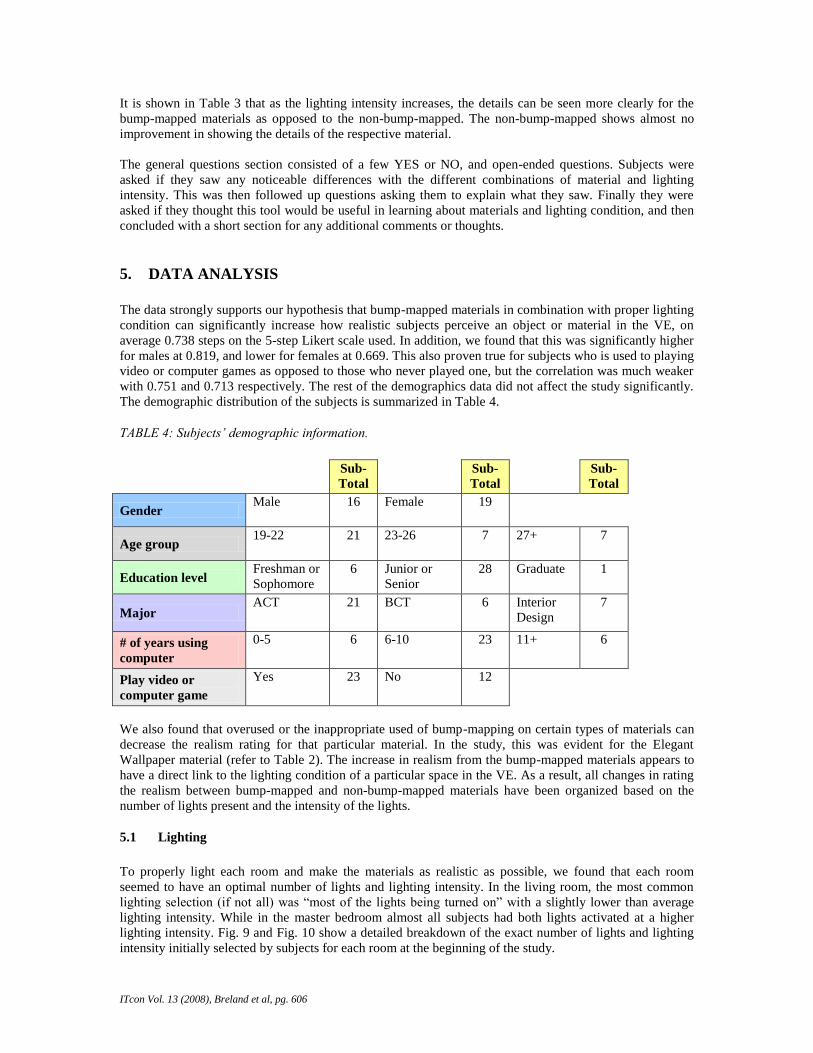
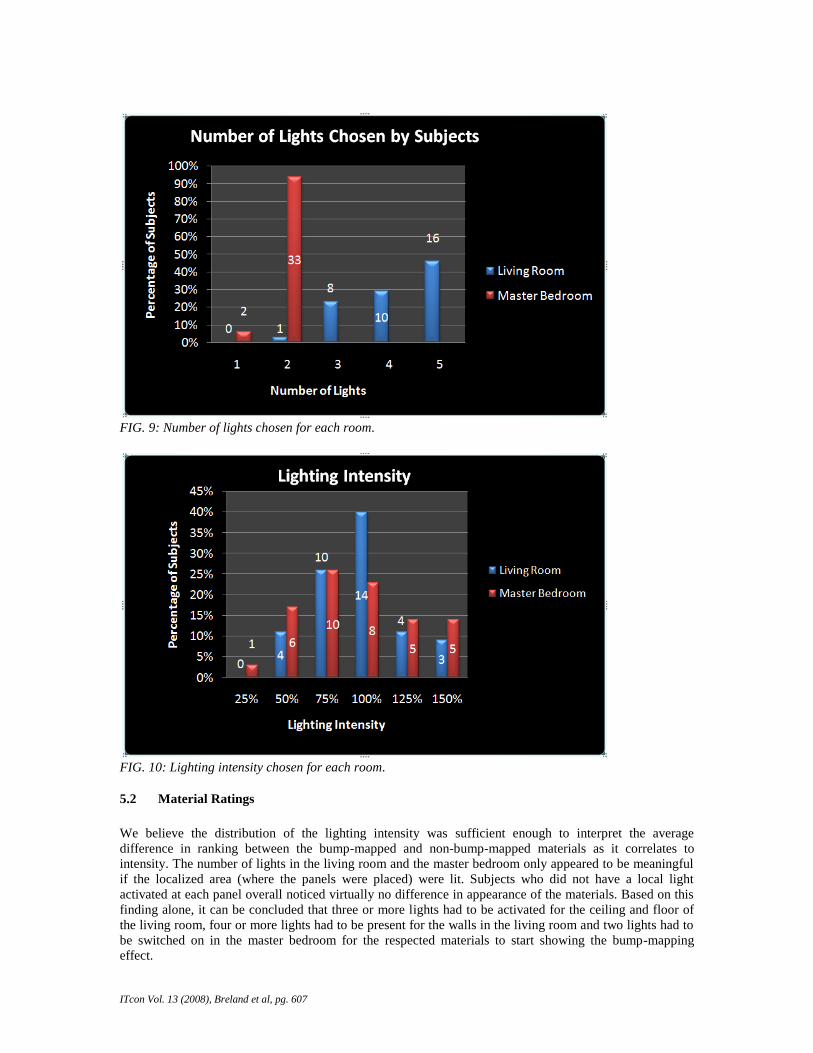
seemed to have an optimal number of lights and lighting intensity. In the living room, the most common
lighting selection (if not all) was “most of the lights being turned on” with a slightly lower than average
lighting intensity. While in the master bedroom almost all subjects had both lights activated at a higher
lighting intensity. Fig. 9 and Fig. 10 show a detailed breakdown of the exact number of lights and lighting
intensity initially selected by subjects for each room at the beginning of the study.
ITcon Vol. 13 (2008), Breland et al, pg. 607
FIG. 9: Number of lights chosen for each room.
FIG. 10: Lighting intensity chosen for each room.
5.2 Material Ratings
We believe the distribution of the lighting intensity was sufficient enough to interpret the average
difference in ranking between the bump-mapped and non-bump-mapped materials as it correlates to
intensity. The number of lights in the living room and the master bedroom only appeared to be meaningful
if the localized area (where the panels were placed) were lit. Subjects who did not have a local light
activated at each panel overall noticed virtually no difference in appearance of the materials. Based on this
finding alone, it can be concluded that three or more lights had to be activated for the ceiling and floor of
the living room, four or more lights had to be present for the walls in the living room and two lights had to
be switched on in the master bedroom for the respected materials to start showing the bump-mapping
effect.
ITcon Vol. 13 (2008), Breland et al, pg. 608
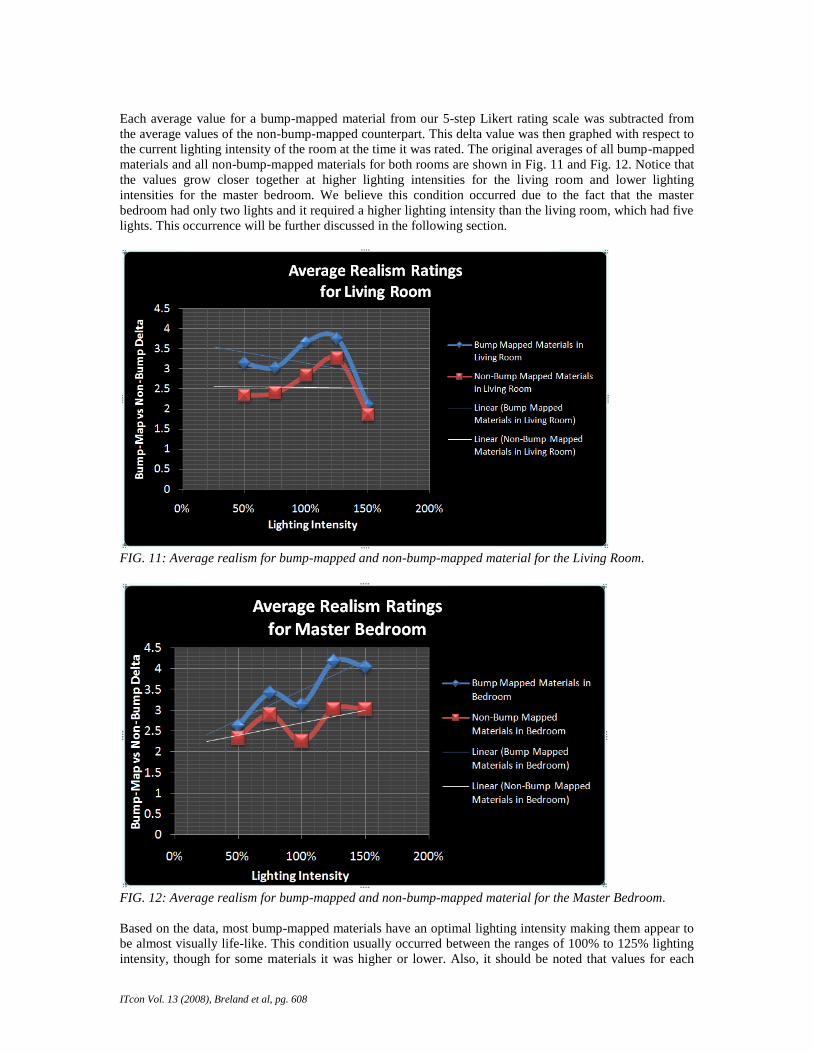
Each average value for a bump-mapped material from our 5-step Likert rating scale was subtracted from
the average values of the non-bump-mapped counterpart. This delta value was then graphed with respect to
the current lighting intensity of the room at the time it was rated. The original averages of all bump-mapped
materials and all non-bump-mapped materials for both rooms are shown in Fig. 11 and Fig. 12. Notice that
the values grow closer together at higher lighting intensities for the living room and lower lighting
intensities for the master bedroom. We believe this condition occurred due to the fact that the master
bedroom had only two lights and it required a higher lighting intensity than the living room, which had five
lights. This occurrence will be further discussed in the following section.
FIG. 11: Average realism for bump-mapped and non-bump-mapped material for the Living Room.
FIG. 12: Average realism for bump-mapped and non-bump-mapped material for the Master Bedroom.
Based on the data, most bump-mapped materials have an optimal lighting intensity making them appear to
be almost visually life-like. This condition usually occurred between the ranges of 100% to 125% lighting
intensity, though for some materials it was higher or lower. Also, it should be noted that values for each
ITcon Vol. 13 (2008), Breland et al, pg. 609
material at a full 150% lighting intensity were often very high or low. In addition to each material‟s unique
property, the low number of subjects who selected 150% for the lighting intensity could also caused this
condition.
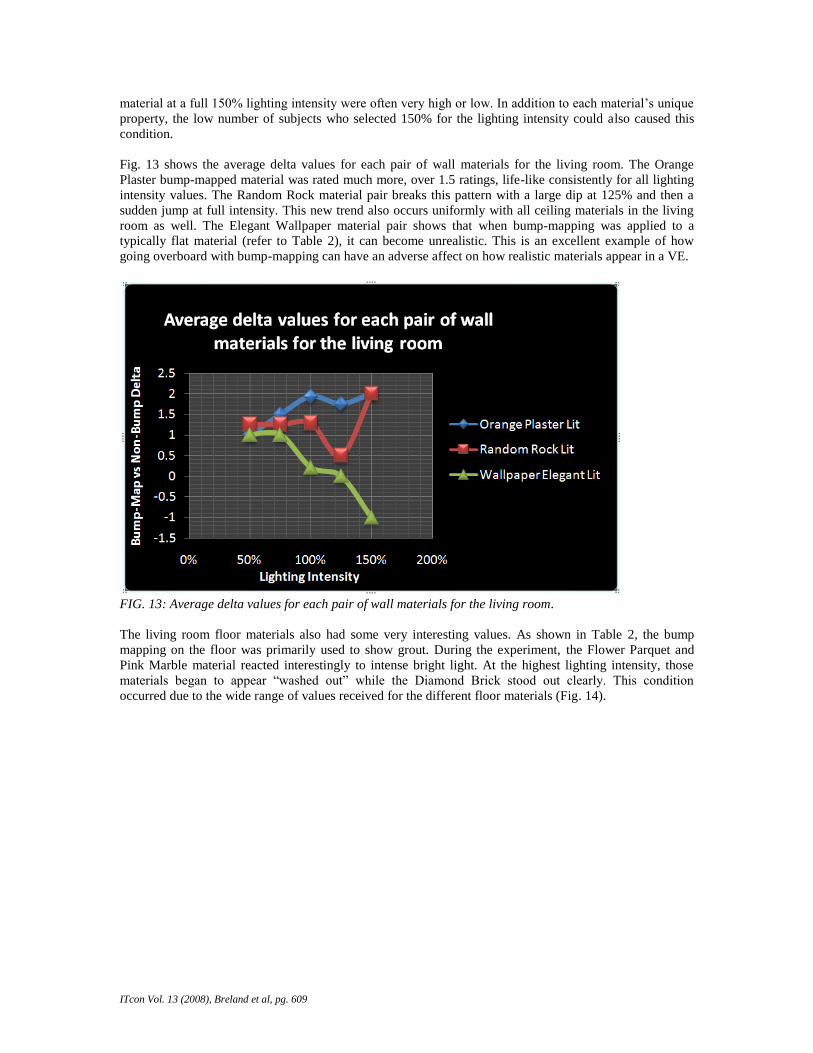
Fig. 13 shows the average delta values for each pair of wall materials for the living room. The Orange
Plaster bump-mapped material was rated much more, over 1.5 ratings, life-like consistently for all lighting
intensity values. The Random Rock material pair breaks this pattern with a large dip at 125% and then a
sudden jump at full intensity. This new trend also occurs uniformly with all ceiling materials in the living
room as well. The Elegant Wallpaper material pair shows that when bump-mapping was applied to a
typically flat material (refer to Table 2), it can become unrealistic. This is an excellent example of how
going overboard with bump-mapping can have an adverse affect on how realistic materials appear in a VE.
FIG. 13: Average delta values for each pair of wall materials for the living room.
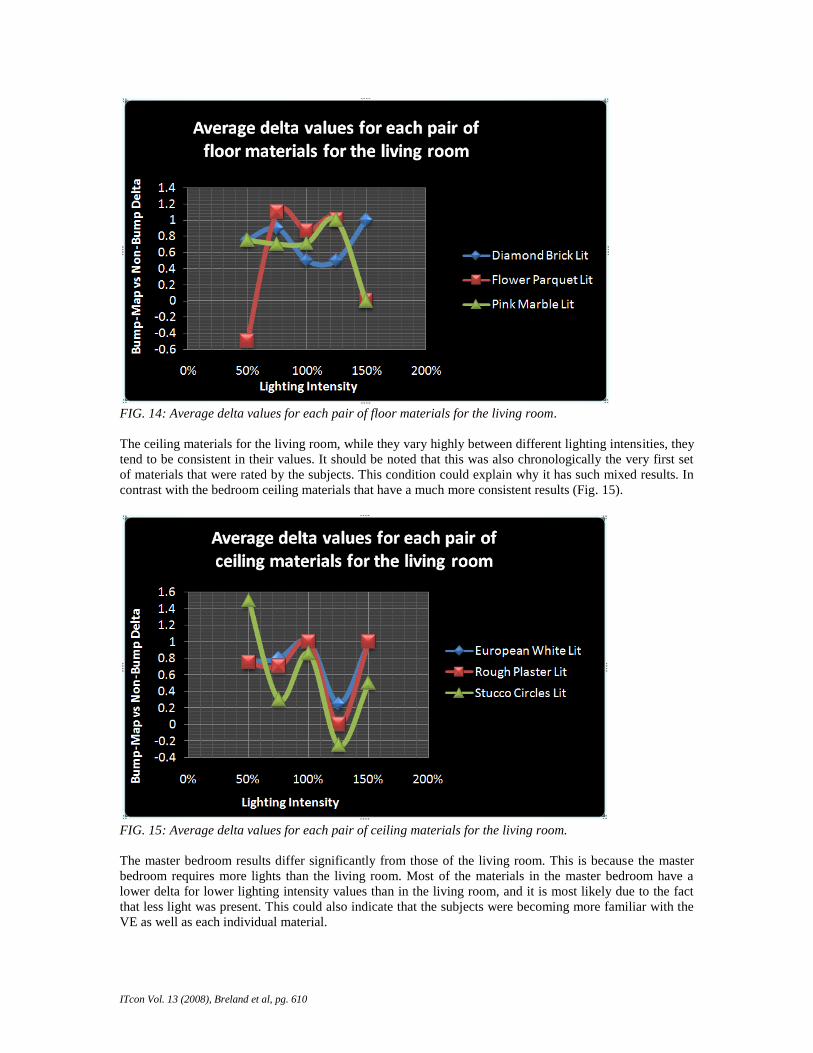
The living room floor materials also had some very interesting values. As shown in Table 2, the bump
mapping on the floor was primarily used to show grout. During the experiment, the Flower Parquet and
Pink Marble material reacted interestingly to intense bright light. At the highest lighting intensity, those
materials began to appear “washed out” while the Diamond Brick stood out clearly. This condition
occurred due to the wide range of values received for the different floor materials (Fig. 14).
ITcon Vol. 13 (2008), Breland et al, pg. 610
FIG. 14: Average delta values for each pair of floor materials for the living room.
The ceiling materials for the living room, while they vary highly between different lighting intensities, they
tend to be consistent in their values. It should be noted that this was also chronologically the very first set
of materials that were rated by the subjects. This condition could explain why it has such mixed results. In
contrast with the bedroom ceiling materials that have a much more consistent results (Fig. 15).
FIG. 15: Average delta values for each pair of ceiling materials for the living room.
The master bedroom results differ significantly from those of the living room. This is because the master
bedroom requires more lights than the living room. Most of the materials in the master bedroom have a
lower delta for lower lighting intensity values than in the living room, and it is most likely due to the fact
that less light was present. This could also indicate that the subjects were becoming more familiar with the
VE as well as each individual material.
ITcon Vol. 13 (2008), Breland et al, pg. 611
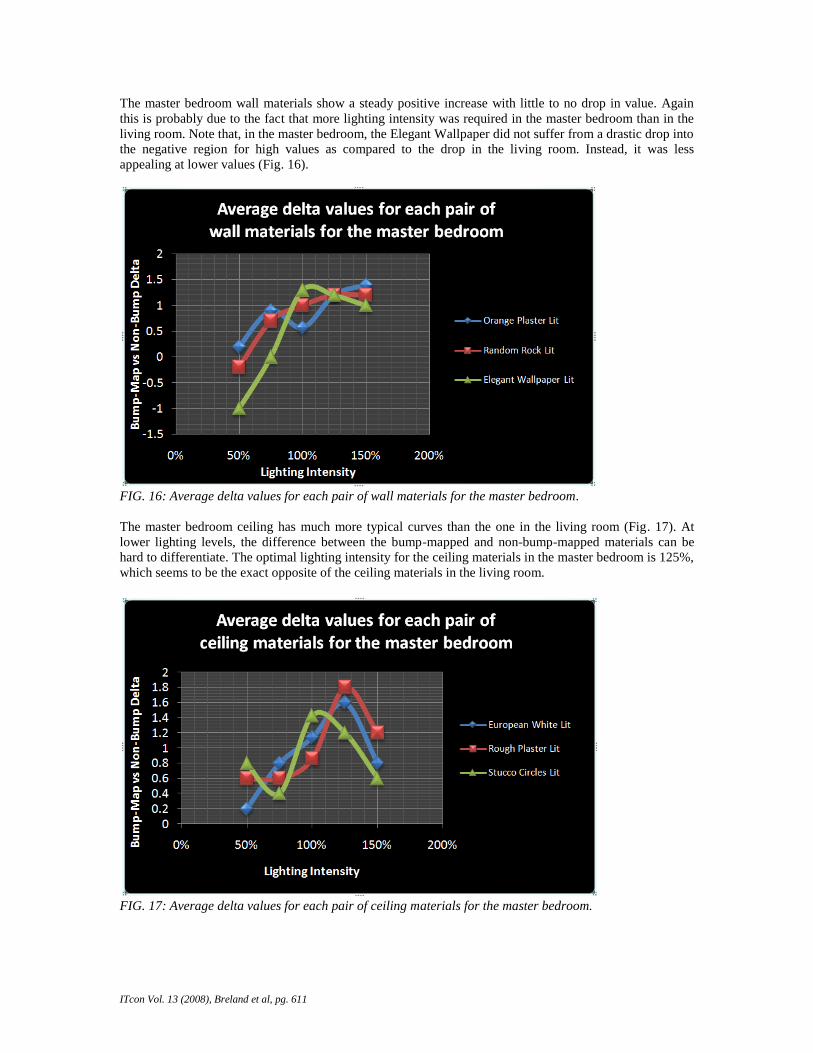
The master bedroom wall materials show a steady positive increase with little to no drop in value. Again
this is probably due to the fact that more lighting intensity was required in the master bedroom than in the
living room. Note that, in the master bedroom, the Elegant Wallpaper did not suffer from a drastic drop into
the negative region for high values as compared to the drop in the living room. Instead, it was less
appealing at lower values (Fig. 16).
FIG. 16: Average delta values for each pair of wall materials for the master bedroom.
The master bedroom ceiling has much more typical curves than the one in the living room (Fig. 17). At
lower lighting levels, the difference between the bump-mapped and non-bump-mapped materials can be
hard to differentiate. The optimal lighting intensity for the ceiling materials in the master bedroom is 125%,
which seems to be the exact opposite of the ceiling materials in the living room.
FIG. 17: Average delta values for each pair of ceiling materials for the master bedroom.
ITcon Vol. 13 (2008), Breland et al, pg. 612
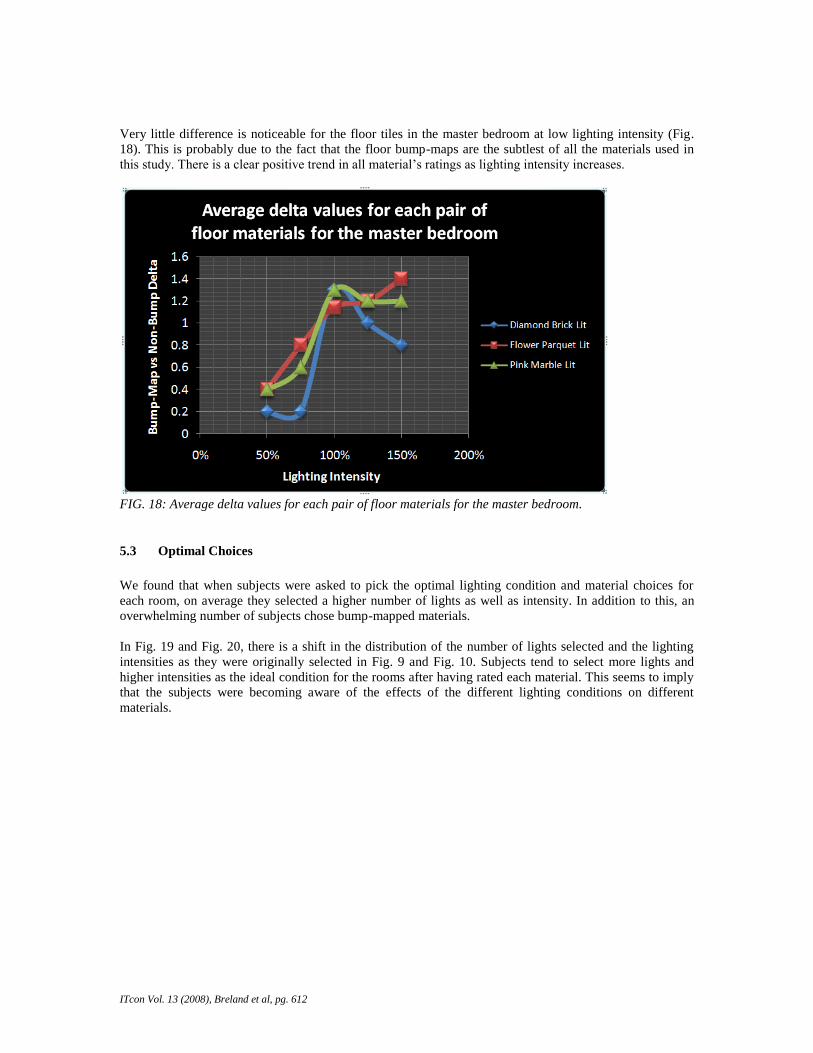
Very little difference is noticeable for the floor tiles in the master bedroom at low lighting intensity (Fig.
18). This is probably due to the fact that the floor bump-maps are the subtlest of all the materials used in
this study. There is a clear positive trend in all material‟s ratings as lighting intensity increases.
FIG. 18: Average delta values for each pair of floor materials for the master bedroom.
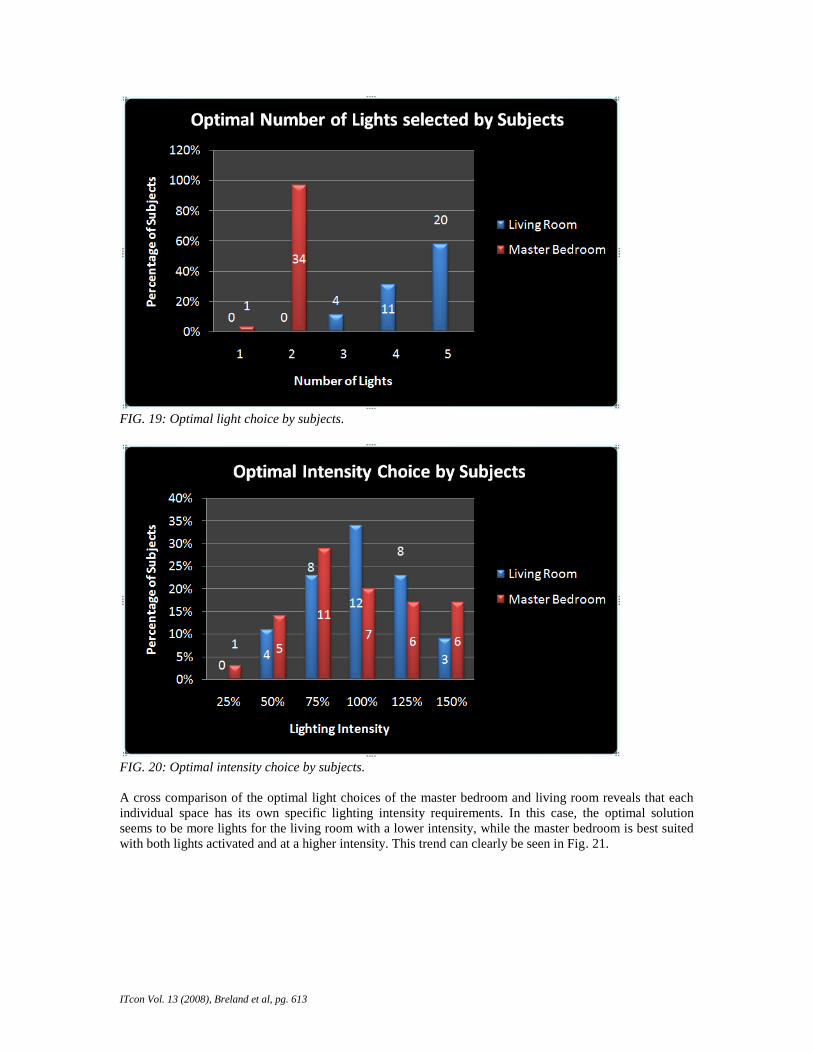
5.3 Optimal Choices
We found that when subjects were asked to pick the optimal lighting condition and material choices for
each room, on average they selected a higher number of lights as well as intensity. In addition to this, an
overwhelming number of subjects chose bump-mapped materials.
In Fig. 19 and Fig. 20, there is a shift in the distribution of the number of lights selected and the lighting
intensities as they were originally selected in Fig. 9 and Fig. 10. Subjects tend to select more lights and
higher intensities as the ideal condition for the rooms after having rated each material. This seems to imply
that the subjects were becoming aware of the effects of the different lighting conditions on different
materials.
ITcon Vol. 13 (2008), Breland et al, pg. 613
FIG. 19: Optimal light choice by subjects.
FIG. 20: Optimal intensity choice by subjects.
A cross comparison of the optimal light choices of the master bedroom and living room reveals that each
individual space has its own specific lighting intensity requirements. In this case, the optimal solution
seems to be more lights for the living room with a lower intensity, while the master bedroom is best suited
with both lights activated and at a higher intensity. This trend can clearly be seen in Fig. 21.

ITcon Vol. 13 (2008), Breland et al, pg. 614
FIG. 21: Optimal intensity comparison for living room and master bedroom.
In this study, one of the most dramatic results was the subject‟s choice of the optimal materials. There was
a strong tendency for subjects to pick the bump-mapped materials over the non-bump mapped materials in
both rooms and for all three surfaces. The most dramatic difference occurs with the floor materials, which
is interesting because of all the bump-mapped materials used, the floor materials were the subtlest (refer to
Table 2). The overall optimal material selections put forth by the subjects are shown in Fig. 22.
FIG. 22: Optimal material choice by subjects.
5.4 Overall Conclusions
Based on all the materials in both rooms, we derived an average delta value for each material by comparing
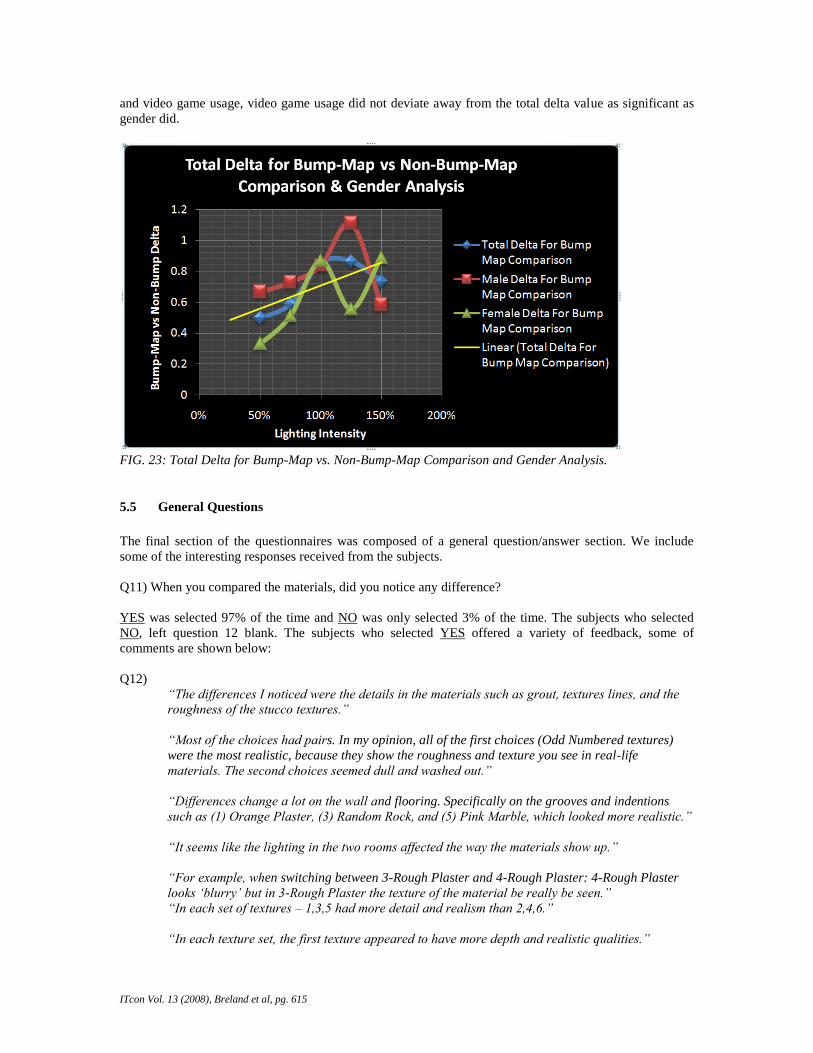
bump-mapped to its non-bump-mapped counterpart at each lighting intensity rating (Fig. 23). It shows that
all bump-mapped materials have a significant positive correlation in realism rating over the non-bump-
mapped materials, which peaks from 100% to 125% lighting intensity. Furthermore, we repeated this
process twice, and using only female and male data. While there was a strong correlation between males
ITcon Vol. 13 (2008), Breland et al, pg. 615
and video game usage, video game usage did not deviate away from the total delta value as significant as
gender did.
FIG. 23: Total Delta for Bump-Map vs. Non-Bump-Map Comparison and Gender Analysis.
5.5 General Questions
The final section of the questionnaires was composed of a general question/answer section. We include
some of the interesting responses received from the subjects.
Q11) When you compared the materials, did you notice any difference?
YES was selected 97% of the time and NO was only selected 3% of the time. The subjects who selected
NO, left question 12 blank. The subjects who selected YES offered a variety of feedback, some of
comments are shown below:
Q12)
“The differences I noticed were the details in the materials such as grout, textures lines, and the
roughness of the stucco textures.”
“Most of the choices had pairs. In my opinion, all of the first choices (Odd Numbered textures)
were the most realistic, because they show the roughness and texture you see in real-life
materials. The second choices seemed dull and washed out.”
“Differences change a lot on the wall and flooring. Specifically on the grooves and indentions
such as (1) Orange Plaster, (3) Random Rock, and (5) Pink Marble, which looked more realistic.”
“It seems like the lighting in the two rooms affected the way the materials show up.”
“For example, when switching between 3-Rough Plaster and 4-Rough Plaster: 4-Rough Plaster
looks „blurry‟ but in 3-Rough Plaster the texture of the material be really be seen.”
“In each set of textures – 1,3,5 had more detail and realism than 2,4,6.”
“In each texture set, the first texture appeared to have more depth and realistic qualities.”
ITcon Vol. 13 (2008), Breland et al, pg. 616
“In the master bedroom the orange stucco looks more realistic with 1-Diamond Brick and the
stucco ceiling than other combinations.”
“In most cases the second material showed less detail – blurred, while the 1st material showed
more depth and detail.”
“I could see the bumps and dips in some of the surfaces of the textures.”
“1-Orange Plaster is more detailed than 2-Orange Plaster. 3-Random Rock is more realistic than
4-Random Rock. 5-Elegant Wallpaper is brighter and more detailed than 6-Elegant Wallpaper.”
“I noticed the more realistic materials with the correct balance of light. Too little light made the
material look flat while too much light created too much contrast.”
“Materials 1,3, and 5 for the floor, walls, and ceiling look more realistic mainly when hit w/
intense light.”
“Some materials had more depth, therefore being more detailed. This was very noticeable in the
orange plaster texture.”
Q13) When you switched on/off different number of lights, do you see any difference in the space being
illuminated.
YES was selected 97% of the time and NO was only selected 3% of the time. The subjects who selected
NO, left question 14 blank. The subjects who selected YES offered a variety of feedback, some of
comments are shown below:
Q14)
“The more lights that are on the better the shadows and reflections of the (textures) are.”
“Because the bedroom was smaller, the lights seem brighter even though they were at the same
intensity.”
“With less light the space looked small but with lots of lights shining, the size of the space was
more noticeable.”
“I noticed that in different light settings that the different (texture) options look different
according to the number and percentage of light values used.”
“In the living room, there is not much or any difference between four lights or five, but there is an
obvious difference between 1 and 5.”
“Where there was not lighting, details were harder to see. The more the light, the better the
detail….Too much light and things started to look fake.”
“The light simply increased, causing the colors and contrast of the materials to increase to the
point of discomfort.”
Q15) When you change the lighting intensity, do you see any differences in the space being illuminated?
YES was selected 97% of the time and NO was only selected 3% of the time. The subjects who selected
No, left question 16 blank. *It should be noted that Q16 was the least responded question possibly because
of its similarity to Q14. The subjects who selected YES offered a variety of feedback, some of the
comments are shown below:
Q16)
“Yes, the materials looked much better in the room when the lighting intensity was increased.”
ITcon Vol. 13 (2008), Breland et al, pg. 617
“If you used too much light it faded to detail (of the textures).”
“At 150% lighting intensity the lighting looks blinding.”
“Too strong a light and things started to look fake and unrealistic.”
Q17) How do you see this type of tool being used in the real-world? Which profession?
“Would be great for interior designers and architects, mainly for walkthroughs to show clients.”
“Interior Design would most likely use this tool and architecture also. Great way to get an overall
feel of a building layout and design.”
“I was very impressed, great tool for helping home builders layout (housing) specs.”
“This tool could play a big factor in the world of design. Especially, interior design because it
dealt with mostly the interior of the house.”
“With further development, this could be used in any field of design.”
“In think this is amazing, it can be applied in architecture, int. design, construction, or interior
decorating. I really like it!”
“Architectural firms could benefit from use of this tool to show client presentations along with the
ability to build and construct a design without having to actually construct something.”
Q18) Do you think this tool can be used to assist you in applying the concepts of material, lightings, and
space?
YES was selected 97% of the time and NO was only selected 3% of the time.
Q19) Any other comments or thoughts?
“I like being able to stay on the same screen when changing materials – instead of going into 3 or
4 different menus to find the materials. This way, it is more convenient to try out all the possibly
materials combinations!”
“Very easy to use and navigate, I like it!”
“I really like it – it would be very helpful for my major (Interior Design) to show clients so that
they can get a true feeling of what their interior would like.”
“This was really cool!”
“I really loved this tool!”
“I liked it, very useful.”
“It can make a huge difference in whether to use certain materials or not just by playing with the
number of lights and intensity.”
“Helps to show what a big difference lighting can make.”

ITcon Vol. 13 (2008), Breland et al, pg. 618
6. CONCLUSIONS AND FUTURE WORK
Based on the results, it is concluded that all bump-mapped materials showed a significant positive
correlation in realism rating over the non-bump mapped materials, which peaked from 100% to 125%
lighting intensity. Furthermore, we repeated this process twice using only female and male data. It should
be noted while there was a strong correlation between males and video game usage; video game usage did
not deviate away from the total delta value as significantly as gender did.
We also discovered that certain types of materials should not be bump-mapped such as the Elegant
Wallpaper material. This is because wallpaper is generally considered to be smooth by many. In this study,
the bump-mapping effect for this type of material caused the material itself to look less life-like after
applying a 50% of lighting intensity. We can also conclude that certain material should be bump-mapped to
realistically match its real-world counterpart.
One of our more interesting conclusions for this study as a whole was the subject‟s choice of optimal
materials. There was a strong tendency for subjects to pick the bump-mapped materials over the non-bump
mapped materials in both rooms and for all three surfaces. It is safe to conclude that subjects did see a
difference between the bump-mapped and non-bump mapped materials and preferred the more realistic
materials that were bump-mapped. It can also be concluded that lighting intensity has a dramatic effect on
how a material can be viewed. The realism of most bump-mapped materials reached their peak at 100%
lighting intensity, while some (such as the Elegant Wallpaper) actually looked more life-like at a lower
lighting intensity i.e. between 50% to 75%.
The overall conclusion that can be drawn from this study is that, even in a VE, lighting plays an important
role and is the catalyst for what makes objects‟ surfaces seem real or not. With the correct balance of
lighting conditions and material mapping techniques, it is possible to simulate life-like material surfaces in
a VE. Based on the results gathered from this study, subjects can identify and prefer the more visually
realistic materials over the non-realistic ones. The findings of this study suggest that should 3D
architectural visualization be done in a real-time VE, scholars and professionals should pay close attention
to detail, realism and the visual aspects of the finished design.
In this study, the use of the C4Engine 3D Game Engine also signifies that the advance computer graphics
features exist within the engine, and in many other next-generation game engines can assist the
development of a more believable and realistic architectural and construction oriented real-time VE. We
believe current 3D visualization and the VE aspects available and being utilized in the AEC industry needs
to move forward and away from the „playdoh‟-like unrealistic representation. A VE that is so believable
and realistic allows the end user to instantly recognize 3D virtual objects without doubt and too much
interaction.
We plan to further this study with the inclusion of other material mapping techniques such as Gloss-
Mapping, Specular-Mapping, Parallax-Mapping and Ambient Occlusion. As time moves on, BuildITC4
will be improved so that one day it can be used in the AEC industry.
7. AKNOWLEDGEMENTS
The authors would sincerely like to especially thank Mr. Eric Lengyel and Mr. David Vasquez, and all the
C4Engine‟s online community for their ongoing support and assistance throughout.
8. REFERENCES
3D Engines Database (2007). The Most Reviewed Commercial Engines. Retrieved July 24, 2008 from
http://www.devmaster.net/engines/
Blinn, J.F. (1978, August). Simulation of Wrinkled Surfaces. Proceedings of the Computer Graphics
(SIGGRAPH 78), 12 (3), 286-292.
ITcon Vol. 13 (2008), Breland et al, pg. 619
Blinn, J.F., & Newell, M.E. (1976, October). Texture and reflection in computer generated images.
Communications of the ACM, 19 (10), 542-547.
Catmull, E.A. (1974, December). A subdivision algorithm for computer display of curved surfaces. PhD
thesis, University of Utah.
Cook, R.L. (1984, July). Shade Trees. Computer Graphics. Proceedings of SIGGRAPH 84, 18 (3), 223-
231.
De Leon, V. (1999, April 29). VRND: Notre-Dame Cathedral: A globally accessible multi-user real-time
virtual reconstruction. Retrieved March 22, 2008 from
http://www.virtualheritage.net/document_library/Cultural%20Heritage/35.htm
Heckbert, P. (1986, November). Survey of texture mapping. IEEE Computer Graphics and Applications,
56–67.
HKS Inc (2008). HKS Licenses Unreal Engine 3 for Groundbreaking Architectural Applications. Retrieved
July 28, 2008 from http://www.hksinc.com/news/2007_10_HKS_Licenses_Unreal.htm.
Khronos Group (2007). Collada - 3D Asset Exchange Schema. Retrieved July 24, 2008 from
http://www.khronos.org/collada/
Kitchens, K., & and Shiratuddin, M.F. (2007, October). Interactive Home Design in a Virtual Environment
, Proceedings of 7th International Conference on Construction Applications of Virtual Reality
CONVR 2007.
Lengyel, E. (2007). C4Engine: Terathon Software. Retrieved July 24, 2008 from
http://www.terathon.com/c4engine/
Miller, G.S., & Hoffman, C.R. (1984, July). Illumination and reflection maps: simulated objects in
simulated and real environments. SIGGRAPH 84: Advanced Computer Graphics Animation
Seminar Notes.
Moloney, J., Amor, R., Furness, J., & Moores, B. (2003, April). Design Critique Inside a Multi-Player
Game Engine, Proceedings of the CIB W78 Conference on IT in Construction, 255-262.
O'Coill, C.Carl A. and& Doughty, M (2005). Computer Game Technology, Collaborative Software
Environments and Participatory Design. Lincoln School of Architecture, University of Lincoln,
UK.
Shiratuddin, M. and Thabet, W. (2002), 'Virtual Office Walkthrough Using a 3D Game Engine',
International Journal of Design Computing, Vol. 4, pp. 1329-7147
Shiratuddin, M.F. & Fletcher, D. (2007). Utilizing 3D Games Development Tool for Architectural Design
in a Virtual Environment, Proceedings of 7th International Conference on Construction
Applications of Virtual Reality CONVR 2007.
Trost, J. & Choudhury, Ifte. (2004). Design of Mechanical and Electrical Systems in Buildings. Prentice
Hall.
Wrobel, K. (2008, April 25). Realistic Lighting of Architectural Projects Based on IBL Method. Central
European Seminar on Computer Graphics. Retrieved July 24 2008, from
http://www.cescg.org/CESCG-2008/papers/Szczecin-Wrobel-Krzysztof.pdf
Copyright © 2022 FDOKUMEN

