


Bahasa
Halaman
Hukum


BioMed CentralMolecular Cancer
ss
Open AcceResearchA cluster of genes located in 1p36 are down-regulated in neuroblastomas with poor prognosis, but not due to CpG island methylationHelena Carén1, Katarina Ejeskär1, Susanne Fransson1, Luke Hesson2, Farida Latif2, Rose-Marie Sjöberg1, Cecilia Krona1 and Tommy Martinsson*1Address: 1Department of Clinical Genetics, Institute for the Health of Women and Children, Göteborg University, Sahlgrenska Univ. Hospital-East, SE-41685 Gothenburg, Sweden and 2Section of Medical and Molecular Genetics, Department of Paediatrics and Child Health, University of Birmingham, The Medical School, Edgbaston, Birmingham B15 2TT, UK
Email: Helena Carén - [email protected]; Katarina Ejeskär - [email protected]; Susanne Fransson - [email protected]; Luke Hesson - [email protected]; Farida Latif - [email protected]; Rose-Marie Sjöberg - [email protected]; Cecilia Krona - [email protected]; Tommy Martinsson* - [email protected]
* Corresponding author
AbstractBackground: A common feature of neuroblastoma tumours are partial deletions of the short armof chromosome 1 (1p-deletions). This is indicative of a neuroblastoma tumour suppressor genebeing located in the region. Several groups including our have been studying candidateneuroblastoma genes in the region, but no gene/genes have yet been found that fulfil the criteriafor being a neuroblastoma tumour suppressor. Since frequent mutations have not been detected,we have now analyzed the expression and promoter CpG island methylation status of the genesUBE4B, KIF1B, PGD, APITD1, DFFA and PEX14 in the 1p36.22 region in order to find an explanationfor a possible down-regulation of this region.
Results: The current study shows that gene transcripts in high stage neuroblastoma tumours aresignificantly down-regulated compared to those in low stage tumours in the 1p36.22 region. CpGisland methylation does not seem to be the mechanism of down-regulation for most of the genestested, since no methylation was detected in the fragments analyzed. One exception is the CpGisland of APITD1. Methylation of this gene is also seen in blood from control individuals and istherefore not believed to participate in tumour development.
Conclusion: The genes UBE4B, KIF1B, PGD, APITD1, DFFA and PEX14 are down-regulated in highstage NB tumours, a feature that can not be explained by CpG island methylation.
BackgroundNeuroblastoma (NB) is the most common paediatricsolid tumour, responsible for 15% of cancer deaths ofchildhood. It is a tumour of the postganglionic sympa-
thetic nervous system that develops from immature ordedifferentiated neural crest-derived cells [1]. The distalpart of chromosome 1p shows loss of heterozygosity(LOH) in 20–40% of NB tumours and has therefore been
Published: 01 March 2005
Molecular Cancer 2005, 4:10 doi:10.1186/1476-4598-4-10
Received: 01 December 2004Accepted: 01 March 2005
This article is available from: http://www.molecular-cancer.com/content/4/1/10
© 2005 Carén et al; licensee BioMed Central Ltd. This is an Open Access article distributed under the terms of the Creative Commons Attribution License (http://creativecommons.org/licenses/by/2.0), which permits unrestricted use, distribution, and reproduction in any medium, provided the original work is properly cited.
Page 1 of 9(page number not for citation purposes)

Molecular Cancer 2005, 4:10 http://www.molecular-cancer.com/content/4/1/10
alleged to contain one or more tumour suppressor genes.We and others have previously analyzed the chromo-somal region 1p36.2-3 [2-12] and we have recentlyfocused on the gene region involving the genes: UBE4B-KIF1B-PGD-APITD1-CORT-DFFA-PEX14. These geneshave been analyzed for mutations and a few have beenfound in rare tumours [13-17].
In search of tumour suppressor genes, the focus has in thelast years moved towards epigenetics and methylation ofpromoter regions. Methylation of cytosines in CpG-dinu-cleotides is a common modification in mammaliangenomes. Methylated cytosines are more susceptible todeamination, which have lead to an erosion of thenumber of CpG-dinucleotides. The vast majority of CpGsresides within repetitive elements and is methylated.There are also stretches of DNA rich in CpG that are geneassociated, i.e. CpG islands, which are normally unmeth-ylated [18]. Methylation is generally associated withrepression of transcription. Gene regulation by methyla-tion includes tissue-specific regulation during develop-ment and processes as X-chromosome inactivation andgenomic imprinting, reviewed by Herman and co-work-ers. [19]. Cancer is associated with a genome-widehypomethylation and a more gene-specific hypermethyl-ation. Hypermethylation of CpG islands has been shownto be a common mechanism for the inactivation oftumour suppressor genes and is found in a wide range oftumour types [20-23]. According to the Knudson two-hithypothesis, two successive mutations are required to inac-tivate a tumour suppressor gene and turn a normal cellinto a malignant one. Inactivation could be due to dele-tions or mutations. Epigenetic events, such as hypermeth-ylation of promoter-associated CpG islands have come infocus during the last decade as a route to inactivation [19].
The most common way to analyze methylation status isbased on bisulphite modification of DNA [24]. In thisreaction, unmethylated cytosines are deaminated touracil, while methylated cytosines remain unconverted.The region of interest can be amplified using non-discrim-inating primers, amplifying both methylated andunmethylated templates in one reaction, or with methyl-ation-specific PCR (MSP) in which methylated andunmethylated templates are amplified in separate reac-tions [25].
Some genes have been analyzed in NB tumours focusingon methylation status. For example, CASP8, on 2q33, wasone of the first genes found to be methylated in neurob-lastoma, with a frequency of about 40 % in primary NBtumours [26]. On 3p21.3, RASSF1A and BLU have beenshown to be frequently methylated [27-29]. In a study byvan Noesel and co-workers, 34 genes in 12 different chro-mosomal regions were analyzed in neuroblastoma cell
lines [30]. A total of six genes that were methylated in atleast three of the 22 cell lines were found. CASP8, asalready known, was one of these genes, also FLIP at 2q33was methylated as well as four genes in the chromosomeregion 8p21; DR4, DR5, DCR1 and DCR2. Genes on 1p36were also included in this study, none of which werefound to be methylated. No genes in the NB tumour sup-pressor candidate region on 1p36.22 were included. Ala-minos and co-workers have in a study screened 45 genesin NB cell lines [31]. 34 genes were found to be methyl-ated in at least one of the ten cell lines. The analysis alsodemonstrated that the percentage of methylated geneswas higher in cell lines with MYCN-amplification than inthose without. UBE4B, located in 1p36.22, was includedin this study and found to be unmethylated.
The genes in the 1p36 consensus deleted region are all,except for CORT, associated with a CpG island in theirrespective promoter regions. The fact that this region isdeleted in a subset of NB tumours and that frequent muta-tions are not found, makes it a possible candidate regionfor hypermethylation of genes. In the current study, wewanted to analyze the expression pattern of these genes inthe 1p36.22 region using TaqMan technology and themethylation status of promoter regions associated withCpG islands, in a panel of NB cell lines and primary NBtumours.
ResultsExpression analysisGUSB was selected as an endogenous control for real-timePCR quantification, and further used as an internal refer-ence for normalization. Real time-PCR studies of all thegenes in the region on cDNA-samples showed a signifi-cant reduction of mRNA levels in high stage NB tumourscompared to low stage tumour mRNA levels, rangingfrom 49% for PEX14 to 79% for APITD1 (Table 4) [16].
The average expression in NB cell lines compared to pri-mary tumours varied between the different genes in theregion. Cell lines showed a higher expression of APITD1and DFFA compared to primary tumours. Lower expres-sion in cell lines was seen in KIF1B and equal levels of celllines and stage 2 primary tumours in UBE4B, PGD andPEX14 (Table 4; Fig. 1). The 1p-deleted cell line SK-N-ASgenerally showed lower expression of the genes in theregion compared to the other NB cell lines tested (Fig. 1).
Methylation analysisThe analyzed fragments of the genes UBE4B, KIF1B, PGD,DFFA and PEX14 were not methylated in the panel of NBprimary tumours and cell lines. For APITD1, the region -393 to -222 relative to initiation codon showed methyla-tion. This region was therefore amplified and cloned witha T/A cloning kit in order to give a value of the percentage
Page 2 of 9(page number not for citation purposes)

Molecular Cancer 2005, 4:10 http://www.molecular-cancer.com/content/4/1/10
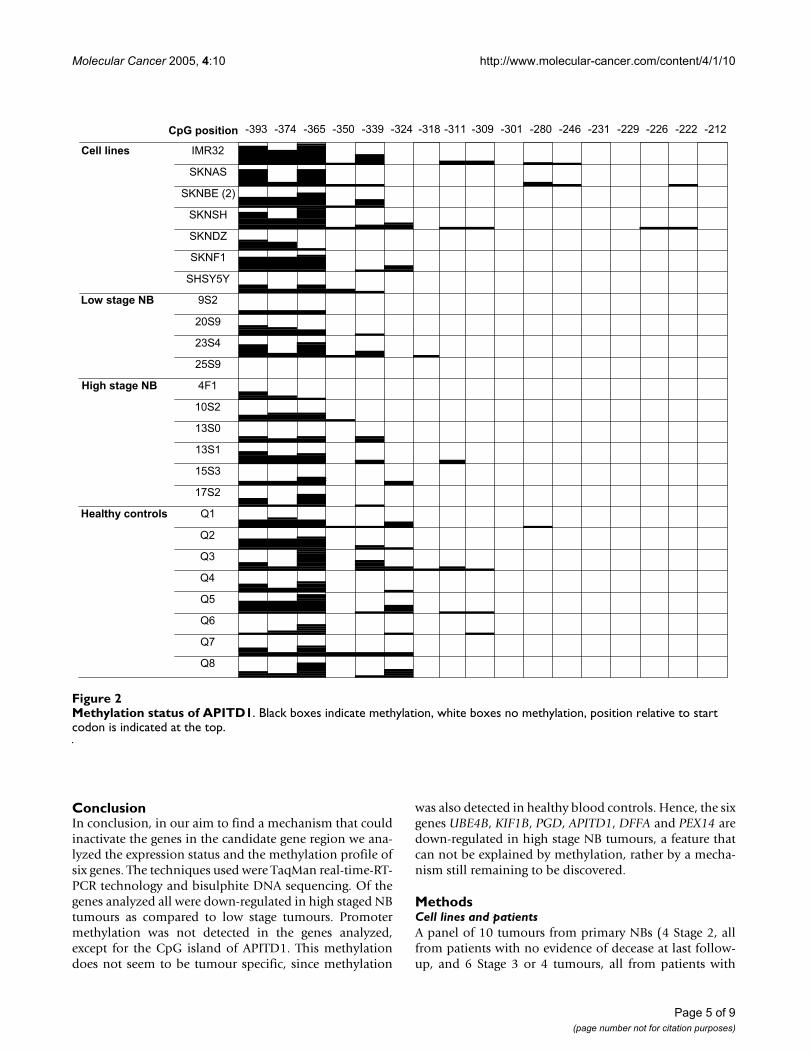
of clones being methylated (Fig. 2). The region contains16 CpG sites and these sites show various degree of meth-ylation, in different clones as well as in different samples.Methylation of cytosine in front of guanine is concen-trated to the beginning of this "methylated region"; thethree first cytosine bases showing the highest degree ofmethylated clones (Fig 3). No methylation was seen up-stream of -393 in the fragments analyzed. At some CpGsites in the region, methylation was never detected. Onlyone sample had no clones with methylation for any of thesites; the stage 2 tumour 20S9. Blood from control indi-viduals also showed various degree of methylation atthese sites. The cell lines did not show methylation down-stream of CpG -212 in the analyzed fragments, clonesfrom tumours were not methylated down-stream of CpG-311. Healthy controls showed a smaller region of meth-ylation, no methylated clones were detected down-streamof CpG -280.
DiscussionDeletion of parts of chromosome 1p is a common featureof neuroblastoma tumours. We have previously narroweddown the shortest region of overlap of deletions (SRO) to25 cM in our tumour material [6,7]. By including a germcell tumour with 1p deletion we could confine the SRO to5 cM [11]. This SRO was further confirmed when a cellline with a homozygous deletion of 500 kb was foundwithin this region [32]. We have previously screened the500 kb region for mutations and only rare have beendetected. The aim of this study was to investigate theexpression of the genes in the region and to correlate thiswith the methylation status. TaqMan expression datashowed a clear down-regulation in gene expression ofgenes in the region tested when comparing high stage NBtumours (stage 3 and 4) and low stage tumours (stage 2).This down-regulation was seen regardless if the high stagetumour was 1p-deleted or not (Fig. 1). This finding furthersupports that this region might be involved in NB devel-opment and progression. We can speculate about somecentral mechanism for the expression of the genes in theentire region that is affected in tumours with poor prog-
nosis, either due to the deletion of one allele and/or bysome other mechanism. An attractive explanation for thiswould be methylation of CpG islands that can lead toinactivation of the respective gene. This does not seem tobe the case though, since none of the genes, APITD1excepted, showed methylation. Furthermore, DNA fromhealthy controls is also methylated in the same region ofthe APITD1 gene, making methylation a less likely expla-nation for the difference in APITD1 gene expressionbetween advanced and favourable primary NB tumours.
CpG methylation is not the only possible explanation forthe down-regulation in gene expression shown in highstage tumours. Analysis of chromatin modifications couldbe the next step in a further analysis of this region, insearch of a mechanism that could lead to down-regulationof the genes. Deficiencies in transcription factors andupstream elements could also account for the decrease ingene transcripts. Another possibility is that the variationsare due to differences in the treatment of the tumoursbefore and after surgery. Radiation and chemotherapycould probably have a vast affect on the expression pat-terns of a substantial amount of genes in the tumour cell.It is however unlikely that all the genes in the analyzedregion would be affected by the treatment alone, ratherthis might explain the differences in the level of down-reg-ulation between different genes.
The difference in expression between NB cell lines and pri-mary NB could be explained by the difference in cell envi-ronment between cells in culture and in vivo. In primarytumours, there are always some non-NB cells in the RNApreparations that might affect the gene expression results.On the other hand, genetic events happen to the cellswhen they get immortalized in cell culture, some genestend to be down-regulated and others up-regulated. Wecan also speculate that some of these genes, for exampleAPITD1, might even be so crucial that only cells withexpression of this gene are capable of surviving in culture.
Table 4: Average relative gene expression (gene/GUSB).
Gene Average relative expression in NB cell lines
Average relative expression in low stage NB
Average relative expression in high stage NB
% less expression in high stage NB compared to low stage NB
UBE4B 1.1 1.2 0.33 73%KIF1B 0.51 3.6 0.99 72%PGD 0.95 1.1 0.38 65%APITD1 1.3 0.35 0.075 79%DFFA 1.5 1.2 0.51 57%PEX14 1.1 1.9 0.96 49%
Data analysed by TaqMan, and grouped in neuroblastoma cell lines, low stage primary tumours and high stage NB primary tumours.
Page 3 of 9(page number not for citation purposes)

Molecular Cancer 2005, 4:10 http://www.molecular-cancer.com/content/4/1/10
Expression studies using the TaqMan-technique for detecting mRNA in NB cell lines and primary tumoursFigure 1Expression studies using the TaqMan-technique for detecting mRNA in NB cell lines and primary tumours. The results are grouped into three groups indicated at the top; also the 1p-deletion status for each sample is indicated at the top. The genes tested are indicated to the left. The Y-axis indicates relative expression level compared to the housekeeping gene GUSB (gene-mRNA concentration / GUSB-mRNA concentration). The identity of each sample is indicated at the bottom.
0
0.5
1
1.5
2
2.5
3
IMR32
SK-N
-AS
SK-N
-DZ
SK-N
-SH
SK-N
-BE
SK-N
-F1
SH-S
Y-5
Y9S
2
20S9
23S4
25S9
4F1
10S2
13S0
13S1
15S3
17S2
0
1
2
3
4
5
6
7
KIF1B
00.20.4
0.60.8
11.2
1.41.6
PGD
0
0.5
1
1.5
2
2.5
3
3.5
DFFA
PEX14
0
0.5
1
1.5
2
2.5
APITD1
0
0.5
1
1.5
2
2.5
UBE4B
Cell lines Low stage tumours
High stage tumours
1p-del + + - - - - - - - - - - + + + + -
p=0,0014
p=0,0016
p=0,0147
p=0,0022
p=0,0061
p=0,0192
Page 4 of 9(page number not for citation purposes)
Molecular Cancer 2005, 4:10 http://www.molecular-cancer.com/content/4/1/10
ConclusionIn conclusion, in our aim to find a mechanism that couldinactivate the genes in the candidate gene region we ana-lyzed the expression status and the methylation profile ofsix genes. The techniques used were TaqMan real-time-RT-PCR technology and bisulphite DNA sequencing. Of thegenes analyzed all were down-regulated in high staged NBtumours as compared to low stage tumours. Promotermethylation was not detected in the genes analyzed,except for the CpG island of APITD1. This methylationdoes not seem to be tumour specific, since methylation
was also detected in healthy blood controls. Hence, the sixgenes UBE4B, KIF1B, PGD, APITD1, DFFA and PEX14 aredown-regulated in high stage NB tumours, a feature thatcan not be explained by methylation, rather by a mecha-nism still remaining to be discovered.
MethodsCell lines and patientsA panel of 10 tumours from primary NBs (4 Stage 2, allfrom patients with no evidence of decease at last follow-up, and 6 Stage 3 or 4 tumours, all from patients with
Methylation status of APITD1Figure 2Methylation status of APITD1. Black boxes indicate methylation, white boxes no methylation, position relative to start codon is indicated at the top.
CpG position -393 -374 -365 -350 -339 -324 -318 -311 -309 -301 -280 -246 -231 -229 -226 -222 -212
Q4
25S9
4F1
Cell lines
Low stage NB 9S2
20S9
23S4
IMR32
SKNAS
SKNBE (2)
10S2
Q3
SKNSH
SKNDZ
SKNF1
SHSY5Y
High stage NB
17S2
Q1
Q2
Healthy controls
13S0
13S1
15S3
Q8
Q5
Q6
Q7
Page 5 of 9(page number not for citation purposes)

Molecular Cancer 2005, 4:10 http://www.molecular-cancer.com/content/4/1/10
adverse outcome) and 7 NB cell lines (IMR-32, SK-N-AS,SK-N-BE (2), SK-N-SH, SK-N-DZ, SK-N-F1 and SH-SY-5Y)were analyzed (Table 1).
Expression analysiscDNA preparationTotal RNA was extracted from frozen (-70°C) NB tumourtissue using RNeasy RNA extraction kit (Qiagen, Hilden,Germany). 2.4 µg total-RNA of each sample was reversedtranscribed to cDNA using Superscript II (Amersham,Buckinghamshire, UK) and random hexamer primers, allaccording to supplier's protocol. All cDNAs were qualitytested by amplification of the housekeeping genes UNPHand GAPDH.
Real time PCR -Endogenous controlTo select the most appropriate endogenous control for thereal-time PCR quantification analysis, we tested eight dif-
ferent primary NB samples of different stages for theirexpression levels of ten commonly used housekeepinggenes with TaqMan Human Endogenous Control Plate,(Applied Biosystems, Foster City, CA). Analysis was per-formed according to supplier's protocol. GUSB (β-glu-curonidase) and B2M (β2-microglobulin) showed leastvariations in ∆CT levels, and were expressed at constantlevels in all samples regardless of NB-stage. GUSB wasselected, and further used as an internal reference fornormalization in the real-time PCR quantification analy-sis (Abel et al., submitted).
Real time PCR- TaqManTaqMan primers and probes were derived from the com-mercially available "TaqMan® Assays-on-Demand™ GeneExpression Products" (URL:http://myscience.appliedbiosystems.com). Real-time PCR was performed in 384-wellplates using ABI PRISM® 7900HT Sequence Detection
Organization of the 5' region of APITD1Figure 3Organization of the 5' region of APITD1. The CpG island, predicted promoter and analyzed region including the region of partial methylation are indicated.
Table 1: Clinical data for the primary tumours used in this study.
Patients/cell lines NB stage 1p-del Ploidi Outcome
18F8 2A neg NED20S9 2 neg NED23S4 2 neg 3n NED25S9 2 neg NED4F1 4 neg DOD10S2A 4 pos DOD13S0 4 pos DOD13S1 3 pos DOD15S3 4 neg/pos DOD17S2 4 neg DOD
Column 3: 1p-del, 1p-deletion; neg, negative; pos, positive; neg/pos; ambiguous results based on microsatellite marker analysis (according to Martinsson et al. [6]) and FISH. Column 5: NED, no evidence of disease; DOD, dead of disease.
Partial
methylation of
C in CpG
dinucleotides
-393 to -212
CpG island
-389 to +642
Promoter region
-250 to +29
Analyzed region
ATG
Exon 1A Exon 1B
Page 6 of 9(page number not for citation purposes)
Molecular Cancer 2005, 4:10 http://www.molecular-cancer.com/content/4/1/10
System (Applied Biosystems). Amplification reactions (10µl) were carried out in duplicate with 0.1 µl templatecDNA according to manufacturers protocol (Applied Bio-systems). In each assay, a standard curve with six cDNAdilutions was recorded and two non-template controlswere included.
Quantification was performed by the standard-curvemethod. The mean CT-value for duplicates were calcu-lated, and the gene concentration (or gene copy numbers)of test samples was interpolated based on standard curves.All samples were normalized by dividing the concentra-tion of the test gene with the concentration of the house-
keeping gene β-glucuronidase (GUSB) in the same cDNAsample.
The logarithms of the expression levels were comparedwith Student's two-sided t-test on each group of tumours;low stage and high stage tumours.
Methylation analysisBisulphite modificationDNA was phenol extracted with the use of phase lock gel(Eppendorf AG, Hamburg, Germany) according to stand-ard procedure and was, with some minor changes, modi-fied according to previously published papers [24,33].Briefly, 1 µg of genomic DNA was digested with restriction
Table 2: Putative promoter regions and CpG island predictions.
Gene Promoter region CpG island Amplified region
UBE4B -1212 to -492 -1157 to -150 -959 to -494KIF1B -22392 to -21141 -22444 to -20935 -22517 to -21874PGD -185 to +7 -680 to +728 -157 to +144APITD1a -250 to +30 -389 to +643 -418 to +321DFFA +65 to +264 -164 to +256 -266 to +142PEX14 - -2806 to -2362 -2752 to -2481
a For APITD1, the methylation status was analyzed for three different fragments. Column 2: Putative promoter regions according to Genomatix Promoter Inspector software. No promoter region was detected in PEX14. Column 3: CpG island prediction by MethPrimer (for CpG island criteria, see materials and methods). Column 4: Region amplified with the primers used in this study.
Table 3: PCR primers for amplification; all primers are designed for the sense strand.
Gene Primer Sequence Length of fragment (bp) Accession number
UBE4B FP 5'-TTGTTAGTTTATTTGGTTTAGGTT-3' 466 NM_006048RP 5'-TAACAAAACCCAACACTATAAAAAAAACCCCT-3'
KIF FP 5'-TTTTTAAGGGTATTTTTTAGAAGGG-3' 644 NM_015074RP 5'-ACTATAACCAATCACAACACAAAACTC-3'
PGD FP-A 5'-GTGAGTTGTTATGGTTATAGTTG-3' 301 NM_002631FP-B 5'-ATGGTGTGGTTTTATGGTTTTATTT-3'RP 5'-CAAAATCACAAAACCCCAAATAA-3'
APITD1 1FP-A 5'-GATTTTGTAAGATATATTTGAGGTAT-3' 231 chr1_29_927.b1FP-B 5'-ATGGAGTTTTTGATAATGTGTATTG-3'1RP 5'-AACCCCCTACTCAACTTACTCTAC-3'2FP-A 5'-ATTAGGTTTTGGGGTGTAGTAGTGAT-3' 1992FP-B 5'-GTAGAGTAAGTTGAGTAGGGGGTTG-3'2RP 5'-ACCCTAAACAAAAACAAAAAAAC-3'3FP-A 5'-GTAGAGTAAGTTGAGTAGGGGGTTG-3' 3503FP-B 5'-TTGTTTTTGTTTAGGGTCGGTT-3'3RP 5'-CAAAACCAAAAAATAACCTCTC-3'
DFFA FP 5'-AAGTTAAAAATAATTTTTAGGTTGAAT-3' 407 NM_004401RP 5'-ACCAACCCTTACTCCTCAAATCT-3'
PEX14 FP 5'-TGATTAGTTAGGTTTTAGAAAGATGG-3' 333 NM_004565RP 5'-CAAATAAAACCAAAAATACTAACAAAC-3'
Column 2: FP, forward primer; RP, reverse primer; FP-A and FP-B, primers used for semi-nested PCR together with the same reverse primer. Column 5: UCSC Genome Browser August 2001 draft sequence was used as reference sequence (URL: http://genome.ucsc.edu).
Page 7 of 9(page number not for citation purposes)

Molecular Cancer 2005, 4:10 http://www.molecular-cancer.com/content/4/1/10
endonucleases that cut close but outside the region ofinterest. The DNA was then denaturated in 0.3 M freshlyprepared NaOH at 40°C for 15 minutes. Sodium metabi-sulphite (Sigma-Aldrich CO, St Louis, MO) and urea, at afinal concentration of 1.73 M and 5.36 M respectively,were added in order to sulphonate the unmethylatedcytosines, along with hydroquinone (0.5 mM).Conversion was carried out at 55°C for 16 hours, with atemperature rise to 95°C for 30 seconds every third hour.DNA was purified with Wizard DNA clean up system(Promega Corporation, Madison, WI) according to themanufactures instructions and desulphonated in 0.3 MNaOH at 37°C for 15 minutes. DNA was then precipi-tated in ethanol, resuspended in distilled H2O and storedat -20°C.
Promoter analysis and DNA amplificationThe putative promoter regions of the genes were predictedusing Genomatix Promoter Inspector software (URL:http://www.genomatix.de) and CpG islands with Meth-Primer software (URL: http://www.urogene.org/methprimer/; Table 2) [34]. These regions, or parts of them,were amplified with one primer pair, or if needed, withsemi-nested primers (Table 3). The methylation statuswas analyzed using bisulphite sequencing. Conditions forPCR amplification were 1× PCR Gold Buffer (Applied Bio-systems), 0.5 mM dNTPs, 2.0–3.0 mM MgCl2, 0.4 µM offorward and reverse primers respectively and 1 unit ofAmpliTaq Gold, in a total volume of 50 µl. Reactions weredenatured at 95°C for 10 min followed by 5 cycles of95°C for 1 min, 49–55°C for 2 min, 72°C for 3 min and30 cycles of 95°C for 30 sec, 49–55°C for 2 min, 72°C for1 min 30 sec and ending with 10 min extension at 72°C.The PCR products were immediately sequenced or clonedinto a sequencing vector using the TOPO T/A cloning kit(Life Technologies Invitrogen, Carlsbad, CA), where after10–30 clones were picked. PCR products were purifiedwith ExoSAP-IT™ (USB Corporation, Cleveland, Ohio)and sequencing was carried out using forward or reverseprimer with ABI Prism BigDye™ cycle sequencing ReadyReaction Kit (Applied Biosystems). The samples were ana-lyzed in an ABI 3100 or an ABI 3730 Genetic Analyzer.
Authors' contributionsHC participated in the design of the study, carried out themethylation analysis and drafted the manuscript. SF, LHand FL participated in parts of the methylation study. KEand CK carried out the TaqMan runs. KE also contributedto drafting the manuscript. RMS participated in the clon-ing. TM coordinated the study. All authors read andapproved the final manuscript.
AcknowledgementsThis work was supported by grants from the Swedish Cancer Society, the Children's Cancer Foundation, the King Gustav V Jubilee Clinic Cancer Research Foundation, the Assar Gabrielsson Foundation, the Wilhelm and
Martina Lundgren Research Foundation and the Sahlgrenska University Foundation. We would like to thank the Swegene Gothenburg Genomics resource unit for access to the ABI 7900HT Sequence Detection System and the ABI 3730 Genetic Analyzer.
References1. Maris JM, Matthay KK: Molecular biology of neuroblastoma. J
Clin Oncol 1999, 17:2264-2279.2. Caron H, Peter M, van Sluis P, Speleman F, de Kraker J, Laureys G,
Michon J, Brugieres L, Voute PA, Westerveld A, et al.: Evidence fortwo tumour suppressor loci on chromosomal bands 1p35-36involved in neuroblastoma: one probably imprinted, anotherassociated with N-myc amplification. Hum Mol Genet 1995,4:535-539.
3. Caron H, Spieker N, Godfried M, Veenstra M, van Sluis P, de KrakerJ, Voute P, Versteeg R: Chromosome bands 1p35-36 containtwo distinct neuroblastoma tumor suppressor loci, one ofwhich is imprinted. Genes Chromosomes Cancer 2001, 30:168-174.
4. Maris JM, White PS, Beltinger CP, Sulman EP, Castleberry RP, ShusterJJ, Look AT, Brodeur GM: Significance of chromosome 1p lossof heterozygosity in neuroblastoma. Cancer Res 1995,55:4664-4669.
5. Maris JM, Guo C, Blake D, White PS, Hogarty MD, Thompson PM,Rajalingam V, Gerbing R, Stram DO, Matthay KK, Seeger RC, BrodeurGM: Comprehensive analysis of chromosome 1p deletions inneuroblastoma. Med Pediatr Oncol 2001, 36:32-36.
6. Martinsson T, Sjöberg RM, Hedborg F, Kogner P: Deletion of chro-mosome 1p loci and microsatellite instability in neuroblast-omas analyzed with short-tandem repeat polymorphisms.Cancer Res 1995, 55:5681-5686.
7. Martinsson T, Sjöberg RM, Hallstensson K, Nordling M, Hedborg F,Kogner P: Delimitation of a critical tumour suppressor regionat distal 1p in neuroblastoma tumours. Eur J Cancer 1997,33:1997-2001.
8. White PS, Thompson PM, Seifried BA, Sulman EP, Jensen SJ, Guo C,Maris JM, Hogarty MD, Allen C, Biegel JA, Matise TC, Gregory SG,Reynolds CP, Brodeur GM: Detailed molecular analysis of 1p36in neuroblastoma. Med Pediatr Oncol 2001, 36:37-41.
9. White PS, Maris JM, Beltinger C, Sulman E, Marshall HN, Fujimori M,Kaufman BA, Biegel JA, Allen C, Hilliard C, et al.: A region of con-sistent deletion in neuroblastoma maps within human chro-mosome 1p36.2-36.3. Proc Natl Acad Sci U S A 1995, 92:5520-5524.
10. Bauer A, Savelyeva L, Claas A, Praml C, Berthold F, Schwab M: Small-est region of overlapping deletion in 1p36 in human neurob-lastoma: a 1 Mbp cosmid and PAC contig. Genes ChromosomesCancer 2001, 31:228-239.
11. Ejeskär K, Sjöberg RM, Abel F, Kogner P, Ambros PF, Martinsson T:Fine mapping of a tumour suppressor candidate gene regionin 1p36.2-3, commonly deleted in neuroblastomas and germcell tumours. Med Pediatr Oncol 2001, 36:61-66.
12. Spieker N, Beitsma M, Van Sluis P, Chan A, Caron H, Versteeg R:Three chromosomal rearrangements in neuroblastomacluster within a 300-kb region on 1p36.1. Genes ChromosomesCancer 2001, 31:172-181.
13. Krona C, Ejeskär K, Abel F, Kogner P, Bjelke J, Björk E, Sjöberg RM,Martinsson T: Screening for gene mutations in a 500 kb neu-roblastoma tumor suppressor candidate region in chromo-some 1p; mutation and stage-specific expression in UBE4B/UFD2. Oncogene 2003, 22:2343-2351.
14. Ejeskär K, Abel F, Sjöberg RM, Bäckström J, Kogner P, Martinsson T:Fine mapping of the human preprocortistatin gene (CORT)to neuroblastoma consensus deletion region 1p36.3-->p36.2,but absence of mutations in primary tumors. Cytogenet CellGenet 2000, 89:62-66.
15. Abel F, Sjöberg RM, Ejeskär K, Krona C, Martinsson T: Analyses ofapoptotic regulators CASP9 and DFFA at 1P36.2, revealrare allele variants in human neuroblastoma tumours. Br JCancer 2002, 86:596-604.
16. Krona C, Ejeskär K, Carén H, Abel F, Sjöberg RM, Martinsson T: Anovel 1p36.2 located gene, APITD1, with tumour-suppres-sive properties and a putative p53-binding domain, showslow expression in neuroblastoma tumours. Br J Cancer 2004,91:1119-1130.
17. Abel F, Sjöberg RM, Krona C, Nilsson S, Martinsson T: Mutations inthe N-terminal domain of DFF45 in a primary germ cell
Page 8 of 9(page number not for citation purposes)

Molecular Cancer 2005, 4:10 http://www.molecular-cancer.com/content/4/1/10
Publish with BioMed Central and every scientist can read your work free of charge
"BioMed Central will be the most significant development for disseminating the results of biomedical research in our lifetime."
Sir Paul Nurse, Cancer Research UK
Your research papers will be:
available free of charge to the entire biomedical community
peer reviewed and published immediately upon acceptance
cited in PubMed and archived on PubMed Central
yours — you keep the copyright
Submit your manuscript here:http://www.biomedcentral.com/info/publishing_adv.asp
BioMedcentral
tumor and in neuroblastoma tumors. Int J Oncol 2004,25:1297-1302.
18. Plass C: Cancer epigenomics. Hum Mol Genet 2002, 11:2479-2488.19. Herman JG, Baylin SB: Gene silencing in cancer in association
with promoter hypermethylation. N Engl J Med 2003,349:2042-2054.
20. Costello JF, Plass C: Methylation matters. J Med Genet 2001,38:285-303.
21. Jones PA, Laird PW: Cancer epigenetics comes of age. Nat Genet1999, 21:163-167.
22. Tycko B: Epigenetic gene silencing in cancer. J Clin Invest 2000,105:401-407.
23. Esteller M: CpG island hypermethylation and tumor suppres-sor genes: a booming present, a brighter future. Oncogene2002, 21:5427-5440.
24. Clark SJ, Harrison J, Paul CL, Frommer M: High sensitivity map-ping of methylated cytosines. Nucleic Acids Res 1994,22:2990-2997.
25. Herman JG, Graff JR, Myohanen S, Nelkin BD, Baylin SB: Methyla-tion-specific PCR: a novel PCR assay for methylation statusof CpG islands. Proc Natl Acad Sci U S A 1996, 93:9821-9826.
26. Teitz T, Wei T, Valentine MB, Vanin EF, Grenet J, Valentine VA, BehmFG, Look AT, Lahti JM, Kidd VJ: Caspase 8 is deleted or silencedpreferentially in childhood neuroblastomas with amplifica-tion of MYCN. Nat Med 2000, 6:529-535.
27. Harada K, Toyooka S, Maitra A, Maruyama R, Toyooka KO, TimmonsCF, Tomlinson GE, Mastrangelo D, Hay RJ, Minna JD, Gazdar AF:Aberrant promoter methylation and silencing of theRASSF1A gene in pediatric tumors and cell lines. Oncogene2002, 21:4345-4349.
28. Astuti D, Agathanggelou A, Honorio S, Dallol A, Martinsson T,Kogner P, Cummins C, Neumann HP, Voutilainen R, Dahia P, Eng C,Maher ER, Latif F: RASSF1A promoter region CpG islandhypermethylation in phaeochromocytomas and neuroblast-oma tumours. Oncogene 2001, 20:7573-7577.
29. Agathanggelou A, Dallol A, Zochbauer-Muller S, Morrissey C, Hono-rio S, Hesson L, Martinsson T, Fong KM, Kuo MJ, Yuen PW, MaherER, Minna JD, Latif F: Epigenetic inactivation of the candidate3p21.3 suppressor gene BLU in human cancers. Oncogene2003, 22:1580-1588.
30. van Noesel MM, van Bezouw S, Voute PA, Herman JG, Pieters R, Ver-steeg R: Clustering of hypermethylated genes inneuroblastoma. Genes Chromosomes Cancer 2003, 38:226-233.
31. Alaminos M, Davalos V, Cheung NK, Gerald WL, Esteller M: Clus-tering of gene hypermethylation associated with clinical riskgroups in neuroblastoma. J Natl Cancer Inst 2004, 96:1208-1219.
32. Ohira M, Kageyama H, Mihara M, Furuta S, Machida T, Shishikura T,Takayasu H, Islam A, Nakamura Y, Takahashi M, Tomioka N, Saki-yama S, Kaneko Y, Toyoda A, Hattori M, Sakaki Y, Ohki M, Horii A,Soeda E, Inazawa J, Seki N, Kuma H, Nozawa I, Nakagawara A: Iden-tification and characterization of a 500-kb homozygouslydeleted region at 1p36.2-p36.3 in a neuroblastoma cell line.Oncogene 2000, 19:4302-4307.
33. Paulin R, Grigg GW, Davey MW, Piper AA: Urea improves effi-ciency of bisulphite-mediated sequencing of 5'-methylcyto-sine in genomic DNA. Nucleic Acids Res 1998, 26:5009-5010.
34. Li LC, Dahiya R: MethPrimer: designing primers for methyla-tion PCRs. Bioinformatics 2002, 18:1427-1431.
Page 9 of 9(page number not for citation purposes)
Top Related
Copyright © 2022 FDOKUMEN

