


Bahasa
Halaman
Hukum

Citation: Qi, X.; Lim, S. A
Screen-Printed Metal Hybrid
Composite for Wireless Wind
Sensing. Nanomaterials 2022, 12, 972.
https://doi.org/10.3390/
nano12060972
Academic Editors: Hideya Kawasaki,
Vassiliki Belessi and Vasilios
Georgakilas
Received: 28 January 2022
Accepted: 11 March 2022
Published: 15 March 2022
Publisher’s Note: MDPI stays neutral
with regard to jurisdictional claims in
published maps and institutional affil-
iations.
Copyright: © 2022 by the authors.
Licensee MDPI, Basel, Switzerland.
This article is an open access article
distributed under the terms and
conditions of the Creative Commons
Attribution (CC BY) license (https://
creativecommons.org/licenses/by/
4.0/).
nanomaterials
Article
A Screen-Printed Metal Hybrid Composite for WirelessWind SensingXue Qi and Sooman Lim *
Department of Flexible and Printable Electronics, LANL-JBNU Engineering Institute, Jeonbuk NationalUniversity, Jeonju 54896, Korea; [email protected]* Correspondence: [email protected]
Abstract: Wind sensing has become a key component in various fields with the growing trend ofassessing air conditions for energy conversion. In this study, we demonstrated a wireless screen-printable flexible strain sensor system based on Ag/MWCNT composite for wind sensing. To achievehigh printability with the metal hybrid composite for the fabrication of a screen-printed flexiblesensor, we systematically investigated the rheological properties, resulting in the high shear thinningand thixotropic behavior of the composite. After confirming the suitability for screen printing, weinvestigated the performance of the printed strain sensor, obtaining a gauge factor (G.F.) of 2.08 with90% sensitivity and high durability after 6000 bending cycles. In addition, the sensor showed 98%temperature sensitivity during a wind sensing test due to the intrinsic properties of the metal hybridcomposite. In an application based on an IoT system, we verified that the response of the wirelesssensor corresponded with that of a wired sensor, indicating the expansion of low-cost, mass-producedscreen-printed wind sensors.
Keywords: screen-printed wind sensor; rheology; gauge factor; temperature; wireless sensor
1. Introduction
Wind sensing has been utilized in various fields, including in the determination of dry-ing rates [1,2], pollen propagation [3–5], pathogen propagation [6–8], air conditioning strat-egy design [9–11], and wind turbine operations [12–14]. To measure wind velocity, tradi-tional measuring mechanisms are widely used, such as vane and cup anemometers [15–17]and acoustic anemometers [18]. However, these mechanisms have detection thresholdsdue to mechanical wear, performance degradation, and bearing friction, and are relativelyexpensive, limiting their use [19]. Another measuring mechanism includes the use of apressure anemometer, which works based on the measurement of barometric pressureproportional to the square of the wind velocity [20]. Although this approach can provideaccurate wind velocity measurements, the tubes are prone to clogging by water dropletsand ice crystals [21].
To avoid these defects, a low-cost, low-complexity, powerful wind direction sen-sor using 3D printed flexible strain sensor has been demonstrated [20]. In this previouswork, conductive polylactic acid was printed on a flexible substrate via the fused deposi-tion method.
The printing process can be modeled so that core and adjustable design aspects canbe fitted to specific wind sensing applications. However, due to the nature of the FDMprinting process, the low printing speeds and limited productivity are still problematic.Alternatively, screen printing is the most widely used process for the fabrication of flexiblestrain sensors because of its advantages of fast production, massive productivity, easydesign, and less limited surface morphology of the substrates [22–24]. However, the screenprinting process has not been applied for wind sensing applications in various fields.
When applying printed flexible strain sensors for wind sensing, the conductive mate-rial is an important component, since it mainly determines the sensing properties. Carbon
Nanomaterials 2022, 12, 972. https://doi.org/10.3390/nano12060972 https://www.mdpi.com/journal/nanomaterials
Nanomaterials 2022, 12, 972 2 of 12
nanotubes (CNTs) have been broadly used in strain sensors as conductive materials due totheir excellent mechanical properties, chemical inertness, and low cost [25–27]. To make upfor certain defects that carbon base materials often suffer from, such as low conductivity(sheet resistance of ≈4 KΩ sq−15) and relatively low sensitivity, researchers have mixedCNTs with other metal materials. A previous study physically mixed CNTs with silverparticles [28], while another using chemical methods produced AgNP-modified CNTs [29],resulting in improved electrical properties and a high gauge factor (GF) sensitivity withthe results being two times better than for CNTs. Conventionally, strain sensor networksrequire wires to connect each individual strain sensor to a centralized data acquisition unit;however, this causes measurement limitations, high maintenance costs, and reductions inspatial resolution [30–32]. Thus, the fabrication of wireless sensors with a wireless commu-nication channel is preferred and expected to offer unique advantages, such as installationflexibility, reduced weight, improved sensor density, and ease of maintenance [33–35]. Onthe other hand, simulations are being used in various fields to analyze specific phenom-ena [36,37]. However, the sensing mechanism is still poorly understood. In particular, thecalculation of strain energy via the piezo resistance and applied load plays a key role inthis study.
In this study, a wireless screen-printable flexible strain sensor system based on anAg/MWCNT composite was designed for wind sensing. The sensor’s fast productionspeed, high productivity, simple design, low cost, stability, and lower restrictions on thesurface morphology of the substrate mean it has wider application prospects. To use theoptimized Ag/MWCNT composite for the fabrication of a screen-printed flexible sensor,we investigated the rheological properties of the composite to verify the printability of thesynthesized ink, whereby the performance of the strain sensor revealed a gauge factor (G.F.)of 2.08 with 90% sensitivity and high durability after 6000 bending cycles. In addition, thesensor showed 98% temperature sensitivity during a wind sensing test due to the intrinsicproperties of the metal hybrid composite. Finally, the printed sensor was proven to offergreater performance in wireless systems compared to that of wired systems. Comparedto other recent results that have been published (Table 1), the wireless screen-printableflexible strain sensor system based on Ag/MWCNT composite for wind sensing showedexcellent performance in terms of its stability, applicability, simple production process, andlow substrate limits.
Table 1. Summary of the performance results for carbon-based flexible strain sensors.
Materials PreparationProcess Stability GF Application Ref.
Graphene/polyimide Coating/Depositing 1500 cycles 0.96 Wind sensor [38]
Carbon Screen printing No 3.27 healthmonitoring [39]
CNT/polymer Monte Carlotechniques No 2 - [40]
MWCNT/siliconerubber
Sub-surfaceprinting of
nanocompositeinside matrix
5 cycles 1.5 - [41]
MWCNT/epoxyresins Casting film 5 cycles 4.45 wearable
electronics [42]
Ag/CNT Screen printing 6000 cycles 2.08 Wirelesswind sensor
Thiswork
Nanomaterials 2022, 12, 972 3 of 12
2. Experiment2.1. Materials
AgNPs were purchased from NTbase (South Korea), and the model of AgNP was NP-S80, with a purity of 99.99%. The OD values of MWCNTs (US Research Nanomaterials, Inc.,Houston, TX, USA) were 5–15 nm, with a purity of >95%. The fluorosurfactant (FC-4430) wasobtained from 3M United States. Sterocoll® HS, FoamStar® SI 2213 (St. Paul, MN, USA) andHdropal-at® WE 3475 were provided by BASF corporation (Florham Park, NJ, USA). Butylcarbitol and PVB terpolymers were purchased from Sigma-Aldrich (Burlington, MA, USA).
2.2. Preparation of Ag/MWCNT Composite
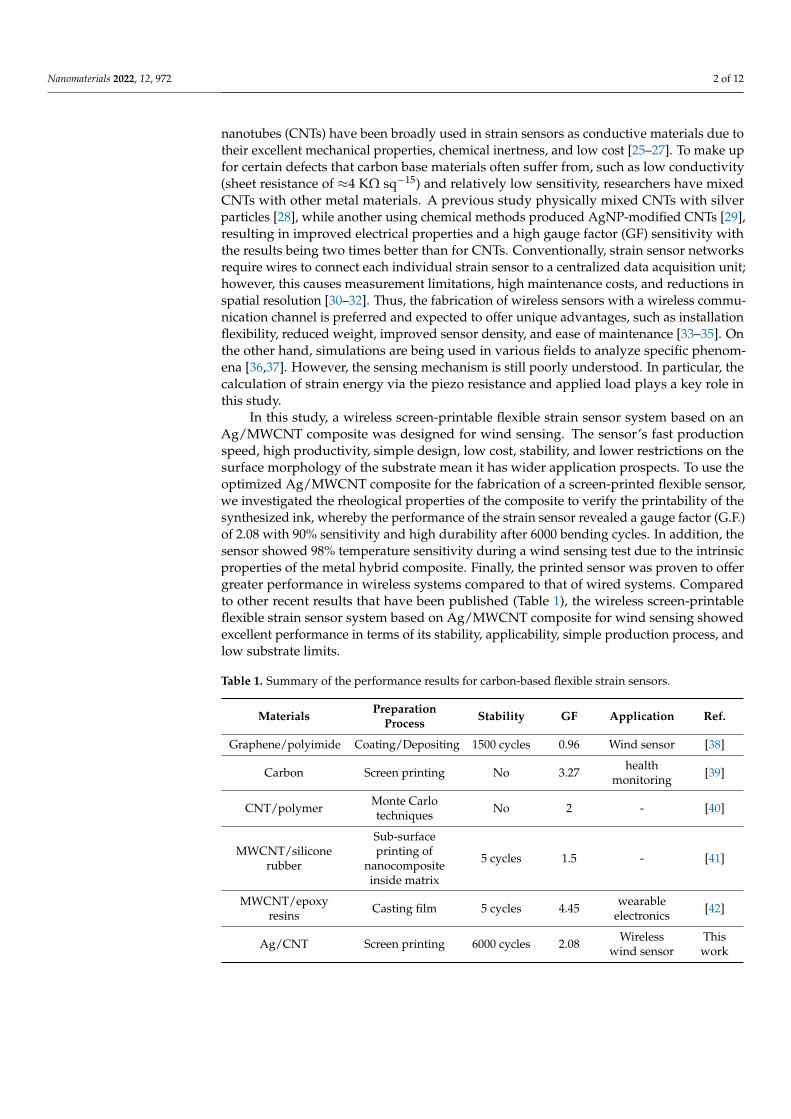
As shown in Figure 1a, a simple, low-cost, room temperature chemical solutionprocess was used to prepare the Ag/CNT paste. The ratio of the Ag/CNT, dispersant(FC-4430), solvent–resin vehicle (Butyl carbitol/PVB—3.75:21.25), thicker (Sterocoll® HS),defoaming agent (FoamStar® SI 2213), and wetting agent (Hydropalat® WE 3475) was2.4:47.7:0.1:47.7:1:0.1:1. The materials were mixed using a vortex agitator (Daihan Scientific,Wonju, South Korea) at 1000 RPM for 12 h. The paste was transferred to a planetarycentrifugal bubble-free mixer (ARE-310, THINKY U.S.A., Inc., Laguna Hills, CA, USA) for20 min, then degassed for 5 min, and this process was repeated three times.
Nanomaterials 2022, 12, x FOR PEER REVIEW 3 of 12
2. Experiment 2.1. Materials
AgNPs were purchased from NTbase (South Korea), and the model of AgNP was NP-S80, with a purity of 99.99%. The OD values of MWCNTs (US Research Nanomateri-als, Inc., Houston, TX, USA) were 5–15 nm, with a purity of >95%. The fluorosurfactant (FC-4430) was obtained from 3M United States. Sterocoll® HS, FoamStar® SI 2213 (St. Paul, MN, USA) and Hdropal-at® WE 3475 were provided by BASF corporation (Florham Park, NJ, USA). Butyl carbitol and PVB terpolymers were purchased from Sigma-Aldrich (Bur-lington, MA, USA).
2.2. Preparation of Ag/MWCNT Composite As shown in Figure 1a, a simple, low-cost, room temperature chemical solution pro-
cess was used to prepare the Ag/CNT paste. The ratio of the Ag/CNT, dispersant (FC-4430), solvent–resin vehicle (Butyl carbitol/PVB—3.75:21.25), thicker (Sterocoll® HS), defoaming agent (FoamStar® SI 2213), and wetting agent (Hydropalat® WE 3475) was 2.4:47.7:0.1:47.7:1:0.1:1. The materials were mixed using a vortex agitator (Daihan Scien-tific, South Korea) at 1000 RPM for 12 h. The paste was transferred to a planetary centrif-ugal bubble-free mixer (ARE-310, THINKY U.S.A., Inc., Laguna Hills, CA, USA) for 20 min, then degassed for 5 min, and this process was repeated three times.
Figure 1. (a) Preparation process of thermally conductive silver nanoparticle MWCNT compos-ites. (b) A schematic diagram of the screen printing process with Ag/MWCNT composite for thefabrication of a wind sensor.

Nanomaterials 2022, 12, 972 4 of 12
2.3. Fabrication of Printed Strain Sensor with Screen Printing
Screen printing of the composite was performed on an AMX-1242T Semi-Auto screenprinter (Korea), using a 320 mm × 320 mm precision stainless steel screen mesh (400 meshcount, 0.84 mm wire diameter, 0.83 mm mesh opening, standard mesh tension, 39 µm meshthickness, 10 µm emulsion thickness, emulsion is safe with water) from Samborn Screens(Korea). A 140 mm squeegee with an ergonomic holder forming an angle of approximately45 was used to print a pattern with a printing velocity of 30 mms−1. The stretchable filmwas fixed on the screen printing substrate and configured Ag/MWCNT composite loadedon one end of the mesh-screen, and then the composite was transferred to the substratefilm through squeezing and drying for 30 min at 120 C.
2.4. Characterization
A mixed-flow instrument (hr-3TA Instruments, New Castle, DE, USA) was usedto measure the viscosity of Ag/MWCNT composite. The current signal system voltagewas 5.0 V (Keithley 2400 source meter, Beaverton, OR, USA), which was used to test thedurability of the sensor by bending the system (OWIS PS 10-32, Staufen, Germany). Themorphologies of composite films were analyzed using field-emission–scanning electronmicroscopy (SUPRA 40VP, Carl Zeiss, Germany) at the Center for University-Wide ResearchFacilities (CURF) at Jeonbuk National University.
3. Results and Discussion
Figure 1b shows the fabrication of a strain sensor fully printed with Ag/MWC-NTcomposite on a PEN substrate. The reason for using PEN as a substrate was due to itshigh tensile strength, excellent dimensional stability, low moisture absorption, and goodretention of physical properties over a wide temperature range. For the screen printingmethod, the composite is placed on the screen, pulled with strong tension, and pressed witha squeegee (a spatula-shaped urethane rubber material). During the process, the screenprinter maintains a snap-off distance between the screen and the substrate, and when thesqueegee passes the screen meets the substrate, transfers the composite, and deposits it byreleasing the tension.
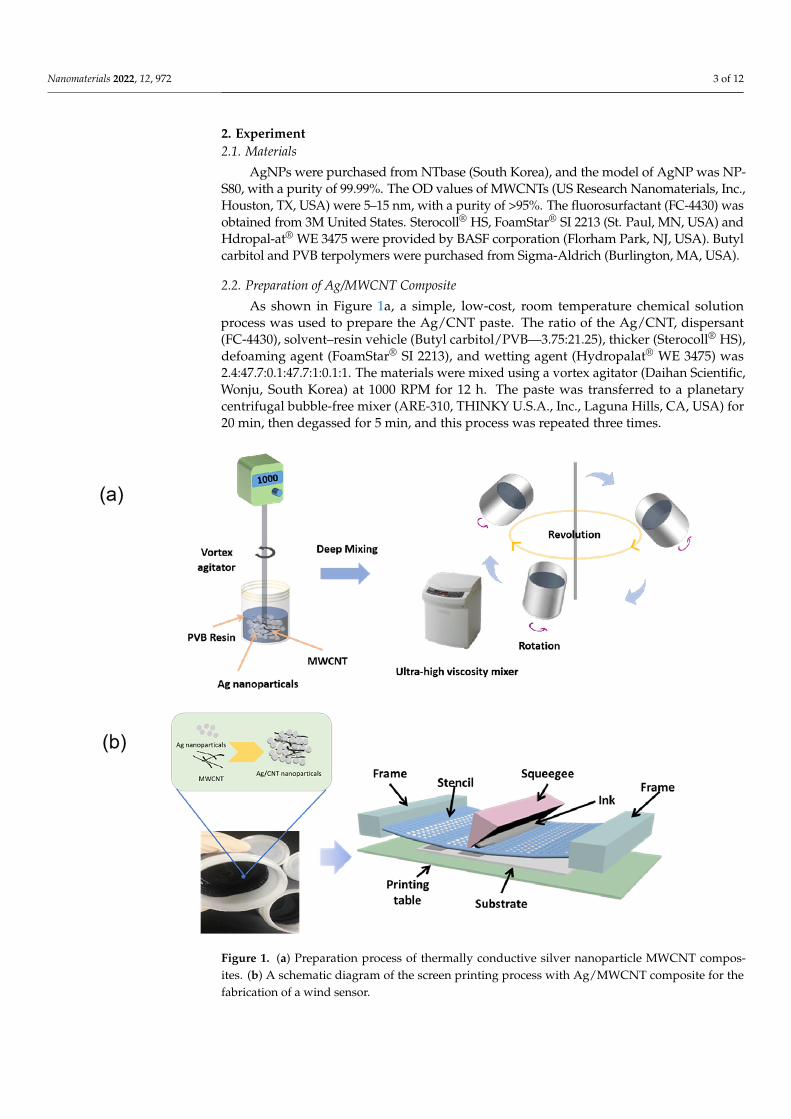
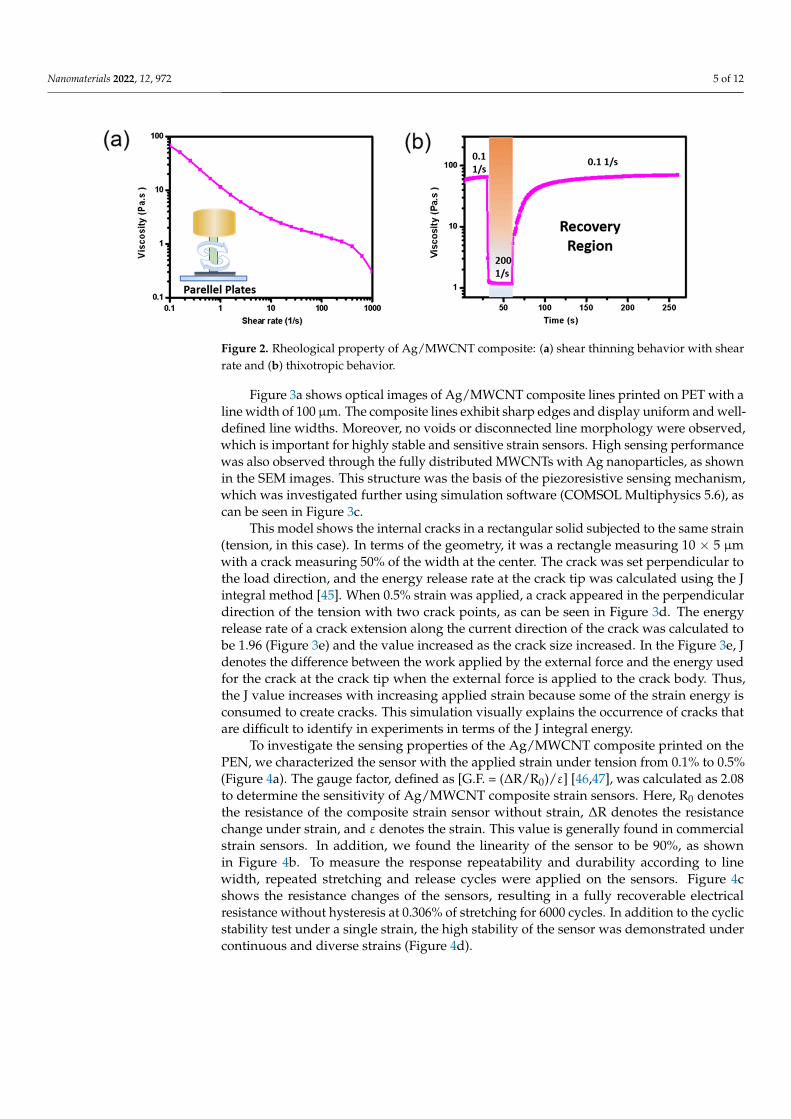
Figure 2a depicts the rheological behaviors of the Ag/MWCNT composite in termsof the printability of the ink in the screen printing process. The steady-state flow stepmeasured by cone–plate rheometer reveals that the composites have shear thinning behav-iors suitable for printing processes; shearing force induces disintegration of agglomeratesor deforms the shapes of particles, resulting in reduced interactive forces between theparticles [43]. We also measured the thixotropic behavior of the composite, whereby areduction in structural strength with a shear loading and structure regeneration with timewas set up to simulate the composite flow during the screen printing process. As shownin Figure 2b, the shear rate was kept at 0.1 s−1 for 30 s in the first interval and increasedto 200 s−1 for 30 s in the second interval of the squeezing process. Then, the shear ratewas brought back to 0.1 s−1 and held for 110 s in the third interval to observe leveling ofthe composite with time after finishing the printing. When the composites were undera considerable shear rate of 200 s−1 during the second interval, there was a decrease inviscosity, which then recovered with time (time dependency). Moreover, gradual recoveryduring the third interval was observed and the difference in recovery (%) between theinitial point (60 s) to the end pint (110 s) was 80%. Since the recovery velocity determinesthe leveling time, which in turn determines the pattern quality, recovery times that are tooshort or too long should be avoided [44]. In this study, the Ag/MWCNT composite wassuitable for high printability, since the composite recovery time was sufficient to allow auniform pattern. In addition, the composite showed a high percentage of recovery of 80%,meaning the high elasticity allowed us to print 100 µm of a fine pattern.
Nanomaterials 2022, 12, 972 5 of 12
Nanomaterials 2022, 12, x FOR PEER REVIEW 5 of 12
high printability, since the composite recovery time was sufficient to allow a uniform pat-tern. In addition, the composite showed a high percentage of recovery of 80%, meaning the high elasticity allowed us to print 100 μm of a fine pattern.
Figure 2. Rheological property of Ag/MWCNT composite: (a) shear thinning behavior with shear rate and (b) thixotropic behavior.
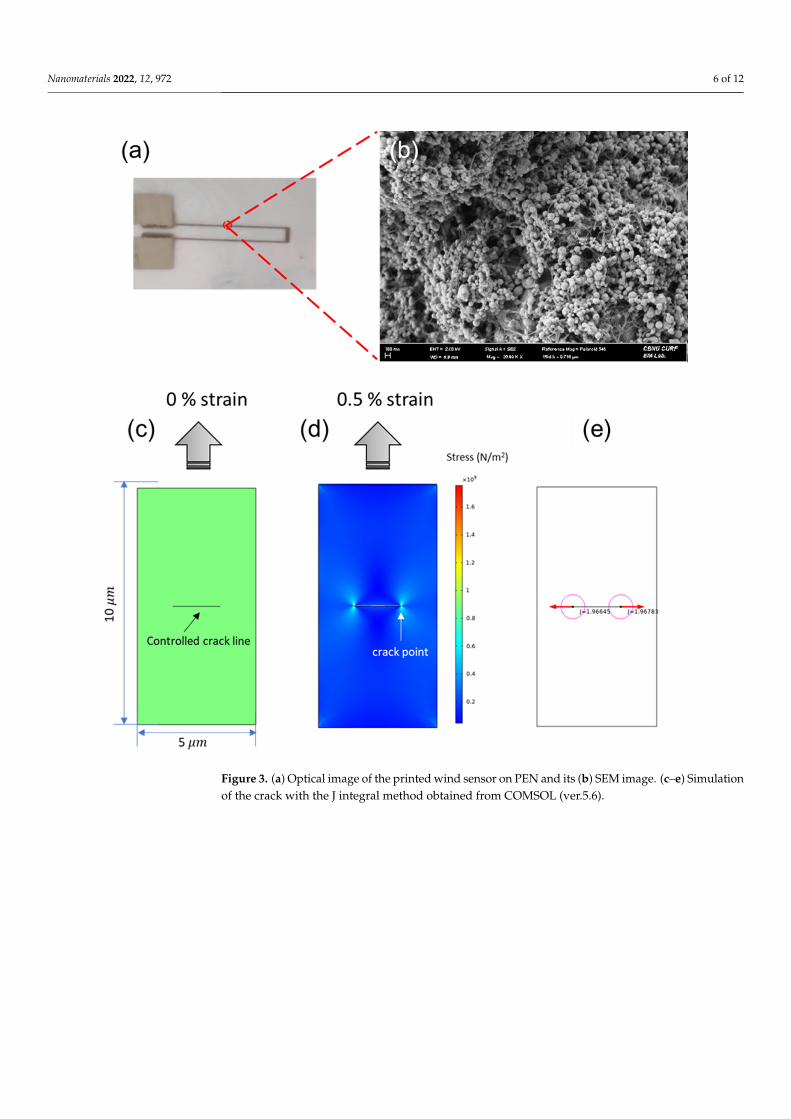
Figure 3a shows optical images of Ag/MWCNT composite lines printed on PET with a line width of 100 μm. The composite lines exhibit sharp edges and display uniform and well-defined line widths. Moreover, no voids or disconnected line morphology were ob-served, which is important for highly stable and sensitive strain sensors. High sensing performance was also observed through the fully distributed MWCNTs with Ag nano-particles, as shown in the SEM images. This structure was the basis of the piezoresistive sensing mechanism, which was investigated further using simulation software (COMSOL Multiphysics 5.6), as can be seen in Figure 3c.
This model shows the internal cracks in a rectangular solid subjected to the same strain (tension, in this case). In terms of the geometry, it was a rectangle measuring 10 × 5 µm with a crack measuring 50% of the width at the center. The crack was set perpendicu-lar to the load direction, and the energy release rate at the crack tip was calculated using the J integral method [45]. When 0.5% strain was applied, a crack appeared in the perpen-dicular direction of the tension with two crack points, as can be seen in Figure 3d. The energy release rate of a crack extension along the current direction of the crack was calcu-lated to be 1.96 (Figure 3e) and the value increased as the crack size increased. In the Fig-ure 3e, J denotes the difference between the work applied by the external force and the energy used for the crack at the crack tip when the external force is applied to the crack body. Thus, the J value increases with increasing applied strain because some of the strain energy is consumed to create cracks. This simulation visually explains the occurrence of cracks that are difficult to identify in experiments in terms of the J integral energy.
Figure 2. Rheological property of Ag/MWCNT composite: (a) shear thinning behavior with shearrate and (b) thixotropic behavior.
Figure 3a shows optical images of Ag/MWCNT composite lines printed on PET with aline width of 100 µm. The composite lines exhibit sharp edges and display uniform and well-defined line widths. Moreover, no voids or disconnected line morphology were observed,which is important for highly stable and sensitive strain sensors. High sensing performancewas also observed through the fully distributed MWCNTs with Ag nanoparticles, as shownin the SEM images. This structure was the basis of the piezoresistive sensing mechanism,which was investigated further using simulation software (COMSOL Multiphysics 5.6), ascan be seen in Figure 3c.
This model shows the internal cracks in a rectangular solid subjected to the same strain(tension, in this case). In terms of the geometry, it was a rectangle measuring 10 × 5 µmwith a crack measuring 50% of the width at the center. The crack was set perpendicular tothe load direction, and the energy release rate at the crack tip was calculated using the Jintegral method [45]. When 0.5% strain was applied, a crack appeared in the perpendiculardirection of the tension with two crack points, as can be seen in Figure 3d. The energyrelease rate of a crack extension along the current direction of the crack was calculated tobe 1.96 (Figure 3e) and the value increased as the crack size increased. In the Figure 3e, Jdenotes the difference between the work applied by the external force and the energy usedfor the crack at the crack tip when the external force is applied to the crack body. Thus,the J value increases with increasing applied strain because some of the strain energy isconsumed to create cracks. This simulation visually explains the occurrence of cracks thatare difficult to identify in experiments in terms of the J integral energy.
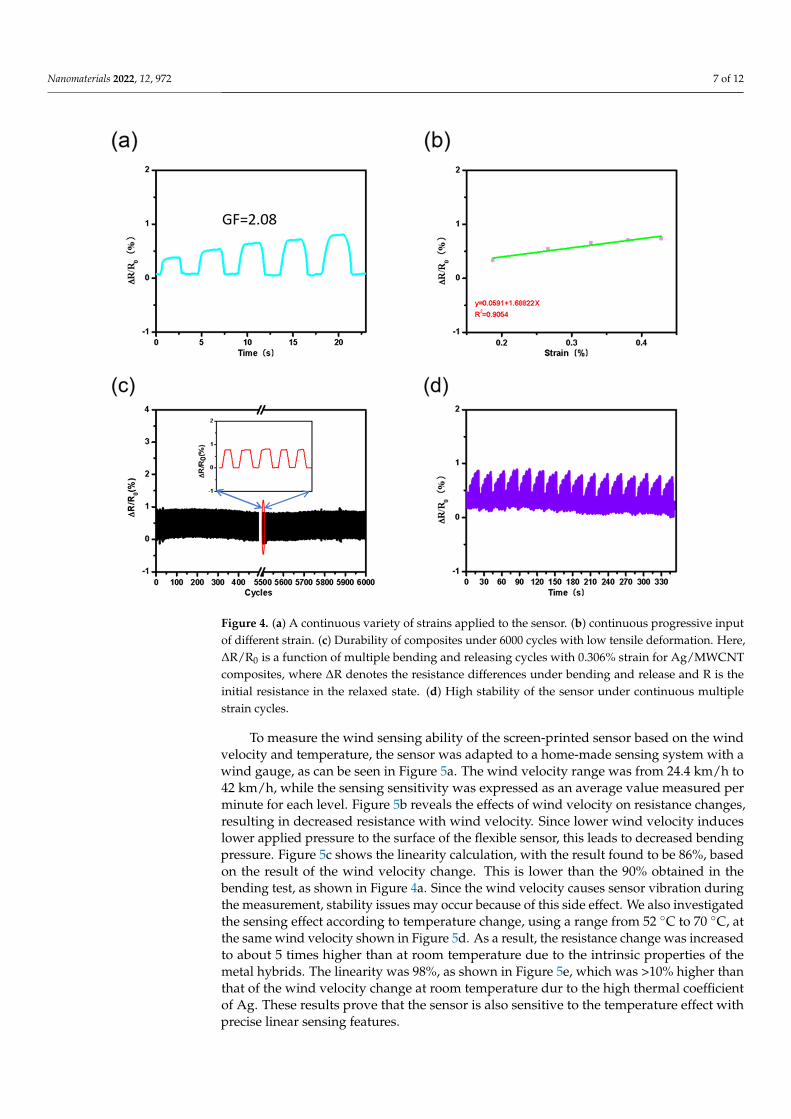
To investigate the sensing properties of the Ag/MWCNT composite printed on thePEN, we characterized the sensor with the applied strain under tension from 0.1% to 0.5%(Figure 4a). The gauge factor, defined as [G.F. = (∆R/R0)/ε] [46,47], was calculated as 2.08to determine the sensitivity of Ag/MWCNT composite strain sensors. Here, R0 denotesthe resistance of the composite strain sensor without strain, ∆R denotes the resistancechange under strain, and ε denotes the strain. This value is generally found in commercialstrain sensors. In addition, we found the linearity of the sensor to be 90%, as shownin Figure 4b. To measure the response repeatability and durability according to linewidth, repeated stretching and release cycles were applied on the sensors. Figure 4cshows the resistance changes of the sensors, resulting in a fully recoverable electricalresistance without hysteresis at 0.306% of stretching for 6000 cycles. In addition to the cyclicstability test under a single strain, the high stability of the sensor was demonstrated undercontinuous and diverse strains (Figure 4d).
Nanomaterials 2022, 12, 972 6 of 12Nanomaterials 2022, 12, x FOR PEER REVIEW 6 of 12
Figure 3. (a) Optical image of the printed wind sensor on PEN and its (b) SEM image. (c–e) Simu-lation of the crack with the J integral method obtained from COMSOL (ver.5.6).
To investigate the sensing properties of the Ag/MWCNT composite printed on the PEN, we characterized the sensor with the applied strain under tension from 0.1% to 0.5% (Figure 4a). The gauge factor, defined as [G.F. = (ΔR/R0)/ε] [46,47], was calculated as 2.08 to determine the sensitivity of Ag/MWCNT composite strain sensors. Here, R0 denotes the resistance of the composite strain sensor without strain, ΔR denotes the resistance change under strain, and ε denotes the strain. This value is generally found in commercial strain sensors. In addition, we found the linearity of the sensor to be 90%, as shown in Figure 4b. To measure the response repeatability and durability according to line width, repeated stretching and release cycles were applied on the sensors. Figure 4c shows the resistance changes of the sensors, resulting in a fully recoverable electrical resistance without hyste-resis at 0.306% of stretching for 6000 cycles. In addition to the cyclic stability test under a single strain, the high stability of the sensor was demonstrated under continuous and di-verse strains (Figure 4d).
Figure 3. (a) Optical image of the printed wind sensor on PEN and its (b) SEM image. (c–e) Simulationof the crack with the J integral method obtained from COMSOL (ver.5.6).
Nanomaterials 2022, 12, 972 7 of 12Nanomaterials 2022, 12, x FOR PEER REVIEW 7 of 12
Figure 4. (a) A continuous variety of strains applied to the sensor. (b) continuous progressive in-put of different strain. (c) Durability of composites under 6000 cycles with low tensile defor-mation. Here, ∆R/R0 is a function of multiple bending and releasing cycles with 0.306% strain for Ag/MWCNT composites, where ∆R denotes the resistance differences under bending and release and R is the initial resistance in the relaxed state. (d) High stability of the sensor under continuous multiple strain cycles.
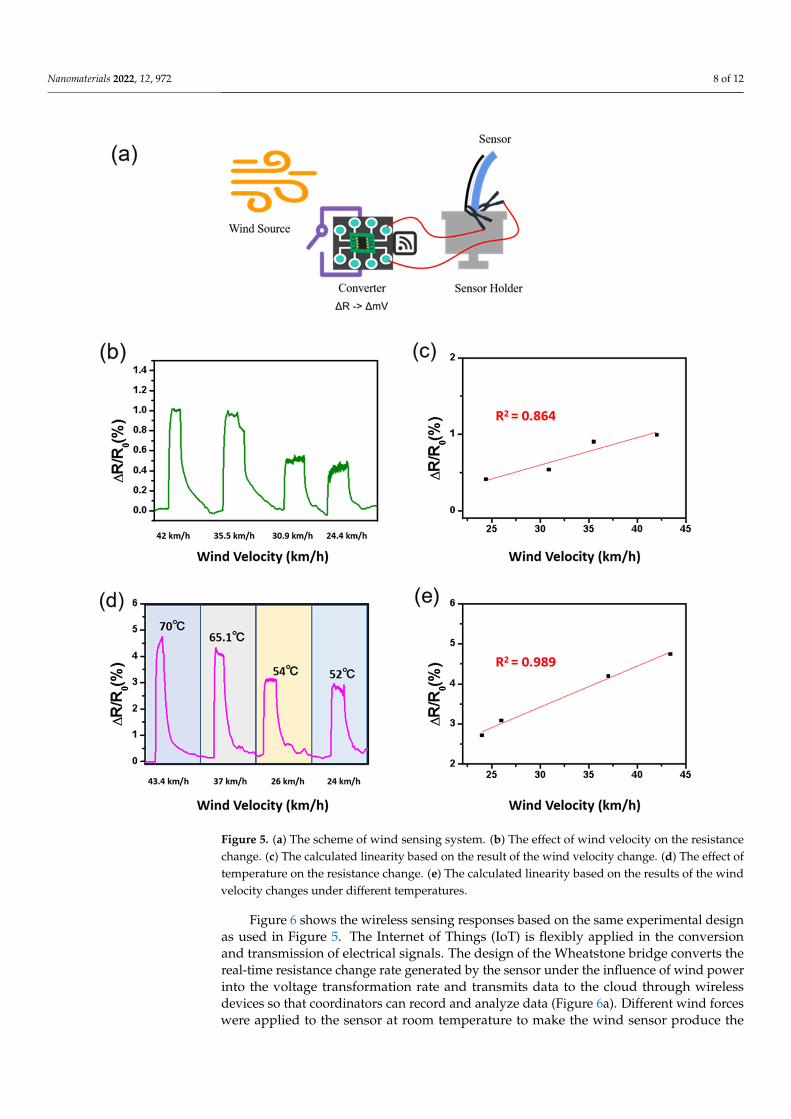
To measure the wind sensing ability of the screen-printed sensor based on the wind velocity and temperature, the sensor was adapted to a home-made sensing system with a wind gauge, as can be seen in Figure 5a. The wind velocity range was from 24.4 km/h to 42 km/h, while the sensing sensitivity was expressed as an average value measured per minute for each level. Figure 5b reveals the effects of wind velocity on resistance changes, resulting in decreased resistance with wind velocity. Since lower wind velocity induces lower applied pressure to the surface of the flexible sensor, this leads to decreased bending pressure. Figure 5c shows the linearity calculation, with the result found to be 86%, based on the result of the wind velocity change. This is lower than the 90% obtained in the bend-ing test, as shown in Figure 4a. Since the wind velocity causes sensor vibration during the measurement, stability issues may occur because of this side effect. We also investigated the sensing effect according to temperature change, using a range from 52 °C to 70 °C, at the same wind velocity shown in Figure 5d. As a result, the resistance change was in-creased to about 5 times higher than at room temperature due to the intrinsic properties of the metal hybrids. The linearity was 98%, as shown in Figure 5e, which was >10% higher than that of the wind velocity change at room temperature dur to the high thermal coeffi-cient of Ag. These results prove that the sensor is also sensitive to the temperature effect with precise linear sensing features.
Figure 4. (a) A continuous variety of strains applied to the sensor. (b) continuous progressive inputof different strain. (c) Durability of composites under 6000 cycles with low tensile deformation. Here,∆R/R0 is a function of multiple bending and releasing cycles with 0.306% strain for Ag/MWCNTcomposites, where ∆R denotes the resistance differences under bending and release and R is theinitial resistance in the relaxed state. (d) High stability of the sensor under continuous multiplestrain cycles.
To measure the wind sensing ability of the screen-printed sensor based on the windvelocity and temperature, the sensor was adapted to a home-made sensing system with awind gauge, as can be seen in Figure 5a. The wind velocity range was from 24.4 km/h to42 km/h, while the sensing sensitivity was expressed as an average value measured perminute for each level. Figure 5b reveals the effects of wind velocity on resistance changes,resulting in decreased resistance with wind velocity. Since lower wind velocity induceslower applied pressure to the surface of the flexible sensor, this leads to decreased bendingpressure. Figure 5c shows the linearity calculation, with the result found to be 86%, basedon the result of the wind velocity change. This is lower than the 90% obtained in thebending test, as shown in Figure 4a. Since the wind velocity causes sensor vibration duringthe measurement, stability issues may occur because of this side effect. We also investigatedthe sensing effect according to temperature change, using a range from 52 C to 70 C, atthe same wind velocity shown in Figure 5d. As a result, the resistance change was increasedto about 5 times higher than at room temperature due to the intrinsic properties of themetal hybrids. The linearity was 98%, as shown in Figure 5e, which was >10% higher thanthat of the wind velocity change at room temperature dur to the high thermal coefficientof Ag. These results prove that the sensor is also sensitive to the temperature effect withprecise linear sensing features.
Nanomaterials 2022, 12, 972 8 of 12Nanomaterials 2022, 12, x FOR PEER REVIEW 8 of 12
Figure 5. (a) The scheme of wind sensing system. (b) The effect of wind velocity on the resistance change. (c) The calculated linearity based on the result of the wind velocity change. (d) The effect of temperature on the resistance change. (e) The calculated linearity based on the results of the wind velocity changes under different temperatures.
Figure 6 shows the wireless sensing responses based on the same experimental de-sign as used in Figure 5. The Internet of Things (IoT) is flexibly applied in the conversion and transmission of electrical signals. The design of the Wheatstone bridge converts the real-time resistance change rate generated by the sensor under the influence of wind power into the voltage transformation rate and transmits data to the cloud through wire-less devices so that coordinators can record and analyze data (Figure 6a). Different wind forces were applied to the sensor at room temperature to make the wind sensor produce the corresponding strain. Figure 6b shows a comparison analysis diagram obtained using
Figure 5. (a) The scheme of wind sensing system. (b) The effect of wind velocity on the resistancechange. (c) The calculated linearity based on the result of the wind velocity change. (d) The effect oftemperature on the resistance change. (e) The calculated linearity based on the results of the windvelocity changes under different temperatures.
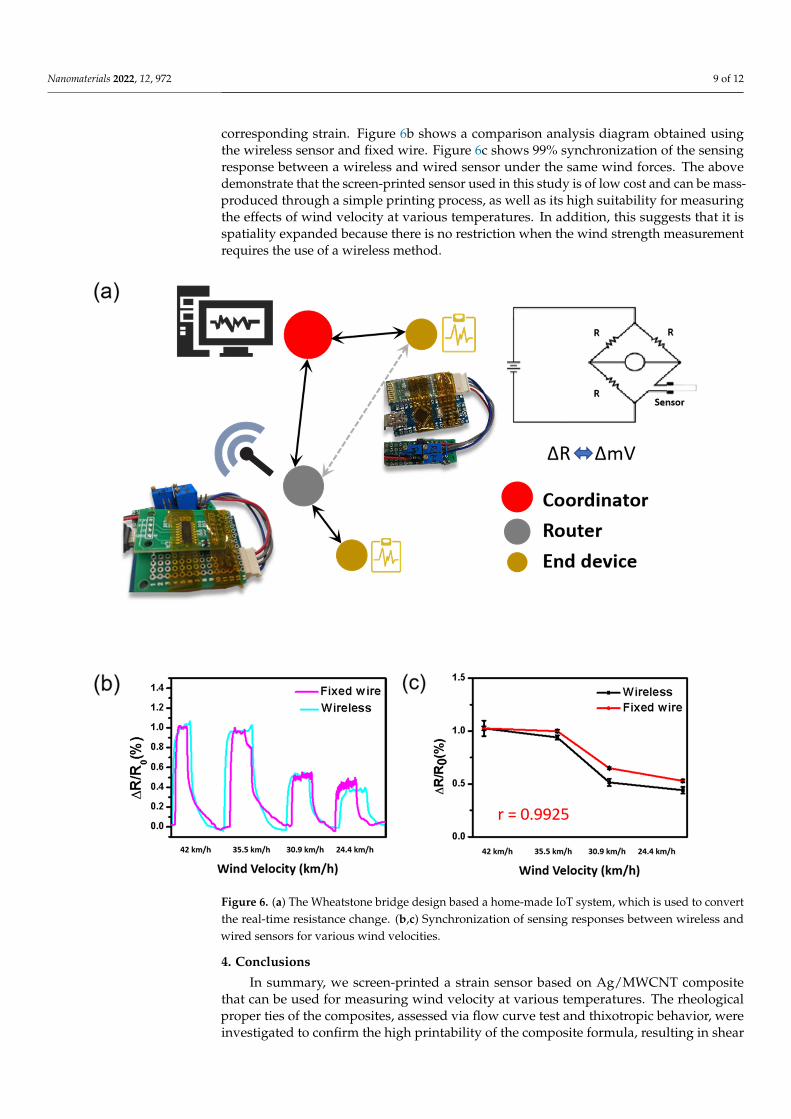
Figure 6 shows the wireless sensing responses based on the same experimental designas used in Figure 5. The Internet of Things (IoT) is flexibly applied in the conversionand transmission of electrical signals. The design of the Wheatstone bridge converts thereal-time resistance change rate generated by the sensor under the influence of wind powerinto the voltage transformation rate and transmits data to the cloud through wirelessdevices so that coordinators can record and analyze data (Figure 6a). Different wind forceswere applied to the sensor at room temperature to make the wind sensor produce the
Nanomaterials 2022, 12, 972 9 of 12
corresponding strain. Figure 6b shows a comparison analysis diagram obtained usingthe wireless sensor and fixed wire. Figure 6c shows 99% synchronization of the sensingresponse between a wireless and wired sensor under the same wind forces. The abovedemonstrate that the screen-printed sensor used in this study is of low cost and can be mass-produced through a simple printing process, as well as its high suitability for measuringthe effects of wind velocity at various temperatures. In addition, this suggests that it isspatiality expanded because there is no restriction when the wind strength measurementrequires the use of a wireless method.
Nanomaterials 2022, 12, x FOR PEER REVIEW 9 of 12
the wireless sensor and fixed wire. Figure 6c shows 99% synchronization of the sensing response between a wireless and wired sensor under the same wind forces. The above demonstrate that the screen-printed sensor used in this study is of low cost and can be mass-produced through a simple printing process, as well as its high suitability for meas-uring the effects of wind velocity at various temperatures. In addition, this suggests that it is spatiality expanded because there is no restriction when the wind strength measure-ment requires the use of a wireless method.
Figure 6. (a) The Wheatstone bridge design based a home-made IoT system, which is used to con-vert the real-time resistance change. (b,c) Synchronization of sensing responses between wireless and wired sensors for various wind velocities.
4. Conclusions In summary, we screen-printed a strain sensor based on Ag/MWCNT composite that
can be used for measuring wind velocity at various temperatures. The rheological proper
Figure 6. (a) The Wheatstone bridge design based a home-made IoT system, which is used to convertthe real-time resistance change. (b,c) Synchronization of sensing responses between wireless andwired sensors for various wind velocities.
4. Conclusions
In summary, we screen-printed a strain sensor based on Ag/MWCNT compositethat can be used for measuring wind velocity at various temperatures. The rheologicalproper ties of the composites, assessed via flow curve test and thixotropic behavior, wereinvestigated to confirm the high printability of the composite formula, resulting in shear
Nanomaterials 2022, 12, 972 10 of 12
thinning behavior and an 80% recovery ratio, which contributed to the high pattern fidelityduring the printing process. After confirming the composite’s properties in the properprinting process, we investigated the sensing properties of the printed sensor using abending test, resulting in a gauge factor (G.F.) of 2.08 with 90% linearity and high durabilityafter 6000 bending cycles. In addition, the sensor was suitable for measuring wind velocityat temperatures ranging from room temperature to 70 C, with 98% sensitivity, whichwas attributed to the intrinsic properties of the metal hybrids. Finally, we practicallydemonstrated that the performance of the IoT-based wireless sensor matched that of thewired sensor, making a case for the mass-production of low-cost screen-printed windsensors. Compared to other recent works, the wireless screen-printable flexible strainsensor revealed higher performance in terms of stability and applicability with a simpleproduction process. We believe its outstanding characteristics mean it will have widerapplication prospects.
Author Contributions: Conceptualization, X.Q. and S.L.; Methodology, X.Q. and S.L.; Validation,X.Q. and S.L.; Formal Analysis, X.Q.; Investigation, X.Q.; Data Curation, X.Q.; Writing—OriginalDraft Preparation, X.Q.; Writing—Review and Editing, S.L.; Visualization, X.Q. and S.L.; Supervision,S.L.; Project Administration, S.L.; Funding Acquisition, S.L. All authors have read and agreed to thepublished version of the manuscript.
Funding: This research was supported by the National Research Foundation of Korea (NRF), fundedby the Korean government (MSIT) (2021R1A2C1011248).
Institutional Review Board Statement: Not applicable.
Informed Consent Statement: Not applicable.
Data Availability Statement: Not applicable.
Acknowledgments: Not applicable.
Conflicts of Interest: The authors declare no conflict of interest.
References1. Martin, D.P.; Grant, J.J.; Ringwood, J.V. Evaluation of a prototype thermal anemometer for use in low airspeed drying measure
calculations. Flow Meas. Instrum. 2002, 12, 385–396. [CrossRef]2. Jones, H.G.; Hutchinson, P.A.; May, T.; Jamali, H.; Deery, D.M. A practical method using a network of fixed infrared sensors for
estimating crop canopy conductance and evaporation rate. Biosyst. Eng. 2018, 165, 59–69. [CrossRef]3. Timerman, D.; Barrett, S.C.H. Comparative analysis of pollen release biomechanics in Thalictrum: Implications for evolutionary
transitions between animal and wind pollination. New Phytol. 2019, 224, 1121–1132. [CrossRef] [PubMed]4. Crazzolara, C.; Ebner, M.; Platis, A.; Miranda, T.; Bange, J.; Junginger, A. A new multicopter-based unmanned aerial system for
pollen and spores collection in the atmospheric boundary layer. Atmos. Meas. Tech. 2019, 12, 1581–1598. [CrossRef]5. Arritt, R.W.; Clark, C.A.; Goggi, A.S.; Lopez Sanchez, H.; Westgate, M.E.; Riese, J.M. Lagrangian numerical simulations of canopy
air flow effects on maize pollen dispersal. Field Crops Res. 2007, 102, 151–162. [CrossRef]6. Gulec, F.; Atakan, B. A Molecular Communication Perspective on Airborne Pathogen Transmission and Reception via Droplets
Generated by Coughing and Sneezing. IEEE Trans. Mol. Biol. Multi-Scale Commun. 2021, 7, 175–184. [CrossRef]7. Raman, T.; Muthukathan, G. Field suppression of Fusarium wilt disease in banana by the combined application of native
endophytic and rhizospheric bacterial isolates possessing multiple functions. Phytopathol. Mediterr. 2015, 54, 241–252. [CrossRef]8. Aylor, D.E. The Role of Intermittent. Annu. Rev. Phytopathol. 1990, 28, 73–92. [CrossRef]9. Mao, Z.; Li, F.; Su, Q.; Fang, Z.; Xu, X.; Ding, Y. Application of energy-saving control strategy in air conditioning terminal
equipment based on constant temperature difference of chilled water. Case Stud. Therm. Eng. 2021, 28, 101409. [CrossRef]10. Yin, H.; Yang, C.; Yi, L.; Yu, J.; Wu, Y.; Deng, Y.; Tang, Z. Ventilation and air conditioning system of deep-buried subway station in
sub-tropical climates: Energy-saving strategies. Appl. Therm. Eng. 2020, 178, 115555. [CrossRef]11. Zhao, R.; Sun, S.; Ding, R. Conditioning strategies of indoor thermal environment in warm climates. Energy Build. 2004, 36,
1281–1286. [CrossRef]12. Wu, X.; Jiang, G.; Wang, X.; Xie, P.; Li, X. A Multi-Level-Denoising Autoencoder Approach for Wind Turbine Fault Detection.
IEEE Access 2019, 7, 59376–59387. [CrossRef]13. Wang, Y.; Ma, X.; Qian, P. Wind Turbine Fault Detection and Identification Through PCA-Based Optimal Variable Selection. IEEE
Trans. Sustain. Energy 2018, 9, 1627–1635. [CrossRef]14. Heier, S. Grid Integration of Wind Energy: Onshore and Offshore Conversion Systems; John Wiley & Sons: Hoboken, NJ, USA, 2014;
ISBN 1118703294.
Nanomaterials 2022, 12, 972 11 of 12
15. Bai, Y.; Meng, X.; Guo, H.; Liu, D.; Jia, Y.; Cui, P. Design and validation of an adaptive low-power detection algorithm forthree-cup anemometer. Meas. J. Int. Meas. Confed. 2021, 172, 108887. [CrossRef]
16. Suomi, I.; Vihma, T. Wind gust measurement techniques—From traditional anemometry to new possibilities. Sensors 2018,18, 1300. [CrossRef]
17. Wyngaard, J.C. Cup, Propeller, Vane, and Sonic Anemometers in Turbulence Research. Annu. Rev. Fluid Mech. 1981, 13, 399–423.[CrossRef]
18. Siebert, H.; Teichmann, U. Behaviour of an ultrasonic anemometer under cloudy conditions. Bound. Layer Meteorol. 2000, 94,165–169. [CrossRef]
19. Hong, W.; Cai, W.; Wang, S.; Tomovic, M.M. Mechanical wear debris feature, detection, and diagnosis: A review. Chin. J. Aeronaut.2018, 31, 867–882. [CrossRef]
20. Al-Rubaiai, M.; Tsuruta, R.; Gandhi, U.; Wang, C.; Tan, X. A 3D-printed stretchable strain sensor for wind sensing. Smart Mater.Struct. 2019, 28, 084001. [CrossRef]
21. Klopfenstein, R. Air velocity and flow measurement using a Pitot tube. ISA Trans. 1998, 37, 257–263. [CrossRef]22. Metters, J.P.; Kadara, R.O.; Banks, C.E. New directions in screen printed electroanalytical sensors: An overview of recent
developments. Analyst 2011, 136, 1067–1076. [CrossRef] [PubMed]23. Yeo, J.C.; Yap, H.K.; Xi, W.; Wang, Z.; Yeow, C.H.; Lim, C.T. Flexible and Stretchable Strain Sensing Actuator for Wearable Soft
Robotic Applications. Adv. Mater. Technol. 2016, 1, 1600018. [CrossRef]24. Zhang, Y.; Anderson, N.; Bland, S.; Nutt, S.; Jursich, G.; Joshi, S. All-printed strain sensors: Building blocks of the aircraft
structural health monitoring system. Sens. Actuators A 2017, 253, 165–172. [CrossRef]25. Shajari, S.; Mahmoodi, M.; Rajabian, M.; Karan, K.; Sundararaj, U.; Sudak, L.J. Highly Sensitive and Stretchable Carbon
Nanotube/Fluoroelastomer Nanocomposite with a Double-Percolated Network for Wearable Electronics. Adv. Electron. Mater.2020, 6, 1901067. [CrossRef]
26. Tas, M.O.; Baker, M.A.; Masteghin, M.G.; Bentz, J.; Boxshall, K.; Stolojan, V. Highly Stretchable, Directionally Oriented CarbonNanotube/PDMS Conductive Films with Enhanced Sensitivity as Wearable Strain Sensors. ACS Appl. Mater. Interfaces 2019, 11,39560–39573. [CrossRef]
27. Kanoun, O.; Müller, C.; Benchirouf, A.; Sanli, A.; Dinh, T.N.; Al-Hamry, A.; Bu, L.; Gerlach, C.; Bouhamed, A. Flexible carbonnanotube films for high performance strain sensors. Sensors 2014, 14, 10042–10071. [CrossRef]
28. Takei, K.; Yu, Z.; Zheng, M.; Ota, H.; Takahashi, T.; Javey, A. Highly sensitive electronic whiskers based on patterned carbonnanotube and silver nanoparticle composite films. Proc. Natl. Acad. Sci. USA 2014, 111, 1703–1707. [CrossRef]
29. Zhang, S.; Zhang, H.; Yao, G.; Liao, F.; Gao, M.; Huang, Z.; Li, K.; Lin, Y. Highly stretchable, sensitive, and flexible strain sensorsbased on silver nanoparticles/carbon nanotubes composites. J. Alloys Compd. 2015, 652, 48–54. [CrossRef]
30. Sivagami, A.; Jayakumar, S.; Kandavalli, M.A. Structural health monitoring using smart sensors. AIP Conf. Proc. 2020, 2281.[CrossRef]
31. Yao, J.; Hew, Y.Y.M.; Mears, A.; Huang, H. Strain Gauge-Enable Wireless Vibration Sensor Remotely Powered by Light. IEEE Sens.J. 2015, 15, 5185–5192. [CrossRef]
32. Abdulkarem, M.; Samsudin, K.; Rokhani, F.Z.; Rasid, M.F.A. Wireless sensor network for structural health monitoring: Acontemporary review of technologies, challenges, and future direction. Struct. Heal. Monit. 2020, 19, 693–735. [CrossRef]
33. Lynch, J.P. A Summary Review of Wireless Sensors and Sensor Networks for Structural Health Monitoring. Shock Vib. Dig. 2006,38, 91–128. [CrossRef]
34. Jo, H.; Park, J.W.; Spencer, B.F.; Jung, H.J. Develoment of high-sensitivity wireless strain sensor for structural health monitoring.Smart Struct. Syst. 2013, 11, 477–496. [CrossRef]
35. Choi, H.; Choi, S.; Cha, H. Structural Health Monitoring system based on strain gauge enabled wireless sensor nodes. InProceedings of the 2008 5th International Conference on Networked Sensing Systems, IKanazawa, Japan, 17–19 June 2008; pp.211–214. [CrossRef]
36. Vakis, A.I.; Yastrebov, V.A.; Scheibert, J.; Nicola, L.; Dini, D.; Minfray, C.; Almqvist, A.; Paggi, M.; Lee, S.; Limbert, G.; et al.Modeling and simulation in tribology across scales: An overview. Tribol. Int. 2018, 125, 169–199. [CrossRef]
37. Sahmani, S.; Fattahi, A.M. Development an efficient calibrated nonlocal plate model for nonlinear axial instability of zirconiananosheets using molecular dynamics simulation. J. Mol. Graph. Model. 2017, 75, 20–31. [CrossRef]
38. Jiang, Y.; He, Q.; Cai, J.; Shen, D.; Hu, X.; Zhang, D. Flexible Strain Sensor with Tunable Sensitivity via Microscale ElectricalBreakdown in Graphene/Polyimide Thin Films. ACS Appl. Mater. Interfaces 2020, 12, 58317–58325. [CrossRef]
39. Zymelka, D.; Togashi, K.; Kobayashi, T. Carbon-based printed strain sensor array for remote and automated structural healthmonitoring. Smart Mater. Struct. 2020, 29, 105022. [CrossRef]
40. Hu, N.; Karube, Y.; Yan, C.; Masuda, Z.; Fukunaga, H. Tunneling effect in a polymer/carbon nanotube nanocomposite strainsensor. Acta Mater. 2008, 56, 2929–2936. [CrossRef]
41. Vertuccio, L.; Vittoria, V.; Guadagno, L.; De Santis, F. Strain and damage monitoring in carbon-nanotube-based composite undercyclic strain. Compos. Part A Appl. Sci. Manuf. 2015, 71, 9–16. [CrossRef]
42. Giffney, T.; Bejanin, E.; Kurian, A.S.; Travas-Sejdic, J.; Aw, K. Highly stretchable printed strain sensors using multi-walled carbonnanotube/silicone rubber composites. Sens. Actuators A 2017, 259, 44–49. [CrossRef]

Nanomaterials 2022, 12, 972 12 of 12
43. Qi, X.; Ha, H.; Hwang, B.; Lim, S. Printability of the screen-printed strain sensor with carbon black/silver paste for sensitivewearable electronics. Appl. Sci. 2020, 10, 6983. [CrossRef]
44. Go, M.; Qi, X.; Matteini, P.; Hwang, B.; Lim, S. High resolution screen-printing of carbon black/carbon nanotube composite forstretchable and wearable strain sensor with controllable sensitivity. Sens. Actuators A 2021, 332, 113098. [CrossRef]
45. Pang, H.L.J.; Leggat, R.H. 2D Test Cases in Linear Elastic Fracture Mechanics; NAFEMS: Glasgow, UK, 1992.46. Liao, X.; Zhang, Z.; Liao, Q.; Liang, Q.; Ou, Y.; Xu, M.; Li, M.; Zhang, G.; Zhang, Y. Flexible and printable paper-based strain
sensors for wearable and large-area green electronics. Nanoscale 2016, 8, 13025–13032. [CrossRef] [PubMed]47. Qi, X.; Li, X.; Jo, H.; Sideeq Bhat, K.; Kim, S.; An, J.; Kang, J.W.; Lim, S. Mulberry paper-based graphene strain sensor for wearable
electronics with high mechanical strength. Sens. Actuators A 2020, 301, 111697. [CrossRef]
Top Related
Copyright © 2022 FDOKUMEN

