


Bahasa
Halaman
Hukum


A Robust and Effective Time-Independent Route to the Calculation ofResonance Raman Spectra of Large Molecules in Condensed Phaseswith the Inclusion of Duschinsky, Herzberg−Teller, Anharmonic, andEnvironmental EffectsFranco Egidi,† Julien Bloino,†,‡ Chiara Cappelli,§ and Vincenzo Barone*,†
†Scuola Normale Superiore, Piazza dei Cavalieri 7, 56126 Pisa, Italy‡Consiglio Nazionale delle Ricerche, Istituto di Chimica dei Composti Organometallici, UOS di Pisa, Via G. Moruzzi 1, 56124 Pisa,Italy§Dipartimento di Chimica e Chimica Industriale, Universita di Pisa, via Risorgimento 35, 56126 Pisa, Italy
*S Supporting Information
ABSTRACT: We present an effective time-independentimplementation to model vibrational resonance Raman (RR)spectra of medium−large molecular systems with the inclusionof Franck−Condon (FC) and Herzberg−Teller (HT) effectsand a full account of the possible differences between theharmonic potential energy surfaces of the ground and resonantelectronic states. Thanks to a number of algorithmicimprovements and very effective parallelization, the fullcomputations of fundamentals, overtones, and combinationbands can be routinely performed for large systems possiblyinvolving more than two electronic states. In order to improvethe accuracy of the results, an effective inclusion of the leadinganharmonic effects is also possible, together with environ-mental contributions under different solvation regimes. Reduced-dimensionality approaches can further enlarge the range ofapplications of this new tool. Applications to imidazole, pyrene, and chlorophyll a1 in solution are reported, as well ascomparisons with available experimental data.
1. INTRODUCTION
Resonance Raman spectroscopy (RR) has received muchattention in recent years and has found applications in manyareas such as analytical chemistry1 and the study of metalcomplexes2 and biological systems.3−5 The first distinguishingfeature that RR shows with respect to nonresonant Raman isthe so-called resonance enhancement:6 the intensity of thescattered radiation is 103−106 higher than the intensity of theregular Raman signal. This property facilitates experimentalmeasurements and, in most cases, also causes the resultingspectrum to be free from any “contamination” arising from thenonresonant Raman signal, which has a much smaller intensity.Resonance enhancement is also responsible for granting RRspectroscopy other peculiar features. Since it is due to theinteraction of the incoming radiation with an electronictransition of the system, a RR spectrum carries informationabout the excited state(s). Traditionally, the methods of choiceto study excited-state properties of molecules are UV−visabsorption and fluorescence spectroscopies. Both thesemethods have two disadvantages: First, because of the naturallyshort lifetime of some excited states, and because of theinhomogenous broadening caused by the environment, the
bandwidth of most electronic transitions is usually very broad,especially in the case of molecules in solution. This “dilutes” theinformation that could be extracted from the spectrum, and it isusually difficult to record vibrationally resolved electronicspectra, even though the band-shape may be dominated by thevibronic structure. In RR, the bandwidth only depends on theinitial and final states,6 which both belong to the ground statepotential energy surface (PES), therefore the peaks’ width iscomparable to the case of a nonresonant Raman spectrum.Another advantage of RR over traditional one-photon spectros-copies is that it is a vibrational spectroscopy, whence it is mucheasier to extract structural information about the system. Asecond consequence of the resonance enhancement is that onlythe molecular vibrations that are affected by the electronictransitions (in particular, those vibrations that involve atomsclose to the chromophore) will be visible in the spectrumbecause all other vibrational modes will not benefit from theenhancement and will have negligible intensity. This property isheavily exploited in the study of biological macromolecules,4,5
Received: October 25, 2013Published: December 13, 2013
Article
pubs.acs.org/JCTC
© 2013 American Chemical Society 346 dx.doi.org/10.1021/ct400932e | J. Chem. Theory Comput. 2014, 10, 346−363

in which one may tune the incident radiation’s frequency toone particular chromophore within the system, obtaininginformation about the corresponding region of the macro-molecule; if a regular Raman or infrared spectrum is recorded,the high number of vibrational transitions of the molecule willproduce an “overcrowded” spectrum which would be difficultto interpret.All such characteristic features of RR have stimulated the
research in this field, both experimentally6 and theoretically,7
but there is still much work to be done in both areas. In thiscontribution, we present our work on the time-independent(TI) implementation of RR spectra8 within a general-purposequantum chemistry program, with an emphasis on thecomputational applicability and scaling of the method withrespect to system size. The implementation was designed as anintegrated module in the multifrequency virtual spectrometerunder development in our group;9 in this way, it can takeadvantage of the various features already present such as thehandling of large systems through reduced-dimensionalityschemes, the modeling of the solvation environment, andanharmonicity. The present work is organized as follows: afteran introduction on the theoretical framework of RR, theinclusion of anharmonicity and of environmental effects isdiscussed. As an illustration of the versatility and reliability ofour procedure, we analyze the spectra of three differentsystems: imidazole, pyrene, and chloropyll a1.
2. RESONANCE RAMAN SCATTERINGCROSS-SECTION
Raman scattering can be formally thought of as a two-photonphenomenon where incident electromagnetic radiation isinelastically scattered by the system, which can either absorb(Stokes scattering) or release (anti-Stokes scattering) energy.The ability of a molecular system to give rise to Ramanscattering is related to its transition polarizability tensor10
between two different vibrational states belonging to the sameelectronic level. The Raman cross-section can be easilycomputed once the transition polarizability is known. Forisotropic media it can be expressed as a combination of threeisotropic invariants corresponding to the mean isotropicpolarizability, the symmetric anisotropy, and the antisymmetricanisotropy, defined as11 (summation over repeated indices isimplied):
α α
α α α α
α α
=
= −
=
*
* *
*
a
g
d
19
Re
12
Re(3 )
32
Re
aa bb
ab ab aa bb
ab ab
2 s s
2 s s s s
2 a a(1)
where αs and αa are the symmetric and antisymmetriccomponents of the polarizability tensor. For example, in thecase of 90° scattering with an incident radiation of frequency ωperpendicularly polarized with respect to the scattering plane,and an unpolarized scattered radiation,12 we have
σ πω
′ + ⊥ ⊥ =+ +
ca g d
( /2, , )45 7 5
45s s i s
4
4
2 2 2
(2)
where ωs = ω − ωfi is the angular frequency of the scatteredradiation. These expressions are general and are applicable toboth the resonant and nonresonant cases. One importantdifference, however, is that the nonresonant transition polar-
izability is symmetric, giving a vanishing contribution from thed2 term. There are several methods for the calculation of theRR polarizability, with different levels of approximations. Thetheoretical framework of RR can be traced back to the work ofPlaczek,13 who obtained sum-over-state formulas for the Ramantransition polarizability in the resonant and nonresonant casesstarting from the perturbation expansion of the wave function,and later Albrecht,14 who gave separate expressions for thevarious contributions of the polarizability arising from theexpansion of the transition dipole moments. The RRpolarizability can then be written as a sum-over-state expressionas follows:10
∑αμ μ
ω ω γ =
ℏ
⟨ | | ′⟩⟨ ′| | ⟩
− −αβα β
′
f m m i
i1
m mi (3)
where ⟨f | and |i⟩ represent the final and initial vibrational states,respectively, ωmi = ωm − ωi is the energy difference betweenthe middle and initial states, μα and μβ are the Cartesiancomponents of the transition dipole moments between theground and excited electronic states, γ is the excited state’sphenomenological damping constant, and the (infinite)summation runs over all vibrational states m′ belonging tothe excited state PES. An equivalent expression for the RRpolarizability can be obtained in the time domain:15−17
∫α μ μ =ℏ
⟨ | | ⟩αβ α βω ω γ
∞− ′ ℏ + −i
f i te e diH t i t t
0
/ ( )i
(4)
Both the time-dependent and the time-independent expres-sions require a model for the ground and excited PESs, and forthe transition electric dipole moment. Usually the harmonicapproximation is invoked for both states, but even though ageometry optimization followed by a harmonic analysis can beroutinely performed for the ground state with most electronicstructure methods, the same task may prove to be much moredifficult in the case of an excited state and often requires anumerical differentiation of the energy gradient, which is muchmore time-consuming. For this reason, further approximationsare often invoked and most calculations of RR spectra assumethat both states have the same normal modes and harmonicfrequencies and differ only in the equilibrium geometry, thisassumption being known as the independent mode displacedharmonic oscillator18 (IMDHO) model. The IMDHO modelhas been extensively used to compute RR spectra,19−24 basedon either the time-dependent or the time-independentformulations. Additional methods used for the calculation ofRR spectra can be derived by further manipulation of the time-dependent expression, which can be viewed as an equation forthe motion of the starting vibrational wavepacket on the excitedstate PES. Under short-time dynamics conditions,15−17 it ispossible to write the relative RR peak intensity as a ratiobetween the excited-state gradients calculated along the normalmodes under consideration.25−28 The latter method is thesimplest one for computing RR spectra and requires neither asum-over-state calculation nor the evaluation of a half-Fouriertransform. Following an alternative treatment, which also relieson the short-time dynamics approximation, it is possible toevaluate the RR spectrum by computing the geometricalderivative of the complex electronic polarizability underresonance conditions using linear response theory,29−34
similarly to what is commonly done to compute frequency-dependent nonresonant Raman intensities, but with theadditional complication that the finite lifetime of the excited
Journal of Chemical Theory and Computation Article
dx.doi.org/10.1021/ct400932e | J. Chem. Theory Comput. 2014, 10, 346−363347

state must be included in the calculation to avoid thesingularities that appear in the undamped linear responseequation. It should be clear from this brief discussion that thereis currently a profusion of widely different methods that areused to compute RR spectra, each based on differentassumptions and presenting its own challenges and advantages,and there are also a few works in the literature that haveattempted to compare them against each other and also withrespect to experimental data.20,35,36 However, the majority ofRR spectra calculations present in the literature still relies onthe IMDHO model to describe the excited-state PES. Thisprovides a rather unbalanced description of the two statesinvolved since a geometry optimization followed by a fullharmonic analysis is performed for the ground state, whereasonly the gradients are usually computed for the excited state. Ifthe excited state’s normal modes are computed, the integralswhich appear in the TI or TD polarizability expressions cannotbe straightforwardly computed since the harmonic wavefunctions of the two PESs are expressed in different basissets. In order to solve this problem, in the case of semirigidmolecules without large-amplitude motions,37 the excited statenormal modes can be related to the ones of the ground state viaan affine transformation known as the Duschinsky relation:38
′ = +Q QJ K (5)
where Q and Q′ are the ground and excited state normalmodes, respectively, and J and K are the Duschinsky matrix andthe shift vector. By means of the Duschinsky relation, it ispossible to write down explicit equations that allow thecalculation of RR intensities in both the TI and TDframeworks.8,39−41 As already pointed out, the most straightfor-ward way to compute the Duschinsky matrix is to perform ageometry optimization followed by a vibrational analysis forboth states. This method is often called Adiabatic Hessian(AH),42 but it is not the only way to obtain a meaningfuldescription of the excited state normal modes. Indeed, thevibrational analysis for the excited state may also be performedat the ground state equilibrium geometry, and the shift vectorcan be extrapolated from the gradient, a method known asVertical Hessian (VH).42,43 If the harmonic approximation isexact, then the two methods are equivalent; otherwise thechoice of using one or the other depends on whether one needsa better description of the vertical region or the minimum ofthe excited PES. If the Duschinsky rotation is ignored andexcited-state frequencies are not computed, the simplifiedmethods known as Vertical Gradient (VG) and Adiabatic Shift(AS) are obtained. In the first one, only the excited-stategradient at the ground-state equilibrium geometry is computed,whereas for the second one the excited-state geometry isoptimized, but the shape of the PES is then assumed to be thesame as in the ground state.2.1. Time-Independent Calculation of the RR Polar-
izability. In this work, we chose the time-independentapproach for the calculation of the RR polarizability tensor.The transition dipole moments that appear in eq 3 can beexpanded in a Taylor series with respect to the excited-statenormal modes around the molecule’s equilibrium geometry.Keeping only the terms up to the second order in thepolarizability we obtain
∑
∑
∑
α μ μω ω γ
μ μω ω γ
μ μω ω γ
μ μω ω γ
μ μω ω γ
μ μω ω γ
=ℏ
⟨ | ′⟩⟨ ′| ⟩
− −
+ ⟨ | ′| ′⟩⟨ ′| ⟩
− −+
⟨ | ′⟩⟨ ′| ′| ⟩− −
+ ⟨ | ′| ′⟩⟨ ′| ′| ⟩
− −+
⟨ | ′⟩⟨ ′| ′ ′| ⟩− −
+ ⟨ | ′ ′| ′⟩⟨ ′| ⟩
− −
′
⎡⎣⎢
⎛⎝⎜
⎞⎠⎟
⎛⎝⎜
⎞⎠⎟⎟⎤⎦⎥⎥
f m m ii
f Q m m i
i
f m m Q i
i
f Q m m Q i
i
f m m Q Q i
i
f Q Q m m i
i
1
m
aa
aa
a
aba b
a bab
a b
aba b
0 0mi
0mi
0mi
mi0
mi
0mi (6)
where μa and μab are the transition dipole moment first andsecond derivatives with respect to the normal modes. This wayof writing the expansion of the polarizability allows one to drawa parallel with the nonresonant Raman polarizability, which isexpanded directly in a Taylor series up to at least the first order(and more, whenever anharmonicity effects are considered).The zeroth and first order dipole expansion terms that appearin the resonant case are commonly referred to as Franck−Condon (FC) and Herzberg−Teller (HT), therefore the termsthat appear in the polarizability expression can be classified asmixed FC−FC, FC−HT, etc. terms, which can be consideredthe different orders in the expansion of the RR polarizability inthe normal modes. The full second order of the polarizabilitycontains a HT−HT term, and two FC−D2 terms (where D2refers to the second order derivative of the transition dipolemoment). In this work, we stop the dipole expansion up to theHT terms, therefore the polarizability contains all FC−FC,FC−HT, and HT−HT terms. Note that in these expressionsthe dipole moments are expanded with respect to the excitedstate normal modes (all quantities referring to the excitedelectronic state are denoted by an apex). This choice allows fora simplification of the formulas to calculate the requiredHerzberg−Teller integrals, and if HT can be considered a goodapproximation, the two approaches are equivalent. Theinclusion of HT terms is especially crucial in the case ofsymmetry-forbidden transitions, or transitions with a very lowoscillator strength, while their inclusion may be forgone in thecase of strongly allowed transitions.The integrals that appear in eq 6 can be computed
recursively.44−46 The time-independent formulation of the RRpolarizability has been implemented within the Gaussian suitedevelopment version47 by taking advantage of the featurespreviously developed for one-photon spectra calculation,48,49
and in particular for one-photon absorption (OPA) whichrequires the very same transition integrals as RR. As alreadymentioned, the time-independent scheme requires a truncationof the summation in eq 6 in order to be of any use. There is inprinciple an infinite number of middle states ⟨m′|, therefore weneed to screen them to select beforehand the states that areexpected to give the greatest contribution to the dipoleintegrals. We have accomplished this by using a class-basedmethod, described in refs 42 and 48−51. The convergence ofeach Raman peak’s calculation can be gauged by evaluating theexpression obtained by neglecting the denominator contribu-tion in eq 6 both numerically and analitically, as described in ref8. Alternative methods for the screening of integrals have alsobeen proposed.52−54 While the prescreening method attemptsto reduce the number of middle states that need to be includedin the calculation, their number can still be significant and doesscale with the size of the system. Fortunately, each middle statecontributes independently to the total sum-over-state, thereforeeq 6 can be implemented in an effective parallel way, allowing
Journal of Chemical Theory and Computation Article
dx.doi.org/10.1021/ct400932e | J. Chem. Theory Comput. 2014, 10, 346−363348

us to apply our procedure to systems of medium and large size,without the need to introduce further approximations. Morespecifically, the middle states are separated into “classes” ofexcitations according to the number of simultaneously excitedmodes, and the contribution of a class is computed beforemoving to the next. Within each class, the calculation is splitbetween all available processors, using a shared-memory OpenMulti-Processing (OpenMP) protocol, and each processortreats a different family of middle states ⟨m′|, where by familywe intend a set of states with the same simultaneously excitedoscillators, hence differing only by the number of non-nullquanta for each mode. The number of states belonging to aclass grows very rapidly with the class order, which makes it thebottleneck of the calculation. Parallelizing the latter step canspeed up the calculation almost linearly with the number ofprocessors. Additionally, each Raman peak can be computedindependently of the others, therefore the evaluation of thedifferent band intensities can also be parallelized if multiplemachines are available.The TI formulation has a few advantages. Since the recursion
formulas used to compute the FC integrals are completelygeneral, it is possible to compute the intensity of overtone andcombination bands up to any order and the computational costfor a combination band is not significantly higher with respectto a fundamental band (though the raw number of possiblecombinations grows rapidly with the maximum allowedquantum number and with system size). This also allows thestraightforward inclusion of temperature effects in thecalculation, since this requires one to select a finite numberof different initial states according to their Boltzmannpopulation. Finite temperature spectra may contain a greaternumber of bands, whose computation can also be parallelized.The efficient implementation of the FC integral calculation,along with the parallelization of the code, allows us to apply theTI picture with the Duschinsky and temperature effects tosystems of medium−large size. Note that as the size of thesystem increases and we wish to keep intact the level of theory(i.e., inclusion of Duschinsky mixing), the actual RR spectrumcalculation will never be the bottleneck of the wholecomputation since the excited-state vibrational analysis is byfar the most demanding step (see section 8 for a specificexample). The applicability of our method can therefore beextended to ever-larger systems by reducing the cost of thelatter step, e.g. by using a more affordable basis set or even byestimating the second derivatives using semiempirical methods,or running the various steps involved in the numericaldifferentiation on separate machines.
3. ANHARMONICITY EFFECTSEven though peaks’ intensities carry information about theexcited electronic state of the system, RR can still be considereda vibrational spectroscopy since the transition involves twovibrational states belonging to the same PES. While a harmonicdescription of the ground-state PES to model vibrationalspectroscopies can give good qualitative results, inclusion ofanharmonic effects is often needed to achieve sufficientaccuracy to allow a direct comparison with experimentalresults. This is especially true in the case of RR because peakpositions are determined by the energies of the vibrationalstates, and it has been shown55−57 that anharmonicity can havehuge effects, resulting in shifts of as much as 150 cm−1 for C−Hstretchings, and, more crucially, anharmonicity can affect theordering of the vibrational modes, which can lead to erroneous
peak assignments. The anharmonicity of the PES also affectsspectroscopic intensities, as demonstrated in many works in thecase of infrared and vibrational circular dichroism spec-tra.55,58−62 In the case of nonresonant Raman spectroscopy,the inclusion of anharmonic contributions on the intensitiescalls for both an anharmonic description of the PES and theinclusion of additional terms in the Taylor expansion of theRaman polarizability as a function of the normal modes ofvibration up to the third order (the so-called electricalanharmonicity).55 In the TI picture of RR, the transitiondipole moment is instead expanded as a Taylor series, givingrise to Franck−Condon, Herzberg−Teller, and possibly higherterms, so the inclusion of anharmonicity rests on the soledescription of the vibrational states. An additional challengefaced in the case of RR is the fact that intensities rely on anaccurate description of the excited state PES in addition to theground-state one, and if performing a complete harmonicvibrational analysis for an excited state can itself be quitedemanding, going beyond the harmonic approximation canprove to be truly Herculean, unless the excited state can becomputationally treated like a ground state, e.g., whenever it hasa different symmetry or spin multiplicity with respect to the“true” ground state, or in cases like photon-induced ionizationswhere an electron is removed from the system. Anharmonicityeffects can be included at different levels of approximation andwith different methods.63,64 In this work, we used ourimplementation65−68 of second order vibrational perturbationtheory (VPT2) which can provide an accurate description ofboth anharmonic vibrational energies and wave functions. InVPT2, the perturbed wave functions are expressed as linearcombinations of harmonic states, and in order to use this kindof expression in calculation of Franck−Condon integrals, wewould have to perform a large number of computations foreach RR peak, with a prohibitive computational cost, barring forthe smallest molecules. Because we are interested in applyingour methodology to medium−large sized systems, we chooseinstead to limit the treatment of anharmonicity effects to thevibrational energies, which are employed in eq 6, in place of theharmonic ones, with no additional computational cost for thevibronic part. As already pointed out, computing the excited-state anharmonic frequencies with a full VPT2 treatment iscomputationally too expensive and can only be done inconjunction with an electronic structure method for whichanalytical second derivatives of the excitation energy areavailable. We choose instead to use the ground-stateanharmonic frequencies to estimate the excited-state ones,following the scheme proposed by some of us.64 Since ingeneral the excited-state normal modes differ from the ground-state ones, the anharmonic shifts computed for the lattercannot be directly applied to the former. To solve this problem,we compute the scaling factors between the harmonic ground-state energies and their anharmonic counterparts and then usethe Duschinsky transformation to estimate the correspondingscaling factors for the excited state. The estimated excited stateanharmonic frequencies can then be written as64
∑ωωω
ω′ = ′⎛⎝⎜⎜
⎞⎠⎟⎟Jb
aba
a
ab
anh 2anh
harmharm
(7)
Empirical scaling factors are commonly used to estimateanharmonicity effects for the ground state, and in fact they havealso been used in the context of RR calculations.25,69−71
Computing the scaling factors using vibrational perturbation
Journal of Chemical Theory and Computation Article
dx.doi.org/10.1021/ct400932e | J. Chem. Theory Comput. 2014, 10, 346−363349

theory, as opposed to using empirical ones, poses notransferability problems and is therefore much more suitedfor the estimation of the excited-state frequencies. The excited-state anharmonic frequencies are then inserted into eq 6 alongwith the ground-state ones and are also used in the recursionformulas used to compute the Franck−Condon integrals. It isworth noting that anharmonic frequencies are systematicallylower than their harmonic counterparts, therefore if anharmo-nicity effects were included only in the ground state vibrationalenergies, the denominators in eq 6 would increase, leading tosystematically lower absolute intensities. Because the anharmo-nicity shift tends to be much higher for higher-energy modes,this effect is also heterogeneous along the spectrum, leading toan error in the relative intensities, in addition to the absoluteones. It is therefore crucial that anharmonicity effects beincluded for both electronic states.This method of treating the anharmonicity of excited states
can be validated by applying the full VPT2 treatment to excitedstates which, because of symmetry or other reasons, require noTDDFT response calculations. It should be noted that ourvibronic method is not applicable in cases where there is a verylarge change in geometry and normal modes of the excited statewith respect to the ground state’s because in that case theDuschinsky transformation is not sufficient to faithfully describethe relation between the two sets of normal modes. Tosummarize, our method for estimating anharmonic frequenciesin the excited state seems suitable for those systems for whichthe vibronic spectrum can be computed in this framework. Tosupport our claim, we computed the anharmonic frequencies ofimidazole in its ground singlet state and in its first triplet (T0)and ionized (D0) states. We then computed the Duschinskymatrix and the anharmonic shifts for the T0 and D0 states usingeq 7 and compared the results.While this method of treating anharmonic effects exonerates
us from the calculation of high-order geometric derivatives ofthe excitation energy, computing the anharmonic frequenciesfor the ground state alone is still very demanding and scalesunfavorably with system size. Fortunately, RR spectroscopy canbenefit greatly from the use of a reduced-dimensionalityscheme. Usually one is only interested in a specific region ofthe spectrum, therefore it is not necessary to compute theanharmonic frequencies of the normal modes which lie outsideof it. Computationally, this means that the energy Hessian needonly be computed after displacing the molecular geometryalong the selected normal modes rather than the full ensemble,with a proportional saving in computational time. Unless themodes that are not included in the anharmonic treatment arevery strongly anharmonic and strongly coupled to the selectedmodes, the discarded terms contribute marginally to theanharmonic correction and can safely be eliminated, so peakpositions are almost unaffected.72,73 In addition, a very smalleffect on the computed RR intensities can be expected becausethe harmonic frequencies will be used in place of theanharmonic ones for the nonselected modes in eq 6. In ourexamples, the effect of anharmonicity on intensities is not verybig, therefore we can safely apply our reduced dimensionalityscheme in the most complex cases.
4. ENVIRONMENTAL EFFECTS ON RESONANCERAMAN SPECTRA
Though some reports of RR spectra of molecules in the gasphase exist,74−77 RR spectral measurements are most oftenperformed on molecules in solution or more complex
environments. The connection between the RR spectralresponse and the molecular environment is in fact so strongthat RR measurements have been used to evaluate solventreorganization energies associated with the electronic tran-sition.78−80 The most evident environmental effect on thespectrum is the change in the positions of the peaks, related tothe change in the vibrational energies, which can be quitesignificant.56 This change is one of the consequences of thechange in the PESs and, by extension, in the vibrational wavefunctions that enter eq 3, causing a change in the intensity ofthe peaks, as well as their positions. Therefore, we need asuitable computational protocol able to model the effects of theenvironment on all these parameters, having the capability ofaccurately calculating the energies, geometries, frequencies, andvibrational wave functions of the system. While theserequirements can be met by means of numerical algorithms,there are other issues which have to be solved before the modelcan be considered suitable for modeling RR spectroscopy. Bylimiting ourselves to solvated systems (similar considerationsalso apply to generic systems composed of a core moleculeinteracting with an external environment), it should be takeninto account that RR scattering is a dynamical process.Therefore, the response of the solvent to the core systeminteracting with the external field will occur at different timescales, depending on the different degrees of freedom of thesolvent molecules surrounding the core system. This results inboth homogeneous and inhomogenous broadening effects ofthe spectral response caused by the presence of the solvatingenvironment.81 The component of the solute−solvent inter-action that acts at the polarizability level can be modeled byincluding an additional time-dependent dephasing term in theexponent of eq 4, and if this is simplified by a constant term,there is a resulting increase in the observed value for thedamping constant γ that appears in eq 3, so it can no longer beattributed solely to the finite lifetime of the excited electronicstate. The choice of an appropriate value for the dampingconstant to be used in the spectrum simulation shouldtherefore take into account the experimental conditions. Inaddition, the spectral peaks will also be broadened because ofthe presence of the solvent, and this latter effect can beempirically considered by using an arbitrarily chosen line shape,such as a Gaussian or Lorentzian distribution function.Coming back to the modeling of solvent effects on PESs,
vibrational wave functions, and electronic excited states, apossible strategy consists in performing QM calculations withinthe framework of the Polarizable Continuum Model(PCM),82,83 which has been used in the past to model solventeffects in the context of RR spectroscopy.8,21,26,84−88 PCM is aso-called focused model, which treats the solvent as acontinuum polarizable dielectric medium that hosts the solutemolecule, treated quantum mechanically, within a molecule-shaped cavity. The presence of the polarizable continuum altersthe solute electronic density, via an effective solvent-dependentterm in the molecular Hamiltonian, which in turn affects thesolvent response, until self-consistency, which finally results inmutual solute−solvent polarization effects. Besides such directeffects on the molecular electronic wave function, the presenceof the continuum dielectric also alters the solute PES, i.e. itsequilibrium geometry, vibrational frequencies, and normalmodes, resulting in a change in RR peaks’ positions, but italso affects all excited state properties required in RRcalculations (i.e., transition dipole moments, excited stateforces, etc.).
Journal of Chemical Theory and Computation Article
dx.doi.org/10.1021/ct400932e | J. Chem. Theory Comput. 2014, 10, 346−363350
PCM has been extensively used to model solvent effects onboth vibrational and electronic spectroscopies thanks to thedevelopment of algorithms to include solvent contributions inthe different terms entering eq 3.The peculiar nature of RR as a mixed vibrational-electronic
property calls for care when considering the solvent timeevolution, in order to correctly account for the dynamicalaspects of the solute−solvent interaction,89 which differ ifpurely electronic,90,91 vibrational,57,92 or mixed electronic/vibrational phenomena89,93 are considered.In the simple case of electronic absorption spectra, a possible
(and most often used) partition of the solvent response to theelectronic changes in the solute assumes the solvent electronicdegrees of freedom to quickly equilibrate to the time-evolvingsolute electronic density, whereas the rest stay equilibrated tothe unaltered ground state solute charge density, thus resultingin a nonequilibrium solute−solvent regime.89−91 The same alsoapplies to vibrational spectroscopies;57,92 however the partitionof the solvent response has to be done differently, because boththe electronic and vibrational solvent degrees of freedom can, inthis case, follow the solute charge density evolving in time. Thisformally results in a different definition of the nonequilibriumsolvation regime.57,61,94
Unlike simple one-photon (electronic or vibrational)absorption, RR is at the same time a vibrational and anelectronic phenomenon, therefore the definition of thephysically consistent solvation regime to be used in thecalculation of the RR polarizability is to be done with care.89 Byadopting a time-dependent picture, the RR polarizability can beseen as originating from the evolution in time of the startingvibrational wavepacket on the excited state PES. Therefore,depending on the time scale of such an evolution, it might beassumed that some of the solvent’s nuclear degrees of freedomremain static. To simulate such behavior within the PCMframework, extension of the vibrational nonequilibriumapproach92,95 to excited states, within the further account ofelectronic nonequilibrium effects, would be necessary. Such amodel has never been proposed so far. In this paper, in order topartially account for such effects, we will assume the PCMcavity to stay fixed, i.e., the geometrical arrangement of thesolvent stays equilibrated to the solute equilibrium geometry.This implies that the PCM cavity geometric derivatives will bediscarded in the evaluation of excitation energy gradients and/or Hessians. As far as the ground state is concerned, we willinstead make use of the aforementioned vibrational non-equilibrium regime.57,92 It is worth remarking that the use of afixed cavity cannot completely freeze the solvent’s nucleardegrees of freedom, because the nuclear solvent response,which contributes to the PCM excited state computedproperties, is evaluated within the nuclear equilibrium regime.A further approximation which we will exploit in the followingconsists of performing a numerical differentiation of the(electronic) nonequilibrium excitation energy, where eachatom is displaced along each Cartesian coordinate first in thepositive and then in the negative direction, and the derivative isthen computed numerically. The PCM cavity is also kept fixed.A univocal assessment of the (nuclear + electronic) solvationregime to be exploited in modeling RR spectra is far fromtrivial. Therefore, in the following, we will compare threedifferent approaches to compute the parameters required for aRR calculation:1. Equilibrium solvation: All solvent degrees of freedom are
equilibrated with the solute. Both ground state and excitation
properties are computed in this manner, and the PCM cavity ismobile.2. Fixed cavity: The PCM cavity is kept fixed in the
calculation of all energy derivatives, for both the ground stateand excitation properties, where the former are computedunder the vibrational nonequilibrium regime and the latter arecomputed in the electronic equilibrium solvation regime.3. Nonequilibrium: In addition to keeping the cavity fixed,
the vertical excitation energy is computed under (electronic)nonequilibrium conditions and is numerically differentiated.The choice of the solvation regime should also be coherent
with the treatment of the excited-state PES: in an adiabaticscheme, where the excited-state geometry is optimized and thePCM cavity is displaced along with it during the optimization,the equilibrium solvation should be selected. The other tworegimes can be used in vertical treatments (VG or VH). Inorder to apply the other two solvation regimes to adiabaticschemes, the excited-state geometry optimization must also beperformed with a fixed PCM cavity.
5. COMPUTATIONAL DETAILS
All DFT, RR, and vibronic absorption calculations wereperformed using a development version of the Gaussian suiteof quantum chemistry programs.47 The B3LYP96,97 functionalis adopted for imidazole and chlorophyll a1, while PBE098 isused in the case of pyrene, following previous studiesestablishing this functional as appropriate for this system.87
Some test computations on pyrene were also performed withthe CAM-B3LYP99 and the M06-2X100 functionals. The basisset was chosen taking each system’s size and consequentcomputational cost of each task into account. For imidazole, theaug-cc-pVTZ basis set101 was used for all calculations; forpyrene and chlorophyll a1, the ground-state harmonicfrequencies were computed with the double-ζ SNSD basisset,102 whereas anharmonic effects and excited-state frequencieswere computed with the smaller 6-31G* basis set.Solvent effects were taken into account using the Polarizable
Continuum Model (PCM).82,83 The PCM cavity was builtusing a system of interlocking spheres with the following radiiexpressed in Ångstroms: 1.443 for hydrogen, 1.926 for carbon,1.830 for nitrogen, 1.7500 for oxygen, and 1.5105 formagnesium, each multiplied by a factor of 1.1. The solvents’static and optical dielectric constants used are ε0 = 78.36 andε∞ = 1.78 for water, ε0 = 35.69 and ε∞ = 1.81 for acetonitrile,and ε0 = 32.61 and ε∞ = 1.77 for methanol.All Complete Active Space Self-Consistent Field (CASSCF)
and Multi-State Complete Active Space Second-OrderPerturbation Theory (MS-CASPT2)103 calculations wereperformed using the MOLCAS package (version 7.8).104−106
6. IMIDAZOLE IN AQUEOUS SOLUTION
Imidazole was chosen for its role in biological systems andbecause its small size and solubility in water allow for a veryextensive analysis of the various contributions to the finalspectra and of the different levels of approximation involved.For our study, we focused on the very bright π−π* transition,which appears around 210 nm. Because this transition isstrongly allowed,107 we performed our calculations at the FClevel.
6.1. Anharmonicity Effects. As already mentioned,imidazole is an ideal candidate to illustrate our method fortreating anharmonicity effects in RR spectroscopy. We
Journal of Chemical Theory and Computation Article
dx.doi.org/10.1021/ct400932e | J. Chem. Theory Comput. 2014, 10, 346−363351

performed the full VPT2 anharmonic analysis65−68 forimidazole in its ground S0 state and first triplet state T0, andfor the radical cation ImH+ in the lowest-energy D0 state. Thecalculations in each case involve a geometry optimization (seeFigure 1 for the three optimized geometries), followed by the
calculation of harmonic force constants (to obtain the normalmodes of vibration), and finally the numerical differentiationsof the energy Hessian.From the harmonic analysis of the three species, it is possible
to compute the Duschinsky matrix and shift vector that relatethe normal modes of the cation and the triplet to the normalmodes of the singlet. Using eq 7, the anharmonic frequencies ofthe ground singlet state were used to estimate the anharmonicfrequencies of the cation and triplet, which were compared totheir VPT2 counterparts to assess the validity of our scalingscheme. The results are reported in Table 1. The anharmonicfrequencies obtained with the Duschinsky method are inexcellent agreement with the VPT2 ones in the case of thedoublet cation, with an average deviation of 0.4% and amaximum deviation of 1.1% for normal mode 15. A muchlarger deviation is observed in the case of the triplet state, withdeviations as high as 43% for the first normal mode. Thisbehavior can be explained from the observation of the
optimized structures (Figure 1). The optimized structure forthe triplet state presents a significant pyramidalization of twoatoms in the ring, resulting in a different molecular symmetry.The normal modes of the triplet state are poorly described interms of the singlet state normal modes using a simple affinetransformation such as the Duschinsky relation, leading to avery dense Duschinsky matrix (see the Supporting Informationfor a pictorial representation of the Duschinsky matrices), withmany elements of significant magnitude for each row (orcolumn). In this case, our vibronic model is not applicable.From these results, it is reasonable to suggest that this methodof estimating anharmonic frequencies rests upon the sameassumptions behind the vibronic model itself; i.e., there shouldbe a limited structural deformation associated with theelectronic transition.Figure 2 shows the harmonic and anharmonic RR spectra
calculated for an incident wavelength of 224 nm, a damping of500 cm−1, and peaks convoluted with Gaussian functions with ahalf-width at half-maximum (HWHM) of 10 cm−1. The spectrawere scaled to have the same maximum intensity to comparethem more easily. As expected, anharmonic bands aresystematically red-shifted with respect to the harmonic ones,and there is also a significant difference in the computedrelative peak intensities. Notice also that in the anharmonicspectrum there is a very small peak at 1136 cm−1 which, in theharmonic spectrum, is obscured by the intense peak close to it.We finally note that imidazole is a small system; i.e. it has alimited number of vibrational modes, thus the resultingspectrum is relatively simple. For more complex systems, thecombination of peak displacements and changes in relativeintensities can potentially lead to notable differences in thebandshapes.
Figure 1. Optimized structures of imidazole (singlet), imidazole cation(doublet), and imidazole (triplet).
Table 1. Comparison between VPT2 Anharmonic Frequencies and the Ones Estimated with the Anharmonic Scaling SchemeBased on the Duschinsky Transformationa
ImH S0 (Cs) ImH+ D0 (Cs) ImH T0 (C1)
# Sym Harm VPT2 Harm VPT2 Dusch. % dev Harm VPT2 Dusch. % dev
1 A″ 540 533 496 491 487 0.78 201 137 196 43.142 A″ 647 633 544 531 534 0.73 404 328 394 20.153 A″ 683 673 707 690 694 0.70 467 392 455 16.004 A″ 743 724 799 778 781 0.42 599 545 586 7.425 A′ 827 810 825 806 810 0.57 736 611 719 17.806 A″ 885 864 890 872 871 0.20 809 775 793 2.257 A′ 908 895 923 907 908 0.14 832 801 815 1.868 A″ 946 932 936 917 913 0.42 914 865 892 3.149 A′ 1073 1049 964 942 944 0.26 916 871 895 2.7510 A′ 1093 1069 1043 1018 1021 0.24 1008 966 982 1.7211 A′ 1144 1121 1125 1105 1100 0.47 1049 1025 1024 0.0512 A′ 1159 1133 1212 1186 1184 0.21 1107 1074 1080 0.5813 A′ 1286 1261 1265 1242 1237 0.45 1262 1232 1229 0.2514 A′ 1363 1323 1295 1270 1267 0.22 1305 1271 1272 0.1115 A′ 1427 1389 1416 1365 1380 1.12 1358 1317 1322 0.4016 A′ 1499 1470 1453 1415 1421 0.41 1396 1346 1366 1.4517 A′ 1556 1524 1539 1494 1506 0.79 1541 1507 1501 0.3718 A′ 3242 3115 3235 3112 3109 0.09 3110 2988 2984 0.1319 A′ 3244 3118 3241 3116 3115 0.04 3180 3054 3055 0.0520 A′ 3272 3145 3248 3124 3122 0.05 3230 3083 3105 0.6921 A′ 3652 3484 3565 3399 3401 0.07 3467 3223 3325 3.17
aImH denotes neutral imidazole. ImH+ is the radical cation. Note that the optimized structure for the triplet state of imidazole has a differentsymmetry with respect to the singlet; the symmetry labels therefore do not apply in this case.
Journal of Chemical Theory and Computation Article
dx.doi.org/10.1021/ct400932e | J. Chem. Theory Comput. 2014, 10, 346−363352

6.2. Effect of the Solvation Regime. As pointed outpreviously, solvent effects can be crucial in RR spectroscopy,and the choice of the solvation regime is of particular relevance.Because of water’s high polarity, the distinction betweenequilibrium and nonequilibrium solvation can have verydramatic consequences on spectroscopic properties. As alreadypointed out in section 4, for RR, as well as vibrationallyresolved absorption and fluorescence spectra, it is necessary tomake a distinction between electronic and vibrational non-equilibrium solvation, depending on which degrees of freedomof the solvent are allowed to relax and thus remain atequilibrium with the solute evolving with a time scalecharacteristic of the spectroscopic phenomenon. In theframework of a time-dependent picture, the vibronic structurecharacteristic of any electronic excitation and the RR responsearise from the evolution of the initial vibrational wavepacket onthe excited state PES, which may last long enough to allow forthe relaxation of the solvent’s electronic (and, possibly, nuclear)degrees of freedom. The choice of the most appropriatesolvation regime depends on the system and is by no meanstrivial. We have investigated the effect of the differentapproaches on RR and vibrationally resolved OPA spectra ofimidazole in water by performing the calculations under thethree distinct conditions described in section 4. First, weconsidered the solvent in full equilibrium with the system, bothin its electronic and nuclear degrees of freedom. Then weconsidered the effect of keeping the PCM cavity fixed (wherethe vibrational nonequilibrium regime is employed in thecomputation of the harmonic or anharmonic vibrationalground-state frequencies and normal modes), and finally weperformed the calculation with the addition of electronicnonequilibrium effects on excited state properties. Note that wealso included anharmonicity effects in all cases.Electronic and nuclear nonequilibrium affects the computed
spectra at different levels. Keeping the PCM cavity fixed onlyinfluences the calculation of the gradients (and, if required,Hessian and higher order derivatives) of the ground stateenergy and excitation energy that are used to model the PESs.Conversely, under equilibrium conditions, it is necessary toinclude in the derivatives additional terms accounting for thedisplacement of the cavity. This effect does not change thevertical energy or dipole strength of the transition (the latteraccounted for by the FC terms), since neither involves anygeometrical derivatives but affects the shape of the excited-statePES and the HT and higher terms in the Taylor expansion of
the dipole moments. It should be clear that the question of thevibrational nonequilibrium does not arise in the modeling ofone-photon spectroscopies (e.g., absorption and fluorescence)unless one is interested in the vibronic band shape but is alwayspresent in the case of RR, for which even the simplestcomputational models require the calculation of the excitedstate gradient. Electronic nonequilibrium has a more dramaticeffect, as it influences the calculated vertical excitation energiesand can even affect the order of the excitations. Figure 3 shows
the computed vibronic OPA spectra, the RR excitation profile(i.e., a plot of the RR intensity against the incident frequency ata fixed Raman shift) corresponding to the eighth normal mode(an in-plane bending motion, see the Supporting Informationfor a pictorial representation of the normal modes mentionedthroughout the article), and the RR spectrum, under the threesolvation regimes discussed in section 4. All spectra werecomputed at the Vertical-Gradient Franck−Condon (VG|FC)level, with the inclusion of anharmonic effects. Each band in thevibronic OPA spectrum was convoluted with a Gaussianfunction with a HWHM of 150 cm−1, while the peaks in the RRspectra were convoluted with Gaussian functions with aHWHM of 10 cm−1. The RR and RR excitation profile spectraemploy a value for the damping constant of 500 cm−1. Allspectra are shown in arbitrary units. The RR spectra werecomputed for an incident wavelength of 224 nm and, since weare more interested in comparing relative intensities rather than
Figure 2. Harmonic (continuous red line) and anharmonic (dashedblue line) RR spectra of imidazole in water.
Figure 3. UV−vis (top panel), RR excitation profile (middle panel),and RR spectra (bottom panel) of imidazole in water calculated withthree different solvation regimes: equilibrium solvation (finely dashedblue line), fixed cavity (dashed orange line), and nonequilibrium(continuous green line).
Journal of Chemical Theory and Computation Article
dx.doi.org/10.1021/ct400932e | J. Chem. Theory Comput. 2014, 10, 346−363353

absolute ones, they were subsequently scaled to have the samemaximum intensity.All three vibronic OPA spectra show a similar convolution;
the lowest energy band corresponds to the 0−0 transition,while the other bands arise mainly from the superposition ofdifferent peaks corresponding to transitions from the vibra-tional ground state to a combination of normal modes 11, 13,14, and 15 in the excited state PES. The spectra show that thereis only a slight change when the PCM cavity is held fixed(dashed orange line), and the resulting spectrum is almostsuperimposed to the spectrum obtained with a mobile cavity.The position of the peaks is expected to be almost identical inthe two cases, as keeping the cavity fixed does not directly affectthe vertical transition energy. The same behavior is observed inthe case of the RR excitation profile. The RR spectrum insteadshows a much more pronounced difference: the position of thepeaks is heavily influenced by the solvation regime employed tocompute the ground state anharmonic frequencies, with asmaller yet clearly discernible effect on relative intensities. Amuch larger change can be observed in the case of theelectronic nonequilibrium: in this case, the vertical transitionenergy is blueshifted by about 1500 cm−1 (roughly 7.5 nm),and both the OPA spectrum and the RR excitation profileappear translated. In addition, the relative intensities of theabsorption peaks are affected by the variation of the solvationregime, and the same behavior is observed in the excitationprofile. The change in both intensity patterns is a consequenceof the change in the computed excited-state forces under thetwo different solvation regimes. The RR spectrum shows a verydifferent behavior, as there is very little change with respect tothe fixed-cavity regime. The position of the peaks is a propertyof the ground state, therefore it is not influenced by the wayexcitation properties are calculated, and while a small change inthe intensity pattern is noticeable, it is by no means assignificant as in the case of the RR excitation profile, thoughthis depends upon the chosen incident wavelength.These results highlight the nature of RR spectroscopy as a
mixed electronic-vibrational phenomenon which is heavilyinfluenced by the environment and the choice of solvationregime.6.3. Comparison with Experimental Results. So far we
have analyzed the effect of anharmonicity and solvationenvironment employing the simplest model for the vibronictransition (VG|FC). Before comparing our results withexperimental data, we needed to study the effect of Duschinskymixing on the spectrum. To do so, we compared theanharmonic (VH|FC) RR spectrum with the (VG|FC) onerepresented as a dashed orange line in Figure 3 (whithin thefixed-cavity solvation regime). The results are represented inFigure 4a. Of course, peak positions are unaffected by theintroduction of Duschinsky mixing, but relative intensitiesexperience significant changes.The comparison with experimental data is complicated by
the great number of parameters involved. First, one has tochoose an incident frequency and a suitable damping constant,which can assume a wide range of different values. The incidentfrequency may be chosen to differ from the calculated verticalenergy by the same amount as the experimental laser frequencydiffers from the measured absorption maximum.87 If theabsorption spectrum is very broad, this method may not bevery precise. Note also that a lower damping constant maycause the spectrum to depend more strongly upon the chosenincident frequency.8 In addition, the solvation regime greatly
affects both the vertical transition energy and the RR intensitypattern. The comparison may be greatly facilitated if both theexperimental RR spectrum and RR excitation profile areavailable. We compare our results with the experimental ones ofBalakrishnan et al.108 (see Figure 4b), who measured the RRspectrum at an excitation wavelength of 229 nm, whichcorresponds to the very start of the absorption band ofimidazole. The comparison of the experimental spectrum withthe calculated VH one (Figure 4a) shows that peak positionsare reproduced well enough to permit an assignment. The bandthat appears around 1100 cm−1 is enhanced with respect to theexperimental one, while the one at 1260 cm−1 has a lower thanexpected intensity. Otherwise the agreement is fairly good, andthe VH spectrum shows a better agreement with experimentalresults than the VG one, owing to the effect of Duschinskymixing. The small peaks between 1050 and 1150 cm−1 are in-plane bending motions of the C−H bonds;108 they are notvisible in the theoretical spectrum because of their negligiblecalculated intensity or because they are obscured by the higher-intensity peak at 1100 cm−1. One possible source of errors maybe that imidazole in water can form hydrogen bonds withsolvent molecules, whose effect is not fully captured by ourimplicit solvation model. A way to overcome this limitation isto use atomistic models for the environment, such as the QM/FQ/PCM model we have recently implemented.109−111
Because the experimental incident frequency is on the tail ofthe absorption band shape, there may also be contaminationfrom the nonresonant Raman spectrum.
7. PYRENE IN ACETONITRILE SOLUTIONThe RR spectra of pyrene (D2h symmetry) and its derivativeshave been previously studied both experimentally112 andtheoretically.87,113,114 In this contribution, we wish to drawupon the previous work by some of us87 and expand it byincluding anharmonicity and nonequilibrium solvent effects inthe spectrum calculation. The interesting property of the RRspectra of pyrene is the interference between different excitedstates. Contrary to what happens in the case of OP spectra, inRR the contributions from different electronic states must beadded at the amplitude (polarizability) level rather than at theintensity level (the Raman cross section is quadraticallydependent on the polarizability). The result is that the totalspectrum is not simply the sum of the spectra arising from thedifferent electronic states. The three excited states that should
Figure 4. Calculated VG|FC (top, solid green line) and VH|FC (top,dashed purple line) RR spectra and experimental108 (bottom, blackline) RR spectrum of imidazole in water.
Journal of Chemical Theory and Computation Article
dx.doi.org/10.1021/ct400932e | J. Chem. Theory Comput. 2014, 10, 346−363354

be taken into consideration are, in order of increasing energy,the 1B1u, 2B2u, and 2B1u states.87,112 In the case of pyrenecalculations, we chose the intermediate solvation regime, withground state harmonic and anharmonic frequency calculationsperformed with vibrational nonequilibrium effects, and we keptthe cavity fixed in all calculations involving the excited states.We performed a ground state geometry optimization followedby a normal mode calculation at the PBE0/SNSD102 level oftheory. We also optimized the ground-state geometry andcomputed the anharmonic vibrational frequencies using thesmaller 6-31G* basis set in order to obtain them at a reducedcomputational cost. The PBE0/SNSD harmonic frequencieswere combined with the PBE0/6-31G* anharmonic shifts toobtain the anharmonic vibrational energies to be used in thesubsequent RR calculations. The PBE0/6-31G* level of theorywas also used for all excited-state calculations, and the modelchosen for the excited PESs is AH, which requires a geometryoptimization followed by harmonic frequency calculations. AllRR spectra were computed using a damping constant of 500cm−1, and the RR peaks were convoluted with Gaussianfunctions with a HWHM of 15 cm−1.As already pointed out, it is not essential to accurately
reproduce the excitation energy to compute a RR spectrumbecause the incident frequency used in the calculation can beeasily adjusted to compensate for this error. However,whenever multiple states are involved, it may be crucial tocorrectly reproduce the energy difference between the states.For example, a spectrum may contain peaks which areenhanced by resonance with different electronic states, and ifthe energy difference between those states is overestimated, itmay be impossible to find an incident frequency for which allpeaks are visible. A comparison between the experimental andtheoretical vibronic absorption spectrum can be used to checkthe reliability of the chosen electronic structure model.Moreover, if the vibronic resolution is clearly visible in theexperimental spectrum, the latter can be used to extract theenergy of the 0−0 transitions for each electronic state, andthose energies can then be employed in the calculation of theRR spectra. This is the case of pyrene, whose experimental andcalculated vibronic absorption spectra are shown in Figure 5.While the bandshapes are correctly reproduced, the calculatedspectrum is not merely shifted with respect to the experimentalone because the energy of the 1B1u state is underestimated by alarger amount with respect to the 2B2u and 2B1u states. Tocompensate for this error, we therefore shifted the energy ofeach state individually before computing the RR spectra andexcitation profiles.We also checked whether other DFT functionals or a
multireference method would yield better results. We thereforecomputed the vertical excitation energies using the CAM-B3LYP99 and M06-2X100 functionals with the SNSD basis set,as well as by MS-CASPT2103 with the ANO basis set with thecontraction 4s3p1d for carbon atoms and 2s1p for hydrogenatoms.115,116 A full valence π space which comprised 16electrons distributed in 16 orbitals (16,16) was used. The DFTcalculations included solvent effects by means of PCM, whilethe MS-CASPT2 calculations were performed for the moleculein the gas phase, so we also computed the excitations withPBE0 without PCM, to estimate the solvent shift. The PBE0/SNSD ground state optimized geometry was used in all cases.The calculated vertical transition energies cannot be directlycompared with the energy of the 0−0 transition obtained fromthe experimental spectrum, though their difference can be
estimated theoretically from the vibronic spectrum calculatedwith the PBE0 functional, giving 2690 cm−1 for the 1B1u state,2188 cm−1 for the 2B2u state, and 2967 cm−1 for the 2B1u state.These values were then subtracted from the calculated verticalexcitation energies. Table 2 summarizes the results. M06-2X
gives the best results for the excitation energies, however it hasbeen shown that it is less reliable for calculation of harmonicfrequencies. 117 Therefore we still preferred to use PBE0 tocompute all spectra because, as shown in Figure 5 and in theanalysis by Avila Ferrer et al.,87 this functional gives a very gooddescription of the shape of the PESs. The MS-CASPT2 resultsdo not show a significant improvement with respect to theTDDFT ones, though they lack a description of solvationeffects which, as can be seen from the comparison of the gas-phase and acetonitrile solution results obtained for PBE0, give alarge contribution.Often the resolution of the experimental spectrum is not
sufficient to clearly identify the energy of the 0−0 transition(especially if the states are very close in energy and their spectraoverlap). In that case, it may be useful to perform additionalcalculations with different electronic structure methods toestimate the energy differences between the excited states.To show the effect of the excitation-energy shift and of
anharmonicity on the RR spectrum, we computed the harmonicand anharmonic spectra using the PBE0/SNSD excitationenergy, as well as the anharmonic spectrum calculated using the
Figure 5. Experimental (top black line) and calculated (bottom lines)vibronic absorption spectra of pyrene in acetonitrile. The dashed redline is the unshifted spectrum (PBE0/SNSD band positions); thecontinuous blue line is the shifted spectrum according to theexperimental transition energies.
Table 2. Energies of the 0−0 Transitions (in cm−1)Computed with Different Methods and Their ExperimentalCounterparts112a
stateMS-
CASPT2 PBE0(g) PBE0CAM-B3LYP M06-2X exptl112
1B1u 25 688 27 333 25 773 27 219 27 700 29 9402B2u 36 180 35 271 33 761 35 944 35 931 36 7652B1u 41 469 40 768 38 328 39 527 39 902 41 667
aPBE0(g) denotes gas-phase excitation energies, while all otherTDDFT results include solvent effects.
Journal of Chemical Theory and Computation Article
dx.doi.org/10.1021/ct400932e | J. Chem. Theory Comput. 2014, 10, 346−363355
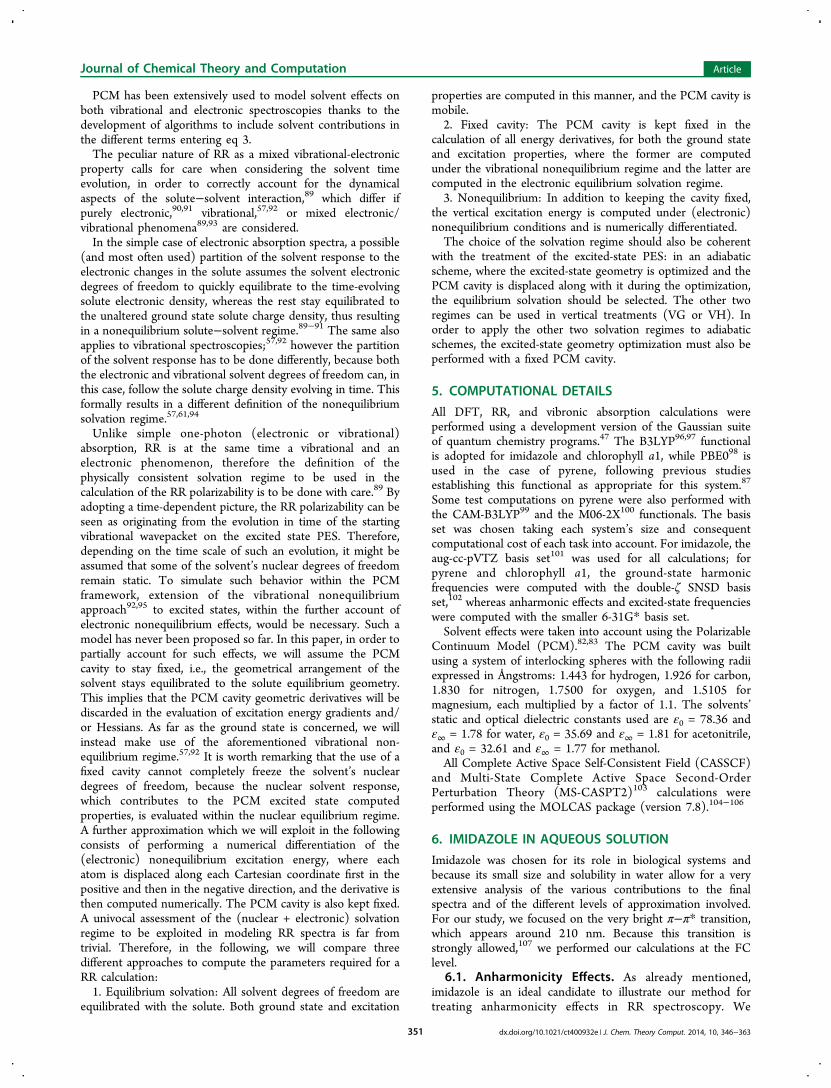
excitation energies from experimental data. We chose anincident frequency of 42 000 cm−1 (238 nm) to compute thelatter spectrum and an incident frequency of 39 500 cm−1 (253nm) to compute the two former ones (in order to adjust theenergy of the 2B1u state without touching the energydifferences, as would be normally done). The incident energyis at the edge of the 2B1u band in the experimental spectrum inFigure 5, so it is affected by interference with the lower-energy2B2u state. Figure 6 shows the results. As in the case of
imidazole, anharmonicity causes a red shift of all bands, as wellas minor intensity changes. The spectrum computed using theexperimental excitation energies shows an additional change inintensity, especially visible for the band that appears around1700 cm−1. These kinds of effects are not very big in the case ofpyrene because there is quite a large separation between thethree electronic states, but they may be more relevant in caseswhere the energy difference between the states is grosslyoverestimated or underestimated by the chosen electronicstructure method.
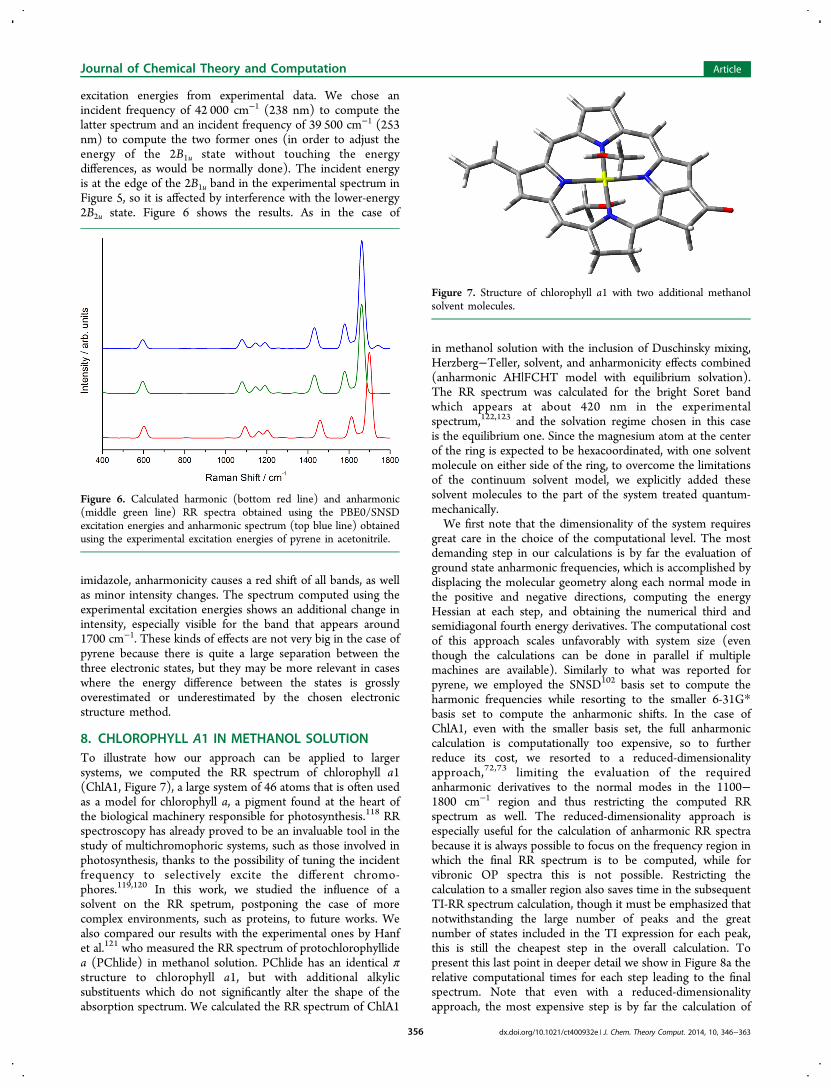
8. CHLOROPHYLL A1 IN METHANOL SOLUTIONTo illustrate how our approach can be applied to largersystems, we computed the RR spectrum of chlorophyll a1(ChlA1, Figure 7), a large system of 46 atoms that is often usedas a model for chlorophyll a, a pigment found at the heart ofthe biological machinery responsible for photosynthesis.118 RRspectroscopy has already proved to be an invaluable tool in thestudy of multichromophoric systems, such as those involved inphotosynthesis, thanks to the possibility of tuning the incidentfrequency to selectively excite the different chromo-phores.119,120 In this work, we studied the influence of asolvent on the RR spetrum, postponing the case of morecomplex environments, such as proteins, to future works. Wealso compared our results with the experimental ones by Hanfet al.121 who measured the RR spectrum of protochlorophyllidea (PChlide) in methanol solution. PChlide has an identical πstructure to chlorophyll a1, but with additional alkylicsubstituents which do not significantly alter the shape of theabsorption spectrum. We calculated the RR spectrum of ChlA1
in methanol solution with the inclusion of Duschinsky mixing,Herzberg−Teller, solvent, and anharmonicity effects combined(anharmonic AH|FCHT model with equilibrium solvation).The RR spectrum was calculated for the bright Soret bandwhich appears at about 420 nm in the experimentalspectrum,122,123 and the solvation regime chosen in this caseis the equilibrium one. Since the magnesium atom at the centerof the ring is expected to be hexacoordinated, with one solventmolecule on either side of the ring, to overcome the limitationsof the continuum solvent model, we explicitly added thesesolvent molecules to the part of the system treated quantum-mechanically.We first note that the dimensionality of the system requires
great care in the choice of the computational level. The mostdemanding step in our calculations is by far the evaluation ofground state anharmonic frequencies, which is accomplished bydisplacing the molecular geometry along each normal mode inthe positive and negative directions, computing the energyHessian at each step, and obtaining the numerical third andsemidiagonal fourth energy derivatives. The computational costof this approach scales unfavorably with system size (eventhough the calculations can be done in parallel if multiplemachines are available). Similarly to what was reported forpyrene, we employed the SNSD102 basis set to compute theharmonic frequencies while resorting to the smaller 6-31G*basis set to compute the anharmonic shifts. In the case ofChlA1, even with the smaller basis set, the full anharmoniccalculation is computationally too expensive, so to furtherreduce its cost, we resorted to a reduced-dimensionalityapproach,72,73 limiting the evaluation of the requiredanharmonic derivatives to the normal modes in the 1100−1800 cm−1 region and thus restricting the computed RRspectrum as well. The reduced-dimensionality approach isespecially useful for the calculation of anharmonic RR spectrabecause it is always possible to focus on the frequency region inwhich the final RR spectrum is to be computed, while forvibronic OP spectra this is not possible. Restricting thecalculation to a smaller region also saves time in the subsequentTI-RR spectrum calculation, though it must be emphasized thatnotwithstanding the large number of peaks and the greatnumber of states included in the TI expression for each peak,this is still the cheapest step in the overall calculation. Topresent this last point in deeper detail we show in Figure 8a therelative computational times for each step leading to the finalspectrum. Note that even with a reduced-dimensionalityapproach, the most expensive step is by far the calculation of
Figure 6. Calculated harmonic (bottom red line) and anharmonic(middle green line) RR spectra obtained using the PBE0/SNSDexcitation energies and anharmonic spectrum (top blue line) obtainedusing the experimental excitation energies of pyrene in acetonitrile.
Figure 7. Structure of chlorophyll a1 with two additional methanolsolvent molecules.
Journal of Chemical Theory and Computation Article
dx.doi.org/10.1021/ct400932e | J. Chem. Theory Comput. 2014, 10, 346−363356
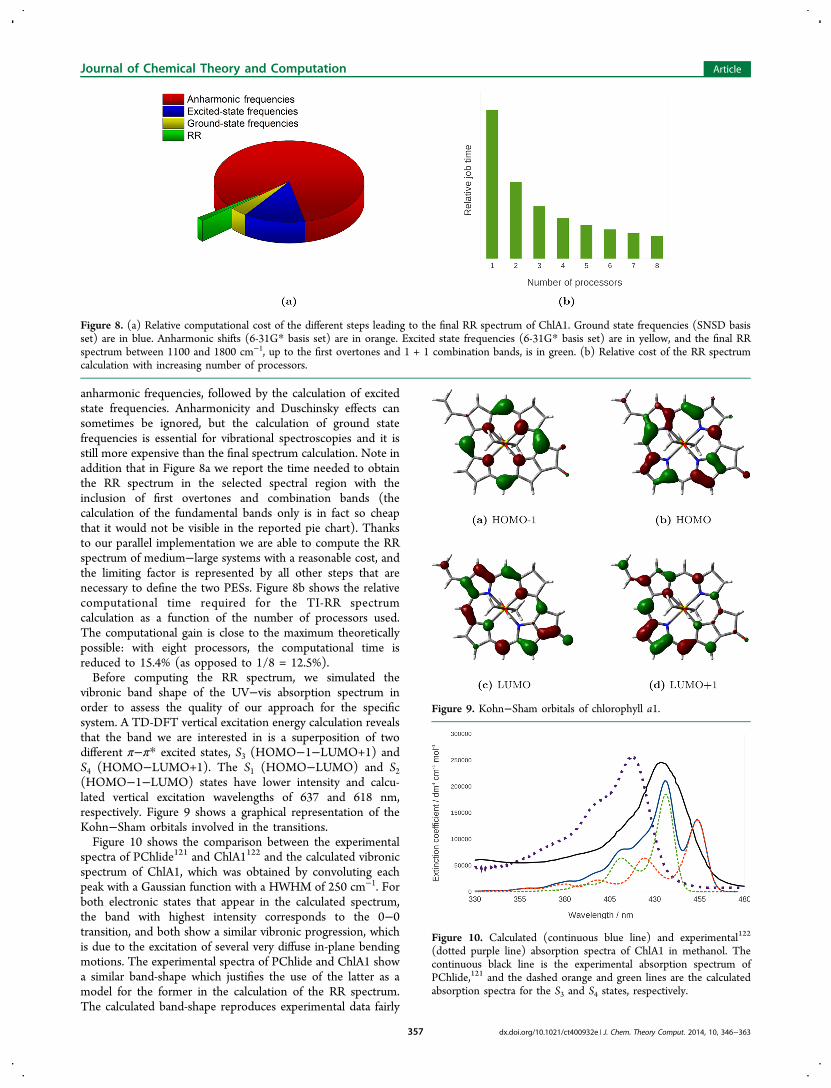
anharmonic frequencies, followed by the calculation of excitedstate frequencies. Anharmonicity and Duschinsky effects cansometimes be ignored, but the calculation of ground statefrequencies is essential for vibrational spectroscopies and it isstill more expensive than the final spectrum calculation. Note inaddition that in Figure 8a we report the time needed to obtainthe RR spectrum in the selected spectral region with theinclusion of first overtones and combination bands (thecalculation of the fundamental bands only is in fact so cheapthat it would not be visible in the reported pie chart). Thanksto our parallel implementation we are able to compute the RRspectrum of medium−large systems with a reasonable cost, andthe limiting factor is represented by all other steps that arenecessary to define the two PESs. Figure 8b shows the relativecomputational time required for the TI-RR spectrumcalculation as a function of the number of processors used.The computational gain is close to the maximum theoreticallypossible: with eight processors, the computational time isreduced to 15.4% (as opposed to 1/8 = 12.5%).Before computing the RR spectrum, we simulated the
vibronic band shape of the UV−vis absorption spectrum inorder to assess the quality of our approach for the specificsystem. A TD-DFT vertical excitation energy calculation revealsthat the band we are interested in is a superposition of twodifferent π−π* excited states, S3 (HOMO−1−LUMO+1) andS4 (HOMO−LUMO+1). The S1 (HOMO−LUMO) and S2(HOMO−1−LUMO) states have lower intensity and calcu-lated vertical excitation wavelengths of 637 and 618 nm,respectively. Figure 9 shows a graphical representation of theKohn−Sham orbitals involved in the transitions.Figure 10 shows the comparison between the experimental
spectra of PChlide121 and ChlA1122 and the calculated vibronicspectrum of ChlA1, which was obtained by convoluting eachpeak with a Gaussian function with a HWHM of 250 cm−1. Forboth electronic states that appear in the calculated spectrum,the band with highest intensity corresponds to the 0−0transition, and both show a similar vibronic progression, whichis due to the excitation of several very diffuse in-plane bendingmotions. The experimental spectra of PChlide and ChlA1 showa similar band-shape which justifies the use of the latter as amodel for the former in the calculation of the RR spectrum.The calculated band-shape reproduces experimental data fairly
Figure 8. (a) Relative computational cost of the different steps leading to the final RR spectrum of ChlA1. Ground state frequencies (SNSD basisset) are in blue. Anharmonic shifts (6-31G* basis set) are in orange. Excited state frequencies (6-31G* basis set) are in yellow, and the final RRspectrum between 1100 and 1800 cm−1, up to the first overtones and 1 + 1 combination bands, is in green. (b) Relative cost of the RR spectrumcalculation with increasing number of processors.
Figure 9. Kohn−Sham orbitals of chlorophyll a1.
Figure 10. Calculated (continuous blue line) and experimental122
(dotted purple line) absorption spectra of ChlA1 in methanol. Thecontinuous black line is the experimental absorption spectrum ofPChlide,121 and the dashed orange and green lines are the calculatedabsorption spectra for the S3 and S4 states, respectively.
Journal of Chemical Theory and Computation Article
dx.doi.org/10.1021/ct400932e | J. Chem. Theory Comput. 2014, 10, 346−363357

well, even though DFT predicts the two excited states to befurther apart than they would appear from the experimentalspectrum. The calculated spectrum almost overlaps with theexperimental PChlide one, with the maximum appearing at 434and 437 nm in the experimental and calculated spectrum,respectively, whereas the maximum of the experimental ChlA1spectrum appears at 417 nm. Overall, the chosen model seemsappropriate for the description of our system.
Figure 12 shows the calculated and experimental121 RRspectra. The calculations were performed with an incidentfrequency of 24 550 cm−1 (407 nm) and a damping constant of500 cm−1. The experimental spectrum of PChlide was alsorecorded with 407 nm incident radiation. Because thecalculated ChlA1 UV−vis spectrum overlaps with theexperimental PChlide one, we did not need to apply any shiftto the incident frequency. The peaks were convoluted withGaussian functions with a HWHM of 10 cm−1. The top andmiddle panels show the harmonic and anharmonic spectra,respectively. As already reported for imidazole, the effect of
anharmonicity mainly consists of a redshift of all bands, butbecause the shift is different for each peak, the convolutedspectrum also shows some clearly visible differences in the bandshape. Figure 12 also shows the separate contribution of eachexcited state: the S4 state gives a greater contribution, as isexpected from its greater intensity in the absorption spectrumand from the fact that it lies closer to the incident frequency.The S3 state still gives a non-negligible contribution thanks tothe fact that the tail in its absorption spectrum reaches the valueof the incident frequency. As explained above, the totalspectrum is not simply the sum of the two separate spectrabecause of interference effects acting at the polarizability level.We also computed the spectrum with the inclusion ofovertones and combination bands of up to two quantatransitions, but we found that they all have negligible intensitiesresulting in an almost identical spectrum (see SupportingInformation).The bottom panel in Figure 12 shows for comparison the
experimental spectrum of PChlide recorded with a 407 nmlaser frequency.121 The experimental spectrum shows a strongband around 1360 cm−1 which the authors assign to C−Cbreathing vibrations of the porphyrin, a band around 1570 cm−1
assigned to CC stretching vibrations, and one at 1700 cm−1
assigned to the CO bending of the ciclopentanone ring.These features are all reproduced in the calculated spectrum,though with notable differences. The computed frequencies arelower than the experimental ones, causing a shift of the wholespectrum. The 1400 cm−1 zone in the computed spectrumshows a few bands of significant intensities, which correspondto very diffuse CC bendings, that are not observed in theexperimental spectrum. The high-intensity peaks that appearbetween 1500 and 1600 cm−1 in the anharmonic calculatedspectrum are due to CC stretching motions, and they areseparated by a gap which is not found in the experimentalspectrum, but our calculations reveal that there are actually nonormal modes with an energy that would place them whithinthat gap. These differences may be attributed to the additional
Figure 11. Calculated 2D-RR spectrum of ChlA1 in methanol, wherethe spectrum and excitation profiles are shown at the same time.
Figure 12. Harmonic (top panel) and anharmonic (middle panel) RR spectra of ChlA1 in methanol. The continuous blue line is the total spectrum;the dashed orange and green lines are the spectra for the S3 and S4 states, respectively. The bottom panel shows the experimental RR spectrum ofPChlide.121
Journal of Chemical Theory and Computation Article
dx.doi.org/10.1021/ct400932e | J. Chem. Theory Comput. 2014, 10, 346−363358

side chains of PChlide, which would result in a greater numberof peaks.The effect of changing the incident frequency can be grasped
by looking at the 3D plot in Figure 11, where the axes hold theRaman shift, incident frequency, and spectrum intensity. Thebehavior of the different bands seems irregular because the twoexcited states affect the various peaks in different ways, andtheir large number means that they often overlap to give rise tothe visible bands. The potential interpretative power oftheoretical calculation is then evident as it can help to unravelcomplex spectroscopic responses such as RR, which, as anadditional complication, does not benefit from the simpleselection rules valid for nonresonant Raman scattering.
9. CONCLUSIONS AND PERSPECTIVESIn this work, we have presented a parallel implementation ofthe TI calculation of RR spectra with the inclusion ofanharmonicity and solvent effects. We have shown that it ispossible, by carefully choosing the computational methods andemploying appropriate reduced-dimensionality schemes, tocoherently include anharmonicity, Duschinsky, and solventeffects in the calculation of RR spectra of medium-to-large sizedsystems. We have demonstrated that the cost of the calculationsrequired to accurately model the ground-state and excited-statePESs far outweighs the simulation of the final TI-RR spectrum,therefore the best way to extend the applicability of the methodto ever-larger systems is to find cheaper means to perform theformer tasks. This goal may be accomplished through analyticimplementations of excited state energy second deriva-tives,124,125 which scale very favorably with system size withrespect to their numerical counterparts, and through the use ofless expensive methods such as semiempirical ones, especiallyfor the evaluation of anharmonic frequencies.126
With the goal of extending the method to larger and morecomplex systems, another issue calling for deeper investigationsis the choice of internal coordinates for the simultaneousdescription of electronic states possibly characterized by quitedifferent geometries. Several studies have shown that normalmodes built from Cartesian coordinates represent the moststraightforward and robust choice when small displacementsoccur. In such circumstances, the full adiabatic Hessian (AH)model, possibly including leading anharmonic corrections,shows a remarkable agreement with experimental data,provided that the quantum mechanical method chosen tobuild the PES is accurate enough. When large structuraldisplacements take place between the different electronic states,the situation is more involved, especially if inversions and/ortorsions are present.127 Recent works suggest that in suchcircumstances Cartesian coordinates face significant difficultiesfor a correct description of curvilinear displacements and aproper account of the Duschinsky mixing within the AH model,where the PESs of the different electronic states arequadratically expanded around their own equilibrium geome-try.127−129 Although the theory behind the use of internalcoordinates is well-known127 and several works have beenpublished concerning specific systems,128,129 a generalimplementation of this model is still lacking and is one of themost important tasks on which our group is concentrating itsefforts. On the other hand, the good agreement between theresults issuing from the vertical Hessian (VH) model andexperimental line shapes indicates that this approximation, inwhich all the normal modes are evaluated at the equilibriumgeometry of a single reference electronic state, is a good
alternative to deal with systems exhibiting large displacements.The use of this model can, however, be problematic whenimaginary frequencies arise.130
Motivated by the fact that there is a well-known strongrelationship between the RR spectral response and themolecular environment, we have also studied the effect of thesolvation regime on the final spectrum. We have employedthree different solvation regimes with the intent of modelingthe behavior of the different degrees of freedom of the solventas they either remain fixed or equilibrate with the time-dependent evolution of the starting vibrational wavepacket ofthe solute that generates the spectral response, according totheir characteristic time scales. It should be noted that thedifferent solvation regimes we have considered can be viewed aslimiting cases of the real behavior of the solvent: in reality thesolvent’s degrees of freedom always start from a nonequilibriumsituation, and then, if the lifetime of the vibrational wavepacketon the excited state PES is long enough to allow it, theygradually evolve to re-equilibrate with the solute. Nonetheless,our results show that the change in the solvation regime doeshave a great influence on the final RR spectrum and excitationprofile, which could stimulate more research in this area. Inparticular, by performing the calculation in the time-dependentpicture, it could be possible to model the evolution of thesolvent’s polarization more accurately by considering anadditional time-dependence of all the terms in the equationcaused by the solvent, though the assessment of how thesolvent’s evolution affects the excited state PES and thetransition moments is far from trivial. The choice of theappropriate solvation regime may be particularly important inthe case of more complex environments, such as a protein,which cannot freely rearrange itself to adapt to the evolution ofthe chromophore. In this case though, implicit solvent modelsmay fail to capture the specificity of the interactions, thereforeatomistic models may be more appropriate. A possible strategyto overcome such limitations can be the hybrid multiscale QM/FQ/PCM scheme109−111 we have recently proposed, to treatexplicit interactions between a molecular system and itsenvironment. An additional limitation of the implicit modelused in this work is the absence of nonelectrostatic effects inthe solvent respose in its basic formulation. Several methodshave been proposed to include nonelectrostatic effects withinthe PCM framework,131−133 though, to the best of ourknowledge, none have been applied to RR spectroscopy.
■ ASSOCIATED CONTENT
*S Supporting InformationThe Duschinsky matrices that relate the normal modesImH(T0) and ImH+(D0) to the normal modes of ImH(S0), apictorial representation of the vibrational modes andchlorophyll orbitals mentioned in the article, and a comparisonof the RR spectrum of ChlA1 having only the fundamentalbands to the one that includes contribution from overtones andcombination bands. This material is available free of charge viathe Internet at http://pubs.acs.org/.
■ AUTHOR INFORMATION
Corresponding Author*E-mail: [email protected].
NotesThe authors declare no competing financial interest.
Journal of Chemical Theory and Computation Article
dx.doi.org/10.1021/ct400932e | J. Chem. Theory Comput. 2014, 10, 346−363359

■ ACKNOWLEDGMENTS
The authors gratefully acknowledge support from COST(Action CoDECS: “COnvergent Distributed Environment forComputational Spectroscopy”) and ERC (European ResearchCouncil Advanced Grant 320951-DREAMS). Chiara Cappelliwould also like to acknowledge support from the Italian MIURPRIN 2009 (Sviluppo di modelli accurati e di codici veloci peril calcolo di spettri vibrazionali) and FIRB 2010 (Futuro inRicerca Protocollo RBFR10Y5VW). We also thank Dr.Małgorzata Biczysko for the helpful discussion about thespectroscopic properties of chlorophyll a1 and Dr. MireiaSegado for performing all CASSCF and MS-CASPT2calculations.
■ REFERENCES(1) Efremov, E. V.; Ariese, F.; Gooijer, C. Achievements in resonanceRaman spectroscopy. Review of a technique with a distinct analyticalchemistry potential. Anal. Chim. Acta 2008, 606, 119−134.(2) Horvath, R.; Gordon, K. C. Understanding excited-state structurein metal polypyridyl complexes using resonance Raman excitationprofiles, time-resolved resonance Raman spectroscopy and densityfunctional theory. Coord. Chem. Lett. 2010, 254, 2505−2518.(3) Boereboom, L. M.; van Hemert, M. C.; Neugebauer, J. TheResonance Raman Spectra of Spheroidene Revisited with a First-Principles Approach. ChemPhysChem 2011, 12, 3157−3169.(4) Oladepo, S. A.; Xiong, K.; Hong, Z.; Asher, S. A. ElucidatingPeptide and Protein Structure and Dynamics: UV Resonance RamanSpectroscopy. J. Phys. Chem. Lett. 2011, 2, 334−344.(5) Oladepo, S. A.; Xiong, K.; Hong, Z.; Asher, S. A.; Handen, J.;Lednev, I. K. UV Resonance Raman Investigations of Peptide andProtein Structure and Dynamics. Chem. Rev. 2012, 112, 2604−2628.(6) Kelley, A. M. Resonance Raman and Resonance hyper-RamanIntensities: Structure and Dynamics of Molecular Excited States inSolution. J. Phys. Chem. A 2008, 112, 11975−11991.(7) Warshel, A.; Dauber, P. Calculations of resonance Raman spectraof conjugated molecules. J. Chem. Phys. 1997, 66, 5477−5488.(8) Santoro, F.; Cappelli, C.; Barone, V. Effective Time-IndependentCalculations of Vibrational Resonance Raman Spectra of Isolated andSolvated Molecules Including Duschinsky and Herzberg−TellerEffects. J. Chem. Theory Comput. 2011, 7, 1824−1839.(9) Barone, V.; Baiardi, A.; Biczysko, M.; Bloino, J.; Cappelli, C.;Lipparini, F. Implementation and validation of a multi-purpose virtualspectrometer for large systems in complex environments. Phys. Chem.Chem. Phys. 2012, 14, 12404−12422.(10) Barron, L. Molecular Light Scattering and Optical Activity; 2nded.; Cambridge University Press: New York, 2004; pp 53−169.(11) Hecht, L.; Nafie, L. A. Theory of natural Raman Optical ActivityPart I. Complete circular polarization formalism. Mol. Phys. 1991, 72,441−469.(12) Long, D. A. The Raman Effect: A Unified Treatment of the Theoryof Raman Scattering by Molecules; John Wiley & Sons Ltd: New York,2002; pp 85−152.(13) Placzek, G. In Handbuch der Radiologie VI; Marx, E., Ed.;Akademische Verlagsgesellshaft: Leipzig, Germany, 1934; Vol. 2, pp209−374.(14) Albrecht, A. C. On the Theory of Raman Intensities. J. Chem.Phys. 1961, 34, 1476−1484.(15) Lee, S.-Y.; Heller, E. J. Time-dependent theory of Ramanscattering. J. Chem. Phys. 1979, 71, 4777−4788.(16) Tannor, D. J.; Heller, E. J. Polyatomic Raman Scattering forGeneral Harmonic Potentials. J. Chem. Phys. 1982, 77, 202−218.(17) Yan, Y. J.; Mukamel, S. Eigenstate-free, Green function,calculation of molecular absorption and fluorescence line shapes. J.Chem. Phys. 1986, 85, 5908−5922.(18) Blazej, D. C.; Peticolas, W. L. Ultraviolet resonance Ramanexcitation profiles of pyrimidine nucleotides. J. Chem. Phys. 1980, 72,3134−3142.
(19) Peticolas, W. L.; Rush, T., III. Ab Initio Calculations of theUltraviolet Resonance Raman Spectra of Uracil. J. Comput. Chem.1995, 16, 1261−1260.(20) Neugebauer, J.; Hess, B. A. Resonance Raman spectra of uracilbased on Kramers−Kronig relations using time-dependent densityfunctional calculations and multireference perturbation theory. J.Chem. Phys. 2004, 120, 11564−11477.(21) Guthmuller, J.; Champagne, B. Time dependent densityfunctional theory investigation of the resonance Raman properties ofthe julolidinemalononitrile push-pull chromophore in various solvents.J. Chem. Phys. 2007, 127, 164507.(22) Guthmuller, J.; Gonzalez, L. Simulation of the resonance Ramanintensities of a ruthenium−palladium photocatalyst by time dependentdensity functional theory. Phys. Chem. Chem. Phys. 2010, 12, 14812−14821.(23) Petrenko, T.; Neese, F. Analysis and prediction of absorptionband shapes, fluorescence band shapes, resonance Raman intensities,and excitation profiles using the time-dependent theory of electronicspectroscopy. J. Chem. Phys. 2007, 127, 164319.(24) Petrenko, T.; Neese, F. Efficient and automatic calculation ofoptical band shapes and resonance Raman spectra for larger moleculeswithin the independent mode displaced harmonic oscillator model. J.Chem. Phys. 2012, 137, 234107.(25) Jarzecki, A. A.; Spiro, T. G. Ab initio computation of the UVresonance Raman intensity pattern of aqueous imidazole. J. RamanSpectrosc. 2001, 32, 599−605.(26) Mennucci, B.; Cappelli, C.; Cammi, R.; Tomasi, J. A quantummechanical polarizable continuum model for the calculation ofresonance Raman spectra in condensed phase. Theor. Chem. Acc.2007, 117, 1029−1039.(27) Guthmuller, J. Assessment of TD-DFT and CC2 Methods forthe Calculation of Resonance Raman Intensities: Application to o-Nitrophenol. J. Chem. Theory Comput. 2011, 7, 1082−1089.(28) Kupfer, S.; Guthmuller, J.; Gonzalez, L. An Assessment ofRASSCF and TDDFT Energies and Gradients on an Organic Donor-Acceptor Dye Assisted by Resonance Raman Spectroscopy. J. Chem.Theory Comput. 2013, 9, 543−554.(29) Jensen, L.; Autschbach, J.; Schatz, G. C. Finite lifetime effects onthe polarizability within time-dependent density-functional theory. J.Chem. Phys. 2005, 122, 224115.(30) Jensen, L.; Zhao, L. L.; Autschbach, J.; Schatz, G. C. Theory andmethod for calculating resonance Raman scattering from resonancepolarizability derivatives. J. Chem. Phys. 2005, 123, 174110.(31) Norman, P.; Bishop, D. M.; Jensen, H. J. A.; Oddershede, J.Nonlinear response theory with relaxation: The first-order hyper-polarizability. J. Chem. Phys. 2005, 123, 194103.(32) Ågren, A. M. H.; Norman, P. Resonance enhanced Ramanscattering from the complex electric-dipole polarizability: A theoreticalstudy on N2. Chem. Phys. Lett. 2009, 468, 119−123.(33) Ågren, A. M. H.; Norman, P. Time-dependent densityfunctional theory for resonant properties: resonance enhancedRaman scattering from the complex electric-dipole polarizability.Phys. Chem. Chem. Phys. 2009, 11, 4539−4548.(34) Latorre, M. T. F.; Marquetand, P. Resonance Raman spectra ofortho-nitrophenol calculated by real-time time-dependent densityfunctional theory. J. Chem. Phys. 2013, 138, 044101.(35) Kane, K. A.; Jensen, L. Calculation of Absolute ResonanceRaman Intensities: Vibronic Theory vs Short-Time Approximation. J.Phys. Chem. C 2010, 114, 5540−5546.(36) Al-Saidi, W. A.; Asher, S. A.; Norman, P. Resonance RamanSpectra of TNT and RDX Using Vibronic Theory, Excited-StateGradient, and Complex Polarizability Approximations. J. Phys. Chem. A2012, 116, 7862−7872.(37) Lucas, N. J. D. The Franck−Condon principle for polyatomicmolecules. J. Phys. B: At. Mol. Phys. 1973, 6, 155−163.(38) Duschinsky, F. Acta Physicochim. URSS 1937, 7, 551.(39) Ma, H.; Liu, J.; Liang, W. Time-Dependent Approach toResonance Raman Spectra Including Duschinsky Rotation and
Journal of Chemical Theory and Computation Article
dx.doi.org/10.1021/ct400932e | J. Chem. Theory Comput. 2014, 10, 346−363360
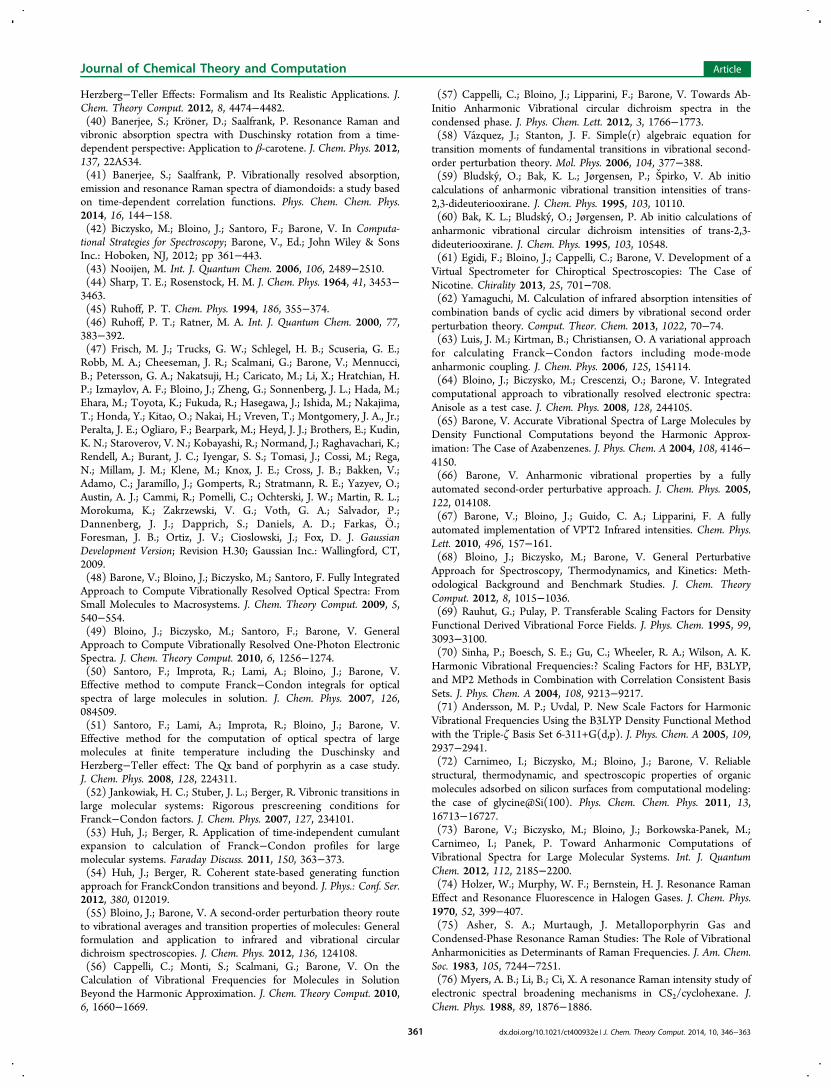
Herzberg−Teller Effects: Formalism and Its Realistic Applications. J.Chem. Theory Comput. 2012, 8, 4474−4482.(40) Banerjee, S.; Kroner, D.; Saalfrank, P. Resonance Raman andvibronic absorption spectra with Duschinsky rotation from a time-dependent perspective: Application to β-carotene. J. Chem. Phys. 2012,137, 22A534.(41) Banerjee, S.; Saalfrank, P. Vibrationally resolved absorption,emission and resonance Raman spectra of diamondoids: a study basedon time-dependent correlation functions. Phys. Chem. Chem. Phys.2014, 16, 144−158.(42) Biczysko, M.; Bloino, J.; Santoro, F.; Barone, V. In Computa-tional Strategies for Spectroscopy; Barone, V., Ed.; John Wiley & SonsInc.: Hoboken, NJ, 2012; pp 361−443.(43) Nooijen, M. Int. J. Quantum Chem. 2006, 106, 2489−2510.(44) Sharp, T. E.; Rosenstock, H. M. J. Chem. Phys. 1964, 41, 3453−3463.(45) Ruhoff, P. T. Chem. Phys. 1994, 186, 355−374.(46) Ruhoff, P. T.; Ratner, M. A. Int. J. Quantum Chem. 2000, 77,383−392.(47) Frisch, M. J.; Trucks, G. W.; Schlegel, H. B.; Scuseria, G. E.;Robb, M. A.; Cheeseman, J. R.; Scalmani, G.; Barone, V.; Mennucci,B.; Petersson, G. A.; Nakatsuji, H.; Caricato, M.; Li, X.; Hratchian, H.P.; Izmaylov, A. F.; Bloino, J.; Zheng, G.; Sonnenberg, J. L.; Hada, M.;Ehara, M.; Toyota, K.; Fukuda, R.; Hasegawa, J.; Ishida, M.; Nakajima,T.; Honda, Y.; Kitao, O.; Nakai, H.; Vreven, T.; Montgomery, J. A., Jr.;Peralta, J. E.; Ogliaro, F.; Bearpark, M.; Heyd, J. J.; Brothers, E.; Kudin,K. N.; Staroverov, V. N.; Kobayashi, R.; Normand, J.; Raghavachari, K.;Rendell, A.; Burant, J. C.; Iyengar, S. S.; Tomasi, J.; Cossi, M.; Rega,N.; Millam, J. M.; Klene, M.; Knox, J. E.; Cross, J. B.; Bakken, V.;Adamo, C.; Jaramillo, J.; Gomperts, R.; Stratmann, R. E.; Yazyev, O.;Austin, A. J.; Cammi, R.; Pomelli, C.; Ochterski, J. W.; Martin, R. L.;Morokuma, K.; Zakrzewski, V. G.; Voth, G. A.; Salvador, P.;Dannenberg, J. J.; Dapprich, S.; Daniels, A. D.; Farkas, O.;Foresman, J. B.; Ortiz, J. V.; Cioslowski, J.; Fox, D. J. GaussianDevelopment Version; Revision H.30; Gaussian Inc.: Wallingford, CT,2009.(48) Barone, V.; Bloino, J.; Biczysko, M.; Santoro, F. Fully IntegratedApproach to Compute Vibrationally Resolved Optical Spectra: FromSmall Molecules to Macrosystems. J. Chem. Theory Comput. 2009, 5,540−554.(49) Bloino, J.; Biczysko, M.; Santoro, F.; Barone, V. GeneralApproach to Compute Vibrationally Resolved One-Photon ElectronicSpectra. J. Chem. Theory Comput. 2010, 6, 1256−1274.(50) Santoro, F.; Improta, R.; Lami, A.; Bloino, J.; Barone, V.Effective method to compute Franck−Condon integrals for opticalspectra of large molecules in solution. J. Chem. Phys. 2007, 126,084509.(51) Santoro, F.; Lami, A.; Improta, R.; Bloino, J.; Barone, V.Effective method for the computation of optical spectra of largemolecules at finite temperature including the Duschinsky andHerzberg−Teller effect: The Qx band of porphyrin as a case study.J. Chem. Phys. 2008, 128, 224311.(52) Jankowiak, H. C.; Stuber, J. L.; Berger, R. Vibronic transitions inlarge molecular systems: Rigorous prescreening conditions forFranck−Condon factors. J. Chem. Phys. 2007, 127, 234101.(53) Huh, J.; Berger, R. Application of time-independent cumulantexpansion to calculation of Franck−Condon profiles for largemolecular systems. Faraday Discuss. 2011, 150, 363−373.(54) Huh, J.; Berger, R. Coherent state-based generating functionapproach for FranckCondon transitions and beyond. J. Phys.: Conf. Ser.2012, 380, 012019.(55) Bloino, J.; Barone, V. A second-order perturbation theory routeto vibrational averages and transition properties of molecules: Generalformulation and application to infrared and vibrational circulardichroism spectroscopies. J. Chem. Phys. 2012, 136, 124108.(56) Cappelli, C.; Monti, S.; Scalmani, G.; Barone, V. On theCalculation of Vibrational Frequencies for Molecules in SolutionBeyond the Harmonic Approximation. J. Chem. Theory Comput. 2010,6, 1660−1669.
(57) Cappelli, C.; Bloino, J.; Lipparini, F.; Barone, V. Towards Ab-Initio Anharmonic Vibrational circular dichroism spectra in thecondensed phase. J. Phys. Chem. Lett. 2012, 3, 1766−1773.(58) Vazquez, J.; Stanton, J. F. Simple(r) algebraic equation fortransition moments of fundamental transitions in vibrational second-order perturbation theory. Mol. Phys. 2006, 104, 377−388.(59) Bludsky, O.; Bak, K. L.; Jørgensen, P.; Spirko, V. Ab initiocalculations of anharmonic vibrational transition intensities of trans-2,3-dideuteriooxirane. J. Chem. Phys. 1995, 103, 10110.(60) Bak, K. L.; Bludsky, O.; Jørgensen, P. Ab initio calculations ofanharmonic vibrational circular dichroism intensities of trans-2,3-dideuteriooxirane. J. Chem. Phys. 1995, 103, 10548.(61) Egidi, F.; Bloino, J.; Cappelli, C.; Barone, V. Development of aVirtual Spectrometer for Chiroptical Spectroscopies: The Case ofNicotine. Chirality 2013, 25, 701−708.(62) Yamaguchi, M. Calculation of infrared absorption intensities ofcombination bands of cyclic acid dimers by vibrational second orderperturbation theory. Comput. Theor. Chem. 2013, 1022, 70−74.(63) Luis, J. M.; Kirtman, B.; Christiansen, O. A variational approachfor calculating Franck−Condon factors including mode-modeanharmonic coupling. J. Chem. Phys. 2006, 125, 154114.(64) Bloino, J.; Biczysko, M.; Crescenzi, O.; Barone, V. Integratedcomputational approach to vibrationally resolved electronic spectra:Anisole as a test case. J. Chem. Phys. 2008, 128, 244105.(65) Barone, V. Accurate Vibrational Spectra of Large Molecules byDensity Functional Computations beyond the Harmonic Approx-imation: The Case of Azabenzenes. J. Phys. Chem. A 2004, 108, 4146−4150.(66) Barone, V. Anharmonic vibrational properties by a fullyautomated second-order perturbative approach. J. Chem. Phys. 2005,122, 014108.(67) Barone, V.; Bloino, J.; Guido, C. A.; Lipparini, F. A fullyautomated implementation of VPT2 Infrared intensities. Chem. Phys.Lett. 2010, 496, 157−161.(68) Bloino, J.; Biczysko, M.; Barone, V. General PerturbativeApproach for Spectroscopy, Thermodynamics, and Kinetics: Meth-odological Background and Benchmark Studies. J. Chem. TheoryComput. 2012, 8, 1015−1036.(69) Rauhut, G.; Pulay, P. Transferable Scaling Factors for DensityFunctional Derived Vibrational Force Fields. J. Phys. Chem. 1995, 99,3093−3100.(70) Sinha, P.; Boesch, S. E.; Gu, C.; Wheeler, R. A.; Wilson, A. K.Harmonic Vibrational Frequencies:? Scaling Factors for HF, B3LYP,and MP2 Methods in Combination with Correlation Consistent BasisSets. J. Phys. Chem. A 2004, 108, 9213−9217.(71) Andersson, M. P.; Uvdal, P. New Scale Factors for HarmonicVibrational Frequencies Using the B3LYP Density Functional Methodwith the Triple-ζ Basis Set 6-311+G(d,p). J. Phys. Chem. A 2005, 109,2937−2941.(72) Carnimeo, I.; Biczysko, M.; Bloino, J.; Barone, V. Reliablestructural, thermodynamic, and spectroscopic properties of organicmolecules adsorbed on silicon surfaces from computational modeling:the case of glycine@Si(100). Phys. Chem. Chem. Phys. 2011, 13,16713−16727.(73) Barone, V.; Biczysko, M.; Bloino, J.; Borkowska-Panek, M.;Carnimeo, I.; Panek, P. Toward Anharmonic Computations ofVibrational Spectra for Large Molecular Systems. Int. J. QuantumChem. 2012, 112, 2185−2200.(74) Holzer, W.; Murphy, W. F.; Bernstein, H. J. Resonance RamanEffect and Resonance Fluorescence in Halogen Gases. J. Chem. Phys.1970, 52, 399−407.(75) Asher, S. A.; Murtaugh, J. Metalloporphyrin Gas andCondensed-Phase Resonance Raman Studies: The Role of VibrationalAnharmonicities as Determinants of Raman Frequencies. J. Am. Chem.Soc. 1983, 105, 7244−7251.(76) Myers, A. B.; Li, B.; Ci, X. A resonance Raman intensity study ofelectronic spectral broadening mechanisms in CS2/cyclohexane. J.Chem. Phys. 1988, 89, 1876−1886.
Journal of Chemical Theory and Computation Article
dx.doi.org/10.1021/ct400932e | J. Chem. Theory Comput. 2014, 10, 346−363361

(77) Ziegler, L. D.; Chung, Y. C.; Wang, P.; Zhang, Y. P.Metalloporphyrin Gas and Condensed-Phase Resonance RamanStudies: The Role of Vibrational Anharmonicities as Determinantsof Raman Frequencies. J. Chem. Phys. 1989, 90, 4125−4143.(78) Yamaguchi, T.; Kimura, Y.; Hirota, N. Solvent and SolventDensity Effects on the Spectral Shifts and the Bandwidths of theAbsorption and the Resonance Raman Spectra of Phenol Blue. J. Phys.Chem. A 1997, 101, 9050−9060.(79) Kelley, A. M. Resonance Raman Intensity Analysis ofVibrational and Solvent Reorganization in Photoinduced ChargeTransfer. J. Phys. Chem. A 1999, 103, 6891−6903.(80) Leng, W.; Wurthner, F.; Kelley, A. M. Solvent-DependentVibrational Frequencies and Reorganization Energies of TwoMerocyanine Chromophores. J. Phys. Chem. A 1999, 103, 6891−6903.(81) Myers, A. B. Molecular Electronic Spectral Broadening inLiquids and Glasses. Annu. Rev. Phys. Chem. 1998, 49, 267−295.(82) Tomasi, J.; Mennucci, B.; Cammi, R. Quantum MechanicalContinuum Solvation Models. Chem. Rev. 2005, 105, 2999−3093.(83) Mennucci, B. Polarizable Continuum Model. WIREs Comput.Mol. Sci. 2012, 2, 386−404.(84) Guthmuller, J.; Champagne, B. Resonance Raman scattering ofrhodamine 6G as calculated by time-dependent density functionaltheory: Vibronic and solvent effects. J. Phys. Chem. A 2008, 112,3215−3223.(85) Guthmuller, J.; Champagne, B. Resonance Raman Spectra andRaman Excitation Profiles of Rhodamine 6G from Time-DependentDensity Functional Theory. ChemPhysChem 2008, 9, 1667−1669.(86) Guthmuller, J.; Champagne, B.; Moucheron, C.; Andree, K.Investigation of the Resonance Raman Spectra and Excitation Profilesof a Monometallic Ruthenium(II) [Ru(bpy)(2)(HAT)](2+) Complexby Time-Dependent Density Functional Theory. J. Phys. Chem. B2010, 114, 511−520.(87) Avila Ferrer, F. J.; Barone, V.; Cappelli, C.; Santoro, F.Duschinsky, Herzberg−Teller, and Multiple Electronic ResonanceInterferential Effects in Resonance Raman Spectra and ExcitationProfiles. The Case of Pyrene. J. Chem. Theory Comput. 2013, 9, 3597−3611.(88) Jarzecki, A. A. Quantum-Mechanical Calculations of ResonanceRaman Intensities: The Weighted-Gradient Approximation. J. Phys.Chem. A 2009, 113, 2926−2934.(89) Mennucci, B.; Cappelli, C.; Guido, C. A.; Cammi, R.; Tomasi, J.Structures and Properties of Electronically Excited Chromophores inSolution from the Polarizable Continuum Model Coupled to theTime-Dependent Density Functional Theory. J. Phys. Chem. A 2009,113, 3009−3020.(90) Mennucci, B.; Cammi, R.; Tomasi, J. Excited states andsolvatochromic shifts within a nonequilibrium solvation approach. J.Chem. Phys. 1998, 109, 2798−2807.(91) Cossi, M.; Barone, V. Time-dependent density functional theoryfor molecules in liquid solutions. J. Chem. Phys. 2001, 115, 4708−4717.(92) Cappelli, C.; Corni, S.; Cammi, R.; Mennucci, B.; Tomasi, J.Nonequilibrium formulation of infrared frequencies and intensities insolution. J. Chem. Phys. 2000, 113, 11270−11279.(93) Cappelli, C.; Corni, S.; Tomasi, J. Electronic and vibrationaldynamic solvent effects on Raman spectra. J. Chem. Phys. 2001, 115,5531−5535.(94) Cappelli, C.; Corni, S.; Mennucci, B.; Cammi, R.; Tomasi, J.Vibrational Circular Dichroism within the Polarizable ContinuumModel: A Theoretical Evidence of Conformation Effects andHydrogen Bonding for (S)-(−)-3-Butyn-2-ol in CCl4 Solution. J.Phys. Chem. A 2002, 106, 12331−12339.(95) Cappelli, C.; Lipparini, F.; Bloino, J.; Barone, V. Towards anaccurate description of anharmonic infrared spectra in solution withinthe polarizable continuum model: Reaction field, cavity field andnonequilibrium effects. J. Chem. Phys. 2011, 135, 104505.(96) Becke, A. D. Density-functional thermochemistry. III. The roleof exact exchange. J. Chem. Phys. 1993, 98, 5648−5652.
(97) Lee, C.; Yang, W.; Parr, R. G. Development of the Colle-Salvetticorrelation-energy formula into a functional of the electron density.Phys. Rev. B 1988, 37, 785−789.(98) Adamo, C.; Barone, V. Toward reliable density functionalmethods without adjustable parameters: The PBE0 model. J. Chem.Phys. 1999, 110, 6158−6169.(99) Yanai, T.; Tew, D. P.; Handy, N. C. A new hybrid exchange-correlation functional using the Coulomb-attenuating method (CAM-B3LYP). Chem. Phys. Lett. 2004, 393, 51−57.(100) Zhao, Y.; Truhlar, D. G. The M06 suite of density functionalsfor main group thermochemistry, thermochemical kinetics, non-covalent interactions, excited states, and transition elements: two newfunctionals and systematic testing of four M06-class functionals and 12other functionals. Theor. Chem. Acc. 2008, 393, 215−241.(101) Kendall, R. A.; Dunning, T. H., Jr.; Harrison, R. J. Electronaffinities of the first-row atoms revisited. Systematic basis sets andwave functions. J. Chem. Phys. 1992, 96, 6796−6806.(102) Carnimeo, I.; Puzzarini, C.; Tasinato, N.; Stoppa, P.; Charmet,A. P.; Biczysko, M.; Cappelli, C.; Barone, V. Anharmonic theoreticalsimulations of infrared spectra of halogenated organic compounds. J.Chem. Phys. 2013, 139, 074310.(103) Finley, J.; Malmqvist, P.-Å.; Roos, B. O.; Serrano-Andres, L.The multi-state CASPT2 method. Chem. Phys. Lett. 1998, 288, 299−306.(104) Aquilante, F.; De Vico, L.; Ferre, N. F.; Ghigo, G.; Malmqvist,P.-Å.; Neogrady, P.; Pedersen, T.; Pitonak, M.; Reiher, M.; Roos, B.;Serrano-Andres, L.; Urban, M.; Veryazov, V.; Lindh, R. MOLCAS 7:The Next Generation. J. Comput. Chem. 2010, 31, 224−247.(105) Veryazov, V.; Widmark, P.-O.; Serrano-Andres, L.; Lindh, R.;Roos, B. 2MOLCAS as a development platform for quantumchemistry software. Int. J. Quantum Chem. 2004, 100, 626−635.(106) Karlstrom, G.; Lindh, R.; Malmqvist, P.-Å.; Roos, B. O.; Ryde,U.; Veryazov, V.; Widmark, P.-O.; Cossi, M.; Schimmelpfennig, B.;Neogrady, P.; Seijo, L. MOLCAS: a program package for computa-tional chemistry. Comput. Mater. Sci. 2003, 28, 222−239.(107) Caswell, D. S.; Spiro, T. G. Ultraviolet Resonance RamanSpectroscopy of Imidazole, Histidine, and Cu(imidazole)4
2+: Implica-tions for Protein Studies. J. Am. Chem. Soc. 1986, 108, 6470−6477.(108) Balakrishnan, G.; Jarzecki, A. A.; Wu, Q.; Kozlowski, P. M.;Wang, D.; Spiro, T. G. Mode Recognition in UV Resonance RamanSpectra of Imidazole: Histidine Monitoring in Proteins. J. Phys. Chem.B 2012, 116, 9387−9395.(109) Lipparini, F.; Barone, V. Polarizable Force Fields andPolarizable Continuum Model: A Fluctuating Charges/PCM Ap-proach. 1. Theory and Implementation. J. Chem. Theory Comput. 2011,7, 3711−3724.(110) Lipparini, F.; Cappelli, C.; Barone, V. Linear Response Theoryand Electronic Transition Energies for a Fully Polarizable QM/Classical Hamiltonian. J. Chem. Theory Comput. 2012, 8, 4153−4165.(111) Lipparini, F.; Cappelli, C.; Scalmani, G.; De Mitri, N.; Barone,V. Analytical First and Second Derivatives for a Fully Polarizable QM/Classical Hamiltonian. J. Chem. Theory Comput. 2012, 8, 4270−4278.(112) Jones, C. M.; Asher, S. A. Ultraviolet resonance Raman studyof the pyrene S4, S3, and S2 excited electronic states. J. Chem. Phys.1988, 89, 2649−2661.(113) Neugebauer, J.; Baerends, E. J.; Efremov, E. V.; Ariese, F.;Gooijer, C. Combined Theoretical and Experimental Deep-UVResonance Raman Studies of Substituted Pyrenes. J. Phys. Chem. A2005, 109, 2100−2106.(114) Jensen, L.; Schatz, G. C. Resonance Raman Scattering ofRhodamine 6G as Calculated Using Time-Dependent DensityFunctional Theory. J. Phys. Chem. A 2006, 110, 5973−5977.(115) Malmqvist, P.-O. W. P.-Å.; Roos, B. O. Density matrixaveraged atomic natural orbital (ANO) basis sets for correlatedmolecular wave functions. Theor. Chim. Acta 1990, 77, 291−306.(116) Angeli, C.; Pastore, M. The lowest singlet states of octatetraenerevisited. J. Phys. Chem. 2011, 134, 184302.(117) Biczysko, M.; Panek, P.; Scalmani, G.; Bloino, J.; Barone, V.Harmonic and Anharmonic Vibrational Frequency Calculations with
Journal of Chemical Theory and Computation Article
dx.doi.org/10.1021/ct400932e | J. Chem. Theory Comput. 2014, 10, 346−363362

the Double-Hybrid B2PLYP Method: Analytic Second Derivatives andBenchmark Studies. J. Chem. Theory Comput. 2010, 6, 2115−2125.(118) Milgrom, L. R. The Colours of Life: An Introduction to theChemistry of Porphyrins and Related Compounds; Oxford UniversityPress: Oxford, U. K., 1997; pp 65−155.(119) Robert, B. Resonance Raman spectroscopy. Photosynth. Res.2010, 101, 147−155.(120) Premvardhan, L.; Robert, B.; Beer, A.; Buchel, C. Pigmentorganization in fucoxanthin chlorophyll a/c2 proteins (FCP) based onresonance Raman spectroscopy and sequence analysis. Biochim.Biophys. Acta 2010, 1797, 1647−1656.(121) Hanf, R.; Tschierlei, S.; Dietzek, B.; Seidel, S.; Hermann, G.;Schmitt, M.; Popp, J. Probing the structure and Franck−Condonregion of protochlorophyllide a through analysis of the Raman andresonance Raman spectra. J. Raman Spectrosc. 2010, 41, 414−423.(122) Du, H.; Fuh, R.-C. A.; Li, J.; Corkan, L. A.; Lindsey, J. S.PhotochemCAD: A Computer-Aided Design and Research Tool inPhotochemistry. Photochem. Photobiol. 1998, 68, 141−142.(123) Vassiliev, S.; Bruce, D. Toward understanding molecularmechanisms of light harvesting and charge separation in photosystemII. Photosynth. Res. 2008, 97, 75−89.(124) Liu, J.; Liang, W. Analytical Hessian of electronic excited statesin time-dependent density functional theory with Tamm-Dancoffapproximation. J. Chem. Phys. 2011, 135, 014113.(125) Liu, J.; Liang, W. Analytical approach for the excited-stateHessian in time-dependent density functional theory: Formalism,implementation, and performance. J. Chem. Phys. 2011, 135, 184111.(126) Barone, V.; Scalmani, I. C. G. Computational Spectroscopy ofLarge Systems in Solution: The DFTB/PCM and TD-DFTB/PCMApproach. J. Chem. Theory Comput. 2013, 9, 2052−2071.(127) Reimers, J. R. A practical method for the use of curvilinearcoordinates in calculations of normal-mode-projected displacementsand Duschinsky rotation matrices for large molecules. J. Chem. Phys.2001, 115, 9103.(128) Borrelli, R.; Peluso, A. The electron photodetachmentspectrum of c-C4F8
−: A test case for the computation of Franck−Condon factors of highly flexible molecules. J. Chem. Phys. 2008, 123,044303.(129) Borrelli, R.; Capobianco, A.; Peluso, A. Franck−Condonfactors Computational approaches and recent developments. Can. J.Chem. 2013, 91, 495−504.(130) Avila Ferrer, F. J.; Santoro, F. Comparison of vertical andadiabatic harmonic approaches for the calculation of the vibrationalstructure of electronic spectra. Phys. Chem. Chem. Phys. 2013, 14,13549−13563.(131) Amovilli, C.; Mennucci, B. Self-Consistent-Field Calculation ofPauli Repulsion and Dispersion Contributions to the Solvation FreeEnergy in the Polarizable Continuum Model. J. Phys. Chem. B 1997,101, 1051−1057.(132) Cammi, R.; Cappelli, C.; Mennucci, B.; Tomasi, J. Calculationand analysis of the harmonic vibrational frequencies in molecules atextreme pressure: Methodology and diborane as a test case. J. Chem.Phys. 2012, 137, 154112.(133) Weijo, V.; Mennucci, B.; Frediani, L. Toward a GeneralFormulation of Dispersion Effects for Solvation Continuum Models. J.Chem. Theory Comput. 2010, 6, 33583364.
Journal of Chemical Theory and Computation Article
dx.doi.org/10.1021/ct400932e | J. Chem. Theory Comput. 2014, 10, 346−363363
Top Related
Copyright © 2022 FDOKUMEN

