


Bahasa
Halaman
Hukum

A REPORT
ON
WORKING CAPITAL MANAGEMENT IN SMIIEL (A UNITOF MOTHERSON SUMI SYSTEM LIMITED), NOIDA
SECTOR 59
By
Aarti Agarwal
MBA II semester
FMS-WISDOM
Banasthali University2014
Submitted To Submitted to
MOTHERSON SUMI SYSTEM LIMITED MBADEPARTMENT
NAME OF MENTOR NAME FACULTY:-
DIVYA MEHTA
1

2
TABLE OF CONTENTS
Acknowledgement
List of illustrations
Abstract
1. Introduction
1.1 Significance of topic, About
company
1.2 Objectives & Limitations
1.3 IMPORTANCE OF WORKING CAPITAL
RATIOS
2. Literature Review
3. Methodology
4. Analysis of Data / Finding
5. Conclusion & Recommendations.
3
Bibliography
Abstract
For increasing shareholder's wealth a firm has to
analyze the effect of fixed assets and current assets
on its return and risk. Working Capital Management is
related with the Management of current assets. The
Management of current assets is different from fixed
assets on the basis of the following points:
1. Current assets are for short period while fixed
assets are for more than one year.
2. The large holdings of current assets, especially
cash, strengthens liquidity position but also
reduces overall profitability, and to maintain an
optimum level of liquidity and profitability, risk
4
return trade off is involved in holding current
assets.
3. Only Current Assets can be adjusted with sales
fluctuating in the short run. Thus, the firm has
greater degree of flexibility in managing current
Assets. The management of Current Assets helps
affirm in building a good market reputation
regarding its business and economic condition.
Working capital may be regarded as the life blood of
business. Working capital is of major importance to
internal and external analysis because of its close
relationship with the current day-to-day operations of
a business. Every business needs funds for two
purposes:-
A. Long term funds are required to create production
facilities through purchase of fixed assets such as
plants, machineries, lands, buildings, etc.
5
B. Short term funds are required for the purchase of
raw materials, payment of wages, and other day-to-day
expenses. . It is otherwise known as revolving or
circulating capital
It is nothing but the difference between current assets
and current liabilities. i.e.
Working Capital = Current Assets – Current Liabilities.
6

Acknowledgement
I am grateful for the assistance of several
people who have contributed their ideas and valuable
suggestion for the fulfillment of this report. In this
context, I would like to thanks Mr. ………… (HOD),
Lecturers , College Name for helping me to give a
final structure of this report.
I would like to give my special thanks to Mr.
………………….. (Sales Manager), SMIIEL for providing me the
official help and mental support for the completion of
this report.
I would once again offer my sincere thanks to all
the office members for their help, without their
willingness and co-operation , nothing would have been
completed.
7
(Aarti )
INTRODUCTION
Working capital is the life blood and nerve centre of a
business. Just as circulation of blood is essential in the
human body for maintaining life, working capital is very
essential to maintain the smooth running of a business. No
business can run successfully without an adequate amount of
working capital.
Working capital refers to that part of firm’s capital which
is required for financing short term or current assets such
as cash, marketable securities, debtors, and inv entories.
8
In other words working capital is the amount of funds
necessary to cover the cost of operating the enterprise.
Meaning:
Working capital means the funds (i.e.; capital) available
and used for day to day operations (i.e.; working) of an
enterprise. It consists broadly of that portion of assets of
a business which are used in or related to its current
operations. It refers to funds which are used during an
accounting period to generate a current income of a type
which is consistent with major purpose of a firm existence.
Definition
Roland Berger Strategy Consultants study on working capital
management: Optimizing current assets helps tap into cash
potential and build buffers against insolvency
Our study entitled "Working capital – Cash for
recovery" looks at 216 European companies with total
sales of EUR 3,700 billion and total EBIT of EUR 422
billion
9
Presently, the insolvency risk is increasing as higher
cash requirements coincide with reduced cash supply and
high financing costs
Internal sources of finance are becoming more
interesting: one of the main lever is tapping into the
cash potential in working capital
The companies surveyed had a combined potential of EUR
353 billion in Q1 2009, roughly one third more than in
2008
Relative to tied-up working capital, utilities and
engineered products companies have the greatest cash
reserves hidden in their working capital
In the current economic situation, companies are facing a
higher risk of insolvency. On the one hand, they need more
cash; on the other, lenders are more tightfisted than usual
and the financing costs are higher. In its study entitled
"Working capital – Cash for recovery", Roland Berger
Strategy Consultants has analyzed 216 European companies by
taking a close look at their internal sources of finance.
10
The result? At the moment, releasing the cash reserves
hidden in working capital offers the greatest potential for
improving liquidity. According to the Roland Berger experts,
the companies surveyed had a total cash potential of EUR 353
billion. This turned out to be especially true for utilities
and engineered products companies.
"In the current recession, working capital is emerging as a
key source of internal finance," says Roland Schwientek,
Partner at Roland Berger's Operations Strategy Competence
Center. Increased cash requirements and a reduced cash
supply with higher financing costs combine to increase the
likelihood of insolvency. In their study called "Working
capital – Cash for recovery", the experts highlight
alternative sources of internal finance: "As some
traditional sources of cash have dried up, the most
promising solution is to tap into the liquidity potential
hidden in working capital," says Schwientek. According to
the experts, internal finance based on optimized working
capital is much more effective than external finance. Even
11
small improvements in receivables, inventories and payables
can generate significant reductions in external finance
requirements.
Survey of 216 European companies
The survey was based on an analysis of 216 European
companies from key industry sectors, such as automotive,
chemicals & oil, consumer goods & retail and
pharmaceuticals. The companies surveyed achieved combined
sales of EUR 3,700 billion and total EBIT of EUR 422 billion
or some 30% of the gross domestic product generated by the
EU25.
According to the Roland Berger experts, the companies
surveyed had total cash potential of EUR 353 billion in the
first quarter of 2009. The previous study conducted in 2004
had revealed no more than EUR 193 billion. Despite the
financial crisis, the cash potential was also up a full 32%
year on year. At 41%, payables offer the greatest potential,
followed by receivables (37%) and inventories (22%).
12
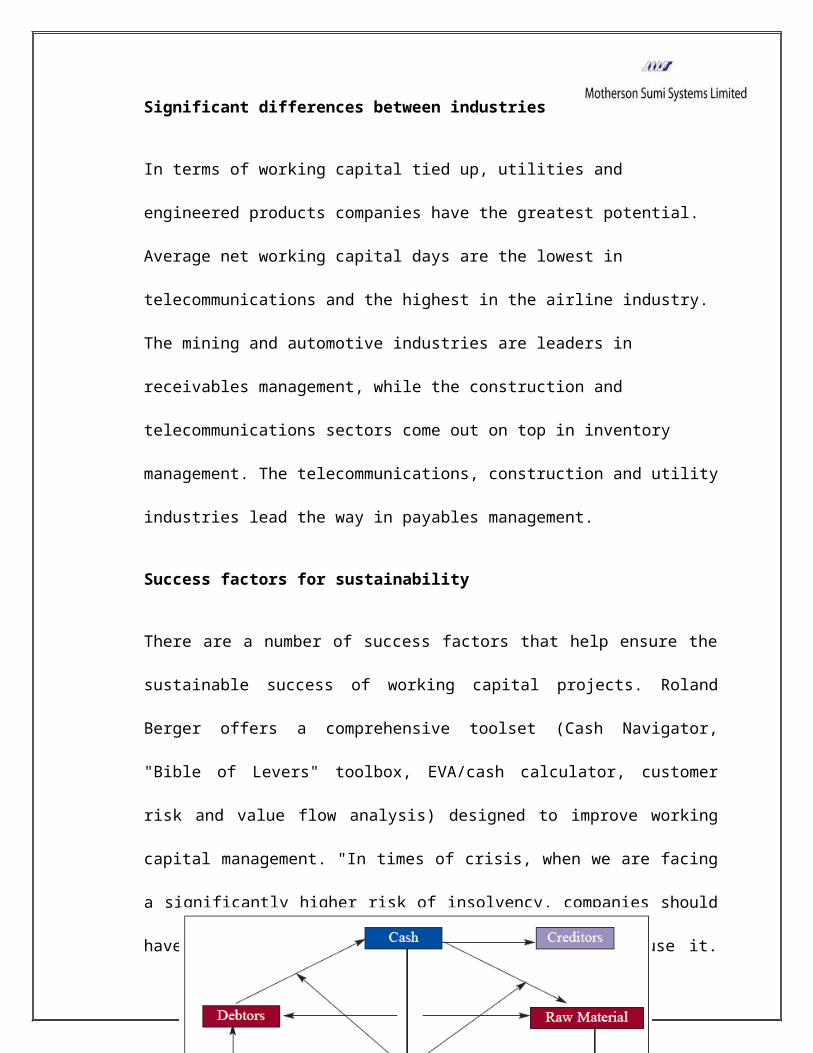
Significant differences between industries
In terms of working capital tied up, utilities and
engineered products companies have the greatest potential.
Average net working capital days are the lowest in
telecommunications and the highest in the airline industry.
The mining and automotive industries are leaders in
receivables management, while the construction and
telecommunications sectors come out on top in inventory
management. The telecommunications, construction and utility
industries lead the way in payables management.
Success factors for sustainability
There are a number of success factors that help ensure the
sustainable success of working capital projects. Roland
Berger offers a comprehensive toolset (Cash Navigator,
"Bible of Levers" toolbox, EVA/cash calculator, customer
risk and value flow analysis) designed to improve working
capital management. "In times of crisis, when we are facing
a significantly higher risk of insolvency, companies should
have a very clear idea of their potential – and use it.13

Nobody can afford to leave billions of euros idle in their
working capital," stresses Roland Berger expert Schwientek
in pointing out the need for effective working capital
management.
14
Objectives of working capital:
Every business needs some amount of working capital. It
is needed for following purposes-
For the purchase of raw materials, components and
spares.
To pay wages and salaries.
To incur day to day expenses and overhead costs such as
fuel, power, and office expenses etc.
To provide credit facilities to customers etc.
Factors that determine working capital:
The working capital requirement of a concern depend upon a
large number of factors such as
? Size of business
? Nature of character of business.
? Seasonal variations working capital cycle
? Operating efficiency
15

? Profit level.
? Other factors.
16

Sources of working capital:
The working capital requirements should be met both from
short term as well as long term sources of funds.
? Financing of working capital through short term sources of
funds has the benefits of lower cost and establishing close
relationship with banks.
? Financing of working capital through long term sources
provides the benefits of reduces risk and increases
liquidity.
Types of working capital:
Working capital can be divided into two categories-
Permanent working capital:
It refers to that minimum amount of investment in all
current assets which is required at all times to carry
out minimum level of business activities.
Temporary working capital:17
The amount of such working capital keeps on fluctuating
from time to time on the basis of business activities.
Advantages of working capital:
• It helps the business concern in maintaining the goodwill.
• It can arrange loans from banks and others on easy and
favorable terms.
• It enables a concern to face business crisis in
emergencies such as depression.
• It creates an environment of security, confidence, and
over all efficiency in a business.
• It helps in maintaining solvency of the business.
Disadvantages of working capital:
• Rate of return on investments also fall with the shortage
of working capital.
18

• Excess working capital may result into over all
inefficiency in organization.
• Excess working capital means idle funds which earn no
profits.
• Inadequate working capital cannot pay its short term
liabilities in time.
19
1.1 COMPANY PROFILESMIIEL (a unit of Motherson Sumi Systems Ltd.)
Located in Noida, India, SMIIEL (a unit of Motherson SumiSystems Ltd.) is a
commercial Tool Room supplying to a wide spectrum ofindustries. SMIEL-TD develops
small to medium size molds for a wide range of applicationswhich include, wiring
harness components, automotive applications, white goods,medical and electrical
equipment.
Product & Services of the company includes productdesigning, tool designing, tool
manufacturing, specialisation in high precision injectionmolding tools and press
stamping tools
Motherson Sumi Systems Limited is the flagship company of
the Samvardhana Motherson Group and was established in 1986.
It is a joint venture between Samvardhana Motherson Group
and Sumitomo Wiring Systems (Japan). SMIIEL is a focused,
dynamic and progressive company providing customers with
innovative and value-added products, services and solutions.
20

SMIIEL facility in Noida Sector 59
The Company is listed at the stock exchanges since 1993. The
acquisition of mirror business from Visiocorp (now renamed
as Samvardhana Motherson Reflectec) and Peguform (now named
Samvardhana Motherson Peguform) has helped SMIIEL evolve as
one of the world’s leading manufacturers of automotive rear
view mirrors and a leading manufacturers of instrument
panels, bumpers and door trims in Europe.
The company is one of the leading manufacturers of
automotive wiring harnesses and mirrors for passenger cars
in India. It is also a leading supplier of plastic
components and modules to the automotive industry. Over the
years SMIIEL has collaborated with global technology leaders
21
and has further leveraged its competency in existing areas
to create products fulfilling the technical needs of its
customers. SMIIEL and its joint ventures have invested in
state-of-the-art technologies and infrastructure to ensure
superior efficiencies & total customer satisfaction.
SMIIEL is strengthening its position as a globally preferred
solutions provider by offering end-to-end solutions
encompassing designing from basic data to prototyping,
tooling, moulding, assembly and integrated modules. The
ability to provide this end-to-end solution in each product
category and combine these solutions in the form of full
system solutions has enabled the Company to evolve as a
preferred supplier. These solutions are supported by the
flexibility to supply from any of the alternative
manufacturing bases and logistic models best suited to
customer requirements. .
SMIIEL has developed a network of manufacturing bases,
design centers, logistics centers, marketing support and
sourcing hubs across a diversified geographical base. SMIIEL
has presence in 25 countries which includes India (Noida ,
22
Gurgaon, Manesar, Faridabad , Pune, Bengaluru, Chennai,
Kandla, Pathredi, Tapukara, Lucknow & Puducherry), UAE., Sri
Lanka, Singapore, China, South Korea, Japan, Germany, UK.,
Czech Republic, Austria, Hungary, Italy, Spain, France,
Ireland, U.S.A, Mexico, South Africa, Australia, Mauritius,
Brazil, Portugal, Slovakia and Thailand to provide timely
and quality delivery to its customers worldwide. SMIIEL has
manufacturing bases across six continents - Asia, Europe,
North America, South America, Africa & Australia to support
its customers. SMIIEL’s diverse global customer base
comprises of almost all leading automobile manufacturers
globally.
The Samvardhana Motherson Group is a focused, dynamic and
progressive Group providing customers with value added
products, services and innovative solutions.
The Group has core competencies in manufacturing of
Electrical Distribution Systems (EDS), automotive rearview
mirrors and polymer processing. These competencies are
supported by specialization in engineering & design,
23
information technology, tool manufacturing and metal
machining.
Product Range
It has been SMIIEL’s endeavour to constantly add new
products in its product line with the objective of emerging
as a single-service interface for multiple customer needs.
The Company has collaborated with technology leaders in
their respective fields to bring relevant technologies for
the products required by its customers. SMIIEL’s diversity
of product range coupled with the depth within each product
portfolio, has helped the company garner leadership in its
area of operations.
The product range of the company along with its
subsidiaries and joint ventures includes:
Automotive Rear View Mirrors
Wiring Harnesses
Wires Grommets
24
Wiring Harness
Components
Seals
Tubes
Fuse Boxes
Injection Moulded Products
Blow Moulded Products
Liquid Silicone Rubber Moulded Components
Injection Moulding Tools
Extruded Rubber Products
Precision Machined Metal Components
Modules
IP/ Cockpit
Door Trims
Bumpers
Air intake
manifolds
Air filter
systems
HVAC Systems
Waste Recycling System
SMIIEL Wiring Harness Division
The wiring harness division of SMIIEL is one of the
25
largest manufacturers of wiring harnesses in India,
serving the entire cross-section of the automotive
industry. SMIIEL also supplies wiring harnesses to
Material Handling, Earth Moving and Farm Equipment, White
Goods & Electronics, Elevators, Office Automation and
Medical Equipment industries.
The Samvardhana Motherson Group is a focused, dynamic and
progressive Group providing customers with value added
products, services and innovative solutions.
The Group has a diversified product range to serve multiple
industries, with automotive industry being the main industry
served.
The Group business portfolio comprises electrical
distribution systems (wiring harnesses), automotive rearview
mirrors, polymer processing, injection moulding tools,
elastomer processing, modules and systems, machined metal
products, cutting tools, IT services, engineering & design,
CAE services, vehicle air conditioning systems, lighting
26
systems, cabins for off-highway vehicles, cutting tools and
thin film coating metals.
The Group has invested in technologies that provide
manufacturing support, including compressors, paint coating
equipment, auxiliary equipment for injection moulding
machines and automotive manufacturing engineering services.
Key Facts
One of the largest manufacturers of exterior rearview
mirrors in the world
One of the largest manufacturers of IP modules, door trims
and bumpers in Europe
One of the largest manufacturers in India for:
Wiring harnesses and rearview mirrors for passenger cars
Moulded components and modules
Cabins for large size dump trucks
Gear cutting tools.
27
CBN & PCD cutting tools.
Plastic air intake manifold.
Presence in 25 countries across the globe.
Group Turnover USD 5.4 billion approx. ( 2012-13)
Joint ventures in key technology areas.
Over 62, 000 qualified professionals.
28
History
1975
Motherson was founded
1977
First Cable factory started
1983
Technical agreement with Tokai
Electric Co. (Now Sumitomo Wiring
Systems - Japan) for Wiring Harness
1986
JV with Sumitomo Wiring
Systems Japan
1989
Injection Moulding
1992
Cutting Tool Manufacturing
29
1994
Tool Room for small and Medium
sized Moulds (upto 650 Tons)
1995
Cockpit Assemblies
Automotive Mirrors
1997
Blow Moulding
1998
Rubber Injection Moulding
1999
First Overseas office
established (Austria)
2000
IT and Design Company
Representetive Office at Singapore
2001
Liquid Silicon Rubber Injection
moulding
30
Machined Metal Components
2002
Wiring Harness manufacturing
at Sharjah
Design Centre at Ireland
2003
Offices in USA & UK established
Tool Room at Sharjah
2004
European Headquaters at Germany
Sheet Metal Die Design
2005
Injection Moulding & metal
Machining in Germany
JVs for
o Environment Management Systems
o Automotive Manufacturing
Engineering
Plastic Moulding & Metal Machining
at Germany
31
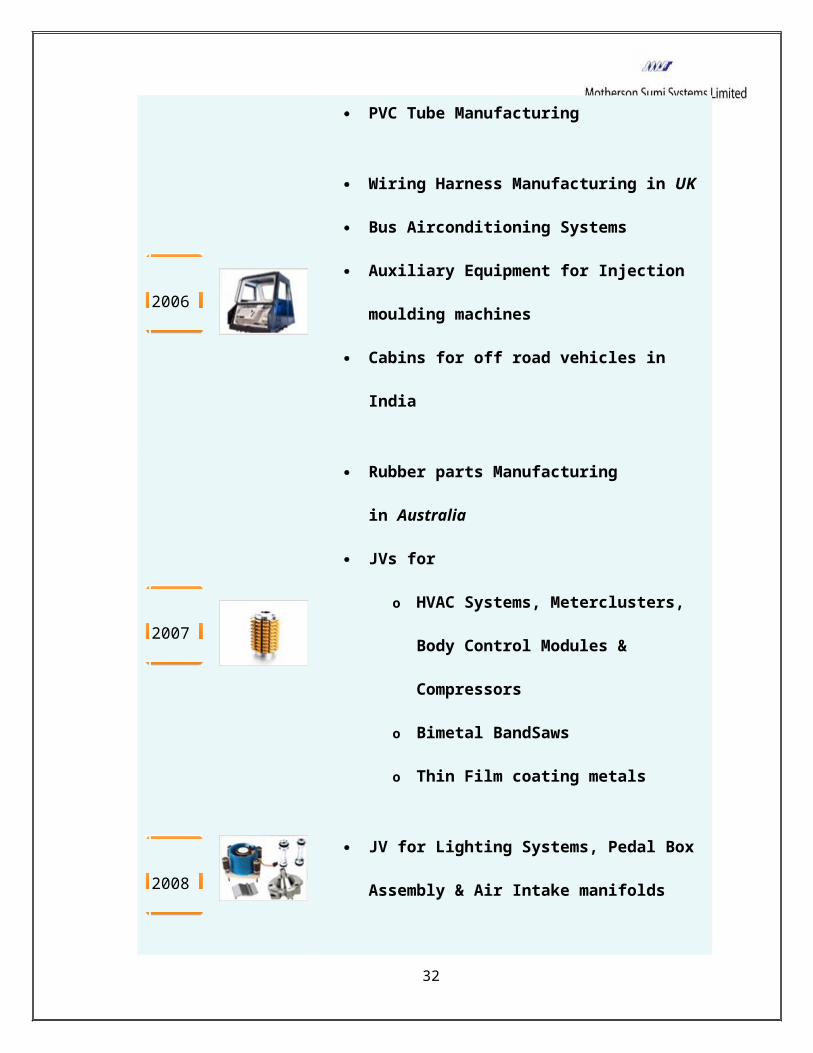
PVC Tube Manufacturing
2006
Wiring Harness Manufacturing in UK
Bus Airconditioning Systems
Auxiliary Equipment for Injection
moulding machines
Cabins for off road vehicles in
India
2007
Rubber parts Manufacturing
in Australia
JVs for
o HVAC Systems, Meterclusters,
Body Control Modules &
Compressors
o Bimetal BandSaws
o Thin Film coating metals
2008
JV for Lighting Systems, Pedal Box
Assembly & Air Intake manifolds
32
JV for Precision machined metal
components
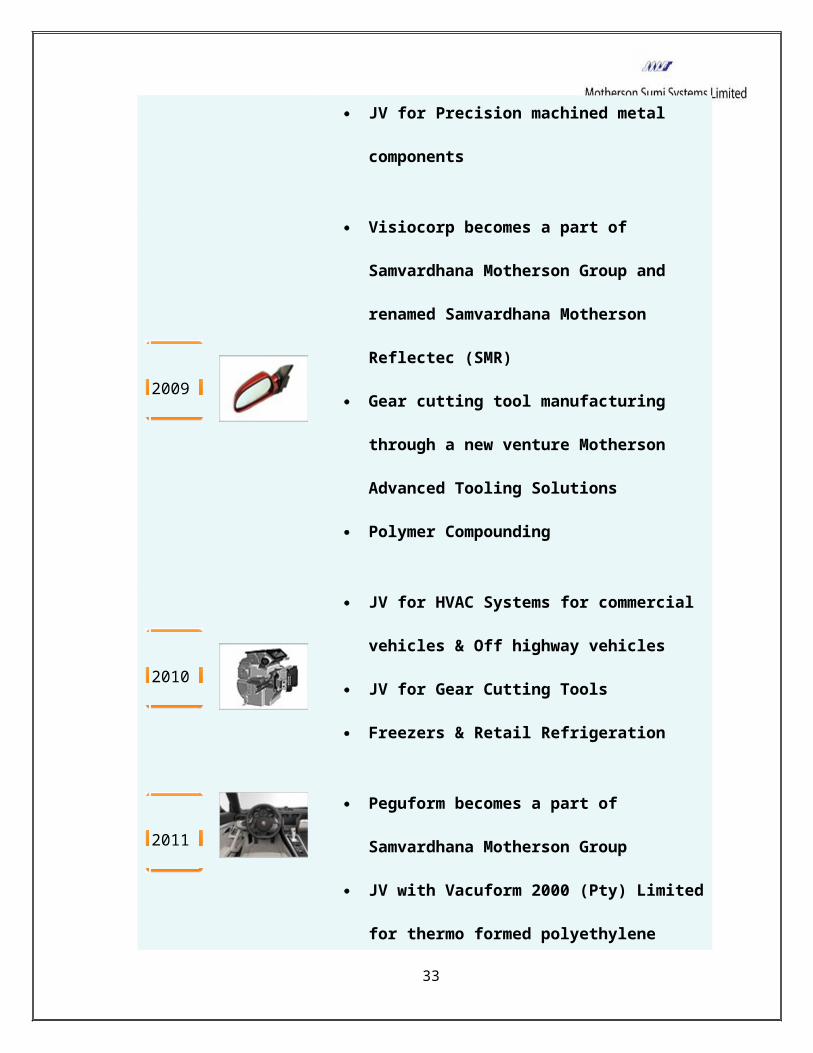
2009
Visiocorp becomes a part of
Samvardhana Motherson Group and
renamed Samvardhana Motherson
Reflectec (SMR)
Gear cutting tool manufacturing
through a new venture Motherson
Advanced Tooling Solutions
Polymer Compounding
2010
JV for HVAC Systems for commercial
vehicles & Off highway vehicles
JV for Gear Cutting Tools
Freezers & Retail Refrigeration
2011
Peguform becomes a part of
Samvardhana Motherson Group
JV with Vacuform 2000 (Pty) Limited
for thermo formed polyethylene
33
components and blow moulded
components for automotive and other
applications.
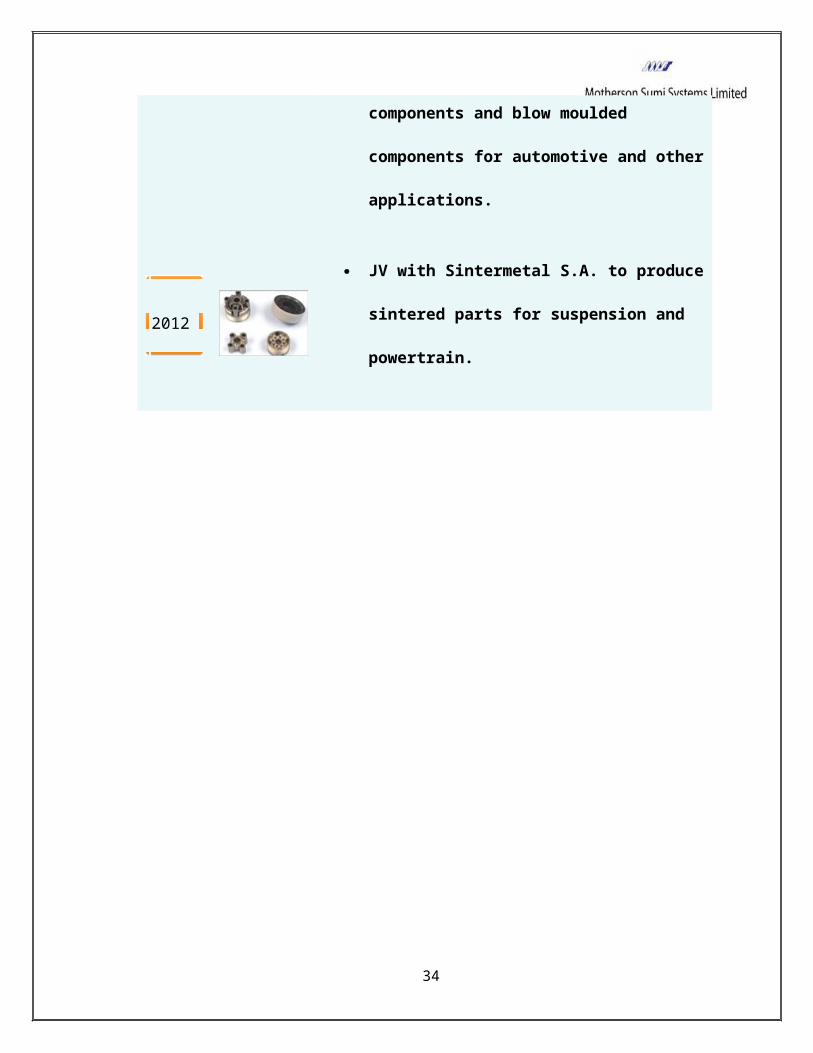
2012
JV with Sintermetal S.A. to produce
sintered parts for suspension and
powertrain.
34
1.2 OBJECTIVES OF THE STUDY
The study areas for this Project include various
functions of Finance department. The main objectives
for the project are as follows:
To analyze the Working Capital of the Company and
also analyze its various determinants in the
Company.
To measure the size of Working Capital in a Power
Generating Company,
To determine the efficiency of Working Capital and
measure the Operational Efficiency of the Company.
35
LIMITATIONS OF THE STUDY
As each project has its own limits, I also face certain
constraints during my project. I tried my best to
overcome these limits but still certain boundaries
cannot be broken. Limitations of report are:
Before coming to this organization I had very
little knowledge of working capital management.
Though I have gone through extensive study, I must
admit that I had tried my best to give expert
comments on the topic.
Eight Weeks time was not sufficient to understand
the topic to the expertise level or I can say to
understand the topic in a comprehensive manner.
Hence this research report has a time constraint
with it.
The data, on which the whole report is based, is
comparison of three years i.e. 2010, 2011 and 2012
36
as it is difficult to compare lot of data in short
span of time.
This project report has been completed keeping in
mind the pocket limit.
The survey has been carried out in the corporate
office itself and not the manufacturing plants. So
the information about the inventory may be exact
or may be having some differences with actual
figures.
As information on core working capital is hard to
get and difficult to explain, it is based just on
the minimum inventory level. It might leave the
reader with his/her doubts.
Most of the report is based on the Secondary data using
financial ratios but still, one doubt give rise to some
other doubt, which is actually a major constraint in
every research project.
37
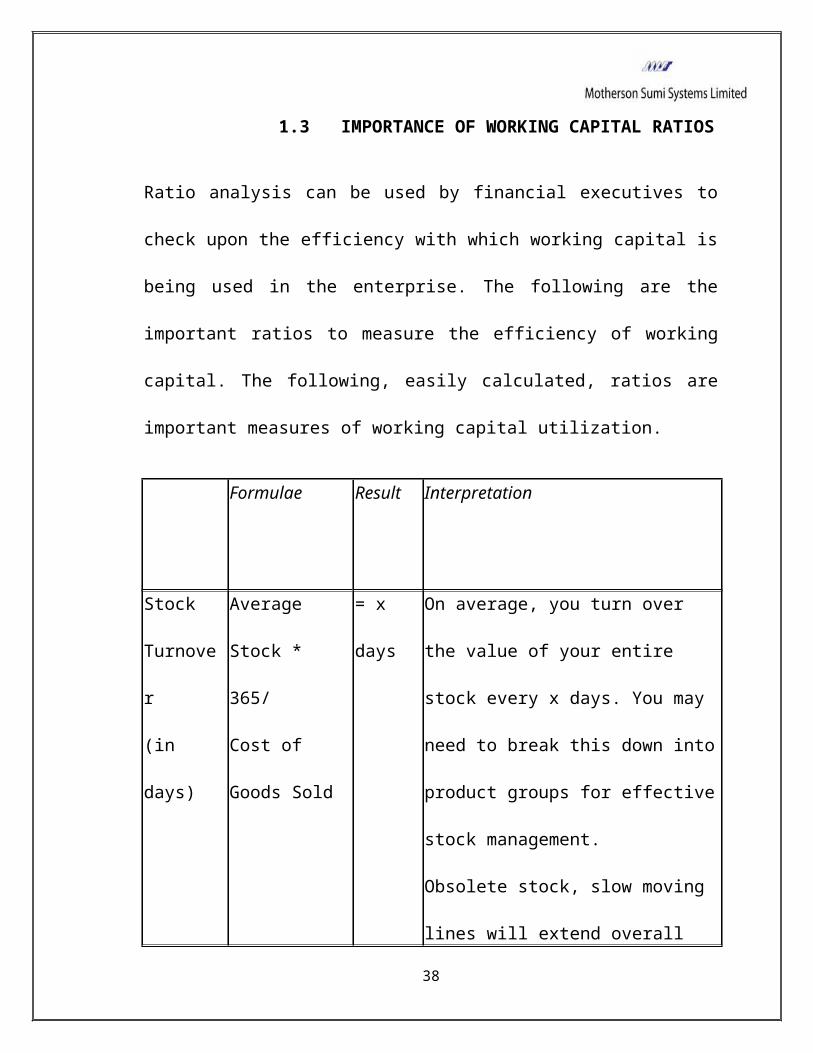
1.3 IMPORTANCE OF WORKING CAPITAL RATIOS
Ratio analysis can be used by financial executives to
check upon the efficiency with which working capital is
being used in the enterprise. The following are the
important ratios to measure the efficiency of working
capital. The following, easily calculated, ratios are
important measures of working capital utilization.
Formulae Result Interpretation
Stock
Turnove
r
(in
days)
Average
Stock *
365/
Cost of
Goods Sold
= x
days
On average, you turn over
the value of your entire
stock every x days. You may
need to break this down into
product groups for effective
stock management.
Obsolete stock, slow moving
lines will extend overall
38
stock turnover days. Faster
production, fewer product
lines, just in time ordering
will reduce average days.
Receiva
bles
Ratio
(in
days)
Debtors *
365/
Sales
= x
days
It takes you on average x
days to collect money due to
you. If your official credit
terms are 45 days and it
takes you 65 days... why?
One or more large or slow
debts can drag out the
average days. Effective
debtor management will
minimize the days.
Payable
s Ratio
(in
days)
Creditors *
365/
Cost of
Sales (or
= x
days
On average, you pay your
suppliers every x days. If
you negotiate better credit
terms this will increase. If
39
Purchases) you pay earlier, say, to get
a discount this will
decline. If you simply defer
paying your suppliers
(without agreement) this
will also increase - but
your reputation, the quality
of service and any
flexibility provided by your
suppliers may suffer.
Current
Ratio
Total
Current
Assets/
Total
Current
Liabilities
= x
times
Current Assets are assets
that you can readily turn in
to cash or will do so within
12 months in the course of
business. Current
Liabilities are amount you
are due to pay within the
coming 12 months. For
40
example, 1.5 times means
that you should be able to
lay your hands on $1.50 for
every $1.00 you owe. Less
than 1 times e.g. 0.75 means
that you could have
liquidity problems and be
under pressure to generate
sufficient cash to meet
oncoming demands.
Quick
Ratio
(Total
Current
Assets -
Inventory)/
Total
Current
Liabilities
= x
times
Similar to the Current Ratio
but takes account of the
fact that it may take time
to convert inventory into
cash.
Working (Inventory As % A high percentage means that
41
Capital
Ratio
+
Receivables
-
Payables)/
Sales
Sales working capital needs are
high relative to your sales.
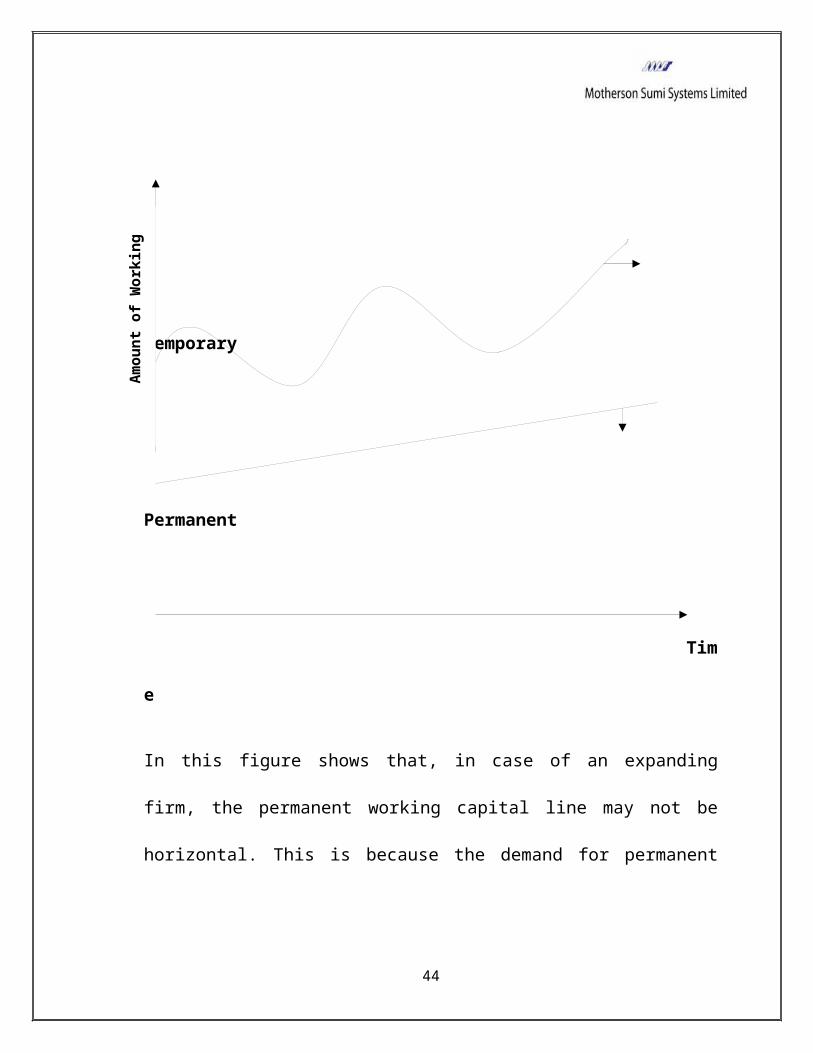
LITERATURE REVIEWRELATIONSHIP B/W PERMANENT AND TEMPORARY WORKING CAPITAL
42
Permanent and Temporary Working Capital
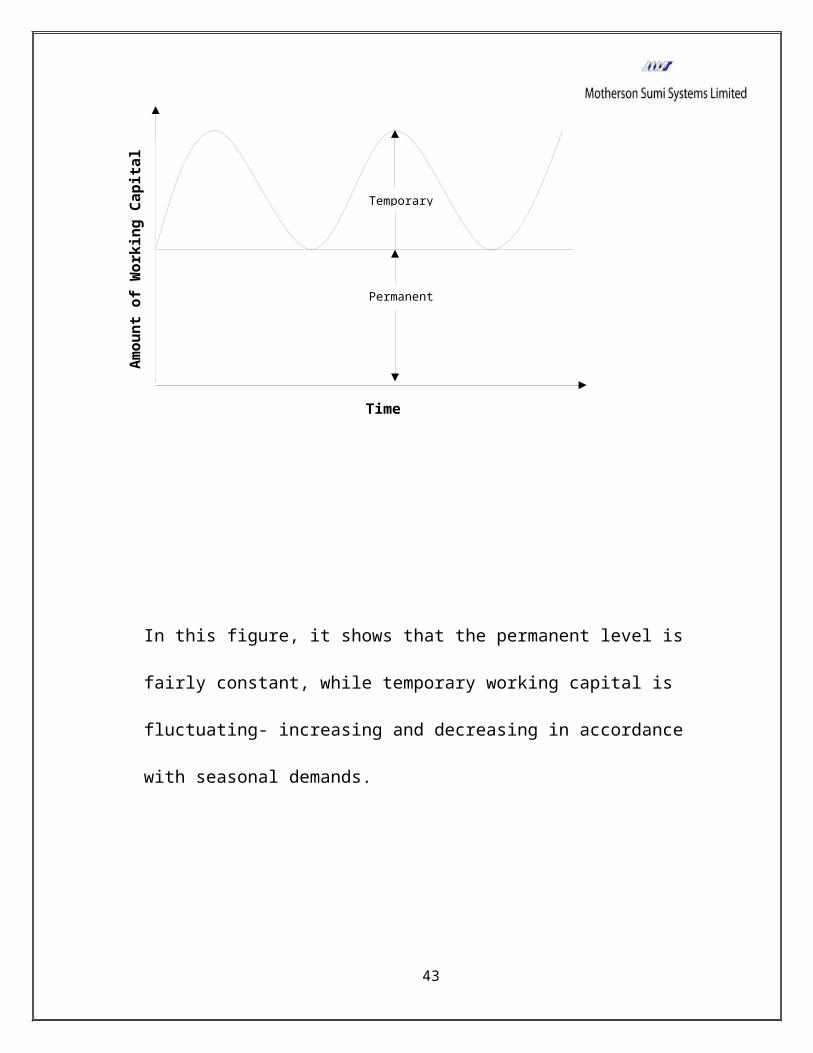
In this figure, it shows that the permanent level is
fairly constant, while temporary working capital is
fluctuating- increasing and decreasing in accordance
with seasonal demands.
43
Temporary
Permanent
Amou
nt o
f Work
ing
Capita
l
Time
Temporary
Permanent
Tim
e
In this figure shows that, in case of an expanding
firm, the permanent working capital line may not be
horizontal. This is because the demand for permanent
44
Amou
nt o
f Work
ing
Capi
tal
current assets might be increasing or decreasing to
support a rising level of activity.
COMPONENTS OF WORKING CAPITAL
There are two components of working capital:
Current Assets: Current assets are those assets which
can be converted into cash in the normal course of
business within a short period say a maximum of one
year. They are also called floating or circulating
assets because they cannot be put to constant use. The
list of current assets is:
1. Cash in hand & Bank balances.
2. Bills Receivables.
3. Sundry Debtors.
4. Short term loans and advances.
5. Inventories of stocks
6. Prepaid expenses.
7. Accrued income.
45
Current Liabilities: Current Liabilities are those
liabilities which are intended to be paid in the
ordinary course of business within a short period of
normally one accounting year out of the current assets
or the income of the business. Example of current
liabilities is:
1. Bills Payable.
2. Sundry creditors or Accounts payable.
3. Accrued or outstanding Expenses.
4. Short term loans and advances and deposits.
5. Bank overdraft.
WORKING CAPITAL CYCLE
Cash flows in a cycle into, around and out of a
business. It is the business's life blood and every
manager's primary task is to help keep it flowing and
to use the cash flow to generate profits. If a business
is operating profitably, then it should, in theory,
46
generate cash surpluses. If it doesn't generate
surpluses, the business will eventually run out of cash
and expire.
The faster a business expands the more cash it will
need for working capital and investment. The cheapest
and best sources of cash exist as working capital right
within business. Good management of working capital
will generate cash will help to improve profits and
reduce risks. Bear in mind that the cost of providing
credit to customers and holding stocks can represent a
substantial proportion of a company's total profits.
There are two elements in the business cycle that
absorb cash - Inventory (stocks and work-in-progress)
and Receivables (debtors owing you money). The main
sources of cash are Payables (your creditors) and
Equity and Loans.
47
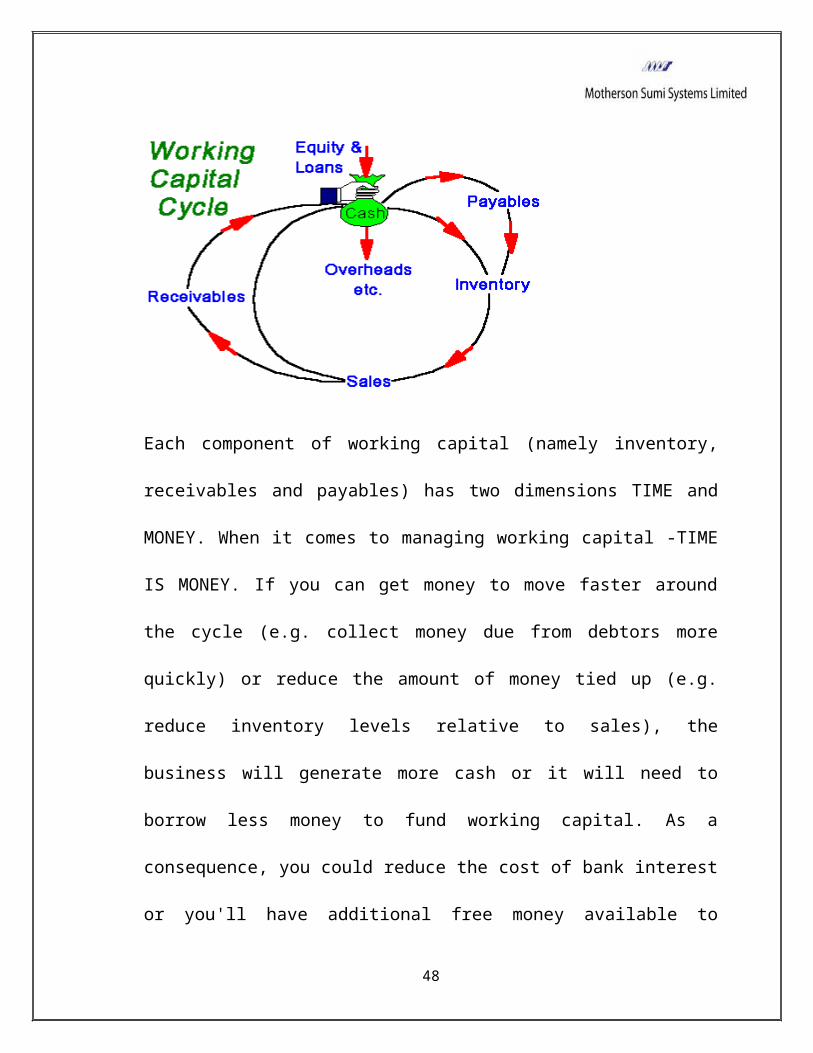
Each component of working capital (namely inventory,
receivables and payables) has two dimensions TIME and
MONEY. When it comes to managing working capital -TIME
IS MONEY. If you can get money to move faster around
the cycle (e.g. collect money due from debtors more
quickly) or reduce the amount of money tied up (e.g.
reduce inventory levels relative to sales), the
business will generate more cash or it will need to
borrow less money to fund working capital. As a
consequence, you could reduce the cost of bank interest
or you'll have additional free money available to
48
support additional sales growth or investment.
Similarly, if you can negotiate improved terms with
suppliers e.g. get longer credit or an increased credit
limit; you effectively create free finance to help fund
future sales.
More businesses fail for lack of cash than for want of
profit.
Need for Working Capital
A successful sales program is necessary for earning
profits by any business enterprise. However sales do
not convert into cash instantly; there is invariably a
time lag between the sale of goods and receipts of
cash.
A sufficient amount of working capital is necessary to
sustain sales activity. Technically this is referred to
as the operating or cash cycle.
49

The operating cycle can be said to at the heart of the
need for working capital.
50
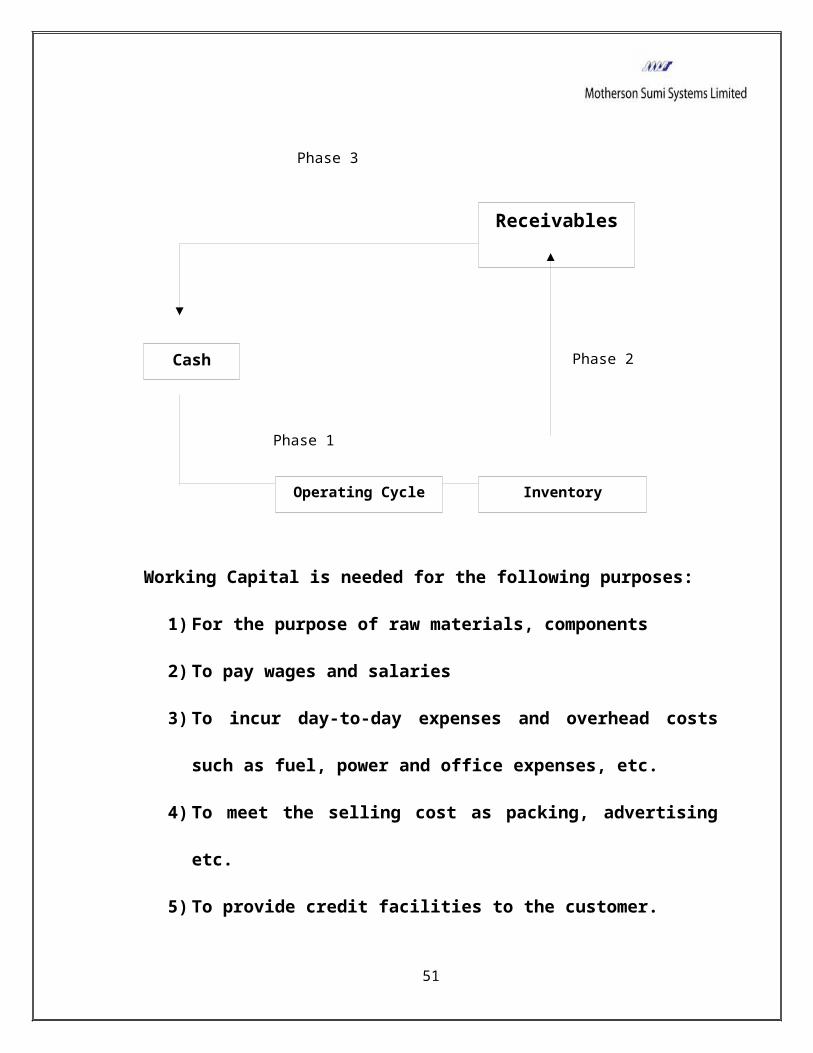
Working Capital is needed for the following purposes:
1) For the purpose of raw materials, components
2) To pay wages and salaries
3) To incur day-to-day expenses and overhead costs
such as fuel, power and office expenses, etc.
4) To meet the selling cost as packing, advertising
etc.
5) To provide credit facilities to the customer.
51
Cash
Receivables
Inventory
Phase 1
Phase 2
Phase 3
Operating Cycle

6) To maintain the inventories of raw material, work-
in-progress and finished goods.
52
DETERMINANTS OF WORKING CAPITAL
General nature of business
The working capital requirements of an enterprise are
basically related to the conduct of the business. The
public utilities have certain features which have a
bearing on their working capital needs. The two
relevant features are:
1. The cash nature of the business that is cash
sales.
2. Sale of services rather than commodities.
At the other extreme are trading and financial
enterprises. The nature of their business is such that
they have to maintain a sufficient amount of cash,
inventories and book debts. The proportion of current
assets to total assets measures the relative
requirements of working capital of various industries.
Production Cycle
53
The term production cycle or manufacturing cycle refers
to time involved in the manufacture of goods. It covers
the time span between the procurement of raw materials
and the completion of the manufacturing process leading
to the production of finished goods. Funds have to be
necessarily tied up during the process manufacturing
necessitating enhanced working capital. In other words,
there is some time gap before raw material converts to
finished goods. To sustain such activities the need for
working capital is obvious. The longer the times span
(i.e. the production cycle), the larger will be the
tied up funds and, therefore, the larger is the working
capital needed and vice versa.
Business Cycle
The working capital requirements are also determined by
the nature of the business cycle. Business fluctuations
leading to cyclical and seasonal changes that, in turn,
cause a shift in the working capital position,
54
particularly for temporary working capital
requirements. The variations in business conditions may
be in two directions:-
1. Upswing phase when boom conditions prevail.
2. Downswing phase when economic activity is marked
by decline.
During the upswing of business activity, the need for
working capital is likely to grow to cover the lag
between increased sales and receipt of cash as well as
to finance purchases of additional material to cater to
the expansion of the level of activity. Additional
funds may be required to invest in plant and machinery
to meet the increased demand. The downswing phase of
business cycle has exactly an opposite effect on the
level of working capital requirement. The need for
working capital in recessionary conditions is bound to
decline. Thus business fluctuations influence the size
of working capital mainly through the effect on
55
inventories. The response of inventory to business
cycles is mild or violent according to nature of the
business policy.
Production Policy
In the case of certain business the demand for products
is seasonal, the production policy followed in such
case have two options open to such steady enterprises
are :-
Either they confine their production only to periods
when goods are purchased or they follow a steady
production policy throughout the year and produce goods
at a level to meet the peak demand. Working capital
planning has to incorporate this pattern of
requirements of funds when production and seasonal
sales are steady. The nature of some products may be
such that accumulation of inventories may create a
special risk and cost problems. For them, a production
policy in tune with the changing demands may be
56
preferable. Therefore, production policies have to be
formulated on the basis of individual setting of each
enterprise and the magnitude and dimension of the
working capital problems will accordingly vary.
Credit Policy
The credit policy influences the requirement of working
capital in two ways:-
1. Through credit terms granted by the company to its
customers/ buyers of goods.
2. Credit terms available to the company from its
creditors.
The credit terms granted to customers have a bearing on
the magnitude of working capital by determining the
level of book debts. The credit sales result in higher
book debts (receivables). Higher book debts mean more
working capital. The working capital requirements of a
business are, thus affected by the terms of purchase
57
and sale, and the role given to credit by a company in
its dealings with creditors and debtors.
The prevailing trade practices as well as changing
economic conditions affect credit terms fixed by an
enterprise. Adoption of rationalized credit policies
are a significant factor in determining the working
capital needs of an enterprise. A company that operates
in a highly competitive market to win and retain
customers may be forced to offer generous credit terms
to them. The investment in book debts will consequently
be of a higher order, necessitating large working
capital in another way. The degree of competition is,
therefore, an important factor influencing working
capital requirements.
Growth and Expansion
As a company grows its logical to expect that a larger
amount of working capital is required. It is difficult
to determine precisely the relationship between the
58
growth in volume of business of a company and the
increase in its working capital. The composition of
working capital in a growing company also shifts with
economic circumstances and corporate practices. The
critical fact, however, is that the need for planning
of working capital is, therefore, a continuing
necessity for a growing concern.
Vagaries in the Availability of Raw Material
There may be some materials, which cannot be procured
easily either because of their sources, are few or they
are irregular. To sustain smooth production, therefore,
the company might be compelled to purchase and stock
them far in excess of genuine production needs. This
will result in an excessive inventory of such
materials. Procurement of some essential raw materials
is difficult because of their sporadic supply. This
happens very often with raw materials that are in short
supply and are controlled to ensure equitable
59
distribution. The buyer has in such cases very limited
options as to the quantum and timing of procurement. It
may so happen that a bulk consignment may be available
but the company may be short of funds, while when
surplus funds are available the commodities may be in
short supply. This element of uncertainty would lead to
a relatively high level of working capital.
Profit Level
The level of profits earned differs from enterprise to
enterprise. The nature of the product, hold on the
market, quality of management and monopoly power would
by and large determine the profit earned by a company.
It can be generalized that a company dealing in a high
quality product, having a good marketing arrangement
and enjoying monopoly power in the market, is likely to
earn high profits and vice versa. Higher profit margin
would improve the prospects of generating more internal
funds thereby contributing to the working capital pool.
60
The net profit is a source of working capital to the
extent that it has been earned in cash. In practice,
the net cash inflows from operations cannot be
considered as cash available for use at the end of cash
cycle. Even as a company’s operations are in progress,
cash is used for augmenting stock, book debts and fixed
assets. It must, therefore be seen that cash generation
has been used for furthering the interest of the
enterprise. The availability of internal funds for
working capital requirements is determined not merely
by the profit margin but also by the manner of
appropriating profits. The availability of such funds
would depend upon the profits appropriations for
taxation, dividend, reserves and depreciations.
Level of taxes
The first appropriation out of profit is payment or
provision for tax. The amount of taxes to be paid is
determined by prevailing tax regulations. The
61
management has no discretion in this respect. Very
often taxes have to be paid in advance on the basis of
the profit of proceeding year. Tax liability is, in a
sense, short – term liability payable in cash. An
adequate provision for tax payments is, therefore an
important aspect of working capital planning. If tax
liability increases, it leads to an increase in the
requirement of working capital and vice versa. The
service of tax experts can be availed of to take
advantage of the various concessions and incentive
through avoidance as opposed to evasion of taxes. Tax
planning can, therefore, be said to be an integral part
of working capital planning.
Dividend Policy
Another appropriation out of profits that has a bearing
on working capital is dividend payment. The payment of
dividend consumes cash resources and thereby, affects
working capital to that extent. If the company does not
62
pay dividend but retains the profits, working capital
increases. A company should retain profits to preserve
cash resources and, at the same time, it must pay
dividends to satisfy the expectations of investors.
When profits are relatively small, the choice is
between retention and payment. There are wide
variations in industry practices as regards the
interrelationship between working capital requirements
and dividend payment. In some cases, shortage of
working capital has been a powerful reason for reducing
or even skipping dividends in cash. There are
occasions, on the other hand, when dividend payments
are continued in spite of inadequate earnings in a
particular year because of sound liquidity. Dividend
policy is thus, a significant element in determining
the level of working capital in an organization.
Depreciation Policy
63
Depreciation policy also exerts an influence on the
quantum of working capital. Depreciation charges do not
involve any cash outflows. The effect of depreciation
policy on working capital is, therefore, indirect.
Depreciation affects the tax liability and retention of
profits. Depreciation is allowable expenditure in
calculating net profits. Enhanced rates of depreciation
lower the profits and, therefore, the tax liability
and, thus more cash profits. Higher depreciation also
means lower disposable profits and, therefore, a
smaller dividend payment. Thus cash is preserved. If
current capital expenditure falls short of the
depreciation provision, the working capital position is
strengthened and there may be no need for short-term
borrowing. If on the other hand, the current capital
expenditure exceeds the depreciation provision; either
outside borrowing will have to be adapted to prevent
the working capital position from being adversely
64
affected. It is in these ways that depreciation policy
is relevant to the planning of working capital.
Price Level Changes
Changes in the price level also affect the requirements
of working capital. Rising prices necessitate the use
of more funds for maintaining an existing level of
activity. For the same level of current assets higher
cash outlay are required. The effect of rising prices
is that a higher amount of working capital is needed.
The implications of changing price levels on working
capital position vary from company to company depending
on the nature of its operations, it’s standing in the
market and other relevant considerations.
Operating Efficiency
The operating efficiency of the management is also an
important determinant of the level of working capital.
65
The management can contribute to a sound working
capital position through operating efficiency. Although
the management cannot control the rise in prices, it
can ensure the efficient utilization of resources by
eliminating waste, improving coordination, and a fuller
utilization of existing resources, and so on.
Efficiency of operations accelerates the pace of cash
cycle and improves the working capital turnover. It
releases the pressure on working capital by improving
profitability and improving the internal generation of
funds.
66

FACTORS AFFECTING WORKING CAPITAL MANAGEMENT
1) Nature and Size of Business:
The requirement of working capital of a firm is widely
related to the nature and size of business unit. For
example, trading and financial firms require a large
amount of investment in working capital but a
significantly smaller amount of investment in fixed
assets. Similarly, a service oriented firm, e.g.
transport or electricity generation, needs a modest
working capital requirement since it has a very short
operating cycle and sales are made on cash basis.
Moreover, the size of the firm is also important factor
because, smaller firm needs smaller amount of working
capital on the basis of its production activities and
vice-versa.
2) Length of Production cycle: The time taken to
convert raw material into finished product is
known as the production cycle. The level of
67
working capital depends upon the production cycle.
Longer the production cycle, more will be the need
for working funds in order to finance the current
assets during the prolonged manufacturing cycle
and vice-versa.
3) Seasonal Operation: If a firm is operating in
goods and services having seasonal fluctuation in
demand, then the working capital requirement will
also fluctuate with every change. In cold drink
factory, the demand will certainly be high during
summer season and therefore, more working capital
is required to maintain higher production.
4) Market Competitiveness: The market
competitiveness has an important bearing on the
working capital needs of a firm. In view of the
competitive conditions prevailing in the market,
the firm may have to offer liberal credit firm to
the customer resulting in hire debtors.
68

5) Credit Policy: The credit policy means the
totality of terms and conditions on which goods
are sold and purchased. A firm has to interact
with two types of credit policies at a time. For
example, a firm might be purchasing goods and
services on credit terms but selling goods only
for cash. The working capital requirement of this
firm will be lower than that of a firm which is
purchasing cash but has to sell on credit basis.
6) Supply Conditions: The time taken by supplier of
raw materials, goods etc after placing an order,
also determines the working capital requirements.
A goods a received as soon as or in a short period
after placing an order, then the purchaser will
not like to maintain a high level of inventory of
that goods and vice-versa.
7) Growth and Diversification of Business: Growth
and Diversification of business call for larger
69
volume of working fund. The need of increased
working capital does not follow the growth of
business operations but precedes it. Working
capital needs is in fact assessed in advance in
reference to the business plan.
8) Other Factors: For example, banking relation,
price level changes, operating efficiency,
taxation policy, dividend policy etc. also
influence the requirement of working capital.
IMPORTANCE OF ADEQUATE WORKING CAPITAL
1) Solvency of the Business: Adequate working capital
helps in maintaining solvency of the business by
providing uninterrupted flow of production.
2) Goodwill: Sufficient working capital enables a
business concern to make prompt payments and hence
helps in creating and maintaining goodwill.
3) Easy Loans: A concern having adequate working
capital, high solvency and goods credit standing
70
can arrange loans from banks and other financial
institutions on easy and favourable terms.
4) Cash Discount: Adequate working capital also
enables a concern to avail cash discounts on the
purchases and hence it reduces the cost.
5) Regular supply of raw material: Sufficient working
capital ensures regular supply of raw materials
and continuous production.
6) Ability to face crises: Adequate working capital
enables a concern to face business crises in
emergencies, such as, depression because during
such period, generally, there is much pressure on
working capital.
7) High morale: Adequacy of working capital creates
and environment of security, confidence, high
morale and creates overall efficiency in a
business.
IMPACT/HARM OF REDUNDANT OR EXCESSIVE WORKING CAPITAL
71
* Excessive WC means idle funds, which earn no profits
for the business, cannot earn proper rate of return on
its investment.
* When there is a redundant WC, it may lead to
unnecessary purchasing and accumulation of inventories
causing more chances if theft, waste and losses.
* Excessive WC implies excessive debtors and defective
credit policy, which may cause higher incidences of bad
debts.
* It may result into overall inefficiency in the
organizations.
* When there is excessive WC relation with banks and
other financial institutions may not be maintained.
* The redundant WC gives rise to speculative
transaction.
72
* Due to low rate of return on investments the value of
shares may also fall.
* In case of redundant WC there is always a chance of
financing long terms assets from short terms funds,
which is very harmful in long run for any organization.
DANGER OF SHORT OR INADEQUATE WORKING CAPITAL
*A concern, which had inadequate WC, cannot pay its
short-term liabilities in time. Thus it will lose its
reputation and should be not be able to get good credit
facilities.
* It cannot buy its requirements in bulk and cannot
avail discounts. It stagnates growth.
73
* It becomes difficult for the firms to exploit
favourable market conditions and undertake profitable
projects due to non-availability of WC funds.
* The firm cannot pay day-to-day expenses of its
operations and its credit inefficiencies, increases
cost and reduces the profits of the business.
* It becomes impossible to utilize efficiently the
fixed assets due to non-availability of liquid funds
thus, the firm’s profitability would deteriorate.
* The rate of return on investments also falls with the
shortage of WC.
* Operating inefficiency creeps in and it will become
difficult to implement operating plans and achieve the
firms profit targets.
74
FACTORS REQUIRING CONSIDERATION WHILE ESTIMATING
WORKING CAPITAL
The average credit period expected to be allowed
by suppliers.
Total costs incurred on material, wages.
The length of time for which raw material are to
remain in stores before they are issued for
production.
The length of the production cycle (or) work in
progress.
The length of sales cycle during which finished
goods are to be kept waiting for sales.
The average period of credit allowed to customers.
The amount of cash required to make advance
payment.
75
RESEARCH METHODOLOGY
The study is conducted based on secondary data sources.
Secondary sources of data mainly include annual reports
of SMIIEL. Statement of changes in working capital for
the past 5 years is done using the data taken from
these financial reports. Similarly time series analysis
of operating cycle and calculations of ratios is done.
Apart from this, the website of SMIIEL. is referred
to know the services, services facilities, network etc.
Industry analysis is done based on the information
76
gathered from newspapers and websites of Indian steel
ministry & other sector related websites.
WORKING CAPITAL ANALYSIS
The basic goal of Working Capital Management is to
manage the current assets and current liabilities of a
firm in such a way that the level of Working Capital is
77
neither inadequate nor excessive as both the situations
are bad for any firm. There should be no shortage of
funds and also no working capital should be idle.
Working Capital Management policies have a great impact
on the profitability, liquidity and structural health
of the firm. So working capital management can be seen
as three dimensional in nature as it is concerned with-
1. Formulation of Policies with reference to
profitability, liquidity and risk.
2. Decisions about the composition and level of
current assets.
3. Decisions about the composition and level of
current liabilities
Working Capital Analysis: Adequate amount of working
capital is very much essential for the smooth running
of any business. It directly affects the liquidity
positions of the firm. Hence it is necessary to
78
evaluate the efficiency with which the working capital
is employed in the business. This can be achieved by
carrying out the Working Capital Analysis.
The analysis of working capital can be conducted
through a number of devices such as:
1. Ratio Analysis
2. Funds Flow Analysis
3. Budgeting
Ratio Analysis: A ratio is a simple arithmetical
expression one number to another. The technique of
ratio analysis can be employed for measuring short-term
liquidity or working capital position of a firm. The
following ratios can be calculated for the purpose of
(a) Liquidity Ratios and (b) Current Assets movements
Ratios
79

Fund Flow Analysis: Fund flow analysis is a technical
device designated to study the sources from which
additional funds were derived and the use to which
these sources were put. The fund flow analysis consists
of (a) Preparing schedule of changes of working capital
and (b) Statement of sources and application of funds.
It is an effective management tool to study the changes
in financial position (working capital) business
enterprise between beginning and ending of the
financial dates.
Working Capital Budget: A budget is a financial or
quantitative expression of business plans and policies
to be pursued in the future time period. Working
Capital budget as a part of the total budgeting process
of a business is prepared estimating future long term
and short term working capital needs and sources to
finance them, and then comparing the budgeted figures
with actual performance for calculating the variances,
80
if any, so that corrective actions may be taken in
future. The objective of working capital budget is to
ensure availability of funds as and when needed, and to
ensure effective utilization of these resources.
Analysis of Short Term Financial Position of the Firm
(Ratio Analysis):
1. Liquidity Ratio: Liquidity refers to the ability of
a firm to meet its current obligations as and when
these become due. The short-term obligations are
met by realizing amount from current, floating or
circulating assts. The
current assets should either be liquid or near about
liquidity. These should
be convertible in cash for paying obligations of
short-term nature. The sufficiency or insufficiency of
current assets should be assessed by comparing
them with short-term liabilities. If current assets can
pay off the current81
liabilities then the liquidity position is
satisfactory. On the other hand, if the
current liabilities cannot be met out of the current
assets, then the liquidity
position is bad. To measure the liquidity of a firm,
the following ratios can be
calculated:
a) Current Ratio
b) Quick Ratio
c) Absolute Liquid Ratio
2. Efficiency Ratio or Current Asset Movement Ratio:
Funds are invested in various assets in business to
make sales and earn profits. The efficiency with which
assets are managed directly affects- the volume of
82
sales. The better the management of assets, larger is
the amount of sales and profits. Current assets
movement ratios measure the efficiency with which a
firm manages its resources. These ratios are called
turnover ratios because they indicate the speed with
which assets are converted or turned over into sales.
Depending upon the purpose, a number of turnover ratios
can be calculated. Some are -
a) Working capital Turnover Ratio
b) Debtors Turnover Ratio
c) Average Collection Period
83
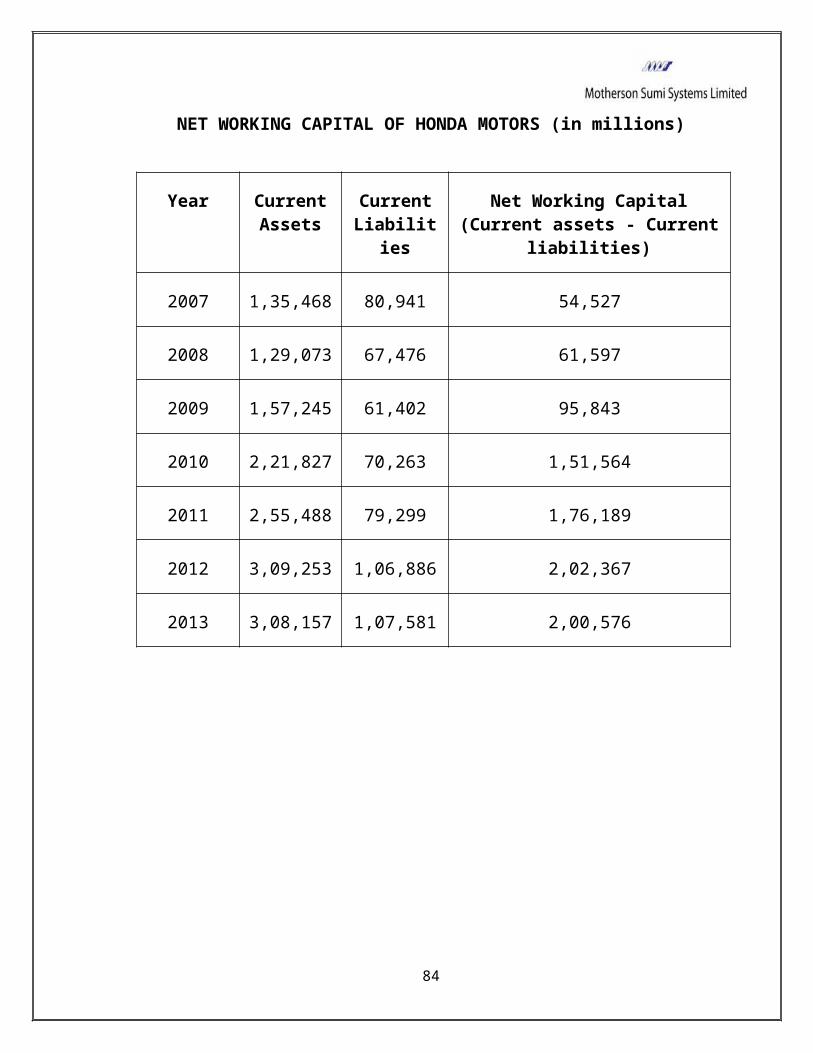
NET WORKING CAPITAL OF HONDA MOTORS (in millions)
Year CurrentAssets
CurrentLiabilit
ies
Net Working Capital(Current assets - Current
liabilities)
2007 1,35,468 80,941 54,527
2008 1,29,073 67,476 61,597
2009 1,57,245 61,402 95,843
2010 2,21,827 70,263 1,51,564
2011 2,55,488 79,299 1,76,189
2012 3,09,253 1,06,886 2,02,367
2013 3,08,157 1,07,581 2,00,576
84
Net Working Capital
2007
2008
2009
2010
2011
2012
2013
0
50000
100000
150000
200000
250000
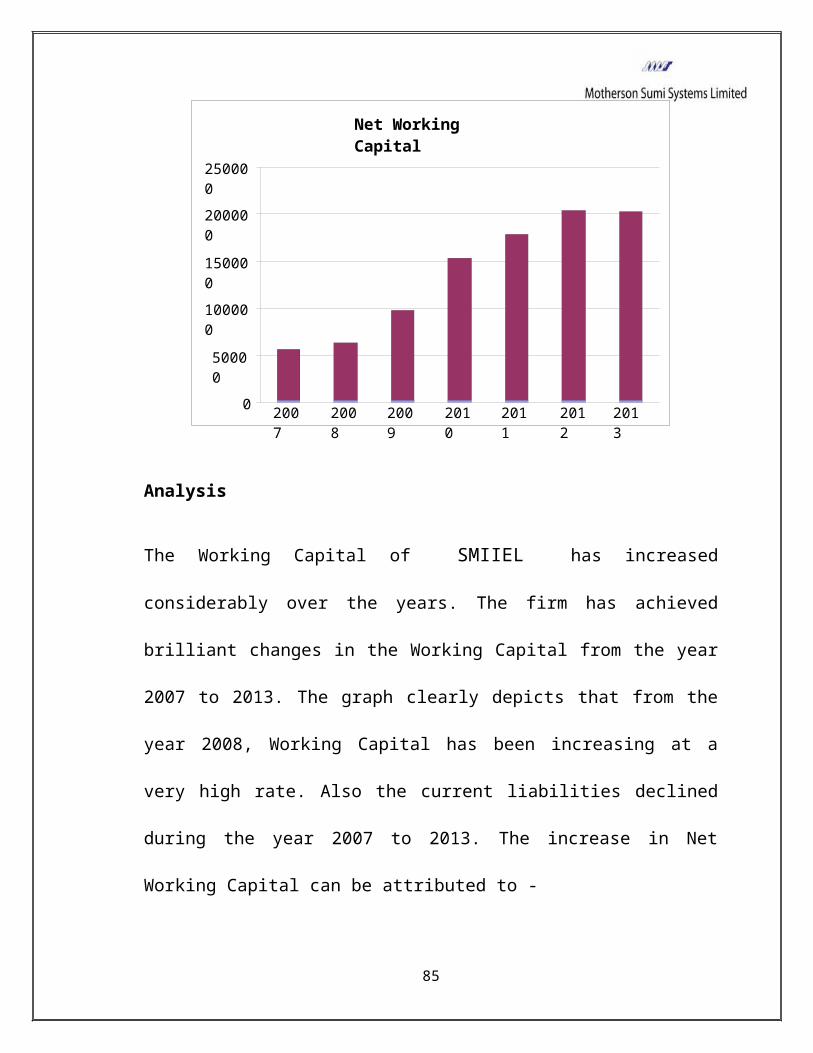
Analysis
The Working Capital of SMIIEL has increased
considerably over the years. The firm has achieved
brilliant changes in the Working Capital from the year
2007 to 2013. The graph clearly depicts that from the
year 2008, Working Capital has been increasing at a
very high rate. Also the current liabilities declined
during the year 2007 to 2013. The increase in Net
Working Capital can be attributed to -
85
Increase in inventory such as Components and Spare
Parts, Fuel Oil, Stock of Coal, Chemical and
Consumables etc.
Increase in cash and bank balance (which include
increase in current account and term deposit
account)
Overall increase in Debtors
Increase in loan and advances
86
CURRENT RATIO
Current Ratio is a measure of general liquidity and it
is most widely used to make the analysis of short term
financial position or liquidity of a firm. I shows the
ability of a firm to meet its short term obligations.
Current ratio is given by
Current Ratio = Current Assets/Current Liabilities
Current Assets include cash, marketable securities,
bill receivables, sundry datas, inventories and work in
progress. Current liabilities include outstanding
expenses, bills payable, dividend payable etc.
A relatively high current ratio is an indication that
the firm is liquid and has the ability to pay its
current obligations in time. On the other hand, a low
current ration represents that the liquidity position
of the firm is not good and the firm shall not be able
to pay its current liabilities in time. A Ratio equal87

or near to the Rule of Thumb of 2:1 that is current
assets double the current liabilities is considered to
be satisfactory.
88
NET WORKING CAPITAL OF HONDA MOTORS (in millions)
Year Current
Assets
Current
Liabiliti
es
Current Ratio
(Current
Assets/Current
Liabilities)
Ratio
2007 1,35,468 80,941 1,35468 / 80,941 1.67
2008 1,29,073 67,476 1,29,073 / 67,476 1.91
2009 1,57,245 61,402 1,57,245 / 61,402 2.56
2010 2,21,827 70,263 2,21,827 / 70,263 3.15
2011 2,55,488 79,299 2,55,488 / 79,299 3.22
2012 3,09,253 1,06,886 3,09,253 /
1,06,886
2.89
2013 3,08,157 1,07,581 3,08,157 /
1,07,581
2.86
89
Current Ratio
2013
2012
2011
2010
2009
2008
2007
0
0.5
1
1.5
2
2.5
3
3.5
Analysis:
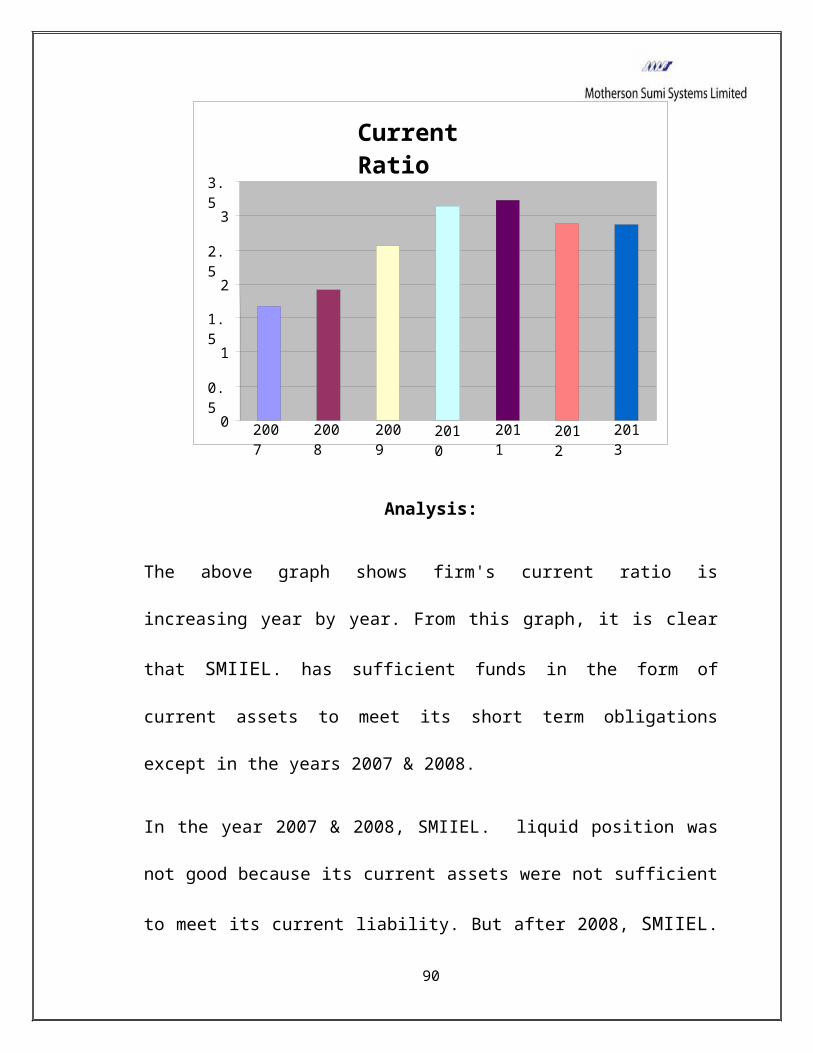
The above graph shows firm's current ratio is
increasing year by year. From this graph, it is clear
that SMIIEL. has sufficient funds in the form of
current assets to meet its short term obligations
except in the years 2007 & 2008.
In the year 2007 & 2008, SMIIEL. liquid position was
not good because its current assets were not sufficient
to meet its current liability. But after 2008, SMIIEL.
90
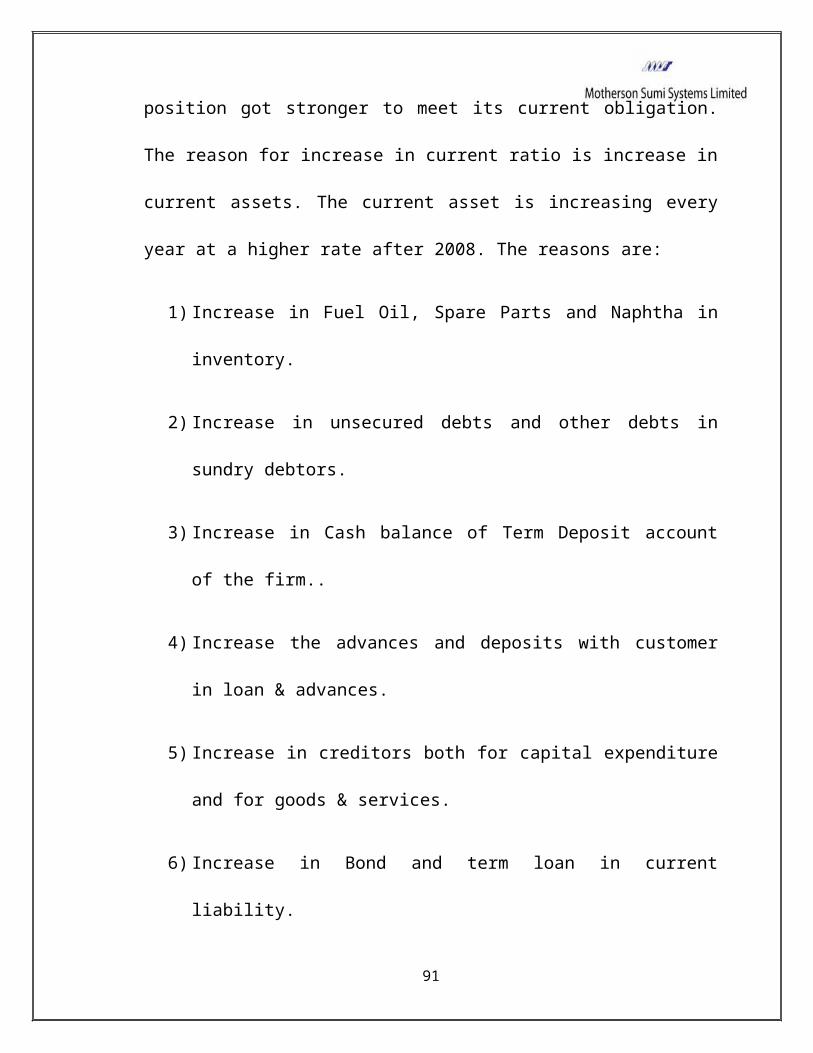
position got stronger to meet its current obligation.
The reason for increase in current ratio is increase in
current assets. The current asset is increasing every
year at a higher rate after 2008. The reasons are:
1) Increase in Fuel Oil, Spare Parts and Naphtha in
inventory.
2) Increase in unsecured debts and other debts in
sundry debtors.
3) Increase in Cash balance of Term Deposit account
of the firm..
4) Increase the advances and deposits with customer
in loan & advances.
5) Increase in creditors both for capital expenditure
and for goods & services.
6) Increase in Bond and term loan in current
liability.
91

92
QUICK RATIO:
Quick Ratio is a more rigorous test of liquidity than
current ratio. Quick Ratio may be defined as the
relationship between Quick/Liquid assets and Current or
Liquid liabilities. An asset is set to be liquid, if it
can be converted into cash within a short period
without loss of value. It measures the firm's capacity
to pay off the current obligations immediately.
Quick Ratio = Quick Assets/Current Liabilities
Quick Assets includes marketable securities, cash in
hand, cash in bank and debtors. As a Rule of
Thumb, ratio 1:1 is considered satisfactory. It is
generally thought that if quick assets are equal to
current liabilities, then the concern may be able
to meet its short term obligations. However, a firm
having high quick ratio may not have a
93
satisfactory liquidity position, if it has slow paying
debtors.
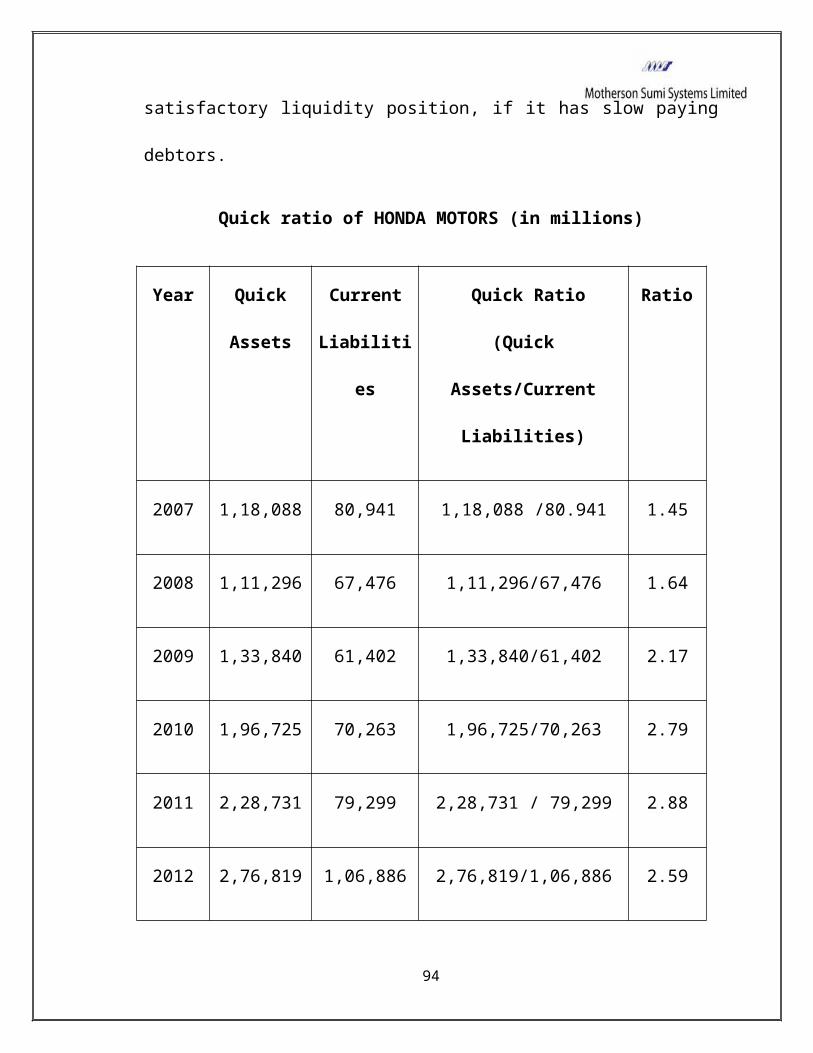
Quick ratio of HONDA MOTORS (in millions)
Year Quick
Assets
Current
Liabiliti
es
Quick Ratio
(Quick
Assets/Current
Liabilities)
Ratio
2007 1,18,088 80,941 1,18,088 /80.941 1.45
2008 1,11,296 67,476 1,11,296/67,476 1.64
2009 1,33,840 61,402 1,33,840/61,402 2.17
2010 1,96,725 70,263 1,96,725/70,263 2.79
2011 2,28,731 79,299 2,28,731 / 79,299 2.88
2012 2,76,819 1,06,886 2,76,819/1,06,886 2.59
94

Quick Ratio
2013
2012
2011
2010
2009
2008
2007
0
0.5
1
1.5
2
2.5
3
3.5
2013 2,74,680 1,07,581 2,74,680/1,07,581 2.55
Analysis:
From this graph, it is seen that the firm’s quick ratio
is very sound. From the beginning i.e. 2007 to 2013,
SMIIEL. has a good liquidity position. In the year
2009 and 2010, it is very high which is 2.8 and 2.88,
95
but after that it has decreased, the reason for which
are:
Increase in Cash & Bank balance of SMIIEL.
Increase in Loan & Advances
Overall there is increase in debtors
Overall there is increase in current liabilities
96
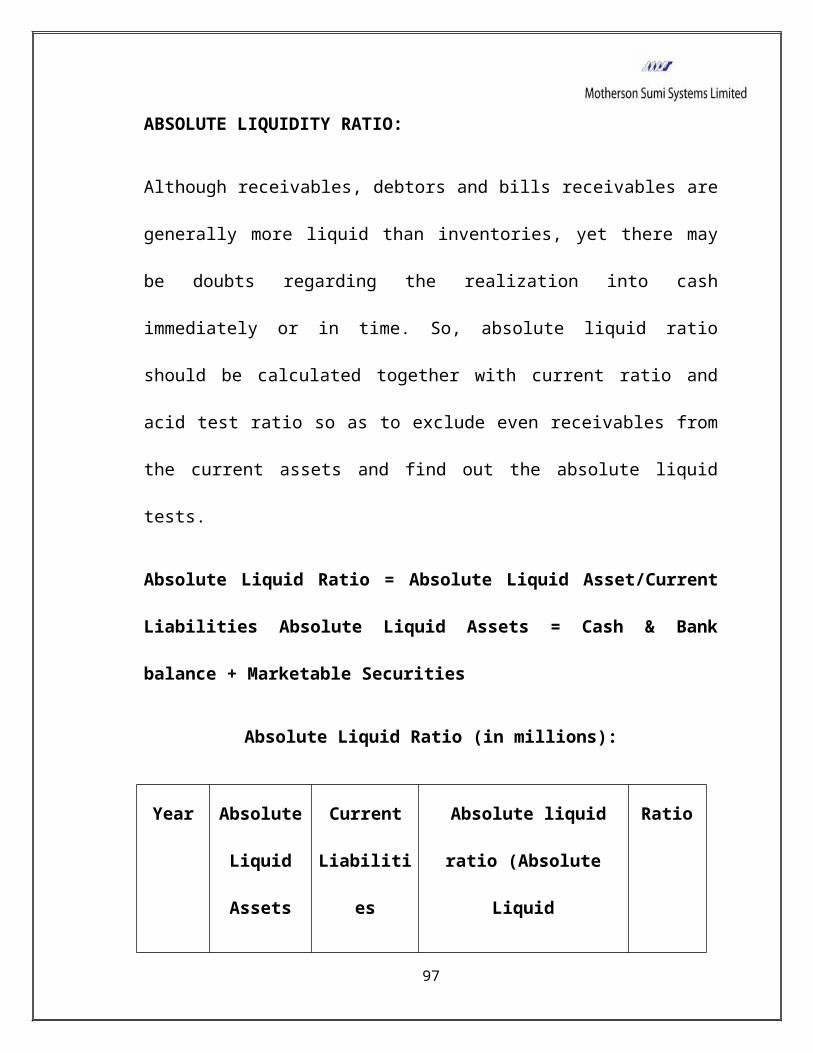
ABSOLUTE LIQUIDITY RATIO:
Although receivables, debtors and bills receivables are
generally more liquid than inventories, yet there may
be doubts regarding the realization into cash
immediately or in time. So, absolute liquid ratio
should be calculated together with current ratio and
acid test ratio so as to exclude even receivables from
the current assets and find out the absolute liquid
tests.
Absolute Liquid Ratio = Absolute Liquid Asset/Current
Liabilities Absolute Liquid Assets = Cash & Bank
balance + Marketable Securities
Absolute Liquid Ratio (in millions):
Year Absolute
Liquid
Assets
Current
Liabiliti
es
Absolute liquid
ratio (Absolute
Liquid
Ratio
97
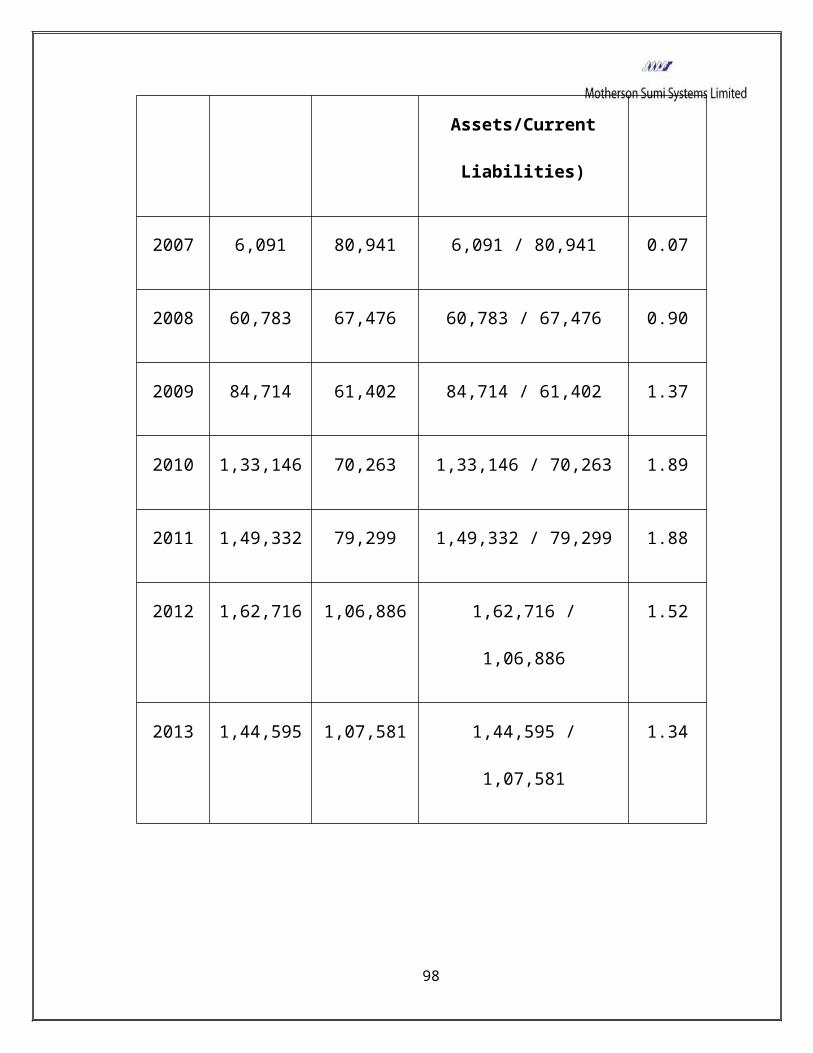
Assets/Current
Liabilities)
2007 6,091 80,941 6,091 / 80,941 0.07
2008 60,783 67,476 60,783 / 67,476 0.90
2009 84,714 61,402 84,714 / 61,402 1.37
2010 1,33,146 70,263 1,33,146 / 70,263 1.89
2011 1,49,332 79,299 1,49,332 / 79,299 1.88
2012 1,62,716 1,06,886 1,62,716 /
1,06,886
1.52
2013 1,44,595 1,07,581 1,44,595 /
1,07,581
1.34
98
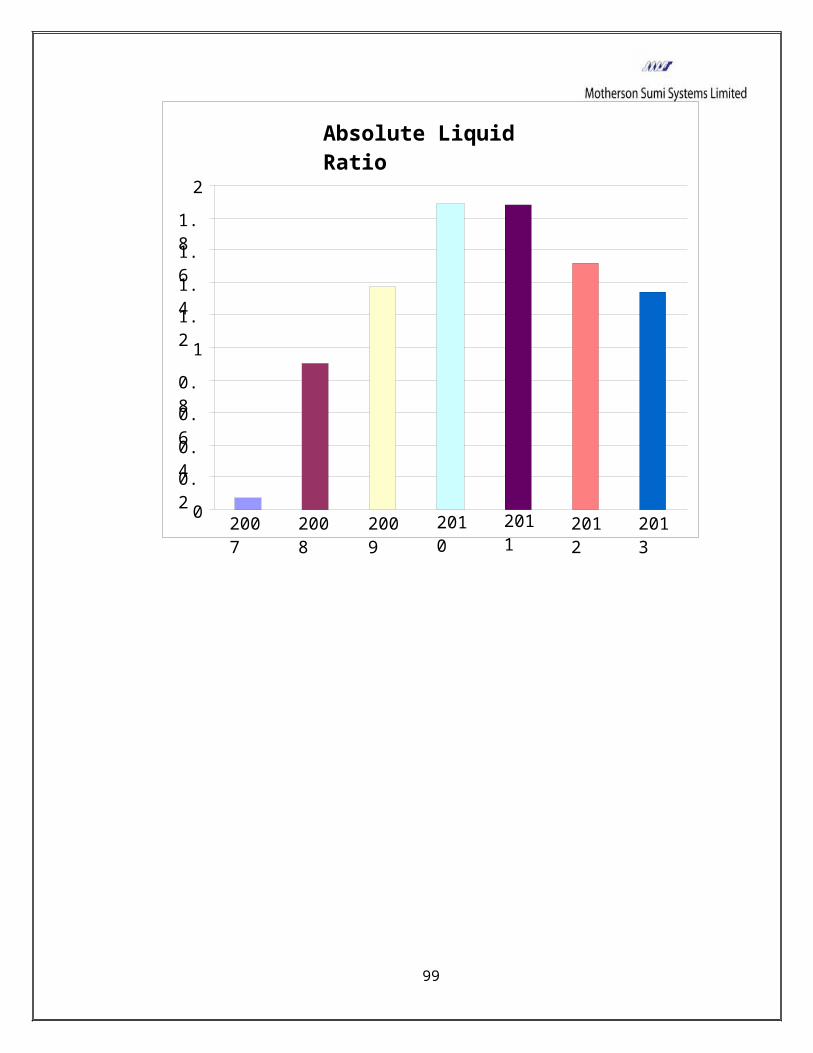
Absolute Liquid Ratio
2013
2012
2011
2010
2009
2008
2007
00.2
0.4
0.6
0.8
11.2
1.4
1.6
1.8
2
99
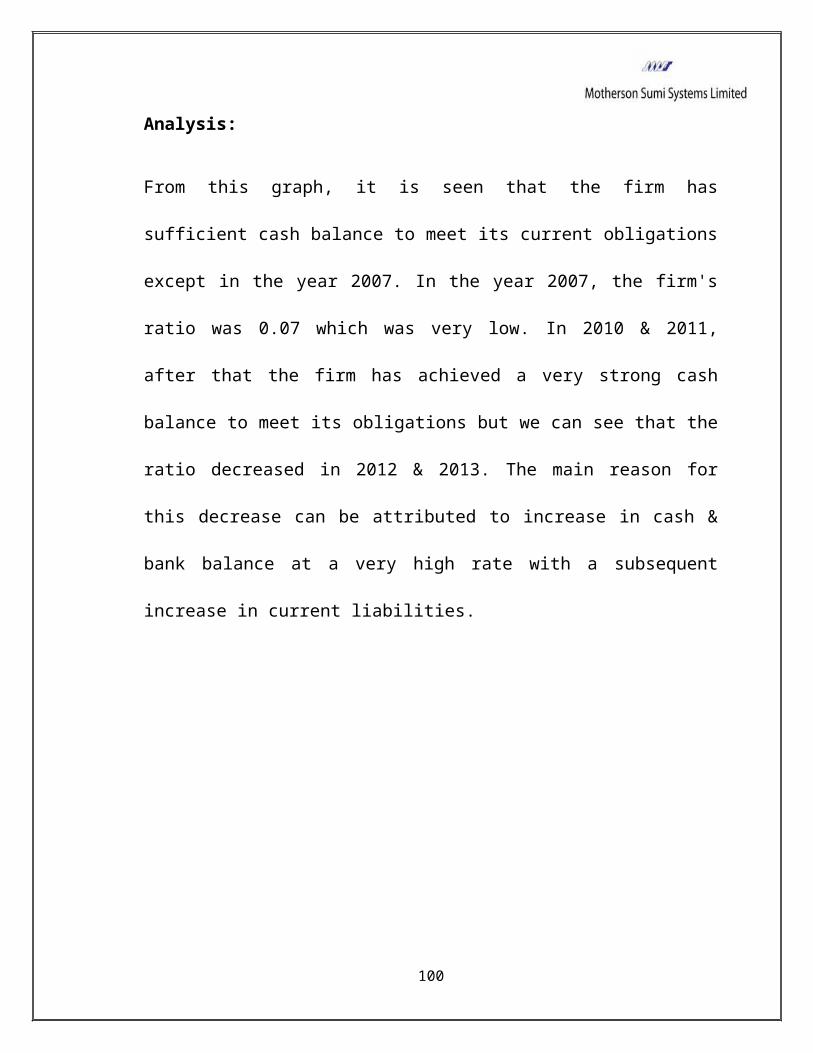
Analysis:
From this graph, it is seen that the firm has
sufficient cash balance to meet its current obligations
except in the year 2007. In the year 2007, the firm's
ratio was 0.07 which was very low. In 2010 & 2011,
after that the firm has achieved a very strong cash
balance to meet its obligations but we can see that the
ratio decreased in 2012 & 2013. The main reason for
this decrease can be attributed to increase in cash &
bank balance at a very high rate with a subsequent
increase in current liabilities.
100

101
CURRENT WORKING CAPITAL TURN-OVER RATIO:
Working Capital Turn-Over ratio indicates the pace of
utilization of Net Working Capital. This ratio measures
the efficiency with which the Working capital is used
by the firm. A high ratio indicates efficient
utilization of working capital and a low ratio
indicates otherwise. But a very high WCTR is not good
situation for any firm.
WCTR = Net Sales/Net Working Capital
DEBTOR TURN-OVER RATIO
Debtor turnover ratio indicates the pace of debt
collection of firm. A high debtor turnover ratio
indicates the efficient management of debtor or more
liquidity is the debtor. Similarly low debtor's
turnover ratio implies inefficient management of debtor
and less liquidity debtor. There is no rule of thumb
102
for an ideal debtor turnover ratio. It varies from firm
to firm.
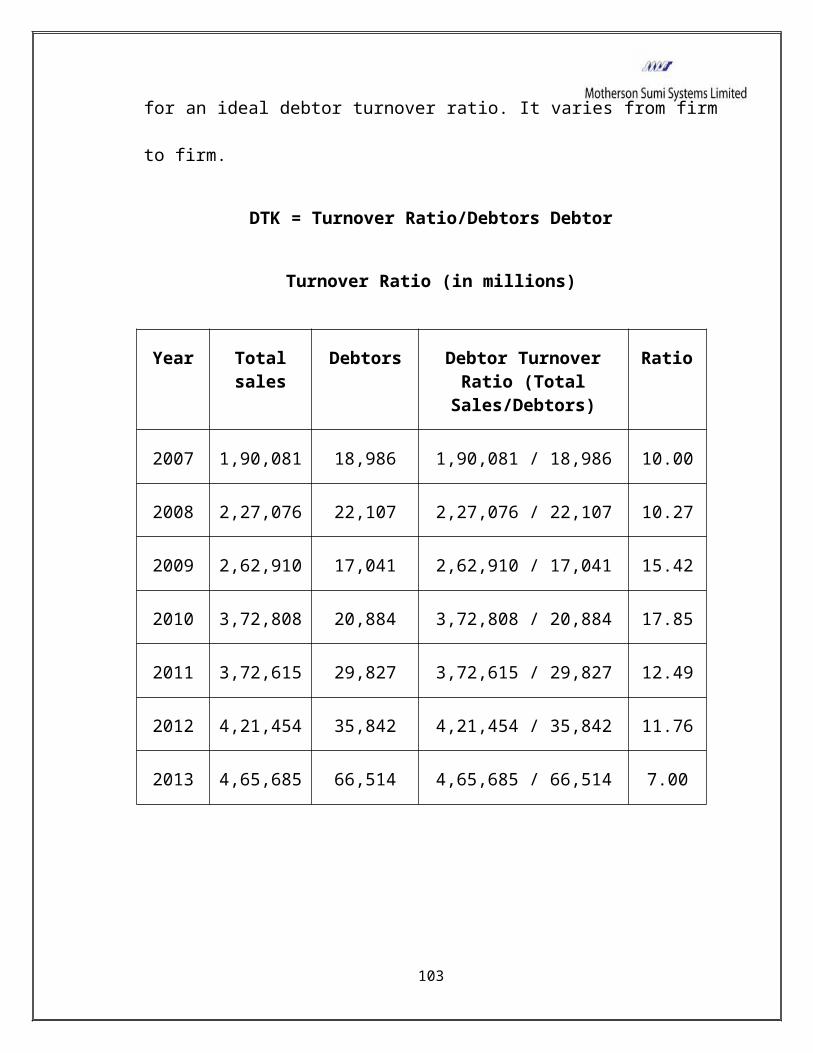
DTK = Turnover Ratio/Debtors Debtor
Turnover Ratio (in millions)
Year Totalsales
Debtors Debtor TurnoverRatio (Total
Sales/Debtors)
Ratio
2007 1,90,081 18,986 1,90,081 / 18,986 10.00
2008 2,27,076 22,107 2,27,076 / 22,107 10.27
2009 2,62,910 17,041 2,62,910 / 17,041 15.42
2010 3,72,808 20,884 3,72,808 / 20,884 17.85
2011 3,72,615 29,827 3,72,615 / 29,827 12.49
2012 4,21,454 35,842 4,21,454 / 35,842 11.76
2013 4,65,685 66,514 4,65,685 / 66,514 7.00
103

Debtor Turnover Ratio
2013
2012
2011
2010
2009
2008
2007
0246810
12
14
16
18
20
Analysis :
It is seen from the graph that the debtor turnover
ratio of the firm has grown in the period from 2007 to
2010. It shows the firms efficient management of debts.
The reasons for increase in debtor turnover ratio is-
1) Increase in Sales activity
2) Liberal Credit Policy by the firm
104
But after that firm's debtor turnover ratio has
declined. The reasons for the same could be -
1) Increase in sales at a lower rate
2) Restricted Credit Policy by the firm
105
AVERAGE COLLECTION PERIOD
Average collection period represents the average number
of days, the firm has to wait before its receivable are
converted in to cash. It measures the quality of
debtor. Generally shorter the average collection period
the better is quality of debtor. Similarly the higher
collection period implies inefficient collection
performance which in turn adversely affects the
liquidity or short term paying capacity of the firms
out of its current liability.
Also, longer the average collection period, there are
more chances of bad debt. Though there is no rule of
thumb for the average collection period, it is
generally given 2 to 3 months. It also varies from firm
to firm.
Average Collection Period of HONDA MOTORS (in millions)
106
Year No. of
days in
a year
Debtor
turnover
ratio
Average collection
period (No. of
working days in a
year/debtor
turnover ratio)
Days
2007 365 10.00 365/10.00 37
2008 365 10.27 365/10.27 36
2009 365 15.42 365/15.42 24
2010 365 17.85 365/117.85 20
2011 365 12.49 365/12.49 29.49
2012 365 11.76 365/11.76 31.04
2013 365 7.00 365/7.00 52.14
107
Average Collection Period
2013
2012
2011
2010
2009
2008
2007
0
10
20
30
40
50
60
108
Analysis
As it is seen that the firm has restricted the credit
policy, by which its average collection period has
declined from the year 2007 to 2010. But after that it
has increased due to liberal credit policy. SMIIEL. is
focusing 100% payment and also giving incentive to
debtor in form of 2% discount on the billing. It is
allowing 2 months credit to its debtor.
109
RECEIVABLES MANAGEMENT
Receivables constitute a significant part of current
asset of the firm. Receivable represent amount owed to
the firm as a result of sale of goods or service in the
ordinary course of business. These are the claim of the
firm against its customer. This receivable is known as
trade credit or trade receivable. It is an investment
because it blocks some portion of firm's funds. The
purpose of maintaining or investing in receivables is
to meet competition and to increase the sales and
profit. Receivable management is the process of making
decision relating to investment in trade debtors.
Factors Influencing Receivable:
1. Credit Policy: A firm with aggressive credit
policy will have a low size of receivable while a
firm has liberal credit policy will higher size
receivable.
110

2. Term of Credit : If the term of credit period
is allowed more, then the receivable will be more.
While credit period is short, then the size of
receivable will be less.
3. Expansion Plan: When firm enter into a new
market for expansion of its business, it gives
credit facility to attract its customer by which
receivables get increased.
111
Tools of Receivable Management:
Receivable management consists of various factors such
as -
1. Forming Credit Policy
2. Executing Credit Policy
3. Formulating & Executing Collection Policy
Forming Credit Policy:
A suitable credit policy is essential for efficient
management of receivables. A optimum credit policy is
the one which maximizes value of the firm. A credit
policy is related to decisions such as credit standard,
length of standard, length of credit period, cash
discount and discount period etc.
(a) Credit Standards:
112
Credit standards are the criteria which a firm follows
in selecting customer for the purpose of credit
extension. By liberalizing credit policy the volume of
sales will get increased which result into increase the
profit. It also increases the volume of sales which
enhance the risk of bad debts and delayed receipt. On
the other hand, a tight credit policy will decrease the
volume of sales which result in decrease in the chances
of bad debt loses.
113
(b) Credit Period:
Credit period refers to the time period allowed to the
customer for making the payment. There is no binding on
fixing the terms of credit. It varies from firm to firm
depending on its objective. A firm lengthens its credit
period will block more money which ultimately involves
more debt collection cost and more bad debt losses. The
firm may tighten its credit period; if its customers
are defaulting too frequently and bad debt losses are
building up.
(c) Discount period:
The collection of receivables is influenced by the
period allowed for availing discount. It is the
additional period allowed for the customer- to avail
discount and make payment.
(d) Cash Discount:
114

It is a reduction of payment offered to customers to
induce them to repay credit obligations within a
specific period of time which will be less than normal
credit period. It is given to speed up the collection
of receivables.
115
Executing Credit Policy:
(a) Collecting Credit Information
It refers to the collection of information about
customers regarding their financial position for giving
credit. This information helps in improving the quality
of receivable which ultimately reduces the chances of
bad debt losses. This information can be collected from
financial statement, credit rating agencies, backs etc.
(b) Credit Analysis
Credit analysis is the determination of the degree of
risk associated with the
account, the capacity of the customer to borrow and its
ability and
willingness to pay the credit amount. At the time of
credit analysis the
manager keeps in various factors like Character,
116
Capacity, Capital, Condition
and Collateral.
c) Credit Decision
Credit decision is taken by the manager by matching the
creditworthiness of the customer with the credit
standard of the firm.
117

Collect Policy:
Collection refers to obtaining payment of past due
account. A good collection policy accelerates the
collection from slow payer and reduces the bad debt
losses. It keeps the debtor alert and urges them to pay
their dues promptly. The collection policy is either
strict or lenient. A strict collection policy enables
early collection and reduces bad debt losses but it
reduces the volume of sales and increases the
collection cost. A lenient policy increases the bad
debt losses and increase debt collection period. The
credit manager makes or frames some collection effort
for collecting the credit amount from customers. Some
are -
a) Sending a letter informing the customer regarding
the past due status that are overdue.
b) Making a telephone call to the customer.
118
c) Employing a collection agency
d) Taking a legal action against the customer
The firms need to continuously monitor and control its
receivable to ensure the success of collection efforts.
There are two methods for evaluating the management of
receivable. Such are -
119
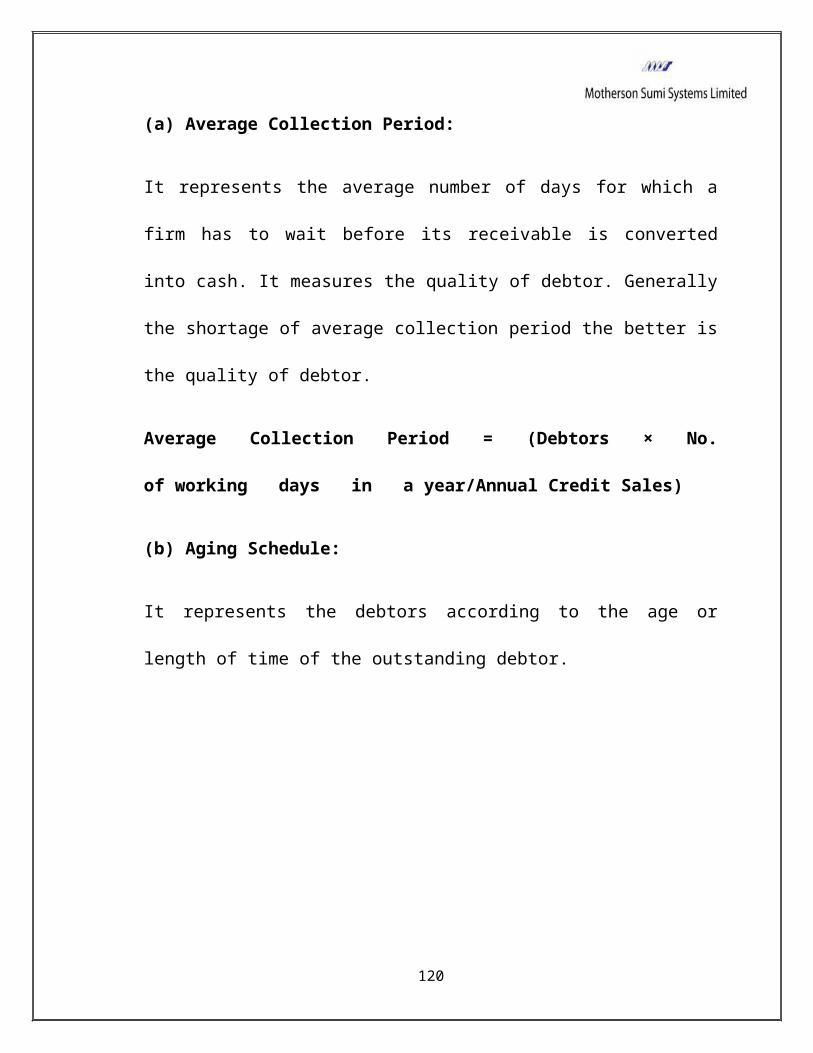
(a) Average Collection Period:
It represents the average number of days for which a
firm has to wait before its receivable is converted
into cash. It measures the quality of debtor. Generally
the shortage of average collection period the better is
the quality of debtor.
Average Collection Period = (Debtors × No.
of working days in a year/Annual Credit Sales)
(b) Aging Schedule:
It represents the debtors according to the age or
length of time of the outstanding debtor.
120
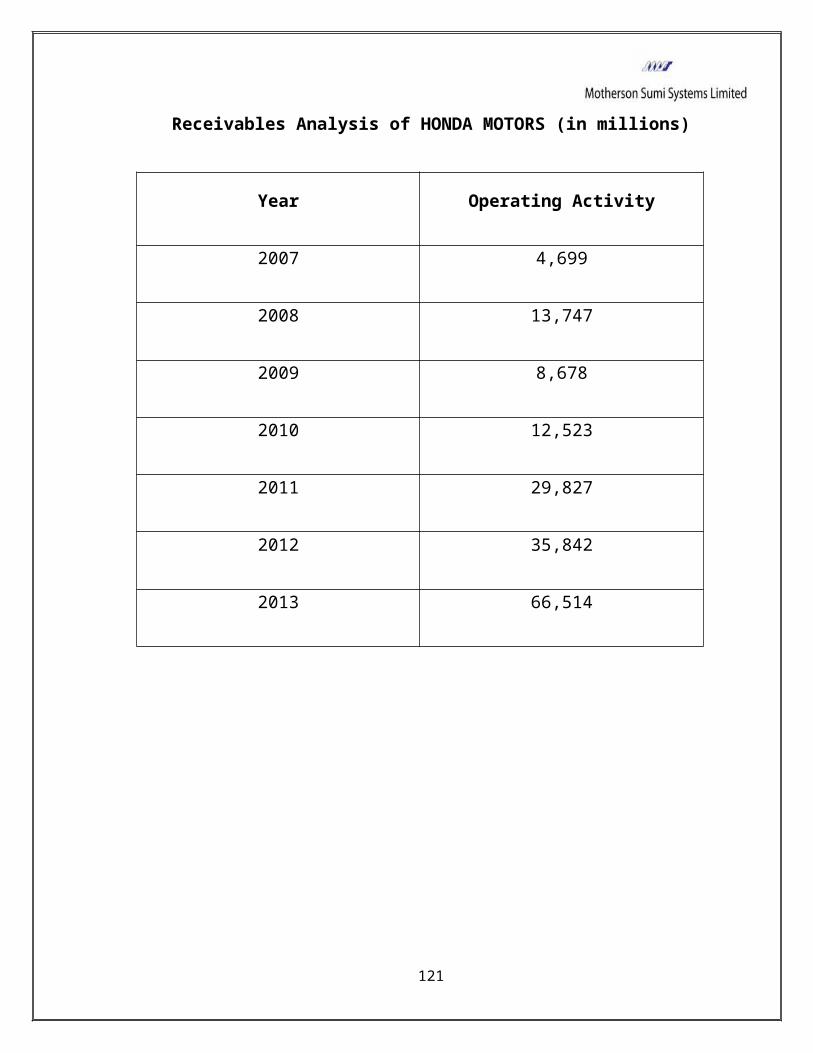
Receivables Analysis of HONDA MOTORS (in millions)
Year Operating Activity
2007 4,699
2008 13,747
2009 8,678
2010 12,523
2011 29,827
2012 35,842
2013 66,514
121
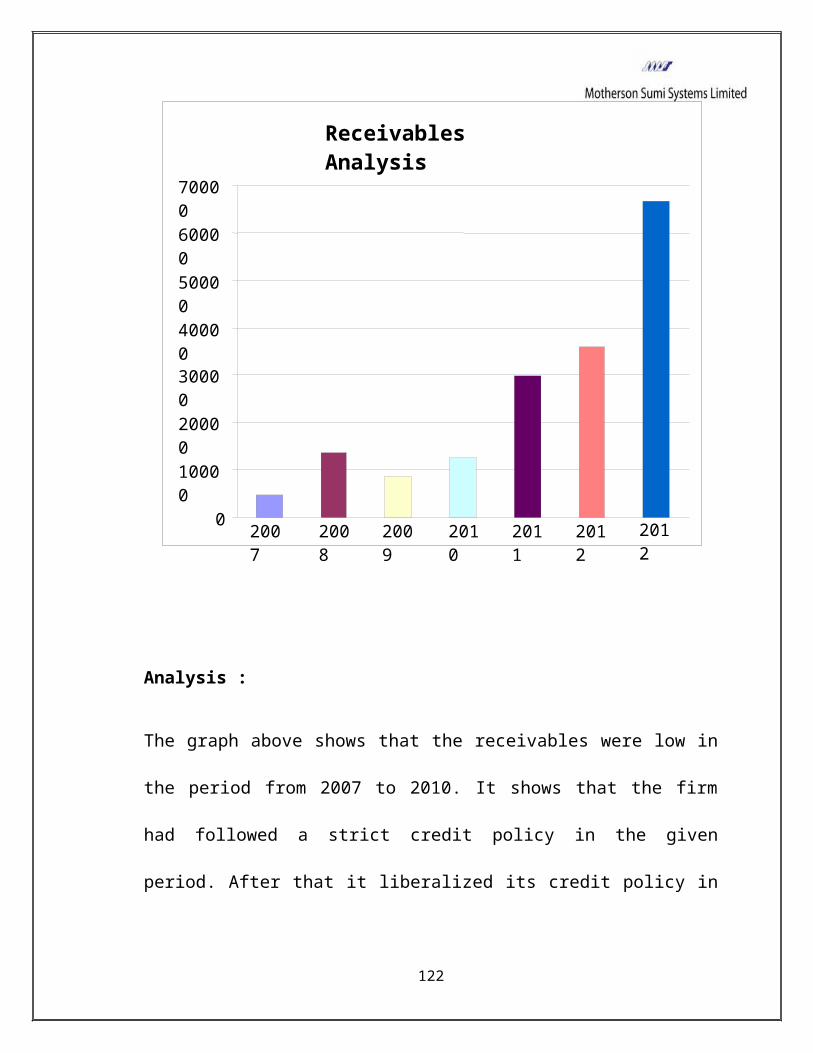
Receivables Analysis
2012
2012
2011
2010
2009
2008
2007
0
10000
20000
30000
40000
50000
60000
70000
Analysis :
The graph above shows that the receivables were low in
the period from 2007 to 2010. It shows that the firm
had followed a strict credit policy in the given
period. After that it liberalized its credit policy in
122

subsequent years resulting in increase in debtors as
compared to previous years.
123
CURRENT WORKING CAPITAL
Margins for the full year (FY13) too were lower by 130
basis points at 10.5% over FY12. This is in fact the
third consecutive decline in SMIIEL. EBITDA margins
since FY11 when it reported healthy margins of 12.8%.
HONDA MOTORS's interest cost as a percentage of sales
rose by 36 basis points in FY13 to 1.61% even as its
total debt declined by over 10% over the previous year
to Rs 8,800 crore.
Given an almost flat growth in profit before interest
and tax (PBIT) over the past year, there is a visible
deterioration in the company's interest coverage ratio
compared to the previous couple of years.
The management has said that there has been an increase
in its average borrowings (long term) pursuant to an
increase in operating activities. Also, cost of funds
124

has also gone up from an average of 8.1% in FY12 to
8.8% in FY13, leading to a spike in interest outflow.
The increase in borrowing levels, though in line with
the volume growth of company's operations has impacted
SMIIEL. working capital. According to the management,
the working capital in relation to sales deteriorated
to 16% for the year against 12% a year ago.
Given the ambitious revenue targets that SMIIEL. has
guided for FY14 in a tight credit environment, there
could well be further stress on working capital this
fiscal. The company has guided for a growth of 20% in
order inflows and 15-17% growth in revenues for FY14.
For a company which started as the finance arm of
SMIIEL. in 1994 to help meet the working capital
requirements of its dealers and vendors, it was
imperative to go on a shopping spree to mark its
presence in various financial verticals: insurance,
125
financing, mutual funds, broking and wealth management.
SMIIEL. Finance first tested the M&A waters in 2009
when it bought out the assets of DBS Cholamandalam
Asset Management) marking its entry into the Indian
mutual fund industry. In 2012, it acquired Indo Pacific
Housing Finance and Family Credit, which provides auto
loans.
The big one came in the same year (2012) when it bought
out the Indian assets of Fidelity Mutual Fund. It is
said SMIIEL. Finance paid Rs 530-550 crore to buy
Fidelity's assets under management worth around Rs
8,800 crore (at the time of the acquisition). The
acquisition was important for SMIIEL. Finance as a
sizeable portion of Fidelity's assets were equities,
which fetch fund houses higher profit margins than
debt.
126
SUGGESTIONS AND RECOMMENDATIONS
GENERAL SUGGESTIONS:
1. Close scrutiny of present rise in inflation in cost
of various raw materials
should be done, and without compromising on the
quality, cheapest materials should be acquired and
thus try to reduce the cost of production.
127
2. The creativity of employees should be
increased by motivation and
involving them in extracurricular activities and
making them understand
how creativity plays a role in success of any
organization.
3. Proper planning of the investment should be
made and financial
managers should be employed to take proper decisions
and thus increase
the profitability and liquidity of the organization.
128
RECOMMENDATIONS:
1. SMIIEL. should institutionalize a continuous
improvement program for operational as well as
managerial efficiencies. As a matter of subject we
will focus on managerial efficiency which is an
inherent problem for any public sector unit. To
some extent this problem can be solved by reducing
the shareholding of Government can go for regular
well structured disinvestment programs and sell its
holding to the public. This will create an
automotive pressure on the management and will
force the management to strive for improved
efficiency in order to maintain the faith and
goodwill of the company.
2. Firms should try to maintain its quick ratio which
is presently higher than the normal ratio i.e. 1:1.
Also the absolute liquid ratio is very high.
129

130
CONCLUSION
From the ratios observed in the study I conclude that
SMIIEL. is maintaining a good Working Capital
Management base. India's number one power major is
financially well equipped to raise the fund required
for its planned Capacity Addition Programme. The
internal accruals of the Company would be sufficient to
finance the equity component for the new projects.
Given its low gearing and strong credit ratings, the
company is well positioned to raise the required
borrowings without going for any other following Public
Offering.
Therefore in conclusion we can say that SMIIEL.. is
financially capable enough to carry out its planned
Capacity Addition programme and would continue to enjoy
the topmost position in the power sector for a long
time in the future.
131
BIBLIOGRAPHY
1.Financial Management Book written by
a.M.Y. Khan & P.K. Jain
b.I.M. Pandey
c.Prasanna Chandra
d.R.K.Sharma & Shashi K.Gupta
2.Data from Past Records of the Company.
3.Company website: www.Honda Motors.com
132

133

134
Top Related
Copyright © 2022 FDOKUMEN

