


Bahasa
Halaman
Hukum

Ind. in. of Agri. Econ.Vol. 57, No. 3, July-Sept. 2002
A Profile of Pulses Production in India:Facts, Trends and Opportunities
P. K. Joshi and Raka Saxena*
INTRODUCTION
Pulses complement cereals in both production and consumption. In theproduction process, pulses improve soil fertility, require less water than cereals andtheir rotation with cereals controls diseases and pests. On the consumption side,these are relatively cheaper sources of protein. Despite their importance, the percapita availability of pulses has reduced to almost half from about 60 gm/day in1950-51 to 26 gm/day in 2000-01 as against the recommendation (43 gm/day) of theIndian Council of Medical Research. Such a trend was due to dismal productionperformance of pulses in comparison to population growth. With the acute shortfall insupply, the country was compelled to import pulses, which further restricted thegrowth of pulses production. The average import of pulses was 870 thousand tonnesper annum during the last five years ending 2001, with an extreme of 2,177 thousandtonnes in 2001-02. In value terms, it was approximately US$ 270 million for theformer and a peak of US$ 886 million in 2001-02.
Such a dismal scenario of pulses is attributed to the technological stagnation,supply side constraints, and unattendance to new niches for their production. Theseissues need to be assessed to raise their production. For this, it is pre-requisite todiagnose the pulses economy to understand their performance temporally andspatially. The study is an attempt in this direction to (i) assess the historical pattern ofpulses production in the country, (ii) identify key constraints in the production ofpulses, and (iii) assess the prospects of and opportunities for pulses production in thecountry. The study postulated two hypotheses: (i) shortfall in domestic production ofpulses led to new production niches, and (ii) technological stagnation resulted in poorperformance of pulses in the country.
METHODOLOGY
The study is based on the state-level data which are mainly collated fromsecondary sources (Government of India, 2000 a and b; 2002). The historicalperformance of pulses has been assessed for all the major states. The study coveredimportant pulses, which included chickpea, pigeonpea, blackgram, greengram andlentil. These pulses account for more than 80 per cent of total pulses area in thecountry. The study covered the last two decades from 1980-81 to 1999-2000. This
* National Centre for Agricultural Economics and Policy Research, New Delhi-110 012.
A PROFILE OF PULSES PRODUCTION IN INDIA: FACTS, TRENDS AND OPPORTUNITIES 327
long time span was divided into two sub-periods. The basis for making two sub-periods was linked with the adoption of cereal-based improved technologies and theeconomic reforms launched in the country: (i) 1980s was considered as late adoptionof improved cereal-based technology, and pre-reform period,. and (iii) 1990s wasviewed as saturation in the adoption of improved cereal-based technologies, andreform period. Annual compound growth rates of area, production and productivity ofmajor pulses were computed in different states to examine their historicalperformance. Total factor productivity (TFP) was also computed to examine the roleof technology in changing production of different pulses. Due to limitation of space,the detail methodology may be referred in Rosegrant and Evenson (1992).
HISTORICAL CHANGES IN PULSES PRODUCTION
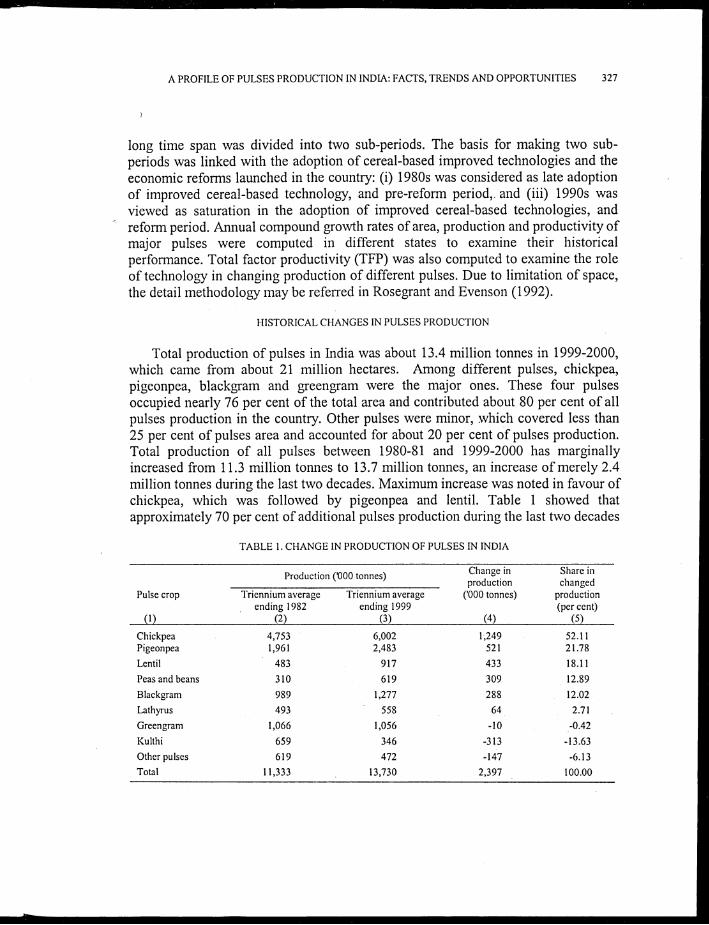
Total production of pulses in India was about 13.4 million tonnes in 1999-2000,which came from about 21 million hectares. Among different pulses, chickpea,pigeonpea, blackgram and greengram were the major ones. These four pulsesoccupied nearly 76 per cent of the total area and contributed about 80 per cent of allpulses production in the country. Other pulses were minor, which covered less than25 per cent of pulses area and accounted for about 20 per cent of pulses production.Total production of all pulses between 1980-81 and 1999-2000 has marginallyincreased from 11.3 million tonnes to 13.7 million tonnes, an increase of merely 2.4million tonnes during the last two decades. Maximum increase was noted in favour ofchickpea, which was followed by pigeonpea and lentil. Table 1 showed thatapproximately 70 per cent of additional pulses production during the last two decades
TABLE I. CHANGE IN PRODUCTION OF PULSES IN INDIA
Pulse crop
(1)
Production ('000 tonnes) Change inproduction
('000 tonnes)
(4)
Share inchangedproduction(percent)
(5)
Triennium averageending 1982
(2)
Triennium averageending 1999
(3)
Chickpea 4,753 6,002 1,249 52.11Pigeonpea 1,961 2,483 521 21.78
Lentil 483 917 433 18.11
Peas and beans 310 619 309 12.89
Blackgram 989 1,277 288 12.02
Lathyrus 493 558 64 2.71
Greengram 1,066 1,056 -10 -0.42
Kulthi 659 346 -313 -13.63
Other pulses 619 472 -147 -6.13
Total 11,333 13,730 2,397 100.00
328 INDIAN JOURNAL OF AGRICULTURAL ECONOMICS
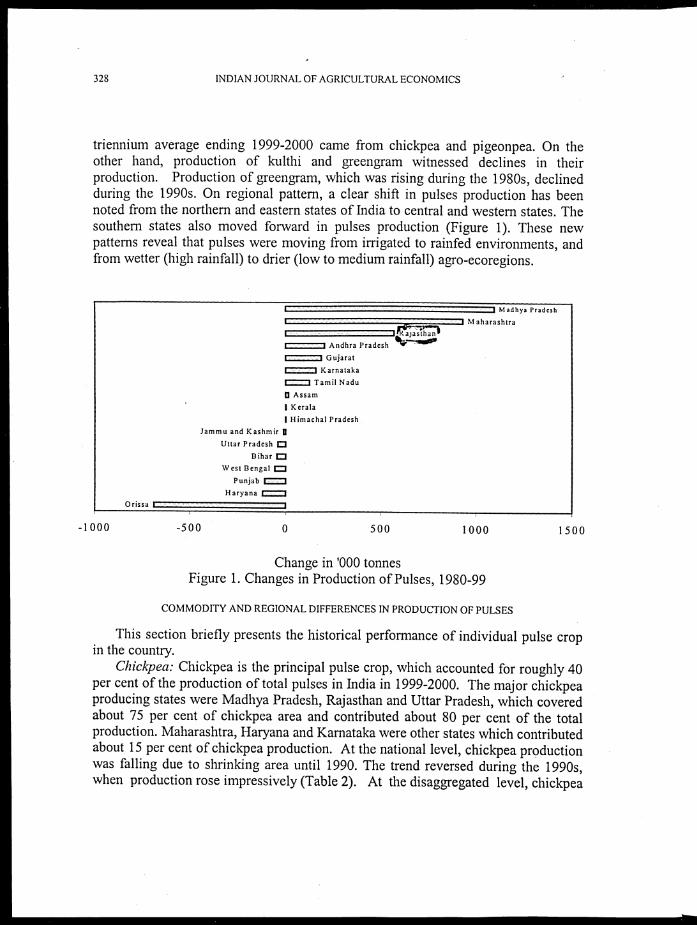
triennium average ending 1999-2000 came from chickpea and pigeonpea. On theother hand, production of kulthi and greengram witnessed declines in theirproduction. Production of greengram, which was rising during the 1980s, declinedduring the 1990s. On regional pattern, a clear shift in pulses production has beennoted from the northern and eastern states of India to central and western states. Thesouthern states also moved forward in pulses production (Figure 1). These newpatterns reveal that pulses were moving from irrigated to rainfed environments, andfrom wetter (high rainfall) to drier (low to medium rainfall) agro-ecoregions.
Orissa
Madhya Pradesh
Maharashtra
Andhra Pradesh
Gujarat
Karnataka
=3 Tamil Nadu
fl AssamI Kerala
I Himachal Pradesh
Jammu and Kashmir flUttar Pradesh CI
Bihar
West Bengal 1:3
Punjab =
Haryana
j a;t117.11
-1000 -500 0 500 1000 1500
Change in '000 tonnesFigure 1. Changes in Production of Pulses, 1980-99
COMMODITY AND REGIONAL DIFFERENCES IN PRODUCTION OF PULSES
This section briefly presents the historical performance of individual pulse cropin the country.
Chickpea: Chickpea is the principal pulse crop, which accounted for roughly 40per cent of the production of total pulses in India in 1999-2000. The major chickpeaproducing states were Madhya Pradesh, Rajasthan and Uttar Pradesh, which coveredabout 75 per cent of chickpea area and contributed about 80 per cent of the totalproduction. Maharashtra, Haryana and Karnataka were other states which contributedabout 15 per cent of chickpea production. At the national level, chickpea productionwas falling due to shrinking area until 1990. The trend reversed during the 1990s,when production rose impressively (Table 2). At the disaggregated level, chickpea
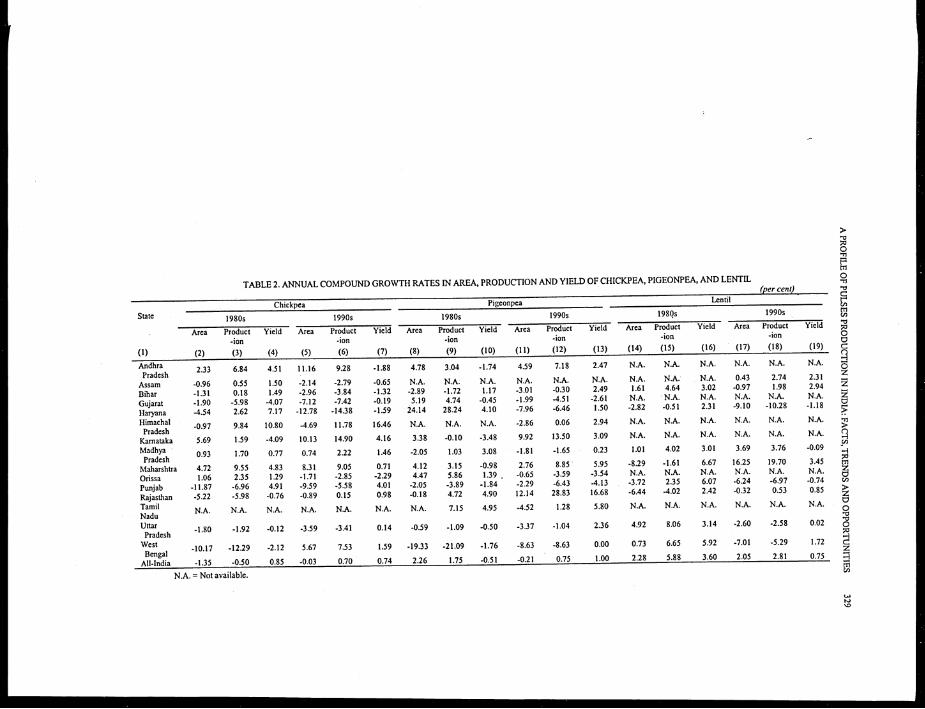
TABLE 2. ANNUAL COMPOUND GROWTH RATES IN AREA, PRODUCTION AND YIELD OF CHICKPEA, PIGEONPEA, AND LENTIL
(per cent)
Chickpea Pigeonpea Lentil
1980s 1990s 1980s 1990s 198gs 1990s
(1)
Area
(2)
Product-ion
(3)
Yield
(4)
Area
(5)
Product-ion
(6)
Yield
(7)
Area
(8)
Product-ion
(9)
Yield
(10)
Area
(11)
Product-ion
(12)
Yield
(13)
Area
(14)
Product-ion
(15)
Yield
(16)
Area
(17)
Product-ion
(18)
Yield
(19)
AndhraPradesh
2.33 6.84 4.51 11.16 9.28 -1.88 4.78 3.04 -1.74 4.59 7.18 2.47 N.A. N.A. N.A. N.A. N.A. N.A.
Assam -0.96 0.55 1.50 -2.14 -2.79 -0.65 N.A. N.A. N.A. N.A. N.A. N.A. N.A. N.A. N.A. 0.43 2.74 2.31
Bihar -1.31 0.18 1.49 -2.96 -3.84 -1.32 -2.89 -1.72 1.17 -3.01 -0.30 2.49 1.61 4.64 3.02 -0.97 1.98 2.94
Gujarat -1.90 -5.98 -4.07 -7.12 -7.42 -0.19 5.19 4.74 -0.45 -1.99 -4.51 -2.61 N.A. • N.A. N.A. N.A. N.A. N.A.
Haryana -4.54 2.62 7.17 -12.78 -14.38 -1.59 24.14 28.24 4.10 -7.96 -6.46 1.50 -2.82 -0.51 2.31 -9.10 -10.28 -1.18
HimachalPradesh
-0.97 9.84 10.80 -4.69 11.78 16.46 N.A. N.A. N.A. -2.86 0.06 2.94 N.A. N.A. N.A. N.A. N.A. N.A.
Karnataka 5.69 1.59 -4.09 10.13 14.90 4.16 3.38 -0.10 -3.48 9.92 13.50 3.09 N.A. N.A. N.A. N.A. N.A. N.A.
MadhyaPradesh
0.93 1.70 0.77 0.74 2.22 1.46 -2.05 1.03 3.08 -1.81 -1.65 0.23 1.01 4.02 3.01 3.69 3.76 -0.09
Maharshtra 4.72 9.55 4.83 8.31 9.05 0.71 4.12 3.15 -0.98 2.76 8.85 . 5.95 -8.29 -1.61 6.67 16.25 19.70 3.45
Orissa 1.06 2.35 1.29 -1.71 -2.85 -2.29 4.47 5.86 1.39 , -0.65 -3.59 -3.54 N.A. N.A. N.A. N.A. N.A. N.A.
Punjab -11.87 -6.96 4.91 -9.59 -5.58 4.01 -2.05 -3.89 -1.84 -2.29 -6.43 -4.13 -3.72 2.35 6.07 -6.24 -6.97 -0.74
Rajasthan -5.22 -5.98 -0.76 -0.89 0.15 0.98 -0.18 4.72 4.90 12.14 28.83 16.68 -6.44 -4.02 2.42 -0.32 0.53 0.85
TamilNadu
N.A. N.A. N.A. N.A. N.A. NA. N.A. 7.15 4.95 -4.52 1.28 5.80 N.A. N.A. N.A. N.A. N.A. N.A.
UttarPradesh
-1.80 -1.92 -0.12 -3.59 -3.41 0.14 -0.59 -1.09 -0.50 -3.37 -1.04 2.36 4.92 8.06 3.14 -2.60 -2.58 0.02
WestBengal
-10.17 -12.29 -2.12 5.67 7.53 1.59 -19.33 -21.09 -1.76 -8.63 -8.63 0.00 0.73 6.65 5.92 -7.01 -5.29 1.72
All-India -1.35 -0.50 0.85 -0.03 0.70 0.74 2.26 1.75 -0.51 -0.21 0.75 1.00 2.28 5.88 3.60 2.05 2.81 0.75
NA. = Not available.
A PROFILE OF PULSES PRODUCTION IN INDIA: FACTS, TRENDS AND OPPORTUNITIES
330 INDIAN JOURNAL OF AGRICULTURAL ECONOMICS
production in Madhya Pradesh was rising while in Uttar Pradesh, it was declining.Chickpea production in non-traditional areas was increasing at a rapid rate,particularly in Andhra Pradesh, Maharashtra and Karnataka. In these states, the areaexpansion was the major source of increased chickpea production. In some of thetraditional areas (Bihar, Haryana, Himachal Pradesh, Punjab and Uttar Pradesh),chickpea has been drastically substituted by wheat. The crop found new niches inAndhra Pradesh, Karnataka, Maharashtra and West Bengal. The temporal shift inchickpea area during the 1990s revealed that the crop has gradually shifted fromnorth to south India, and from eastern to western parts of the country. It is interestingto note that chickpea yields have shown increasing trends in most of the states duringthe decade of 1990. In some states yields were declining but production was growingmainly on account of area increase. Such a phenomenon occurs when the crop isgrown in new areas, which are characterised as marginal. The availability ofimproved chickpea varieties resulted in raising yields in different chickpea producingpockets (Joshi et al., 1999).
Pigeonpea: Pigeonpea is the second most important pulse crop in the country. Itoccupied an area of about 3.5 million hectares, which produced about 2.7 milliontonnes of grains in 1999-2000. Pigeonpea production, which was growing annuallyat the rate of about 1.75 per cent during the 1980s showed stagnation (0.75 per cent)during the 1990s (Table 2). While the area increased rapidly during the 1980s, itdeclined in the 1990s. Four states, namely, Gujarat, Madhya Pradesh, Maharashtraand Uttar Pradesh produced about 75 per cent of total pigeonpea in the country.Among these states, production was impressively rising in Maharashtra during the1990s, while in Gujarat, Uttar Pradesh and Madhya Pradesh it witnessed descendingtrends. Increase in pigeonpea production in Maharashtra was mainly attributed toyield gains. It is disturbing to note that except in Uttar Pradesh and Bihar, thepigeonpea yields were below one tonne per hectare in all the states with all-Indiaaverage at 786 kg/ha (1999-2000). Maharashtra, in spite of being the largest producerof pigeonpea in India, attained a low level of yields (834 kg/ha). Higher yields wereobtained in relatively better-endowed and irrigated areas as compared to marginal andrainfed areas.
It is distressing that pigeonpea area in a majority of the states has declined duringthe 1990s. The available trends in pigeonpea area showed that it has gradually movedfrom more wetter (irrigated or high rainfall) areas to drier (minted and medium orlow rainfall) areas. Since pigeonpea is a long duration crop, declining size of holdingis replacing it in favour of cereals and other short-duration remunerative crops (Jha,2001). However, short and extra-short duration pigeonpea varieties are now available,which may make pigeonpea more viable in smaller holdings. It may be mentionedthat in Andhra Pradesh and Maharashtra, the medium duration varieties are beingfavoured against long duration varieties and other crops (Bantilan and Joshi, 1996;Bantilan and Parthasarathy, 1999).
A PROFILE OF PULSES PRODUCTION IN INDIA: FACTS, TRENDS AND OPPORTUNITIES 331
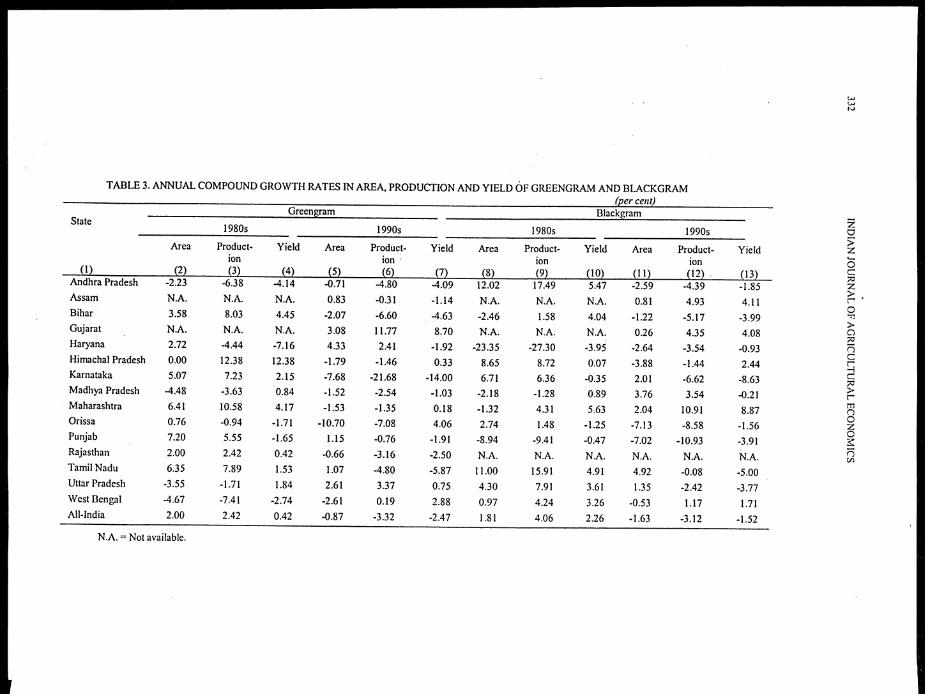
Blackgranz: The crop is ranked third among all pulses in the country. Although itaccounts for only 10 per cent of total pulses production in the country, it is grown in awide range of environments. It is an important crop in Andhra Pradesh, Maharashtra,Orissa, Madhya Pradesh, Tamil Nadu and Uttar Pradesh. At the national level, thearea and production of blackgram increased during the 1980s, which showed gradualdecline during the 1990s (Table 3). The national trends were reflected in a majorityof the states with the exception of Madhya Pradesh, Maharashtra and Assam, whereproduction rose during the 1990s. In Madhya Pradesh, the yield levels were too lowbut the area under the crop was impressively rising. This is an indication that the cropis finding niche in marginal areas. Since the crop can be grown in more diverseenvironments, efforts should be initiated for its larger adoption in new areas.
Greengram: More than 60 per cent of the area and production of greengram wasshared by only three states, namely, Andhra Pradesh, Maharashtra and Orissa. Thiscrop is also grown in a wide range of environments. At the national level, theproduction of greengram went up during the 1980s, but declined during the 1990s(Table 3). It was because the area under greengram in all the three major producingstates has sharply shrunk. The production of greengram was rising in Gujarat,Haryana and Uttar Pradesh during the 1990s. These states accounted for only 15 percent of total greengram production in the country. Yields were rapidly rising inGujarat.
Lentil: Lentil is one of the minor pulse crops. Its production was 1.08 milliontonnes in 1999-2000, which accounted for about 8 per cent of total pulses productionin the country. Uttar Pradesh (60 per cent) and Madhya Pradesh (30 per cent)accounted for 90 per cent of total lentil production in the country. Uttar Pradesh,which witnessed impressive performance of lentil during the 1980s, showed declinein its area and production during the 1990s (Table 2). In Madhya Pradesh, itsproduction was rising during the 1990s. Area expansion was the main source ofproduction increase. Maharashtra is emerging in a big way for lentil cultivation,where production growth was remarkable due to area expansion. Other states whereproduction was rising through yield gains during the 1990s were Assam and Bihar.In these two states, lentil is grown as a para crop, when its seeds are broadcasted instanding rice crop, which is almost ready for harvest to escape the terminal drought.
ESTIMATES ON TOTAL FACTOR PRODUCTIVITY
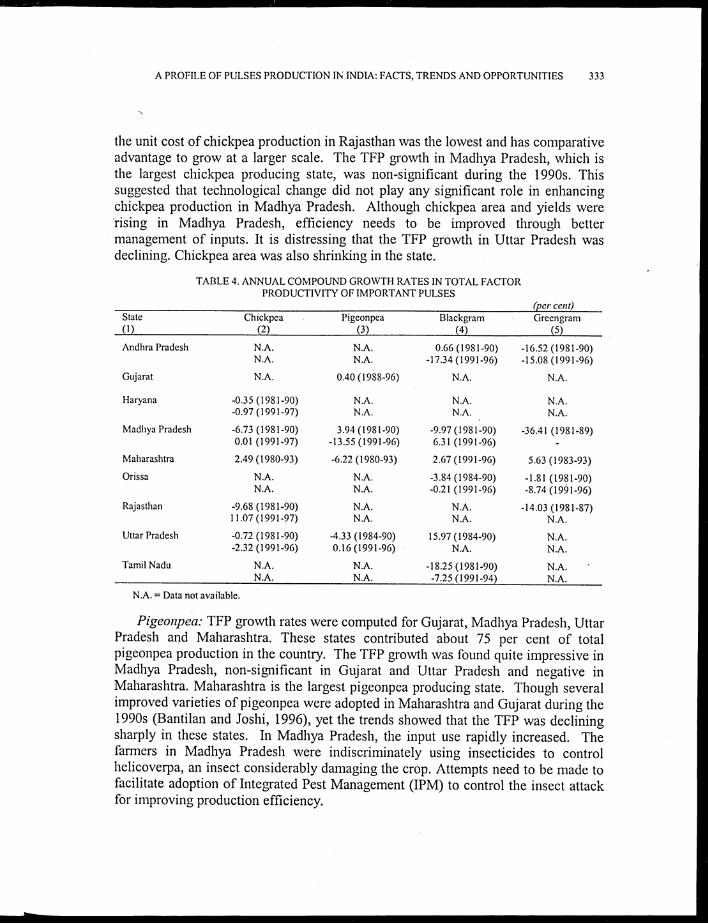
Total factor productivity (TFP) and its growth rates were computed for chickpea,pigeonpea, blackgram and greengram (Table 4). Non-availability of required dataconstrained in estimating the TFP for other pulse crops and for uniform time periods.
Chickpea: TFP of chickpea was computed for Haryana, Madhya Pradesh,Rajasthan, Uttar Pradesh and Maharashtra. These account for more than 90 per centof chickpea area and production in the country. The TFP growth was quite impressivein Rajasthan during 1991-97, and Maharashtra during 1980-93. These two statescontributed about one-third of total chickpea production in the country. Incidentally,
ta..)
TABLE 3. ANNUAL COMPOUND GROWTH RATES IN AREA, PRODUCTION AND YIELD OF GREENGRAM AND BLACKGRAM(per cent)
Greengram BlackgramState
1980s 1990s 1980s 1990s
(1)
Area
(2)
Product-ion
(3)
Yield
(4)
Area
(5)
Product-ion i(6)
Yield
(7)
Area
(8)
Product-ion
(9)
Yield
(10)
Area
(11)
Product-ion(12) .
Yield
(13)Andhra Pradesh -2.23 -6.38 -4.14 -0.71 -4.80 -4.09 12.02 17.49 5.47 -2.59 -4.39 -1.85Assam N.A. N.A. N.A. 0.83 -0.31 -1.14 N.A. N.A. N.A. 0.81 4.93 4.11Bihar 3.58 8.03 4.45 -2.07 -6.60 -4.63 -2.46 1.58 4.04 -1.22 -5.17 -3.99Gujarat NA. N.A. N.A. 3.08 11.77 8.70 N.A. N.A. N.A. 0.26 4.35 4.08Haryana 2.72 -4.44 -7.16 4.33 2.41 -1.92 -23.35 -27.30 -3.95 -2.64 -3.54 -0.93Himachal Pradesh 0.00 12.38 12.38 -1.79 -1.46 0.33 8.65 8.72 0.07 -3.88 -1.44 2.44Karnataka 5.07 7.23 2.15 -7.68 -21.68 -14.00 6.71 6.36 -0.35 2.01 -6.62 -8.63Madhya Pradesh -4.48 -3.63 0.84 -1.52 -2.54 -1.03 -2.18 -1.28 0.89 3.76 3.54 -0.21Maharashtra 6.41 10.58 4.17 -1.53 -1.35 0.18 -1.32 4.31 5.63 2.04 10.91 8.87Orissa 0.76 -0.94 -1.71 -10.70 -7.08 4.06 2.74 1.48 -1.25 -7.13 -8.58 -1.56Punjab 7.20 5.55 -1.65 1.15 -0.76 -1.91 -8.94 -9.41 -0.47 -7.02 -10.93 -3.91Rajasthan 2.00 2.42 0.42 -0.66 -3.16 -2.50 N.A. N.A. N.A. N.A. N.A. N.A.Tamil Nadu 6.35 7.89 1.53 1.07 -4.80 -5.87 11.00 15.91 4.91 4.92 -0.08 -5.00Uttar Pradesh -3.55 -1.71 1.84 2.61 3.37 0.75 4.30 7.91 3.61 1.35 -2.42 -3.77West Bengal -4.67 -7.41 -2.74 -2.61 0.19 2.88 0.97 4.24 3.26 -0.53 1.17 1.71All-India 2.00 2.42 0.42 -0.87 -3.32 -2.47 1.81 4.06 2.26 -1.63 -3.12 -1.52
N.A. = Not available.
A PROFILE OF PULSES PRODUCTION IN INDIA: FACTS, TRENDS AND OPPORTUNITIES 333
the unit cost of chickpea production in Rajasthan was the lowest and has comparativeadvantage to grow at a larger scale. The TFP growth in Madhya Pradesh, which isthe largest chickpea producing state, was non-significant during the 1990s. Thissuggested that technological change did not play any significant role in enhancingchickpea production in Madhya Pradesh. Although chickpea area and yields wererising in Madhya Pradesh, efficiency needs to be improved through bettermanagement of inputs. It is distressing that the TFP growth in Uttar Pradesh wasdeclining. Chickpea area was also shrinking in the state.
TABLE 4. ANNUAL COMPOUND GROWTH RATES IN TOTAL FACTORPRODUCTIVITY OF IMPORTANT PULSES
(per cent)State
(1)
Chickpea(2)
Pigeonpea
(3)
Blackgram(4)
Greengram
(5)
Andhra Pradesh N.A. N.A. 0.66 (1981-90) -16.52 (1981-90)N.A. N.A. -17.34 (1991-96) -15.08 (1991-96)
Gujarat N.A. 0.40 (1988-96) N.A. N.A.
Haryana -0.35 (1981-90) N.A. N.A. N.A.-0.97 (1991-97) N.A. N.A. N.A.
Madhya Pradesh -6.73 (1981-90) 3.94 (1981-90) -9.97 (1981-90) -36.41 (1981-89)0.01 (1991-97) -13.55 (1991-96) 6.31 (1991-96)
Maharashtra 2.49 (1980-93) -6.22 (1980-93) 2.67 (1991-96) 5.63 (1983-93)
Orissa N.A. N.A. -3.84 (1984-90) -1.81 (1981-90)N.A. N.A. -0.21 (1991-96) -8.74 (101-96)
Rajasthan -9.68 (1981-90) N.A. N.A. -14.03 (1981-87)11.07(1991-97) N.A. N.A. N.A.
Uttar Pradesh -0.72 (1981-90) -4.33 (1984-90) 15.97 (1984-90) N.A.-2.32 (1991-96) 0.16 (1991-96) N.A. N.A.
Tamil Nadu N.A. N.A. -18.25 (1981-90) N.A.N.A. N.A. -7.25 (1991-94) N.A.
N.A. = Data not available.
Pigeonpea: TFP growth rates were computed for Gujarat, Madhya Pradesh, UttarPradesh and Maharashtra. These states contributed about 75 per cent of totalpigeonpea production in the country. The TFP growth was found quite impressive inMadhya Pradesh, non-significant in Gujarat and Uttar Pradesh and negative inMaharashtra. Maharashtra is the largest pigeonpea producing state. Though severalimproved varieties of pigeonpea were adopted in Maharashtra and Gujarat during the1990s (Bantilan and Joshi, 1996), yet the trends showed that the TFP was decliningsharply in these states. In Madhya Pradesh, the input use rapidly increased. Thefarmers in Madhya Pradesh were indiscriminately using insecticides to controlhelicoverpa, an insect considerably damaging the crop. Attempts need to be made tofacilitate adoption of Integrated Pest Management (IPM) to control the insect attackfor improving production efficiency.
334 INDIAN JOURNAL OF AGRICULTURAL ECONOMICS
Blackgram: The TFP growth with respect to blackgram was found positive onlyin Madhya Pradesh and Maharashtra. These two states accounted for about one-thirdof total blackgram area in the country. These are the states where the unit cost ofblackgram production was the lowest in comparison to other states. Orissa wasranked third with respect to the unit cost of blackgram production. Introduction ofimproved cultivars of blackgram in Orissa would result in raising yield levels and indeclining the unit cost of production. There exists high potential for blackgramproduction in Orissa.
Greengram: Only Maharashtra experienced high and positive growth in TFP ofgreengram. The state accounted for about 19 per cent of greengram production in thecountry. It was Andhra Pradesh, which was producing the greengram at least cost butthe TFP was declining at a rapid rate. Greengram has prospects in Andhra Pradeshprovided input use is more efficiently managed.
CONSTRAINTS TO PULSES PRODUCTION
Pulses are more prone to several abiotic, biotic and socio-economic constraintsthan cereals and other crops. The biotic and abiotic constraints include insects,diseases and stresses under different environments, which vary across different pulses(Johansen et al., 2000). However, the socio-economic constraints are often common,and the important ones are briefly discussed below:
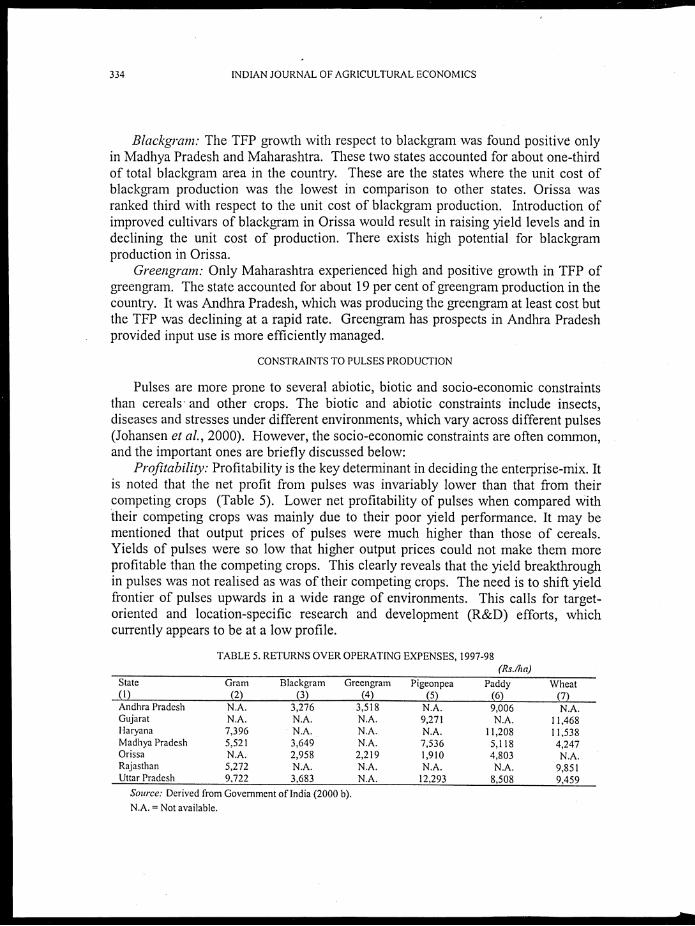
Profitability: Profitability is the key determinant in deciding the enterprise-mix. Itis noted that the net profit from pulses was invariably lower than that from theircompeting crops (Table 5). Lower net profitability of pulses when compared withtheir competing crops was mainly due to their poor yield performance. It may bementioned that output prices of pulses were much higher than those of cereals.Yields of pulses were so low that higher output prices could not make them moreprofitable than the competing crops. This clearly reveals that the yield breakthroughin pulses was not realised as was of their competing crops. The need is to shift yieldfrontier of pulses upwards in a wide range of environments. This calls for target-oriented and location-specific research and development (R&D) efforts, whichcurrently appears to be at a low profile.
TABLE 5. RETURNS OVER OPERATING EXPENSES, 1997-98(Rs./ha)
State Gram Blackgram Greengram Pigeonpea Paddy Wheat(1) (2) (3) (4) (5) (6) (7)Andhra Pradesh N.A. 3,276 3,518 N.A. 9,006 N.A.Gujarat N.A. N.A. N.A. 9,271 N.A. 11,468Haryana 7,396 N.A. N.A. N.A. 11,208 11,538Madhya Pradesh 5,521 3,649 N.A. 7,536 5,118 4,247Orissa N.A. 2,958 2,219 1,910 4,803 N.A.Rajasthan 5,272 N.A. N.A. N.A. N.A. 9,851Uttar Pradesh 9,722 3,683 N.A. 12,293 8,508 9,459
Source: Derived from Government of India (2000 b).
N.A. = Not available.
A PROFILE OF PULSES PRODUCTION IN INDIA: FACTS, TRENDS AND OPPORTUNITIES 335
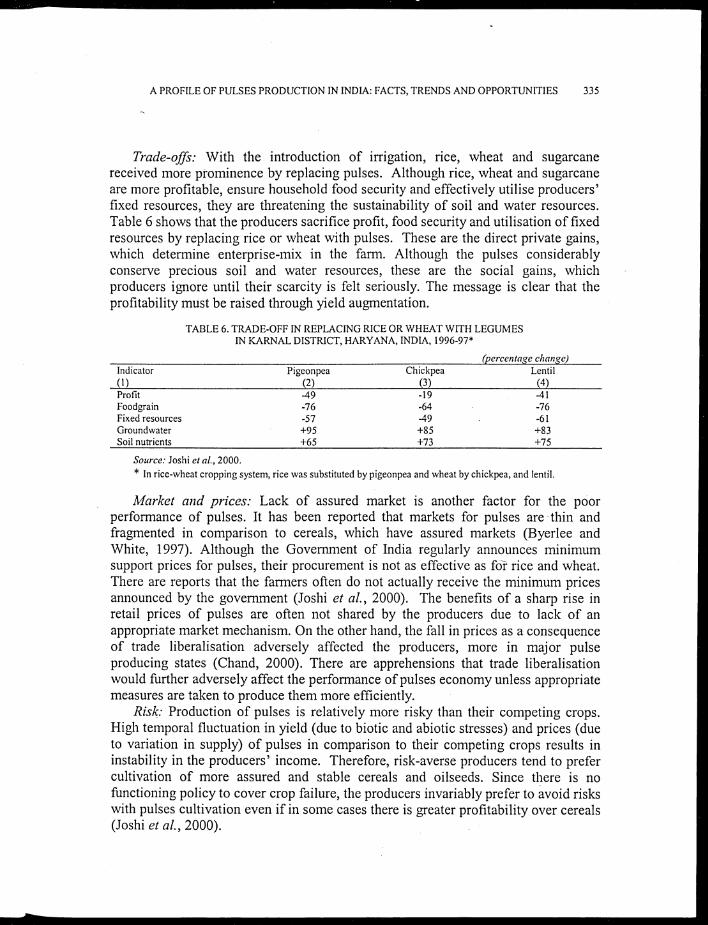
Trade-offs: With the introduction of irrigation, rice, wheat and sugarcanereceived more prominence by replacing pulses. Although rice, wheat and sugarcaneare more profitable, ensure household food security and effectively utilise producers'fixed resources, they are threatening the sustainability of soil and water resources.Table 6 shows that the producers sacrifice profit, food security and utilisation of fixedresources by replacing rice or wheat with pulses. These are the direct private gains,which determine enterprise-mix in the farm. Although the pulses considerablyconserve precious soil and water resources, these are the social gains, whichproducers ignore until their scarcity is felt seriously. The message is clear that theprofitability must be raised through yield augmentation.
TABLE 6. TRADE-OFF IN REPLACING RICE OR WHEAT WITH LEGUMESIN KARNAL DISTRICT, HARYANA, INDIA, 1996-97*
(percentage change)Indicator Pigeonpea Chickpea Lentil(1) (2) (3) (4)Profit -49 -19 -41Foodgrain -76 -64 -76Fixed resources -57 -49 -61Groundwater +95 +85 +83Soil nutrients +65 +73 +75
Source: Joshi etal., 2000.
* In rice-wheat cropping system, rice was substituted by pigeonpea and wheat by chickpea, and lentil.
Market and prices: Lack of assured market is another factor for the poorperformance of pulses. It has been reported that markets for pulses are thin andfragmented in comparison to cereals, which have assured markets (Byerlee andWhite, 1997). Although the Government of India regularly announces minimumsupport prices for pulses, their procurement is not as effective as foi- rice and wheat.There are reports that the farmers often do not actually receive the minimum pricesannounced by the government (Joshi et al., 2000). The benefits of a sharp rise inretail prices of pulses are often not shared by the producers due to lack of anappropriate market mechanism. On the other hand, the fall in prices as a consequenceof trade liberalisation adversely affected the producers, more in major pulseproducing states (Chand, 2000). There are apprehensions that trade liberalisationwould further adversely affect the performance of pulses economy unless appropriatemeasures are taken to produce them more efficiently.
Risk: Production of pulses is relatively more risky than their competing crops.High temporal fluctuation in yield (due to biotic and abiotic stresses) and prices (dueto variation in supply) of pulses in comparison to their competing crops results ininstability in the producers' income. Therefore, risk-averse producers tend to prefercultivation of more assured and stable cereals and oilseeds. Since there is nofunctioning policy to cover crop failure, the producers invariably prefer to avoid riskswith pulses cultivation even if in some cases there is greater profitability over cereals(Joshi et al., 2000).
336 INDIAN JOURNAL OF AGRICULTURAL ECONOMICS
Opportunities for Pulses Production
Enormous opportunities exist for the production of pulses in a wide range ofenvironments. The important ones include better performance in new niches anduntapped yield reservoir.
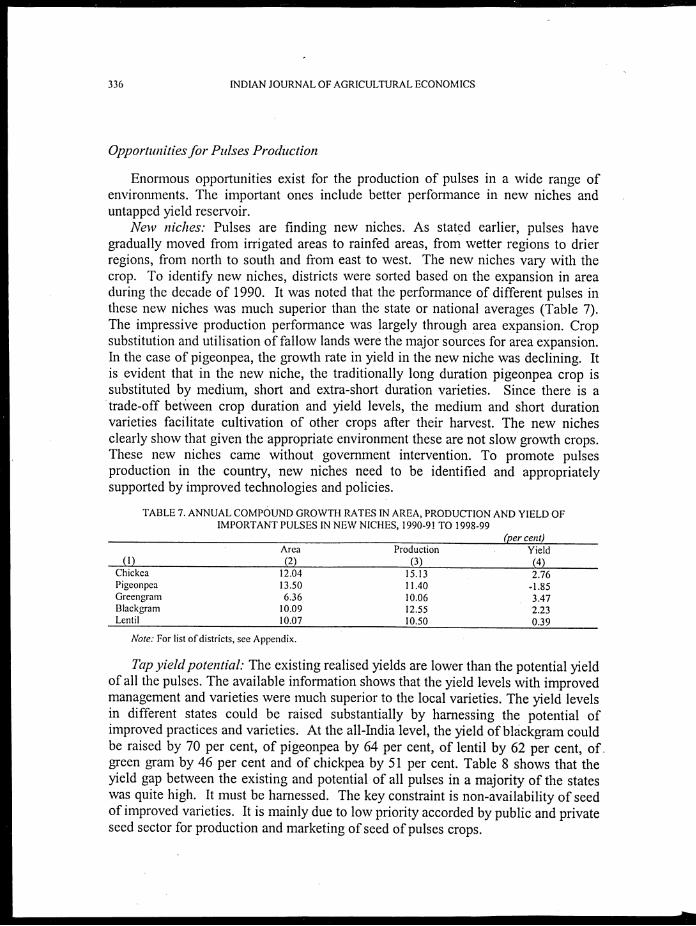
New niches: Pulses are finding new niches. As stated earlier, pulses havegradually moved from irrigated areas to rainfed areas, from wetter regions to drierregions, from north to south and from east to west. The new niches vary with thecrop. To identify new niches, districts were sorted based on the expansion in areaduring the decade of 1990. It was noted that the performance of different pulses inthese new niches was much superior than the state or national averages (Table 7).The impressive production performance was largely through area expansion. Cropsubstitution and utilisation of fallow lands were the major sources for area expansion.In the case of pigeonpea, the growth rate in yield in the new niche was declining. Itis evident that in the new niche, the traditionally long duration pigeonpea crop issubstituted by medium, short and extra-short duration varieties. Since there is atrade-off between crop duration and yield levels, the medium and short durationvarieties facilitate cultivation of other crops after their harvest. The new nichesclearly show that given the appropriate environment these are not slow growth crops.These new niches came without government intervention. To promote pulsesproduction in the country, new niches need to be identified and appropriatelysupported by improved technologies and policies.
TABLE 7. ANNUAL COMPOUND GROWTH RATES IN AREA, PRODUCTION AND YIELD OFIMPORTANT PULSES IN NEW NICHES, 1990-91 TO 1998-99
(per cent)
(1)Area(2)
Production
(3)
Yield(4)
Chickea 12.04 15.13 2.76Pigeonpea 13.50 11.40 -1.85Greengram 6.36 10.06 3.47Blackgram 10.09 12.55 2.23Lentil 10.07 10.50 0.39
Note: For list of districts, see Appendix.
Tap yield potential: The existing realised yields are lower than the potential yieldof all the pulses. The available information shows that the yield levels with improvedmanagement and varieties were much superior to the local varieties. The yield levelsin different states could be raised substantially by harnessing the potential ofimproved practices and varieties. At the all-India level, the yield of blackgram couldbe raised by 70 per cent, of pigeonpea by 64 per cent, of lentil by 62 per cent, of.green gram by 46 per cent and of chickpea by 51 per cent. Table 8 shows that theyield gap between the existing and potential of all pulses in a majority of the stateswas quite high. It must be harnessed. The key constraint is non-availability of seedof improved varieties. It is mainly due to low priority accorded by public and privateseed sector for production and marketing of seed of pulses crops.
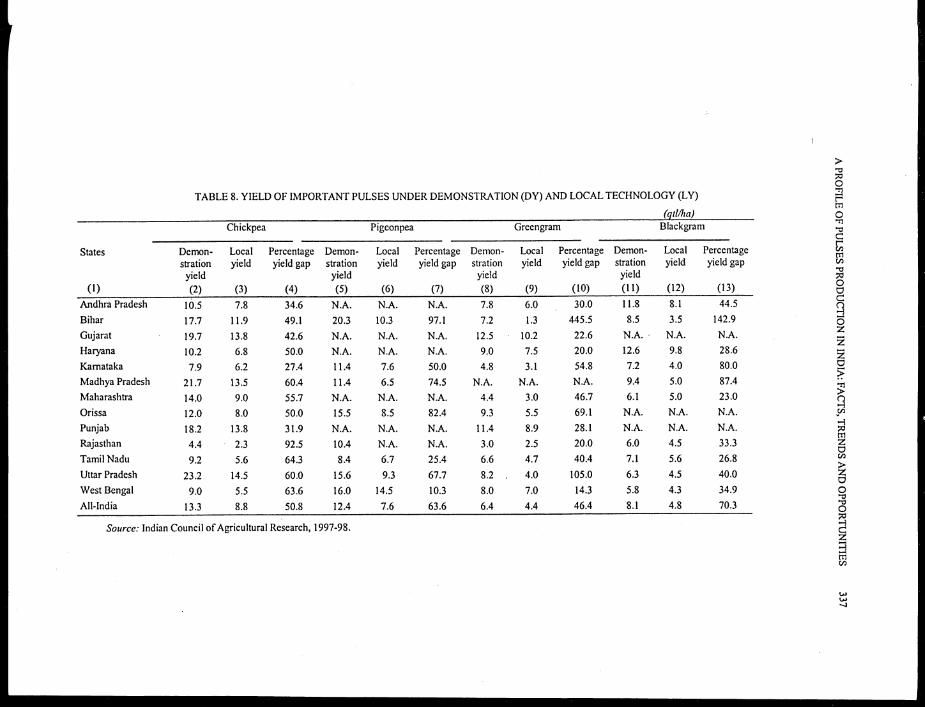
TABLE 8. YIELD OF IMPORTANT PULSES UNDER DEMONSTRATION (DY) AND LOCAL TECHNOLOGY (LY)
(qtl/ha)
Chickpea Pigeonpea Greengram Blackgram
States Demon- Local Percentage Demon- Local Percentage Demon- Local Percentage Demon- Local Percentage
stration yield yield gap stration yield yield gap stration yield yield gap stration yield yield gap
yield yield yield yield
(1) (2) (3) (4) (5) (6) (7) (8) (9) (10) (11) (12) (13)
Andhra Pradesh 16.5 7.8 34.6 N.A. N.A. N.A. 7.8 6.0 30.0 11.8 8.1 44.5
Bihar 17.7 11.9 49.1 20.3 10.3 97.1 7.2 1.3 445.5 8.5 3.5 142.9
Gujarat 19.7 13.8 42.6 N.A. N.A. N.A. 12.5 10.2 22.6 N.A. - N.A. N.A.
Haryana 10.2 6.8 50.0 N.A. N.A. N.A. 9.0 7.5 20.0 12.6 9.8 28.6
Karnataka 7.9 6.2 27.4 11.4 7.6 50.0 4.8 3.1 54.8 7.2 4.0 80.0
Madhya Pradesh 21.7 13.5 60.4 11.4 6.5 74.5 N.A. N.A. N.A. 9.4 5.0 87.4
Maharashtra 14.0 9.0 55.7 N.A. N.A. N.A. 4.4 3.0 46.7 6.1 5.0 23.0
Orissa 12.0 8.0 50.0 15.5 8.5 82.4 9.3 5.5 69.1 N.A. N.A. N.A.
Punjab 18.2 13.8 31.9 N.A. N.A. N.A. 11.4 8.9 28.1 N.A. N.A. N.A.
Rajasthan 4.4 2.3 92.5 10.4 N.A. N.A. 3.0 2.5 20.0 6.0 4.5 33.3
Tamil Nadu 9.2 5.6 64.3 8.4 6.7 25.4 6.6 4.7 40.4 7.1 5.6 26.8
Uttar Pradesh 23.2 14.5 60.0 15.6 9.3 67.7 8.2 4.0 105.0 6.3 4.5 40.0
West Bengal 9.0 5.5 63.6 16.0 14.5 10.3 8.0 7.0 14.3 5.8 4.3 34.9
All-India 13.3 8.8 50.8 12.4 7.6 63.6 6.4 4.4 46.4 8.1 4.8 70.3
Source: Indian Council of Agricultural Research, 1997-98.
A PROFILE OF PULSES PRODUCTION IN INDIA: FACTS, TRENDS AND OPPORTUNITIES
338 INDIAN JOURNAL OF AGRICULTURAL ECONOMICS
SUMMARY AND CONCLUSIONS
The above evidences clearly showed that pulses are finding new niches. Most ofthe pulses have moved from traditional to non-traditional areas. Although the overallperformance of different pulses was dismal, their prospects in new niches seem to bequite promising. It is therefore critical to delineate the promising niche for each pulsecrop and introduce appropriate technology and create favourable environmentthrough policy support. Simultaneously, the potential of improved technologies alsoneed to be tapped. The improved technologies need to be disseminated rapidly byinvolving seed sector, research institutions or non-government organisations. Failingto do that the pulses area may gradually shrink as a consequence of massive importand adversely affect the producers of pulse crops. This calls for identification andprioritisation of region-specific constraints to pulse production and accordinglydesign R&D strategy for efficiently augmenting production of pulse crops to meet theobjectives of improving their availability, reducing their import and conservingnatural resources. The existing low profile pulse research and extension programmeneeds to be overhauled to bring yellow revolution in pulses sector.
APPENDIX
LIST OF DISTRICTS IN NEW NICHES OF IMPORTANT PULSES
Pulse
(1)Districts included
(2
11.111,11.11.1.111.111.11...
Chickpea Anantapur, Cuddapah, Guntur, Kurnool, Medak, Samastipur, Kaira, Panchmahals, Rajkot.Ahmednagar, Akola, Amravati, Buldhana, Chandrapur, Nanded, Parbhani, Satara, Bhilwara,Bikaner, Chittorgarh, Churu, Jaipur, Jhunjhunu, Pali, Tonk.
Pigeonpea Guntur, Prakasam, Warangal, Champaran (West), Gaya, Jamnagar, Balasore, Cuttack, Ganjam,Alwar, Pali, Dindigul, Anna Kanpur city, Sonbhadra.
Greengram Guntur, Kurnool, Mahbubnagar, Medak, Prakasam, Vizianagaram, Amreli, Bhavnagar, PanchMahals, Rajkot, Surendranagar, Amritsar, Dharmapuri, Firozabad, Mainpuri.
Blackgram Adilabad, Kurnool, Medak, Nellore, Vizianagaram, Bhavnagar, Junagadh, Mehsana, Rajkot,Akola, Deed, Kolhapur, Latur, Nanded, Osmanabad, Parbhani, Solapur, Coimbatore, Banda,Hamirpur, Jalaun, Jhansi, Kanpur city, Manipuri.
Lentil Agra, Azamgarh, Ballia, Faizabad, Farrukhabad, Fatehpur, Kanpur city, Lalitpur, Lucknow,Mau, Siddarthnagar, Sonbhadra, Sultanpur, Unnao, Bankura, Birbhum, Coochbehar, Jalpaiguri.
REFERENCES
Bantilan, M.C.S. and P.K. Joshi (1996), Returns to Research and Diffusion Investments on Wilt Resistance inPigeonpea, Impact Series No. 1, International Crops Research Institute for the Semi-Arid Tropics, Patancheru,Andhra Pradesh.
Bantilan, M.C.S. and D. Parthasarathy (1999), Efficiency and Sustainability Gains from Adoption of Short-DurationPigeonpea in Non-Legume-Based Cropping Systems, Impact Series No. 5, International Crops ResearchInstitute for the Semi-Arid Tropics, Patancheru, Andhra Pradesh.
Byerlee, D. and R. White (1997), "Agricultural Systems Intensification and Diversification through Food Legumes:Technological and Policy Options", Invited paper presented at the III International Food Legumes ResearchConference, September 22-26, 1997, Adelaide, Australia.
A PROFILE OF PULSES PRODUCTION IN INDIA: FACTS, TRENDS AND OPPORTUNITIES 339
Chand, Ramesh (2000), "Trade Liberalization, Agricultural Prices and Net Social Welfare in India", Keynote paper inthe Third Asian Conference of Agricultural Economists, October 18-20, 2000, Jaipur.
Government of India (2000 a), Area and Production of Principal Crops in India, Directorate of Economics andStatistics, Ministry of Agriculture, New Delhi.
Government of India (2000 b), Cost of Cultivation of Principal Crops in India, Directorate of Economics andStatistics, Ministry of Agriculture, New Delhi.
Government of India (2002), Agricultural Statistics at a Glance, Directorate of Economics and Statistics, Ministry ofAgriculture, New Delhi.
Indian Council of Agricultural Research (1997-98), Performance of Frontline Demonstrations on Pulse Crops, NewDelhi.
Jha, D. (2001), Technologies for Sustained and Enhanced Productivity for Small Farm, in Proceedings of IndianNational Science Congress, January 3-7, 2001, New Delhi.
Johansen, C.; J.M. Duxbury, S.M Virmani, C.L.L. Gowda, S. Pande and P.K. Joshi (Eds.) (2000), Legumes in Riceand Wheat Cropping Systems of the Indo-Gangetic Plain: Constraints and Opportunities, International CropsResearch Institute for the Semi-Arid Tropics, Patancheru, Andhra Pradesh ,and Cornell University, Ithaca, NewYork, U.S.A.
Joshi, P.K., M. Asokan and M.C.S. Bantilan (1999), "Impact of Improved Chickpea Cultivars", in M.C.S. Bantilanand P.K. Joshi (Eds.) (1999), Joint Research Impact, International CroPs Research Institute for the Semi-AridTropics, Patancheru, Andhra Pradesh.
Joshi, P.K.; M. Asokan, K.K. Datta and P. Kumar (2000), "Socio-Economic Constraints to Legumes Production inRice-Wheat Cropping Systems of India", in C. Johansen; J.M Duxbury, S.M. Virmani, C.L.L. Gowda, S. Pandeand P.K. Joshi (Eds.) (1999), op. cit.
Rosegrant, M.W. and R.E. Evenson (1992), Agricultural Productivity and Sources of Growth in South Asia,American Journal of Agricultural Economics, Vol. 74, No. 3, August, pp. 757-761.-
Copyright © 2022 FDOKUMEN

