


Bahasa
Halaman
Hukum

Pattern Recognition Letters 25 (2004) 975–988
www.elsevier.com/locate/patrec
A novel approach for structural feature extraction:Contour vs. direction
Brijesh Verma a,*, Michael Blumenstein b, Moumita Ghosh c
a School of Information Technology, Central Queensland University, Bruce Highway, Qld 4702, Australiab School of Information Technology, Griffith University, Parklands Drive, Qld 4215, Australia
c School of Information Technology & Mathematical Sciences, University of Ballarat, P.O. Box 663, Ballarat VIC 3353, Australia
Received 11 November 2003; received in revised form 29 December 2003
Available online 1 April 2004
Abstract
The paper presents a novel approach for extracting structural features from segmented cursive handwriting. The
proposed approach is based on the contour code and stroke direction. The contour code feature utilises the rate of
change of slope along the contour profile in addition to other properties such as the ascender and descender count, start
point and end point. The direction feature identifies individual line segments or strokes from the character’s outer
boundary or thinned representation and highlights each character’s pertinent direction information. Each feature is
investigated employing a benchmark database and the experimental results using the proposed contour code based
structural feature are very promising. A comparative evaluation with the directional feature and existing transition
feature is included.
� 2004 Elsevier B.V. All rights reserved.
Keywords: Handwriting recognition; Feature extraction; Segmentation; Neural networks
1. Introduction
Interest in the recognition of off-line handwrit-
ten cursive words has been ongoing for over fourdecades. Off-line handwriting recognition refers to
the problem of computer-based reading of hand-
written characters or words that have been written
on a common surface (i.e. paper). This is signifi-
cantly different to on-line handwriting recognition
* Corresponding author.
E-mail addresses: [email protected] (B. Verma), m.blu-
[email protected] (M. Blumenstein), [email protected].
au (M. Ghosh).
0167-8655/$ - see front matter � 2004 Elsevier B.V. All rights reserv
doi:10.1016/j.patrec.2004.02.013
whereby words are generally written on a pressure
sensitive surface from which real time information,
such as the order of strokes made by the writer, is
obtained and preserved (Plamondon and Srihari,2000).
One of the first investigations in the literature
that confronted the cursive word recognition
problem was that of Frishkopf and Harmon
(1961). In their research, the authors investigated
a letter-by-letter or segmentation-based approach
in addition to a holistic approach for reading
cursive script. To this very day, the main ap-proaches that exist for off-line cursive word rec-
ognition may be divided into segmentation-based
ed.
976 B. Verma et al. / Pattern Recognition Letters 25 (2004) 975–988
and holistic ones. Generally, the former utilises a
strategy based on the recognition of individual
characters whereas the latter deals with the rec-
ognition of the word image as a whole (Plamon-
don and Srihari, 2000). Since Frishkopf and
Harmon’s seminal work, research into the recog-nition of cursive handwriting still continues to be
intense. This continued motivation may be
attributed in part to the challenging nature of the
problem as well as the countless number of
commercial areas that it may be applied to Suen
et al. (1993). Applications that have received
particular attention in recent times include postal
address recognition (Burges et al., 1992; Kimuraet al., 1992), bank cheque processing (Paquet and
Lecourtier, 1991; Guillevic and Suen, 1998) and
forms processing (Bruel, 1994).
In the segmentation-based strategy for hand-
written word recognition, the objective is to over-
segment the word a sufficient number of times to
ensure that all appropriate letter boundaries have
been dissected. To determine the best segmenta-tions, a set of hypotheses are tested by merging
segments of the image and invoking a classifier to
score the combinations. Most techniques employ
an optimisation algorithm making use of some
sort of lexicon-driven, dynamic programming
technique and possibly incorporating contextual
knowledge. The basic approach described above
was proposed simultaneously by a number ofresearchers (Kimura et al., 1992, 1994; Gader
et al., 1992, 1997; Kim and Govindaraju, 1997).
A crucial component of the segmentation-based
strategy is the development of a classification
system for scoring individual characters and
character combinations. The literature is replete
with high accuracy recognition systems for sepa-
rated handwritten numerals (Cai and Liu, 1999;Lee, 1996; Cho, 1997), however the same measure
of success has not been attained for segmented or
cursive characters (Gader et al., 1997; Yamada
and Nakano, 1996; Kimura et al., 1997; Singh and
Hewitt, 2000; Lazzerini and Marcelloni, 2000;
Camastra and Vinciarelli, 2001, 2003; Hanmandlu
et al., 2003). There are three main problems faced
when dealing with segmented, handwritten char-acter recognition: The first relates to the ambiguity
of the character without the context of the entire
word i.e. an ‘‘l’’ may look very similar to an ‘‘e’’.
The second problem relates to the illegibility of
certain characters due to the nature of cursive
writing i.e. ornamentation, distorted character
shape etc. (Blumenstein et al., 2003). Finally, the
process of segmentation may itself introduce someanomalies depending on the algorithm used. Cer-
tain algorithms may not locate the segmentation
path or anchorage point accurately and may
sometimes dissect adjacent character components
(Blumenstein and Verma, 2001).
In order to address the problems discussed
above, researchers have explored two main ap-
proaches: (1) Determining features best suited forrecognition and (2) investigation of different clas-
sification schemes (Lazzerini and Marcelloni,
2000). Yamada and Nakano (1996) investigated a
standard technique for feature extraction based on
direction histograms in character images. They
used a multi-template strategy with clustering for
the recognition of segmented characters from
words in the CEDAR database (Hull, 1994).Kimura et al. investigated a similar feature
extraction technique calculating local histograms
based on chain code information in segmented
handwritten characters. They used statistical and
neural classifiers for the recognition of segmented
CEDAR characters. Gader et al. (1997) have
proposed a feature extraction technique utilising
transition information. Their technique is based onthe calculation and location of transitions from
background to foreground pixels in the vertical
and horizontal directions. The authors used neural
networks trained with the backpropagation algo-
rithm for recognising characters obtained from US
postal words. Other recent studies by Camastra
and Vinciarelli (2001, 2003) have proposed feature
extraction techniques generating local and globalfeatures. The local features are obtained from sub-
images of the character including foreground pixel
density information and directional information.
The global features used included the fraction of
the character appearing below the word baseline
and the character’s width/height ratio. The authors
used learning vector quantization (LVQ) (Cam-
astra and Vinciarelli, 2001) and a combination ofNEURAL GAS and LVQ classifiers (Camastra
and Vinciarelli, 2003) for the recognition of seg-
B. Verma et al. / Pattern Recognition Letters 25 (2004) 975–988 977
mented (cursive) characters from the CEDAR
database.
In this research, a novel approach is presented
for extracting structural features from segmented
handwritten characters. The approach is based on
the character’s contour code and stroke direction.The contour code feature is based on information
extracted from each characters contour profile
such as slope change, direction change, starting
points and end points. In contrast, the direction
feature obtains information based on the identifi-
cation of individual line segments (or strokes) and
distinguishes each segment in terms of its nor-
malized direction. The approach is tested using abenchmark database of handwritten characters
and the results are promising.
The remainder of this paper is broken down
into four sections: Section 2 describes the hand-
writing recognition system along with the pro-
posed feature extraction approach. Section 3
provides experimental results. A discussion of the
results takes place in Section 4, and finally Section5 presents conclusions and future research.
2. Overview of handwriting recognition system
The techniques described in this research form
part of a larger handwriting recognition system as
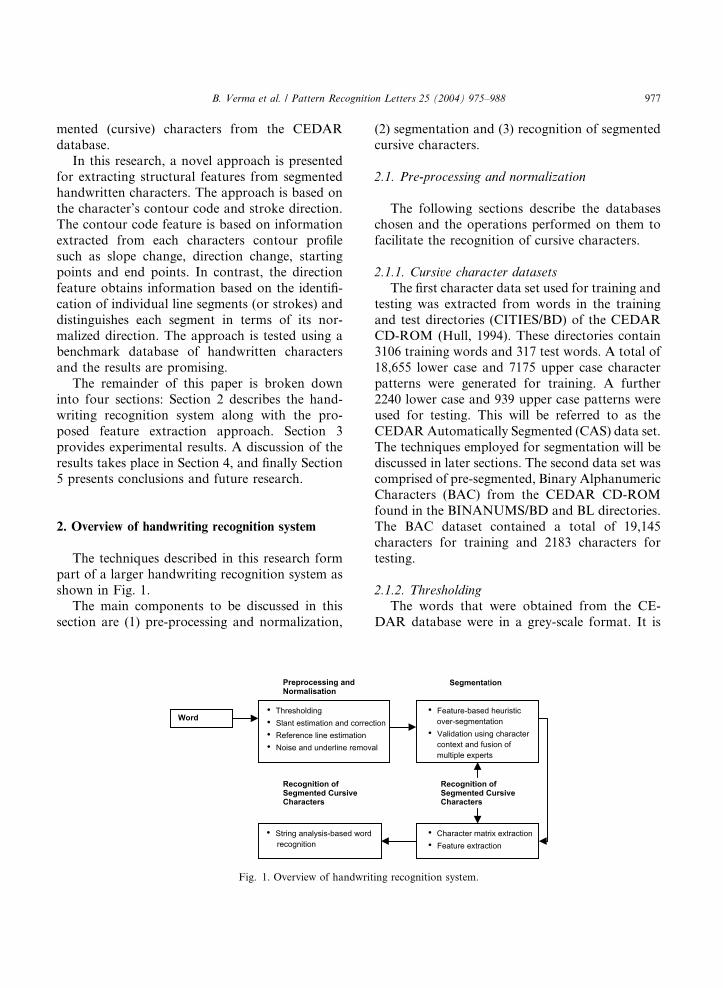
shown in Fig. 1.The main components to be discussed in this
section are (1) pre-processing and normalization,
Recognition ofSegmented Cursive Characters
• String analysis-based wordrecognition
• Thresholding • Slant estimation and correc• Reference line estimation • Noise and underline remov
Word
Preprocessing and Normalisation
Fig. 1. Overview of handwrit
(2) segmentation and (3) recognition of segmented
cursive characters.
2.1. Pre-processing and normalization
The following sections describe the databaseschosen and the operations performed on them to
facilitate the recognition of cursive characters.
2.1.1. Cursive character datasets
The first character data set used for training and
testing was extracted from words in the training
and test directories (CITIES/BD) of the CEDAR
CD-ROM (Hull, 1994). These directories contain3106 training words and 317 test words. A total of
18,655 lower case and 7175 upper case character
patterns were generated for training. A further
2240 lower case and 939 upper case patterns were
used for testing. This will be referred to as the
CEDARAutomatically Segmented (CAS) data set.
The techniques employed for segmentation will be
discussed in later sections. The second data set wascomprised of pre-segmented, Binary Alphanumeric
Characters (BAC) from the CEDAR CD-ROM
found in the BINANUMS/BD and BL directories.
The BAC dataset contained a total of 19,145
characters for training and 2183 characters for
testing.
2.1.2. Thresholding
The words that were obtained from the CE-
DAR database were in a grey-scale format. It is
• Character matrix extraction • Feature extraction
Recognition ofSegmented Cursive Characters
Segmentation
• Feature-based heuristic over-segmentation • Validation using character context and fusion of multiple experts
tion
al
ing recognition system.
978 B. Verma et al. / Pattern Recognition Letters 25 (2004) 975–988
common for grey-level images to be thresholded
prior to further processing in most handwriting
recognition systems. Thresholding is advantageous
as it is easier to manipulate images with only to
levels of colour, processing is faster, less compu-
tationally expensive and allows for more compactstorage. Otsu’s (1979) method was employed to
threshold the handwritten words used in this re-
search. The characters in the BAC dataset were
already in a binary format and did not require
thresholding.
2.1.3. Slant estimation and correction
Arguably, slant estimation and correction maybe one of the most important steps in word pre-
processing and normalization. It is helpful in
transforming handwritten words into a normalized
form that more easily facilitates segmentation and
the extraction of features. A large proportion of
real-world handwritten words exhibit some sort of
slant usually in the forward direction. The ‘‘cities’’
directory of the CEDAR database is no exception.The slant estimation and correction strategy em-
ployed in this research is a slightly modified ver-
sion of that described in (Bozinovic and Srihari,
1989). Through correction of all words in the
CEDAR database it was found that the slant was
adequately corrected in most cases.
2.1.4. Baseline computation
Baseline computation is another important
technique in handwriting recognition. Baselines
are used for size normalization, correcting rota-
tion, extracting features etc. The baseline detection
algorithm incorporated in this research is very
simple and is similar to those employed by other
researchers in the area. It is briefly described below
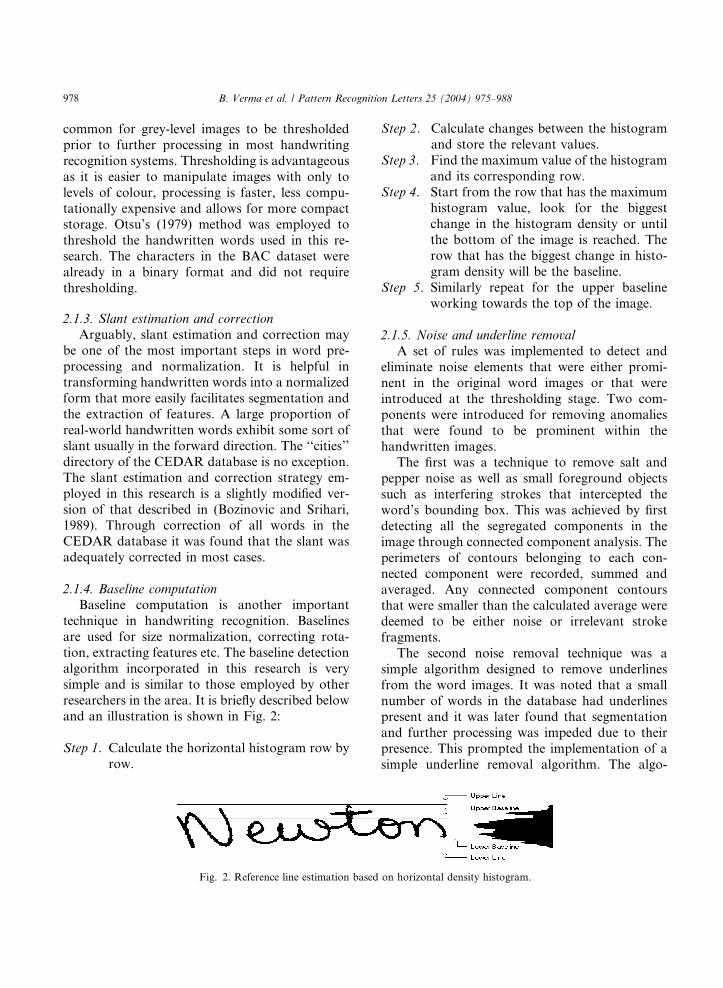
and an illustration is shown in Fig. 2:
Step 1. Calculate the horizontal histogram row by
row.
Fig. 2. Reference line estimation based
Step 2. Calculate changes between the histogram
and store the relevant values.
Step 3. Find the maximum value of the histogram
and its corresponding row.
Step 4. Start from the row that has the maximumhistogram value, look for the biggest
change in the histogram density or until
the bottom of the image is reached. The
row that has the biggest change in histo-
gram density will be the baseline.
Step 5. Similarly repeat for the upper baseline
working towards the top of the image.
2.1.5. Noise and underline removal
A set of rules was implemented to detect and
eliminate noise elements that were either promi-
nent in the original word images or that were
introduced at the thresholding stage. Two com-
ponents were introduced for removing anomalies
that were found to be prominent within the
handwritten images.The first was a technique to remove salt and
pepper noise as well as small foreground objects
such as interfering strokes that intercepted the
word’s bounding box. This was achieved by first
detecting all the segregated components in the
image through connected component analysis. The
perimeters of contours belonging to each con-
nected component were recorded, summed andaveraged. Any connected component contours
that were smaller than the calculated average were
deemed to be either noise or irrelevant stroke
fragments.
The second noise removal technique was a
simple algorithm designed to remove underlines
from the word images. It was noted that a small
number of words in the database had underlinespresent and it was later found that segmentation
and further processing was impeded due to their
presence. This prompted the implementation of a
simple underline removal algorithm. The algo-
on horizontal density histogram.
B. Verma et al. / Pattern Recognition Letters 25 (2004) 975–988 979
rithm searched the word images horizontally for
the presence of underlines. Upon detection of a
relatively long unbroken horizontal line of fore-
ground pixels, a potential underline had been
identified. Its length was recorded, and if its length
exceeded that of a threshold that had been calcu-lated earlier based on the size of the word, then it
was marked as an underline and removed. This
simple algorithm worked for some underlines but
did not perform well on some of the more difficult,
erratic and skewed underlines that were present in
some word images. The remainder of undetected
underlines were removed manually to facilitate
further processing.
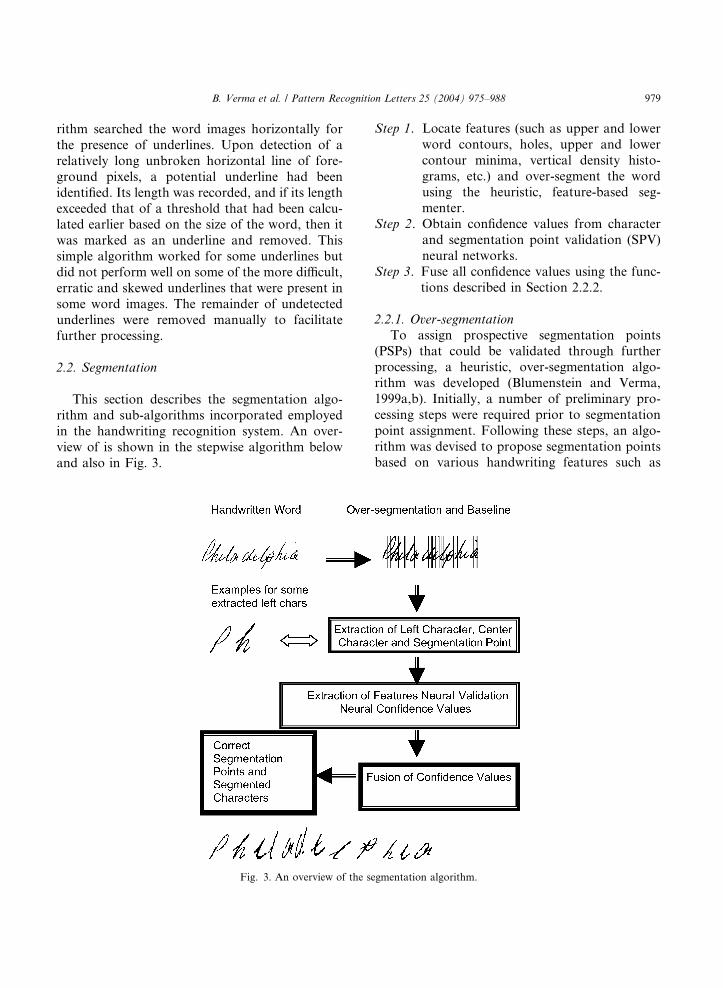
2.2. Segmentation
This section describes the segmentation algo-
rithm and sub-algorithms incorporated employed
in the handwriting recognition system. An over-
view of is shown in the stepwise algorithm below
and also in Fig. 3.
Fig. 3. An overview of the se
Step 1. Locate features (such as upper and lower
word contours, holes, upper and lower
contour minima, vertical density histo-
grams, etc.) and over-segment the word
using the heuristic, feature-based seg-menter.
Step 2. Obtain confidence values from character
and segmentation point validation (SPV)
neural networks.
Step 3. Fuse all confidence values using the func-
tions described in Section 2.2.2.
2.2.1. Over-segmentation
To assign prospective segmentation points
(PSPs) that could be validated through further
processing, a heuristic, over-segmentation algo-
rithm was developed (Blumenstein and Verma,
1999a,b). Initially, a number of preliminary pro-
cessing steps were required prior to segmentation
point assignment. Following these steps, an algo-
rithm was devised to propose segmentation pointsbased on various handwriting features such as
gmentation algorithm.
980 B. Verma et al. / Pattern Recognition Letters 25 (2004) 975–988
upper and lower word contours, holes, upper and
lower contour minima, vertical density histograms
and confidence assignment.
2.2.1.1. Preliminary processing. The first step of
processing required connected components in theimage to be determined. These components rep-
resented isolated characters or sections of joined or
cursive handwriting. The larger components would
be split into smaller components in further steps.
Conversely, small connected components were
deemed as being ‘‘noise’’ in the word image and
were hence removed to facilitate the segmentation
process.The next steps of processing required calcula-
tion of certain measurements that would assist in
locating segmentation points: (1) stroke width
estimation, (2) word height estimation and (3)
average character width estimation. These mea-
surements were invaluable for serving as threshold
values when assigning segmentation points (refer to
Section 2.2.1.2).
2.2.1.2. Segmentation point assignment. Segmenta-
tion points in each word were assigned based on
confidence values derived from examining various
features located in the word image. Confidence
values for PSPs were increased if the particular
area under examination contained minima in the
upper and lower contour (i.e. possible ligatures incursive writing) and areas in the word that exhib-
ited a low vertical pixel density. Finally, a PSP’s
confidence was decreased if it was located in an
area of the word that contained ‘‘holes’’ (i.e. found
in such letters as ‘‘a’’ and ‘‘o’’). The PSPs bearing
the highest confidences were retained for further
examination i.e. redundant segmentation point
removal, and equally distributing segmentationpoints throughout the word. Hence the PSPs
generated where used as input to the next phase of
the entire segmentation procedure. The reader may
refer to Blumenstein and Verma (2001) for a de-
tailed description of the over-segmentation algo-
rithm.
2.2.2. Neural confidences
Following heuristic segmentation it is necessary
to discard ‘‘incorrect’’ segmentation points while
preserving the ‘‘correct’’ points. This is achieved
by calculating a number of confidences for each
segmentation point generated by the heuristic
segmenter. Three neural networks are used for this
step: Firstly, a neural network is trained with
features extracted from segmentation areas origi-nally located by the heuristic algorithm. The neu-
ral network verifies whether each particular area is
or is not characteristic of a segmentation point
(Blumenstein and Verma, 1999a). If an area is
positively identified as a segmentation point, the
network outputs a high confidence (>0.5). Other-
wise the network will output a confidence close to
0.1.Two other neural networks trained with hand-
written characters (upper case and lower case) are
then used to confirm the first neural network’s
output. Each network is presented with areas
immediately centred on/adjacent to each segmen-
tation point. Area width is calculated based upon
average character width. If for example, the area
immediately to the left of the PSP proves to be avalid character, the network will output a high
confidence (LCC) for that character class. At the
same time, if the area immediately centred on the
segmentation point provides a high confidence for
the reject neuron (CCC), then it is likely that the
PSP is a valid segmentation point. The ‘‘reject’’
output is specifically trained to recognise non-
character patterns (i.e. joined characters, halfcharacters or unintelligible primitives). If this
neuron gives a high confidence, this will usually
indicate that the particular area being tested is a
good candidate for a segmentation point. Other-
wise, if any valid characters are given a high con-
fidence (in the centre character area), it is unlikely
that that particular area should be segmented.
2.3. Contour features for segmented character
recognition
2.3.1. Contour extraction
This section describes the proposed methodol-
ogy for the extracting the contour between the two
segmentation points. The contour between two
consecutive segmentation points is extracted usingthe following few steps: In the first step disconnect
the pixels near the first segmentation point; dis-
B. Verma et al. / Pattern Recognition Letters 25 (2004) 975–988 981
connect the pixels near the second segmentation
point. Find the nearest distance of the first black
pixel from the first segmentation point and the
three baselines. Follow the contour path across
that baseline having minimum distance is closest.
Find the connecting contour. Mark it as visitedonce it is visited. If the contour is already visited
then discard that, take the other part if any.
2.3.2. Proposed contour code based structural
feature
A novel feature extraction technique is pro-
posed to extract the feature between the two con-
tours. The values for feature extracted arestructural feature from the contour profile. So the
feature is named as contour code feature. The rate
of change of slope along with the point where it is
changing is extracted. With the contour slope, a
few additional values that count number of
ascenders, number of descenders, start point, end
point, etc. are taken into consideration to capture
the structural properties of the contour profile.The contour code feature vector size is taken as
25. The contour code feature is described below.
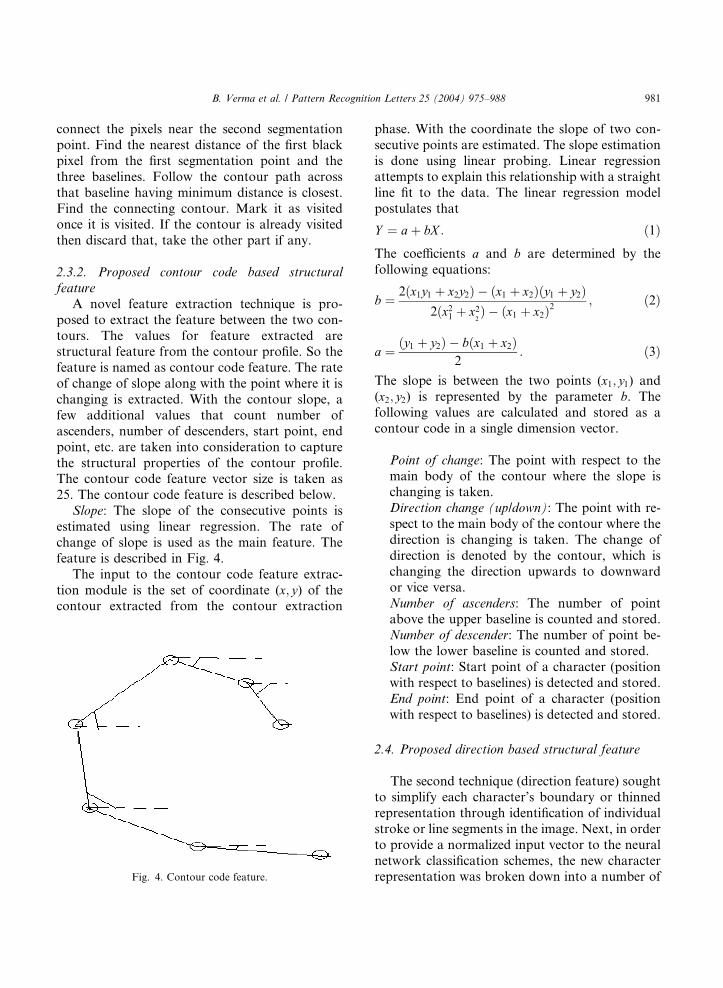
Slope: The slope of the consecutive points is
estimated using linear regression. The rate of
change of slope is used as the main feature. The
feature is described in Fig. 4.
The input to the contour code feature extrac-
tion module is the set of coordinate (x; y) of thecontour extracted from the contour extraction
Fig. 4. Contour code feature.
phase. With the coordinate the slope of two con-
secutive points are estimated. The slope estimation
is done using linear probing. Linear regression
attempts to explain this relationship with a straight
line fit to the data. The linear regression model
postulates that
Y ¼ aþ bX : ð1ÞThe coefficients a and b are determined by the
following equations:
b ¼ 2ðx1y1 þ x2y2Þ � ðx1 þ x2Þðy1 þ y2Þ2ðx21 þ x2
2Þ � ðx1 þ x2Þ2
; ð2Þ
a ¼ ðy1 þ y2Þ � bðx1 þ x2Þ2
: ð3Þ
The slope is between the two points (x1; y1) and
(x2; y2) is represented by the parameter b. The
following values are calculated and stored as a
contour code in a single dimension vector.
Point of change: The point with respect to the
main body of the contour where the slope ischanging is taken.
Direction change (up/down): The point with re-
spect to the main body of the contour where the
direction is changing is taken. The change of
direction is denoted by the contour, which is
changing the direction upwards to downward
or vice versa.
Number of ascenders: The number of pointabove the upper baseline is counted and stored.
Number of descender: The number of point be-
low the lower baseline is counted and stored.
Start point: Start point of a character (position
with respect to baselines) is detected and stored.
End point: End point of a character (position
with respect to baselines) is detected and stored.
2.4. Proposed direction based structural feature
The second technique (direction feature) sought
to simplify each character’s boundary or thinned
representation through identification of individual
stroke or line segments in the image. Next, in order
to provide a normalized input vector to the neural
network classification schemes, the new characterrepresentation was broken down into a number of
982 B. Verma et al. / Pattern Recognition Letters 25 (2004) 975–988
windows of equal size (zoning) whereby the num-
ber, length and types of lines present in each
window was determined. The line segments that
would be determined in each character image were
categorised into four types: (1) vertical lines, (2)
horizontal lines, (3) right diagonal and (4) leftdiagonal. Aside from these four line representa-
tions, the technique also located intersection
points between each type of line.
To facilitate the extraction of direction features,
the following steps were required to prepare the
character pattern:
1. starting point and intersection point location,2. distinguishing individual line segments,
3. labelling line segment information,
4. line type normalization.
2.4.1. Starting point and intersection point location
To locate the starting point of the character, the
first black pixel in the lower left hand side of the
image is found. The choice of this starting point isbased on the fact that in cursive English hand-
writing, many characters begin in the lower, left
hand side. Subsequently, intersection points be-
tween line segments are marked (these locations
are a component of the final feature vector).
Intersection points are determined as being those
foreground pixels that have more than two fore-
ground pixel neighbours.
2.4.2. Distinguish individual line segments
As mentioned earlier, four types of line seg-
ments were to be distinguished as compromising
each character pattern. Following the step de-
scribed in Section 2.3.1, neighbouring pixels along
the thinned pattern/character boundary were fol-
lowed from the starting point to known intersec-tion points. Upon arrival at each subsequent
intersection, the algorithm conducted a search in
a clockwise direction to determine the beginning
and end of individual line segments. Hence, the
commencement of a new line segment was located
IF:
1. the previous direction was up-right or down-leftAND the next direction is down-right or up-left
OR
2. the previous direction is down-right or up-left
AND the next direction is up-right or down-left
OR
3. the direction of a line segment has been changed
in more than three types of direction OR4. the length of the previous direction type is
greater than three pixels.
The above rules were consulted for each set of
pixels in the character pattern. The thresholds in
rules 3 and 4 above were determined by manually
inspecting a subset of the character database.
Firstly, it was noted that the object of ‘‘line typenormalization’’ (Section 2.4.4.) was to normalize
individual lines in a character pattern matching
one of the four line types described earlier; spe-
cifically pixels which did not significantly deviate
from one single direction type. Hence, it was
posited that a line changing in more than three
directions could not be called a single line.
Secondly, in rule 4 above, the threshold of threewas chosen as it was found through visual
inspection that a suitable ‘‘minimum line length’’
could be deemed as being one composed of at least
four pixels all marked with the same direction
value.
2.4.3. Labelling line segment information
Once an individual line segment is located, the
black pixels along the length of this segment are
coded with a direction number as follows: vertical
line segment––2, right diagonal line––3, horizontal
line segment––4 and left diagonal line––5. Fig. 5illustrates the process of marking individual line
segments.
2.4.4. Line type normalization
Following the steps described in Sections 2.4.2
and 2.4.3, line segments were composed of marked
direction pixels (Fig. 5).
As line segments were marked by followingeither the character boundary or thinned image
pattern on a pixel-by-pixel basis, some spurious
direction values may have been marked in any
particular line segment due to the presence
of anomalous pixels introduced through the thin-
ning or boundary extraction process. Hence to
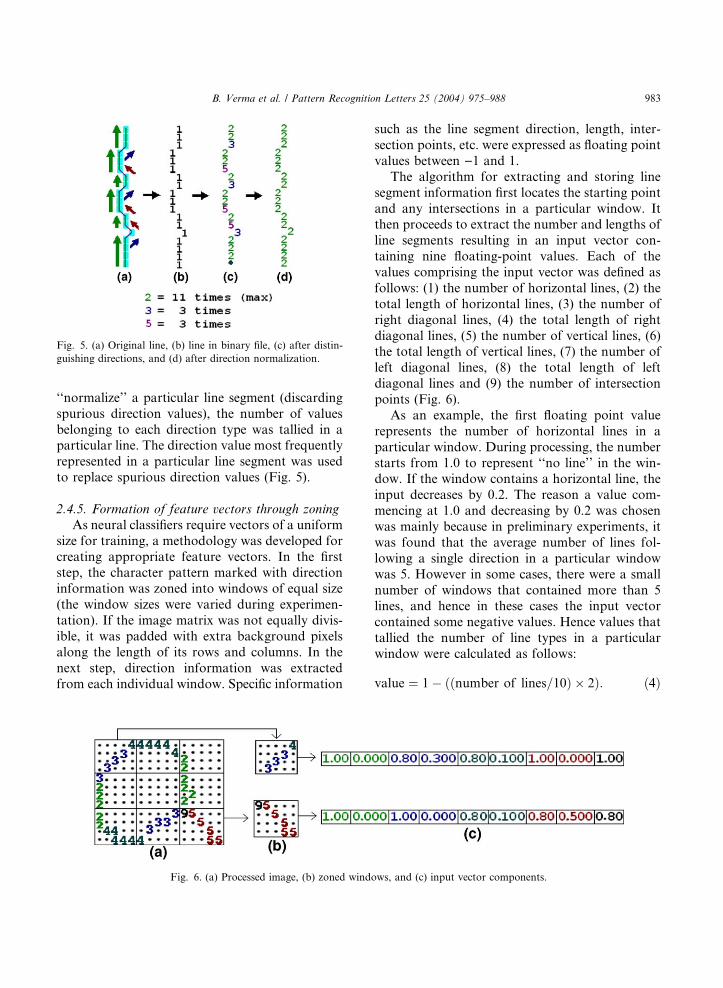
Fig. 5. (a) Original line, (b) line in binary file, (c) after distin-
guishing directions, and (d) after direction normalization.
B. Verma et al. / Pattern Recognition Letters 25 (2004) 975–988 983
‘‘normalize’’ a particular line segment (discarding
spurious direction values), the number of values
belonging to each direction type was tallied in aparticular line. The direction value most frequently
represented in a particular line segment was used
to replace spurious direction values (Fig. 5).
2.4.5. Formation of feature vectors through zoning
As neural classifiers require vectors of a uniform
size for training, a methodology was developed for
creating appropriate feature vectors. In the firststep, the character pattern marked with direction
information was zoned into windows of equal size
(the window sizes were varied during experimen-
tation). If the image matrix was not equally divis-
ible, it was padded with extra background pixels
along the length of its rows and columns. In the
next step, direction information was extracted
from each individual window. Specific information
Fig. 6. (a) Processed image, (b) zoned windo
such as the line segment direction, length, inter-
section points, etc. were expressed as floating point
values between )1 and 1.
The algorithm for extracting and storing line
segment information first locates the starting point
and any intersections in a particular window. Itthen proceeds to extract the number and lengths of
line segments resulting in an input vector con-
taining nine floating-point values. Each of the
values comprising the input vector was defined as
follows: (1) the number of horizontal lines, (2) the
total length of horizontal lines, (3) the number of
right diagonal lines, (4) the total length of right
diagonal lines, (5) the number of vertical lines, (6)the total length of vertical lines, (7) the number of
left diagonal lines, (8) the total length of left
diagonal lines and (9) the number of intersection
points (Fig. 6).
As an example, the first floating point value
represents the number of horizontal lines in a
particular window. During processing, the number
starts from 1.0 to represent ‘‘no line’’ in the win-dow. If the window contains a horizontal line, the
input decreases by 0.2. The reason a value com-
mencing at 1.0 and decreasing by 0.2 was chosen
was mainly because in preliminary experiments, it
was found that the average number of lines fol-
lowing a single direction in a particular window
was 5. However in some cases, there were a small
number of windows that contained more than 5lines, and hence in these cases the input vector
contained some negative values. Hence values that
tallied the number of line types in a particular
window were calculated as follows:
value ¼ 1� ððnumber of lines=10Þ � 2Þ: ð4Þ
ws, and (c) input vector components.
984 B. Verma et al. / Pattern Recognition Letters 25 (2004) 975–988
For each value that tallied the number of lines
present in a particular window, a corresponding
input value tallying the total length of the lines was
also stored. To illustrate, the horizontal line length
can be used as an example. The number starts at 0to represent ‘‘no horizontal lines’’ in a particular
window. If a window has a horizontal line, the
input will increase by the length of the line divided
by the maximum window length or window height,
(depending on which one is the largest) multiplied
by two. The reason this formula is used, is because
it is assumed that the maximum length of one
single line type is two times the largest windowsize. As an example, if the line length is 7 pixels
and the window size is 10 pixels · 13 pixels, then
the line length will be 7=ð13� 2Þ ¼ 0:269:
length ¼ number of pixels in a particular direction
ðwindow height or widthÞ � 2:
ð5Þ
The operations discussed above for the encoding
of horizontal line information must be performed
for the remainder of directions. The last input
vector value represents the number of intersection
points in the character. It is calculated in the same
manner as for the number of lines present. Fig. 6
illustrates the process of input vector creation.
2.5. Configuration of the neural classifiers
The neural classifiers chosen for the task of
character recognition were Multi-layer-Perceptron
(MLP) and Radial Basis Function (RBF) net-
works. For experimentation purposes, the archi-
tectures were modified varying the number of
inputs, outputs, hidden units, hidden layers andthe various learning terms.
The number of inputs to each network was
associated with the size of the feature vector for
each image. The most successful vector configu-
rations were of size 25 for the contour code fea-
ture, 81 for the direction feature and 100 for the
transition feature. For the BAC data set (whilst
testing the contour code feature), two separateneural networks were trained for lowercase and
uppercase characters. The number of outputs
considered for this data set was 26 for each
(characters a–z and A–Z). With the CAS data set,
two separate neural networks were trained for
lowercase and uppercase characters. This time the
number of outputs considered for this data set was
27 (characters a–z and 1 reject neuron for non-
character patterns). The non-character categorywas specifically used to identify character patterns
that were smaller than approximately half a reg-
ular character and those character components
that had not been correctly split i.e. multiple
characters. For the BAC data set (whilst testing
the direction feature), a single neural network
architecture was considered with 36 outputs simi-
lar to that proposed by Singh and Hewitt (2000).
2.6. Preparation of training and testing data
For neural network training it was necessary
to include samples for each type of character
ða–z;A–ZÞ. In the case of the CAS data set, train-
ing and test files needed to be manually prepared,
however character matrix patterns were deter-mined based on the output of our heuristic seg-
menter. To summarise the character extraction
process, our technique first proceeded to sequen-
tially locate all non-cursive/printed character
components through the use of character com-
ponent analysis. Next, x-coordinates (vertical
segmentations) for each connected character
component (defined by the heuristic segmenter(Blumenstein and Verma, 1999a,b)) were used to
define the vertical boundaries of each character
matrix. The horizontal boundaries of the character
matrix were deemed as the top-most and bottom-
most y-coordinates of the connected component
being examined. Each extracted character was
viewed by a human operator and was labelled
manually as belonging to a particular characterclass.
3. Experimental results
The first set of character recognition experi-
ments tested the contour code feature using a back
propagation neural network. The number ofcharacters used for training and testing were 1500
and 1200, respectively from the BAC dataset. The
B. Verma et al. / Pattern Recognition Letters 25 (2004) 975–988 985
results obtained for character recognition using
the contour code feature were compared to the
performance of the transition feature and are
shown in Table 1.
Table 2 presents top results using the CAS
dataset, the MLP and the direction and transitionfeature extraction techniques described in Section
2. Separate experiments were once again con-
ducted for lower case and upper case character
patterns. A total of 18,655 lower case and 7175
upper case character patterns were generated for
training. A further 2240 lower case and 939 upper
case patterns were used for testing.
Finally, Table 3 presents results for the entireBAC dataset processed by the direction feature
extraction technique using the MLP network for
non-resized patterns. The BAC dataset contained
a total of 19,145 characters for training and 2183
characters for testing. Resized patterns were ex-
Table 1
Top character recognition rates using the MLP network and a
limited BAC dataset
Recognition rate (%)
Lowercase Uppercase
Contour code 86.84 85.34
Transition 83.46 84.64
Table 2
Top character recognition rates using the MLP network and the
CAS dataset
Recognition rate (%)
Lowercase Uppercase
Direction (resized thinned) 69.78 78.70
Direction (resized boundary) 69.73 77.32
Direction (non-resized thinned) 69.02 80.62
Direction (non-resized boundary) 67.19 79.98
Transition 67.81 79.23
Table 3
Top character recognition rates using the MLP network and the
BAC dataset
Recognition rate (%)
Direction (non-resized thinned) 83.10
Direction (non-resized boundary) 83.65
Transition 82.82
cluded from these experiments on the basis that in
preliminary experiments with the CAS dataset, the
results suggested that on average the non-resized
dataset outperformed the resized one. The results
are once again compared to those obtained using
the transition feature extraction technique.
4. Discussion of results
4.1. Contour character vs. transition feature
The novel contour code feature extraction
technique was compared with the transition fea-ture and it was found that the proposed contour
code feature produced, on average, much higher
recognition rates.
4.2. Direction vs. transition feature
Across all experiments that were performed, it
was found that the direction feature outperformedthe transition feature in all cases. However, whilst
using the MLP network, small differences in rec-
ognition rate may sometimes be attributed to
variations in the starting conditions of the net-
work. Hence, to confirm the veracity of the rec-
ognition rates attained, extra experiments, using
the MLP network configuration that provided the
top result for direction and transition features,were conducted. For each feature type, a total of
six experiments were conducted and the average
recognition rate was calculated. In each case the
direction feature outperformed the transition fea-
ture technique by 2% for lowercase characters and
almost 7% for uppercase characters.
4.3. Contour vs. direction
It is difficult to compare the results from
experiments conducted with the contour code and
direction feature mainly due to differences in data
set size and classifier configuration. Experiments
conducted with the contour code feature used a
reduced sized BAC data set, and separate classifi-
ers were trained for lower case and upper casecharacters. In contrast, experiments conducted
using the direction feature encompassed the entire
986 B. Verma et al. / Pattern Recognition Letters 25 (2004) 975–988
data set and used a single classifier configuration.
One possible method of comparison is to compare
the average lower and uppercase character recog-
nition result obtained with the contour code fea-
ture with the single classifier result of the direction
feature. The recognition rate was slightly higherusing the contour code feature at 86.09% in com-
parison to 83.65% for the direction feature.
4.4. MLP and RBF networks
Upon comparison of results using the RBF and
MLP networks, the top recognition rates in each
case are of a very similar standard. Specifically, thedifference in recognition rates for the CAS dataset
is negligible (Table 4). Although the recognition
rate was not notably higher, training time was
significantly reduced when the RBF network was
employed. For the BAC dataset the highest rec-
ognition rate was obtained using the RBF net-
work. On average however, the MLP network
outperforms RBF.
4.5. General discussion
As may be seen from the results in Table 2, the
use of non-resized patterns resulted in a compa-
rable or slightly higher recognition rate. Whereas
the difference in character classification rate when
features were extracted from thinned characterimages and the character boundary was negligible.
4.6. Character recognition results
It is always a difficult task to compare results
for handwritten character recognition with other
Table 4
Top character recognition rates using the RBF network and the
CAS dataset
Recognition rate (%)
Lowercase Uppercase
Direction (resized thinned) 69.96 77.21
Direction (resized boundary) 70.63 75.93
Direction (non-resized thinned) 70.54 79.98
Direction (non-resized boundary) 69.51 79.23
Transition 70.31 79.13
researchers in the literature. The main problems
that arise are differences in experimental method-
ology, experimental settings and the handwriting
database used. The comparisons presented below
have been chosen for two main reasons. The
handwriting database (CEDAR) used by theresearchers is identical to the one used in this re-
search and the results are some of the most recent
in the literature. Cho (1997) presented a hand-
written word recognition system, which was
trained on segmented characters from the CEDAR
benchmark database. They recorded recognition
rates of 67.8% and 75.7% for the recognition of
characters where upper case letters and lower caseletters were distinguished and not distinguished,
respectively. Therefore, if the top lower case
(70.63%) and upper case (80.62%) character rec-
ognition scores in this research are averaged, a
recognition accuracy of 75.63% is obtained, which
compares well with their results. Kimura et al.
(1997) used neural and statistical classifiers to
recognise segmented CEDAR characters. For casesensitive experiments, their neural classifier pro-
duced an accuracy of 73.25%, which was compa-
rable to the lower case and upper case average of
75.63%. Singh and Hewitt (2000) employed the
modified Hough Transform on characters from
the CEDAR. They obtained a recognition rate of
67.3%, our best result using their network config-
uration (83.65%) compares favourably with theirtop recognition rate. Finally, the techniques pro-
posed in this research compared favourably to
those presented by Camastra and Vinciarelli (2001,
2003).
5. Conclusions and future research
We have presented a novel contour code and
direction feature based approach for the recogni-
tion of segmented handwritten characters. Both
techniques were compared to other popular tech-
niques in the literature. As shown below in Fig. 7,
the proposed techniques outperformed the transi-
tion feature technique and were comparable to
other techniques in the literature. The contourcode technique seems to be very promising pro-
ducing top results. In future research the contour
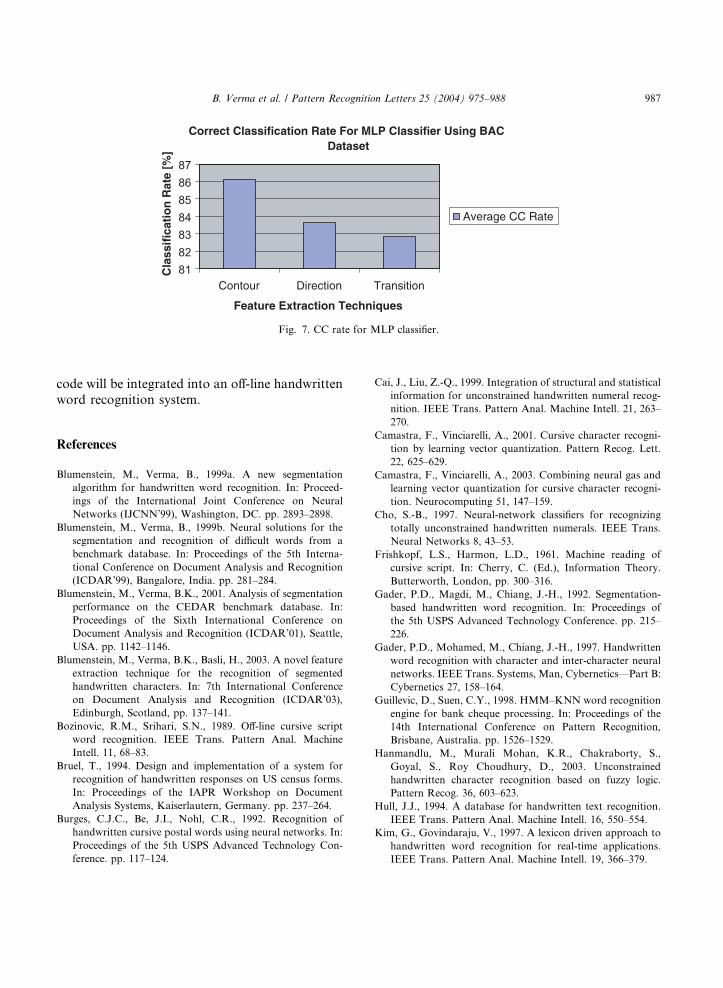
Correct Classification Rate For MLP Classifier Using BAC Dataset
81828384858687
Contour Direction Transition
Feature Extraction Techniques
Cla
ssif
icat
ion
Rat
e [%
]
Average CC Rate
Fig. 7. CC rate for MLP classifier.
B. Verma et al. / Pattern Recognition Letters 25 (2004) 975–988 987
code will be integrated into an off-line handwrittenword recognition system.
References
Blumenstein, M., Verma, B., 1999a. A new segmentation
algorithm for handwritten word recognition. In: Proceed-
ings of the International Joint Conference on Neural
Networks (IJCNN’99), Washington, DC. pp. 2893–2898.
Blumenstein, M., Verma, B., 1999b. Neural solutions for the
segmentation and recognition of difficult words from a
benchmark database. In: Proceedings of the 5th Interna-
tional Conference on Document Analysis and Recognition
(ICDAR’99), Bangalore, India. pp. 281–284.
Blumenstein, M., Verma, B.K., 2001. Analysis of segmentation
performance on the CEDAR benchmark database. In:
Proceedings of the Sixth International Conference on
Document Analysis and Recognition (ICDAR’01), Seattle,
USA. pp. 1142–1146.
Blumenstein, M., Verma, B.K., Basli, H., 2003. A novel feature
extraction technique for the recognition of segmented
handwritten characters. In: 7th International Conference
on Document Analysis and Recognition (ICDAR’03),
Edinburgh, Scotland, pp. 137–141.
Bozinovic, R.M., Srihari, S.N., 1989. Off-line cursive script
word recognition. IEEE Trans. Pattern Anal. Machine
Intell. 11, 68–83.
Bruel, T., 1994. Design and implementation of a system for
recognition of handwritten responses on US census forms.
In: Proceedings of the IAPR Workshop on Document
Analysis Systems, Kaiserlautern, Germany. pp. 237–264.
Burges, C.J.C., Be, J.I., Nohl, C.R., 1992. Recognition of
handwritten cursive postal words using neural networks. In:
Proceedings of the 5th USPS Advanced Technology Con-
ference. pp. 117–124.
Cai, J., Liu, Z.-Q., 1999. Integration of structural and statistical
information for unconstrained handwritten numeral recog-
nition. IEEE Trans. Pattern Anal. Machine Intell. 21, 263–
270.
Camastra, F., Vinciarelli, A., 2001. Cursive character recogni-
tion by learning vector quantization. Pattern Recog. Lett.
22, 625–629.
Camastra, F., Vinciarelli, A., 2003. Combining neural gas and
learning vector quantization for cursive character recogni-
tion. Neurocomputing 51, 147–159.
Cho, S.-B., 1997. Neural-network classifiers for recognizing
totally unconstrained handwritten numerals. IEEE Trans.
Neural Networks 8, 43–53.
Frishkopf, L.S., Harmon, L.D., 1961. Machine reading of
cursive script. In: Cherry, C. (Ed.), Information Theory.
Butterworth, London, pp. 300–316.
Gader, P.D., Magdi, M., Chiang, J.-H., 1992. Segmentation-
based handwritten word recognition. In: Proceedings of
the 5th USPS Advanced Technology Conference. pp. 215–
226.
Gader, P.D., Mohamed, M., Chiang, J.-H., 1997. Handwritten
word recognition with character and inter-character neural
networks. IEEE Trans. Systems, Man, Cybernetics––Part B:
Cybernetics 27, 158–164.
Guillevic, D., Suen, C.Y., 1998. HMM–KNN word recognition
engine for bank cheque processing. In: Proceedings of the
14th International Conference on Pattern Recognition,
Brisbane, Australia. pp. 1526–1529.
Hanmandlu, M., Murali Mohan, K.R., Chakraborty, S.,
Goyal, S., Roy Choudhury, D., 2003. Unconstrained
handwritten character recognition based on fuzzy logic.
Pattern Recog. 36, 603–623.
Hull, J.J., 1994. A database for handwritten text recognition.
IEEE Trans. Pattern Anal. Machine Intell. 16, 550–554.
Kim, G., Govindaraju, V., 1997. A lexicon driven approach to
handwritten word recognition for real-time applications.
IEEE Trans. Pattern Anal. Machine Intell. 19, 366–379.
988 B. Verma et al. / Pattern Recognition Letters 25 (2004) 975–988
Kimura, F., Tsuruoka, S., Shridhar, M., Chen, Z., 1992.
Context-directed handwritten word recognition for postal
service applications. In: Proceedings of the 5th USPS
Advanced Technology Conference. pp. 199–213.
Kimura, F., Tsuruoka, S., Miyake, Y., Shridhar, M., 1994. A
lexicon directed algorithm for recognition of unconstrained
handwritten words. IEICE Trans. Inform. Syst. E77-D,
785–793.
Kimura, F., Kayahara, N., Miyake, Y., Shridhar, M., 1997.
Machine and human recognition of segmented characters
from handwritten words. In: 4th International Conference
on Document Analysis and Recognition (ICDAR’97), Ulm,
Germany. pp. 866–869.
Lazzerini, B., Marcelloni, F., 2000. A Linguistic fuzzy recogn-
iser of off-line handwritten characters. Pattern Recog. Lett.
21, 319–327.
Lee, S.-W., 1996. Off-line recognition of totally unconstrained
handwritten numerals using multilayer cluster neural net-
work. IEEE Trans. Pattern Anal. Machine Intell. 18, 648–
652.
Otsu, N., 1979. A threshold selection method from gray-level
histograms. IEEE Trans. Systems, Man, Cybernetics SMC-
9, 62–66.
Paquet, T., Lecourtier, Y., 1991. Handwriting recognition:
Application on bank cheques. In: Proceedings of the First
International Conference on Document Analysis and Rec-
ognition, St. Malo, France. pp. 749–757.
Plamondon, R., Srihari, S.N., 2000. On-line and off-line
handwriting recognition: A comprehensive survey. IEEE
Trans. Pattern Anal. Machine Intell. 22, 63–84.
Singh, S., Hewitt, M., 2000. Cursive digit and character
recognition on cedar database. In: International Conference
on Pattern Recognition (ICPR 2000), Barcelona, Spain. pp.
569–572.
Suen, C.Y., Legault, R., Nadal, C., Cheriet, M., Lam, L., 1993.
Building a new generation of handwriting recognition
systems. Pattern Recog. Lett. 14, 305–315.
Yamada, H., Nakano, Y., 1996. Cursive handwritten word rec-
ognition using multiple segmentation determined by con-
tour analysis. IEICE Trans. Inform. Syst. E79-D, 464–470.
Copyright © 2022 FDOKUMEN

