


Bahasa
Halaman
Hukum

A model-driven approach toindustrializing discoveryprocesses in pharmaceuticalresearch
&
K. Bhattacharya
R. Guttman
K. Lyman
F. F. Heath III
S. Kumaran
P. Nandi
F. Wu
P. Athma
C. Freiberg
L. Johannsen
A. Staudt
Despite year-to-year increases in R & D budgets, the number of successful NCEs (new
chemical entities) has continued to decline. Drug companies are looking into new
ways to make research processes more efficient, to manage information better, and to
improve collaboration among research groups. This shift from an artisan approach to
an organized, streamlined discovery process is often termed the ‘‘industrialization of
discovery processes.’’ This paper presents an approach to industrializing drug
discovery that involves the formal modeling of research processes at several layers of
abstraction, mappings between adjacent layers, and an implementation of this
hierarchy using information technology-level execution elements. This approach is
applied to the assay development phase of the drug discovery process. First, a
business operations model is built by identifying the business artifacts, developing
models for the life cycles of these artifacts, and then creating a comprehensive model
that combines these life-cycle models and their interactions. Using the concept of
adaptive business objects, a solution composition model that expands on the business
operations model is developed. This model is then mapped into an executable
platform-specific implementation by using the IBM WebSpheret platform. Our
prototype system was built and validated as a joint effort between IBM Research and
Bayer HealthCare.
The main business of the pharmaceutical industry is
to provide drugs that save and extend lives, cure
diseases, and alleviate the burden of sickness or age.
High profits are generated mainly with patent-
protected drugs during the time of patent protection.
The pharmaceutical industry relies heavily on new
drugs to generate the revenue needed to drive the
expensive process of drug development. Drug
development is research-intensive and thus phar-
maceutical companies return more of their profits to
�Copyright 2005 by International Business Machines Corporation. Copying inprinted form for private use is permitted without payment of royalty providedthat (1) each reproduction is done without alteration and (2) the Journalreference and IBM copyright notice are included on the first page. The titleand abstract, but no other portions, of this paper may be copied or distributedroyalty free without further permission by computer-based and otherinformation-service systems. Permission to republish any other portion of thepaper must be obtained from the Editor. 0018-8670/05/$5.00 � 2005 IBM
IBM SYSTEMS JOURNAL, VOL 44, NO 1, 2005 BHATTACHARYA ET AL. 145
research and development than any other industry.
The average cost of bringing a drug to market has
risen from around US$54 million in 1976 to an
estimated US$802 million in 2001. Moreover, this
cost is expected to rise to US$900 million in 2003, an
almost 17-fold increase since 1976.1
Drug discovery researchers strive to produce high-
quality new chemical entities (NCEs) that could
potentially be turned into effective drugs. Despite
year-to-year increases in R & D budgets, the number
of successful NCEs has declined significantly in
recent years. Facing this challenge, research orga-
nizations are looking into new ways of managing
processes and information and enhancing collabo-
ration among teams. This shift from an artisan
approach to an organized, streamlined discovery
process is often termed the ‘‘industrialization’’ of
drug discovery.2,3
Although increased costs can be attributed mostly to
the clinical phase of development, the entire process
of R & D has to be streamlined in order to identify
the most promising drug candidates earlier in the
drug discovery process, which should lead to
reduced development times and improved success
rates. A streamlined approach to drug discovery
should also address several problems identified by
industry analysts, such as low productivity in the
laboratory, patent expiries, and intense therapeutic
competition that have made it increasingly difficult
for pharmaceutical companies to produce new
drugs.3,4
Over the past decade, information technology (IT)
has been used in various aspects of the drug
discovery process, such as data evaluation, deter-
mination of 3D molecular structure, and simulation
of biological systems. The successful industrializa-
tion of drug discovery, however, needs to go beyond
the deployment of specialized applications. Drug
discovery research of the future will support
‘‘horizontal’’ integration of various research teams
to provide information sharing across ‘‘vertical silos
of expertise,’’ thus enabling effective collaboration
of dispersed research teams and improved decision
making.
Working with its partners, IBM is developing a set of
IT capabilities to facilitate the industrialization of a
wide range of business processes. In particular, IBM
Research has developed a model-driven approach to
support the collaboration among various teams and
the integration of people, information, applications,
and systems involved in business processes. Teams
from IBM Research and Bayer HealthCare Research
have collaborated in the work presented here, which
demonstrates the value of the model-driven
approach to drug discovery.
Drug discovery process
The goal of drug discovery research is finding and
producing chemical compounds that can be used to
fight diseases. The viability of chemical compounds
as disease-fighting drugs is determined by a set of
complex characteristics including potency, selectiv-
ity (i.e., effectiveness against the biological target
and harmlessness to other tissue), toxicity, solubil-
ity, metabolic rate and kinetics within a test
organism, ease of chemical synthesis, and patent-
ability. Drug research typically takes between three
and five years to determine a suitable compound for
a given disease.
This process starts with identifying and isolating the
biological target—the biological structure associated
with a specific disease. Such targets are mainly
enzymes or receptors but may also be regulatory
processes within an organism. The target needs to
be prepared in such a way that a very large number
of compounds can be tested for potency against (or
ability to bind with) this target in order to identify a
few compounds that best inhibit or neutralize the
malignant biological behavior of this target.
Chemical structures selected during a highly auto-
mated procedure called high throughput screening
(HTS) are further subjected to a battery of
molecular tests aimed at determining the value of
further investment into these compounds. The
parameters studied include chemical characteristics
(ease of synthesis, solubility, reactivity, etc.) and
biological characteristics (selectivity, activity in
living organisms, toxicity, etc.). When a compound
that satisfies all the major requirements is found, a
chemical synthesis program to produce similar
compounds with improved characteristics, such as
amenability to clinical testing, might follow.
Consecutive phases in the drug discovery process
become increasingly time consuming and costly due
to the complexity of the tasks involved, the
resources consumed, and the personnel required.
Therefore, it is desirable to streamline the process in
BHATTACHARYA ET AL. IBM SYSTEMS JOURNAL, VOL 44, NO 1, 2005146
such a way that compounds can be identified early
in the process.
In most pharmaceutical organizations the drug
discovery process contains the following steps:3
1. Target identification—A suitable biological target
associated with a disease is identified.
2. Target validation—The target is validated by
conducting several preliminary experiments.
3. Assay development—The components to be ana-
lyzed are identified; a protocol to sustain the
screening of large numbers of compounds against
a biological target is developed.
4. HTS—Compounds are screened for potency
against the biological target.
5. Hit identification—A reduced set of chemical
compounds, typically of the order of one million,
are identified in the HTS phase as inhibitors of
the target’s biological function.
6. Lead candidate selection—The selected set of
compounds is further reduced by focusing on the
most promising compounds (typical size of this
set is 1000 compounds).
7. Lead optimization—The chemical structure and
biological effects of the selected set are further
used to reduce the number of compounds (typical
size of the set is 10 compounds).
8. Preclinical testing—Selected compounds are pre-
tested before the large scale clinical trials (e.g.,
testing on animals).
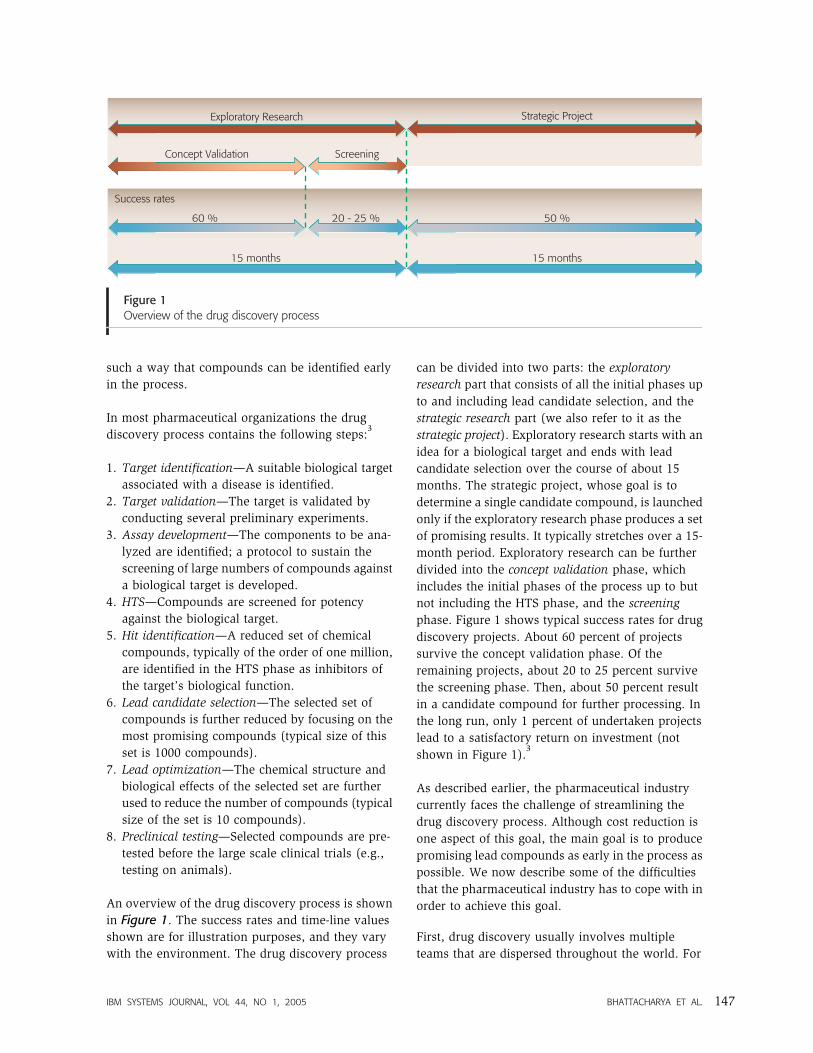
An overview of the drug discovery process is shown
in Figure 1. The success rates and time-line values
shown are for illustration purposes, and they vary
with the environment. The drug discovery process
can be divided into two parts: the exploratory
research part that consists of all the initial phases up
to and including lead candidate selection, and the
strategic research part (we also refer to it as the
strategic project). Exploratory research starts with an
idea for a biological target and ends with lead
candidate selection over the course of about 15
months. The strategic project, whose goal is to
determine a single candidate compound, is launched
only if the exploratory research phase produces a set
of promising results. It typically stretches over a 15-
month period. Exploratory research can be further
divided into the concept validation phase, which
includes the initial phases of the process up to but
not including the HTS phase, and the screening
phase. Figure 1 shows typical success rates for drug
discovery projects. About 60 percent of projects
survive the concept validation phase. Of the
remaining projects, about 20 to 25 percent survive
the screening phase. Then, about 50 percent result
in a candidate compound for further processing. In
the long run, only 1 percent of undertaken projects
lead to a satisfactory return on investment (not
shown in Figure 1).3
As described earlier, the pharmaceutical industry
currently faces the challenge of streamlining the
drug discovery process. Although cost reduction is
one aspect of this goal, the main goal is to produce
promising lead compounds as early in the process as
possible. We now describe some of the difficulties
that the pharmaceutical industry has to cope with in
order to achieve this goal.
First, drug discovery usually involves multiple
teams that are dispersed throughout the world. For
Figure 1Overview of the drug discovery process
Success rates
15 months 15 months
50 %60 % 20 - 25 %
Exploratory Research Strategic Project
ScreeningConcept Validation
IBM SYSTEMS JOURNAL, VOL 44, NO 1, 2005 BHATTACHARYA ET AL. 147
example, an HTS unit takes over the biological
target assays from therapeutic area teams and
screens a large number of chemical structures
supplied by chemistry units. The smooth operation
of the process demands efficient collaboration
among all parties concerned. This collaboration
includes the coordination of resources and the
exchange of information.
Second, every large pharmaceutical research orga-
nization has a heterogeneous technology infra-
structure. In many instances companies have
invested heavily in cutting-edge technology without
due consideration for its overall impact on the entire
discovery process. Research units often are
equipped with platforms that are selected based on
local considerations and may not be designed to
interoperate with other teams’ equipment.
Third, pharmaceutical research produces a tremen-
dous amount of data, sometimes too vast to analyze
in detail.3,5
Often data are used by different teams in
ways that impede collaboration and the smooth flow
of information. For example, the heterogeneous
nature of the technology infrastructure leads to
information produced in a variety of data formats.
Also, data are typically managed locally within
research units and thus not easily accessible by
other teams.
Although other industries are facing similar situa-
tions, the problems are more severe in the phar-
maceutical industry because research is at the core
of its business. The main asset of pharmaceutical
companies is the scientific ingenuity and the
creativity of their research staff. The drug discovery
process must be streamlined without inhibiting the
creativity of researchers. The challenge is to
improve the efficiency of existing processes by
integrating people, information, IT systems, and
various apparatuses to facilitate collaboration
among research units. We now discuss our ap-
proach to accomplishing this task.
Our approach
In a recent paper one of the authors laid out a
conceptual framework for the so-called ‘‘model-
driven enterprise’’ that aims at bridging the gap
between business goals and the IT systems that
support the business processes of the enterprise.6
The framework consists of a hierarchy of four
abstraction layers, each providing a different view
(model) of the behavior of the enterprise.
1. Strategy layer—The strategy model specifies what
the business is intended to achieve. It models the
business objectives in terms that executives and
business strategists understand. For example, it
might specify the objectives in terms of the well-
known balanced scorecard perspective.7
2. Operations layer—The operations model de-
scribes what the business is doing to achieve its
strategic objectives and how it will measure its
progress toward them. It is typically developed by
business analysts in conjunction with line-of-
business managers. Because the model captures
the business operations, commitments, and
operational key performance indicators (KPIs) in
terms accessible to business users, we refer to it
hereafter as the business operations model.
3. Solution composition layer—The solution com-
position model describes the processes and
information flows that the business uses to
implement the operations model. It is platform-
independent and allows iterative performance
improvement while ensuring consistency with
the business objectives. A transformation (map-
ping) tool is used to create the core elements of
the solution composition model from the oper-
ations model, which is then manually refined to
complete its definition.
4. Implementation layer—The implementation
model is a platform-specific realization of the
solution composition model. Tools are used
today to construct portions of the implementation
model directly from the solution composition
model, much as a compiler translates a high-level
language into a machine language. The model
links to applications and specifies how to
measure the parameters needed to determine the
KPIs.
This model-driven approach is now applied to
analyzing and capturing pharmaceutical research
operations. We model specific research operations
at the operations level using the WebSphere*
Business Integration (WBI) Modeler.8We apply a
heuristic transformation algorithm that maps the
operations model into an solution composition
model. The key component used to create the
solution composition model is the adaptive business
object (ABO)—the solution composition layer is a
composition of communicating ABOs.9
BHATTACHARYA ET AL. IBM SYSTEMS JOURNAL, VOL 44, NO 1, 2005148
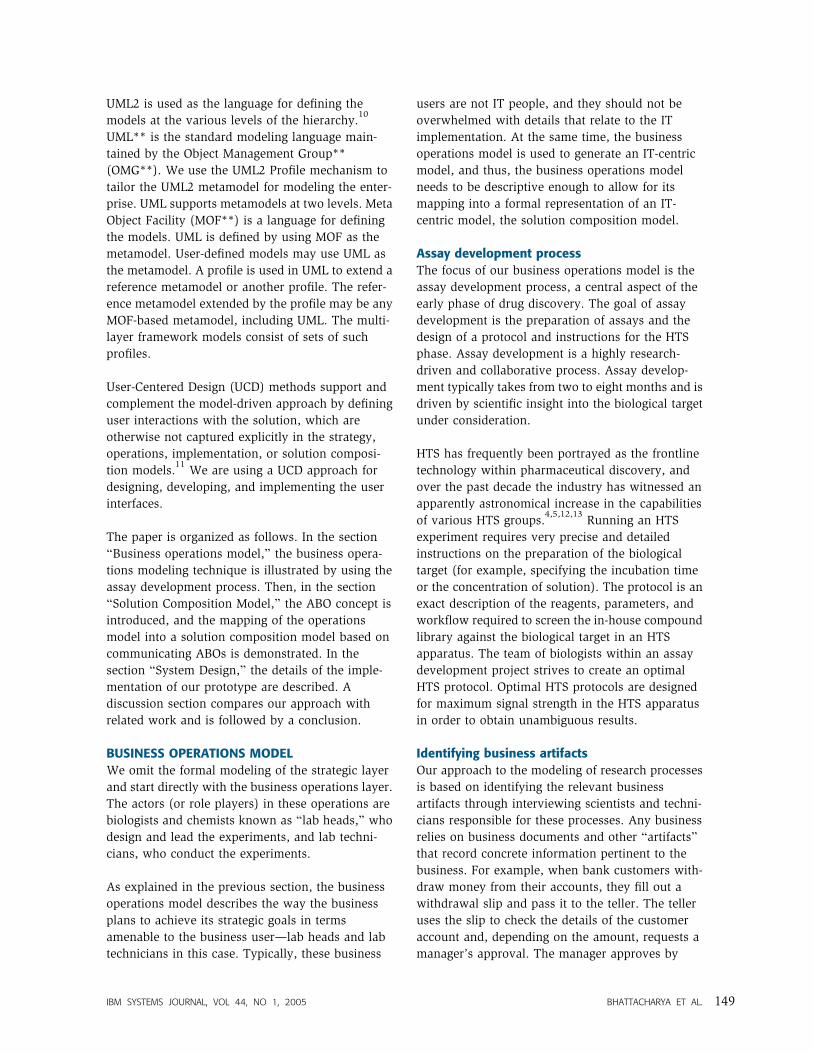
UML2 is used as the language for defining the
models at the various levels of the hierarchy.10
UML** is the standard modeling language main-
tained by the Object Management Group**
(OMG**). We use the UML2 Profile mechanism to
tailor the UML2 metamodel for modeling the enter-
prise. UML supports metamodels at two levels. Meta
Object Facility (MOF**) is a language for defining
the models. UML is defined by using MOF as the
metamodel. User-defined models may use UML as
the metamodel. A profile is used in UML to extend a
reference metamodel or another profile. The refer-
ence metamodel extended by the profile may be any
MOF-based metamodel, including UML. The multi-
layer framework models consist of sets of such
profiles.
User-Centered Design (UCD) methods support and
complement the model-driven approach by defining
user interactions with the solution, which are
otherwise not captured explicitly in the strategy,
operations, implementation, or solution composi-
tion models.11
We are using a UCD approach for
designing, developing, and implementing the user
interfaces.
The paper is organized as follows. In the section
‘‘Business operations model,’’ the business opera-
tions modeling technique is illustrated by using the
assay development process. Then, in the section
‘‘Solution Composition Model,’’ the ABO concept is
introduced, and the mapping of the operations
model into a solution composition model based on
communicating ABOs is demonstrated. In the
section ‘‘System Design,’’ the details of the imple-
mentation of our prototype are described. A
discussion section compares our approach with
related work and is followed by a conclusion.
BUSINESS OPERATIONS MODEL
We omit the formal modeling of the strategic layer
and start directly with the business operations layer.
The actors (or role players) in these operations are
biologists and chemists known as ‘‘lab heads,’’ who
design and lead the experiments, and lab techni-
cians, who conduct the experiments.
As explained in the previous section, the business
operations model describes the way the business
plans to achieve its strategic goals in terms
amenable to the business user—lab heads and lab
technicians in this case. Typically, these business
users are not IT people, and they should not be
overwhelmed with details that relate to the IT
implementation. At the same time, the business
operations model is used to generate an IT-centric
model, and thus, the business operations model
needs to be descriptive enough to allow for its
mapping into a formal representation of an IT-
centric model, the solution composition model.
Assay development process
The focus of our business operations model is the
assay development process, a central aspect of the
early phase of drug discovery. The goal of assay
development is the preparation of assays and the
design of a protocol and instructions for the HTS
phase. Assay development is a highly research-
driven and collaborative process. Assay develop-
ment typically takes from two to eight months and is
driven by scientific insight into the biological target
under consideration.
HTS has frequently been portrayed as the frontline
technology within pharmaceutical discovery, and
over the past decade the industry has witnessed an
apparently astronomical increase in the capabilities
of various HTS groups.4,5,12,13
Running an HTS
experiment requires very precise and detailed
instructions on the preparation of the biological
target (for example, specifying the incubation time
or the concentration of solution). The protocol is an
exact description of the reagents, parameters, and
workflow required to screen the in-house compound
library against the biological target in an HTS
apparatus. The team of biologists within an assay
development project strives to create an optimal
HTS protocol. Optimal HTS protocols are designed
for maximum signal strength in the HTS apparatus
in order to obtain unambiguous results.
Identifying business artifacts
Our approach to the modeling of research processes
is based on identifying the relevant business
artifacts through interviewing scientists and techni-
cians responsible for these processes. Any business
relies on business documents and other ‘‘artifacts’’
that record concrete information pertinent to the
business. For example, when bank customers with-
draw money from their accounts, they fill out a
withdrawal slip and pass it to the teller. The teller
uses the slip to check the details of the customer
account and, depending on the amount, requests a
manager’s approval. The manager approves by
IBM SYSTEMS JOURNAL, VOL 44, NO 1, 2005 BHATTACHARYA ET AL. 149
50%
100%
150%
0.1 1 10 100 1000
Concentration [µmol]
% A
ctiv
ity
Figure 2An experiment record
Enzyme A Test (EnzA) Experiment No.:ExpDate:
Execution:
99072999-07-29Susan Tech
A: 1.2 mg/L Enzyme, 250 mg/L BSA, 0.5 mM ATP in CB: 40 mg/L 23S+16S rRNA in CC: 50 mM Tris/HCl, 5 mM MgCl2, 1 mM DTT, pH 7.5 in 0.1% DEPC in H2O, autoklaviert D: 0.04% Malachite green, 5% (NH4)2MoO4, 3.7% HCl, 10 mM EDTA in H2O, autoklaviert
SamplePlate name
10 mmol
MTP Nr.:Description:
Concentration:
Reaction: Test compound in 2 µL DMSO + 25 µL A + 50 µL B > 60 min @ 30°C > + 100 µL D ( 30 min @ RT) > A @ 630nm
2 µl in 77 µl reaktion volume: 260 µmol 1:2 serial dilution
Compounds / dilutionControls 1:1 1:2 1:4 1:8 1:16 1:32 1:64 1:128 1:256 1:512
1 2 3 4 5 6 7 8 9 10 11 12
1 2 3 4 5 6 7 8 9 10 11 12
AB C D E F G H
0% 100%0% 100%0% 100%0% 100%0% 100%0% 100%0% 100%0% 100%
BAYA001234BAYB004321BAY 123456BAY 123457BAY 123458
Absorption @ 630 nm
ABCDE
0.1340.1300.1310.1320.138
0.5720.5800.5680.5790.556
0.3160.2540.2300.2230.233
0.3020.2880.1760.1770.179
0.2400.3280.1660.1600.162
0.4050.3880.2130.1690.221
0.3120.4300.2530.2610.363
0.3230.4320.3310.4770.531
0.4400.5620.4870.5540.620
0.5120.5730.5780.5910.623
0.5140.6030.6200.5830.611
0.5990.6120.6260.5850.603
FGH
AVG 0.133 0.57 EvaluationSD 0.003 0.01 Concentration [µmol]
% Activity IC50 260 130 65 32.5 16.3 8.1 4.1 2.0 1.0 0.5
BAYA001234 7.1 42% 39% 24% 62% 41% 43% 70% 87% 87% 106%BAYB004321 52.0 28% 35% 45% 58% 68% 68% 98% 100% 107% 109%BAY 123456 7.6 22% 10% 8% 18% 27% 45% 81% 102% 111% 113%BAY 123457 12.8 21% 10% 6% 8% 29% 79% 96% 105% 103% 103%BAY 123458 17.5 23% 11% 7% 20% 53% 91% 111% 112% 109% 107%
0%
50%
100%
150%
0.1 1 10 100 1000
Concentration [µmol]
% A
ctiv
ity
BAYA001234BAYB004321BAY 123456BAY 123457
BAY 123458
BHATTACHARYA ET AL. IBM SYSTEMS JOURNAL, VOL 44, NO 1, 2005150
signing the slip and returning it to the teller, who
hands out the requested money to the customer and
then files the slip for the bank records. The key
business artifact in this example is the withdrawal
slip, which captures all important data pertinent to
the withdrawal process.
A business artifact can be characterized as follows:
1. A business artifact has a unique identity and
therefore cannot be broken up and reassembled.
2. A business artifact is self-describing and contains
all information pertinent to the business context.
3. A business artifact is a record meaningful to the
business user.
We conducted several workshops with the lab
personnel in which we identified the business
artifacts for the assay development process and how
the business artifacts are used by asking the
participants two questions: (1) what do you
produce? and (2) how do you produce it?
As a result we identified three distinct business
artifacts for the assay development process:
� Candidate HTS protocol record—This artifact
represents the assay development team’s main
product. The candidate HTS protocol record
consists of a set of instructions that describes the
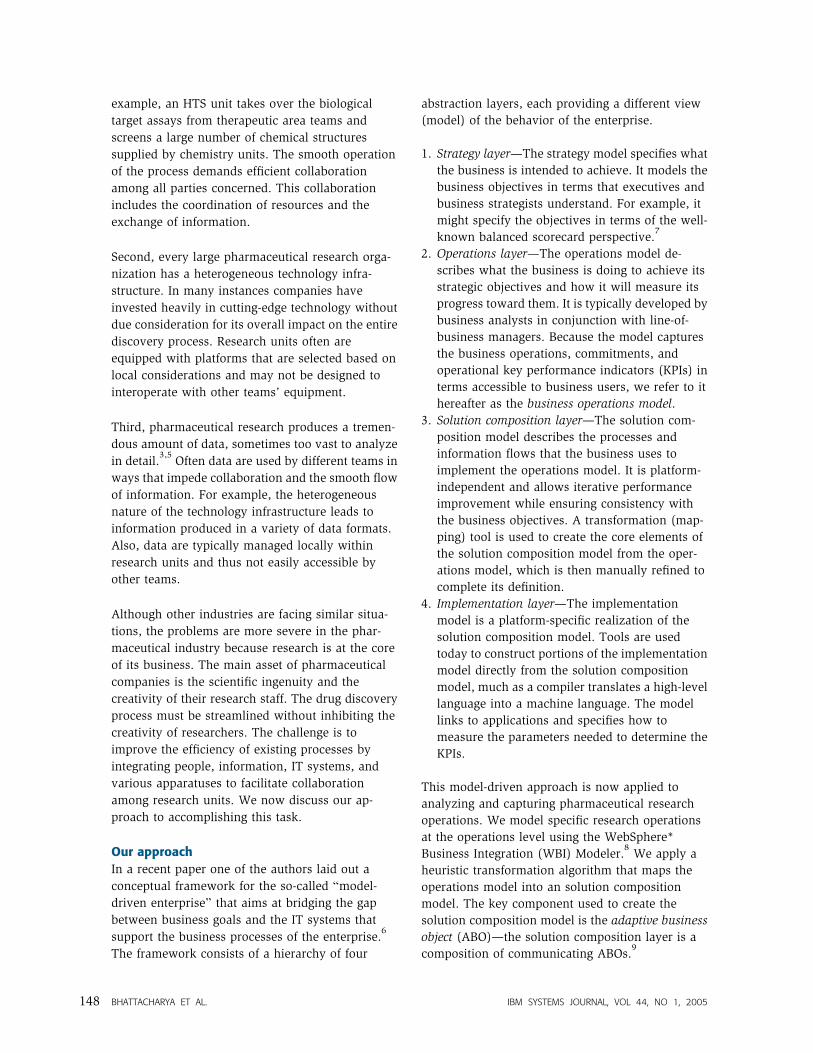
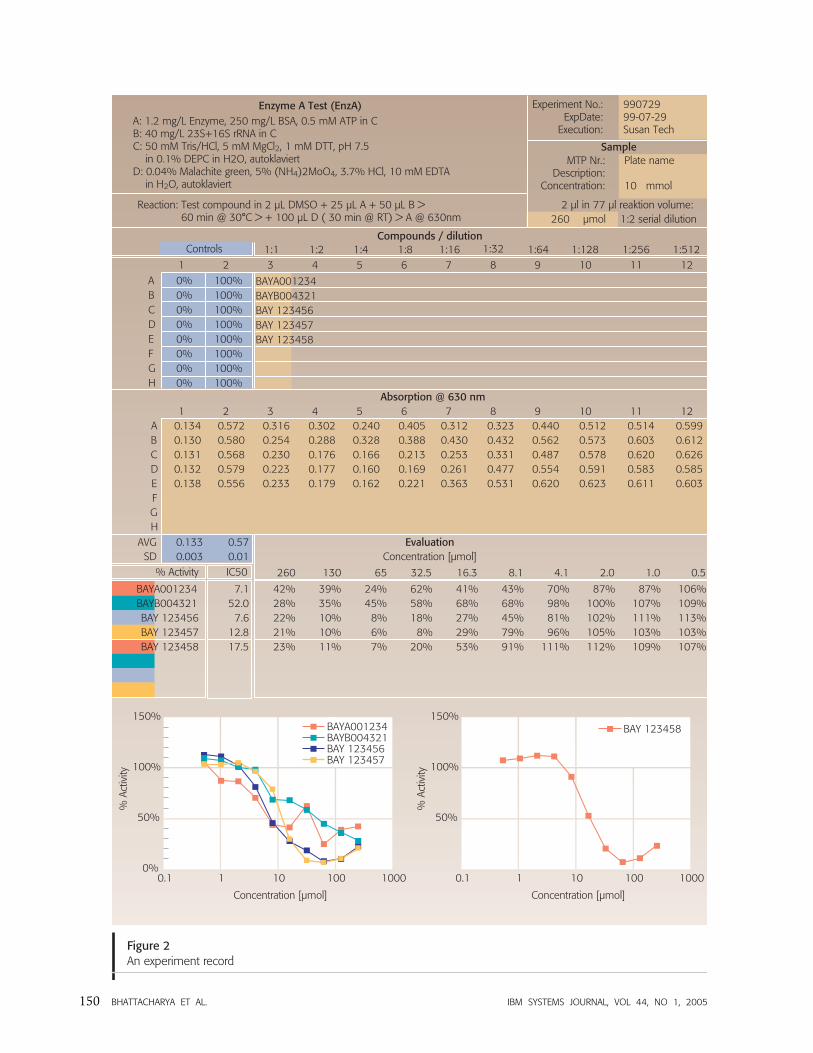
steps involved in running an HTS experiment.� Experiment record—An experiment record consists
of a protocol section for capturing instructions for
experiments, a results section for capturing results
from experiments, and a notes section for captur-
ing notes, comments, and observations during the
experiment (see Figure 2).� HTS protocol record—The HTS protocol is used by
the HTS labs to conduct HTS pre-runs.
The experiment record illustrated in Figure 2 is a
spreadsheet designed by the lab head. It is divided
into horizontal sections and consists of three distinct
parts. The first section at the top is the protocol
section, which contains instructions for conducting
the experiment (steps A, B, C, and D are shown).
The second and third sections make up the result
part; the data contained are entered and updated by
lab technicians who conduct the experiment. The
bottom two sections make up the evaluation part;
the data are typically entered by the lab head and a
lab technician.
Modeling centered on artifacts
The business approach centered on artifacts that is
used in this project is based on the operational
specification as described by Nigam and Caswell (our
terminology is somewhat different).14
In the opera-
tional specification approach, the modeling of busi-
ness processes is done by tracking the life cycle of key
business artifacts. There are two modeling primitives
used: the task and the repository.
In a business environment, business artifacts are
passed from agent to agent (which may be a person,
an application, or some other processing system or
apparatus). An atomic business transaction that
modifies a single artifact or a collection of artifacts is
known as a task.
The repository represents a place to store a specific
artifact type. Repositories are modeled after phys-
ical, electronic, or logical objects, such as a filing
cabinet, a hard drive, or a database.
Whereas the task is an active entity, the repository is
a passive one. After receiving an artifact and
processing it, the task either releases the artifact and
makes it available to another task or stores it in a
repository. The repository does not actively initiate
the release of a stored artifact, but only responds to
requests to retrieve the artifact.
A task owns input and output ports. Each input and
output port is associated with an interface that
supports one specific type of business artifact; that
is, two business artifacts of different types cannot
enter or leave a task through the same port.
Conditions on the ports control whether an artifact
passes through the port.
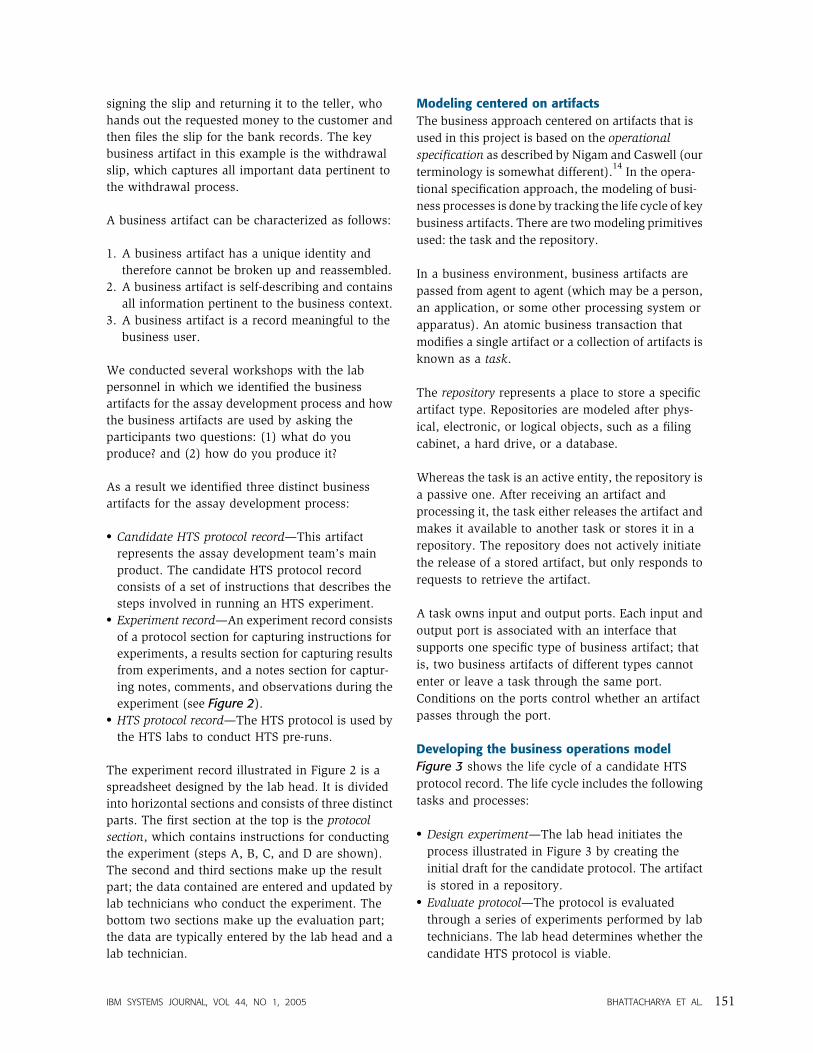
Developing the business operations model
Figure 3 shows the life cycle of a candidate HTS
protocol record. The life cycle includes the following
tasks and processes:
� Design experiment—The lab head initiates the
process illustrated in Figure 3 by creating the
initial draft for the candidate protocol. The artifact
is stored in a repository.� Evaluate protocol—The protocol is evaluated
through a series of experiments performed by lab
technicians. The lab head determines whether the
candidate HTS protocol is viable.
IBM SYSTEMS JOURNAL, VOL 44, NO 1, 2005 BHATTACHARYA ET AL. 151
� Prepare HTS protocol—The lab head summarizes
the experimental results and finalizes the candi-
date HTS protocol.� Request pre-run—The lab head is now ready to
share the candidate protocol with the HTS lab and
makes it available to the HTS lab through the
repository.� HTS lab—The HTS lab retrieves the candidate HTS
protocol for review and may return the protocol
with comments and suggestions if more validation
is required. Note that this step is modeled as a
process instead of a task.� Initiate additional experiments—If the HTS lab
asks for further validation, the lab head updates
the candidate HTS protocol and queues it up for
additional experiments by lab technicians.
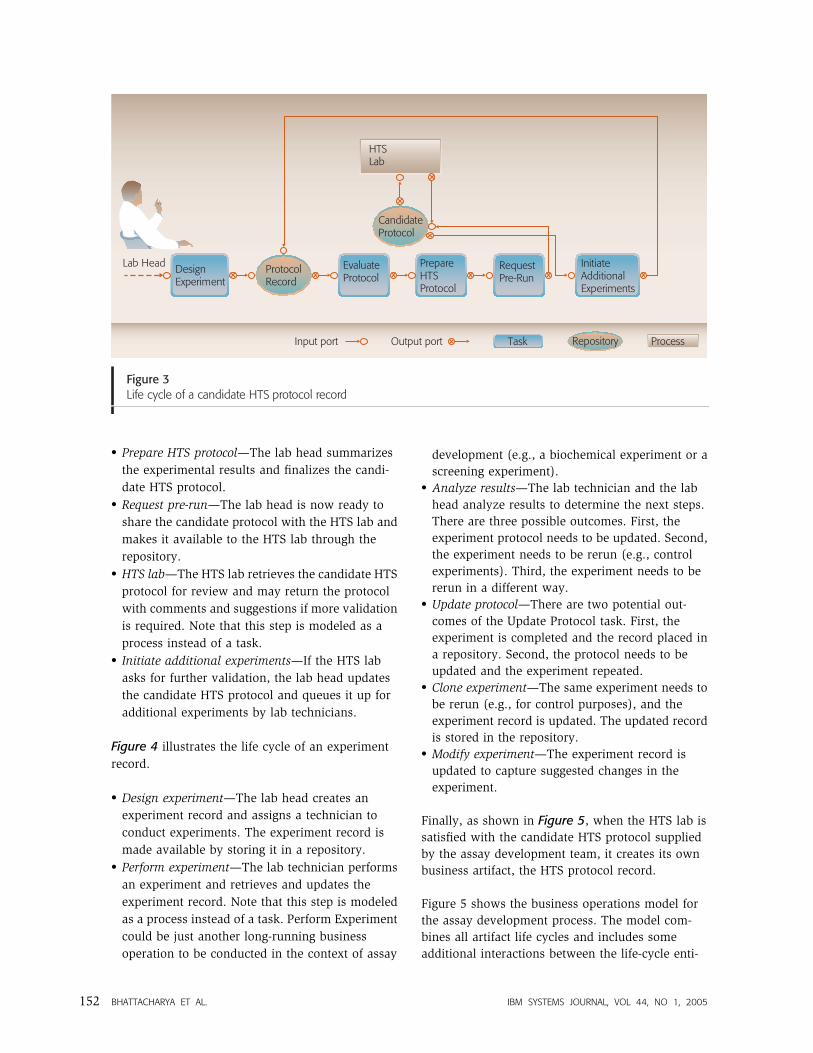
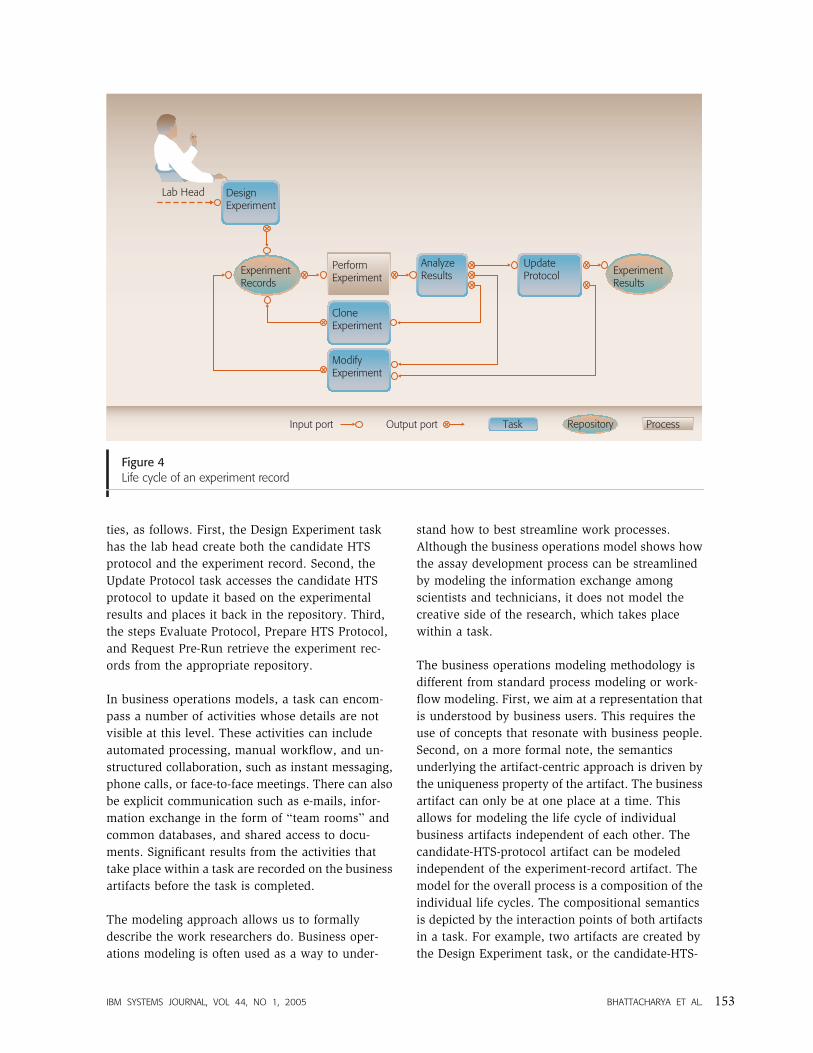
Figure 4 illustrates the life cycle of an experiment
record.
� Design experiment—The lab head creates an
experiment record and assigns a technician to
conduct experiments. The experiment record is
made available by storing it in a repository.� Perform experiment—The lab technician performs
an experiment and retrieves and updates the
experiment record. Note that this step is modeled
as a process instead of a task. Perform Experiment
could be just another long-running business
operation to be conducted in the context of assay
development (e.g., a biochemical experiment or a
screening experiment).� Analyze results—The lab technician and the lab
head analyze results to determine the next steps.
There are three possible outcomes. First, the
experiment protocol needs to be updated. Second,
the experiment needs to be rerun (e.g., control
experiments). Third, the experiment needs to be
rerun in a different way.� Update protocol—There are two potential out-
comes of the Update Protocol task. First, the
experiment is completed and the record placed in
a repository. Second, the protocol needs to be
updated and the experiment repeated.� Clone experiment—The same experiment needs to
be rerun (e.g., for control purposes), and the
experiment record is updated. The updated record
is stored in the repository.� Modify experiment—The experiment record is
updated to capture suggested changes in the
experiment.
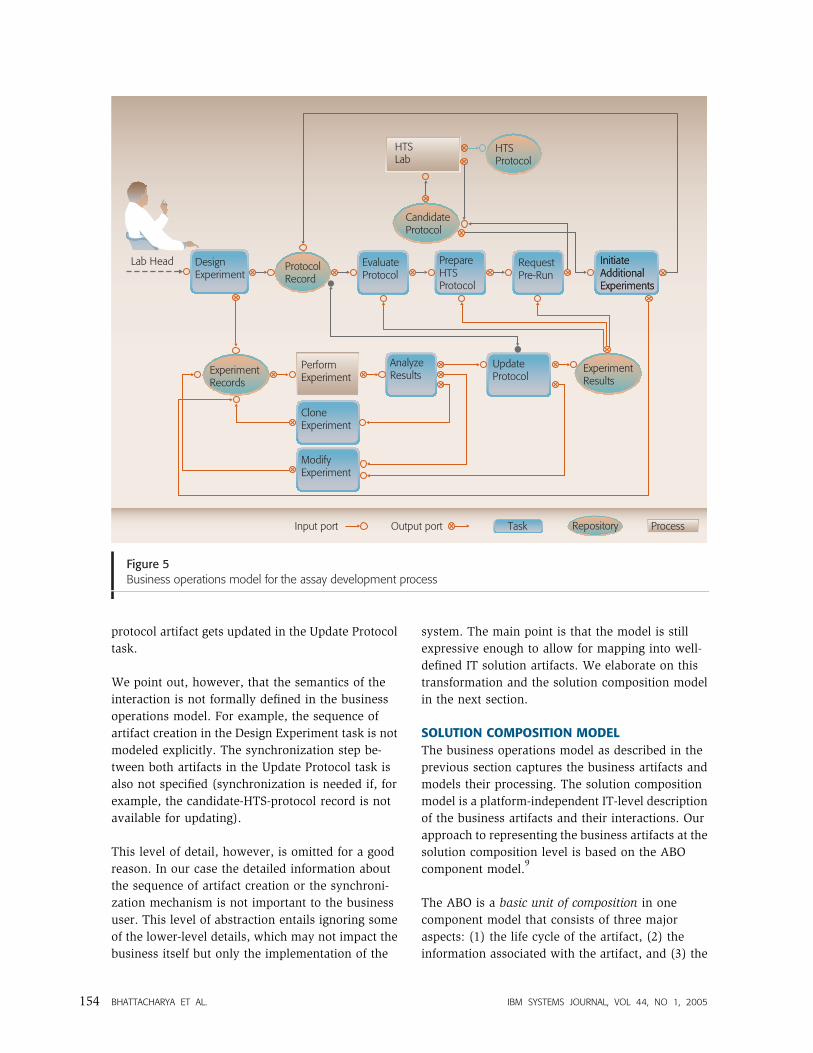
Finally, as shown in Figure 5, when the HTS lab is
satisfied with the candidate HTS protocol supplied
by the assay development team, it creates its own
business artifact, the HTS protocol record.
Figure 5 shows the business operations model for
the assay development process. The model com-
bines all artifact life cycles and includes some
additional interactions between the life-cycle enti-
Input port Task Repository ProcessOutput port
Figure 3Life cycle of a candidate HTS protocol record
DesignExperiment
ProtocolRecord
EvaluateProtocol
PrepareHTSProtocol
RequestPre-Run
HTSLab
Lab Head InitiateAdditionalExperiments
CandidateProtocol
BHATTACHARYA ET AL. IBM SYSTEMS JOURNAL, VOL 44, NO 1, 2005152
ties, as follows. First, the Design Experiment task
has the lab head create both the candidate HTS
protocol and the experiment record. Second, the
Update Protocol task accesses the candidate HTS
protocol to update it based on the experimental
results and places it back in the repository. Third,
the steps Evaluate Protocol, Prepare HTS Protocol,
and Request Pre-Run retrieve the experiment rec-
ords from the appropriate repository.
In business operations models, a task can encom-
pass a number of activities whose details are not
visible at this level. These activities can include
automated processing, manual workflow, and un-
structured collaboration, such as instant messaging,
phone calls, or face-to-face meetings. There can also
be explicit communication such as e-mails, infor-
mation exchange in the form of ‘‘team rooms’’ and
common databases, and shared access to docu-
ments. Significant results from the activities that
take place within a task are recorded on the business
artifacts before the task is completed.
The modeling approach allows us to formally
describe the work researchers do. Business oper-
ations modeling is often used as a way to under-
stand how to best streamline work processes.
Although the business operations model shows how
the assay development process can be streamlined
by modeling the information exchange among
scientists and technicians, it does not model the
creative side of the research, which takes place
within a task.
The business operations modeling methodology is
different from standard process modeling or work-
flow modeling. First, we aim at a representation that
is understood by business users. This requires the
use of concepts that resonate with business people.
Second, on a more formal note, the semantics
underlying the artifact-centric approach is driven by
the uniqueness property of the artifact. The business
artifact can only be at one place at a time. This
allows for modeling the life cycle of individual
business artifacts independent of each other. The
candidate-HTS-protocol artifact can be modeled
independent of the experiment-record artifact. The
model for the overall process is a composition of the
individual life cycles. The compositional semantics
is depicted by the interaction points of both artifacts
in a task. For example, two artifacts are created by
the Design Experiment task, or the candidate-HTS-
Input port Task Repository ProcessOutput port
Figure 4Life cycle of an experiment record
DesignExperiment
PerformExperiment
CloneExperiment
ModifyExperiment
AnalyzeResults
Lab Head
UpdateProtocolExperiment
RecordsExperimentResults
IBM SYSTEMS JOURNAL, VOL 44, NO 1, 2005 BHATTACHARYA ET AL. 153
protocol artifact gets updated in the Update Protocol
task.
We point out, however, that the semantics of the
interaction is not formally defined in the business
operations model. For example, the sequence of
artifact creation in the Design Experiment task is not
modeled explicitly. The synchronization step be-
tween both artifacts in the Update Protocol task is
also not specified (synchronization is needed if, for
example, the candidate-HTS-protocol record is not
available for updating).
This level of detail, however, is omitted for a good
reason. In our case the detailed information about
the sequence of artifact creation or the synchroni-
zation mechanism is not important to the business
user. This level of abstraction entails ignoring some
of the lower-level details, which may not impact the
business itself but only the implementation of the
system. The main point is that the model is still
expressive enough to allow for mapping into well-
defined IT solution artifacts. We elaborate on this
transformation and the solution composition model
in the next section.
SOLUTION COMPOSITION MODEL
The business operations model as described in the
previous section captures the business artifacts and
models their processing. The solution composition
model is a platform-independent IT-level description
of the business artifacts and their interactions. Our
approach to representing the business artifacts at the
solution composition level is based on the ABO
component model.9
The ABO is a basic unit of composition in one
component model that consists of three major
aspects: (1) the life cycle of the artifact, (2) the
information associated with the artifact, and (3) the
Figure 5Business operations model for the assay development process
DesignExperiment
PerformExperiment
CloneExperiment
ModifyExperiment
AnalyzeResults
Lab Head
UpdateProtocol
Input port Task Repository Process
ExperimentRecords
ExperimentResults
ProtocolRecord
EvaluateProtocol
PrepareHTSProtocol
RequestPre-Run
HTSLab
InitiateAdditionalExperiments
InitiateAdditionalExperiments
HTSProtocol
CandidateProtocol
Output port
BHATTACHARYA ET AL. IBM SYSTEMS JOURNAL, VOL 44, NO 1, 2005154
interaction of the artifact with external agents (such
as applications or other artifacts). A solution
composition model is thereby a composite of
interacting ABOs. The exchange of information
between the ABOs can be modeled as a communi-
cation protocol with managed state similar to
Conversation Policies.15
The mapping of the model for the assay develop-
ment process illustrated in Figure 5 to a solution
composition model results in the creation of three
ABOs. The three business artifacts (the candidate
HTS protocol, the HTS protocol, and the experiment
record) are mapped into three corresponding ABOs.
The life-cycle component of an ABO uses finite state
machines (FSM) as a computational model. The life
cycle of the business artifact at the business
operations layer is thereby mapped into a FSM
representation at the solution composition level.
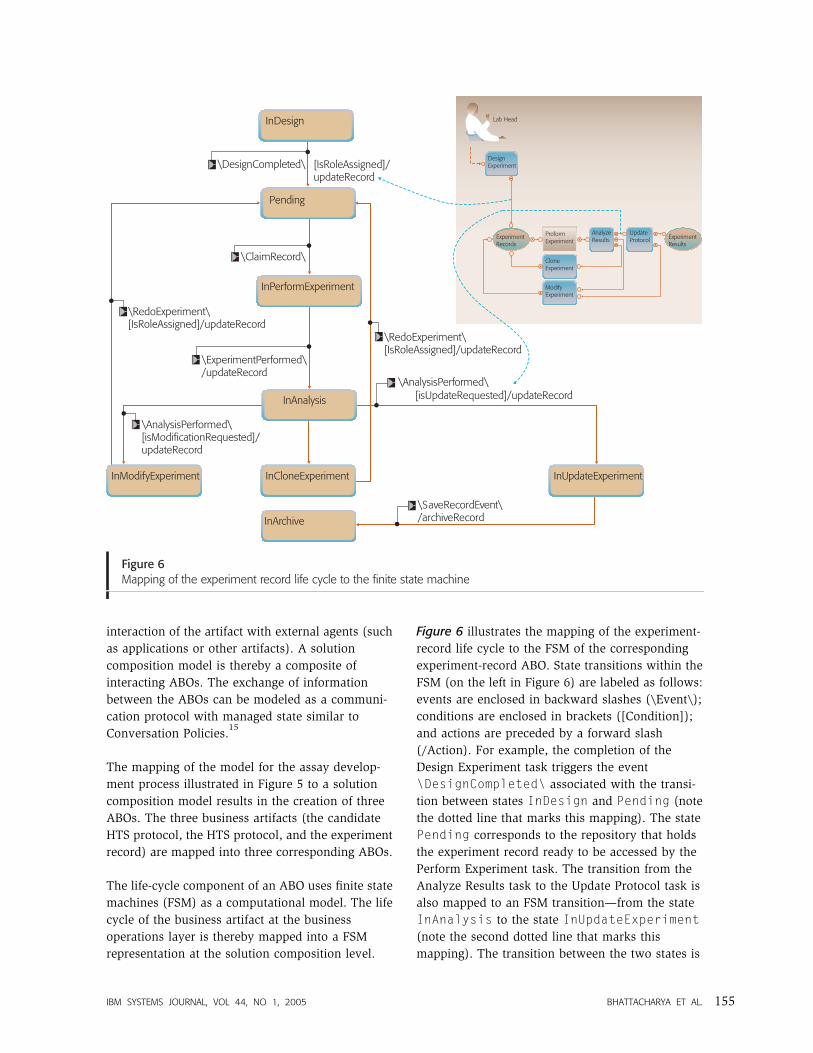
Figure 6 illustrates the mapping of the experiment-
record life cycle to the FSM of the corresponding
experiment-record ABO. State transitions within the
FSM (on the left in Figure 6) are labeled as follows:
events are enclosed in backward slashes (\Event\);
conditions are enclosed in brackets ([Condition]);
and actions are preceded by a forward slash
(/Action). For example, the completion of the
Design Experiment task triggers the event
\DesignCompleted\ associated with the transi-
tion between states InDesign and Pending (note
the dotted line that marks this mapping). The state
Pending corresponds to the repository that holds
the experiment record ready to be accessed by the
Perform Experiment task. The transition from the
Analyze Results task to the Update Protocol task is
also mapped to an FSM transition—from the state
InAnalysis to the state InUpdateExperiment(note the second dotted line that marks this
mapping). The transition between the two states is
Figure 6Mapping of the experiment record life cycle to the finite state machine
InArchive
\SaveRecordEvent\/archiveRecord
\RedoExperiment\[IsRoleAssigned]/updateRecord
Pending
InDesign
InPerformExperiment
InUpdateExperimentInCloneExperiment
InAnalysis
\AnalysisPerformed\[isModificationRequested]/updateRecord
\AnalysisPerformed\
InModifyExperiment
DesignExperiment
ProformExperiment
CloneExperiment
ModifyExperiment
AnalyzeResults
Lab Head
UpdateProtocolExperiment
RecordsExperimentResults
[IsRoleAssigned]/updateRecord
\ClaimRecord\
\ExperimentPerformed\/updateRecord
\DesignCompleted\
[isUpdateRequested]/updateRecord
\RedoExperiment\[IsRoleAssigned]/updateRecord
IBM SYSTEMS JOURNAL, VOL 44, NO 1, 2005 BHATTACHARYA ET AL. 155
labeled with the event \AnalysisPerformed\,the condition [IsUpdateRequested], and the
action /updateRecord.
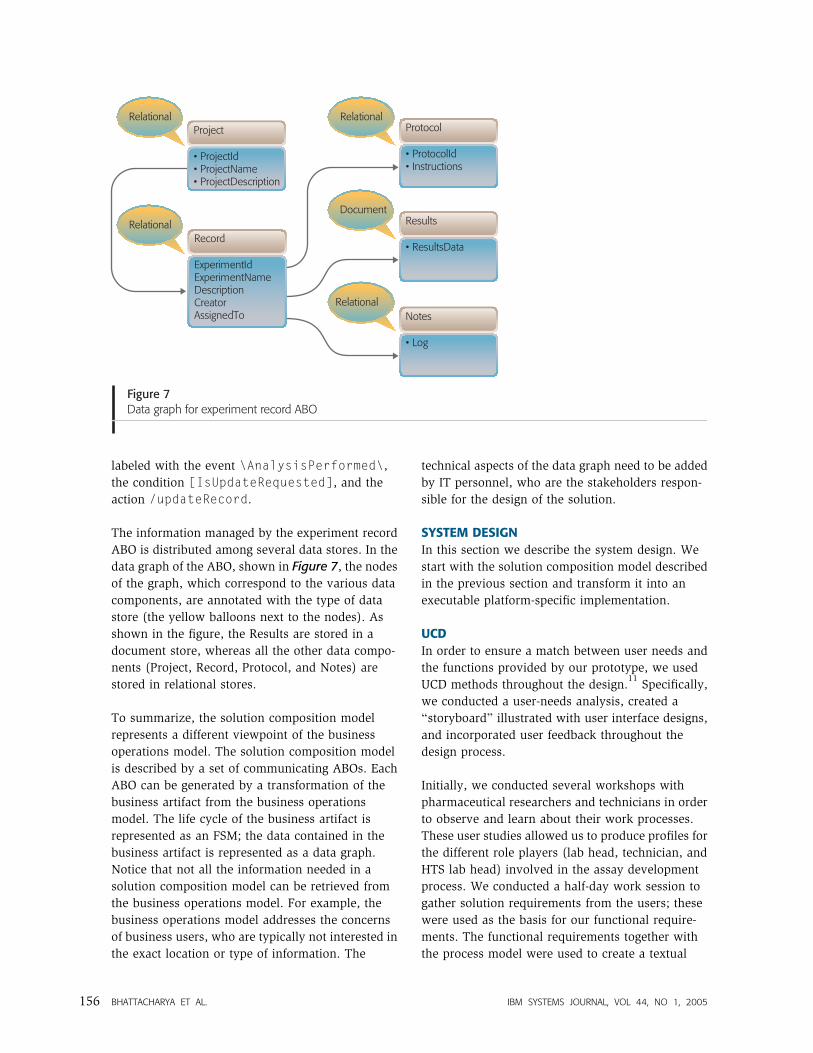
The information managed by the experiment record
ABO is distributed among several data stores. In the
data graph of the ABO, shown in Figure 7, the nodes
of the graph, which correspond to the various data
components, are annotated with the type of data
store (the yellow balloons next to the nodes). As
shown in the figure, the Results are stored in a
document store, whereas all the other data compo-
nents (Project, Record, Protocol, and Notes) are
stored in relational stores.
To summarize, the solution composition model
represents a different viewpoint of the business
operations model. The solution composition model
is described by a set of communicating ABOs. Each
ABO can be generated by a transformation of the
business artifact from the business operations
model. The life cycle of the business artifact is
represented as an FSM; the data contained in the
business artifact is represented as a data graph.
Notice that not all the information needed in a
solution composition model can be retrieved from
the business operations model. For example, the
business operations model addresses the concerns
of business users, who are typically not interested in
the exact location or type of information. The
technical aspects of the data graph need to be added
by IT personnel, who are the stakeholders respon-
sible for the design of the solution.
SYSTEM DESIGN
In this section we describe the system design. We
start with the solution composition model described
in the previous section and transform it into an
executable platform-specific implementation.
UCD
In order to ensure a match between user needs and
the functions provided by our prototype, we used
UCD methods throughout the design.11
Specifically,
we conducted a user-needs analysis, created a
‘‘storyboard’’ illustrated with user interface designs,
and incorporated user feedback throughout the
design process.
Initially, we conducted several workshops with
pharmaceutical researchers and technicians in order
to observe and learn about their work processes.
These user studies allowed us to produce profiles for
the different role players (lab head, technician, and
HTS lab head) involved in the assay development
process. We conducted a half-day work session to
gather solution requirements from the users; these
were used as the basis for our functional require-
ments. The functional requirements together with
the process model were used to create a textual
Figure 7Data graph for experiment record ABO
Relational
• ProtocolId• Instructions
Protocol
Document
• ResultsData
Results
Relational
•
• Log
Notes
Relational
ExperimentIdExperimentNameDescriptionCreatorAssignedTo
Record
Relational
• ProjectId• ProjectName• ProjectDescription
Project
BHATTACHARYA ET AL. IBM SYSTEMS JOURNAL, VOL 44, NO 1, 2005156
narrative that describes the way researchers would
use the anticipated solution. This narrative was
illustrated with rough user interface designs, and
then refined to include high-quality user interface
designs. The end product of the UCD process was a
storyboard, complete with user interface designs
that explained the use of the solution by different
role players. The user-validated interface designs
were then implemented. All these designs were
validated during joint meetings between the IBM
Research and the Bayer HealthCare Research teams.
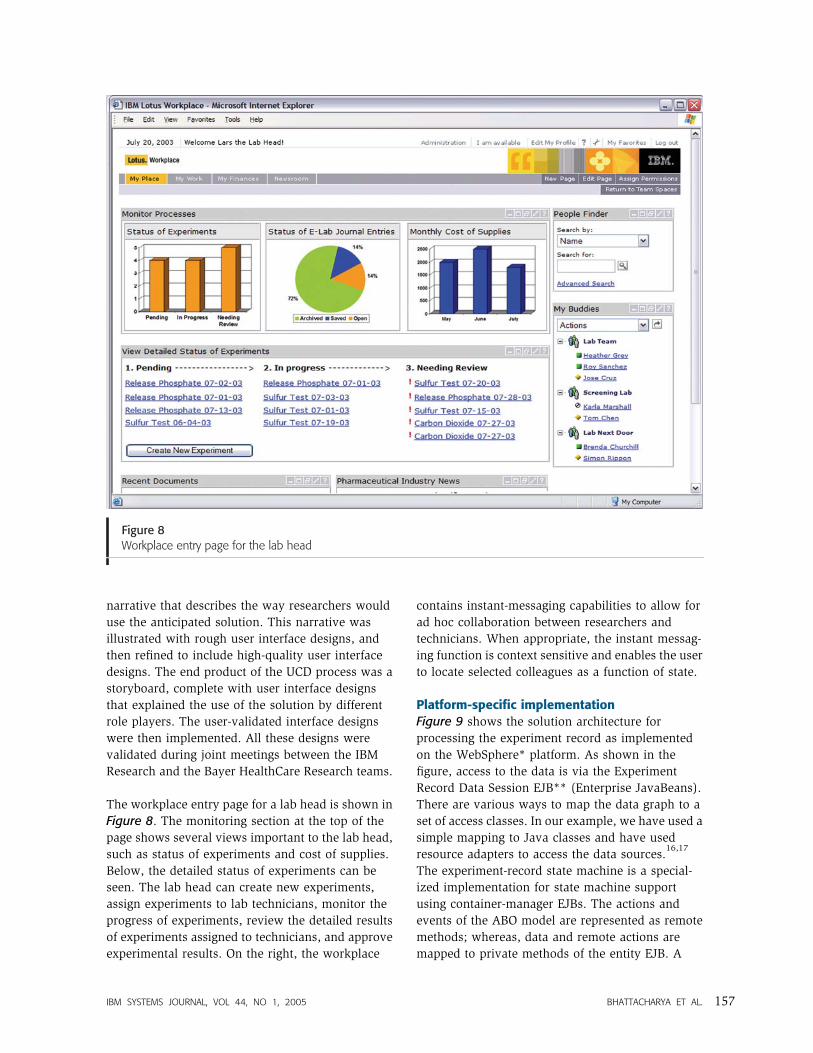
The workplace entry page for a lab head is shown in
Figure 8. The monitoring section at the top of the
page shows several views important to the lab head,
such as status of experiments and cost of supplies.
Below, the detailed status of experiments can be
seen. The lab head can create new experiments,
assign experiments to lab technicians, monitor the
progress of experiments, review the detailed results
of experiments assigned to technicians, and approve
experimental results. On the right, the workplace
contains instant-messaging capabilities to allow for
ad hoc collaboration between researchers and
technicians. When appropriate, the instant messag-
ing function is context sensitive and enables the user
to locate selected colleagues as a function of state.
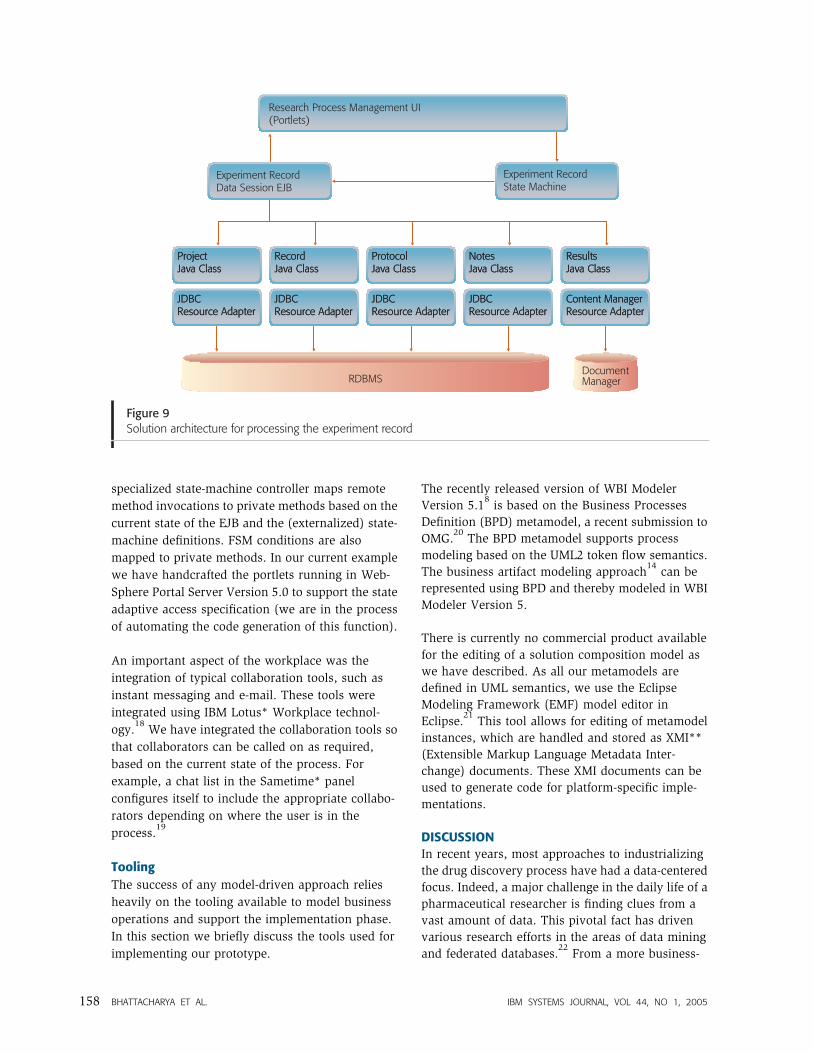
Platform-specific implementationFigure 9 shows the solution architecture for
processing the experiment record as implemented
on the WebSphere* platform. As shown in the
figure, access to the data is via the Experiment
Record Data Session EJB** (Enterprise JavaBeans).
There are various ways to map the data graph to a
set of access classes. In our example, we have used a
simple mapping to Java classes and have used
resource adapters to access the data sources.16,17
The experiment-record state machine is a special-
ized implementation for state machine support
using container-manager EJBs. The actions and
events of the ABO model are represented as remote
methods; whereas, data and remote actions are
mapped to private methods of the entity EJB. A
Figure 8Workplace entry page for the lab head
IBM SYSTEMS JOURNAL, VOL 44, NO 1, 2005 BHATTACHARYA ET AL. 157
specialized state-machine controller maps remote
method invocations to private methods based on the
current state of the EJB and the (externalized) state-
machine definitions. FSM conditions are also
mapped to private methods. In our current example
we have handcrafted the portlets running in Web-
Sphere Portal Server Version 5.0 to support the state
adaptive access specification (we are in the process
of automating the code generation of this function).
An important aspect of the workplace was the
integration of typical collaboration tools, such as
instant messaging and e-mail. These tools were
integrated using IBM Lotus* Workplace technol-
ogy.18
We have integrated the collaboration tools so
that collaborators can be called on as required,
based on the current state of the process. For
example, a chat list in the Sametime* panel
configures itself to include the appropriate collabo-
rators depending on where the user is in the
process.19
Tooling
The success of any model-driven approach relies
heavily on the tooling available to model business
operations and support the implementation phase.
In this section we briefly discuss the tools used for
implementing our prototype.
The recently released version of WBI Modeler
Version 5.18is based on the Business Processes
Definition (BPD) metamodel, a recent submission to
OMG.20
The BPD metamodel supports process
modeling based on the UML2 token flow semantics.
The business artifact modeling approach14
can be
represented using BPD and thereby modeled in WBI
Modeler Version 5.
There is currently no commercial product available
for the editing of a solution composition model as
we have described. As all our metamodels are
defined in UML semantics, we use the Eclipse
Modeling Framework (EMF) model editor in
Eclipse.21
This tool allows for editing of metamodel
instances, which are handled and stored as XMI**
(Extensible Markup Language Metadata Inter-
change) documents. These XMI documents can be
used to generate code for platform-specific imple-
mentations.
DISCUSSIONIn recent years, most approaches to industrializing
the drug discovery process have had a data-centered
focus. Indeed, a major challenge in the daily life of a
pharmaceutical researcher is finding clues from a
vast amount of data. This pivotal fact has driven
various research efforts in the areas of data mining
and federated databases.22
From a more business-
Figure 9Solution architecture for processing the experiment record
RDBMSDocumentManager
Content ManagerResource AdapterContent ManagerResource Adapter
JDBC Resource AdapterJDBC Resource Adapter
JDBC Resource AdapterJDBC Resource Adapter
JDBC Resource AdapterJDBC Resource Adapter
JDBC Resource AdapterJDBC Resource Adapter
ResultsJava ClassResultsJava Class
Protocol Java ClassProtocol Java Class
Notes Java ClassNotes Java Class
Record Java ClassRecord Java Class
Project Java ClassProject Java Class
Experiment Record State Machine
Research Process Management UI(Portlets)
Experiment Record Data Session EJB
BHATTACHARYA ET AL. IBM SYSTEMS JOURNAL, VOL 44, NO 1, 2005158
related perspective, Davis and Peakman have
introduced the concept of data-driven drug discovery
(4D).23
In their work they illustrate the problems
and the associated costs related to handling the
many different types of data produced in pharma-
ceutical research. Their approach starts out by using
a methodology similar to ours. The authors propose
an analysis in several business data-related dimen-
sions, such as data lag, data quality, data use, data
leverage, data productivity, and data costs. Based on
this conceptual framework, the authors created
maturity profiles that estimate the individual
strengths and weaknesses of companies. This type
of approach is intriguing as it tries to go directly to
the source of the problem. The authors recognize
that most pharmaceutical companies typically suffer
from problems in four areas: (1) loading of
important data onto corporate systems, (2) sharing
of data across organizations, (3) accessing, visual-
izing, and manipulating of data by scientists, and (4)
gathering and presentation of data for decision
making. A drawback of their approach, when
compared with ours, is the lack of formal modeling
techniques. Although their methodology leads to a
maturity model that estimates the extent to which
the company uses state-of-the-art techniques for
data handling, their approach does not offer
methods to solve any of the four problem areas.
By comparison, we analyze the current state of the
business by modeling business operations and use
this model to evaluate the efficiency of the business
process through simulations or other techniques.
This approach not only leads to similar results in
terms of maturity assessment, but it enables the
design of solutions to support the processes under
consideration. This approach, centered in business
operations, acts as an orchestrating principle and
helps define goals for associated research activities
and, in the process, develop methods for handling
the data created. The formal models underlying the
layers of the hierarchy and the mappings among
them enable us to analyze and refine business
requirements and eventually map them into IT
solutions, thereby bridging the business-IT gap.
Another very interesting approach described by
Peakman et al.5is to examine the drug discovery
process as a traditional supply-chain model with
volatile lead times. For example, maximizing the use
of HTS apparatuses requires increased transparency
of the various assay development efforts (i.e., the
HTS labs can better plan their resource if they can
anticipate the number of incoming requests for
screening). When such transparency exists, the HTS
groups may serve the next HTS request more
efficiently, thereby reducing the cycle times of the
assay development and HTS processes. In the same
way, chemists delivering the compound libraries for
the HTS process would benefit from more visibility
downstream. Because of volatile lead times, the time
to develop an assay and deliver it to the HTS team
can significantly vary from project to project. Even
for one development project, the time to delivery
can vary in the course of the assay development
process because a biological system may turn out to
be much harder to prepare than initially assumed.
Peakman et al. suggest that despite the problem of
volatile lead times, collaborative planning concepts
from automotive industries may apply to drug
discovery as well.
In our approach, monitoring of KPIs, such as cycle
times for processes, resource control, and other
aspects, across various research processes would
allow for gathering the information needed to
perform collaborative planning calculations. Mon-
itoring of business operations also allows visibility
up and down the discovery supply chain.
We observed a trend towards ‘‘e-R&D’’, that is, the
use of information technology to facilitate the
overall industrialization of drug discovery R & D.3
This concept has gained some traction in the areas
of e-documentation, clinical trial simulation, and
process optimization in clinical trials.
CONCLUSION
The business artifact-centric view we take here
brings out a more subtle aspect of the drug discovery
process. Although the analysis of data is clearly
crucial for understanding the processes analyzed, a
purely data-centric approach ignores the fact that
the expertise for the interpretation of data belongs to
researchers distributed across various organizations
doing this work. Facilitating collaboration among
researchers amounts to creating a distributed
knowledge network. Experience shows that a com-
plex problem is often solved by examining it from
different perspectives. Sharing information across
vertical ‘‘silos’’ of knowledge has a higher proba-
bility of solving such complex issues. Although this
is, of course, only a hypothesis, the notion of
horizontal integration across functional organiza-
IBM SYSTEMS JOURNAL, VOL 44, NO 1, 2005 BHATTACHARYA ET AL. 159
tions is a popular theme in business restructuring
and, in particular, in IBM’s on demand strategic
vision for the IT industry.
How applicable is our approach in the current
pharmaceutical environment? During this research
project we found out that modeling concepts are
well-aligned to current thinking in pharmaceutical
research. An implementation of a production system
based on our concepts throughout the entire enter-
prise is a future challenge. One difficulty is the
integration of a wide variety of apparatuses, some of
which are not equipped with proper interfaces.
Intelligent data analysis, which is not addressed by
our methodology, is undoubtedly a very important
aspect in pharmaceutical research.
The main goal of our work is to enable a method-
ology that will allow pharmaceutical companies to
tackle three major challenges. First, in order to stay
competitive in a constantly changing market envi-
ronment, enterprises require IT solutions that adapt
to changing market conditions. A business process
management solution should provision capabilities
to allow for efficient change management. Our
approach accommodates change management by
taking a model-driven approach to be applied
hierarchically from the strategic layer down to the
implementation layer. Changes in business strategy
and operations are reflected in changes in the
models and can be easily mapped to the IT
environment without the need for extensive and
costly re-engineering initiatives.
Second, the business value of IT solutions grows
substantially when these solutions seamlessly inte-
grate people, processes, systems, and information.
This proposition is at the core of our approach as we
introduce a novel approach to compose a model-
based IT solution, which can be seen as an IT-level
blueprint of the business itself.
Third, the ubiquitous nature of IT, its constantly
growing capabilities, and its growing cost require a
good understanding of how to make best use of both
innovations and legacy systems. It is current
practice to decide these questions at an IT level. As
can be seen in large IT consolidation efforts in the
pharmaceutical industry and many others, the
question of how to leverage IT will be more and
more a business decision. The business strategy and
operations will set the context in which IT will be
leveraged. Our methodology is an important step
towards transforming the business intent and
requirements directly into viable IT solutions.
In summary, in this joint project we have taken a
model-driven approach to analyzing and capturing
pharmaceutical research processes. By applying a
heuristic transformation, we have created a solution
composition model, which is an abstraction of the
actual IT solution. The key technique for developing
the solution composition model is the ABO compo-
nent model. A prototype has been built based on
WebSphere technology. We validated each step in
the design process in the lab with the participation
of the business users. Although we tested and
demonstrated the solution in various scenarios, we
have not yet deployed our solution into the Bayer
production environment.
ACKNOWLEDGMENTSSeveral people have contributed to discussions and
support over the course of this project, including Anil
Nigam, Nathan Caswell, Nitin Nayak, and David
Cohn from IBM Research, Anne Aldous and Mark
Pease from IBM Life Sciences, Tim Peakman from
Biobank UK, and Joerg Weiser from Schroedinger
Corporation. Furthermore, we were fortunate to have
development help from our colleagues at the IBM
China Research Lab.
*Trademark or registered trademark of International Busi-ness Machines Corporation.
**Trademark or registered trademark of Object Manage-ment Group or Sun Microsystems, Inc.
CITED REFERENCES AND NOTES1. J. A. DiMasi, R. W. Hansen, H. G. Grabowski, and L.
Lasagna, ‘‘Cost of Innovation in the PharmaceuticalIndustry,’’ Journal of Health Economics 10, No. 2, 107–142 (1991).
2. S. Arlington, Pharma 2005: An industrial revolution inR & D, http://www-1.ibm.com/services/us/imc/pdf/gw510-9220-pharma-2005-industrial-revolution.pdf.
3. S. J. Arlington, S. Barnett, S. Hughes, and J. Palo, ‘‘Pharma2010—The Threshold of Innovation,’’ The Future of thePharmaceutical Industry, IBM Corporation (2004), http://www-1.ibm.com/services/us/index.wss/xs/imc/a1001099?cntxtld=a1000060.
4. J. R. Archer, ‘‘Faculty or Factory? Why IndustrializedDrug Discovery Is Inevitable,’’ Journal of BiomolecularScreening 4, No. 5, 235–237 (1999).
5. T. Peakman, S. Franks, C. White, and M. Beggs,‘‘Delivering the Power of Discovery in Large Pharma-ceutical Organizations,’’ Drug Discovery Today 8, No. 5,203–211 (March 2003).
BHATTACHARYA ET AL. IBM SYSTEMS JOURNAL, VOL 44, NO 1, 2005160
6. S. Kumaran, ‘‘Model-Driven Enterprise,’’ Proceedings ofthe Global Enterprise Application Integration (EAI)Summit 2004, Banf, Canada (2004), pp. 166–180.
7. R. S. Kaplan and D. P. Norton, ‘‘The Balanced Score-card—Measures that Drive Performance,’’ Harvard Busi-ness Review, 71–79 (January-February 1992).
8. WebSphere Business Integration Modeler, IBM Corpora-tion, http://www.ibm.com/software/integration/wbimodeler/.
9. S. Kumaran and P. Nandi, ‘‘Adaptive Business Objects: ANew Component Model for Business Applications,’’ inpreparation.
10. Unified Modeling Language, Object Management Group,http://www.uml.org/.
11. K. Vredenburg, S. Isensee, and C. Righi, User-CenteredDesign: An Integrated Approach, Prentice-Hall, UpperSaddle River, NJ (2002).
12. M. Beggs, ‘‘HTS—where next?’’ Drug Discovery World 2,25–30 (2000).
13. M. Beggs and A. C. Long, ‘‘High Throughput Genomicsand Drug Discovery—Parallel Universes or a Continu-um?’’ Drug Discovery World 3, 75–80 (2002).
14. A. Nigam and N. S. Caswell, ‘‘Business Artifacts: AnApproach to Operational Specification,’’ IBM SystemsJournal 42, No. 3, p. 428–445 (2003).
15. J. E. Hanson, P. Nandi, and S. Kumaran, ‘‘ConversationSupport for Business Process Integration,’’ IEEE Interna-tional Enterprise Distributed Object Conference (EDOC),65–74 (2002).
16. The J2EE Connector Architecture’s Resource Adapter, SunMicrosystems, Inc., http://java.sun.com/developer/technicalArticles/J2EE/connectorclient/resourceadapter.html.
17. In the future we will make use of a more flexible andpowerful approach using Service Data Objects (SDO) (seeService Data Objects, IBM Corporation and BEA Systems,Inc. (2003), Java Community Process, http://www.jcp.org/en/jsr/detail?id=235).
18. Lotus Workplace Products, IBM Corporation, http://www.lotus.com/products/product5.nsf/wdocs/workplacehome.
19. A demo and screenshots of the solution are availableupon request from the first author.
20. Business Processes Definition Metamodel: Concepts andOverview, Object Management Group,http://www.omg.org/docs/bei/04-05-03.pdf.
21. Eclipse Modeling Framework, Eclipse Foundation, http://www.eclipse.org/emf/.
22. L. M. Haas, E. T. Lin, and M. A. Roth, ‘‘Data IntegrationThrough Database Federation,’’ IBM Systems Journal 41,No. 4, 578–596 (2002).
23. N. Davis and T. Peakman, ‘‘Making the Most of YourDiscovery Data,’’ Drug Discovery World, 17–23 (April2004).
Accepted for publication August 30, 2004.
Kamal BhattacharyaIBM Thomas J. Watson Research Center, 1101 KitchawanRoad, Yorktown Heights, NY 10598 ([email protected]).Dr. Bhattacharya, a member of the Business InformaticsDepartment, focuses on the application of model-driven
architecture concepts to real-world business scenarios,adaptive enterprises, and business performance management.Prior to joining IBM Research in 2001, Dr. Bhattacharyaserved as an e-business IT Architect for IBM Global Services inGermany and worked on several large scale e-businessprojects in the automotive and travel industry. He received adoctoral degree in theoretical and computational physics fromGeorg-August University, Goettingen, Germany, in 1999.
Robert GuttmanIBM Thomas J. Watson Research Center, 1101 KitchawanRoad, Yorktown Heights, NY 10598 ([email protected]).Mr. Guttman leads a company-wide initiative that advocatesthe use of a model-driven approach to map the strategic goalsof businesses into IT implementations. He received a B.S.E.degree in computer engineering from the University ofMichigan in 1992. Upon receiving his M.S. degree in 1998from the Massachusetts Institute of Technology (MIT), hefounded Frictionless Commerce, a leading enterprise-sourcingsoftware vendor, based on software agent technologies that heinvented at MIT’s Media Laboratory. These technologies areautomating sourcing business processes, providing visibilityinto sourcing activities and information through role-baseddashboards, and helping procurement professionals makeoptimal award allocation decisions resulting in direct, ongoingbottom-line savings. These innovations earned him a 2002MIT Technology Review Top 100 Young Innovators Award(TR100).
Kelly LymanIBM Thomas J. Watson Research Center, 1101 KitchawanRoad, Yorktown Heights, NY 10598 ([email protected]).Kelly Lyman is a User-Centered Design (UCD) lead in theBusiness Informatics Department. Her expertise is inresearching target market groups and then using her findingsto design innovative e-business solutions. Prior to joiningIBM, she managed a user experience group at PeopleSoft. Shecompleted her education at Carnegie Mellon—she holds aMaster’s degree in human-computer interaction, a Bachelor’sdegree in human-computer interaction, and a Bachelor’sdegree in information design.
Fenno F. Heath IIIIBM Thomas J. Watson Research Center, 1101 KitchawanRoad, Yorktown Heights, NY 10598 ([email protected]).Terry Heath, a Senior Software Engineer, has been a researchengineer for over 14 years and has participated in manyprototyping and customer engagement efforts in industriessuch as manufacturing, automotive, and electronics. He is amember of the Business Informatics Department where hefocuses on formal modeling of collaboration and userinteraction processes in business process managementsystems.
Santhosh KumaranIBM Thomas J. Watson Research Center, 1101 KitchawanRoad, Yorktown Heights, NY 10598 ([email protected]).Santhosh Kumaran leads a team of researchers in the area ofmodel-driven business integration. His research interest is inusing formal models to explicitly define the structure andbehavior of an enterprise and employing these models tointegrate, monitor, analyze, and improve its performance.
Prabir NandiIBM Thomas J. Watson Research Center, 1101 KitchawanRoad, Yorktown Heights, NY 10598 ([email protected]). Mr.Nandi, a member of the Business Informatics Department atthe Thomas J. Watson Research Center, received a B.E. degreein electronics and communications engineering from BirtaInstitute of Technology, Ranchi, India, in 1990, and an M.S.degree in computer science from the College of William andMary in 1997. He subsequently joined the Thomas J. Watson
IBM SYSTEMS JOURNAL, VOL 44, NO 1, 2005 BHATTACHARYA ET AL. 161
Internet publication January 31, 2005.
Research Center, where he has worked on business processintegration and management. He co-invented the AdaptiveDocument (ADoc) technology and pioneered the businessartifact-centric way of modeling, composing, andimplementing business process integration solutions. He alsodeveloped the Adaptive Business Object (ABO) concept andthe related programming model. Mr. Nandi has authored anumber of conference publications, journal articles, andpatents.
Frederick WuIBM Thomas J. Watson Research Center, 1101 KitchawanRoad, Yorktown Heights, NY 10598 ([email protected]). Dr.Wu, a research staff member at the IBM Thomas J. WatsonResearch Center, has worked in the area of electroniccommerce and business integration for the past nine years. Heholds S.B., S.M., and Ph.D. degrees from the MassachusettsInstitute of Technology.
Prasanna AthmaIBM Healthcare and Life Sciences, Route 100, Somers, NewYork 10589 ([email protected]). Dr. Athma is aBioinformatics Domain Expert in the IBM Life SciencesSolutions Development. She joined the Computational BiologyCenter at the Watson Research Center in 2000 as a researchassociate after working as an Associate Research Professor inNew York Medical College, Hawthorne, New York. Her initialwork at IBM was focused on structure prediction of proteins.She participated in Critical Assessment of Techniques forProtein Prediction (CASP) experiments, an internationalcompetition held every two years, in which protein sequencesare released as targets, and the participating teams predict thestructures in a blind manner before the actual structures areavailable. Her recent work at IBM Healthcare and LifeSciences has involved providing domain expertise in a broadrange of areas such as genomics, transcriptomics andproteomics. She provides scientific domain knowledge in thedevelopment of middleware components for health care andlife science solutions and customer engagements. Sheparticipates in MAGE and Proteomics standards by drivingstandards into IBM solutions. She has authored many journaland conference papers and holds two patents.
Christoph FreibergBayer Healthcare, Pharmaceutical Research, D-42096Wuppertal/Germany ([email protected]). Dr. Freiberg studied biology at the University ofGottingen and earned his Ph.D. from the University of Jena.He held research positions at the University of Marburg andthe Institute for Molecular Biotechnology in Jena. For the pastseven years, he has served as laboratory head at Bayer’sAntiinfectives Research unit in Wuppertal. He is responsiblefor bioinformatics and genomics applications and forscreening assays development in the field of antibacterialresearch. He also coordinates the biology activities ofadvanced drug discovery and leads structure-optimizationprojects.
Lars JohannsenBayer Healthcare, Pharmaceutical Research, D-42096Wuppertal/Germany ([email protected]). Dr. Johannsen earned his Ph.D. in biochemistry fromthe Free University of Berlin and held research positions at theBundesgesundheitsamt in Berlin and the University ofTennessee, Memphis. He has 10 years of research experienceat Bayer’s Anti-infectives unit. For the past three years he hasbeen with the Information Services Department, the ScientificInformation and Documentation Group, where he isresponsible for the processing of document-based internalinformation.
Andreas StaudtBayer Healthcare, Pharmaceutical Research, D-42096Wuppertal/Germany ([email protected]).Dr. Staudt has more than 12 years of experience ininformation management in the pharmaceutical industry. Hehas held a number of international management positions,with increasing responsibilities, in the global BayerHealthCare organization. His current position is Director,Proprietary Information and Research Support at BayerHealthCare’s Pharmaceutical Division. His responsibilitiesinclude the coordination of information technology for GlobalPharmaceutical Research and the coordination of documentmanagement activities across Bayer’s worldwidepharmaceutical organization. He earned his doctoral degree inphysics from the University of Heidelberg, Germany. He was apostdoctoral fellow at the Max-Planck Institute for NuclearPhysics. He is co-author of a textbook on modern physics forgraduate students and professionals. &
BHATTACHARYA ET AL. IBM SYSTEMS JOURNAL, VOL 44, NO 1, 2005162
Top Related
Copyright © 2022 FDOKUMEN

