


Bahasa
Halaman
Hukum

�����������������
Citation: Iancu, T.; Petre, I.L.; Tudor,
V.C.; Micu, M.M.; Ursu, A.;
Teodorescu, F.-R.; Dumitru, E.A. A
Difficult Pattern to Change in
Romania, the Perspective of
Socio-Economic Development.
Sustainability 2022, 14, 2350. https://
doi.org/10.3390/su14042350
Academic Editors: Vasilii Erokhin,
Tianming Gao and Andrei Jean Vasile
Received: 25 January 2022
Accepted: 15 February 2022
Published: 18 February 2022
Publisher’s Note: MDPI stays neutral
with regard to jurisdictional claims in
published maps and institutional affil-
iations.
Copyright: © 2022 by the authors.
Licensee MDPI, Basel, Switzerland.
This article is an open access article
distributed under the terms and
conditions of the Creative Commons
Attribution (CC BY) license (https://
creativecommons.org/licenses/by/
4.0/).
sustainability
Article
A Difficult Pattern to Change in Romania, the Perspective ofSocio-Economic DevelopmentTiberiu Iancu 1, Ionut, Laurent,iu Petre 2 , Valentina Constanta Tudor 3,*, Marius Mihai Micu 3, Ana Ursu 4 ,Florina-Ruxandra Teodorescu 3 and Eduard Alexandru Dumitru 4,*
1 Faculty of Management and Rural Tourism, Banat’s University of Agricultural Sciences and VeterinaryMedicine “King Michael I of Romania” Timisoara, Calea Aradului, No. 119, 300645 Timisoara, Romania;[email protected]
2 Department of Agrifood and Environmental Economics, The Bucharest University of Economic Studies,010374 Bucharest, Romania; [email protected]
3 Faculty of Management and Rural Development, University of Agronomic Sciences and Veterinary Medicine,010961 Bucharest, Romania; [email protected] (M.M.M.); [email protected] (F.-R.T.)
4 The Agricultural Economics Office, Research Institute for Agriculture Economy and Rural Development,010961 Bucharest, Romania; [email protected]
* Correspondence: [email protected] (V.C.T.); [email protected] (E.A.D.)
Abstract: The rural area is a basic component from a socio-economic point of view, being closelylinked to the activities that take place in these areas. Normally, Romanian rural localities should showsignificant differences from one development region to another, being influenced by a number offactors (geographical positioning, the influence of agriculture in the economy, etc.). In this sense, datawere collected from the town halls of the localities from Calarasi and Timis counties. The analyzeddata were processed by the linear regression method, and the estimation of the evolution of thepopulation was determined using the Vensim simulation program. The paper identifies a patternin rural localities in Romania that hinders their development, reflected by various socio-economicindicators available in the analyzed localities. The main factor that can change this pattern in rurallocalities is the influence of local and national decision-makers, who can encourage investment inthese areas either through the development of local and national infrastructure or through fiscalmeasures that encourage the development of quality non-agricultural activities that can generatefinancial resources and jobs at the local level. Moreover, it is not only the low number of non-agricultural activities that is causing the poor development of rural areas, but rather the low numberof economic operators in general and the quality of these types of activities, which in most cases donot have the capacity to create new jobs.
Keywords: rural development; sustainable; rural area; localities; evolution; local authorities; Romania
1. Introduction
The concept of “rural” includes several dimensions that refer on the one hand to thepredominant activity in rural areas—agriculture—and life in rural areas, including peopleengaged in agriculture or other related activities [1–4].
According to Bold and Buciuman (2003), “rural” can be defined as the totality ofactivities that take place in a space other than an urban one, with a relatively small numberof inhabitants, who have multiple relationships with each other and where agriculture andforestry have an important role [5,6].
According to some authors who have researched this complex concept, over time theidea has emerged that “rural space” includes everything that is not urban. Among themultiple definitions assigned to the term of rural space, the most representative are [7–9]:
• The rural area can be characterized by a relatively small number of inhabitants, witha small number of buildings, and where there are mainly natural landscapes, where
Sustainability 2022, 14, 2350. https://doi.org/10.3390/su14042350 https://www.mdpi.com/journal/sustainability
Sustainability 2022, 14, 2350 2 of 29
nature blends perfectly with the activities that man undertakes. In the rural space,the activities mainly carried out by its inhabitants are agriculture, animal husbandry,forestry, or beekeeping.
• The rural area can also be characterized as having a multitude of non-urban areas,which include fields and people carrying out activities associated with field work;
• The rural area is the ideal environment in which agricultural activity can be developedand where, compared to urban areas, the concentration of people is low.
Taking into account the “artisanal” dimension of the rural space, we can say that therural is not only related to agriculture, but also includes all the activities carried out byfolk craftsmen or activities with a tourist profile. Whether it is wood carving, weaving, ormaking traditional sandals called opinci, all these activities are specific to the rural area anddefine the identity of the Romanian people [10–13].
Various authors consider that the modern rural area is the result of a complex processof continuity and discontinuity, where the new life models replace the traditional onesand the modernization of the villages and rural communities implies its transformation asa whole [14].
The term “rural area” is also widely used in politics and economics, but there is noaccepted unitary definition. However, it can be stated that a more accurate definition ofrural space consists of a “diverse and complicated economic structure that includes villages,small towns, forests, commercial activities that may include tourism, small companies, craftworkshops, small and medium industry, landscapes, and cultural traditions. This indicatesthe high degree of complexity that such an area has [15].
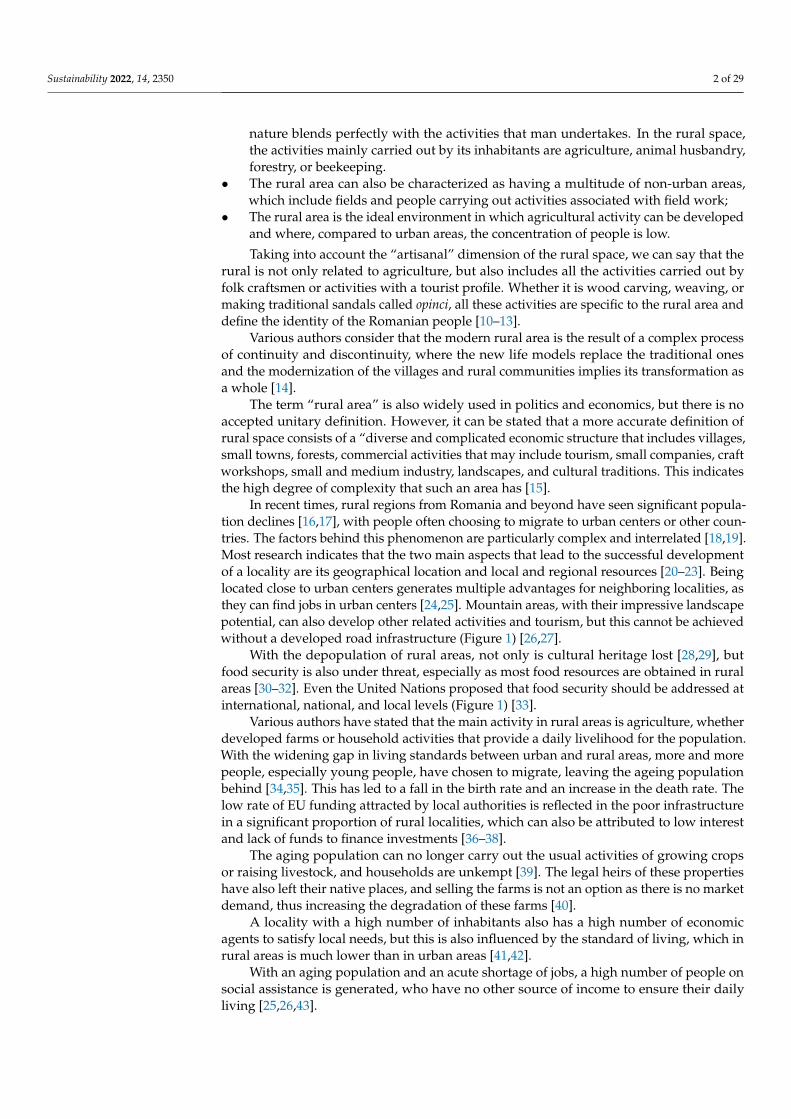
In recent times, rural regions from Romania and beyond have seen significant popula-tion declines [16,17], with people often choosing to migrate to urban centers or other coun-tries. The factors behind this phenomenon are particularly complex and interrelated [18,19].Most research indicates that the two main aspects that lead to the successful developmentof a locality are its geographical location and local and regional resources [20–23]. Beinglocated close to urban centers generates multiple advantages for neighboring localities, asthey can find jobs in urban centers [24,25]. Mountain areas, with their impressive landscapepotential, can also develop other related activities and tourism, but this cannot be achievedwithout a developed road infrastructure (Figure 1) [26,27].
With the depopulation of rural areas, not only is cultural heritage lost [28,29], butfood security is also under threat, especially as most food resources are obtained in ruralareas [30–32]. Even the United Nations proposed that food security should be addressed atinternational, national, and local levels (Figure 1) [33].
Various authors have stated that the main activity in rural areas is agriculture, whetherdeveloped farms or household activities that provide a daily livelihood for the population.With the widening gap in living standards between urban and rural areas, more and morepeople, especially young people, have chosen to migrate, leaving the ageing populationbehind [34,35]. This has led to a fall in the birth rate and an increase in the death rate. Thelow rate of EU funding attracted by local authorities is reflected in the poor infrastructurein a significant proportion of rural localities, which can also be attributed to low interestand lack of funds to finance investments [36–38].
The aging population can no longer carry out the usual activities of growing cropsor raising livestock, and households are unkempt [39]. The legal heirs of these propertieshave also left their native places, and selling the farms is not an option as there is no marketdemand, thus increasing the degradation of these farms [40].
A locality with a high number of inhabitants also has a high number of economicagents to satisfy local needs, but this is also influenced by the standard of living, which inrural areas is much lower than in urban areas [41,42].
With an aging population and an acute shortage of jobs, a high number of people onsocial assistance is generated, who have no other source of income to ensure their dailyliving [25,26,43].
Sustainability 2022, 14, 2350 3 of 29Sustainability 2022, 14, x FOR PEER REVIEW 3 of 30
Figure 1. Interdependence of internal and external factors on localities. Source: Canva processing.
Various authors have stated that the main activity in rural areas is agriculture, whether developed farms or household activities that provide a daily livelihood for the population. With the widening gap in living standards between urban and rural areas, more and more people, especially young people, have chosen to migrate, leaving the age-ing population behind [34,35]. This has led to a fall in the birth rate and an increase in the death rate. The low rate of EU funding attracted by local authorities is reflected in the poor infrastructure in a significant proportion of rural localities, which can also be attributed to low interest and lack of funds to finance investments [36–38].
The aging population can no longer carry out the usual activities of growing crops or raising livestock, and households are unkempt [39]. The legal heirs of these properties have also left their native places, and selling the farms is not an option as there is no mar-ket demand, thus increasing the degradation of these farms [40].
A locality with a high number of inhabitants also has a high number of economic agents to satisfy local needs, but this is also influenced by the standard of living, which in rural areas is much lower than in urban areas [41,42].
With an aging population and an acute shortage of jobs, a high number of people on social assistance is generated, who have no other source of income to ensure their daily living [25,26,43].
The study compares two development regions with different approaches as follows: The West region is located in Western Romania, on the border with Hungary and Serbia, with easier access to Western European countries, encouraging trade. Romania’s poorly developed road infrastructure also makes it difficult for other regions to access Europe, so this region has a significant advantage. The West region has a diversified economy, where agriculture is not a major driver of the economy. On the other hand, the South-Muntenia region is based on agricultural activities, being located in the Baragan Plain, where the
Figure 1. Interdependence of internal and external factors on localities. Source: Canva processing.
The study compares two development regions with different approaches as follows:The West region is located in Western Romania, on the border with Hungary and Serbia,with easier access to Western European countries, encouraging trade. Romania’s poorlydeveloped road infrastructure also makes it difficult for other regions to access Europe, sothis region has a significant advantage. The West region has a diversified economy, whereagriculture is not a major driver of the economy. On the other hand, the South-Munteniaregion is based on agricultural activities, being located in the Baragan Plain, where thefertile soils allow the cultivation of a variety of plant species over a large area. The relativelyclose location to the Black Sea allows the marketing of cereals and oil plants in the BlackSea basin.
The aim of the study is to demonstrate that, no matter how different the developmentregions in Romania may be in terms of geographical positioning, and focusing on localitiesin counties with a high value of agricultural production, the socio-economic developmentprospects are relatively similar and bleak. The paper also identifies a pattern in some rurallocalities that stands in the way of their development.
2. Theoretical Background
The rural area is characterized by diversity, including both physical and morphologicalaspects, biodiversity, and landscapes, but also social aspects, such as land use, traditions,and customs, while maintaining the priority of the development of these areas.
Looking at it from a different perspective, the rural area is considered an area of“disadvantages” characterized by low-income households, people with a poor level ofeducation, and lack of basic infrastructure (water, gas, and sewerage). A harsh but realprospect is often the level of extreme poverty, which is usually passed down from onegeneration to the next [44].
There are three types of disadvantaged regions: mountainous areas, other disad-vantaged rural areas (low-productivity land, low-income enterprises, low agricultural
Sustainability 2022, 14, 2350 4 of 29
incomes, low density, sustained population exodus), and areas with specific disadvantages(unfavorable natural conditions) [45].
According to Steiner, the main disadvantages of rural areas include low density,special social and economic structures, dependence on agriculture, low incomes, anddifficult accessibility [46].
The Evolution of Rural Development in Romania
Until 1990, the emphasis of the communist regime was on the development of industry,which contributed to the development of cities, to the detriment of rural areas. Due to thisaspect, there is still a significant gap between the two areas. In addition, during that period,a large part of the population in rural areas worked partly from their residences, until theemergence of the collectivization process, profoundly transforming the Romanian village,especially by dispossessing them of owned agricultural land [47].
After this period, the rural environment entered a new stage, with the return of thepopulation to the rural area, where the process of restitution of agricultural land occupiedby the communist regime was quite difficult and impartial, with small and very smallareas being returned to the population and agricultural practiced being one of subsistence.The restitution of these lands led to the emergence of small and medium-sized farms, butwith low productivity due to the lack of machinery and equipment needed to work theland. This led to the practice of subsistence farming, based on the production of primaryagricultural products in small quantities [47].
A negative characteristic of the Romanian rural area is the demographic decline,caused by the decrease in the rural population, determined by the aging population, but alsodue to the migration of the population to the areas with better-paid jobs. Small businesses,especially those that create jobs, cannot grow due to lack of funding (co-financing), but alsodue to poor infrastructure. There has been a change in rural areas in recent years, especiallyin terms of demographic change, core occupations, and moral value [47].
According to data published in 2019, only 11.3% of the rural population had access tosewerage services, and only 40% of households have constant access to drinking water. Itshould be mentioned that a part of the rural population of Romania has the possibility toconnect to these sewerage services, but the costs related to construction and connectivityare much too high for them [47].
The road infrastructure has significant deficiencies, with only 15% of the road networkin rural areas being modernized, with the rest as dirt or cobbled roads (in 2019). Gas supplyis also low, due to high connection costs but also poor infrastructure, including in areaswith a high population concentration [47].
Due to the poor condition of primary and secondary schools, in recent years their num-ber has been reduced by a third, which has contributed to an overcrowding of functionalschools, but also an increase in schooling costs of students in the environment, Determinedby their transport to nearby functional educational units [47].
Rural space, at the European level, is precious natural space as a result of a long history,and whose survival and revitalization is a constant concern for modern society [48–50].
At the European level, the member states of the European Union use their owndefinition of the term “rural area.” In France, the rural area is the territory where agricul-tural production is predominant and the landscape elements are found in their naturalstate [51,52]. On the other hand, the Belgians chose to define rural space as a set of naturallandscapes and cultivated areas. The Germans consider that the rural area represents all theareas that are positioned outside the areas that have a large number of inhabitants [53–55].In the United States of America, two terms are widely used to differentiate between ruraland urban: “rural farm” (rural agricultural) and “rural non-farm” (rural non-agricultural),and this can be explained by the existence of two rural areas, some mainly agricultural andothers where non-agricultural activities predominate in rural areas [56].
In Russia, rural areas are considered to be ones where the main functions are agriculture,forestry, fishing, and industrial activities of primary processing of these branches [56–58].
Sustainability 2022, 14, 2350 5 of 29
In other countries (UK, USA, Brazil), the definition is given according to the mainoccupation of the majority of the active population.
The most important regulation on sustainable development was given by Agenda 21,adopted at the United Nations Conference on Environment and Development in Rio deJaneiro in 1992, attended by 178 countries and 120 leaders. The defined principles providedfor measures to prepare people and authorities to produce and live differently than howthey had before. Agenda 21 is the most important moment for the concept of sustainabledevelopment [33].
In its report entitled “Our Common Journey: A Transition towards Sustainability,” theAcademy of Sciences of the United States of America tried to establish an order in terms ofthe definitions given so far of the concept of sustainable development. The authors of theUS report believe that it is important to differentiate between the priorities to be supportedby specific measures and the priorities to be developed. The scientists who contributed tothis report found three important categories involved in sustainable rural development:nature, life support systems, and the human community. The first studies on sustainabledevelopment addressed, first of all, the economic aspects of the job-generating sectors.Subsequently, consumption and human health were taken into account. The authors of theAmerican report believe that the approach to the concept of sustainable development hasfocused on the progress of society and the values and security of the welfare of countries,areas, and authorities at the national and local levels [58].
Sustainable development and rural areas are topics that have been analyzed andresearched by scientists from countries such as Germany, Austria, and Poland. The need topreserve and develop the village has recently been studied due to the fact that people havebecome increasingly concerned with having a better, healthier life and the preservation ofnatural landscapes.
Moser et al. (2018) studied the extent to which the lives of people living in rural areasof Germany can be improved. In the paper entitled “Improving the quality of life throughrural development programs in Germany (2007–2013). Evidence of the assessment,” theresearchers from Germany analyzed the extent to which the rural development programsimplemented in the 16 German Länder have fulfilled their purpose, that of enabling thesustainable development of the rural environment and improving the quality of life ofthe villagers. The results of the study showed that the improvement of the quality of lifethrough the implemented development programs was achieved only in certain regions [59].
The LEADER axis, which is found in many rural development programs in the memberstates of the European Union, has been studied in terms of the effect felt by member statessuch as France, Germany, and Italy. In the paper entitled “LEADER as a European policy forrural development in a multilevel governance framework: a comparison of implementationin France, Germany and Italy,” Pollermann et al. (2020) analyzed the way in which theimplementation of the LEADER axis in three different countries brought substantial changesto the rural area. The paper analyzed the similarities and differences between the threecountries in terms of implementation mechanisms of the LEADER axis. The study wasbased on the analysis of documents and a series of interviews with stakeholders, andthe institutional differences in the implementation of LEADER at the local level wereanalyzed in order to identify the best strategy for the development of the LEADER axis inthe future [60].
3. Methodology
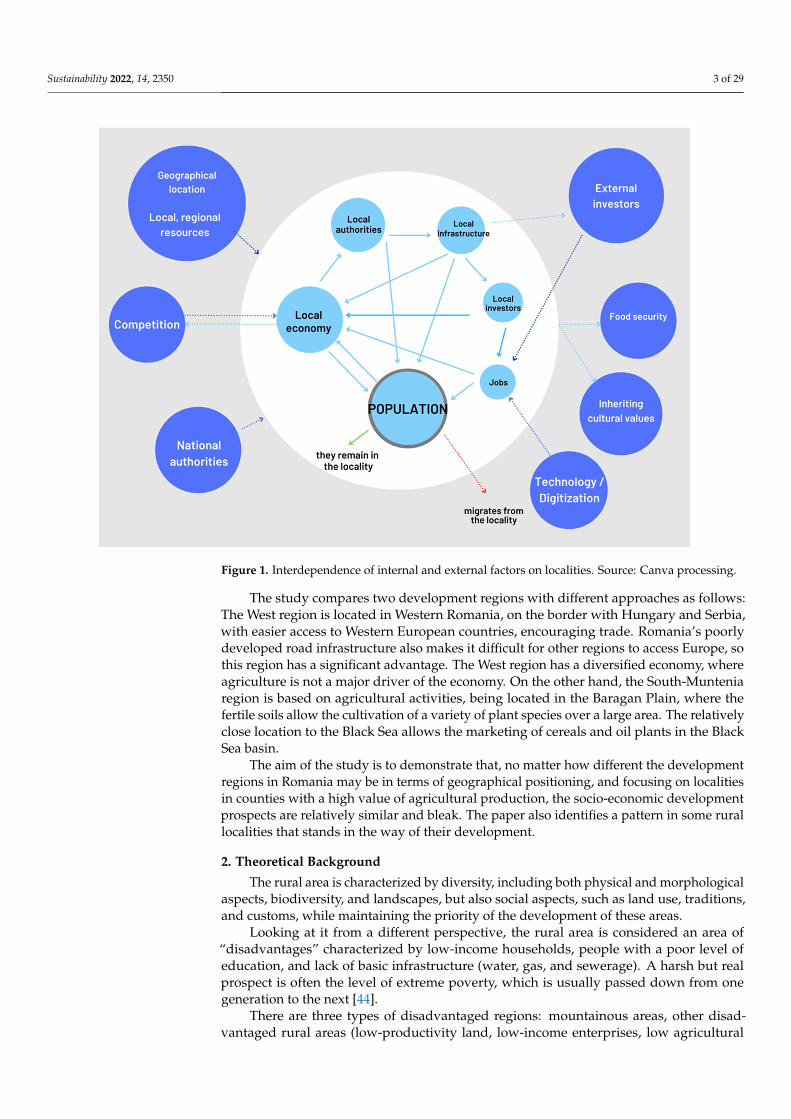
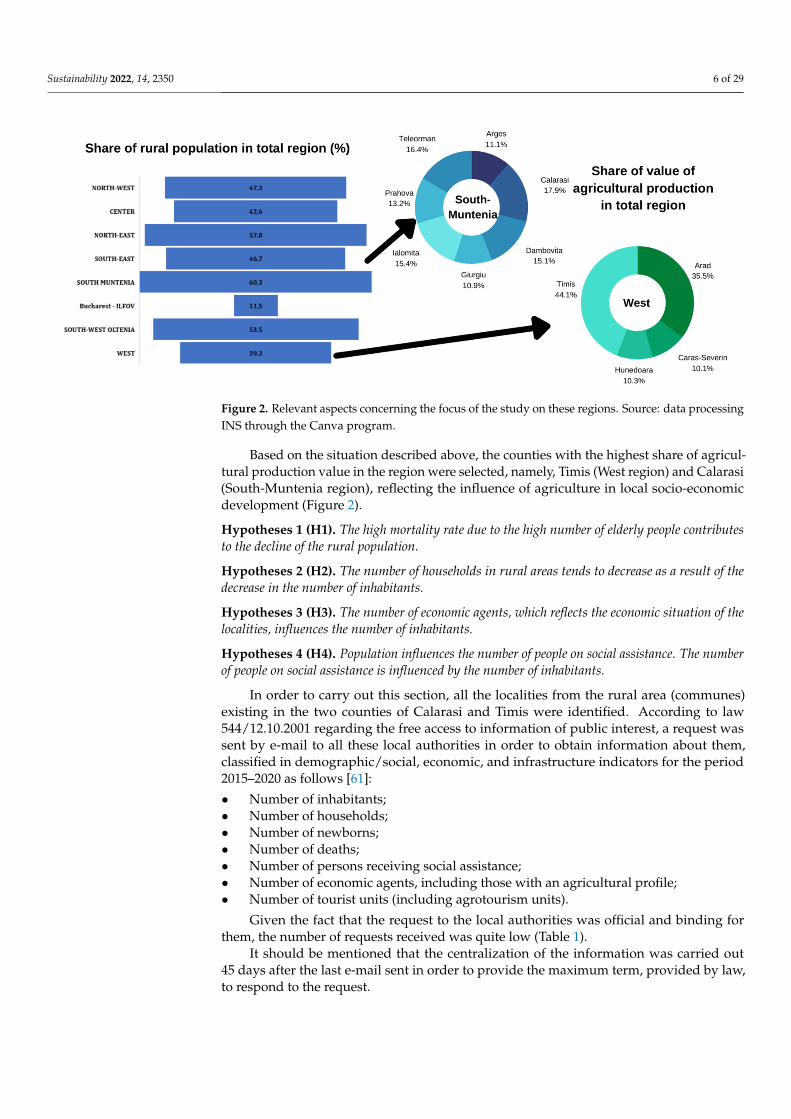
The focus of the study on the two development regions of Romania was based onthe share of the rural population in the total population, and the extremes were selected.Thus, in the South-Muntenia region, in 2019, the share of the rural population in thetotal population was 60.3%, whereas the West region had the lowest rural population,with only 39.3% (except for the Bucharest-Ilfov region, whose socio-economic situation isextremely favorable in the context of its location in the immediate vicinity of the Romaniancapital) (Figure 2).
Sustainability 2022, 14, 2350 6 of 29
Sustainability 2022, 14, x FOR PEER REVIEW 6 of 30
sustainable development of the rural environment and improving the quality of life of the villagers. The results of the study showed that the improvement of the quality of life through the implemented development programs was achieved only in certain regions [59].
The LEADER axis, which is found in many rural development programs in the mem-ber states of the European Union, has been studied in terms of the effect felt by member states such as France, Germany, and Italy. In the paper entitled “LEADER as a European policy for rural development in a multilevel governance framework: a comparison of im-plementation in France, Germany and Italy,” Pollermann et al. (2020) analyzed the way in which the implementation of the LEADER axis in three different countries brought sub-stantial changes to the rural area. The paper analyzed the similarities and differences be-tween the three countries in terms of implementation mechanisms of the LEADER axis. The study was based on the analysis of documents and a series of interviews with stake-holders, and the institutional differences in the implementation of LEADER at the local level were analyzed in order to identify the best strategy for the development of the LEADER axis in the future [60].
3. Methodology The focus of the study on the two development regions of Romania was based on the
share of the rural population in the total population, and the extremes were selected. Thus, in the South-Muntenia region, in 2019, the share of the rural population in the total pop-ulation was 60.3%, whereas the West region had the lowest rural population, with only 39.3% (except for the Bucharest-Ilfov region, whose socio-economic situation is extremely favorable in the context of its location in the immediate vicinity of the Romanian capital) (Figure 2).
Figure 2. Relevant aspects concerning the focus of the study on these regions. Source: data pro-cessing INS through the Canva program.
Based on the situation described above, the counties with the highest share of agri-cultural production value in the region were selected, namely, Timis (West region) and Calarasi (South-Muntenia region), reflecting the influence of agriculture in local socio-economic development (Figure 2).
Hypotheses 1 (H1). The high mortality rate due to the high number of elderly people contributes to the decline of the rural population.
Figure 2. Relevant aspects concerning the focus of the study on these regions. Source: data processingINS through the Canva program.
Based on the situation described above, the counties with the highest share of agricul-tural production value in the region were selected, namely, Timis (West region) and Calarasi(South-Muntenia region), reflecting the influence of agriculture in local socio-economicdevelopment (Figure 2).
Hypotheses 1 (H1). The high mortality rate due to the high number of elderly people contributesto the decline of the rural population.
Hypotheses 2 (H2). The number of households in rural areas tends to decrease as a result of thedecrease in the number of inhabitants.
Hypotheses 3 (H3). The number of economic agents, which reflects the economic situation of thelocalities, influences the number of inhabitants.
Hypotheses 4 (H4). Population influences the number of people on social assistance. The numberof people on social assistance is influenced by the number of inhabitants.
In order to carry out this section, all the localities from the rural area (communes)existing in the two counties of Calarasi and Timis were identified. According to law544/12.10.2001 regarding the free access to information of public interest, a request wassent by e-mail to all these local authorities in order to obtain information about them,classified in demographic/social, economic, and infrastructure indicators for the period2015–2020 as follows [61]:
• Number of inhabitants;• Number of households;• Number of newborns;• Number of deaths;• Number of persons receiving social assistance;• Number of economic agents, including those with an agricultural profile;• Number of tourist units (including agrotourism units).
Given the fact that the request to the local authorities was official and binding forthem, the number of requests received was quite low (Table 1).
It should be mentioned that the centralization of the information was carried out45 days after the last e-mail sent in order to provide the maximum term, provided by law,to respond to the request.
Sustainability 2022, 14, 2350 7 of 29
Table 1. The centralizing situation of the answers received from the local authorities.
County No. Localities to WhichRequests Were Sent
No. Localities ThatResponded to the Request
No. Localities ThatDid Not Respond
Share of Localities ThatResponded of the Total (%)
Calarasi 50 19 31 38.0
Timis 88 35 53 39.8
Total 138 54 84 39.1
Source: centralized data.
Because the large volume of data transmitted by the authorities does not make itpossible to present them in this article, it was decided to present and analyze the followinglocalities that responded to the request (Table 2):
• Criterion 1—the locality with the highest number of inhabitants in 2020;• Criterion 2—the locality with the lowest number of inhabitants in 2020;• Criterion 3—the locality with the largest number of economic agents in 2020;• Criterion 4—the locality with the lowest number of economic agents in 2020.
Table 2. Communes that were selected according to the criteria needed to determine mathematicalmodels.
No. Crt. Locality from Calarasi County Locality from Timis County
1 Dragalina Sanmihaiu
2 Nicolae Balcescu Valcani
3 Soldanu Peciu Nou
4 Sarulesti FardeaSource: centralized data.
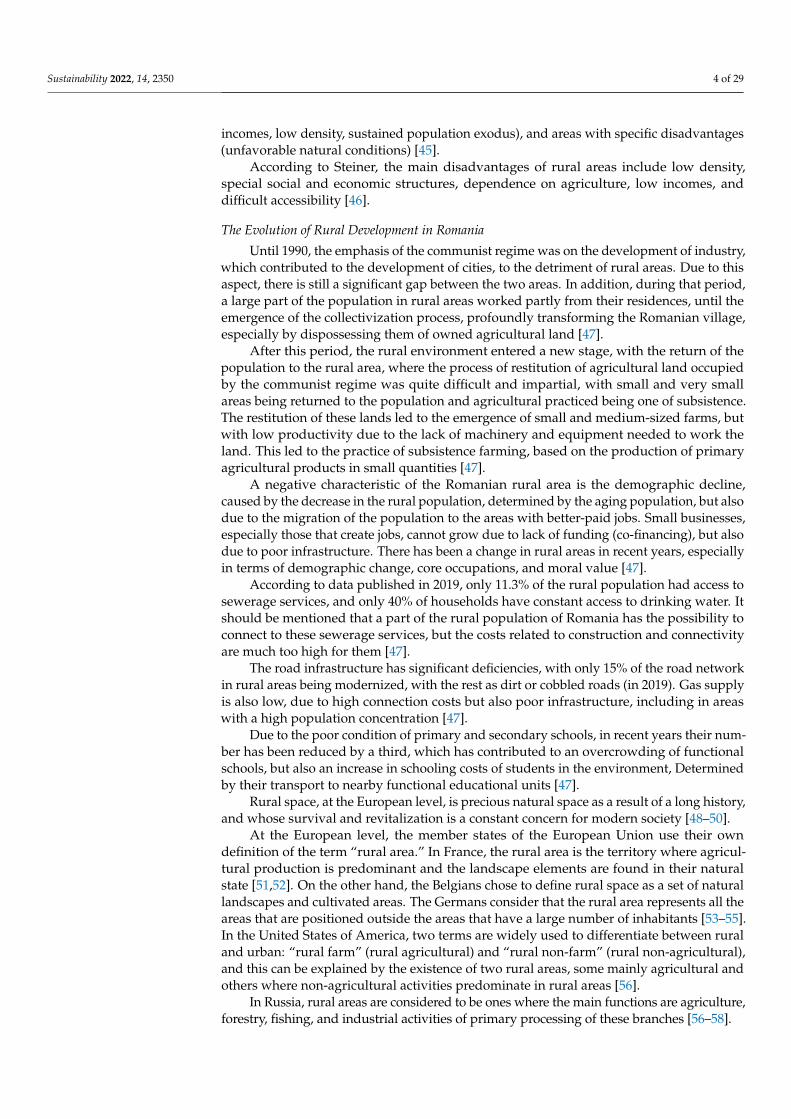
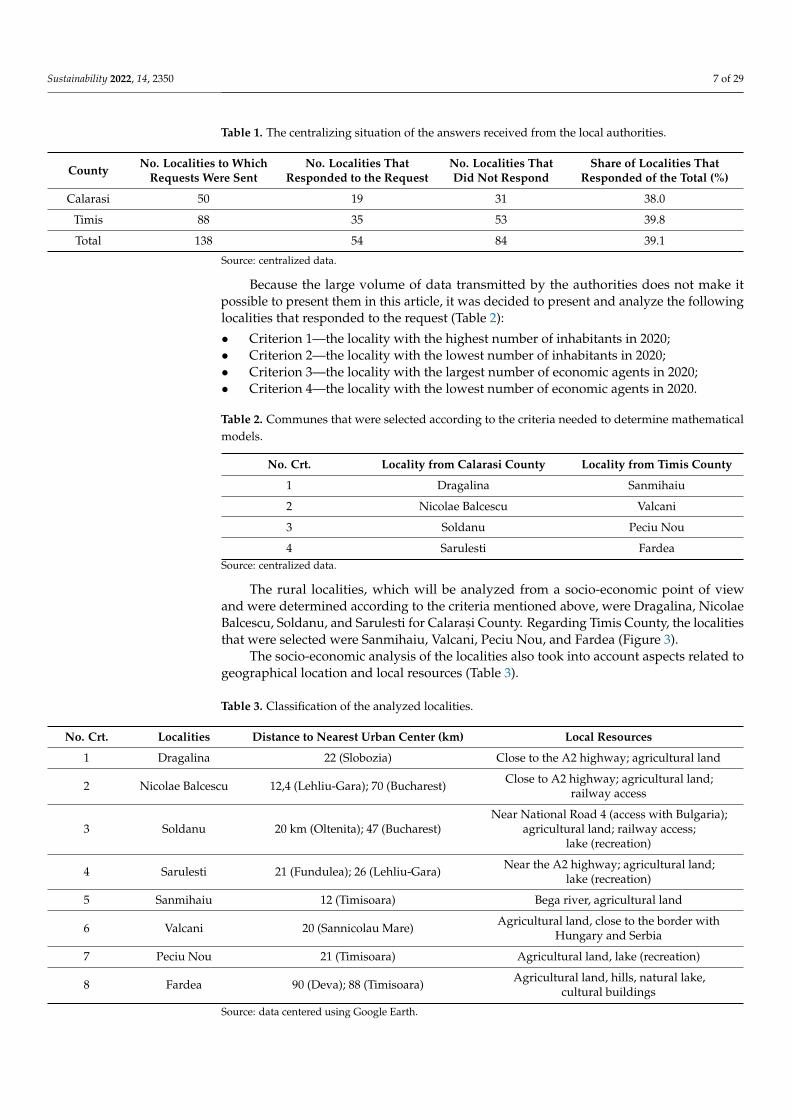
The rural localities, which will be analyzed from a socio-economic point of viewand were determined according to the criteria mentioned above, were Dragalina, NicolaeBalcescu, Soldanu, and Sarulesti for Calaras, i County. Regarding Timis County, the localitiesthat were selected were Sanmihaiu, Valcani, Peciu Nou, and Fardea (Figure 3).
The socio-economic analysis of the localities also took into account aspects related togeographical location and local resources (Table 3).
Table 3. Classification of the analyzed localities.
No. Crt. Localities Distance to Nearest Urban Center (km) Local Resources
1 Dragalina 22 (Slobozia) Close to the A2 highway; agricultural land
2 Nicolae Balcescu 12,4 (Lehliu-Gara); 70 (Bucharest) Close to A2 highway; agricultural land;railway access
3 Soldanu 20 km (Oltenita); 47 (Bucharest)Near National Road 4 (access with Bulgaria);
agricultural land; railway access;lake (recreation)
4 Sarulesti 21 (Fundulea); 26 (Lehliu-Gara) Near the A2 highway; agricultural land;lake (recreation)
5 Sanmihaiu 12 (Timisoara) Bega river, agricultural land
6 Valcani 20 (Sannicolau Mare) Agricultural land, close to the border withHungary and Serbia
7 Peciu Nou 21 (Timisoara) Agricultural land, lake (recreation)
8 Fardea 90 (Deva); 88 (Timisoara) Agricultural land, hills, natural lake,cultural buildings
Source: data centered using Google Earth.
Sustainability 2022, 14, 2350 8 of 29
Sustainability 2022, 14, x FOR PEER REVIEW 8 of 30
The rural localities, which will be analyzed from a socio-economic point of view and were determined according to the criteria mentioned above, were Dragalina, Nicolae Bal-cescu, Soldanu, and Sarulesti for Calarași County. Regarding Timis County, the localities that were selected were Sanmihaiu, Valcani, Peciu Nou, and Fardea (Figure 3).
Figure 3. Territorial distribution of the analyzed localities. Source: geographical distribution using the MapChart application.
The socio-economic analysis of the localities also took into account aspects related to geographical location and local resources (Table 3).
Table 3. Classification of the analyzed localities.
No. Crt. Localities Distance to Nearest Urban Center (km) Local Resources 1 Dragalina 22 (Slobozia) Close to the A2 highway; agricultural land
2 Nicolae Balcescu 12,4 (Lehliu-Gara); 70 (Bucharest) Close to A2 highway; agricultural land; railway access
3 Soldanu 20 km (Oltenita); 47 (Bucharest) Near National Road 4 (access with Bulgaria); ag-ricultural land; railway access; lake (recreation)
4 Sarulesti 21 (Fundulea); 26 (Lehliu-Gara) Near the A2 highway; agricultural land; lake (recreation)
5 Sanmihaiu 12 (Timisoara) Bega river, agricultural land
6 Valcani 20 (Sannicolau Mare) Agricultural land, close to the border with Hun-gary and Serbia
7 Peciu Nou 21 (Timisoara) Agricultural land, lake (recreation)
8 Fardea 90 (Deva); 88 (Timisoara) Agricultural land, hills, natural lake, cultural
buildings Source: data centered using Google Earth.
Figure 3. Territorial distribution of the analyzed localities. Source: geographical distribution usingthe MapChart application.
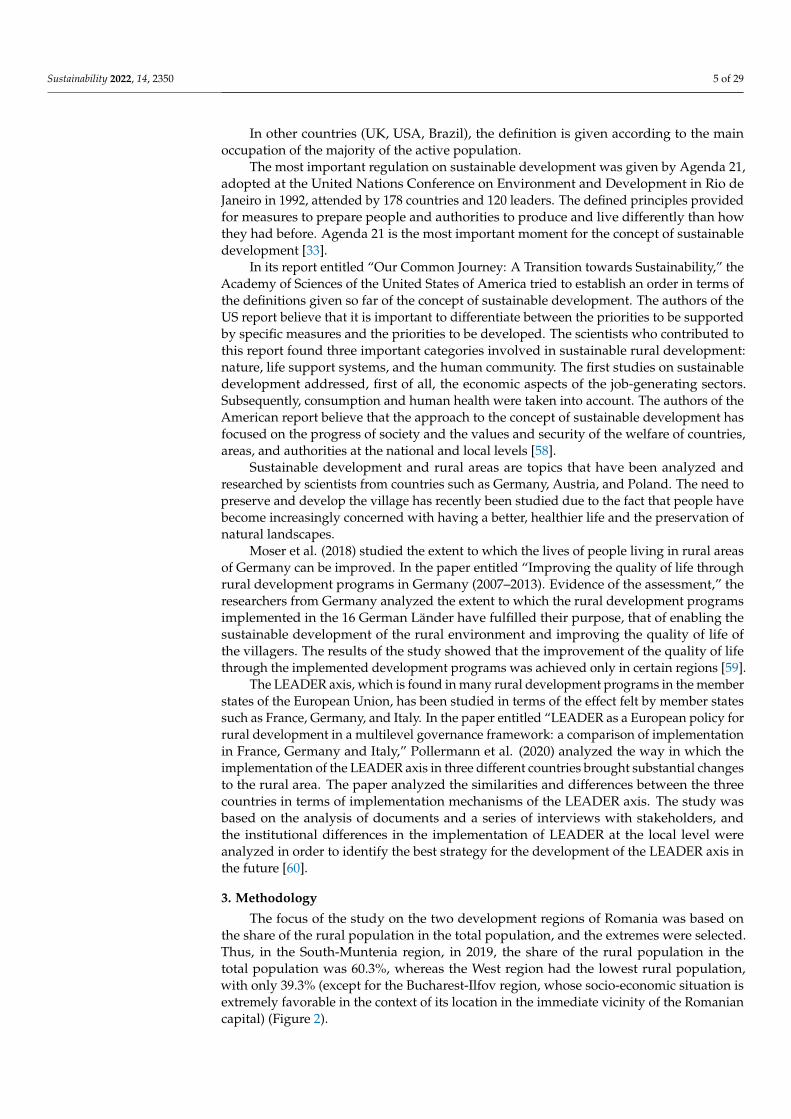
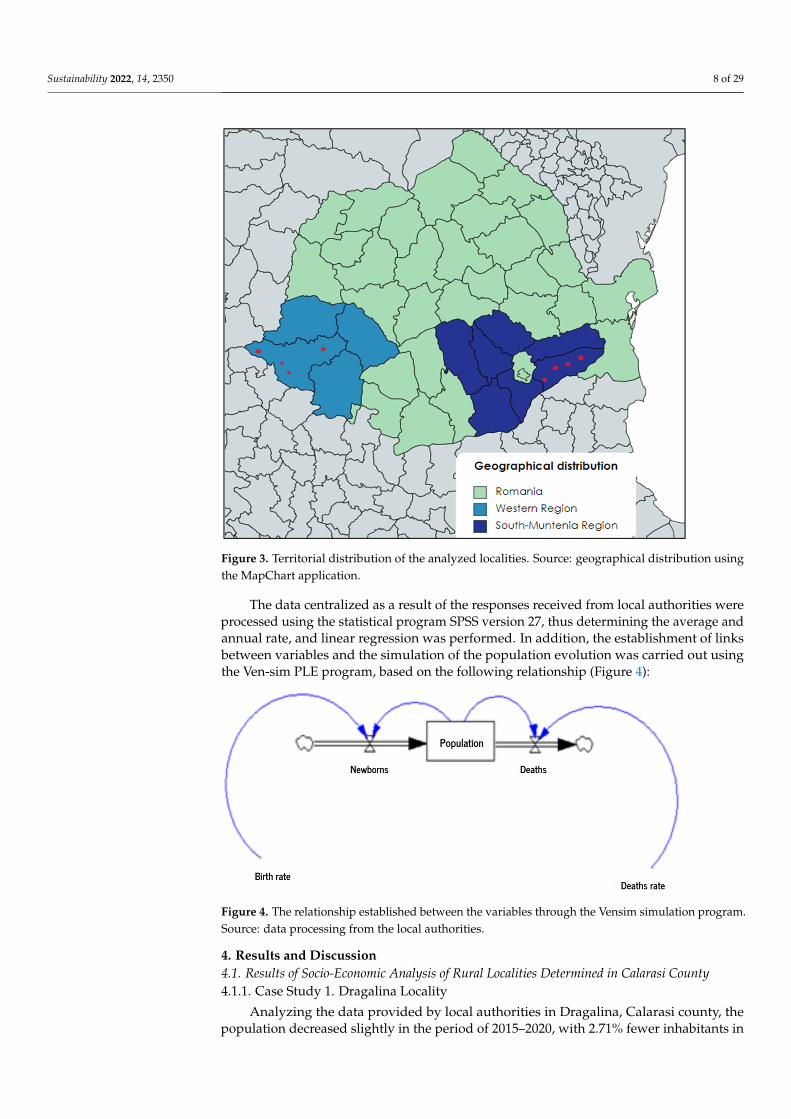
The data centralized as a result of the responses received from local authorities wereprocessed using the statistical program SPSS version 27, thus determining the average andannual rate, and linear regression was performed. In addition, the establishment of linksbetween variables and the simulation of the population evolution was carried out usingthe Ven-sim PLE program, based on the following relationship (Figure 4):
Sustainability 2022, 14, x FOR PEER REVIEW 9 of 30
The data centralized as a result of the responses received from local authorities were processed using the statistical program SPSS version 27, thus determining the average and annual rate, and linear regression was performed. In addition, the establishment of links between variables and the simulation of the population evolution was carried out using the Ven-sim PLE program, based on the following relationship (Figure 4):
Figure 4. The relationship established between the variables through the Vensim simulation pro-gram. Source: data processing from the local authorities.
4. Results and Discussion 4.1. Results of Socio-Economic Analysis of Rural Localities Determined in Calarasi County 4.1.1. Case Study 1. Dragalina Locality
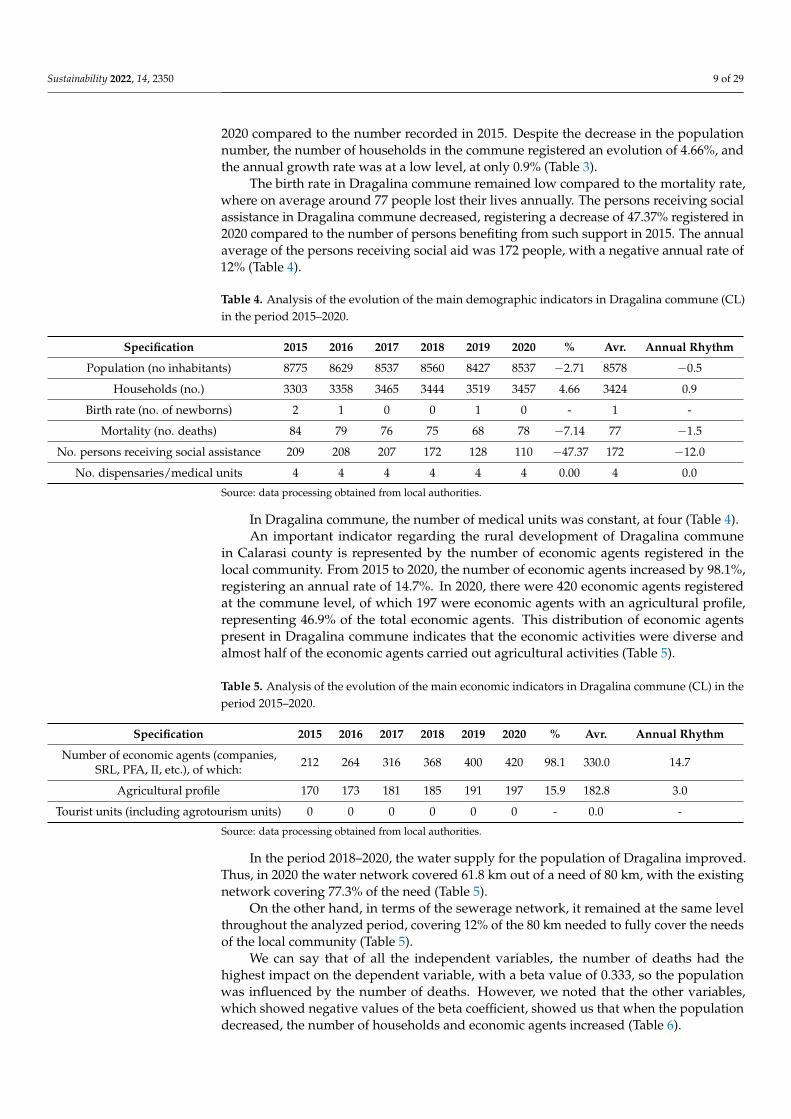
Analyzing the data provided by local authorities in Dragalina, Calarasi county, the population decreased slightly in the period of 2015–2020, with 2.71% fewer inhabitants in 2020 compared to the number recorded in 2015. Despite the decrease in the population number, the number of households in the commune registered an evolution of 4.66%, and the annual growth rate was at a low level, at only 0.9% (Table 3).
The birth rate in Dragalina commune remained low compared to the mortality rate, where on average around 77 people lost their lives annually. The persons receiving social assistance in Dragalina commune decreased, registering a decrease of 47.37% registered in 2020 compared to the number of persons benefiting from such support in 2015. The annual average of the persons receiving social aid was 172 people, with a negative annual rate of 12% (Table 4).
Table 4. Analysis of the evolution of the main demographic indicators in Dragalina commune (CL) in the period 2015–2020.
Specification 2015 2016 2017 2018 2019 2020 % Avr. Annual Rhythm Population (no inhabitants) 8775 8629 8537 8560 8427 8537 −2.71 8578 −0.5
Households (no.) 3303 3358 3465 3444 3519 3457 4.66 3424 0.9 Birth rate (no. of newborns) 2 1 0 0 1 0 - 1 -
Mortality (no. deaths) 84 79 76 75 68 78 −7.14 77 −1.5 No. persons receiving social assistance 209 208 207 172 128 110 −47.37 172 −12.0
No. dispensaries/medical units 4 4 4 4 4 4 0.00 4 0.0 Source: data processing obtained from local authorities.
In Dragalina commune, the number of medical units was constant, at four (Table 4). An important indicator regarding the rural development of Dragalina commune in
Calarasi county is represented by the number of economic agents registered in the local
Figure 4. The relationship established between the variables through the Vensim simulation program.Source: data processing from the local authorities.
4. Results and Discussion4.1. Results of Socio-Economic Analysis of Rural Localities Determined in Calarasi County4.1.1. Case Study 1. Dragalina Locality
Analyzing the data provided by local authorities in Dragalina, Calarasi county, thepopulation decreased slightly in the period of 2015–2020, with 2.71% fewer inhabitants in
Sustainability 2022, 14, 2350 9 of 29
2020 compared to the number recorded in 2015. Despite the decrease in the populationnumber, the number of households in the commune registered an evolution of 4.66%, andthe annual growth rate was at a low level, at only 0.9% (Table 3).
The birth rate in Dragalina commune remained low compared to the mortality rate,where on average around 77 people lost their lives annually. The persons receiving socialassistance in Dragalina commune decreased, registering a decrease of 47.37% registered in2020 compared to the number of persons benefiting from such support in 2015. The annualaverage of the persons receiving social aid was 172 people, with a negative annual rate of12% (Table 4).
Table 4. Analysis of the evolution of the main demographic indicators in Dragalina commune (CL)in the period 2015–2020.
Specification 2015 2016 2017 2018 2019 2020 % Avr. Annual Rhythm
Population (no inhabitants) 8775 8629 8537 8560 8427 8537 −2.71 8578 −0.5
Households (no.) 3303 3358 3465 3444 3519 3457 4.66 3424 0.9
Birth rate (no. of newborns) 2 1 0 0 1 0 - 1 -
Mortality (no. deaths) 84 79 76 75 68 78 −7.14 77 −1.5
No. persons receiving social assistance 209 208 207 172 128 110 −47.37 172 −12.0
No. dispensaries/medical units 4 4 4 4 4 4 0.00 4 0.0
Source: data processing obtained from local authorities.
In Dragalina commune, the number of medical units was constant, at four (Table 4).An important indicator regarding the rural development of Dragalina commune
in Calarasi county is represented by the number of economic agents registered in thelocal community. From 2015 to 2020, the number of economic agents increased by 98.1%,registering an annual rate of 14.7%. In 2020, there were 420 economic agents registeredat the commune level, of which 197 were economic agents with an agricultural profile,representing 46.9% of the total economic agents. This distribution of economic agentspresent in Dragalina commune indicates that the economic activities were diverse andalmost half of the economic agents carried out agricultural activities (Table 5).
Table 5. Analysis of the evolution of the main economic indicators in Dragalina commune (CL) in theperiod 2015–2020.
Specification 2015 2016 2017 2018 2019 2020 % Avr. Annual Rhythm
Number of economic agents (companies,SRL, PFA, II, etc.), of which: 212 264 316 368 400 420 98.1 330.0 14.7
Agricultural profile 170 173 181 185 191 197 15.9 182.8 3.0
Tourist units (including agrotourism units) 0 0 0 0 0 0 - 0.0 -
Source: data processing obtained from local authorities.
In the period 2018–2020, the water supply for the population of Dragalina improved.Thus, in 2020 the water network covered 61.8 km out of a need of 80 km, with the existingnetwork covering 77.3% of the need (Table 5).
On the other hand, in terms of the sewerage network, it remained at the same levelthroughout the analyzed period, covering 12% of the 80 km needed to fully cover the needsof the local community (Table 5).
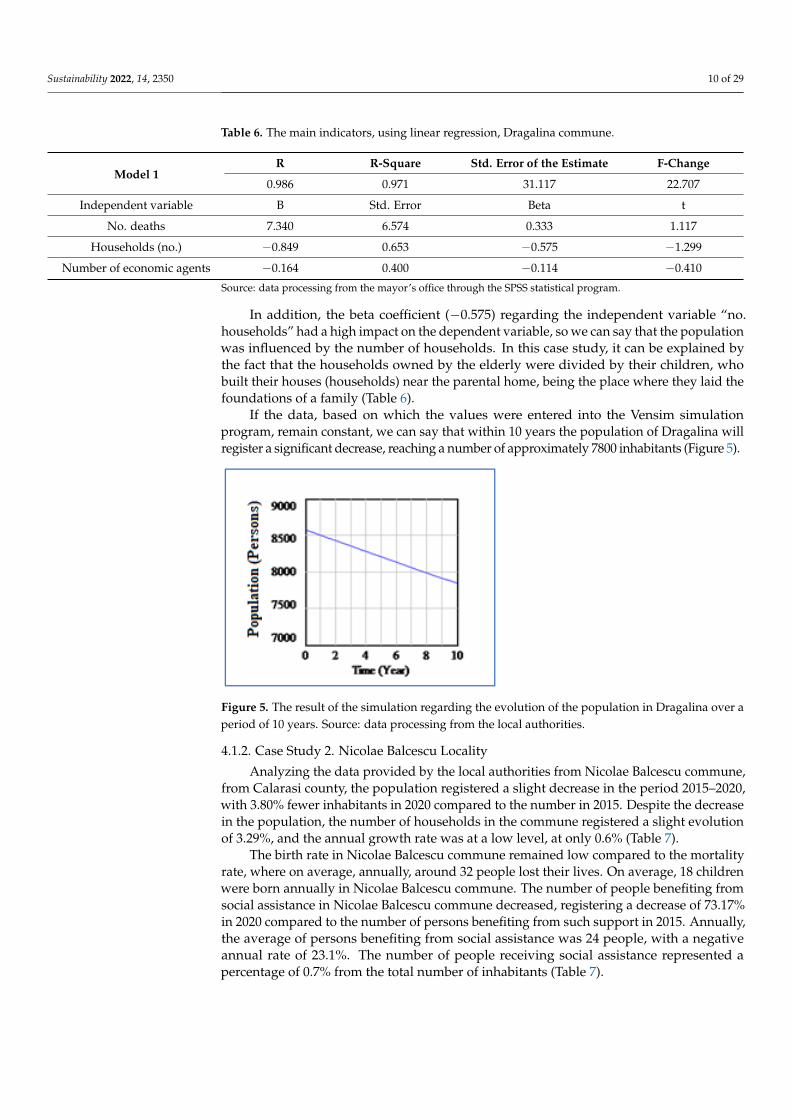
We can say that of all the independent variables, the number of deaths had thehighest impact on the dependent variable, with a beta value of 0.333, so the populationwas influenced by the number of deaths. However, we noted that the other variables,which showed negative values of the beta coefficient, showed us that when the populationdecreased, the number of households and economic agents increased (Table 6).
Sustainability 2022, 14, 2350 10 of 29
Table 6. The main indicators, using linear regression, Dragalina commune.
Model 1R R-Square Std. Error of the Estimate F-Change
0.986 0.971 31.117 22.707
Independent variable B Std. Error Beta t
No. deaths 7.340 6.574 0.333 1.117
Households (no.) −0.849 0.653 −0.575 −1.299
Number of economic agents −0.164 0.400 −0.114 −0.410
Source: data processing from the mayor’s office through the SPSS statistical program.
In addition, the beta coefficient (−0.575) regarding the independent variable “no.households” had a high impact on the dependent variable, so we can say that the populationwas influenced by the number of households. In this case study, it can be explained bythe fact that the households owned by the elderly were divided by their children, whobuilt their houses (households) near the parental home, being the place where they laid thefoundations of a family (Table 6).
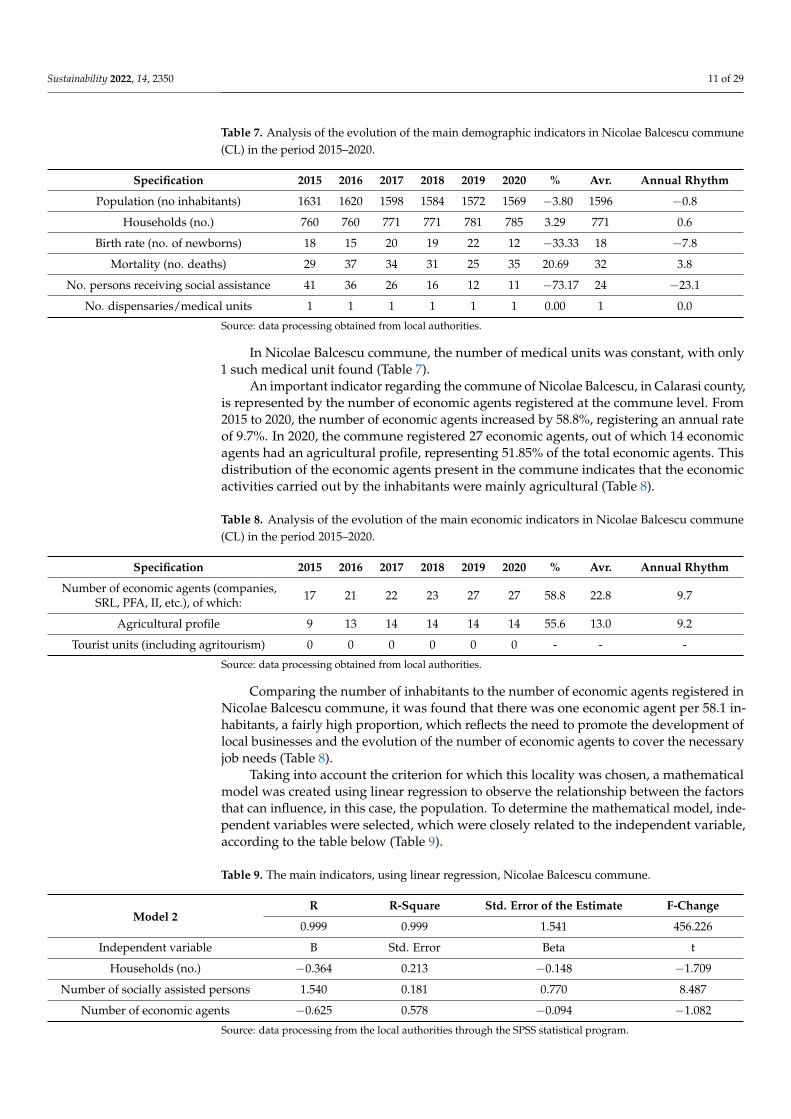
If the data, based on which the values were entered into the Vensim simulationprogram, remain constant, we can say that within 10 years the population of Dragalina willregister a significant decrease, reaching a number of approximately 7800 inhabitants (Figure 5).
Sustainability 2022, 14, x FOR PEER REVIEW 11 of 30
Figure 5. The result of the simulation regarding the evolution of the population in Dragalina over a period of 10 years. Source: data processing from the local authorities.
4.1.2. Case Study 2. Nicolae Balcescu Locality Analyzing the data provided by the local authorities from Nicolae Balcescu com-
mune, from Calarasi county, the population registered a slight decrease in the period 2015–2020, with 3.80% fewer inhabitants in 2020 compared to the number in 2015. Despite the decrease in the population, the number of households in the commune registered a slight evolution of 3.29%, and the annual growth rate was at a low level, at only 0.6% (Table 7).
Table 7. Analysis of the evolution of the main demographic indicators in Nicolae Balcescu commune (CL) in the period 2015–2020.
Specification 2015 2016 2017 2018 2019 2020 % Avr. Annual Rhythm
Population (no inhabitants) 1631 1620 1598 1584 1572 1569 −3.80 1596 −0.8 Households (no.) 760 760 771 771 781 785 3.29 771 0.6
Birth rate (no. of newborns) 18 15 20 19 22 12 −33.33 18 −7.8 Mortality (no. deaths) 29 37 34 31 25 35 20.69 32 3.8
No. persons receiving social assistance 41 36 26 16 12 11 −73.17 24 −23.1 No. dispensaries/medical units 1 1 1 1 1 1 0.00 1 0.0
Source: data processing obtained from local authorities.
The birth rate in Nicolae Balcescu commune remained low compared to the mortality rate, where on average, annually, around 32 people lost their lives. On average, 18 chil-dren were born annually in Nicolae Balcescu commune. The number of people benefiting from social assistance in Nicolae Balcescu commune decreased, registering a decrease of 73.17% in 2020 compared to the number of persons benefiting from such support in 2015. Annually, the average of persons benefiting from social assistance was 24 people, with a negative annual rate of 23.1%. The number of people receiving social assistance repre-sented a percentage of 0.7% from the total number of inhabitants (Table 7).
In Nicolae Balcescu commune, the number of medical units was constant, with only 1 such medical unit found (Table 7).
An important indicator regarding the commune of Nicolae Balcescu, in Calarasi county, is represented by the number of economic agents registered at the commune level. From 2015 to 2020, the number of economic agents increased by 58.8%, registering an an-nual rate of 9.7%. In 2020, the commune registered 27 economic agents, out of which 14 economic agents had an agricultural profile, representing 51.85% of the total economic agents. This distribution of the economic agents present in the commune indicates that the economic activities carried out by the inhabitants were mainly agricultural (Table 8).
Figure 5. The result of the simulation regarding the evolution of the population in Dragalina over aperiod of 10 years. Source: data processing from the local authorities.
4.1.2. Case Study 2. Nicolae Balcescu Locality
Analyzing the data provided by the local authorities from Nicolae Balcescu commune,from Calarasi county, the population registered a slight decrease in the period 2015–2020,with 3.80% fewer inhabitants in 2020 compared to the number in 2015. Despite the decreasein the population, the number of households in the commune registered a slight evolutionof 3.29%, and the annual growth rate was at a low level, at only 0.6% (Table 7).
The birth rate in Nicolae Balcescu commune remained low compared to the mortalityrate, where on average, annually, around 32 people lost their lives. On average, 18 childrenwere born annually in Nicolae Balcescu commune. The number of people benefiting fromsocial assistance in Nicolae Balcescu commune decreased, registering a decrease of 73.17%in 2020 compared to the number of persons benefiting from such support in 2015. Annually,the average of persons benefiting from social assistance was 24 people, with a negativeannual rate of 23.1%. The number of people receiving social assistance represented apercentage of 0.7% from the total number of inhabitants (Table 7).
Sustainability 2022, 14, 2350 11 of 29
Table 7. Analysis of the evolution of the main demographic indicators in Nicolae Balcescu commune(CL) in the period 2015–2020.
Specification 2015 2016 2017 2018 2019 2020 % Avr. Annual Rhythm
Population (no inhabitants) 1631 1620 1598 1584 1572 1569 −3.80 1596 −0.8
Households (no.) 760 760 771 771 781 785 3.29 771 0.6
Birth rate (no. of newborns) 18 15 20 19 22 12 −33.33 18 −7.8
Mortality (no. deaths) 29 37 34 31 25 35 20.69 32 3.8
No. persons receiving social assistance 41 36 26 16 12 11 −73.17 24 −23.1
No. dispensaries/medical units 1 1 1 1 1 1 0.00 1 0.0
Source: data processing obtained from local authorities.
In Nicolae Balcescu commune, the number of medical units was constant, with only1 such medical unit found (Table 7).
An important indicator regarding the commune of Nicolae Balcescu, in Calarasi county,is represented by the number of economic agents registered at the commune level. From2015 to 2020, the number of economic agents increased by 58.8%, registering an annual rateof 9.7%. In 2020, the commune registered 27 economic agents, out of which 14 economicagents had an agricultural profile, representing 51.85% of the total economic agents. Thisdistribution of the economic agents present in the commune indicates that the economicactivities carried out by the inhabitants were mainly agricultural (Table 8).
Table 8. Analysis of the evolution of the main economic indicators in Nicolae Balcescu commune(CL) in the period 2015–2020.
Specification 2015 2016 2017 2018 2019 2020 % Avr. Annual Rhythm
Number of economic agents (companies,SRL, PFA, II, etc.), of which: 17 21 22 23 27 27 58.8 22.8 9.7
Agricultural profile 9 13 14 14 14 14 55.6 13.0 9.2
Tourist units (including agritourism) 0 0 0 0 0 0 - - -
Source: data processing obtained from local authorities.
Comparing the number of inhabitants to the number of economic agents registered inNicolae Balcescu commune, it was found that there was one economic agent per 58.1 in-habitants, a fairly high proportion, which reflects the need to promote the development oflocal businesses and the evolution of the number of economic agents to cover the necessaryjob needs (Table 8).
Taking into account the criterion for which this locality was chosen, a mathematicalmodel was created using linear regression to observe the relationship between the factorsthat can influence, in this case, the population. To determine the mathematical model, inde-pendent variables were selected, which were closely related to the independent variable,according to the table below (Table 9).
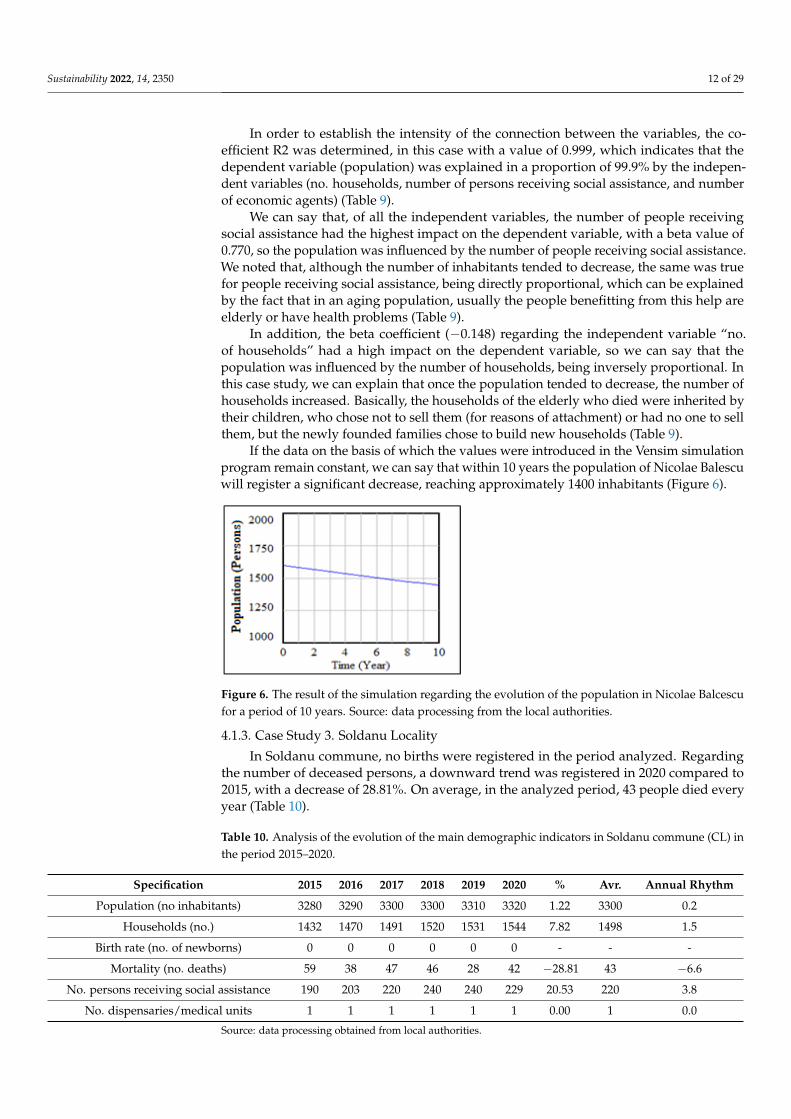
Table 9. The main indicators, using linear regression, Nicolae Balcescu commune.
Model 2R R-Square Std. Error of the Estimate F-Change
0.999 0.999 1.541 456.226
Independent variable B Std. Error Beta t
Households (no.) −0.364 0.213 −0.148 −1.709
Number of socially assisted persons 1.540 0.181 0.770 8.487
Number of economic agents −0.625 0.578 −0.094 −1.082
Source: data processing from the local authorities through the SPSS statistical program.
Sustainability 2022, 14, 2350 12 of 29
In order to establish the intensity of the connection between the variables, the co-efficient R2 was determined, in this case with a value of 0.999, which indicates that thedependent variable (population) was explained in a proportion of 99.9% by the indepen-dent variables (no. households, number of persons receiving social assistance, and numberof economic agents) (Table 9).
We can say that, of all the independent variables, the number of people receivingsocial assistance had the highest impact on the dependent variable, with a beta value of0.770, so the population was influenced by the number of people receiving social assistance.We noted that, although the number of inhabitants tended to decrease, the same was truefor people receiving social assistance, being directly proportional, which can be explainedby the fact that in an aging population, usually the people benefitting from this help areelderly or have health problems (Table 9).
In addition, the beta coefficient (−0.148) regarding the independent variable “no.of households” had a high impact on the dependent variable, so we can say that thepopulation was influenced by the number of households, being inversely proportional. Inthis case study, we can explain that once the population tended to decrease, the number ofhouseholds increased. Basically, the households of the elderly who died were inherited bytheir children, who chose not to sell them (for reasons of attachment) or had no one to sellthem, but the newly founded families chose to build new households (Table 9).
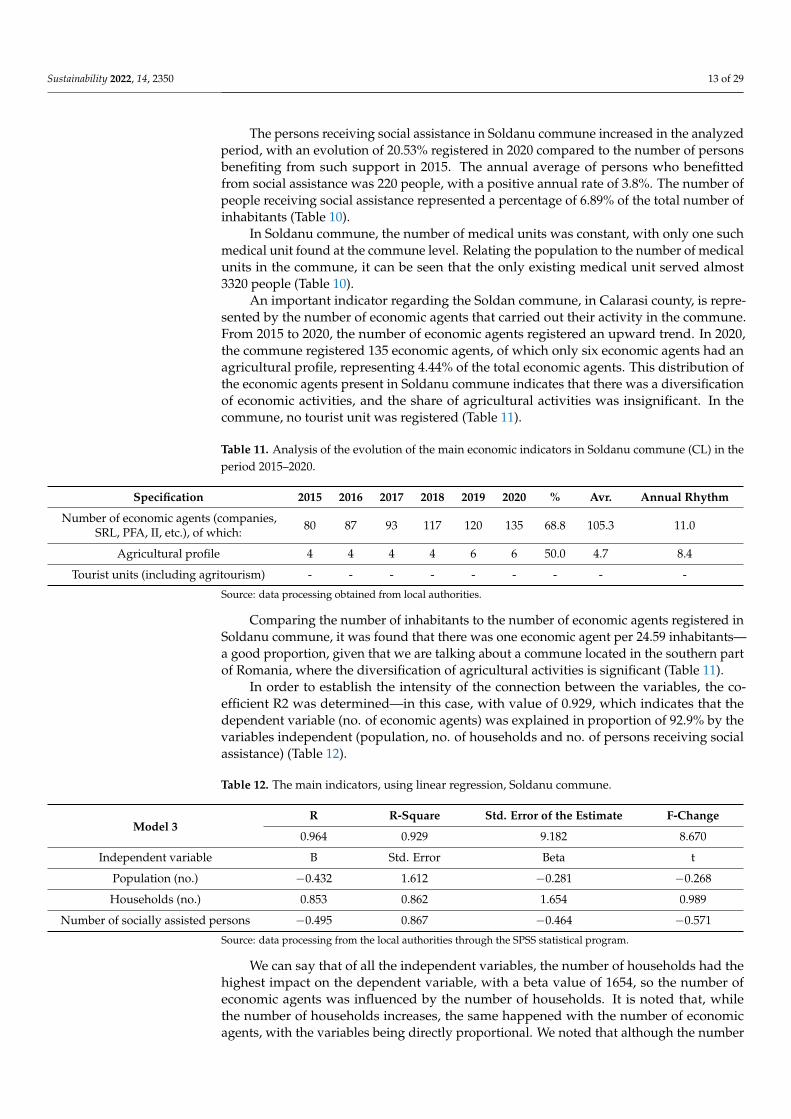
If the data on the basis of which the values were introduced in the Vensim simulationprogram remain constant, we can say that within 10 years the population of Nicolae Balescuwill register a significant decrease, reaching approximately 1400 inhabitants (Figure 6).
Sustainability 2022, 14, x FOR PEER REVIEW 13 of 30
Balescu will register a significant decrease, reaching approximately 1400 inhabitants (Fig-ure 6).
Figure 6. The result of the simulation regarding the evolution of the population in Nicolae Balcescu for a period of 10 years. Source: data processing from the local authorities.
4.1.3. Case Study 3. Soldanu Locality In Soldanu commune, no births were registered in the period analyzed. Regarding
the number of deceased persons, a downward trend was registered in 2020 compared to 2015, with a decrease of 28.81%. On average, in the analyzed period, 43 people died every year (Table 10).
Table 10. Analysis of the evolution of the main demographic indicators in Soldanu commune (CL) in the period 2015–2020.
Specification 2015 2016 2017 2018 2019 2020 % Avr. Annual Rhythm
Population (no inhabitants) 3280 3290 3300 3300 3310 3320 1.22 3300 0.2 Households (no.) 1432 1470 1491 1520 1531 1544 7.82 1498 1.5
Birth rate (no. of newborns) 0 0 0 0 0 0 - - - Mortality (no. deaths) 59 38 47 46 28 42 −28.81 43 −6.6
No. persons receiving social assistance 190 203 220 240 240 229 20.53 220 3.8 No. dispensaries/medical units 1 1 1 1 1 1 0.00 1 0.0
Source: data processing obtained from local authorities.
The persons receiving social assistance in Soldanu commune increased in the ana-lyzed period, with an evolution of 20.53% registered in 2020 compared to the number of persons benefiting from such support in 2015. The annual average of persons who bene-fitted from social assistance was 220 people, with a positive annual rate of 3.8%. The num-ber of people receiving social assistance represented a percentage of 6.89% of the total number of inhabitants (Table 10).
In Soldanu commune, the number of medical units was constant, with only one such medical unit found at the commune level. Relating the population to the number of med-ical units in the commune, it can be seen that the only existing medical unit served almost 3320 people (Table 10).
An important indicator regarding the Soldan commune, in Calarasi county, is repre-sented by the number of economic agents that carried out their activity in the commune. From 2015 to 2020, the number of economic agents registered an upward trend. In 2020, the commune registered 135 economic agents, of which only six economic agents had an agricultural profile, representing 4.44% of the total economic agents. This distribution of the economic agents present in Soldanu commune indicates that there was a diversifica-tion of economic activities, and the share of agricultural activities was insignificant. In the commune, no tourist unit was registered (Table 11).
Figure 6. The result of the simulation regarding the evolution of the population in Nicolae Balcescufor a period of 10 years. Source: data processing from the local authorities.
4.1.3. Case Study 3. Soldanu Locality
In Soldanu commune, no births were registered in the period analyzed. Regardingthe number of deceased persons, a downward trend was registered in 2020 compared to2015, with a decrease of 28.81%. On average, in the analyzed period, 43 people died everyyear (Table 10).
Table 10. Analysis of the evolution of the main demographic indicators in Soldanu commune (CL) inthe period 2015–2020.
Specification 2015 2016 2017 2018 2019 2020 % Avr. Annual Rhythm
Population (no inhabitants) 3280 3290 3300 3300 3310 3320 1.22 3300 0.2
Households (no.) 1432 1470 1491 1520 1531 1544 7.82 1498 1.5
Birth rate (no. of newborns) 0 0 0 0 0 0 - - -
Mortality (no. deaths) 59 38 47 46 28 42 −28.81 43 −6.6
No. persons receiving social assistance 190 203 220 240 240 229 20.53 220 3.8
No. dispensaries/medical units 1 1 1 1 1 1 0.00 1 0.0
Source: data processing obtained from local authorities.
Sustainability 2022, 14, 2350 13 of 29
The persons receiving social assistance in Soldanu commune increased in the analyzedperiod, with an evolution of 20.53% registered in 2020 compared to the number of personsbenefiting from such support in 2015. The annual average of persons who benefittedfrom social assistance was 220 people, with a positive annual rate of 3.8%. The number ofpeople receiving social assistance represented a percentage of 6.89% of the total number ofinhabitants (Table 10).
In Soldanu commune, the number of medical units was constant, with only one suchmedical unit found at the commune level. Relating the population to the number of medicalunits in the commune, it can be seen that the only existing medical unit served almost3320 people (Table 10).
An important indicator regarding the Soldan commune, in Calarasi county, is repre-sented by the number of economic agents that carried out their activity in the commune.From 2015 to 2020, the number of economic agents registered an upward trend. In 2020,the commune registered 135 economic agents, of which only six economic agents had anagricultural profile, representing 4.44% of the total economic agents. This distribution ofthe economic agents present in Soldanu commune indicates that there was a diversificationof economic activities, and the share of agricultural activities was insignificant. In thecommune, no tourist unit was registered (Table 11).
Table 11. Analysis of the evolution of the main economic indicators in Soldanu commune (CL) in theperiod 2015–2020.
Specification 2015 2016 2017 2018 2019 2020 % Avr. Annual Rhythm
Number of economic agents (companies,SRL, PFA, II, etc.), of which: 80 87 93 117 120 135 68.8 105.3 11.0
Agricultural profile 4 4 4 4 6 6 50.0 4.7 8.4
Tourist units (including agritourism) - - - - - - - - -
Source: data processing obtained from local authorities.
Comparing the number of inhabitants to the number of economic agents registered inSoldanu commune, it was found that there was one economic agent per 24.59 inhabitants—a good proportion, given that we are talking about a commune located in the southern partof Romania, where the diversification of agricultural activities is significant (Table 11).
In order to establish the intensity of the connection between the variables, the co-efficient R2 was determined—in this case, with value of 0.929, which indicates that thedependent variable (no. of economic agents) was explained in proportion of 92.9% by thevariables independent (population, no. of households and no. of persons receiving socialassistance) (Table 12).
Table 12. The main indicators, using linear regression, Soldanu commune.
Model 3R R-Square Std. Error of the Estimate F-Change
0.964 0.929 9.182 8.670
Independent variable B Std. Error Beta t
Population (no.) −0.432 1.612 −0.281 −0.268
Households (no.) 0.853 0.862 1.654 0.989
Number of socially assisted persons −0.495 0.867 −0.464 −0.571
Source: data processing from the local authorities through the SPSS statistical program.
We can say that of all the independent variables, the number of households had thehighest impact on the dependent variable, with a beta value of 1654, so the number ofeconomic agents was influenced by the number of households. It is noted that, whilethe number of households increases, the same happened with the number of economicagents, with the variables being directly proportional. We noted that although the number
Sustainability 2022, 14, 2350 14 of 29
of deaths was high, the population seemed to remain constant, which can explained bythe fact that the town managed to attract people from other towns who wanted to starteconomic activities due to the location of the commune, being located halfway betweenBucharest and Oltenita (near the Danube River) (Table 12).
In addition, the beta coefficient (−0.464) regarding the independent variable ”no. ofpeople receiving social assistance” had a high impact on the dependent variable, so wecan say that the number of economic agents was influenced by the number of peoplereceiving social assistance, being inversely proportional. By increasing the number ofeconomic agents, jobs are created, to which the persons belonging to this category can beintroduced (Table 12).
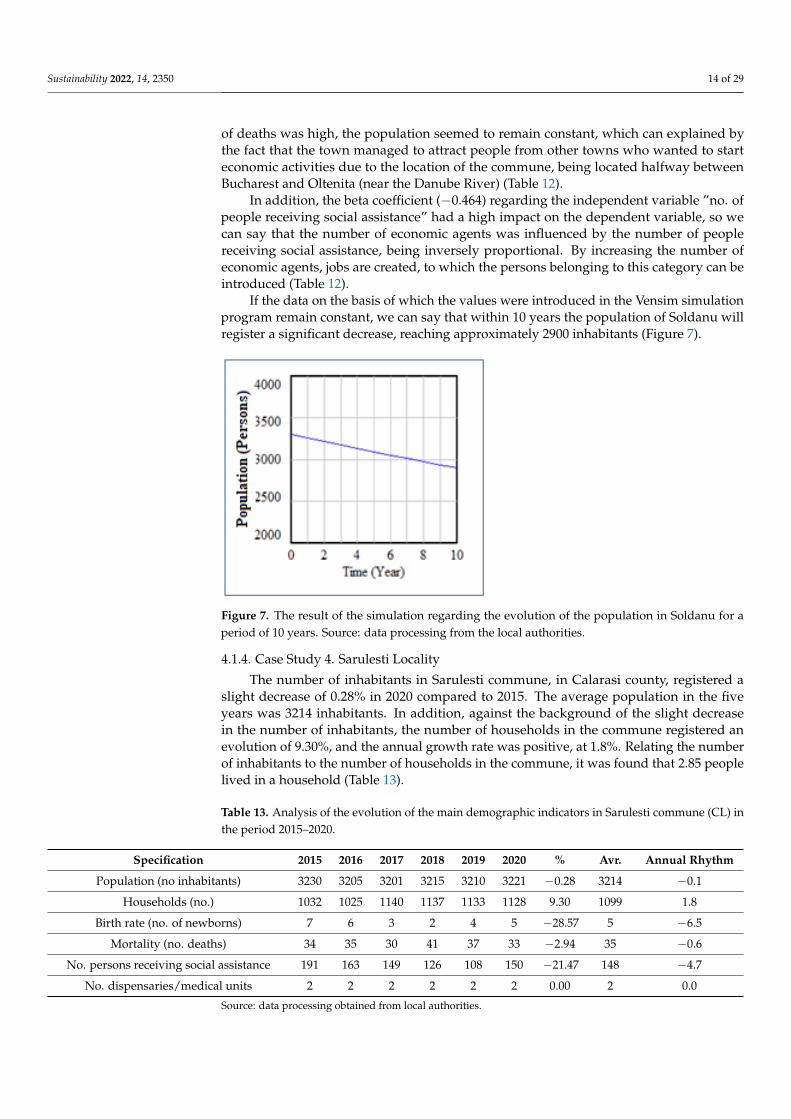
If the data on the basis of which the values were introduced in the Vensim simulationprogram remain constant, we can say that within 10 years the population of Soldanu willregister a significant decrease, reaching approximately 2900 inhabitants (Figure 7).
Sustainability 2022, 14, x FOR PEER REVIEW 15 of 30
Figure 7. The result of the simulation regarding the evolution of the population in Soldanu for a period of 10 years. Source: data processing from the local authorities.
4.1.4. Case Study 4. Sarulesti Locality The number of inhabitants in Sarulesti commune, in Calarasi county, registered a
slight decrease of 0.28% in 2020 compared to 2015. The average population in the five years was 3214 inhabitants. In addition, against the background of the slight decrease in the number of inhabitants, the number of households in the commune registered an evo-lution of 9.30%, and the annual growth rate was positive, at 1.8%. Relating the number of inhabitants to the number of households in the commune, it was found that 2.85 people lived in a household (Table 13).
Table 13. Analysis of the evolution of the main demographic indicators in Sarulesti commune (CL) in the period 2015–2020.
Specification 2015 2016 2017 2018 2019 2020 % Avr. Annual Rhythm
Population (no inhabitants) 3230 3205 3201 3215 3210 3221 −0.28 3214 −0.1 Households (no.) 1032 1025 1140 1137 1133 1128 9.30 1099 1.8
Birth rate (no. of newborns) 7 6 3 2 4 5 −28.57 5 −6.5 Mortality (no. deaths) 34 35 30 41 37 33 −2.94 35 −0.6
No. persons receiving social assistance 191 163 149 126 108 150 −21.47 148 −4.7 No. dispensaries/medical units 2 2 2 2 2 2 0.00 2 0.0
Source: data processing obtained from local authorities.
In Sarulesti commune, in the five years analyzed, the birth rate registered a signifi-cant decrease. In 2020 28.57% fewer children were born than in 2015. Regarding the num-ber of deceased persons, a downward trend was registered in 2020 compared to 2015, with a decrease of 2.94%. On average, 35 people died per year during the analyzed period. Analyzing comparatively the number of newborns with the number of people who lost their lives in 2020, it was found that the number of deceased persons was six times higher than that of newborns (Table 13). The persons receiving social assistance in Sarulesti com-mune decreased in the analyzed period, registering in 2020 a decrease of 21.45% compared to the number of persons benefiting from such support in 2015. The annual average of persons benefitting from social assistance was 148 people, with a negative annual rate of 4.7%. The number of people receiving social assistance represented a percentage of 4.65% of the total number of inhabitants (Table 13). In Sarulesti commune the number of medical units was constant, with two such medical units at the commune level. Relating the pop-ulation to the number of medical units in the commune, it can be seen that one medical unit served almost 1610 people (Table 13).
Figure 7. The result of the simulation regarding the evolution of the population in Soldanu for aperiod of 10 years. Source: data processing from the local authorities.
4.1.4. Case Study 4. Sarulesti Locality
The number of inhabitants in Sarulesti commune, in Calarasi county, registered aslight decrease of 0.28% in 2020 compared to 2015. The average population in the fiveyears was 3214 inhabitants. In addition, against the background of the slight decreasein the number of inhabitants, the number of households in the commune registered anevolution of 9.30%, and the annual growth rate was positive, at 1.8%. Relating the numberof inhabitants to the number of households in the commune, it was found that 2.85 peoplelived in a household (Table 13).
Table 13. Analysis of the evolution of the main demographic indicators in Sarulesti commune (CL) inthe period 2015–2020.
Specification 2015 2016 2017 2018 2019 2020 % Avr. Annual Rhythm
Population (no inhabitants) 3230 3205 3201 3215 3210 3221 −0.28 3214 −0.1
Households (no.) 1032 1025 1140 1137 1133 1128 9.30 1099 1.8
Birth rate (no. of newborns) 7 6 3 2 4 5 −28.57 5 −6.5
Mortality (no. deaths) 34 35 30 41 37 33 −2.94 35 −0.6
No. persons receiving social assistance 191 163 149 126 108 150 −21.47 148 −4.7
No. dispensaries/medical units 2 2 2 2 2 2 0.00 2 0.0
Source: data processing obtained from local authorities.
Sustainability 2022, 14, 2350 15 of 29
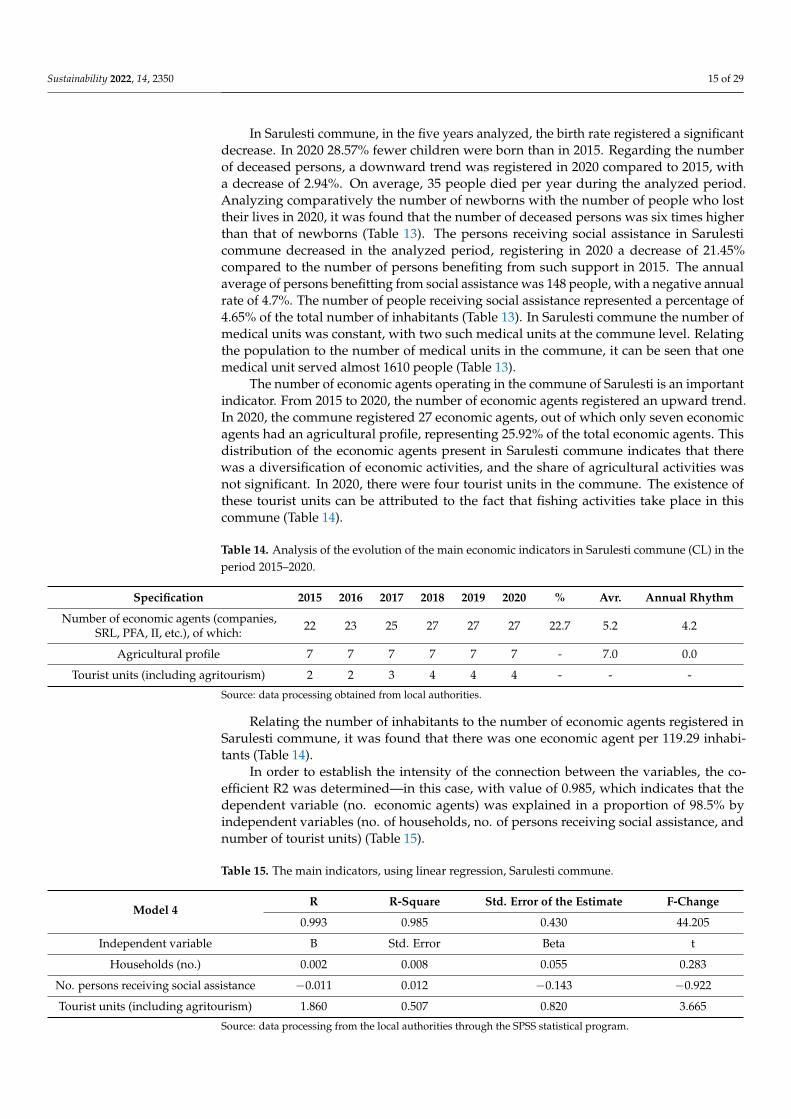
In Sarulesti commune, in the five years analyzed, the birth rate registered a significantdecrease. In 2020 28.57% fewer children were born than in 2015. Regarding the numberof deceased persons, a downward trend was registered in 2020 compared to 2015, witha decrease of 2.94%. On average, 35 people died per year during the analyzed period.Analyzing comparatively the number of newborns with the number of people who losttheir lives in 2020, it was found that the number of deceased persons was six times higherthan that of newborns (Table 13). The persons receiving social assistance in Sarulesticommune decreased in the analyzed period, registering in 2020 a decrease of 21.45%compared to the number of persons benefiting from such support in 2015. The annualaverage of persons benefitting from social assistance was 148 people, with a negative annualrate of 4.7%. The number of people receiving social assistance represented a percentage of4.65% of the total number of inhabitants (Table 13). In Sarulesti commune the number ofmedical units was constant, with two such medical units at the commune level. Relatingthe population to the number of medical units in the commune, it can be seen that onemedical unit served almost 1610 people (Table 13).
The number of economic agents operating in the commune of Sarulesti is an importantindicator. From 2015 to 2020, the number of economic agents registered an upward trend.In 2020, the commune registered 27 economic agents, out of which only seven economicagents had an agricultural profile, representing 25.92% of the total economic agents. Thisdistribution of the economic agents present in Sarulesti commune indicates that therewas a diversification of economic activities, and the share of agricultural activities wasnot significant. In 2020, there were four tourist units in the commune. The existence ofthese tourist units can be attributed to the fact that fishing activities take place in thiscommune (Table 14).
Table 14. Analysis of the evolution of the main economic indicators in Sarulesti commune (CL) in theperiod 2015–2020.
Specification 2015 2016 2017 2018 2019 2020 % Avr. Annual Rhythm
Number of economic agents (companies,SRL, PFA, II, etc.), of which: 22 23 25 27 27 27 22.7 5.2 4.2
Agricultural profile 7 7 7 7 7 7 - 7.0 0.0
Tourist units (including agritourism) 2 2 3 4 4 4 - - -
Source: data processing obtained from local authorities.
Relating the number of inhabitants to the number of economic agents registered inSarulesti commune, it was found that there was one economic agent per 119.29 inhabi-tants (Table 14).
In order to establish the intensity of the connection between the variables, the co-efficient R2 was determined—in this case, with value of 0.985, which indicates that thedependent variable (no. economic agents) was explained in a proportion of 98.5% byindependent variables (no. of households, no. of persons receiving social assistance, andnumber of tourist units) (Table 15).
Table 15. The main indicators, using linear regression, Sarulesti commune.
Model 4R R-Square Std. Error of the Estimate F-Change
0.993 0.985 0.430 44.205
Independent variable B Std. Error Beta t
Households (no.) 0.002 0.008 0.055 0.283
No. persons receiving social assistance −0.011 0.012 −0.143 −0.922
Tourist units (including agritourism) 1.860 0.507 0.820 3.665
Source: data processing from the local authorities through the SPSS statistical program.
Sustainability 2022, 14, 2350 16 of 29
We can say that of all the independent variables, the number of tourist units had thehighest impact on the dependent variable, with a beta value of 0.820, so the number ofeconomic agents was influenced by the number of tourist units. It was noted that the twovariables were directly proportional, so when the number of economic agents increased,there was an increase in tourist units. The fact that the Sarulesti locality benefits fromfavorable conditions for the establishment of these types of economic activities is alsoreflected by the total number of economic agents at the locality level (Table 15).
In addition, the beta coefficient (−0.143) regarding the independent variable “no.people receiving social assistance” had a high impact on the dependent variable, so wecan say that the number of economic agents was influenced by the number of peoplereceiving social assistance, being inversely proportional. By increasing the number ofeconomic agents, jobs are created to which the persons belonging to this category can beintroduced (Table 15).
If the data based on which the values were entered in the Vensim simulation programremain constant, we can say that within 10 years the population of Sarulesti will register asignificant decrease, reaching approximately 2900 inhabitants (Figure 8).
Sustainability 2022, 14, x FOR PEER REVIEW 17 of 30
If the data based on which the values were entered in the Vensim simulation program remain constant, we can say that within 10 years the population of Sarulesti will register a significant decrease, reaching approximately 2900 inhabitants (Figure 8).
Figure 8. The result of the simulation regarding the evolution of the population in Sarulesti for a period of 10 years. Source: data processing from the local authorities.
4.2. Results of Socio-Economic Analysis of Rural Localities Determined in Timis County 4.2.1. Case Study 5. Sanmihaiu Roman Locality
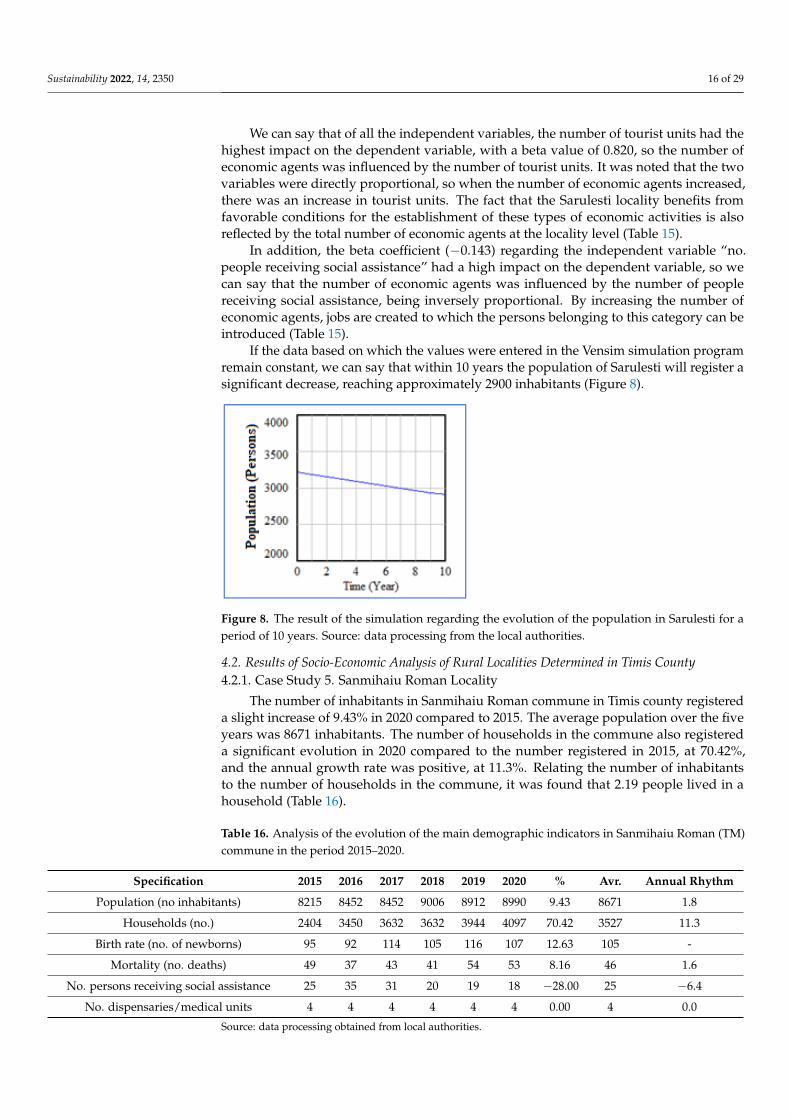
The number of inhabitants in Sanmihaiu Roman commune in Timis county registered a slight increase of 9.43% in 2020 compared to 2015. The average population over the five years was 8671 inhabitants. The number of households in the commune also registered a significant evolution in 2020 compared to the number registered in 2015, at 70.42%, and the annual growth rate was positive, at 11.3%. Relating the number of inhabitants to the number of households in the commune, it was found that 2.19 people lived in a household (Table 16).
In Sanmihaiu Roman commune in the five years analyzed, the birth rate registered a significant evolution. In 2020 12.63% more children were born than in 2015. Regarding the number of deceased persons, an ascending trend was registered in 2020 compared to 2015, at an evolution of 8.16%. On average, 46 people per year died during the analyzed period. Analyzing the number of newborns compared to the number of people who lost their lives in 2020, it was found that the number of newborns was two times higher than the number of people who lost their lives (Table 16).
Table 16. Analysis of the evolution of the main demographic indicators in Sanmihaiu Roman (TM) commune in the period 2015–2020.
Specification 2015 2016 2017 2018 2019 2020 % Avr. Annual Rhythm
Population (no inhabitants) 8215 8452 8452 9006 8912 8990 9.43 8671 1.8 Households (no.) 2404 3450 3632 3632 3944 4097 70.42 3527 11.3
Birth rate (no. of newborns) 95 92 114 105 116 107 12.63 105 - Mortality (no. deaths) 49 37 43 41 54 53 8.16 46 1.6
No. persons receiving social assistance 25 35 31 20 19 18 −28.00 25 −6.4 No. dispensaries/medical units 4 4 4 4 4 4 0.00 4 0.0
Source: data processing obtained from local authorities.
The persons receiving social assistance in Sanmihaiu Roman commune decreased in the analyzed period, with a 28% decrease registered in 2020 compared to the number of persons benefiting from such support in 2015. Annual average of persons benefit from social assistance is 25 people, with a negative annual rate of 6.4%. The number of people receiving social assistance represents a percentage of 0.20% of the total number of inhab-itants (Table 16).
Figure 8. The result of the simulation regarding the evolution of the population in Sarulesti for aperiod of 10 years. Source: data processing from the local authorities.
4.2. Results of Socio-Economic Analysis of Rural Localities Determined in Timis County4.2.1. Case Study 5. Sanmihaiu Roman Locality
The number of inhabitants in Sanmihaiu Roman commune in Timis county registereda slight increase of 9.43% in 2020 compared to 2015. The average population over the fiveyears was 8671 inhabitants. The number of households in the commune also registereda significant evolution in 2020 compared to the number registered in 2015, at 70.42%,and the annual growth rate was positive, at 11.3%. Relating the number of inhabitantsto the number of households in the commune, it was found that 2.19 people lived in ahousehold (Table 16).
Table 16. Analysis of the evolution of the main demographic indicators in Sanmihaiu Roman (TM)commune in the period 2015–2020.
Specification 2015 2016 2017 2018 2019 2020 % Avr. Annual Rhythm
Population (no inhabitants) 8215 8452 8452 9006 8912 8990 9.43 8671 1.8
Households (no.) 2404 3450 3632 3632 3944 4097 70.42 3527 11.3
Birth rate (no. of newborns) 95 92 114 105 116 107 12.63 105 -
Mortality (no. deaths) 49 37 43 41 54 53 8.16 46 1.6
No. persons receiving social assistance 25 35 31 20 19 18 −28.00 25 −6.4
No. dispensaries/medical units 4 4 4 4 4 4 0.00 4 0.0
Source: data processing obtained from local authorities.
Sustainability 2022, 14, 2350 17 of 29
In Sanmihaiu Roman commune in the five years analyzed, the birth rate registered asignificant evolution. In 2020 12.63% more children were born than in 2015. Regarding thenumber of deceased persons, an ascending trend was registered in 2020 compared to 2015,at an evolution of 8.16%. On average, 46 people per year died during the analyzed period.Analyzing the number of newborns compared to the number of people who lost their livesin 2020, it was found that the number of newborns was two times higher than the numberof people who lost their lives (Table 16).
The persons receiving social assistance in Sanmihaiu Roman commune decreasedin the analyzed period, with a 28% decrease registered in 2020 compared to the numberof persons benefiting from such support in 2015. Annual average of persons benefitfrom social assistance is 25 people, with a negative annual rate of 6.4%. The number ofpeople receiving social assistance represents a percentage of 0.20% of the total number ofinhabitants (Table 16).
In Sanmihaiu Roman commune, the number of medical units was constant, with fourin the commune. Relating the population to the number of medical units in the commune,it can be seen that one medical unit served almost 2247 people (Table 16).
The number of economic agents operating in Sanmihaiu Roman commune is animportant indicator. From 2015 to 2020, the number of economic agents registered anupward trend. In 2020, the commune registered 552 economic agents, out of which only 10economic agents had an agricultural profile, representing 1.81% of the total economic agents.This distribution of the economic agents present in Sanmihaiu Roman commune indicatesthat there was a diversification of economic activities, and the share of agricultural activitieswas insignificant. In 2020 there was only one tourist unit in the commune (Table 17).
Table 17. Analysis of the evolution of the main economic indicators in Sanmihaiu (TM) commune inthe period 2015–2020.
Specification 2015 2016 2017 2018 2019 2020 % Avr. Annual Rhythm
Number of economic agents (companies,SRL, PFA, II, etc.), of which: 323 436 445 474 527 552 70.9 486.8 11.3
Agricultural profile 8 9 10 10 10 10 25.0 9.5 4.6
Tourist units (including agritourism) 1 1 1 1 1 1 - - -
Source: data processing obtained from local authorities.
Comparing the number of inhabitants to the number of economic agents registeredin Sanmihaiu Roman commune, it was found that there was one economic agent per16.28 inhabitants (Table 17).
In order to establish the intensity of the link between the variables, the coefficientR2 was determined—in this case, with value of 0.908, which indicates that the dependentvariable (population) was explained in a proportion of 90.8% by the independent variables(no. of households, number of persons receiving social assistance, and number of economicagents) (Table 18).
Table 18. The main indicators, using linear regression, Sanmihaiu Roman commune.
Model 5R R-Square Std. Error of the Estimate F-Change
0.953 0.908 163.124 6.548
Independent variable B Std. Error Beta t
Households (no.) 0.308 0.328 0.543 0.941
No. persons receiving social assistance −25.356 11.238 −0.523 −2.256
Economic agents with agricultural profile 39.181 237.383 0.097 0.165
Source: data processing from the local authorities through the SPSS statistical program.
Sustainability 2022, 14, 2350 18 of 29
We can say that of all the independent variables, the number of households had thehighest impact on the dependent variable, with a beta value of 543, so the population wasinfluenced by the number of households. It was noted that the two variables were directlyproportional, so as the population grew there was an increase in households (Table 18).
In addition, the beta coefficient (−0.523) regarding the independent variable “no.people receiving social assistance” had a high impact on the dependent variable, so we cansay that the population was influenced by the number of people receiving social assistance,being inversely proportional (Table 18).
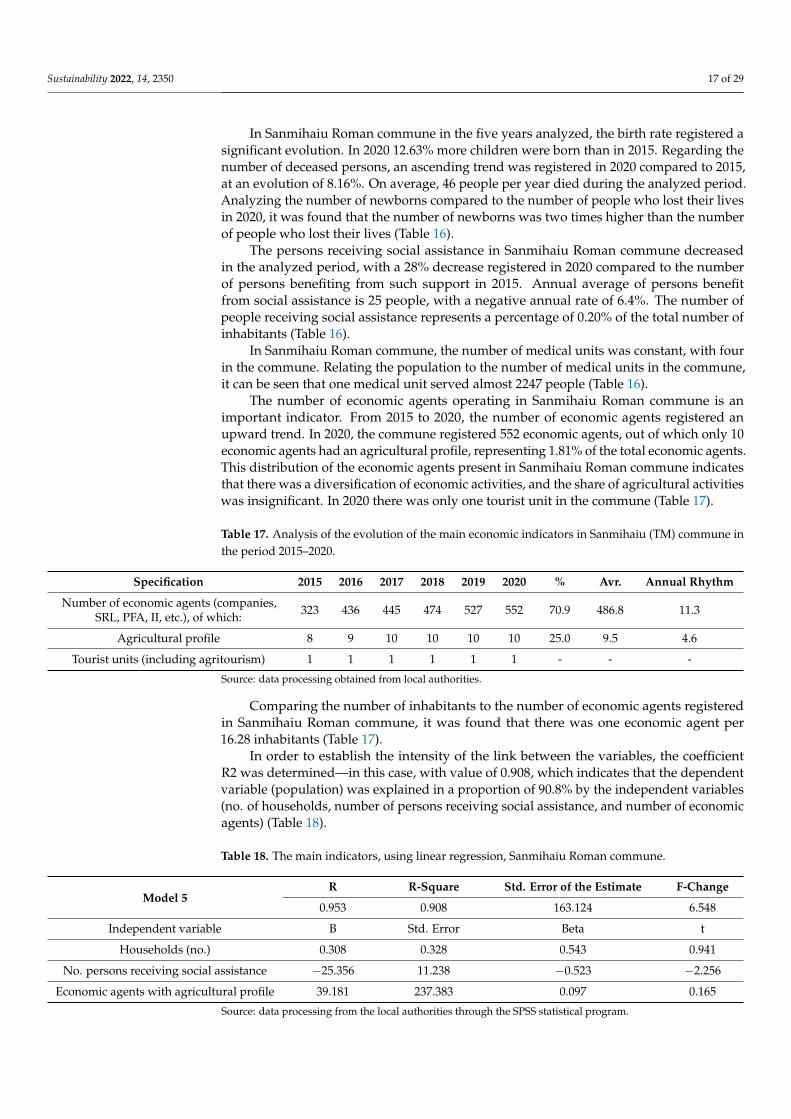
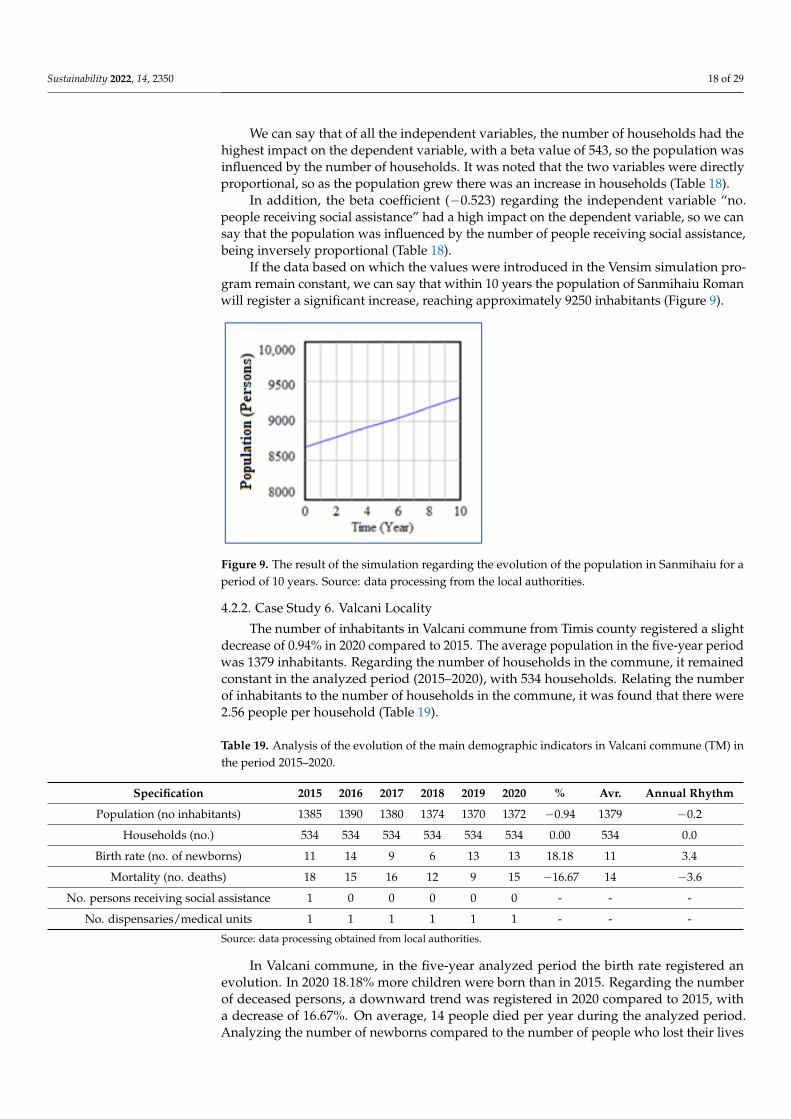
If the data based on which the values were introduced in the Vensim simulation pro-gram remain constant, we can say that within 10 years the population of Sanmihaiu Romanwill register a significant increase, reaching approximately 9250 inhabitants (Figure 9).
Sustainability 2022, 14, x FOR PEER REVIEW 19 of 30
If the data based on which the values were introduced in the Vensim simulation pro-gram remain constant, we can say that within 10 years the population of Sanmihaiu Ro-man will register a significant increase, reaching approximately 9250 inhabitants (Figure 9).
Figure 9. The result of the simulation regarding the evolution of the population in Sanmihaiu for a period of 10 years. Source: data processing from the local authorities.
4.2.2. Case Study 6. Valcani Locality The number of inhabitants in Valcani commune from Timis county registered a slight
decrease of 0.94% in 2020 compared to 2015. The average population in the five-year pe-riod was 1379 inhabitants. Regarding the number of households in the commune, it re-mained constant in the analyzed period (2015–2020), with 534 households. Relating the number of inhabitants to the number of households in the commune, it was found that there were 2.56 people per household (Table 19).
Table 19. Analysis of the evolution of the main demographic indicators in Valcani commune (TM) in the period 2015–2020.
Specification 2015 2016 2017 2018 2019 2020 % Avr. Annual Rhythm
Population (no inhabitants) 1385 1390 1380 1374 1370 1372 −0.94 1379 −0.2 Households (no.) 534 534 534 534 534 534 0.00 534 0.0
Birth rate (no. of newborns) 11 14 9 6 13 13 18.18 11 3.4 Mortality (no. deaths) 18 15 16 12 9 15 −16.67 14 −3.6
No. persons receiving social assistance 1 0 0 0 0 0 - - - No. dispensaries/medical units 1 1 1 1 1 1 - - -
Source: data processing obtained from local authorities.
In Valcani commune, in the five-year analyzed period the birth rate registered an evolution. In 2020 18.18% more children were born than in 2015. Regarding the number of deceased persons, a downward trend was registered in 2020 compared to 2015, with a decrease of 16.67%. On average, 14 people died per year during the analyzed period. An-alyzing the number of newborns compared to the number of people who lost their lives in 2020, it was found that the number of newborns was exceeded by the number of people who lost their lives (Table 19).
In the commune of Valcani in Timis county, in the analyzed period there was only one person with social assistance in 2015; after this year there was no other beneficiary of social benefits (Table 19).
In Valcani commune, the number of medical units was constant, with only one such medical unit. Relating the population to the number of medical units in the commune, it can be seen that one medical unit served 1372 people (Table 19).
Figure 9. The result of the simulation regarding the evolution of the population in Sanmihaiu for aperiod of 10 years. Source: data processing from the local authorities.
4.2.2. Case Study 6. Valcani Locality
The number of inhabitants in Valcani commune from Timis county registered a slightdecrease of 0.94% in 2020 compared to 2015. The average population in the five-year periodwas 1379 inhabitants. Regarding the number of households in the commune, it remainedconstant in the analyzed period (2015–2020), with 534 households. Relating the numberof inhabitants to the number of households in the commune, it was found that there were2.56 people per household (Table 19).
Table 19. Analysis of the evolution of the main demographic indicators in Valcani commune (TM) inthe period 2015–2020.
Specification 2015 2016 2017 2018 2019 2020 % Avr. Annual Rhythm
Population (no inhabitants) 1385 1390 1380 1374 1370 1372 −0.94 1379 −0.2
Households (no.) 534 534 534 534 534 534 0.00 534 0.0
Birth rate (no. of newborns) 11 14 9 6 13 13 18.18 11 3.4
Mortality (no. deaths) 18 15 16 12 9 15 −16.67 14 −3.6
No. persons receiving social assistance 1 0 0 0 0 0 - - -
No. dispensaries/medical units 1 1 1 1 1 1 - - -
Source: data processing obtained from local authorities.
In Valcani commune, in the five-year analyzed period the birth rate registered anevolution. In 2020 18.18% more children were born than in 2015. Regarding the numberof deceased persons, a downward trend was registered in 2020 compared to 2015, witha decrease of 16.67%. On average, 14 people died per year during the analyzed period.Analyzing the number of newborns compared to the number of people who lost their lives
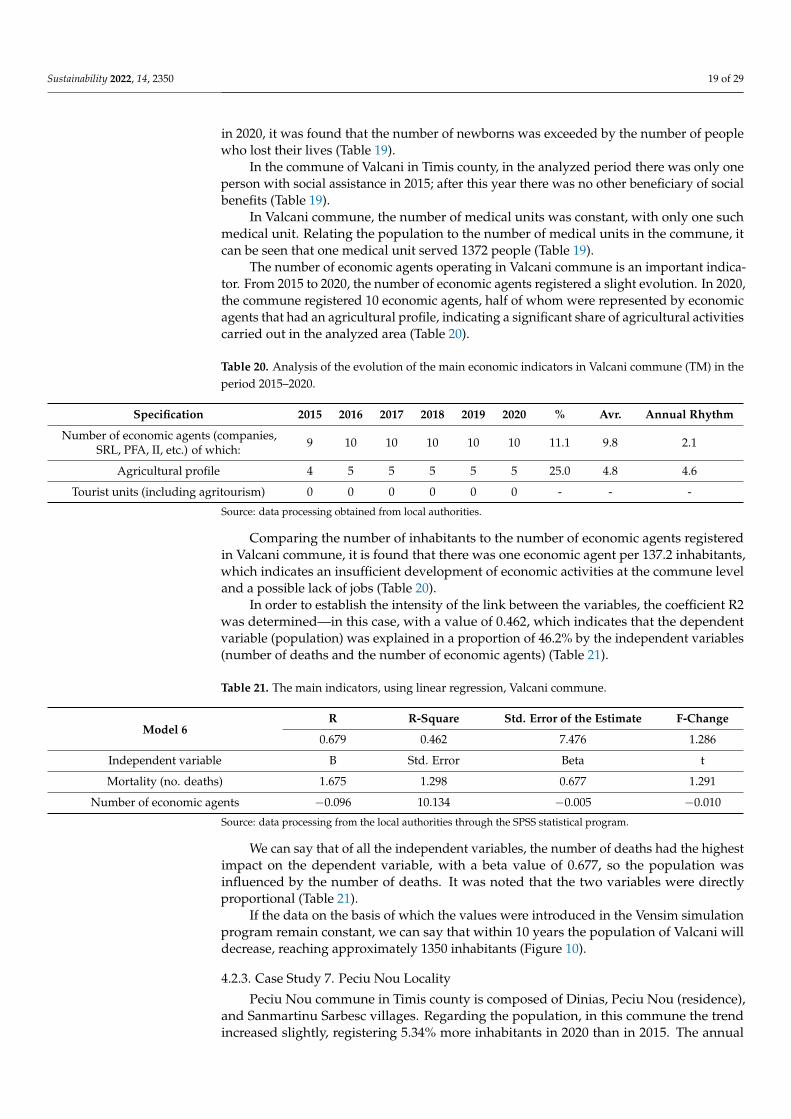
Sustainability 2022, 14, 2350 19 of 29
in 2020, it was found that the number of newborns was exceeded by the number of peoplewho lost their lives (Table 19).
In the commune of Valcani in Timis county, in the analyzed period there was only oneperson with social assistance in 2015; after this year there was no other beneficiary of socialbenefits (Table 19).
In Valcani commune, the number of medical units was constant, with only one suchmedical unit. Relating the population to the number of medical units in the commune, itcan be seen that one medical unit served 1372 people (Table 19).
The number of economic agents operating in Valcani commune is an important indica-tor. From 2015 to 2020, the number of economic agents registered a slight evolution. In 2020,the commune registered 10 economic agents, half of whom were represented by economicagents that had an agricultural profile, indicating a significant share of agricultural activitiescarried out in the analyzed area (Table 20).
Table 20. Analysis of the evolution of the main economic indicators in Valcani commune (TM) in theperiod 2015–2020.
Specification 2015 2016 2017 2018 2019 2020 % Avr. Annual Rhythm
Number of economic agents (companies,SRL, PFA, II, etc.) of which: 9 10 10 10 10 10 11.1 9.8 2.1
Agricultural profile 4 5 5 5 5 5 25.0 4.8 4.6
Tourist units (including agritourism) 0 0 0 0 0 0 - - -
Source: data processing obtained from local authorities.
Comparing the number of inhabitants to the number of economic agents registeredin Valcani commune, it is found that there was one economic agent per 137.2 inhabitants,which indicates an insufficient development of economic activities at the commune leveland a possible lack of jobs (Table 20).
In order to establish the intensity of the link between the variables, the coefficient R2was determined—in this case, with a value of 0.462, which indicates that the dependentvariable (population) was explained in a proportion of 46.2% by the independent variables(number of deaths and the number of economic agents) (Table 21).
Table 21. The main indicators, using linear regression, Valcani commune.
Model 6R R-Square Std. Error of the Estimate F-Change
0.679 0.462 7.476 1.286
Independent variable B Std. Error Beta t
Mortality (no. deaths) 1.675 1.298 0.677 1.291
Number of economic agents −0.096 10.134 −0.005 −0.010
Source: data processing from the local authorities through the SPSS statistical program.
We can say that of all the independent variables, the number of deaths had the highestimpact on the dependent variable, with a beta value of 0.677, so the population wasinfluenced by the number of deaths. It was noted that the two variables were directlyproportional (Table 21).
If the data on the basis of which the values were introduced in the Vensim simulationprogram remain constant, we can say that within 10 years the population of Valcani willdecrease, reaching approximately 1350 inhabitants (Figure 10).
4.2.3. Case Study 7. Peciu Nou Locality
Peciu Nou commune in Timis county is composed of Dinias, Peciu Nou (residence),and Sanmartinu Sarbesc villages. Regarding the population, in this commune the trendincreased slightly, registering 5.34% more inhabitants in 2020 than in 2015. The annual
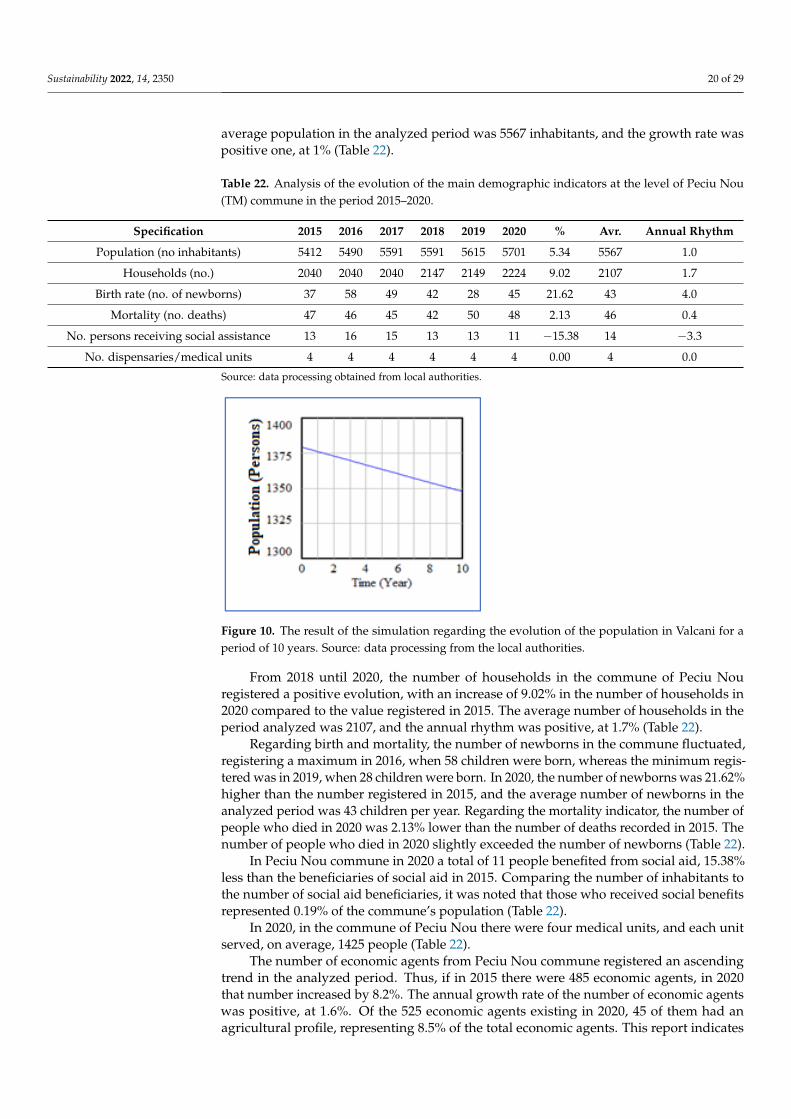
Sustainability 2022, 14, 2350 20 of 29
average population in the analyzed period was 5567 inhabitants, and the growth rate waspositive one, at 1% (Table 22).
Table 22. Analysis of the evolution of the main demographic indicators at the level of Peciu Nou(TM) commune in the period 2015–2020.
Specification 2015 2016 2017 2018 2019 2020 % Avr. Annual Rhythm
Population (no inhabitants) 5412 5490 5591 5591 5615 5701 5.34 5567 1.0
Households (no.) 2040 2040 2040 2147 2149 2224 9.02 2107 1.7
Birth rate (no. of newborns) 37 58 49 42 28 45 21.62 43 4.0
Mortality (no. deaths) 47 46 45 42 50 48 2.13 46 0.4
No. persons receiving social assistance 13 16 15 13 13 11 −15.38 14 −3.3
No. dispensaries/medical units 4 4 4 4 4 4 0.00 4 0.0
Source: data processing obtained from local authorities.
Sustainability 2022, 14, x FOR PEER REVIEW 21 of 30
Figure 10. The result of the simulation regarding the evolution of the population in Valcani for a period of 10 years. Source: data processing from the local authorities.
4.2.3. Case Study 7. Peciu Nou Locality Peciu Nou commune in Timis county is composed of Dinias, Peciu Nou (residence),
and Sanmartinu Sarbesc villages. Regarding the population, in this commune the trend increased slightly, registering 5.34% more inhabitants in 2020 than in 2015. The annual average population in the analyzed period was 5567 inhabitants, and the growth rate was positive one, at 1% (Table 22).
Table 22. Analysis of the evolution of the main demographic indicators at the level of Peciu Nou (TM) commune in the period 2015–2020.
Specification 2015 2016 2017 2018 2019 2020 % Avr. Annual Rhythm
Population (no inhabitants) 5412 5490 5591 5591 5615 5701 5.34 5567 1.0 Households (no.) 2040 2040 2040 2147 2149 2224 9.02 2107 1.7
Birth rate (no. of newborns) 37 58 49 42 28 45 21.62 43 4.0 Mortality (no. deaths) 47 46 45 42 50 48 2.13 46 0.4
No. persons receiving social assistance 13 16 15 13 13 11 −15.38 14 −3.3 No. dispensaries/medical units 4 4 4 4 4 4 0.00 4 0.0
Source: data processing obtained from local authorities.
From 2018 until 2020, the number of households in the commune of Peciu Nou reg-istered a positive evolution, with an increase of 9.02% in the number of households in 2020 compared to the value registered in 2015. The average number of households in the period analyzed was 2107, and the annual rhythm was positive, at 1.7% (Table 22).
Regarding birth and mortality, the number of newborns in the commune fluctuated, registering a maximum in 2016, when 58 children were born, whereas the minimum reg-istered was in 2019, when 28 children were born. In 2020, the number of newborns was 21.62% higher than the number registered in 2015, and the average number of newborns in the analyzed period was 43 children per year. Regarding the mortality indicator, the number of people who died in 2020 was 2.13% lower than the number of deaths recorded in 2015. The number of people who died in 2020 slightly exceeded the number of new-borns (Table 22).
In Peciu Nou commune in 2020 a total of 11 people benefited from social aid, 15.38% less than the beneficiaries of social aid in 2015. Comparing the number of inhabitants to the number of social aid beneficiaries, it was noted that those who received social benefits represented 0.19% of the commune’s population (Table 22).
In 2020, in the commune of Peciu Nou there were four medical units, and each unit served, on average, 1425 people (Table 22).
The number of economic agents from Peciu Nou commune registered an ascending trend in the analyzed period. Thus, if in 2015 there were 485 economic agents, in 2020 that
Figure 10. The result of the simulation regarding the evolution of the population in Valcani for aperiod of 10 years. Source: data processing from the local authorities.
From 2018 until 2020, the number of households in the commune of Peciu Nouregistered a positive evolution, with an increase of 9.02% in the number of households in2020 compared to the value registered in 2015. The average number of households in theperiod analyzed was 2107, and the annual rhythm was positive, at 1.7% (Table 22).
Regarding birth and mortality, the number of newborns in the commune fluctuated,registering a maximum in 2016, when 58 children were born, whereas the minimum regis-tered was in 2019, when 28 children were born. In 2020, the number of newborns was 21.62%higher than the number registered in 2015, and the average number of newborns in theanalyzed period was 43 children per year. Regarding the mortality indicator, the number ofpeople who died in 2020 was 2.13% lower than the number of deaths recorded in 2015. Thenumber of people who died in 2020 slightly exceeded the number of newborns (Table 22).
In Peciu Nou commune in 2020 a total of 11 people benefited from social aid, 15.38%less than the beneficiaries of social aid in 2015. Comparing the number of inhabitants tothe number of social aid beneficiaries, it was noted that those who received social benefitsrepresented 0.19% of the commune’s population (Table 22).
In 2020, in the commune of Peciu Nou there were four medical units, and each unitserved, on average, 1425 people (Table 22).
The number of economic agents from Peciu Nou commune registered an ascendingtrend in the analyzed period. Thus, if in 2015 there were 485 economic agents, in 2020that number increased by 8.2%. The annual growth rate of the number of economic agentswas positive, at 1.6%. Of the 525 economic agents existing in 2020, 45 of them had anagricultural profile, representing 8.5% of the total economic agents. This report indicates
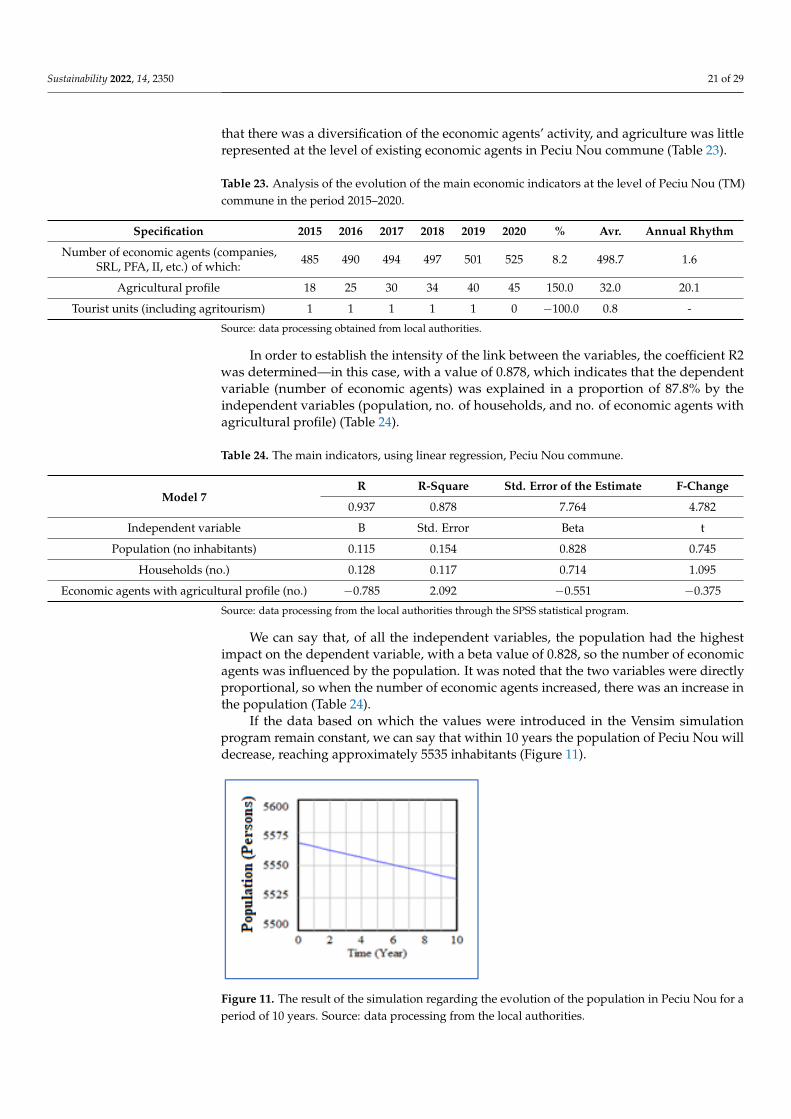
Sustainability 2022, 14, 2350 21 of 29
that there was a diversification of the economic agents’ activity, and agriculture was littlerepresented at the level of existing economic agents in Peciu Nou commune (Table 23).
Table 23. Analysis of the evolution of the main economic indicators at the level of Peciu Nou (TM)commune in the period 2015–2020.
Specification 2015 2016 2017 2018 2019 2020 % Avr. Annual Rhythm
Number of economic agents (companies,SRL, PFA, II, etc.) of which: 485 490 494 497 501 525 8.2 498.7 1.6
Agricultural profile 18 25 30 34 40 45 150.0 32.0 20.1
Tourist units (including agritourism) 1 1 1 1 1 0 −100.0 0.8 -
Source: data processing obtained from local authorities.
In order to establish the intensity of the link between the variables, the coefficient R2was determined—in this case, with a value of 0.878, which indicates that the dependentvariable (number of economic agents) was explained in a proportion of 87.8% by theindependent variables (population, no. of households, and no. of economic agents withagricultural profile) (Table 24).
Table 24. The main indicators, using linear regression, Peciu Nou commune.
Model 7R R-Square Std. Error of the Estimate F-Change
0.937 0.878 7.764 4.782
Independent variable B Std. Error Beta t
Population (no inhabitants) 0.115 0.154 0.828 0.745
Households (no.) 0.128 0.117 0.714 1.095
Economic agents with agricultural profile (no.) −0.785 2.092 −0.551 −0.375
Source: data processing from the local authorities through the SPSS statistical program.
We can say that, of all the independent variables, the population had the highestimpact on the dependent variable, with a beta value of 0.828, so the number of economicagents was influenced by the population. It was noted that the two variables were directlyproportional, so when the number of economic agents increased, there was an increase inthe population (Table 24).
If the data based on which the values were introduced in the Vensim simulationprogram remain constant, we can say that within 10 years the population of Peciu Nou willdecrease, reaching approximately 5535 inhabitants (Figure 11).
Sustainability 2022, 14, x FOR PEER REVIEW 22 of 30
number increased by 8.2%. The annual growth rate of the number of economic agents was positive, at 1.6%. Of the 525 economic agents existing in 2020, 45 of them had an agricul-tural profile, representing 8.5% of the total economic agents. This report indicates that there was a diversification of the economic agents’ activity, and agriculture was little rep-resented at the level of existing economic agents in Peciu Nou commune (Table 23).
Table 23. Analysis of the evolution of the main economic indicators at the level of Peciu Nou (TM) commune in the period 2015–2020.
Specification 2015 2016 2017 2018 2019 2020 % Avr. Annual Rhythm
Number of economic agents (companies, SRL, PFA, II, etc.) of which: 485 490 494 497 501 525 8.2 498.7 1.6
Agricultural profile 18 25 30 34 40 45 150.0 32.0 20.1 Tourist units (including agritourism) 1 1 1 1 1 0 −100.0 0.8 -
Source: data processing obtained from local authorities.
In order to establish the intensity of the link between the variables, the coefficient R2 was determined—in this case, with a value of 0.878, which indicates that the dependent variable (number of economic agents) was explained in a proportion of 87.8% by the in-dependent variables (population, no. of households, and no. of economic agents with ag-ricultural profile) (Table 24).
Table 24. The main indicators, using linear regression, Peciu Nou commune.
Model 7 R R-Square Std. Error of the Estimate F-Change
0.937 0.878 7.764 4.782 Independent variable B Std. Error Beta t
Population (no inhabitants) 0.115 0.154 0.828 0.745 Households (no.) 0.128 0.117 0.714 1.095
Economic agents with agricultural profile (no.) −0.785 2.092 −0.551 −0.375
Source: data processing from the local authorities through the SPSS statistical program.
We can say that, of all the independent variables, the population had the highest im-pact on the dependent variable, with a beta value of 0.828, so the number of economic agents was influenced by the population. It was noted that the two variables were directly proportional, so when the number of economic agents increased, there was an increase in the population (Table 24).
If the data based on which the values were introduced in the Vensim simulation pro-gram remain constant, we can say that within 10 years the population of Peciu Nou will decrease, reaching approximately 5535 inhabitants (Figure 11).
Figure 11. The result of the simulation regarding the evolution of the population in Peciu Nou for aperiod of 10 years. Source: data processing from the local authorities.
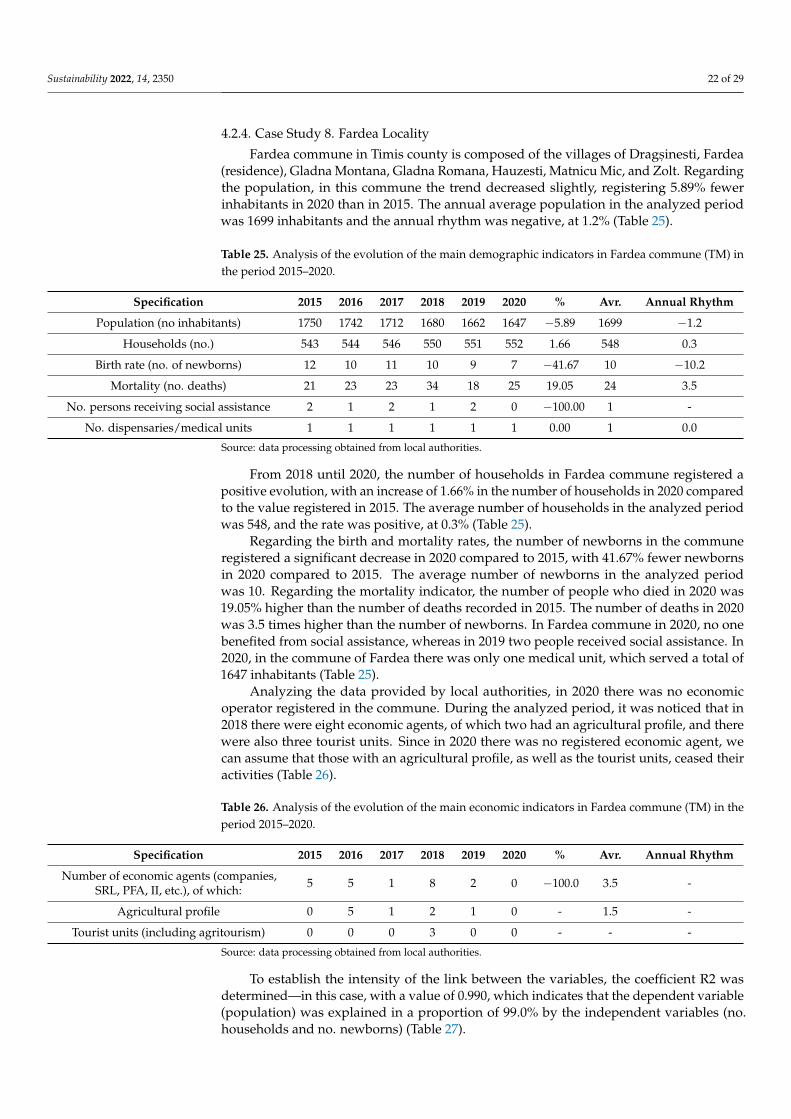
Sustainability 2022, 14, 2350 22 of 29
4.2.4. Case Study 8. Fardea Locality
Fardea commune in Timis county is composed of the villages of Drags, inesti, Fardea(residence), Gladna Montana, Gladna Romana, Hauzesti, Matnicu Mic, and Zolt. Regardingthe population, in this commune the trend decreased slightly, registering 5.89% fewerinhabitants in 2020 than in 2015. The annual average population in the analyzed periodwas 1699 inhabitants and the annual rhythm was negative, at 1.2% (Table 25).
Table 25. Analysis of the evolution of the main demographic indicators in Fardea commune (TM) inthe period 2015–2020.
Specification 2015 2016 2017 2018 2019 2020 % Avr. Annual Rhythm
Population (no inhabitants) 1750 1742 1712 1680 1662 1647 −5.89 1699 −1.2
Households (no.) 543 544 546 550 551 552 1.66 548 0.3
Birth rate (no. of newborns) 12 10 11 10 9 7 −41.67 10 −10.2
Mortality (no. deaths) 21 23 23 34 18 25 19.05 24 3.5
No. persons receiving social assistance 2 1 2 1 2 0 −100.00 1 -
No. dispensaries/medical units 1 1 1 1 1 1 0.00 1 0.0
Source: data processing obtained from local authorities.
From 2018 until 2020, the number of households in Fardea commune registered apositive evolution, with an increase of 1.66% in the number of households in 2020 comparedto the value registered in 2015. The average number of households in the analyzed periodwas 548, and the rate was positive, at 0.3% (Table 25).
Regarding the birth and mortality rates, the number of newborns in the communeregistered a significant decrease in 2020 compared to 2015, with 41.67% fewer newbornsin 2020 compared to 2015. The average number of newborns in the analyzed periodwas 10. Regarding the mortality indicator, the number of people who died in 2020 was19.05% higher than the number of deaths recorded in 2015. The number of deaths in 2020was 3.5 times higher than the number of newborns. In Fardea commune in 2020, no onebenefited from social assistance, whereas in 2019 two people received social assistance. In2020, in the commune of Fardea there was only one medical unit, which served a total of1647 inhabitants (Table 25).
Analyzing the data provided by local authorities, in 2020 there was no economicoperator registered in the commune. During the analyzed period, it was noticed that in2018 there were eight economic agents, of which two had an agricultural profile, and therewere also three tourist units. Since in 2020 there was no registered economic agent, wecan assume that those with an agricultural profile, as well as the tourist units, ceased theiractivities (Table 26).
Table 26. Analysis of the evolution of the main economic indicators in Fardea commune (TM) in theperiod 2015–2020.
Specification 2015 2016 2017 2018 2019 2020 % Avr. Annual Rhythm
Number of economic agents (companies,SRL, PFA, II, etc.), of which: 5 5 1 8 2 0 −100.0 3.5 -
Agricultural profile 0 5 1 2 1 0 - 1.5 -
Tourist units (including agritourism) 0 0 0 3 0 0 - - -
Source: data processing obtained from local authorities.
To establish the intensity of the link between the variables, the coefficient R2 wasdetermined—in this case, with a value of 0.990, which indicates that the dependent variable(population) was explained in a proportion of 99.0% by the independent variables (no.households and no. newborns) (Table 27).
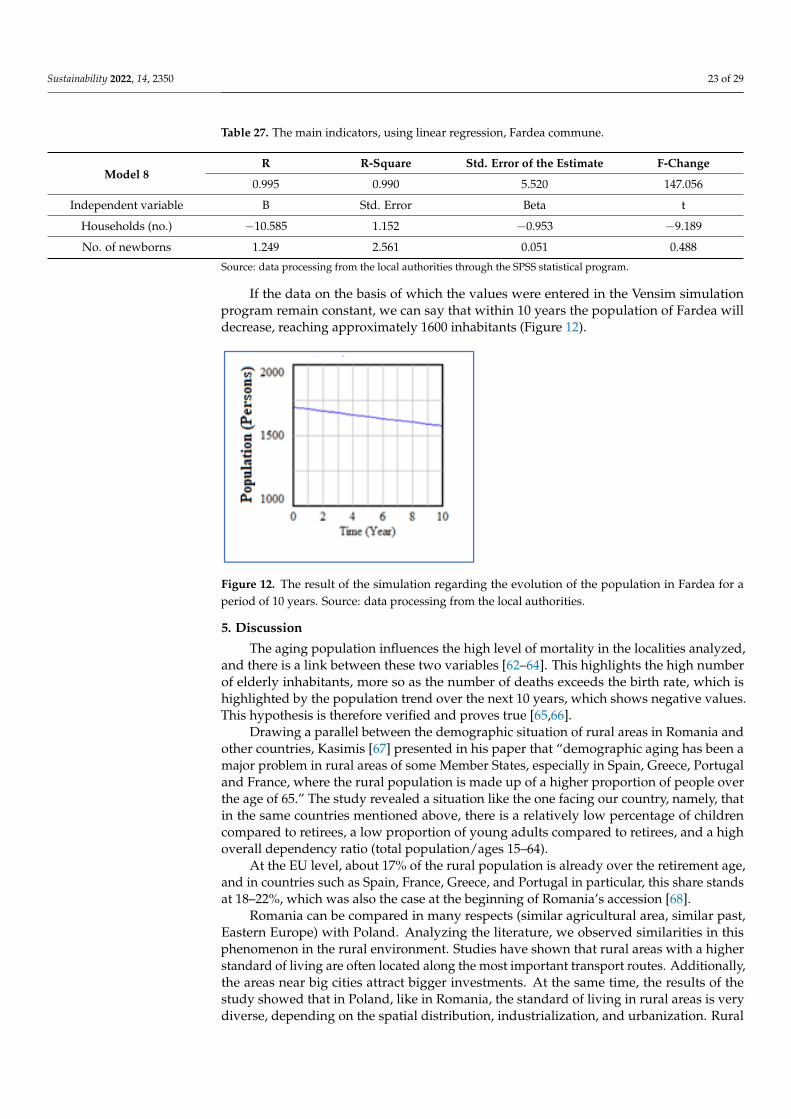
Sustainability 2022, 14, 2350 23 of 29
Table 27. The main indicators, using linear regression, Fardea commune.
Model 8R R-Square Std. Error of the Estimate F-Change
0.995 0.990 5.520 147.056
Independent variable B Std. Error Beta t
Households (no.) −10.585 1.152 −0.953 −9.189
No. of newborns 1.249 2.561 0.051 0.488
Source: data processing from the local authorities through the SPSS statistical program.
If the data on the basis of which the values were entered in the Vensim simulationprogram remain constant, we can say that within 10 years the population of Fardea willdecrease, reaching approximately 1600 inhabitants (Figure 12).
Sustainability 2022, 14, x FOR PEER REVIEW 24 of 30
Source: data processing obtained from local authorities.
To establish the intensity of the link between the variables, the coefficient R2 was determined—in this case, with a value of 0.990, which indicates that the dependent vari-able (population) was explained in a proportion of 99.0% by the independent variables (no. households and no. newborns) (Table 27).
Table 27. The main indicators, using linear regression, Fardea commune.
Model 8 R R-Square Std. Error of the Estimate F-Change
0.995 0.990 5.520 147.056 Independent variable B Std. Error Beta t
Households (no.) −10.585 1.152 −0.953 −9.189 No. of newborns 1.249 2.561 0.051 0.488
Source: data processing from the local authorities through the SPSS statistical program.
If the data on the basis of which the values were entered in the Vensim simulation program remain constant, we can say that within 10 years the population of Fardea will decrease, reaching approximately 1600 inhabitants (Figure 12).
Figure 12. The result of the simulation regarding the evolution of the population in Fardea for a period of 10 years. Source: data processing from the local authorities.
5. Discussion The aging population influences the high level of mortality in the localities analyzed,
and there is a link between these two variables [62–64]. This highlights the high number of elderly inhabitants, more so as the number of deaths exceeds the birth rate, which is highlighted by the population trend over the next 10 years, which shows negative values. This hypothesis is therefore verified and proves true [65,66].
Drawing a parallel between the demographic situation of rural areas in Romania and other countries, Kasimis [67] presented in his paper that “demographic aging has been a major problem in rural areas of some Member States, especially in Spain, Greece, Portugal and France, where the rural population is made up of a higher proportion of people over the age of 65.” The study revealed a situation like the one facing our country, namely, that in the same countries mentioned above, there is a relatively low percentage of children compared to retirees, a low proportion of young adults compared to retirees, and a high overall dependency ratio (total population/ages 15–64).
At the EU level, about 17% of the rural population is already over the retirement age, and in countries such as Spain, France, Greece, and Portugal in particular, this share stands at 18–22%, which was also the case at the beginning of Romania’s accession. [68]
Romania can be compared in many respects (similar agricultural area, similar past, Eastern Europe) with Poland. Analyzing the literature, we observed similarities in this
Figure 12. The result of the simulation regarding the evolution of the population in Fardea for aperiod of 10 years. Source: data processing from the local authorities.
5. Discussion
The aging population influences the high level of mortality in the localities analyzed,and there is a link between these two variables [62–64]. This highlights the high numberof elderly inhabitants, more so as the number of deaths exceeds the birth rate, which ishighlighted by the population trend over the next 10 years, which shows negative values.This hypothesis is therefore verified and proves true [65,66].
Drawing a parallel between the demographic situation of rural areas in Romania andother countries, Kasimis [67] presented in his paper that “demographic aging has been amajor problem in rural areas of some Member States, especially in Spain, Greece, Portugaland France, where the rural population is made up of a higher proportion of people overthe age of 65.” The study revealed a situation like the one facing our country, namely, thatin the same countries mentioned above, there is a relatively low percentage of childrencompared to retirees, a low proportion of young adults compared to retirees, and a highoverall dependency ratio (total population/ages 15–64).
At the EU level, about 17% of the rural population is already over the retirement age,and in countries such as Spain, France, Greece, and Portugal in particular, this share standsat 18–22%, which was also the case at the beginning of Romania’s accession [68].
Romania can be compared in many respects (similar agricultural area, similar past,Eastern Europe) with Poland. Analyzing the literature, we observed similarities in thisphenomenon in the rural environment. Studies have shown that rural areas with a higherstandard of living are often located along the most important transport routes. Additionally,the areas near big cities attract bigger investments. At the same time, the results of thestudy showed that in Poland, like in Romania, the standard of living in rural areas is verydiverse, depending on the spatial distribution, industrialization, and urbanization. Rural
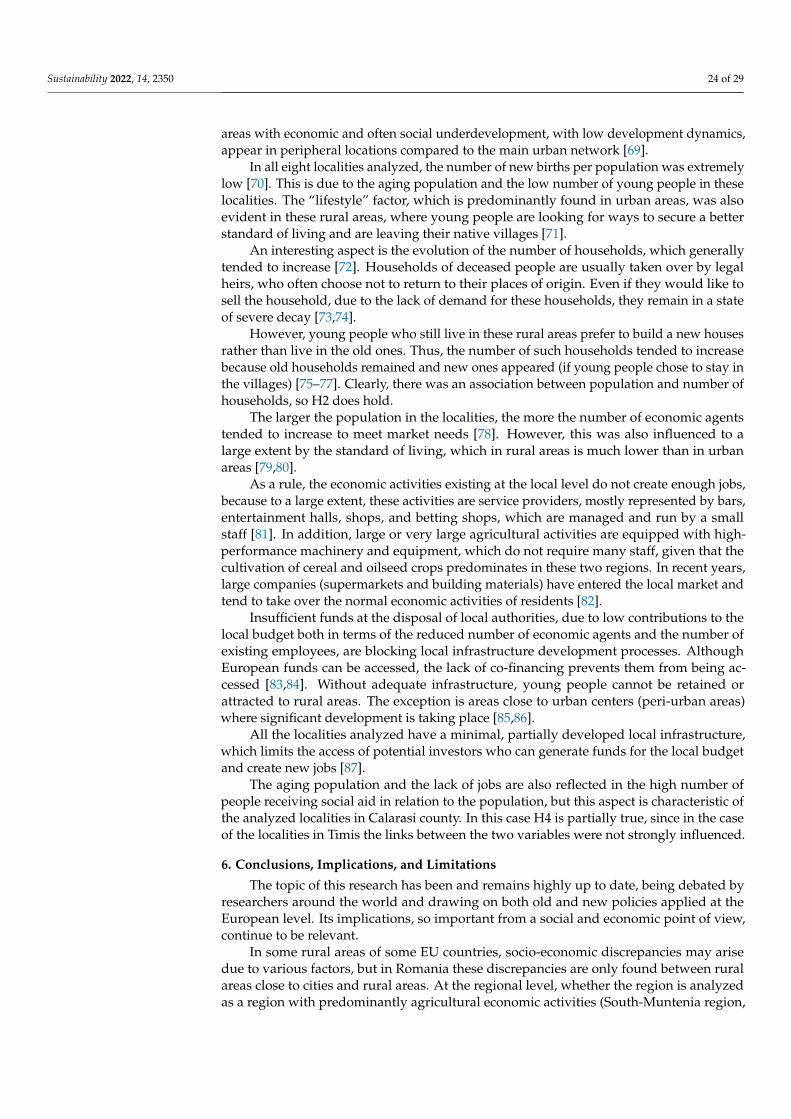
Sustainability 2022, 14, 2350 24 of 29
areas with economic and often social underdevelopment, with low development dynamics,appear in peripheral locations compared to the main urban network [69].
In all eight localities analyzed, the number of new births per population was extremelylow [70]. This is due to the aging population and the low number of young people in theselocalities. The “lifestyle” factor, which is predominantly found in urban areas, was alsoevident in these rural areas, where young people are looking for ways to secure a betterstandard of living and are leaving their native villages [71].
An interesting aspect is the evolution of the number of households, which generallytended to increase [72]. Households of deceased people are usually taken over by legalheirs, who often choose not to return to their places of origin. Even if they would like tosell the household, due to the lack of demand for these households, they remain in a stateof severe decay [73,74].
However, young people who still live in these rural areas prefer to build a new housesrather than live in the old ones. Thus, the number of such households tended to increasebecause old households remained and new ones appeared (if young people chose to stay inthe villages) [75–77]. Clearly, there was an association between population and number ofhouseholds, so H2 does hold.
The larger the population in the localities, the more the number of economic agentstended to increase to meet market needs [78]. However, this was also influenced to alarge extent by the standard of living, which in rural areas is much lower than in urbanareas [79,80].
As a rule, the economic activities existing at the local level do not create enough jobs,because to a large extent, these activities are service providers, mostly represented by bars,entertainment halls, shops, and betting shops, which are managed and run by a smallstaff [81]. In addition, large or very large agricultural activities are equipped with high-performance machinery and equipment, which do not require many staff, given that thecultivation of cereal and oilseed crops predominates in these two regions. In recent years,large companies (supermarkets and building materials) have entered the local market andtend to take over the normal economic activities of residents [82].
Insufficient funds at the disposal of local authorities, due to low contributions to thelocal budget both in terms of the reduced number of economic agents and the number ofexisting employees, are blocking local infrastructure development processes. AlthoughEuropean funds can be accessed, the lack of co-financing prevents them from being ac-cessed [83,84]. Without adequate infrastructure, young people cannot be retained orattracted to rural areas. The exception is areas close to urban centers (peri-urban areas)where significant development is taking place [85,86].
All the localities analyzed have a minimal, partially developed local infrastructure,which limits the access of potential investors who can generate funds for the local budgetand create new jobs [87].
The aging population and the lack of jobs are also reflected in the high number ofpeople receiving social aid in relation to the population, but this aspect is characteristic ofthe analyzed localities in Calarasi county. In this case H4 is partially true, since in the caseof the localities in Timis the links between the two variables were not strongly influenced.
6. Conclusions, Implications, and Limitations
The topic of this research has been and remains highly up to date, being debated byresearchers around the world and drawing on both old and new policies applied at theEuropean level. Its implications, so important from a social and economic point of view,continue to be relevant.
In some rural areas of some EU countries, socio-economic discrepancies may arisedue to various factors, but in Romania these discrepancies are only found between ruralareas close to cities and rural areas. At the regional level, whether the region is analyzedas a region with predominantly agricultural economic activities (South-Muntenia region,
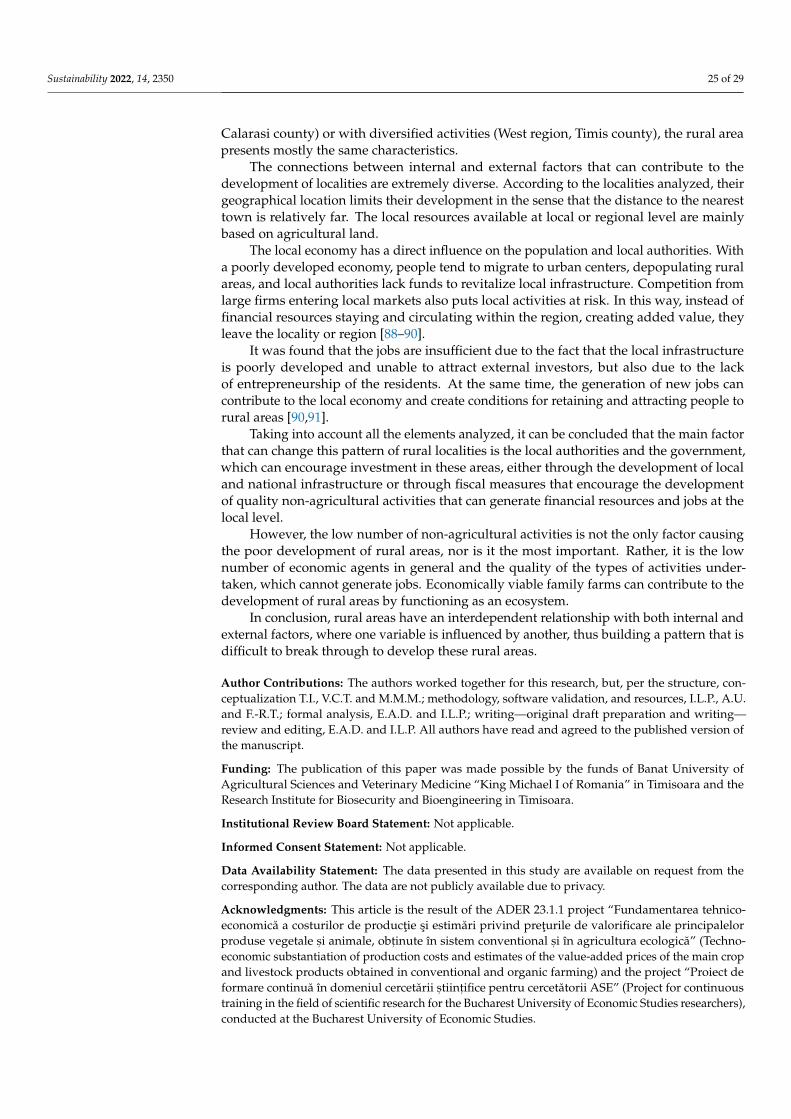
Sustainability 2022, 14, 2350 25 of 29
Calarasi county) or with diversified activities (West region, Timis county), the rural areapresents mostly the same characteristics.
The connections between internal and external factors that can contribute to thedevelopment of localities are extremely diverse. According to the localities analyzed, theirgeographical location limits their development in the sense that the distance to the nearesttown is relatively far. The local resources available at local or regional level are mainlybased on agricultural land.
The local economy has a direct influence on the population and local authorities. Witha poorly developed economy, people tend to migrate to urban centers, depopulating ruralareas, and local authorities lack funds to revitalize local infrastructure. Competition fromlarge firms entering local markets also puts local activities at risk. In this way, instead offinancial resources staying and circulating within the region, creating added value, theyleave the locality or region [88–90].
It was found that the jobs are insufficient due to the fact that the local infrastructureis poorly developed and unable to attract external investors, but also due to the lackof entrepreneurship of the residents. At the same time, the generation of new jobs cancontribute to the local economy and create conditions for retaining and attracting people torural areas [90,91].
Taking into account all the elements analyzed, it can be concluded that the main factorthat can change this pattern of rural localities is the local authorities and the government,which can encourage investment in these areas, either through the development of localand national infrastructure or through fiscal measures that encourage the developmentof quality non-agricultural activities that can generate financial resources and jobs at thelocal level.
However, the low number of non-agricultural activities is not the only factor causingthe poor development of rural areas, nor is it the most important. Rather, it is the lownumber of economic agents in general and the quality of the types of activities under-taken, which cannot generate jobs. Economically viable family farms can contribute to thedevelopment of rural areas by functioning as an ecosystem.
In conclusion, rural areas have an interdependent relationship with both internal andexternal factors, where one variable is influenced by another, thus building a pattern that isdifficult to break through to develop these rural areas.
Author Contributions: The authors worked together for this research, but, per the structure, con-ceptualization T.I., V.C.T. and M.M.M.; methodology, software validation, and resources, I.L.P., A.U.and F.-R.T.; formal analysis, E.A.D. and I.L.P.; writing—original draft preparation and writing—review and editing, E.A.D. and I.L.P. All authors have read and agreed to the published version ofthe manuscript.
Funding: The publication of this paper was made possible by the funds of Banat University ofAgricultural Sciences and Veterinary Medicine “King Michael I of Romania” in Timisoara and theResearch Institute for Biosecurity and Bioengineering in Timisoara.
Institutional Review Board Statement: Not applicable.
Informed Consent Statement: Not applicable.
Data Availability Statement: The data presented in this study are available on request from thecorresponding author. The data are not publicly available due to privacy.
Acknowledgments: This article is the result of the ADER 23.1.1 project “Fundamentarea tehnico-economică a costurilor de productie si estimări privind preturile de valorificare ale principalelorproduse vegetale s, i animale, obt, inute în sistem conventional s, i în agricultura ecologică” (Techno-economic substantiation of production costs and estimates of the value-added prices of the main cropand livestock products obtained in conventional and organic farming) and the project “Proiect deformare continuă în domeniul cercetării s, tiint, ifice pentru cercetătorii ASE” (Project for continuoustraining in the field of scientific research for the Bucharest University of Economic Studies researchers),conducted at the Bucharest University of Economic Studies.
Sustainability 2022, 14, 2350 26 of 29
Conflicts of Interest: The authors declare no conflict of interest.
Limitations: We can consider the fact that the eight localities may not be statistically representativeto extrapolate the situation at the national level for all localities, but we cannot notice the pattern thatwas found in seven of these localities, at a rate of 87.5%.
References1. Bold, I.; Drăghici, M. Two Centuries of Rural and Agrarian Economy. Portraits and Meanings; Mirton: Timisoara, Romania, 2004; p. 51.2. Bologa, G. Sustainable Rural Development in Romania. Productivity Advances in Agriculture; Pro Universitaria: Bucharest, Romania,
2013; p. 143.3. Istudor, N. Romania’s Rural and Regional Development in the Perspective of Integration into the European Union; ASE Publishing House:
Bucharest, Romania, 2006; pp. 72–73. Available online: https://www.editura.ase.ro/Dezvoltarea-rurala-si-regionala-a-Romaniei-in-perspectiva-integrarii-in-Uniunea-Europeana/ (accessed on 5 January 2022).
4. Geamasu, T.; Alecu, I. Conceptual approaches of the rural space. In Agrarian Economy and Rural Development-Realities andPerspectives for Romania; The Research Institute for Agriculture Economy and Rural Development: Bucharest, Romanian, 2014;pp. 8–12.
5. Bold, E.; Buciuman, N.; Drăghici, M. Rural Space—Definition, Organization, Development; Mirton: Timisoara, Romania, 2003; p. 149.6. Radulescu, C.V. Regional and Rural Development; ASE Publishing House: Bucharest, Romania, 2007; pp. 17–20. Available
online: https://www.targulcartii.ro/carmen-valentina-radulescu/dezvoltare-regionala-si-rurala-ase-2007-728506 (accessed on5 January 2022).
7. Dumitru, E.A.; Micu, A.R.; Alecu, I.; Tudor, V.; Micu, M.M. Analisys of the situation of Romanian village—Case study GrinduCommune, Ialomita County. In Proceedings of the 29th International-Business-Information-Management-Association Conference,Vienna, Austria, 3–4 May 2017; pp. 740–747.
8. Dumitru, E.A.; Micu, M.M.; Tudor, V. Conceptual approches regarding the Romanian rural area. Sci. Pap. Ser. Manag. Econ. Eng.Agric. Rural Dev. 2019, 19, 121–127.
9. Dinu, M.; Patarlageanu, S.R.; Chiripuci, B.; Constantin, M. Accessing European funds for agriculture and rural development inRomania for the 2014–2020 period. In Proceedings of the 14th International Conference on Business Excellence (ICBE)—BusinessRevolution in the Digital Era, Bucharest, Romania, 27 June 2020; pp. 717–727. [CrossRef]
10. Giosan, N. Romanian Agriculture; Agro—Silvica: Bucharest, Romania, 1965; p. 195.11. Glogovetan, O.E. The Evolution of Agricultural Holdings in Romania—A Fundamental Element of the Rural Economy.
Ph.D. Thesis, Babes, -Bolyai University, Cluj Napoca, Romania, 2014.12. Ivanovic, O.D.M.; Golušin, M.T.; Dodic, S.N.; Dodic, J.M. Perspectives of sustainable development in countries of Southeastern
Europe. Renew. Sustain. Energy Rev. 2009, 13, 2079–2087. [CrossRef]13. Kerekes, K.P.B.; Szocs, E.; Veres, E.; Vincze, M. Rural Development. Employment in Rural Areas; Accent: Cluj-Napoca, Romania,
2010; pp. 33–38.14. Popescu, M.; Popescu, C.; Per, E. Rural Area and Rural Development. Agric. Manag. 2018, 20, 88–93.15. Baum, S.; Weingarten, P. TypIsierung Landlicher Raume in Mittel-und Osteuropa; Europa Regional: Leibnitz, Austria, 2004;
pp. 149–150.16. Mitrică, B.; Serban, P.; Mocanu, I. Social Development and Regional Disparities in the Rural Areas of Romania: Focus on the
Social Disadvantaged Areas. Soc. Indic Res. 2020, 152, 67–89. [CrossRef]17. Comanescu, I.S.; Foris, D.; Floris, T. Dimensions of the Funding Programmes for Sustainable Rural Development in Romania.
Econ. Sci. Rural Dev. 2019, 50, 44–51. [CrossRef]18. Raicov, M.; Banes, A.; Brad, I.; Feher, A. Absorption of Rural Development Funds. A Lesson Learned? Sci. Pap. Ser. Manag. Econ.
Eng. Agric. Rural Dev. 2021, 21, 505–512.19. Paul, L. Rural Development in Romania—A Few Considerations. Stud. Bus. Econ. 2020, 15, 165–175. [CrossRef]20. Mack, G.; Fintineru, G.; Kohler, A. Do Rural Development Measures Improve Vitality of Rural Areas in Romania? AgroLife Sci. J.
2018, 7, 82–98.21. Pavel, A.; Moldovan, B.; Neamtu, B.; Hintea, C. Are Investments in Basic Infrastructure the Magic Wand to Boost the Local
Economy of Rural Communities from Romania? Sustainability 2018, 10, 3384. [CrossRef]22. Frone, D.F.; Frone, S. Regionalization Increasing Access to Water Supply and Sanitation in Rural Romania. Sci. Pap. Ser. Manag.
Econ. Eng. Agric. Rural Dev. 2019, 19, 135–143.23. Popovici, E.A.; Mitrica, B.; Mocanu, I. Land concentration and land grabbing: Implications for the socio-economic development
of rural communities in south-eastern Romania. Outlook Agric. 2018, 47, 204–213. [CrossRef]24. Bran, F.; Ciobanu, G.; Popescu, M.L.; Vasilache, P.C. Sustainable Local Development in Romania in the Opportunity of Creating
Jobs. Eur. J. Sustain. Dev. 2020, 9, 287. [CrossRef]25. Simescu, L.; Rahoveanu, M.M.T.; Risnoveanu, L. Diversification and consolidation of the system training in agriculture in
Romania. Educ. Excell. Innov. Manag. Vis. 2020, 11, 1306–1309.26. Ibănescu, B.-C.; Stoleriu, O.M.; Munteanu, A.; Iat,u, C. The Impact of Tourism on Sustainable Development of Rural Areas:
Evidence from Romania. Sustainability 2018, 10, 3529. [CrossRef]
Sustainability 2022, 14, 2350 27 of 29
27. Uliu, D.V.; Vladu, M. Researches Regarding the Increase and Modernization of the Meat Processing Capacities by Using theFunds Offered through the National Rural Development Program in the North West Development Region. Sci. Pap. Ser. Manag.Econ. Eng. Agric. Rural Dev. 2020, 20, 593–598.
28. Ulman, S.R.; Isan, V.; Mihai, C.; Ifrim, M. The Responsiveness of the Rural Area to the Related-Decreasing Poverty Measures ofthe Sustainable Development Policy: The Case of North-East Region of Romania. Transform. Bus. Econ. 2018, 17, 780–805.
29. Pavel, A.; Moldovan, B.A.; Kourtit, K.; Nijkamp, P. Urban or Rural: Does It Make A Difference for Economic Resilience? AModelling Study on Economic and Cultural Geography in Romania. Sustainability 2020, 12, 3776. [CrossRef]
30. Mihai, F.-C.; Minea, I. Sustainable Alternative Routes versus Linear Economy and Resources Degradation in Eastern Romania.Sustainability 2021, 13, 10574. [CrossRef]
31. Lile, R.; Boghicevici, C.; Stoian, C.D. Role of social professions in the process of sustainable development of rural area. Study case.Jurid. Trib. Trib. Jurid. 2018, 8, 415–424.
32. Pop, C.; Georgescu, M.A. Romanian Rural World Heritage Sites and Tourism Development. Entrep. Bus. Econ. Rev. 2019, 7,135–158. [CrossRef]
33. United Nations Division for Sustainable Development. United Nations Conference on Environment & Development, Agenda 21,Rio de Janerio, Brazil, 3–14 June 1992. Available online: https://sustainabledevelopment.un.org/content/documents/Agenda21.pdf (accessed on 5 January 2022).
34. Nagiu, A.; Vázquez, J.L.; Georgiev, I. Rural Development Strategies through Rural Tourism Activities in Romania: Chance for anInternal Demand. Int. Rev. Public Nonprofit Mark. 2009, 2, 85–95. [CrossRef]
35. Cebotari, S.; Cristea, M.; Moldovan, C.; Zubascu, F. Renewable energy’s impact on rural development in northwestern Romania.Energy Sustain. Dev. 2017, 37, 110–123. [CrossRef]
36. Dachin, A. Rural development—A basic condition for narrowing regional disparities in Romania. Rom. J. Reg. Sci. 2008, 2,106–117.
37. Mihăilescu, V. Peasant Strategies and Rural Development in Romania; Coping with Local Diversity in Development Policy; SocialCost of Economic Transformation in Central Europe: Bucharest, Romania, 2000; pp. 4–6.
38. Alboiu, C.; Kuliesis, G.; Salengaite, D. The impact of rural development program on agriculture and business/rural developmentin lIthuania and Romania: A mirror situation. Agric. Econ. Rural Dev. 2011, 8, 654–665.
39. Ciutacu, C.; Chivua, L.; Jean, V.A. Similarities and dissimilarities between the EU agricultural and rural development model andRomanian agriculture. Challenges and perspectives. Elsevier Land Use Policy 2015, 44, 169–176. [CrossRef]
40. Munteani, A. Aspects of implementation of information technology in rural development in Romania. Anim. Husb. Ser. 2009, 53,88–93.
41. Ciani, A.; Gambardella, A.; Pociovălis, teanu, D.M. Circular economy and sustainable rural development. Theory and best practice:A challenge for Romania. Ann.-Econ. Ser. 2016, 1, 52–56.
42. Micu, M.M. Research on accessing european funds for young farmers in Romania under the two national rural developmentprograms. Econ. Soc. Dev. 2018, 184–190. Available online: https://am.e-nformation.ro/conference-papers-proceedings/research-on-accessing-european-funds-young/docview/2131162967/se-2?accountid=136549 (accessed on 5 January 2022).
43. Albu, R.G.; Chitu, I.B. Local action groups (lags)—An important instrument in ensuring the sustainable development of ruralareas in Romania. Bull. Transilv. Univ. Brasov Ser. V Econ. Sci. 2014, 7, 97.
44. Gallardo-Cobos, R. Rural Development in the European Union: The concept and the policy. Agron. Colomb. 2010, 28, 475–481.45. Thomas Dax, I.M.; Machold, M. Forderung der landwirtschaftlich benachteiligten Gebiete in denneuen Mitgliedstaaten der
EU. In Ländlicher Raum-Online Fachzeitschrift des Bundesministerium für Land-und Forstwirtschaft, Umwelt und Wassemirtschaft;Bundesministerium für Landwirtschaft, Regionen und Tourismus (Federal Ministry for Agriculture, Regions and Tourism):Vienna, Austria, 2007; pp. 1–14, (In Germany). Available online: https://info.bmlrt.gv.at/dam/jcr:6e1b2d4b-d6c6-46ed-87c6-b270ad0e5e71/Dax_Machold_pdf_END.pdf (accessed on 5 January 2022).
46. Steiner, M. Ländliche Regionen—Gib’s die? Einige Anm. Strateg. 2003, 1, 17–31.47. Henry, D.C. Reviving Romania’s rural economy. RFE/RL Research Rep. 1994, 3, 18. Available online: https://am.e-nformation.ro/
trade-journals/reviving-romanias-rural-economy/docview/233236058/se-2?accountid=136549 (accessed on 5 January 2022).48. Micu, A.R.; Dumitru, E.A.; Tudor, V.; Alecu, I.N.; Micu, M.M. The factors that influence the development of rural villages: Case
study Semlac Commune, Arad County. In Proceedings of the 29th International-Business-Information-Management-AssociationConference, Vienna, Austria, 3–4 May 2017; pp. 748–756.
49. Mihăilescu, I. General Sociology; Polirom: Bucures, ti, Romania, 2003; p. 77.50. Pilar García-Guadilla, M.; Blauert, J. Environmental Social Movements in Latin America and Europe: Challenging Development
and Democracy. Int. J. Sociol. Soc. Policy 1992, 12, 1–274. [CrossRef]51. Moser, A.; Peter, H.; Fengler, B.; Strohm-Lompcke, R. Improving the quality of life with rural developement programms in
Germany (2007–2013). Eur. Countrys. 2018, 11, 321–339. [CrossRef]52. Oprea, R. Sustainable Development and Environmental Protection; Universitatea Dunărea de Jos: Galati, Galati, 2008; pp. 145–168.53. Oprean, C.; Vanu, M.A.; Bucur, A. Sustainable Development Modeling. Manag. Sustain. Dev. 2018, 1, 10–18.54. Pascaru, M. Sociology of Communities; Argonaut: Cluj-Napoca, Romania, 2003; p. 134.55. Dinga, E. Economic Sustainability through Adjustment Policies in the Context of Globalization; Academia Romaine: Bucharest, Romania,
2001; p. 24.
Sustainability 2022, 14, 2350 28 of 29
56. Dona, I. Rural Economy; Economică: Bucharest, Romania, 2015; p. 104.57. Dumitru, E.A.; Badan, D.; Petre, I.L.; Bratulescu, A.M. Analysis of agricultural holdings in Romania in terms of size. Sci. Pap. Ser.
Manag. Econ. Eng. Agric. Rural Dev. 2020, 20, 193–198.58. Wagner, K. Going beyond the Rural Development Programme: A master plan for Austria’s rural areas in the framework of
the CAP. In The Common Agricultural Policy of the European Union—The Present and the future EU Member States Point of View,Proceedings of the International Scientific Conference The Common Agricultural Policy of the European Union-the Present and the FutureMulti-annual Programme 2015–2019 The Polish and the EU Agricultures 2020+. Challenges, Chances, Threats, Proposals, Stare Jablonki,Poland, 5–7 December 2017; Institute of Agricultural and Food Economics-National Research Institute(IAFE-NRI): Warsaw, Poland,2018; pp. 62–68. [CrossRef]
59. European Court of Auditors. Special Report: Programming for Rural Development: There Is a Need to Reduce Complexity and Put MoreEmphasis on Results; Publications Office of the European Union: Luxembourg, 2017; ISBN 978-92-872-8249-1.
60. Podreka, J.; Rodela, R. Local action groups and environmental protection: Overview of the projects which contribute to the secondaxis of the Rural Development Programme. Geogr. Vestn. 2013, 85, 47–56. Available online: https://www.scopus.com/inward/record.uri?eid=2-s2.0-84889052989&partnerID=40&md5=a89a92c1e1cf604d4b70bc606f17906c (accessed on 5 January 2022).
61. Pollermann, K.; Aubert, F. LEADER as european policy for rural development in a multi level governance framework: Acomparison of implementation in France, Germany and Italy. Eur. Ctry. 2020, 12, 156–178.
62. LAW No. 544 of October 12, 2001 on Free Access to Information of Public Interest, Romania. Available online: https://legislatie.just.ro/Public/DetaliiDocument/31413 (accessed on 5 January 2022).
63. Fanea-Ivanovici, M. Culture as a Prerequisite for Sustainable Development. An Investigation into the Process of Cultural ContentDigitisation in Romania. Sustainability 2018, 10, 1859. [CrossRef]
64. Iorga, A.M.; Stoicea, P.; Dobre, C. Statistics of the Rural Population from the Regional Perspective. Sci. Pap. Ser. Manag. Econ. Eng.Agric. Rural Dev. 2020, 20, 287–294.
65. Vladu, M.; Panzaru, R.L.; Savescu, P.; Matei, G. Studies on the Situation of Investments Made with Public Funds under123 Measure “Increasing the Added Value of Agricultural and Forestry Products” of the National Rural Development Program,in the South-West Oltenia Development Region in Romania. Rom. Agric. Res. 2018, 35, 275–281.
66. Stanciu, M. Economic and Social Policies to Combat Poverty in Romania in the Last Century. In The Romanian Economy, A Centuryof Transformation (1918–2018): Proceedings of Espera; Peter Lang GmbH: Berlin, Germany, 2019; pp. 233–244.
67. Kasimis, C. Demographic trends in rural Europe and international migration to rural areas. Agriregionieuropa 2010, 21, 1–6.68. European Commission. Agriculture in the European Union—Statistical and Economic Information. 2007. Available on-
line: https://ec.europa.eu/info/food-farming-fisheries/key-policies/common-agricultural-policy/cmef#indicator (accessed on5 January 2022).
69. Brambert, P.; Kinjorsja, I. Changes in the Standard of Living in Rural Population of Poland in the Period of the EU Membership.Eur. Countruside 2018, 10, 263–279. [CrossRef]
70. Popescu, A.; Dinu, T.A.; Stoian, E. Demographic and Economic Changes Characterizing the Rural Population in Romania. Sci.Pap. Ser. Manag. Econ. Eng. Agric. Rural Dev. 2018, 18, 333–346.
71. Pavel, A.; Moldovan, O. Determining Local Economic Development in the Rural Areas of Romania. Exploring the Role of ExogenousFactors. Sustainability 2019, 11, 282. [CrossRef]
72. Mihai, C.; Ulman, S.R.; David, M. New Assessment of Development Status among the People Living in Rural Areas: AnAlternative Approach for Rural Vitality. Sci. Ann. Econ. Bus. 2019, 66, 167–192. [CrossRef]
73. Tecau, A.S.; Dimitriu, C.; Marinescu, N.; Tescasiu, B.; Epuran, G.A. Qualitative Research on the Food Security of School Childrenin the Rural Area. Sustainability 2020, 12, 9024. [CrossRef]
74. Pargaru, I.; Stancioiu, F.; Ladaru, R.G.; Teodor, C. Sustainable Development in Agriculture at the Level of Romania and theEuropean Union. Qual. Access Success 2019, 20, 446–450.
75. Olar, A.; Jitea, M.I. Enabling Factors for Better Multiplier Effects of the LEADER Programme: Lessons from Romania. Sustainability2021, 13, 5184. [CrossRef]
76. Vijulie, I.; Lequeux-Dincă, A.-I.; Preda, M.; Mareci, A.; Matei, E.; Cuculici, R.; Talos, , A.-M. Certeze Village: The Dilemma ofTraditional vs. Post-Modern Architecture in T, ara Oas, ului, Romania. Sustainability 2021, 13, 11180. [CrossRef]
77. Florea, A.-M.; Capatina, A.; Radu, R.I.; Serban, C.; Boboc, M.G.; Stoica, C.; Munteanu, M.; Ion, I.M.; Stanciu, S. Limiting Factorsthat Influence the Formation of Producer Groups in the South-East Region of Romania: A Fuzzy Set Qualitative ComparativeAnalysis (fsQCA). Sustainability 2019, 11, 1614. [CrossRef]
78. Maican, S.S, .; Muntean, A.C.; Pas, tiu, C.A.; Stepien, S.; Polcyn, J.; Dobra, I.B.; Dârja, M.; Moisă, C.O. Motivational Factors, JobSatisfaction, and Economic Performance in Romanian Small Farms. Sustainability 2021, 13, 5832. [CrossRef]
79. Chiripuci, B.-C.; Constantin, M.; Popescu, M.-F.; Scrieciu, A. The Socio-Economic Impact of Migration on the Labor Market in theRomanian Danube Region. Sustainability 2020, 12, 8654. [CrossRef]
80. Popescu, A. Considerations on the rural population as a resource of labor force in Romania. Sci. Pap. Ser. Manag. Econ. Eng. Agric.Rural Dev. 2013, 13, 146–156.
81. Badiu, A. European funds for agriculture and rural development—Help or burden for Romania? Europolity 2013, 7, 73–86.82. Beciu, S.; Lădaru, R.G. Trends and actual issues concerning sustainable regional development in Romania, study case: The north
east region of development. Sci. Pap. Ser. Manag. Econ. Eng. Agric. Rural Dev. 2013, 13, 27–30.
Sustainability 2022, 14, 2350 29 of 29
83. Sandu, D. Social Disparities in the Regional Development and Policies of Romania. Int. Rev. Soc. Res. 2011, 1, 1–30. [CrossRef]84. Nit,escu, A. Aspects of rural development in Romania. Annals of the University of Petrosani. Economics 2014, 14, 251–258.85. Sima, E. Sustainable rural development through tourism activities in Romania. Agric. Econ. Rural Dev. New Ser. 2018, 15, 219–224.86. Ignat, R.; Stoian, M.; Rosca, V. Socio-economic aspects of rural Romania. Emerg. Mark. Queries Financ. Bus. 2015, 15, 1331–1338.
[CrossRef]87. Rusu, A.; Crunteanu, M.E. Leader—The social development of the rural area in Romania. Sci. Pap. Ser. Manag. Econ. Eng. Agric.
Rural Dev. 2021, 21, 389–694.88. Panagoret, I.; Panagoret, D. Influence factors on agrifood and rural development policies in Romania. 2nd central & eastern
european lumen international conference—Multidimensional education & professional development. Ethical Values 2017, 27,529–536.
89. Razvanta, F. The role of European funds in developing and sustaining rural entrepreneurship in Romania. In Proceedings of theInternational Conference on Business Excellence, Bucharest, Romania, 11–12 June 2020; Volume 14, pp. 134–148.
90. Popescu, D.L. Rural Population in Romania. Development and Tendencies (2000–2010). In Proceedings of the InternationalEconomic Conference of Sibiu 2013 Post Crisis Economy: Challenges and Opportunities, IECS, Sibiu, Romania, 17–18 May 2013;Volume 4, pp. 120–127.
91. Tache, I. Industrialization versus Rural Traditionalism in Inter-War Romania: A Reappraisal from the Globalization Perspective.Ind. Revolut. Glob. Post-Glob. Perspect. 2009, I, 338–344.
Top Related
Copyright © 2022 FDOKUMEN

