


Bahasa
Halaman
Hukum

processes
Article
A Basic Study on Establishing the Automatic Sewing ProcessAccording to Textile Properties
Suhyun Lee 1, Soohyeon Rho 2, Daeyoung Lim 2 and Wonyoung Jeong 2,*
�����������������
Citation: Lee, S.; Rho, S.; Lim, D.;
Jeong, W. A Basic Study on
Establishing the Automatic Sewing
Process According to Textile
Properties. Processes 2021, 9, 1206.
https://doi.org/10.3390/pr9071206
Academic Editor: Jae-Yoon Jung
Received: 17 June 2021
Accepted: 10 July 2021
Published: 13 July 2021
Publisher’s Note: MDPI stays neutral
with regard to jurisdictional claims in
published maps and institutional affil-
iations.
Copyright: © 2021 by the authors.
Licensee MDPI, Basel, Switzerland.
This article is an open access article
distributed under the terms and
conditions of the Creative Commons
Attribution (CC BY) license (https://
creativecommons.org/licenses/by/
4.0/).
1 Department of Fashion Design, College of Human Ecology, Jeonbuk National University, Jeonju 54896, Korea;[email protected]
2 Human Convergence Technology R&D Department, Korea Institute of Industrial Technology,Ansan 15588, Korea; [email protected] (S.R.); [email protected] (D.L.)
* Correspondence: [email protected]; Tel.: +82-31-8040-6233
Abstract: This study aimed to establish an automatic sewing process for garment production accord-ing to textile properties. An automatic feeding system and a self-made template were introduced toan industrial sewing machine. Two types of stitches were performed on fabrics with various physicalproperties and surface roughness using this automatic sewing machine. The appearance, stitch lengthand width, seam strength, and seam efficiency were evaluated according to the sewing conditions,such as presser height and sewing speed. In addition, the correlation between textile properties,sewing conditions, and sewability was analyzed to derive a regression equation for sewability. Theevaluation showed no difference in the lock stitch condition. On the other hand, under the zigzagstitch condition, the stitch width differed according to the presser height, which also affected the seamstructure. The optimal presser height for each fabric was derived from the experimental results. Interms of the sewing speed, however, the seam strength was the best at 200 RPM in the lock stitch and400 RPM in the zigzag stitch. The moderating effect of the presser height between textile propertiesand sewability in the lock stitch condition was confirmed. This result can be used as basic data forestablishing an automatic sewing process for smart factories.
Keywords: smart factory; automatic sewing process; regression equation for sewability; garmentproduction
1. Introduction
The 4th revolution, also known as Industry 4.0, has been attracting attention fromacademia and industry since it was first introduced at the Hannover Exhibition in 2011 [1].It was perceived as the informatization of the process of assembling and moving com-ponents of machines and mechanisms under the guidance and in communication witheach other. In addition, it has been recently recognized as an effective energy-saving pro-cess based on maximum automation and intellectualization of the production process [2].As Industry 4.0, the introduction of automation systems converged with technologies,such as Internet of Things (IoT), artificial intelligence (AI), and robots, has attracted atten-tion [3,4]. Automation is defined as the operation and control of manufacturing systemsusing technologies, such as electronic, mechanical, and computerized systems [5]. Asmarket competition becomes more intense and consumer demands diversify, automationis essential to improving the product quality and price competitiveness. Manufacturers canshorten the production time by increasing the production rate and labor productivity byintroducing an automation system. In addition, the investment costs for automation can berecovered by reducing wages and increasing productivity, which can reduce the burden oninvestment costs. Advanced countries are already suffering from labor shortages due toaging and avoidance of manufacturing. Problems, such as high wages and labor shortages,can also be solved by introducing an automation system.
Processes 2021, 9, 1206. https://doi.org/10.3390/pr9071206 https://www.mdpi.com/journal/processes
Processes 2021, 9, 1206 2 of 19
The garment manufacturing industry, which is a typical labor-intensive industry,is one of the areas where automation is relatively slow due to the weakness of digitaltechnology upgrades in the production process [6]. In particular, the sewing processrequires the most manpower in the production of the garments. Nevertheless, the sewingprocess is the most important joining method and an essential step in adding value totextile products. Garment sewing is divided into three steps: loading of fabric component,sewing of fabric component, and unloading of sewn component [5,7,8]. The loading of thefabric component includes picking up the fabric, arranging, folding, and pushing it underthe presser foot of the sewing machine. In this process, a visual or touch sensor shouldbe used to check the surface of the fabric, and special gripping technology is needed topick up the fabric from the fabric pile. Sewing of the fabric component includes movingthe sewing needle, guiding it until the sewing process is completed, aligning, measuring,and fixing it. Sewing technology is mechanized by the proximity sensor or the opticalsensor, while the feed operation is performed manually as the system for adjusting thetension is required separately. Furthermore, clamp feed or template sewing is required tokeep the fabric stable while maintaining size stability. The last step, unloading the sewncomponent, involves cutting the sewing thread, sliding, flipping, and folding process. Ingeneral, loading of the fabric component is performed manually, and the steps of sewingand unloading are partially automated.
To automate the sewing process without human resources, smart technology must beincorporated into the sewing machine. The cut fabrics should be transferred automaticallyto the sewing machine for feeding and must be sewn according to the stitch line thatis previously designed. In the future of sewing factories, robots and automatic sewingmachines will occupy these processes. Steve Dickerson, a founder of Softwear Automationand a professor at the Georgia Institute of Technology, studied robotics technology forsewing and launched “SEWBOT”, which is an automatic sewing system [6,9]. This systemconsists of an auto sewing machine, robotic arm, and conveyor system. With this system,T-shirts, jeans, floor rugs, bathroom mats, and pillow can be manufactured completelyautomatically. On the other hand, current automated sewing technology has limitations onthe materials that can be used, i.e., only rigid materials such as cotton. Therefore, researchis needed to extend the technology to various fabrics, such as cotton–PET blend fabrics,silk, and mesh fabrics, for garment manufacturing.
In our previous study [10], the automated manufacturing system for a smart sports brawas proposed by using various machines and technologies such as 2D–3D computer-aideddesign (CAD) program, automatic cutting machine, robot-based gripping system, andautomatic sewing system. In particular, the automatic feeding system and template sewingwas developed to realize automatic sewing without human intervention. However, there isa limitation that it is possible only for the selected fabrics and stitch patterns.
Therefore, to sew the fabrics automatically, considerable research for optimizingsewing conditions is required. Because the material of sewing parts, such as fabrics, issoft and flexible, its shape can be changed easily. Hence, it is difficult for an automaticmachine to set the sewing line along the edge of the actual parts accurately and handlethe sewing parts [11]. Generally, sewing damage is a problem in garment manufacturing,causing appearance problems and, consequently, degrading the quality of the final product.The main problems that arise from the actual stitch formation during the sewing processinclude skip or slipped stitches, staggered stitches, unbalanced stitches, variable stitchdensity, seam puckering, and needle, bobbin, or looper thread breakage [12]. Therefore,optimal sewing conditions must be set according to the fabric properties. Many researchershave found that the fabric property parameters, such as the fabric density, thickness, tensilestrength, extensibility, and bending rigidity, affect the seam quality [13].
This study aimed to establish an automatic sewing process for garment production.For this purpose, a system was developed to feed the cut fabrics to the sewing machineautomatically. The stitch pattern was designed as two types. The sewn appearance, stitchlength, and seam efficiency were evaluated according to the sewing parameters of the
Processes 2021, 9, 1206 3 of 19
automatic sewing machine and textile mechanical properties in each stitch pattern. Inaddition, statistical analysis was conducted to quantitatively evaluate the sewability ofstitches formed through the automatic sewing process, and a regression equation for thesewability according to sewing conditions and textile properties was derived.
2. Materials and Methods2.1. Development of Automatic Feeding System for Sewing
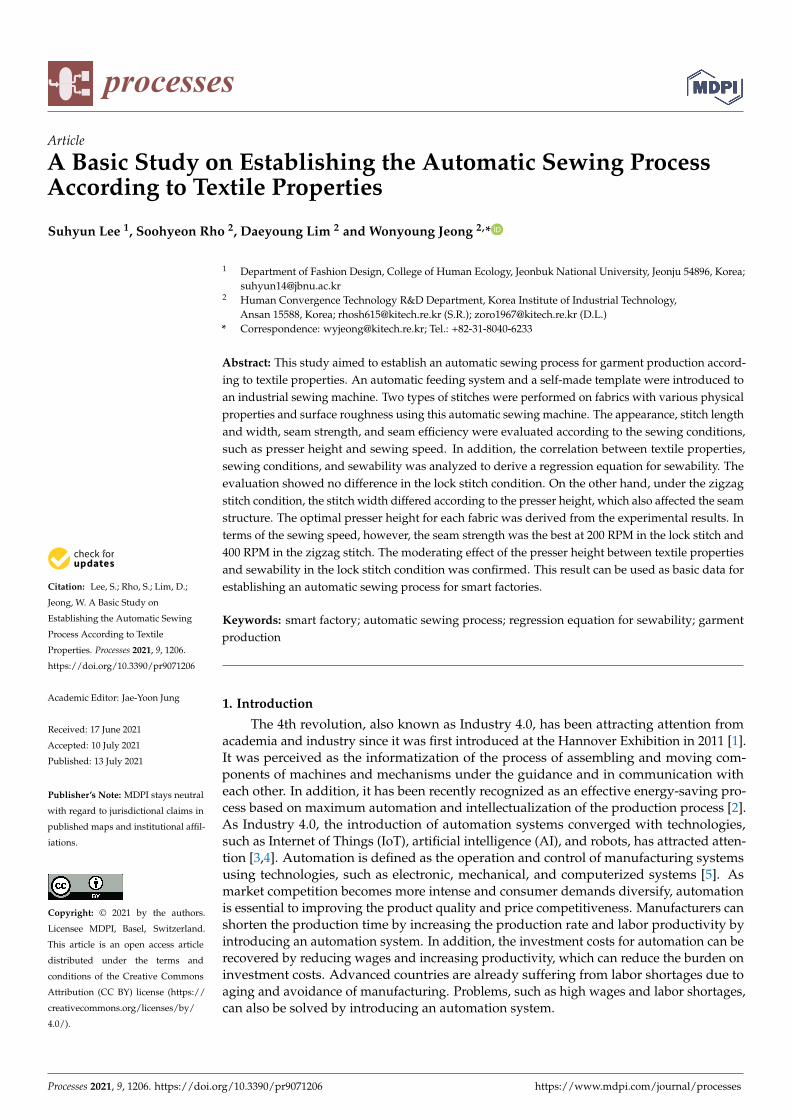
In this study, an industrial sewing machine (AMS-224, Juki, Tokyo, Japan), which isa computer-controlled cycle machine, was used [10]. An automatic feeding system suitablefor the sewing area was developed using a motor and acceleration sensor so that the cutfabrics can be inserted automatically into the sewing machine. This system moves thesewing parts of the cut fabrics on the sewing machine to execute the sewing task alongthe generated sewing trajectory. Figure 1 presents a schematic diagram of the developedautomatic feeding system.
Figure 1. Industrial sewing machine and developed automatic feeding system.
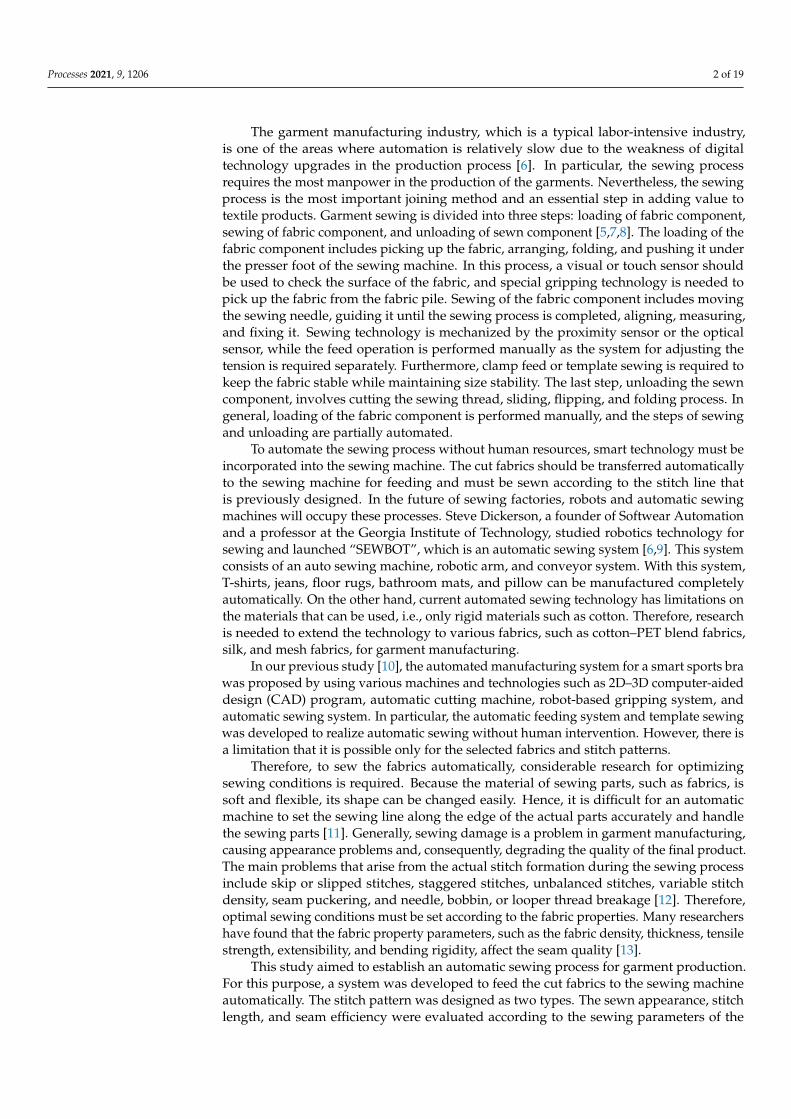
A separate template was made to fix the fabric samples when the cut fabric wasinserted automatically into the sewing machine. The fixation of the fabric was comparedaccording to the template surface roughness by preparing two templates: flat and rough.As shown in Figure 2, a template made of polycarbonate was used as a template fora flat surface, and a tape with silicon carbide particles was attached to the template fora rough surface.
Figure 2. Diagram of the self-made template: (a) flat surface template; (b) rough surface template.
2.2. Preparation and Measurement of the Mechanical Properties of the Fabric Samples
To analyze the sewing quality through an automatic sewing process according to thefabric properties, 12 types of fabrics with different thicknesses and fiber compositions wereprepared. The fabric samples used in this study were commercially available; Table 1 lists
Processes 2021, 9, 1206 4 of 19
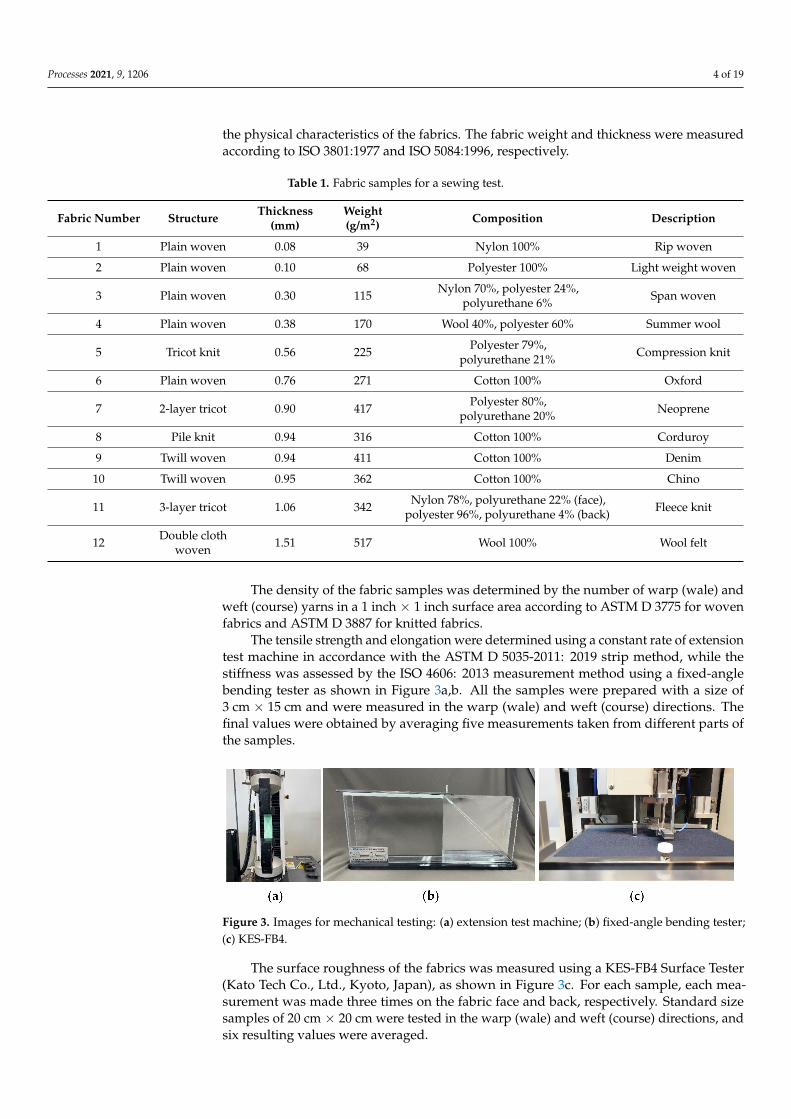
the physical characteristics of the fabrics. The fabric weight and thickness were measuredaccording to ISO 3801:1977 and ISO 5084:1996, respectively.
Table 1. Fabric samples for a sewing test.
Fabric Number Structure Thickness(mm)
Weight(g/m2) Composition Description
1 Plain woven 0.08 39 Nylon 100% Rip woven
2 Plain woven 0.10 68 Polyester 100% Light weight woven
3 Plain woven 0.30 115 Nylon 70%, polyester 24%,polyurethane 6% Span woven
4 Plain woven 0.38 170 Wool 40%, polyester 60% Summer wool
5 Tricot knit 0.56 225 Polyester 79%,polyurethane 21% Compression knit
6 Plain woven 0.76 271 Cotton 100% Oxford
7 2-layer tricot 0.90 417 Polyester 80%,polyurethane 20% Neoprene
8 Pile knit 0.94 316 Cotton 100% Corduroy
9 Twill woven 0.94 411 Cotton 100% Denim
10 Twill woven 0.95 362 Cotton 100% Chino
11 3-layer tricot 1.06 342 Nylon 78%, polyurethane 22% (face),polyester 96%, polyurethane 4% (back) Fleece knit
12 Double clothwoven 1.51 517 Wool 100% Wool felt
The density of the fabric samples was determined by the number of warp (wale) andweft (course) yarns in a 1 inch × 1 inch surface area according to ASTM D 3775 for wovenfabrics and ASTM D 3887 for knitted fabrics.
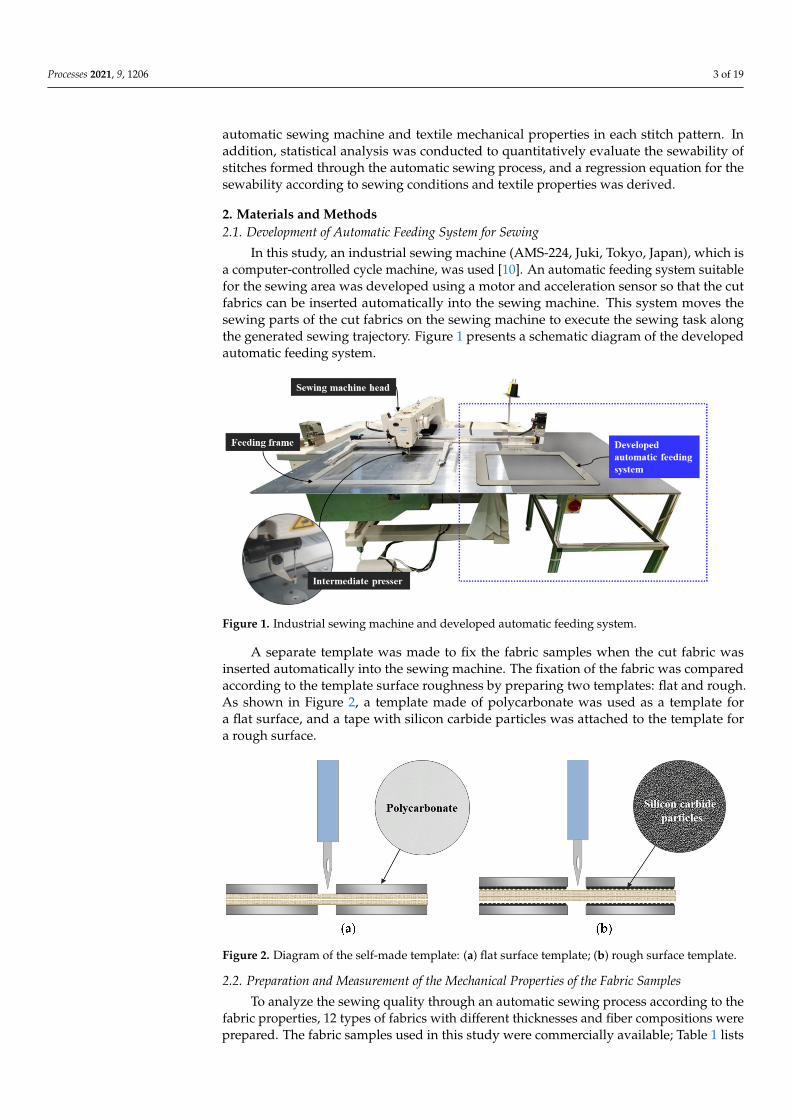
The tensile strength and elongation were determined using a constant rate of extensiontest machine in accordance with the ASTM D 5035-2011: 2019 strip method, while thestiffness was assessed by the ISO 4606: 2013 measurement method using a fixed-anglebending tester as shown in Figure 3a,b. All the samples were prepared with a size of3 cm × 15 cm and were measured in the warp (wale) and weft (course) directions. Thefinal values were obtained by averaging five measurements taken from different parts ofthe samples.
Figure 3. Images for mechanical testing: (a) extension test machine; (b) fixed-angle bending tester;(c) KES-FB4.
The surface roughness of the fabrics was measured using a KES-FB4 Surface Tester(Kato Tech Co., Ltd., Kyoto, Japan), as shown in Figure 3c. For each sample, each mea-surement was made three times on the fabric face and back, respectively. Standard sizesamples of 20 cm × 20 cm were tested in the warp (wale) and weft (course) directions, andsix resulting values were averaged.
Processes 2021, 9, 1206 5 of 19
2.3. Sewing Pattern and Condition
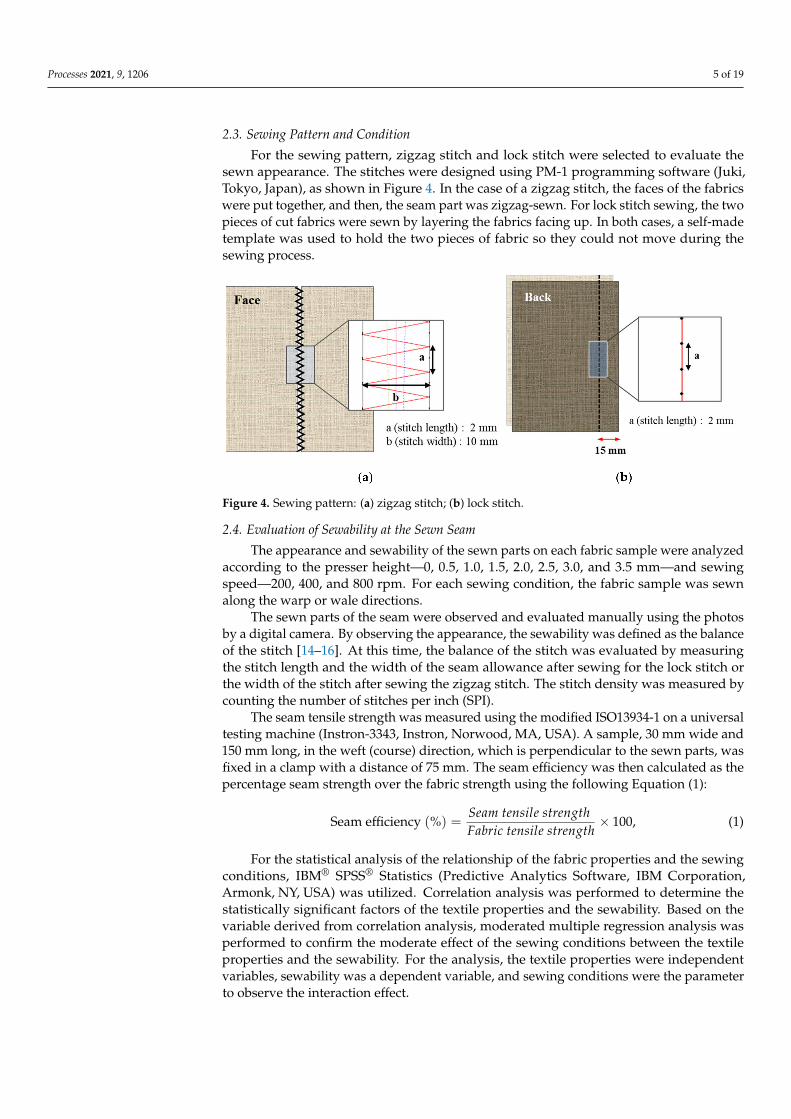
For the sewing pattern, zigzag stitch and lock stitch were selected to evaluate thesewn appearance. The stitches were designed using PM-1 programming software (Juki,Tokyo, Japan), as shown in Figure 4. In the case of a zigzag stitch, the faces of the fabricswere put together, and then, the seam part was zigzag-sewn. For lock stitch sewing, the twopieces of cut fabrics were sewn by layering the fabrics facing up. In both cases, a self-madetemplate was used to hold the two pieces of fabric so they could not move during thesewing process.
Figure 4. Sewing pattern: (a) zigzag stitch; (b) lock stitch.
2.4. Evaluation of Sewability at the Sewn Seam
The appearance and sewability of the sewn parts on each fabric sample were analyzedaccording to the presser height—0, 0.5, 1.0, 1.5, 2.0, 2.5, 3.0, and 3.5 mm—and sewingspeed—200, 400, and 800 rpm. For each sewing condition, the fabric sample was sewnalong the warp or wale directions.
The sewn parts of the seam were observed and evaluated manually using the photosby a digital camera. By observing the appearance, the sewability was defined as the balanceof the stitch [14–16]. At this time, the balance of the stitch was evaluated by measuringthe stitch length and the width of the seam allowance after sewing for the lock stitch orthe width of the stitch after sewing the zigzag stitch. The stitch density was measured bycounting the number of stitches per inch (SPI).
The seam tensile strength was measured using the modified ISO13934-1 on a universaltesting machine (Instron-3343, Instron, Norwood, MA, USA). A sample, 30 mm wide and150 mm long, in the weft (course) direction, which is perpendicular to the sewn parts, wasfixed in a clamp with a distance of 75 mm. The seam efficiency was then calculated as thepercentage seam strength over the fabric strength using the following Equation (1):
Seam efficiency (%) =Seam tensile strengthFabric tensile strength
× 100, (1)
For the statistical analysis of the relationship of the fabric properties and the sewingconditions, IBM® SPSS® Statistics (Predictive Analytics Software, IBM Corporation,Armonk, NY, USA) was utilized. Correlation analysis was performed to determine thestatistically significant factors of the textile properties and the sewability. Based on thevariable derived from correlation analysis, moderated multiple regression analysis wasperformed to confirm the moderate effect of the sewing conditions between the textileproperties and the sewability. For the analysis, the textile properties were independentvariables, sewability was a dependent variable, and sewing conditions were the parameterto observe the interaction effect.
Processes 2021, 9, 1206 6 of 19
3. Results and Discussion3.1. Comparison of the Sewing Appearance by Templates
The methods of automated sewing vary according to the design of the stitch line. Two-dimensional seams can be produced using a computer numerical control (CNC) sewingmethod. To automate the whole sewing processes, clamp feed or template sewing isrequired to keep the fabric stable while maintaining the size stability [5,7–9]. In this study,an automatic feeding system was introduced to an industrial sewing machine for theautomatic insertion and sewing of cut fabrics. In the sewing process, a self-made templatewas designed to fix the cut fabrics without moving and changing the positions.
One of the main factors of sewing influencing the stability of stitch length is its feedingin the sewing process. The feeding conditions depend on the external forces, which arethe load, pressing force, and inertial force. These factors influence the stitch length andappearance to stabilize stitch along the seam [17]. In this study, the template used in thefeeding system was considered to be related to the load and pressing force. Therefore, toevaluate the sewing performance according to the surface of the template, zigzag stitchingwas sewn on the No. 6 fabric sample, which is oxford cotton woven. At this time, thepresser height was fixed to 1.0 mm, and the sewing speed was set to 200 rpm.
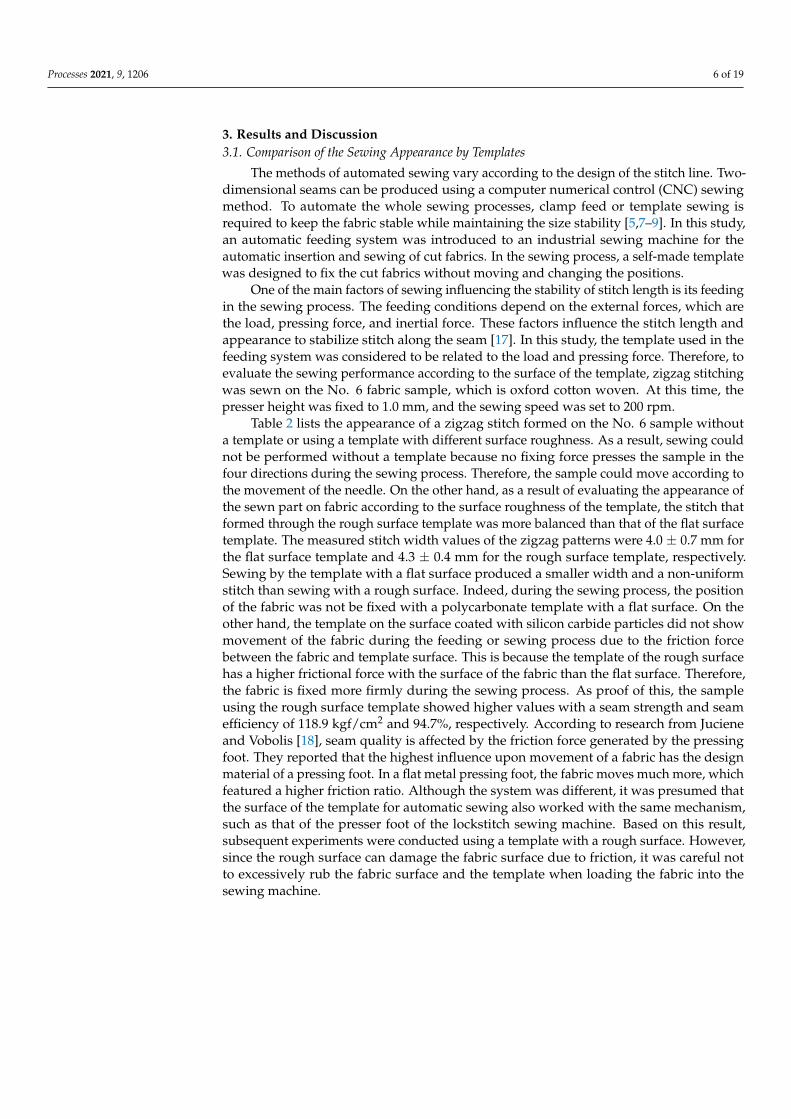
Table 2 lists the appearance of a zigzag stitch formed on the No. 6 sample withouta template or using a template with different surface roughness. As a result, sewing couldnot be performed without a template because no fixing force presses the sample in thefour directions during the sewing process. Therefore, the sample could move according tothe movement of the needle. On the other hand, as a result of evaluating the appearance ofthe sewn part on fabric according to the surface roughness of the template, the stitch thatformed through the rough surface template was more balanced than that of the flat surfacetemplate. The measured stitch width values of the zigzag patterns were 4.0 ± 0.7 mm forthe flat surface template and 4.3 ± 0.4 mm for the rough surface template, respectively.Sewing by the template with a flat surface produced a smaller width and a non-uniformstitch than sewing with a rough surface. Indeed, during the sewing process, the positionof the fabric was not be fixed with a polycarbonate template with a flat surface. On theother hand, the template on the surface coated with silicon carbide particles did not showmovement of the fabric during the feeding or sewing process due to the friction forcebetween the fabric and template surface. This is because the template of the rough surfacehas a higher frictional force with the surface of the fabric than the flat surface. Therefore,the fabric is fixed more firmly during the sewing process. As proof of this, the sampleusing the rough surface template showed higher values with a seam strength and seamefficiency of 118.9 kgf/cm2 and 94.7%, respectively. According to research from Jucieneand Vobolis [18], seam quality is affected by the friction force generated by the pressingfoot. They reported that the highest influence upon movement of a fabric has the designmaterial of a pressing foot. In a flat metal pressing foot, the fabric moves much more, whichfeatured a higher friction ratio. Although the system was different, it was presumed thatthe surface of the template for automatic sewing also worked with the same mechanism,such as that of the presser foot of the lockstitch sewing machine. Based on this result,subsequent experiments were conducted using a template with a rough surface. However,since the rough surface can damage the fabric surface due to friction, it was careful notto excessively rub the fabric surface and the template when loading the fabric into thesewing machine.
Processes 2021, 9, 1206 7 of 19
Table 2. Appearance and sewabilities of the sewn part according to the template surface.
Sewability Without Template Flat Surface Template Rough Surface Template
Appearance
Stitch width (mm) 1.0 ± 1.4 4.0 ± 0.7 4.3 ± 0.4Seam strength (kgf/cm2) 0.0 51.9 118.9
Seam efficiency (%) 0.0 41.3 94.7
3.2. Sewability According to Presser Height
Sewability can be defined as the ease of formation of shell structures and the ability ofa material to be seamed effectively without fabric damage and provide suitable end-useperformance [5,15]. The integration of various parameters related to the sewing thread,fabric, and sewing machine settings at their optimal level results in good sewability [16].The sewing machine parameters that can affect the sewability are the thread tension, take-up lever, sewing speed, fabric feeding mechanism, and presser height. In particular, theautomatic sewing machine used in this study has a different type of presser than the generalsewing machine. Because the presser acts as a guide by contacting the cut fabrics betweenthe fabric and the needle directly, it was determined to be the main sewing parameter.
To determine if the automatic sewing was done as well as the design, the appearanceand sewability of the sewn parts with a lock stitch or a zigzag stitch were analyzedaccording to the change in the presser height. In this study, the presser height was definedas the clearance between the bottom end of the presser and the template with fabrics. Thiscan be adjusted from 0 to 3.5 mm.
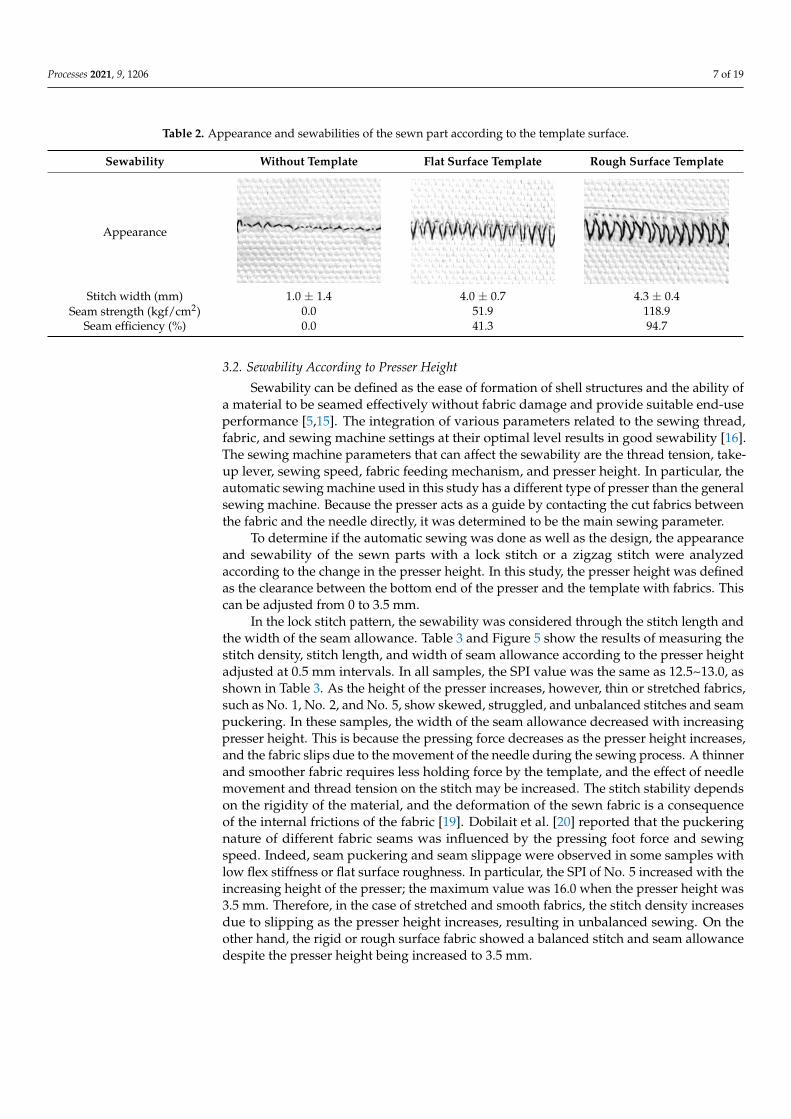
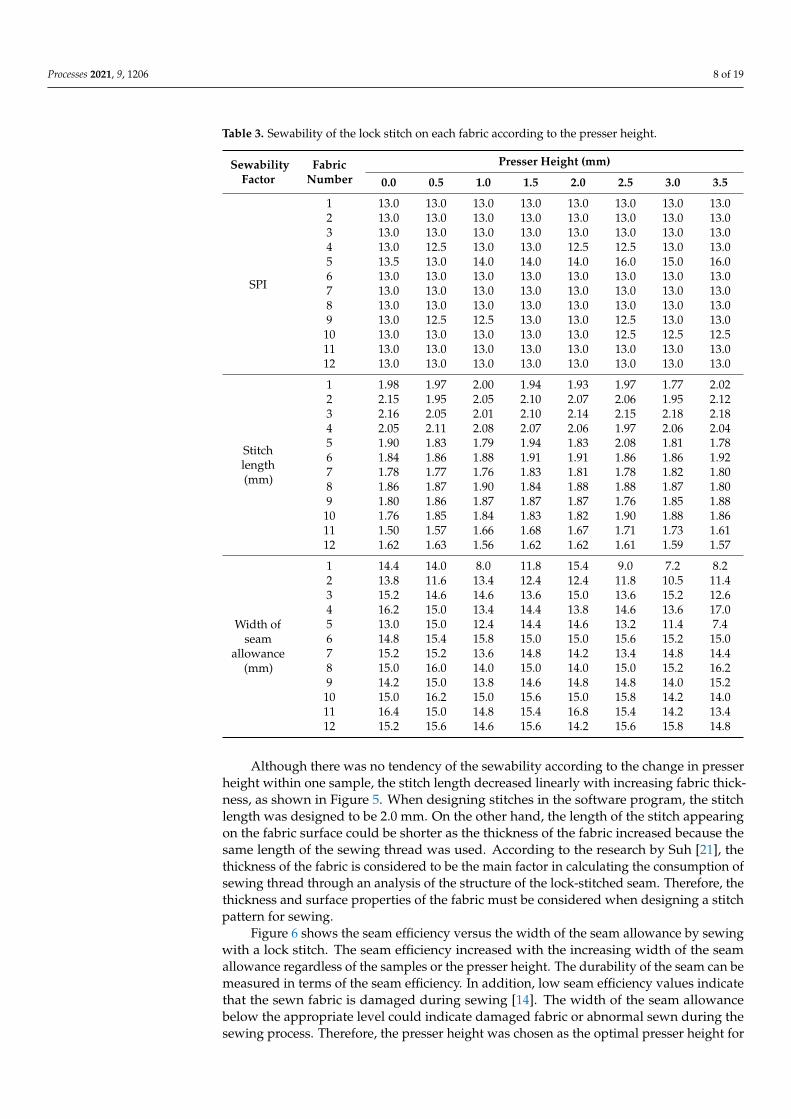
In the lock stitch pattern, the sewability was considered through the stitch length andthe width of the seam allowance. Table 3 and Figure 5 show the results of measuring thestitch density, stitch length, and width of seam allowance according to the presser heightadjusted at 0.5 mm intervals. In all samples, the SPI value was the same as 12.5~13.0, asshown in Table 3. As the height of the presser increases, however, thin or stretched fabrics,such as No. 1, No. 2, and No. 5, show skewed, struggled, and unbalanced stitches and seampuckering. In these samples, the width of the seam allowance decreased with increasingpresser height. This is because the pressing force decreases as the presser height increases,and the fabric slips due to the movement of the needle during the sewing process. A thinnerand smoother fabric requires less holding force by the template, and the effect of needlemovement and thread tension on the stitch may be increased. The stitch stability dependson the rigidity of the material, and the deformation of the sewn fabric is a consequenceof the internal frictions of the fabric [19]. Dobilait et al. [20] reported that the puckeringnature of different fabric seams was influenced by the pressing foot force and sewingspeed. Indeed, seam puckering and seam slippage were observed in some samples withlow flex stiffness or flat surface roughness. In particular, the SPI of No. 5 increased with theincreasing height of the presser; the maximum value was 16.0 when the presser height was3.5 mm. Therefore, in the case of stretched and smooth fabrics, the stitch density increasesdue to slipping as the presser height increases, resulting in unbalanced sewing. On theother hand, the rigid or rough surface fabric showed a balanced stitch and seam allowancedespite the presser height being increased to 3.5 mm.
Processes 2021, 9, 1206 8 of 19
Table 3. Sewability of the lock stitch on each fabric according to the presser height.
SewabilityFactor
FabricNumber
Presser Height (mm)
0.0 0.5 1.0 1.5 2.0 2.5 3.0 3.5
SPI
1 13.0 13.0 13.0 13.0 13.0 13.0 13.0 13.02 13.0 13.0 13.0 13.0 13.0 13.0 13.0 13.03 13.0 13.0 13.0 13.0 13.0 13.0 13.0 13.04 13.0 12.5 13.0 13.0 12.5 12.5 13.0 13.05 13.5 13.0 14.0 14.0 14.0 16.0 15.0 16.06 13.0 13.0 13.0 13.0 13.0 13.0 13.0 13.07 13.0 13.0 13.0 13.0 13.0 13.0 13.0 13.08 13.0 13.0 13.0 13.0 13.0 13.0 13.0 13.09 13.0 12.5 12.5 13.0 13.0 12.5 13.0 13.010 13.0 13.0 13.0 13.0 13.0 12.5 12.5 12.511 13.0 13.0 13.0 13.0 13.0 13.0 13.0 13.012 13.0 13.0 13.0 13.0 13.0 13.0 13.0 13.0
Stitchlength(mm)
1 1.98 1.97 2.00 1.94 1.93 1.97 1.77 2.022 2.15 1.95 2.05 2.10 2.07 2.06 1.95 2.123 2.16 2.05 2.01 2.10 2.14 2.15 2.18 2.184 2.05 2.11 2.08 2.07 2.06 1.97 2.06 2.045 1.90 1.83 1.79 1.94 1.83 2.08 1.81 1.786 1.84 1.86 1.88 1.91 1.91 1.86 1.86 1.927 1.78 1.77 1.76 1.83 1.81 1.78 1.82 1.808 1.86 1.87 1.90 1.84 1.88 1.88 1.87 1.809 1.80 1.86 1.87 1.87 1.87 1.76 1.85 1.8810 1.76 1.85 1.84 1.83 1.82 1.90 1.88 1.8611 1.50 1.57 1.66 1.68 1.67 1.71 1.73 1.6112 1.62 1.63 1.56 1.62 1.62 1.61 1.59 1.57
Width ofseam
allowance(mm)
1 14.4 14.0 8.0 11.8 15.4 9.0 7.2 8.22 13.8 11.6 13.4 12.4 12.4 11.8 10.5 11.43 15.2 14.6 14.6 13.6 15.0 13.6 15.2 12.64 16.2 15.0 13.4 14.4 13.8 14.6 13.6 17.05 13.0 15.0 12.4 14.4 14.6 13.2 11.4 7.46 14.8 15.4 15.8 15.0 15.0 15.6 15.2 15.07 15.2 15.2 13.6 14.8 14.2 13.4 14.8 14.48 15.0 16.0 14.0 15.0 14.0 15.0 15.2 16.29 14.2 15.0 13.8 14.6 14.8 14.8 14.0 15.210 15.0 16.2 15.0 15.6 15.0 15.8 14.2 14.011 16.4 15.0 14.8 15.4 16.8 15.4 14.2 13.412 15.2 15.6 14.6 15.6 14.2 15.6 15.8 14.8
Although there was no tendency of the sewability according to the change in presserheight within one sample, the stitch length decreased linearly with increasing fabric thick-ness, as shown in Figure 5. When designing stitches in the software program, the stitchlength was designed to be 2.0 mm. On the other hand, the length of the stitch appearingon the fabric surface could be shorter as the thickness of the fabric increased because thesame length of the sewing thread was used. According to the research by Suh [21], thethickness of the fabric is considered to be the main factor in calculating the consumption ofsewing thread through an analysis of the structure of the lock-stitched seam. Therefore, thethickness and surface properties of the fabric must be considered when designing a stitchpattern for sewing.
Figure 6 shows the seam efficiency versus the width of the seam allowance by sewingwith a lock stitch. The seam efficiency increased with the increasing width of the seamallowance regardless of the samples or the presser height. The durability of the seam can bemeasured in terms of the seam efficiency. In addition, low seam efficiency values indicatethat the sewn fabric is damaged during sewing [14]. The width of the seam allowancebelow the appropriate level could indicate damaged fabric or abnormal sewn during thesewing process. Therefore, the presser height was chosen as the optimal presser height for

Processes 2021, 9, 1206 9 of 19
each sample when the width of the seam allowance is close to the design and the seamefficiency is high.
Figure 5. Sewability of the lock stitch according to the change in the presser height: (a) stitch length, (b) width of theseam allowance.
Figure 6. Seam efficiency of the lock stitch according to the width of the seam allowance.
The presser height for each sample was selected for lock stitch sewing based on theseam efficiency and stitch length values obtained through the experiment results: 0.0 mmfor No. 1, No. 2, and No. 3; 1.0 mm for No. 4; 0.5 mm for No. 5; 2.0 mm for No. 6 andNo. 7; 2.5 mm for No. 8, No. 9, and No. 10; 3.0 mm for No. 11; 3.5 mm for No. 12.
On the other hand, the zigzag stitch was chosen to join two pieces of fabric throughan automatic sewing machine as a method to imitate a cover stitch or flatlock stitch in thisstudy. Unlike the lock stitch, the zigzag stitch was expected to be affected by the movement
Processes 2021, 9, 1206 10 of 19
of the presser foot and needle during the sewing process because the cut edges of the fabricwere in contact with each other to sew, and the sewing needle moved repeatedly left andright of the seam line. Therefore, the experiment was conducted by setting the presserheight larger than the thickness of the fabrics so that the presser foot does not contactthe fabric during the sewing process directly. Furthermore, thin fabrics with a thicknessof 0.5 mm or less, such as No. 1~No. 5, were excluded from this experiment. This isbecause the stitches were not formed properly as the fabric was moved by the automaticfeeding system when the sample was automatically inserted in the sewing machine or theneedle or sewing thread moving during the sewing process, despite using the template ofa rough surface.
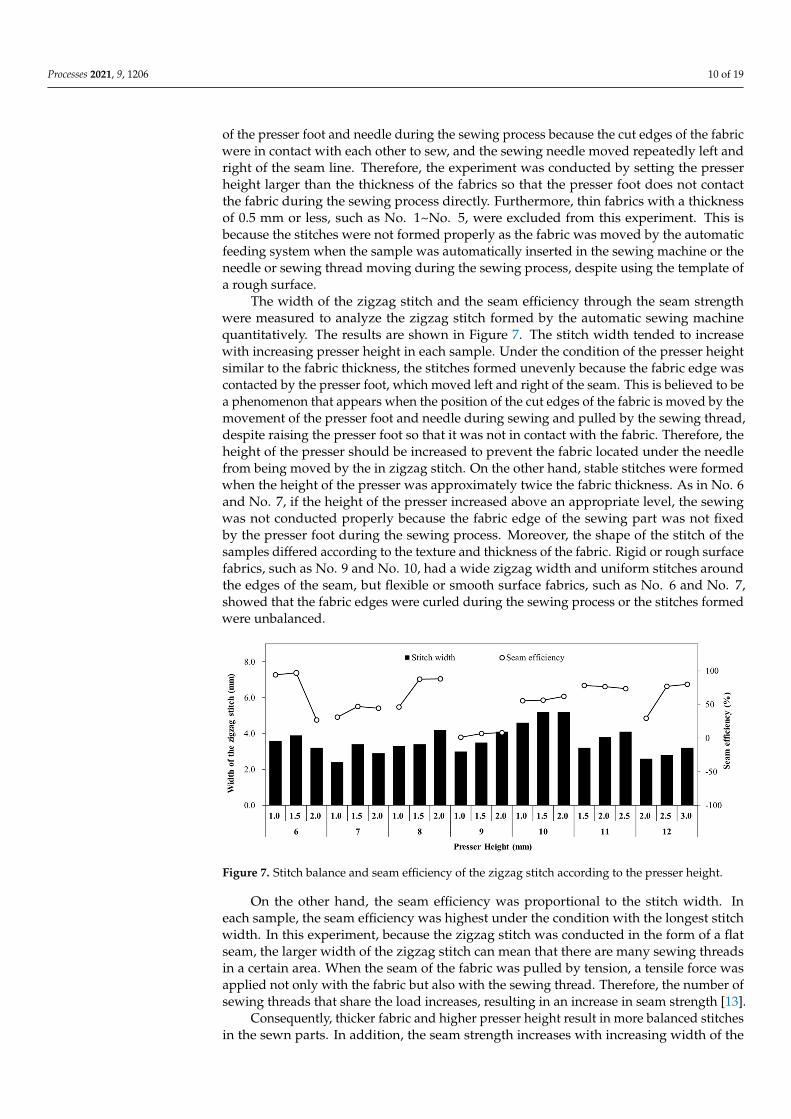
The width of the zigzag stitch and the seam efficiency through the seam strengthwere measured to analyze the zigzag stitch formed by the automatic sewing machinequantitatively. The results are shown in Figure 7. The stitch width tended to increasewith increasing presser height in each sample. Under the condition of the presser heightsimilar to the fabric thickness, the stitches formed unevenly because the fabric edge wascontacted by the presser foot, which moved left and right of the seam. This is believed to bea phenomenon that appears when the position of the cut edges of the fabric is moved by themovement of the presser foot and needle during sewing and pulled by the sewing thread,despite raising the presser foot so that it was not in contact with the fabric. Therefore, theheight of the presser should be increased to prevent the fabric located under the needlefrom being moved by the in zigzag stitch. On the other hand, stable stitches were formedwhen the height of the presser was approximately twice the fabric thickness. As in No. 6and No. 7, if the height of the presser increased above an appropriate level, the sewingwas not conducted properly because the fabric edge of the sewing part was not fixedby the presser foot during the sewing process. Moreover, the shape of the stitch of thesamples differed according to the texture and thickness of the fabric. Rigid or rough surfacefabrics, such as No. 9 and No. 10, had a wide zigzag width and uniform stitches aroundthe edges of the seam, but flexible or smooth surface fabrics, such as No. 6 and No. 7,showed that the fabric edges were curled during the sewing process or the stitches formedwere unbalanced.
Figure 7. Stitch balance and seam efficiency of the zigzag stitch according to the presser height.
On the other hand, the seam efficiency was proportional to the stitch width. Ineach sample, the seam efficiency was highest under the condition with the longest stitchwidth. In this experiment, because the zigzag stitch was conducted in the form of a flatseam, the larger width of the zigzag stitch can mean that there are many sewing threadsin a certain area. When the seam of the fabric was pulled by tension, a tensile force wasapplied not only with the fabric but also with the sewing thread. Therefore, the number ofsewing threads that share the load increases, resulting in an increase in seam strength [13].
Consequently, thicker fabric and higher presser height result in more balanced stitchesin the sewn parts. In addition, the seam strength increases with increasing width of the
Processes 2021, 9, 1206 11 of 19
stitch, resulting in excellent seam efficiency. In this study, the condition of a high seamefficiency and the wide width of the stitch was chosen as the optimal presser heightcondition in each fabric for the zigzag stitch. The optimal presser height value for eachsample was as follows: 1.5 mm for No. 6 and No. 7; 2.0 mm for No. 8, No. 9, and No. 10;2.5 mm for No. 11; 3.0 mm for No. 12.
3.3. Sewability According to Sewing Speed
The sewing speed is related directly to productivity. The fast sewing speed shortensthe production time and increases the production amount, reducing the cost. On the otherhand, an excessively fast sewing speed may cause sewing damage. Lower sewing speedsare effective in controlling the overheating problems of the needles. At the same time, thenumber of yarn breakages is reduced [12]. To improve the productivity, it is necessary toderive the optimal RPM conditions that shorten the sewing time, while making a balancedstitch pattern according to the fabric properties. Therefore, the effect of the sewing speedon the sewability was examined according to the mechanical properties of each fabric.To this end, the sewing speed was adjusted to 200, 400, and 800 rpm to perform the lockstitch and the zigzag stitch according to the optimal presser height for each fabric sampleidentified above.
Table 4 lists SPI, stitch length, and seam allowance values of the sewn part by the lockstitch according to the sewing speed. As expected, the sewability worsened as the sewingspeed increased. In the No. 1~No. 5 fabric samples, which are thin and lightweight, it wasconfirmed that a faster sewing speed resulted in a shorter stitch length and narrower seamallowance. This is because the samples slipped within the template without followingthe movement of the template as the sewing speed increased. On the other hand, inthe thick fabrics of No. 6~No. 12 samples, the stitch length increased with increasingsewing speed. For fabrics with smooth surfaces such as No. 7 and No. 11, the stitchlength increased and the SPI decreased with increasing sewing speed. Milda Juciene andJonas Vobolis [22] reported that the sewing speed has the greatest influence on the stitchlength. They reported that the dependencies of the stitch length show that different frictionforces cause the variations of the stitch length in the range of 10~20%. Indeed, accordingto their experiment, the stitch length may vary up to 0.01 mm when sewing at a lowerspeed, whereas the stitching length may vary up to 0.03 mm when sewing by higher speedthrough a one-needle lockstitch sewing machine. Therefore, the friction force between thetemplate and sample surface decreased with increasing sewing speed. The samples weremore affected by the movement of the needle and the inertia force.
Table 4. Sewability of the lock stitch sewn parts on each fabric according to the sewing speed.
Sewability Factor Fabric NumberSewing Speed (RPM)
200 400 800
SPI
1 13.0 13.0 13.02 13.0 13.0 13.03 13.0 13.0 13.04 13.0 13.0 12.55 13.0 13.0 13.56 13.0 12.5 12.57 13.0 12.5 8.58 13.0 13.0 11.59 12.5 13.0 13.5
10 12.5 13.0 13.011 13.0 12.5 7.012 13.0 13.0 13.0
Processes 2021, 9, 1206 12 of 19
Table 4. Cont.
Sewability Factor Fabric NumberSewing Speed (RPM)
200 400 800
Stitch length(mm)
1 2.0 2.0 2.02 2.1 1.8 1.73 2.2 2.2 2.14 2.1 2.0 1.95 1.8 1.7 1.66 1.9 2.2 2.27 1.8 2.1 3.28 1.9 2.1 2.69 1.8 2.0 2.0
10 1.9 2.1 2.011 1.7 2.0 2.712 1.6 1.9 1.7
Width of seamallowance
(mm)
1 14.4 10.0 10.82 13.8 9.0 7.63 15.2 14.4 14.04 13.4 12.4 13.25 15.0 12.2 12.46 15.0 14.8 14.67 14.8 14.4 14.48 15.0 13.6 15.09 14.8 14.0 15.0
10 15.8 13.2 14.611 14.2 14.2 15.612 14.8 14.4 14.6
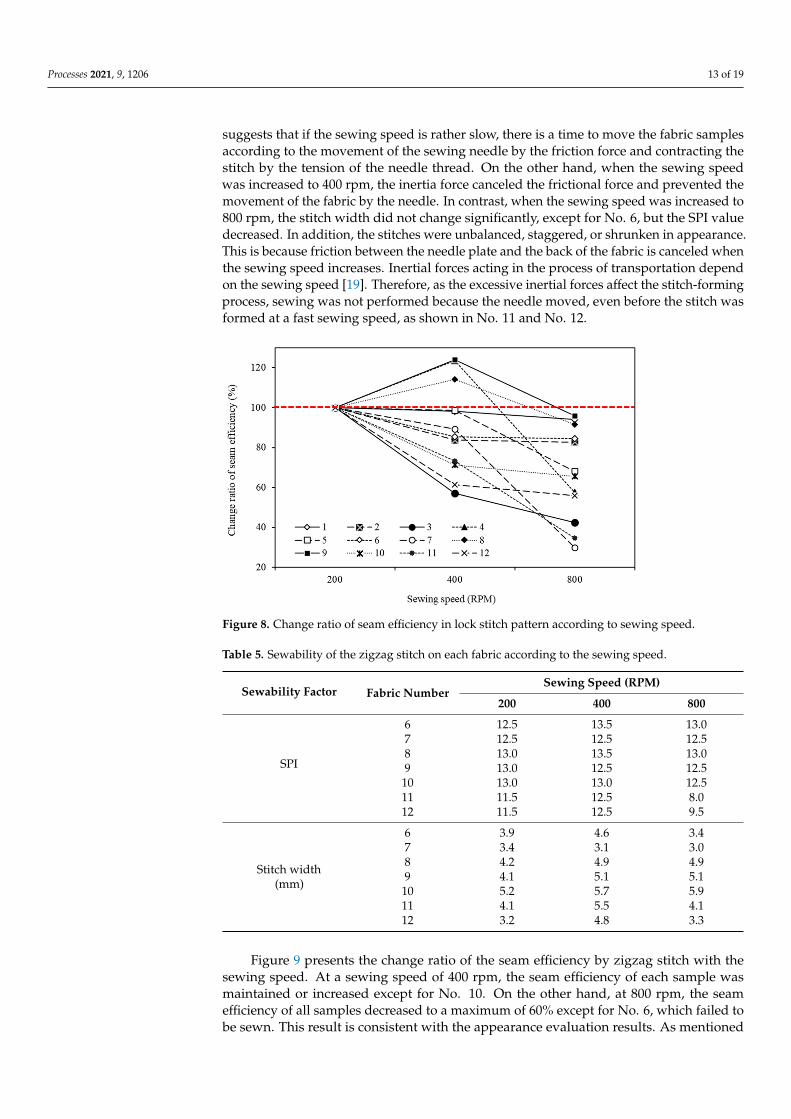
Figure 8 shows the change ratio of the seam efficiency with the sewing speed. Thechange ratio of the seam efficiency is the percentage of the seam efficiency value of thesewn sample at each sewing speed relative to the seam efficiency of the sample sewn at200 rpm. At a sewing speed of 400 rpm, the seam efficiency of each sample decreasedexcept for No. 8, No. 9, and No. 12. At 800 rpm, the seam efficiency of all samplesdecreased to a maximum of 30%. The needle thread is subjected to repeated tensile stressesand is affected by heat, bending, pressure, torsion, and wearing during the sewing process.The sewing speed influences the level of these stresses. Therefore, high-speed sewingoperation leads to an overall reduction in the tensile properties of the needle thread [22].Naeem et al. [23] reported that the seam strength decreases with increasing sewing speedbecause the needle heat rises linearly according to the speed. In addition, the percentageloss of the seam strength is much higher in lightweight fabric than medium or heavyweightfabrics. In this study, however, the seam efficiency of the three samples, No. 8, No. 9, andNo. 12, increased slightly under 400 rpm sewing. These fabrics were less affected by theslip between the fabric surface or the movement of the needle despite the fast sewing speedbecause they were rough and thick. As a result, as the stitch length at 400 rpm was widerthan at 200 rpm, the ability to withstand the tension force was improved further, and theseam efficiency was increased. Through the results of this experiment, 200 rpm was foundto create the best conditions in all fabric samples for the lock stitch.
Table 5 shows SPI and stitch width of the sewn part by the zigzag stitch accordingto the sewing speed. Unlike the expectation that the sewability will deteriorate when thesewing speed is fast, some samples showed balanced stitches on the sewn part, even at highspeed. When the sewing speed was increased to 400 rpm, most of the samples tended toincrease both the SPI value and stitch width, and a very balanced stitch was made. Frictionforces play an important role in the stitch formation process. The highest stitch lengthvariation was at the lowest friction force and the highest rotation frequency of the mainshaft. The stitch length variance decreased with increasing friction force, but the stitchlength variance also increased with increasing rotational speed of the main shaft [24]. This
Processes 2021, 9, 1206 13 of 19
suggests that if the sewing speed is rather slow, there is a time to move the fabric samplesaccording to the movement of the sewing needle by the friction force and contracting thestitch by the tension of the needle thread. On the other hand, when the sewing speedwas increased to 400 rpm, the inertia force canceled the frictional force and prevented themovement of the fabric by the needle. In contrast, when the sewing speed was increased to800 rpm, the stitch width did not change significantly, except for No. 6, but the SPI valuedecreased. In addition, the stitches were unbalanced, staggered, or shrunken in appearance.This is because friction between the needle plate and the back of the fabric is canceled whenthe sewing speed increases. Inertial forces acting in the process of transportation dependon the sewing speed [19]. Therefore, as the excessive inertial forces affect the stitch-formingprocess, sewing was not performed because the needle moved, even before the stitch wasformed at a fast sewing speed, as shown in No. 11 and No. 12.
Figure 8. Change ratio of seam efficiency in lock stitch pattern according to sewing speed.
Table 5. Sewability of the zigzag stitch on each fabric according to the sewing speed.
Sewability Factor Fabric NumberSewing Speed (RPM)
200 400 800
SPI
6 12.5 13.5 13.07 12.5 12.5 12.58 13.0 13.5 13.09 13.0 12.5 12.510 13.0 13.0 12.511 11.5 12.5 8.012 11.5 12.5 9.5
Stitch width(mm)
6 3.9 4.6 3.47 3.4 3.1 3.08 4.2 4.9 4.99 4.1 5.1 5.110 5.2 5.7 5.911 4.1 5.5 4.112 3.2 4.8 3.3
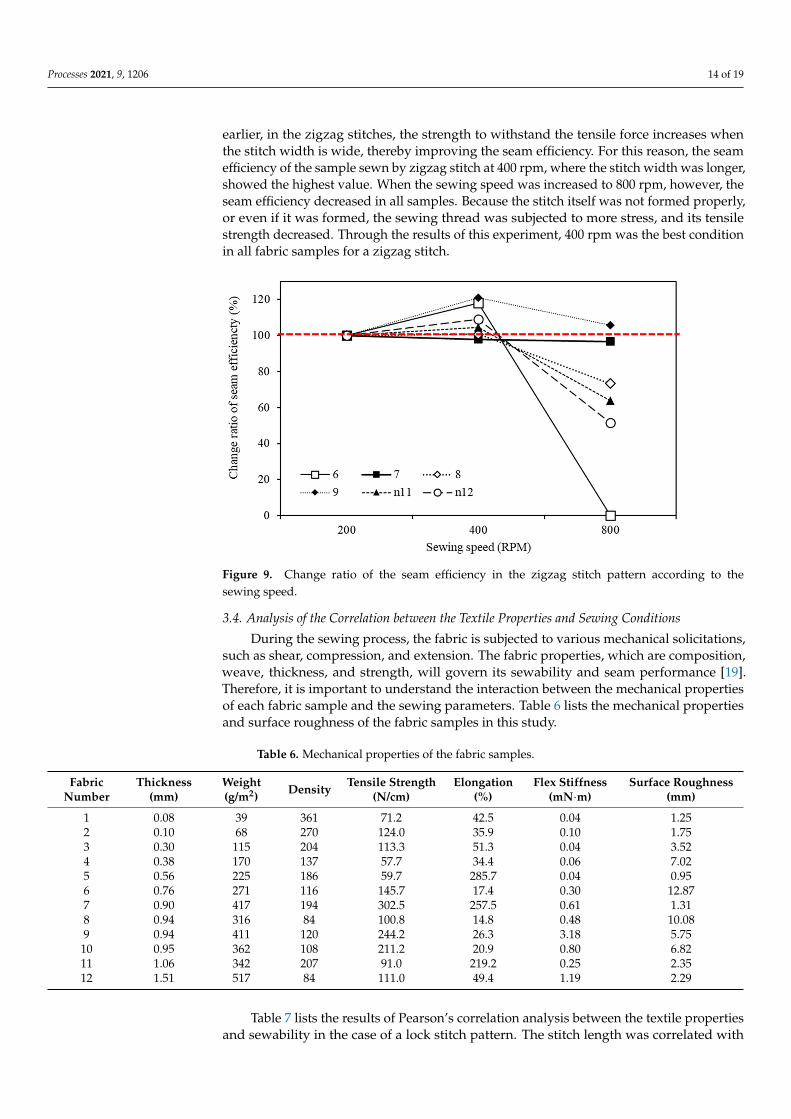
Figure 9 presents the change ratio of the seam efficiency by zigzag stitch with thesewing speed. At a sewing speed of 400 rpm, the seam efficiency of each sample wasmaintained or increased except for No. 10. On the other hand, at 800 rpm, the seamefficiency of all samples decreased to a maximum of 60% except for No. 6, which failed tobe sewn. This result is consistent with the appearance evaluation results. As mentioned
Processes 2021, 9, 1206 14 of 19
earlier, in the zigzag stitches, the strength to withstand the tensile force increases whenthe stitch width is wide, thereby improving the seam efficiency. For this reason, the seamefficiency of the sample sewn by zigzag stitch at 400 rpm, where the stitch width was longer,showed the highest value. When the sewing speed was increased to 800 rpm, however, theseam efficiency decreased in all samples. Because the stitch itself was not formed properly,or even if it was formed, the sewing thread was subjected to more stress, and its tensilestrength decreased. Through the results of this experiment, 400 rpm was the best conditionin all fabric samples for a zigzag stitch.
Figure 9. Change ratio of the seam efficiency in the zigzag stitch pattern according to thesewing speed.
3.4. Analysis of the Correlation between the Textile Properties and Sewing Conditions
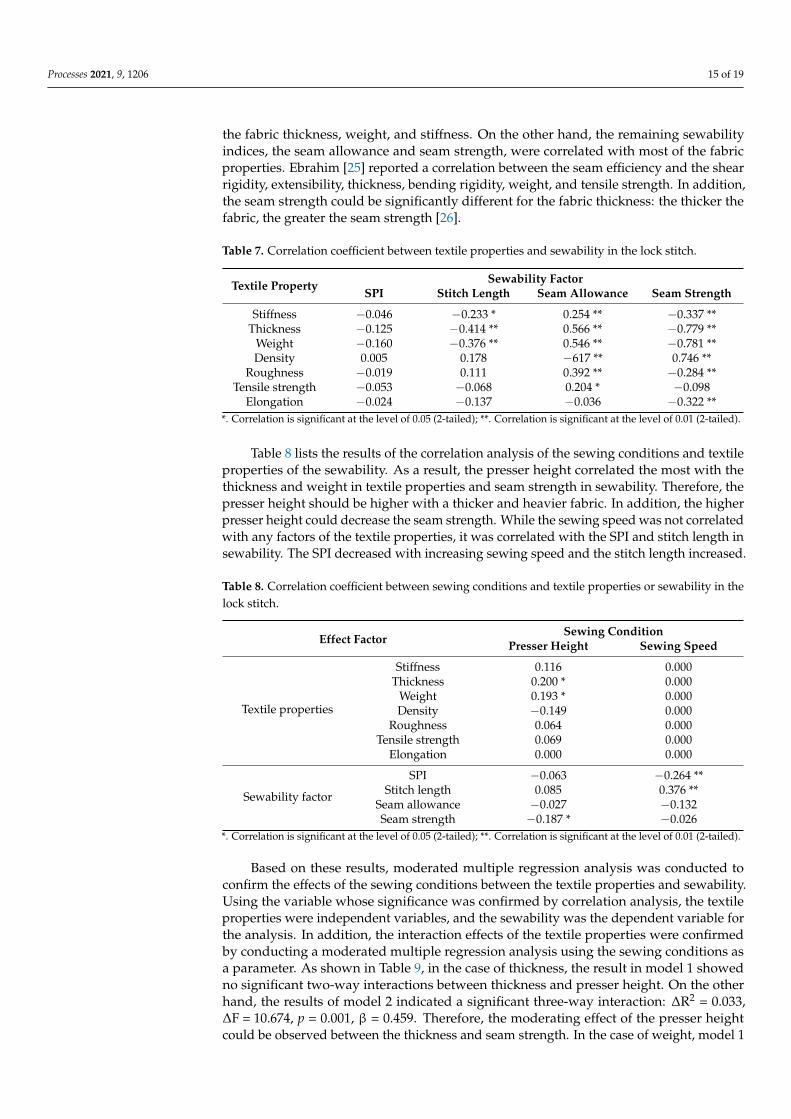
During the sewing process, the fabric is subjected to various mechanical solicitations,such as shear, compression, and extension. The fabric properties, which are composition,weave, thickness, and strength, will govern its sewability and seam performance [19].Therefore, it is important to understand the interaction between the mechanical propertiesof each fabric sample and the sewing parameters. Table 6 lists the mechanical propertiesand surface roughness of the fabric samples in this study.
Table 6. Mechanical properties of the fabric samples.
FabricNumber
Thickness(mm)
Weight(g/m2) Density Tensile Strength
(N/cm)Elongation
(%)Flex Stiffness
(mN·m)Surface Roughness
(mm)
1 0.08 39 361 71.2 42.5 0.04 1.252 0.10 68 270 124.0 35.9 0.10 1.753 0.30 115 204 113.3 51.3 0.04 3.524 0.38 170 137 57.7 34.4 0.06 7.025 0.56 225 186 59.7 285.7 0.04 0.956 0.76 271 116 145.7 17.4 0.30 12.877 0.90 417 194 302.5 257.5 0.61 1.318 0.94 316 84 100.8 14.8 0.48 10.089 0.94 411 120 244.2 26.3 3.18 5.75
10 0.95 362 108 211.2 20.9 0.80 6.8211 1.06 342 207 91.0 219.2 0.25 2.3512 1.51 517 84 111.0 49.4 1.19 2.29
Table 7 lists the results of Pearson’s correlation analysis between the textile propertiesand sewability in the case of a lock stitch pattern. The stitch length was correlated with
Processes 2021, 9, 1206 15 of 19
the fabric thickness, weight, and stiffness. On the other hand, the remaining sewabilityindices, the seam allowance and seam strength, were correlated with most of the fabricproperties. Ebrahim [25] reported a correlation between the seam efficiency and the shearrigidity, extensibility, thickness, bending rigidity, weight, and tensile strength. In addition,the seam strength could be significantly different for the fabric thickness: the thicker thefabric, the greater the seam strength [26].
Table 7. Correlation coefficient between textile properties and sewability in the lock stitch.
Textile Property Sewability FactorSPI Stitch Length Seam Allowance Seam Strength
Stiffness −0.046 −0.233 * 0.254 ** −0.337 **Thickness −0.125 −0.414 ** 0.566 ** −0.779 **
Weight −0.160 −0.376 ** 0.546 ** −0.781 **Density 0.005 0.178 −617 ** 0.746 **
Roughness −0.019 0.111 0.392 ** −0.284 **Tensile strength −0.053 −0.068 0.204 * −0.098
Elongation −0.024 −0.137 −0.036 −0.322 ***. Correlation is significant at the level of 0.05 (2-tailed); **. Correlation is significant at the level of 0.01 (2-tailed).
Table 8 lists the results of the correlation analysis of the sewing conditions and textileproperties of the sewability. As a result, the presser height correlated the most with thethickness and weight in textile properties and seam strength in sewability. Therefore, thepresser height should be higher with a thicker and heavier fabric. In addition, the higherpresser height could decrease the seam strength. While the sewing speed was not correlatedwith any factors of the textile properties, it was correlated with the SPI and stitch length insewability. The SPI decreased with increasing sewing speed and the stitch length increased.
Table 8. Correlation coefficient between sewing conditions and textile properties or sewability in thelock stitch.
Effect FactorSewing Condition
Presser Height Sewing Speed
Textile properties
Stiffness 0.116 0.000Thickness 0.200 * 0.000
Weight 0.193 * 0.000Density −0.149 0.000
Roughness 0.064 0.000Tensile strength 0.069 0.000
Elongation 0.000 0.000
Sewability factor
SPI −0.063 −0.264 **Stitch length 0.085 0.376 **
Seam allowance −0.027 −0.132Seam strength −0.187 * −0.026
*. Correlation is significant at the level of 0.05 (2-tailed); **. Correlation is significant at the level of 0.01 (2-tailed).
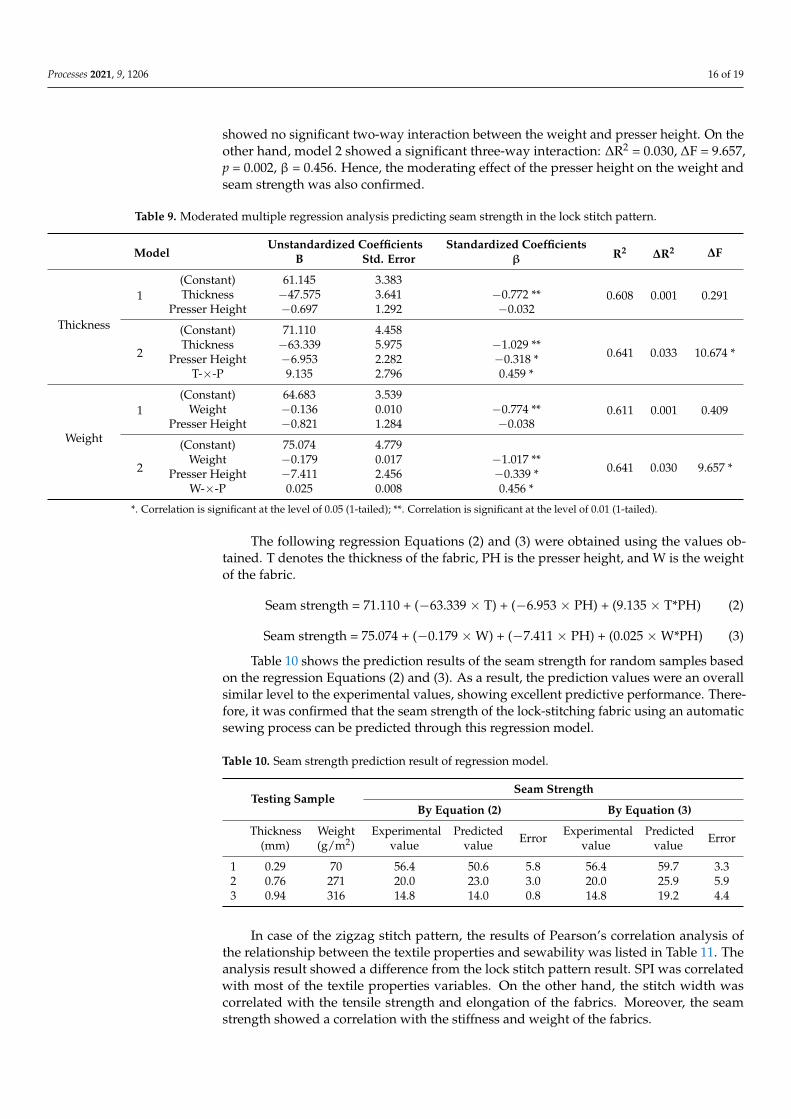
Based on these results, moderated multiple regression analysis was conducted toconfirm the effects of the sewing conditions between the textile properties and sewability.Using the variable whose significance was confirmed by correlation analysis, the textileproperties were independent variables, and the sewability was the dependent variable forthe analysis. In addition, the interaction effects of the textile properties were confirmedby conducting a moderated multiple regression analysis using the sewing conditions asa parameter. As shown in Table 9, in the case of thickness, the result in model 1 showedno significant two-way interactions between thickness and presser height. On the otherhand, the results of model 2 indicated a significant three-way interaction: ∆R2 = 0.033,∆F = 10.674, p = 0.001, β = 0.459. Therefore, the moderating effect of the presser heightcould be observed between the thickness and seam strength. In the case of weight, model 1
Processes 2021, 9, 1206 16 of 19
showed no significant two-way interaction between the weight and presser height. On theother hand, model 2 showed a significant three-way interaction: ∆R2 = 0.030, ∆F = 9.657,p = 0.002, β = 0.456. Hence, the moderating effect of the presser height on the weight andseam strength was also confirmed.
Table 9. Moderated multiple regression analysis predicting seam strength in the lock stitch pattern.
ModelUnstandardized Coefficients Standardized Coefficients
R2 ∆R2 ∆FB Std. Error β
Thickness
1(Constant) 61.145 3.383
0.608 0.001 0.291Thickness −47.575 3.641 −0.772 **Presser Height −0.697 1.292 −0.032
2
(Constant) 71.110 4.458
0.641 0.033 10.674 *Thickness −63.339 5.975 −1.029 **
Presser Height −6.953 2.282 −0.318 *T-×-P 9.135 2.796 0.459 *
Weight
1(Constant) 64.683 3.539
0.611 0.001 0.409Weight −0.136 0.010 −0.774 **Presser Height −0.821 1.284 −0.038
2
(Constant) 75.074 4.779
0.641 0.030 9.657 *Weight −0.179 0.017 −1.017 **
Presser Height −7.411 2.456 −0.339 *W-×-P 0.025 0.008 0.456 *
*. Correlation is significant at the level of 0.05 (1-tailed); **. Correlation is significant at the level of 0.01 (1-tailed).
The following regression Equations (2) and (3) were obtained using the values ob-tained. T denotes the thickness of the fabric, PH is the presser height, and W is the weightof the fabric.
Seam strength = 71.110 + (−63.339 × T) + (−6.953 × PH) + (9.135 × T*PH) (2)
Seam strength = 75.074 + (−0.179 × W) + (−7.411 × PH) + (0.025 × W*PH) (3)
Table 10 shows the prediction results of the seam strength for random samples basedon the regression Equations (2) and (3). As a result, the prediction values were an overallsimilar level to the experimental values, showing excellent predictive performance. There-fore, it was confirmed that the seam strength of the lock-stitching fabric using an automaticsewing process can be predicted through this regression model.
Table 10. Seam strength prediction result of regression model.
Testing SampleSeam Strength
By Equation (2) By Equation (3)
Thickness(mm)
Weight(g/m2)
Experimentalvalue
Predictedvalue Error Experimental
valuePredicted
value Error
1 0.29 70 56.4 50.6 5.8 56.4 59.7 3.32 0.76 271 20.0 23.0 3.0 20.0 25.9 5.93 0.94 316 14.8 14.0 0.8 14.8 19.2 4.4
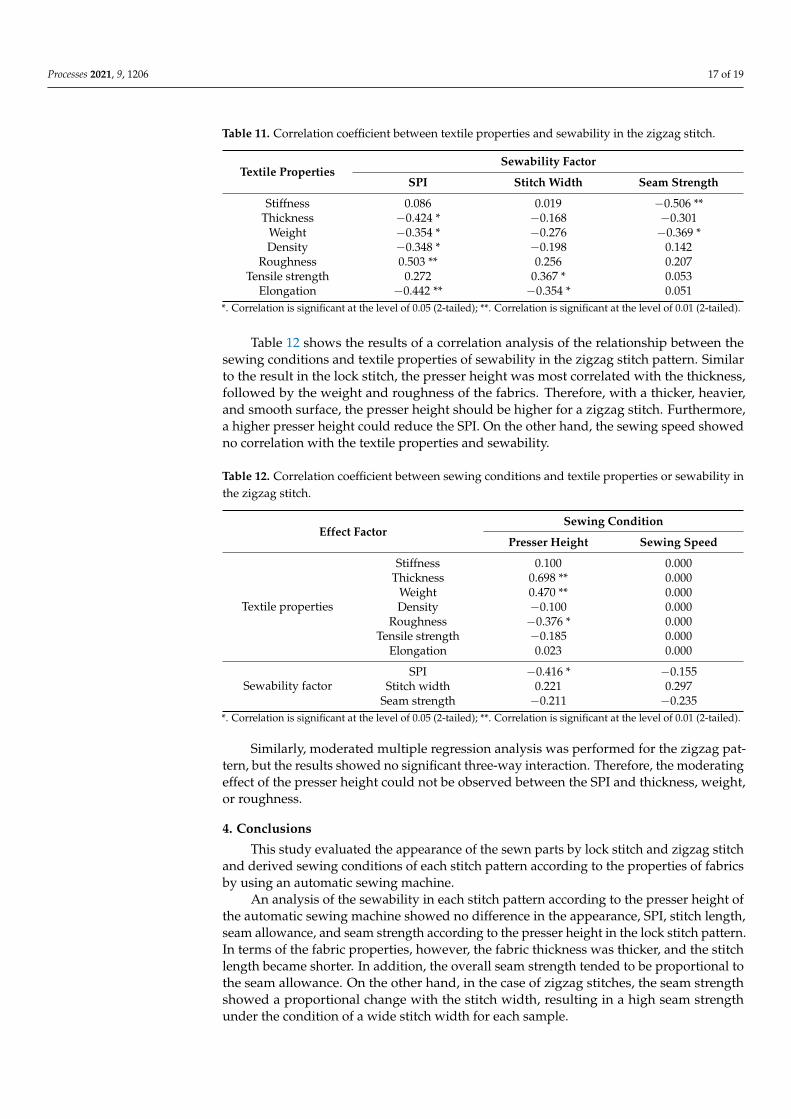
In case of the zigzag stitch pattern, the results of Pearson’s correlation analysis ofthe relationship between the textile properties and sewability was listed in Table 11. Theanalysis result showed a difference from the lock stitch pattern result. SPI was correlatedwith most of the textile properties variables. On the other hand, the stitch width wascorrelated with the tensile strength and elongation of the fabrics. Moreover, the seamstrength showed a correlation with the stiffness and weight of the fabrics.
Processes 2021, 9, 1206 17 of 19
Table 11. Correlation coefficient between textile properties and sewability in the zigzag stitch.
Textile PropertiesSewability Factor
SPI Stitch Width Seam Strength
Stiffness 0.086 0.019 −0.506 **Thickness −0.424 * −0.168 −0.301
Weight −0.354 * −0.276 −0.369 *Density −0.348 * −0.198 0.142
Roughness 0.503 ** 0.256 0.207Tensile strength 0.272 0.367 * 0.053
Elongation −0.442 ** −0.354 * 0.051*. Correlation is significant at the level of 0.05 (2-tailed); **. Correlation is significant at the level of 0.01 (2-tailed).
Table 12 shows the results of a correlation analysis of the relationship between thesewing conditions and textile properties of sewability in the zigzag stitch pattern. Similarto the result in the lock stitch, the presser height was most correlated with the thickness,followed by the weight and roughness of the fabrics. Therefore, with a thicker, heavier,and smooth surface, the presser height should be higher for a zigzag stitch. Furthermore,a higher presser height could reduce the SPI. On the other hand, the sewing speed showedno correlation with the textile properties and sewability.
Table 12. Correlation coefficient between sewing conditions and textile properties or sewability inthe zigzag stitch.
Effect FactorSewing Condition
Presser Height Sewing Speed
Textile properties
Stiffness 0.100 0.000Thickness 0.698 ** 0.000
Weight 0.470 ** 0.000Density −0.100 0.000
Roughness −0.376 * 0.000Tensile strength −0.185 0.000
Elongation 0.023 0.000
Sewability factorSPI −0.416 * −0.155
Stitch width 0.221 0.297Seam strength −0.211 −0.235
*. Correlation is significant at the level of 0.05 (2-tailed); **. Correlation is significant at the level of 0.01 (2-tailed).
Similarly, moderated multiple regression analysis was performed for the zigzag pat-tern, but the results showed no significant three-way interaction. Therefore, the moderatingeffect of the presser height could not be observed between the SPI and thickness, weight,or roughness.
4. Conclusions
This study evaluated the appearance of the sewn parts by lock stitch and zigzag stitchand derived sewing conditions of each stitch pattern according to the properties of fabricsby using an automatic sewing machine.
An analysis of the sewability in each stitch pattern according to the presser height ofthe automatic sewing machine showed no difference in the appearance, SPI, stitch length,seam allowance, and seam strength according to the presser height in the lock stitch pattern.In terms of the fabric properties, however, the fabric thickness was thicker, and the stitchlength became shorter. In addition, the overall seam strength tended to be proportional tothe seam allowance. On the other hand, in the case of zigzag stitches, the seam strengthshowed a proportional change with the stitch width, resulting in a high seam strengthunder the condition of a wide stitch width for each sample.
Processes 2021, 9, 1206 18 of 19
An evaluation of the sewability according to the sewing speed showed that in thelockstitch pattern, as the sewing speed increased, the stitch length and the seam allowancetended to decrease in thin fabrics. Therefore, it showed poor sewing quality. On the otherhand, in thick fabrics, the stitch length increased with increasing sewing speed. Therefore,it showed the best seam strength at 200 RPM in the lock stitch pattern. In the case of zigzagstitches, although the speed was increased to 400 RPM, the stitch was formed uniformly,and the seam strength was also superior to the 200 RPM condition. On the other hand,the sewing quality deteriorated when the sewing speed reached 800 RPM. Therefore, the400 RPM condition was suitable for the zigzag stitch. Statistical analysis confirmed thatthe moderating effect of the sewing condition between the fabric properties and sewabilitywas observed only in the lock stitch.
These results are expected to be used as basic data for research on the automation of thesewing process for a smart factory of garment manufacturing in the future. Nevertheless,the current study had limitations in that various types of fabric and stitch patterns werenot used. In addition, just one thread was used, which is also a limitation to generalizingthe research findings. Therefore, more experiments and evaluations of more diverse fabricsamples, sewing conditions, stitch patterns, and sewing threads are needed.
Author Contributions: Writing—original draft preparation and methodology, S.L.; methodologyand investigation, S.R.; conceptualization and project administration, D.L.; writing—review andediting, W.J. All authors have read and agreed to the published version of the manuscript.
Funding: This research was supported through the Korea Institute of Industrial Technology (kitechJA-21-0001) and Gyeonggi-Do Technology Development Program (kitech IZ-21-0001) as “Develop-ment of smart textronic products based on electronic fiber and textiles”.
Institutional Review Board Statement: Not applicable.
Informed Consent Statement: Not applicable.
Data Availability Statement: Data from this study can be made available upon request.
Conflicts of Interest: The authors declare no conflict of interest.
References1. Sima, V.; Gheorghe, I.G.; Subic, J.; Nancu, D. Influences of the Industry 4.0 Revolution on the human capital development and
consumer behavior: A systematic review. Sustainability 2020, 12, 4035. [CrossRef]2. Arakelyan, E.K.; Kosoy, A.A.; Mezin, S.V.; Pashchenko, F.F. Application of the basic principles of “Industry 4.0” in the intellectual-
ization of automated control systems of modern thermal power plants. Procedia Comput. Sci. 2021, 184, 865–870.3. Ashima, R.; Haleem, A.; Bahl, S.; Javaid, M.; Mahla, S.K.; Singh, S. Automation and manufacturing of smart materials in additive
manufacturing technologies using Internet of Things towards the adoption of industry 4.0. Mater. Today 2021, 45, 5081–5088.4. Ribeiro, J.; Lima, R.; Eckhardt, T.; Paiva, S. Robotic process automation and artificial intelligence in industry 4.0: A literature
review. Procedia Comput. Sci. 2021, 181, 51–58. [CrossRef]5. Nayak, R.; Padhye, R. Automation in Garment Manufacturing; Woodhead Publishing: Duxford, UK, 2018; p. 290.6. An, I.Y. The fourth industrial revolution: The potential impacts of artificial intelligence and automation technologies on gender
equality. Pitt Policy J. 2020, 11, 108–123.7. Kondratas, A. Robotic gripping device for garment handling operations and its adaptive control. Fibers Text. East. Eur. 2005, 13,
84–89.8. Le, T.H.L.; Jilich, M.; Landini, A.; Zoppi, M.; Zlatanov, D.; Molfino, R. On the development of a specialized flexible gripper for
garment handling. J. Autom. Control Eng. 2013, 1, 255–259. [CrossRef]9. Suh, M. Automated cutting and sewing for industry 4.0 at ITMA 2019. J. Text. App. Technol. Manag. 2019, 1–13. Available online:
https://ojs.cnr.ncsu.edu/index.php/JTATM/article/view/16453 (accessed on 10 July 2021).10. Lee, S.; Rho, S.H.; Lee, S.; Lee, J.; Lee, S.W.; Lim, D.; Jeong, W. Implementation of an automated manufacturing process for smart
clothing: The case study of a smart sports bra. Processes 2021, 9, 289. [CrossRef]11. Yoshimi, T.; Takezawa, K.; Hirayama, M. An improvement of trajectory tracking accuracy of automatic sewing robot system by
variable gain learning control. IFAC Paper OnLine 2018, 51, 1–6. [CrossRef]12. Thilagavathi, G.; Viju, S. Process Control in Textile Manufacturing; Woodhead Publishing: Duxford, UK, 2013; pp. 428–473.13. Rajput, B.; Kakde, M.; Gulhane, S.; Raichurkar, P.P. Effect of sewing parameters on seam strength and seam efficiency. Trends Text.
Eng. Fash. Technol. 2018, 4, 4–5.14. Gurarda, A. Seam performance of garments. In Textile Manufacturing Processes; Intech: London, UK, 2019.
Processes 2021, 9, 1206 19 of 19
15. Haghighat, E.; Etrati, S.M.; Najar, S.S. Evaluation of woven denim fabric sewability based on needle penetration force. J. Eng.Fiber Fabr. 2014, 9, 47–60. [CrossRef]
16. Nayak, R. Sewing performance of stretch denim. J. Text. Appar. Technol. Manag. 2010, 6, 1–9.17. Juciene, M.; Vobolis, J. Correlation between the seam stitch length of the sewing garment and friction forces. Mater. Sci. 2007, 132,
74–78.18. Juciene, M.; Vobolis, J. Influence of fabric external friction force and certain parameters of a sewing machine upon stitch length.
Mater. Sci. 2004, 10, 101–104.19. Gribaa, S.; Amar, S.B.; Dogui, A. Influence of sewing parameters upon the tensile behavior of textile assembly. Int. J. Cloth. Sci.
Technol. 2006, 18, 235–346. [CrossRef]20. Dobilaite, V.; Juciene, M. Influence of sewing machine parameters on seam pucker. Strain 2007, 56, 286–292.21. Suh, J.K. Analysis of the structure of lockstitched seam according to sewing thread tension. Fash. Text. Res. J. 2001, 3, 25–30.22. Midha, V.K.; Kothari, V.K.; Chatopadhyay, R.; Mukhopadhyay, A. Effect of high-speed sewing on the tensile properties of sewing
threads at different stages of sewing. Int. J. Cloth. Sci. Technol. 2009, 21, 217–238. [CrossRef]23. Naeem, M.S.; Mazari, A.; Khan, I.A.; Iftikhar, F. Effect of sewing speed on seam strength. Fibres Text. 2014, 2, 24–29.24. Vobolis, J.; Jucience, M.; Punys, J.; Vaitkevicius, V. Influence of selected machine and material parameters on the stitch length and
its irregularity. Fibers Text. East. Eur. 2003, 11, 50–55.25. Ebrahim, F.F.S. Influence of mechanical properties of cotton fabrics on seam quality. Life Sci. J. 2012, 9, 831–836.26. Oh, H.; Oh, K.W.; Park, S. A study of the improvement of foam material sealing technology for wetsuits. Fash. Text. 2019, 6, 25.
[CrossRef]
Top Related
Copyright © 2022 FDOKUMEN

