


Bahasa
Halaman
Hukum


DEVELOPMENT OF FIBER BRAGG GRATING BASED TEMPERATURE
SENSOR SYSTEM
LIAU QIAN YU
UNIVERSITI TEKNOLOGI MALAYSIA

“I hereby declare that I have read this thesis and in my opinion this thesis is
sufficient in term of scope and quality for the award of the degree of Bachelor of
Engineering (Electrical-Telecommunication).”
Signature : …………………………………….
Name of Supervisor : ……………………………………
Date : …………………………….............
DR. ASRUL IZAM BIN AZMI

DEVELOPMENT OF FIBER BRAGG GRATING BASED TEMPERATURE
SENSOR SYSTEM
LIAU QIAN YU
A thesis submitted in fulfilment of the requirements for the award of the degree of
Bachelor of Engineering (Electrical-Telecommunication)
Faculty of Electrical Engineering
Universiti Teknologi Malaysia
JUNE 2013

ii
I declare that this thesis entitled “Development of Fiber Bragg Grating Based
Temperature Sensor System” is the result of my own research except as cited in the
references. The thesis has not been accepted for any degree and is not concurrently
submitted in candidature of any other degree.
Signature : …………………………………….
Name of Student : ……………………………………
Date : …………………………….............
LIAU QIAN YU

iii
DEDICATION
To My beloved Mother
For her endless support
My beloved Father
For his worship and faith in me
My beloved Brother
For motivating me
My beloved Friends
This thesis is dedicated to them

iv
ACKNOWLEDGEMENT
I wish to express my deepest gratitude to my supervisor, Dr. Asrul Izam Bin
Azmi for the patience, supervision, and support I received from him during this
project. I would not have completed my project successfully without his guidance.
Also I would like to heartily thank PHD student, Siti Musliha and technician, Mr.
Nasir who offered helpful advice and support to me. Finally, my warmest
appreciation goes to my family, who gave me their support and encouragement
during this project.

v
ABSTRACT
The development of Fiber Bragg Grating (FBG) sensing technique has
improved significantly especially in the sensor head design and real-time data
acquisition technique. FBG is basically an optical filter that reflects or transmits light
at particular predetermined wavelengths. The FBG wavelength is sensitive to several
measurands including strain, temperature and pressure. This project presents the
development of a Labview program for real-time data acquisition of FBG
temperature sensor system. The Labview program is capable to record the FBG
wavelength shift from an Optical Spectrum Analyzer (OSA), subsequently calculate
the corresponding temperature change and record the important parameters of the
FBG. This project also presents the development of a simple and cost effective
packaging technique that further enhances the performances of the FBG sensor. The
packaged sensor overcomes the nonuniform heat distribution of a bare fiber that
causes eccentric response of FBG spectrum. Therefore, the packaged fiber could be
operated for a localized area with high temperature differential. The packaging also
compensates the unwanted strain effect from the surrounding which makes
temperature measurement become more accurate. The experimental works have been
successfully carried out to demonstrate the system operation and the packaging
functionalities.

vi
ABSTRAK
Perkembangan penderiaan teknik Fiber Bragg Grating (FBG) telah meningkat
dengan ketara terutamanya dalam reka bentuk kepala penderia dan teknik
pemerolehan data masa nyata. FBG asasnya merupakan fiber optik yang memantul
atau menghantar cahaya pada panjang gelombang tertentu yang telah ditetapkan.
Panjang gelombang FBG sensitif kepada daya, suhu dan tekanan. Projek ini
menggambarkan pembangunan satu pengaturcaraan LabVIEW untuk pemerolehan
data masa nyata sistem penderiaan suhu FBG. Pengaturcaraan LabVIEW ini mampu
merekodkan perubahan gelombang FBG dari Spectrum Analyser optik (OSA),
kemudiannya mengira perubahan suhu dan merekodkan parameter penting FBG.
Projek ini juga menggambarkan pembangunan satu teknik pembungkusan yang
mudah dan berkesan tetapi dengan kos yang rendah untuk meningkatkan prestasi
penderiaan suhu FBG ini. Penderiaan yang dibungkus mengatasi pengedaran haba
tak seragam daripada fiber kosong yang menyebabkan keanehan pada spectrum FBG.
Pembungkusan juga mengkompensasi kesan tekanan yang tidak diingini dari
sekeliling untuk meningkatkan ketepatan pengukuran suhu pada penderia FBG.
Kesimpulannya, kerja-kerja eksperimen telah berjaya dilaksanakan untuk
menunjukkan operasi sistem dan kefungsian pembungkusan.

vii
TABLE OF CONTENTS
CHAPTER TITLE PAGE
DECLARATION ii
DEDICATION iii
ACKNOWLEDGEMENTS iv
ABSTRACT v
ABSTRAK vi
TABLE OF CONTENTS vii
LIST OF TABLES x
LIST OF FIGURES xi
LIST OF ABBREVIATIONS xiii
LIST OF SYMBOLS xiv
LIST OF APPENDICES xv
1 INTRODUCTION 1
1.1 Motivation and Significance of Work 1
1.2 Problem Statements 1
1.3 Project Objectives 2
1.4 Project Scope 4
1.5 Work Breakdown 4
1.6 Work Flow 6
1.7 Gantt Chart 8
1.8 Thesis Organization 10

viii
2 LITERATURE REVIEW 11
2.1 Optical Fiber 12
2.2 Fiber Optic Sensor 13
2.2.1 Extrinsic and Intrinsic Fiber Optic Sensor 13
2.2.2 Intensity Modulated Sensor and Phase
Modulated Sensor
15
2.2.3 Advantages of FOS over Conventional
Electrical Sensor
15
2.3 Fiber Bragg Gratings 16
2.3.1 Properties of FBG 16
2.3.2 Types of FBG 19
2.3.3 Applications of FBG Sensors 21
2.4 Packaged Technique of FBG Temperature Sensor 22
3 METHODOLOGY 24
3.1 Experimental Setup of FBG Temperature Sensor 25
3.1.1 Process of Splicing Fiber 27
3.1.2 National Instruments GPIB-USB Cable 29
3.2 Labview Program 30
3.3 Fabrication of FBG Sensor Head Packaging 32
3.4 Tests of the FBG Temperature Sensor 34
4 RESULT AND DISCUSSION 36
4.1 Uniform Heat Test 37
4.2 Nonuniform Heat Test 40
5 CONCLUSION AND RECOMMENDATION 44
5.1 Conclusion 44
5.2 Recommendation 45

ix
REFERENCES 46
Appendices A 48

x
LIST OF TABLES
TABLE NO. TITLE PAGE
3.1 Specification of the Equipments and Component of the
Experimental Setup
26
3.2 Description of Saved Text Document 31
3.3 Specification of the Packaging Materials 33
xi
LIST OF FIGURES
FIGURES NO. TITLE PAGE
1.1 Work breakdown 5
1.2 Work Flow 7
1.3 Gantt chart for first semester 8
1.4 Gantt chart for second semester 9
2.1 Schematic of optical fiber 12
2.2 Fiber optic sensor system 13
2.3 Extrinsic FOS 14
2.4 Intrinsic FOS 14
2.5 Schematic diagram of structure and spectral response of
FBG
17
2.6 Common Bragg grating 19
2.7 Blazed Bragg Grating 20
2.8 (a) Chirped Bragg grating with aperiodic grading planes
spacing
20
2.8 (b) Chirped Bragg grating with a cascade of several
gratings with increasing period
20
3.1 Experimental setup 25
3.2 Process of splicing fiber 27
3.3 Fiber stripper 27
3.4 Alcohol and wipes 28
3.5 Fiber cleaver 28
3.6 Fiber splicer 29
3.7 National Instruments GPIB-USB cable 29

xii
3.8 Graphical user interface of the Labview data
acquisition program
30
3.9 Example of the saved data files of the Labview
program
31
3.10 Schematic of the sensor head packaging 32
3.11 The packaged FBG sensor head 34
3.12 Flow of the experiments 35
4.1 Temperature characteristics curve of bare and packaged
sensor
38
4.2 (a) Temperature measurement of bare FBG sensor 39
4.2 (b) Temperature measurement of packaged FBG sensor 40
4.3 (a) FBG transmission spectra at different stages of
experiment of bare FBG sensor in nonuniform heat test
41
4.3 (b) FBG transmission spectra at different stages of
experiment of packaged FBG sensor in nonuniform
heat test
42
4.4 Temperature measurement of packaged FBG in
nonuniform heat test
43

xiii
LIST OF ABBREVIATIONS
FBG - Fiber Bragg Grating
FOS - Fiber Optic Sensor
EMI - Electro-Magnetic Interference
FOG - Fiber-optic gyroscope
WDM - Wavelength Division Multiplex
TDM - Time Division Multiplex
UV - Ultraviolet
SMF - Single Mode Fiber
OSA - Optical Spectrum Analyzer
GPIB - General Purpose Interface Bus
USB - Universal Serial Bus
I/O - Input and Output
SLD - Superluminescent Diode
DSP - Digital Signal Processing

xiv
LIST OF SYMBOLS
n - Refractive index
Λ - Grating period
λB - Bragg wavelength
λ Wavelength
neff - Effective refractive index
𝛥𝜆𝐵 - Shift of Bragg wavelength
𝑝𝑒 - Effective strain-optic constant
p11 and p12 - Strain-optic tensor
ν - Poisson’s ratio
𝛥𝑇 - Change of temperature
αΛ - Thermal expansion coefficient
αn - Thermo-optic coefficient
θ - Degree of angle
α - Thermal expansion coefficient
ξ - Thermo-optic coefficient
αsub - Thermal expansion coefficient of packaging material
peff - Effective photo-elastic coefficient
°C - Degree Celcius

xv
LIST OF APPENDICES
APPENDIX TITLE PAGE
A Block diagram of the Labview program 48

CHAPTER 1
INTRODUCTION
1.1 Motivation and Significance of Work
In the past several decades, the development of fiber optic sensor (FOS) has
expanded and improved significantly. Peoples are showing great interest on FOS
because the attractive advantages of FOS such as low loss, low cost, low
maintenance, small size, lightweight, high bandwidth, EMI immunity, safety, etc.
Therefore, there are a number of intensive researches on developing the technique of
FOS such as Fiber Bragg grating (FBG), Fiber-optic gyroscopes (FOG), fiber-optic
current sensors, etc. Among these types of techniques, FBG is the most widely used
technique.
FBG has highly accepted and practiced in various of sensing and monitoring
fields such as industrial sensing, bio-medical device, mechanical and civil
engineering, aerospace, oil & gas, etc. Compared with other techniques, FBG shows
a number of distinguishing advantages: Wavelength Encoded; Self-referencing;
Linear output; small and lightweight; WDM & TDM Multiplexing; Mass producible;
durable; Single-& Multi-Point Sensing. Due to these superior advantages, FBG
shows enormous potential of temperature, strain, pressure and radiation effect of
sensing in smart structures and polymeric materials. FBG-based sensors have

2
become one of the most popular in the market now because of their relatively low
cost, flexibility of design to Single or Multi-Point sensing arrays and easy to
multiplex.
FBG sensors are high temperature tolerance therefore, it also being used in
remote sensing (oil wells, power cables, pipelines, space stations, etc.) which have to
stand the high temperature. Due to this FBG temperature sensors are widely used in
oil & gas industry. Since oil & gas industry is one of the important industry in our
country it is important or necessary to develop and improve the performance of FBG
temperature sensing system. Before begin the research regarding improve the
performance and develop new approaches of FBG temperature sensing system
research on the basis FBG temperature sensing system is required.
This research seeks to develop a real-time data acquisition of FBG
temperature sensor system and presents a simple and economical sensor head
packaging technique to improve the sensing performance of the temperature sensor.
A comprehensive literature review that provides the issues and knowledge to develop
the FBG temperature sensor system will be covered in this research.
1.2 Problem Statements
First and foremost, a real-time acquisition programming is needed to
interrogate optical Fiber Bragg Grating (FBG) temperature sensor. This program
must able to calculate the temperature change from the shift of Bragg grating
wavelength and record the shape of reflected/transmission spectrum. It is important
in determining the accuracy of the sensor.
In the reality, the bare FBG sensor cannot directly be applied in practical
environment because of the following reasons:
Optical fiber is made of glass, therefore it is extremely fragile.

3
Experience the cross-effect from other measurands such as strain and
pressure.
Low sensitivity and accuracy.
Less linearity and repeatability on the response characteristics of sensor.
For the case of temperature sensor, a nonuniform heat distribution on a bare
FBG sensor that causes eccentric behaviour of FBG spectrum also will drive the
system to make an error in determine the temperature change. To develop a
practicable FBG sensor, these issues must be overcome. Therefore, a packaging
technique for the FBG sensor head using suitable material is required. The packaging
technique also will compensate the cross-effects of the strain from surrounding.
Moreover, the sensitivity of the FBG sensor will be increased due to the higher
thermal expansion of the packaging material.
1.3 Project Objectives
The objectives of this project are to:
i. Develop a Labview programming for real-time data acquisition of
FBG temperature sensor system.
ii. Develop a simple and cost effective packaging technique that further
enhances the performances of the FBG sensor.
iii. Experiment the packaged sensor to verify the functionalities of the
developed packaging technique.

4
1.4 Project Scope
The scope of this project will include three aspects, which are software,
hardware, and experiment. In the software aspect, a Labview based real-time data
acquisition programming is to be developed. For the hardware aspect, a packaging
for FBG temperature sensor head has to be fabricated. Lastly, the bare and the
packaged FBG temperature sensor have to undergo two test, which are the uniform
test and nonuniform test.
1.5 Work Breakdown
To achieve all of the objectives in this project three categories of tasks have
to be done as shown in the Figure 1.1. The three categories are literature review,
design, and implementation. In the earlier stage of this project, I have to do the
literature review on the topics related to my project. The sources of my literature
review included books, articles, scientific journals and thesises. From the literature
review I able to gain sufficient ideas, methods, algorithms and theories for proceed to
my project designs.
Firstly, I have to design a Fiber Bragg Grating (FBG) based temperature
sensor system, the implemented system is used to test the performance of the FBG
temperature sensor. A labview based real-time acquisition coding is developed and
interfaced with the FBG temperature sensor system to calculate the corresponding
temperature change and record the important parameter of the transmitted spectrum.
Those algorithms related to the FBG temperature sensor are applied to the Labview
coding for the calculation of the temperature change relative to the wavelength shift.
Finally, the proposed FBG temperature sensor head design is fabricated to enhance
the performance of the temperature sensor. In the process of designing the sensor

5
head packaging the tradeoffs on the budget and the performance of the chosen
materials is the significant issue.
Figure 1.1: Work breakdown
Main Process
Literature Review
Fiber Optic Sensor
Fiber Bragg Grating (FBG)
FBG Temperature Sensor
FBG Sensor Head Packaging Technique
Labview Software
Design
FBG Temperature Sensor System
Software Algorithm
Architecture of Sensor Head Packaging
Implementation
Labview Coding
System Setup
Fabrication of Sensor Head Packaging

6
1.6 Work Flow
The workflow of this project was simplified and shown in the Figure 1.2. The
procedures shown in the figure are continuing. This project is completed within two
semesters that is approximately one year.
The foremost for the workflow of this project is the literature review and
theoretical study related to this project. Next, I proceed to development of Labview
programming and also FBG temperature sensor system. The programming and the
system are tested and optimized to improve the performance of the FBG sensor
system. The characteristics response and transmitted spectrum of bare FBG sensor
are recorded before the fabrication of the sensor head packaging on the bare FBG
sensor head. Similarly, I tested the packaged FBG sensor and optimized its
performance again.
After the FBG temperature sensor system is completed and the performance
of the FBG sensor is satisfied, I presented the outcome of this project and also
demonstrated it on the Telecommunication Exhibition 2013 (TED 2013).

7
Figure 1.2: Work Flow
Literature Review and Theoretical Study
Development of Labview Programming
Development of FBG Temperature System
Testing and Optimization
Fabrication of Sensor Head Packaging
Testing and Optimization
Presentation and Demonstration
Report Writing

8
1.7 Gantt Chart
These following gantt charts shown the timetable for this project in the two
semester’s time.
Weeks
Activities
1 2 3 4 5 6 7 8 9 10 11 12 13 14 15 16
Final Year
Project
briefing
Brief idea of
project
Literature
review and
theoretical
study
Project
proposal and
planning
Revise of
project
proposal
Labview
programming
design
Hardware
design
Presentation
Report of
proposed
project
Figure 1.3: Gantt chart for first semester

9
Weeks
Activities
1 2 3 4 5 6 7 8 9 10 11 12 13 14 15 16
Development
of Labview
programming
Development
of the system
setup
Fabrication
of the
hardware
Testing and
optimization
Experiment
Collecting
and
analysing
data
Presentation
Report of the
project
Figure 1.4: Gantt chart for second semester

10
1.8 Thesis Organization
There are five chapters in this thesis. Chapter 1 is the introduction of the
project and work planning for the project. Subsequently, Chapter 2 represents the
general background of optical fiber systems which included the overviews of the
fiber optic sensor, basic principles of Fiber Bragg Grating, and the packaged
technique of FBG sensor. In Chapter 3, the approach of the project is explained
clearly. Following chapter presents the result and discussion of this project. Finally,
Chapter 5 will conclude this project and proposed some recommendation for future
research.

CHAPTER 2
LITERATURE REVIEW
In the early 1970’s researchers studying multi-access single-fiber
communications architectures were first realize that light guided by an optical fiber
could be modulated by direct physical perturbation and that this could be utilized in a
variety of sensing applications [1]. After this discovery, various ideas and techniques
regarding the fiber optic sensor have been proposed by researchers. The inherent
advantages of fiber optic sensors, which include lightweight, small size, electrically
passive, low power ,nonconductive, resistant to electromagnetic interference, high
sensitivity, high bandwidth, and their environmental ruggedness, were successfully
make it accepted and commercial by the market [2].

12
2.1 Optical Fiber
Basically optical fiber is a transparent and flexible fiber made of silica or
plastic. Geometrically, it is thinner than a human hair. It functions as a waveguide of
light, to transmit light between the two ends of fiber with a very little light loss at
certain wavelengths. The schematic of optical fiber in Figure 2.1, which shows a
transparent core with a refractive index n1, is surrounded by a transparent cladding
of slightly lower refractive index n2 [3]. The interference between the core and
cladding is acts as a perfect mirror. The light is transmitted within the core by total
internal reflection. The outer buffer coating provides extra protection to the fiber
from the external conditions and physical damage.
Figure 2.1: Schematic of optical fiber

13
2.2 Fiber Optic Sensor
Figure 2.2 is illustrated the basic of fiber optic sensor system. The light from
the light source is transmitted to a modulated region by optical fiber. In the
modulated region, the light is modulated by physical, chemical, or biomedical
phenomena, and the light is transmitted back to a detector and therein the light is
demodulated [4].
Figure 2.2: Fiber optic sensor system
2.2.1 Extrinsic and Intrinsic Fiber Optic Sensor
Fiber optic sensor (FOS) basically grouped into two classes which is extrinsic
and intrinsic. The extrinsic FOS is basically optical sensor where the light leaves the
fiber, passes through some external transduction element, and is then recoupled back
into fiber. The intrinsic FOS is the optical sensor where the modulation of the optical

14
signal occurs while the light is guided within the fiber. In the simpler word, the
external transduction element in the extrinsic FOS is responsive to the measurand,
whereas the fiber of intrinsic FOS itself is sensitized to the measurand field. The
benefit of extrinsic FOS is their ability to reach places which is unable to access,
such as the temperature inside aircraft jet engines or electrical transformers. The
major advantage of intrinsic FOS is they can be used in the applications that have to
be prohibitive by electrical signal.
Figure 2.3: Extrinsic FOS
Figure 2.4: Intrinsic FOS
15
2.2.2 Intensity Modulated Sensor and Phase Modulated Sensor
According to principle of operation the extrinsic and intrinsic FOS can be
further divided in two categories, there are intensity modulated and the phase
modulated sensors. Intensity modulated sensors works by letting a physical
disturbance cause a change in the received light through an optical fiber. Phase
modulated sensors or interferometric work by comparing the phase of light in the
sensing fiber with a reference fiber in an interferometer. Phase modulated sensors are
much more expensive than intensity modulated sensors because they required
advanced electronics to process the information, but it is much more accurate than
the intensity modulated sensors. However, most of the applications is not required
extreme sensitivity, therefore intensity modulated sensors are more common in the
market by a more reasonable and competitive price.
2.2.3 Advantages of FOS over Conventional Electrical Sensor
Electrical sensors such as foil strain gages, thermocouples, and vibrating
wires that have been used in sensing and monitoring fields for decades have shown
their ineffective and limitation over FOS.
The nonconductive and noncorrosive natures of the fiber make the FOS more
suitable for outdoor than conventional electrical sensors. FOS also can safely
perform sensor measurements near high voltages, high sources of electromagnetic
interference, and in explosive environments because they are nonconductive,
electrically passive, immune to EMI and lightweight. Others characteristics of FOS
make it more effective compared to conventional electrical sensors are long-term
deployments, distributed systems and able to measure over long distance (up to 10km)
without any loss in accuracy.

16
2.3 Fiber Bragg Gratings
Fiber Optic Sensors (FOS) have been increased acceptance and widespread
use. The FBG based sensors are the most widely known and popular among the
multitude of sensor types. Their intrinsic capability to measure a multitude of
parameters such as strain, temperature, pressure, chemical, and biological agents-and
many others-coupled with their flexibility of design to be used as single point or
multi-point sensing arrays and their relative low cost, make of FBGs ideal devices to
be adopted for a multimode of different sensing applications and implemented in
different fields and industries [5].
2.3.1 Properties of FBG
FBG is composed of periodic changes of the refractive index that is formed
from exposure to an intense UV interference pattern in the core of an optical fiber [6].
Specific predetermined narrowband wavelength called the Bragg wavelength is
reflected by the grating structure as shown in the Figure 2.5.

17
Figure 2.5: Schematic diagram of structure and spectral response of FBG
The sensing principle used in the FBG based sensor system is to monitor the
shift in the Bragg wavelength with the changes in the measurand. The Bragg
wavelength, or resonance condition of a grating, is given by the expression [7]
λB = 2 neff Λ (2.1)
where neff is the effective refractive index of the core and Λ is the grating period of
the grating structure.
A unique property of FBG is that the back-reflected Bragg grating
wavelength, 𝜆𝛣 , will shifted when the surrounding temperature, strain or other
environment factor is changing. This happened because when the environment factor
is changing the effective refractive index, n and grating period, Λ also changing.
The shift in Bragg wavelength with strain and temperature changes is
expressed as
𝛥𝜆𝐵 = 2(𝛬𝜕𝑛𝑒𝑓𝑓
𝜕𝑙+ 𝑛𝑒𝑓𝑓
𝜕𝛬
𝜕𝑙)𝛥𝑙 + 2(𝛬
𝜕𝑛𝑒𝑓𝑓
𝜕𝑇+ 𝑛𝑒𝑓𝑓
𝜕𝛬
𝜕𝑇)𝛥𝑇 (2.2)

18
The first term in (2.2) represents the strain effect on an optical fiber. This
corresponds to a change in the grating spacing and the strain-optic induced change in
the refractive index. The strain effect term may be expressed as
𝛥𝜆𝛣 = 𝜆𝛣(1 − 𝑝𝑒)𝜀𝑧 (2.3)
Where 𝑝𝑒 is an effective strain-optic constant defined as
𝑝𝑒 =𝑛𝑒𝑓𝑓
2
2[𝑝12 − 𝜈 𝑝11 + 𝑝12 ] (2.4)
p11 and p12 are components of the strain-optic tensor and ν is the poisson’s ratio. For
a typical germanosilicate optical fiber p11 = 0.113, p12 = 0.252 , ν = 0.16 , and
neff = 1.482.
The second term in (2.2) represents the effect of temperature on an optical
fiber. A shift in the Bragg wavelength due to thermal expansion changes the grating
spacing and the index of refraction. This fractional wavelength shift change 𝛥𝑇 may
be written as
𝛥𝜆𝛣 = 𝜆𝛣(𝛼𝛬 + 𝛼𝑛)𝛥𝑇 (2.5)
Where αΛ = 1
Λ (
∂Λ
∂𝑇) is the thermal expansion coefficient for the fiber
(approximately 0.55x 10⁻⁶
for silica). The αn = 1
neff (
∂neff
∂𝑇) represents the thermo-
optic coefficient, which is approximately equal to 8.6 x 10⁻⁶
for the Germania-doped,
silica-core fiber.
Based on the equations, we can notice that the Bragg wavelength has linear
relationship with the environment factors. Therefore, FBG has been regarded as an
excellent element to be used as sensors to measure strain, temperature, and other
physical parameters.
19
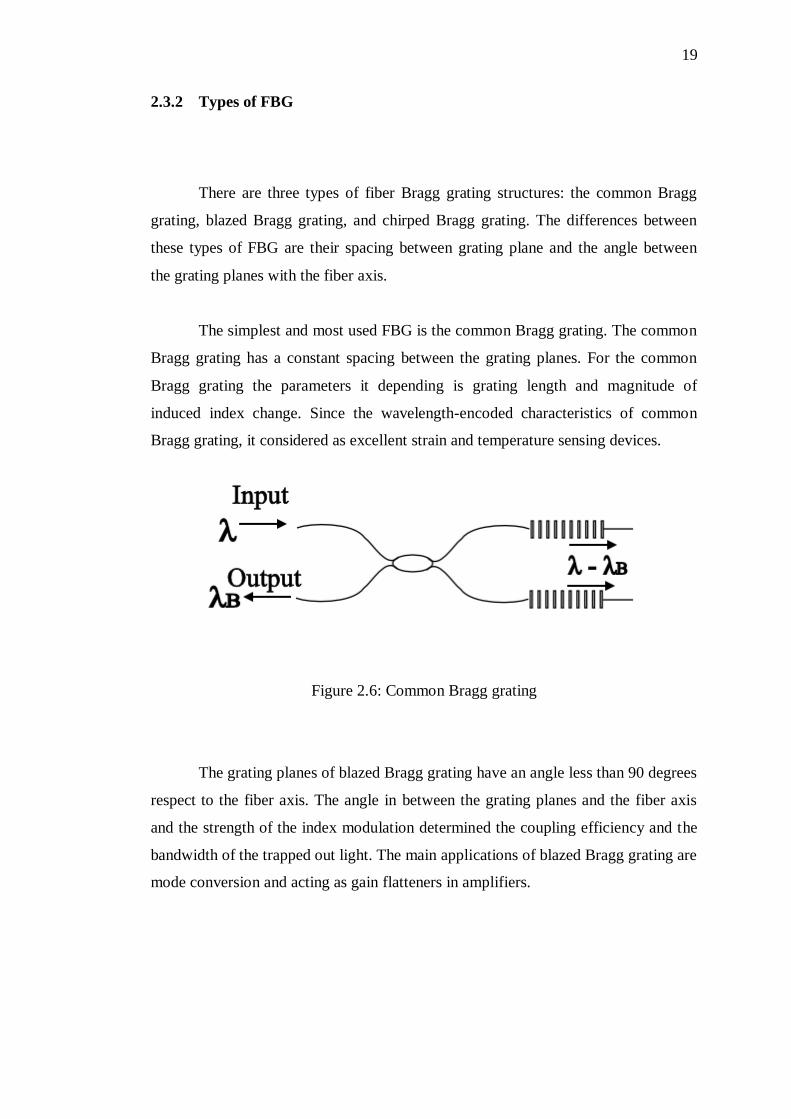
2.3.2 Types of FBG
There are three types of fiber Bragg grating structures: the common Bragg
grating, blazed Bragg grating, and chirped Bragg grating. The differences between
these types of FBG are their spacing between grating plane and the angle between
the grating planes with the fiber axis.
The simplest and most used FBG is the common Bragg grating. The common
Bragg grating has a constant spacing between the grating planes. For the common
Bragg grating the parameters it depending is grating length and magnitude of
induced index change. Since the wavelength-encoded characteristics of common
Bragg grating, it considered as excellent strain and temperature sensing devices.
Figure 2.6: Common Bragg grating
The grating planes of blazed Bragg grating have an angle less than 90 degrees
respect to the fiber axis. The angle in between the grating planes and the fiber axis
and the strength of the index modulation determined the coupling efficiency and the
bandwidth of the trapped out light. The main applications of blazed Bragg grating are
mode conversion and acting as gain flatteners in amplifiers.

20
Figure 2.7: Blazed Bragg Grating
The chirped Bragg grating has an aperiodic spacing in between the grating
planes, displaying a monotonic increase in the spacing between the grating planes.
There are certain characteristic properties offered by chirped Bragg grating that are
considered advantages for specific applications in telecommunications and sensor
technology, such as dispersion compensation and the stable synthesis of multiple
wavelength sources.
Figure 2.8: (a) Chirped Bragg grating with aperiodic grading planes spacing (b)
Chirped Bragg grating with a cascade of several gratings with increasing period

21
2.3.3 Applications of FBG Sensors
The features and benefits of FBG sensors such as nonconductive, electrically
passive, immune to electromagnetic interference (EMI), and daisy chain multiple
sensors on a single fiber have proven that FBG sensors can work much effective
under challenging environment or long distances compare to the conventional
electrical sensors.
Nowadays, FBG optical sensing has been benefited in many areas such as
energy, petroleum, civil infrastructure, and transportation monitoring. This trend is
increasing significantly because the FBG optical sensing is lightweight, simple to
install, suitable for outdoor applications because the nonconductive and noncorrosive
nature, ability to work under hazardous gases and voltages, and immunity to EMI
removes the need for expensive and often difficult signal conditioning required for
measurements near noisy sources such as power transformers.
In the energy area, FBG optical sensing used for monitoring the structural
integrity of a wind turbine blade with electrical sensors would often result in noisy
measurements because of long copper lead wires. With optical sensing, accurate and
noise-free strain measurements on wind turbine blades are possible. Furthermore, the
nonconductive and distributed nature of optical fibers lends too many uses in oil and
gas applications, including pipeline monitoring and downhole monitoring.
FBG optical sensing is drawing attention from civil infrastructure too. The
monitoring of infrastructure such as bridge and building based on the electrical
sensors often faces significant environmental challenges. An electrical monitoring
system would require the installation of countless wires, a lightning grounding
system, and periodic calibration and maintenance services. With an optical sensing
solution, these downfalls are all eliminated. Therefore, optical fiber sensing system is
widely used in large building monitoring, bridge and road monitoring, airport landing
strip load monitoring and dam monitoring.
22
To ensure the operation of transportation such as airplanes, railways, and
ships, are in the proper and safe condition the monitoring system in the transportation
area is very important. However, weight, size, and harsh environmental requirements
can pose significant challenges to implementing an electrical monitoring system.
FBG optical sensors alleviate these challenges because of the longevity and ease of
installation of FBG optical sensors and lack of need for external calibration, these
sensing systems can be deployed reliably for decades without needing any
maintenance - this is especially beneficial for long-term railway and ship hull
monitoring. The ability to have multiple sensors on a single, very thin fiber
dramatically reduces the weight of the monitoring system, which is especially
important in aerospace applications.
2.4 Packaged Technique of FBG Temperature Sensor
The bare FBG sensor is not practicable in the reality applications, because the
optical fiber is slim, fragile and brittle. Moreover, the sensitivity of bare FBG sensor
head is lower than packaged FBG sensor. The sensitivity of FBG temperature sensor
should be enhancing by appropriate packaging technique and to facilitate detection of
sensor. The packaging technique can also weaken the impact of strain or pressure to
the Bragg wavelength, and reduce the sensitivity of strain and pressure [8].
The relative shift of Bragg grating wavelength due to the temperature
perturbation can be expressed as [9]
ΔλB = (α +ξ) ·λB·ΔT (2.6)
where the α is thermal expansion coefficient of optical fiber, the ξ is thermo-optic
coefficient of optical fiber, and ΔT is the change in external temperature at the FBG
zone. For a general germanosilicate fiber, the value of α is 0.55x 10⁻⁶
/ °C,and the
value of ξ is 6.67x 10⁻⁶
/ °C [9].

23
However, the thermal expansion coefficient will alter when the bare FBG are
packaged by some material. Therefore, the relative shift of packaged Bragg grating
wavelength due to the with the variation of temperature can be expressed as [9]
ΔλB = [(α +ξ) + (1-peff) (αsub -α)] ·λB·ΔT (2.7)
where the αsub is thermal expansion coefficient of packaging material and the peff is
effective photo-elastic coefficient and assume to be 0.22.
The sensitivity coefficient of FBG packaged is higher if the larger expansion
coefficient of packaging material is used [10]. Therefore, to attain higher temperature
sensitivity coefficient of FBG temperature sensor, we can select the packaging
material of larger thermal expansion coefficient.
CHAPTER 3
METHODOLOGY
This chapter describes the approach of this project in term of the setup of the
FBG temperature sensor system, the capability of the developed Labview based real-
time data acquisition coding, the details of the materials and the procedures for
fabricate the proposed sensor head packaging, and also the procedures of testing the
FBG temperature sensor.

25
3.1 Experimental Setup of FBG Temperature Sensor
The FBG temperature system consists of a tunable laser source which supply
optical source to the sensing FBG. The sensing FBG was fabricated on SMF-28
hydrogen loaded fiber by UV scanning through a phase mask with no apodization
applied. The grating was written by a 244 nm frequency doubled Argon ion laser at
output power of 150 mW and scanning speed of 3 mm/min [11]. The processes of
splicing the FBG into to the setup are explained in following section. The transmitted
optical spectrums from the sensing FBG are transmitting to the Optical Spectrum
Analyzer (OSA) MS9710B. The OSA passes the FBG transmission spectrum to the
Labview program in the desktop computer through the National Instrument GPIB-
USB cable. The Labview program is capable to calculate the corresponding
temperature change from the wavelength shift of the transmitted FBG spectrum from
the OSA and in the meantime record those important spectrum parameters for further
analysis purpose. The Table 3.1 lists out the specification of the equipments and
components of this system.
Figure 3.1: Experimental setup

26
Table 3.1: Specification of the Equipments and Component of the Experimental
Setup
Equipment / Component Specification
Fiber Bragg Grating (FBG) Single Mode Fiber (SMF-28)
Central Wavelength : 1528nm
Length: 20mm
Peak reflectivity: ~ 99%
Tunable laser source 1550nm SLD Light Source
Operating Wavelength : 1400-1600nm
MS9710B Optical spectrum analyzer
(OSA)
Measurement range : 600 – 1750nm
Wavelength accuracy : 50pm(1530-
1570nm)
NI GPIB-USB Cable Full speed12 Mb/s USB Signaling
Transfer Rates Greater than 880 kbytes/s

27
3.1.1 Process of Splicing Fiber
Figure 3.2: Process of splicing fiber
The first step for slicing fiber is removing the protective polymer coating
around optical fiber and we called this act as stripping. We used fiber stripper to
stripping fiber coating.
Figure 3.3: Fiber stripper
After the fiber being stripped, the bare fiber is cleaned using alcohol and
wipes.
Stripping the Fiber
Cleaning the Fiber
Cleaving the Fiber
Splicing the fiber

28
Figure 3.4: Alcohol and wipes
The bare fiber is then cleaved using fiber cleaver, so that the endface is
perfectly flat and perpendicular to the axis of the fiber. This step is very important,
because the splice loss is a direct function of the angles and quality of the two fiber-
end faces and as the degrees of the cleave angle is closer to 90° the lower is the splice
loss.
Figure 3.5: Fiber cleaver
Finally, we used the fiber splicer to make either core or cladding of the two
cleaved bare fiber are aligned to each other. The fiber splicer aligns the cleaved
automatically.

29
Figure 3.6: Fiber splicer
3.1.2 National Instruments GPIB-USB Cable
The National Instruments compact GPIB-USB transforms any computer with
USB port into a full-function, plug-and-play IEEE-488.3 Controller. It is ideal for
computer or other applications that has no available internal I/O slots.
Figure 3.7: National Instruments GPIB-USB cable
30
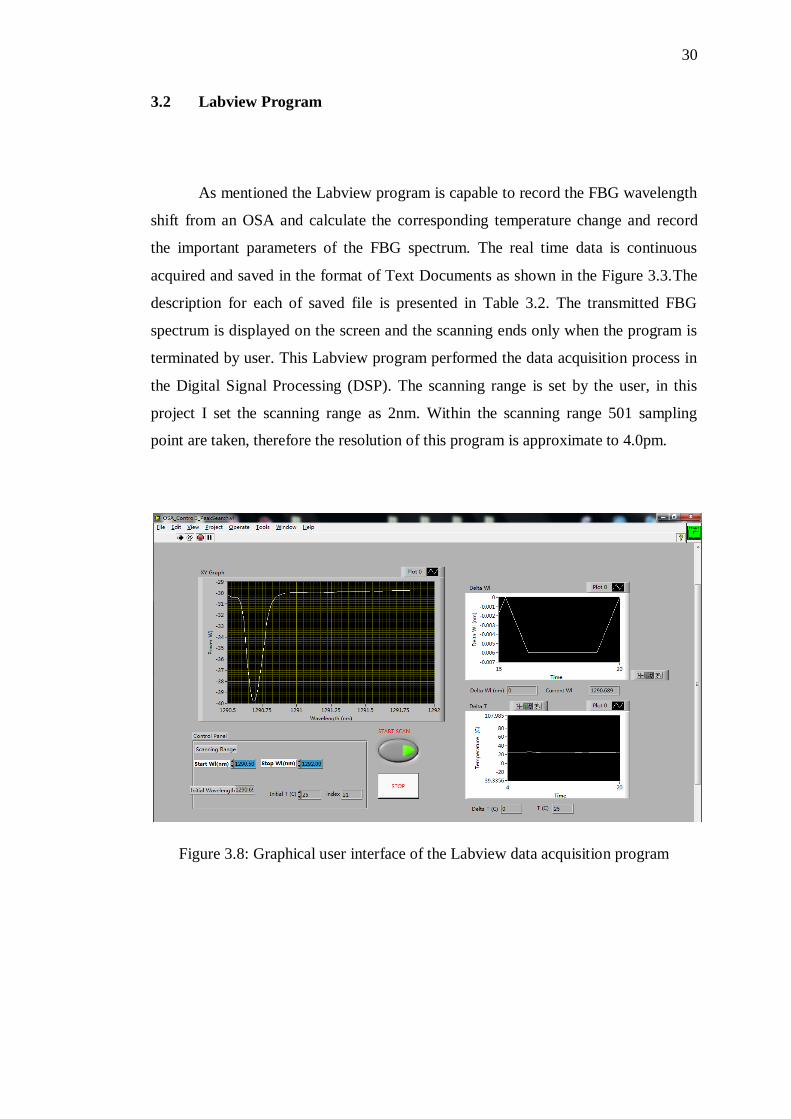
3.2 Labview Program
As mentioned the Labview program is capable to record the FBG wavelength
shift from an OSA and calculate the corresponding temperature change and record
the important parameters of the FBG spectrum. The real time data is continuous
acquired and saved in the format of Text Documents as shown in the Figure 3.3.The
description for each of saved file is presented in Table 3.2. The transmitted FBG
spectrum is displayed on the screen and the scanning ends only when the program is
terminated by user. This Labview program performed the data acquisition process in
the Digital Signal Processing (DSP). The scanning range is set by the user, in this
project I set the scanning range as 2nm. Within the scanning range 501 sampling
point are taken, therefore the resolution of this program is approximate to 4.0pm.
Figure 3.8: Graphical user interface of the Labview data acquisition program

31
Figure 3.9: Example of the saved data files of the Labview program
Table 3.2: Description of Saved Text Document
Name of the Text
Document
Description
delta_T.txt Temperature changes correspond to the shift of dip
wavelength.
delta_WL.txt Changes of the dip wavelength to the initial (first
detected) dip wavelength.
dip_wavelength.txt Dip wavelength of all the spectrum thought out the
sensing period.
level.txt Power level of the spectrum.
relative_time.txt The relative time of each spectrum being detected.
spectra.txt The entire spectrum pattern detected by the program.
time.txt The absolute time (according to the time of desktop) of
each spectrum being detected.
wavelength.txt The wavelength of each sampling points.

32
3.3 Fabrication of FBG Sensor Head Packaging
The copper tube used for packaging has the length of 4 cm, which create
additional 1 cm of length at both ends for 2 cm FBG. In the packaging procedure, the
bare FBG was loosely place at the center of a copper tube and then the position is
fixed by small amount of glue applied to the fiber ends. This step is to ensure the
grating section has a direct contact to the inner wall of the copper tube whilst
maintaining the flexibility of grating section. Then heat sink compound was slowly
injected into the slot of the copper tube. At the 1 cm buffer zone of both ends, the
rubber sleeves were used to give extra protection to the ingress/egress points which
are the most vulnerable parts. Finally, strong glue was applied to fix the position of
the rubber sleeves as well as contain the heat sink compound in the copper tube. The
glue was left to dry before the sensor can be tested. The copper tube is then cleaned
from the remaining of the heat sink compound. The FBG sensor and heat sink
compound consolidated very well with the copper tube and the surface cosmetic
looked very good after treatment.
Figure 3.10: Schematic of the sensor head packaging
The main aspect of packaging technique is the type of the coating material
with high thermal conductivity so that the heat can be conducted across the grating
structure fast and efficiently. Copper possesses many desirable properties for
packaging purpose compared with other conventional materials. A part from its high
thermal conductivity, copper has the advantage of corrosion resistant, good thermal
expansion, high allowable stress resistant and internal pressure resistant. With high
bulk modulus of 140 GPa, the packaged sensor will be insensitive the unwanted
strain originated from the surrounding.

33
The filler material for the copper tube that is used to enhance the contact
between the sensor and coating wall should be ready with suitable viscosity, so that
the process of injecting the material can be done with ease. More importantly, the
material should also possess relatively high thermal conductivity. As for this work, a
heat sink compound RS503-357with thermal conductivity of 0.65W/m°C is selected.
The cost for heat sink compound is increased for higher thermal conductivity. All
materials used in the experiments are selected so that it could sustain the minimum
and maximum expected temperatures to be measured. For this work, the sensor is
tested in boiling water, hence, the range of temperature is between the room
temperature and the boiling point of water i.e. 100 °C. The packaging of sensor to
sustain up to 180 °C, limited by the rubber sleeve operating temperature range. The
specifications of the materials being used in the proposed sensor head packaging is
listed in Table 3.3.
Table 3.3: Specification of the Packaging Material
Material Specification
Heat sink compound
RS503-357
Material : Zinc Oxide
Thermal conductivity : 0.65W/m°C
Boiling point : > 275°C
Melting point : 1970°C
Copper tube Thermal conductivity: 401W/m°C
Operating temperature range: -50 - 200°C
Tube inside diameter: 2.8mm
Tube outside diameter: 4mm
Bulk modulus: 140 GPa
Melting point: 1084 °C
Rubber sleeve Material : Silicone Rubber
Operating temperature range : -65 – 180°C
Sleeve diameter : 1mm
Wall thickness : 0.5mm
Glue Faster Super Glue, SG-F-3ML

34
Figure 3.11: The packaged FBG sensor head
3.4 Tests of the FBG Temperature Sensor
The experiments were carried out in two phases; the bare fiber sensor head
and packaged fiber sensor head. The same FBG with Bragg wavelength is 1528nm
was used throughout the experiment for fair comparison. The functionality of the
FBG temperature sensor was tested by continuous heating of the sensor underwater
from room temperature up to the boiling point. A thermometer was used as a
reference reading. Reading from FBG sensor and thermometer was compare based
on the relative time of the process. For both bare and packaged sensors, two cases
were examined; uniform heat test and nonuniform heat test.
In the uniform heat test, the whole sensor was submerged to the normal
operating condition where the heat can be evenly distributed in the whole grating
structure. On the other hand, for the nonuniform heat test, only half length of the
grating is submerged underwater. The partial heating on the grating will test the

35
performance and response of FBG sensor when there are anomalies of heat
distribution across the grating section.
Figure 3.12: Flow of the experiments
The bare FBG sensor is used in the uniform heat test and nonuniform heat test.
The bare FBG sensor is packaged by the proposed pakaging technique.
The packaged FBG sensor is used in the uniform heat test and nonuniform heat test.
The recorded spectrum data of the bare and packaged FBG sensor during the uniform and nonuniform heat test are analyzed and
compared.

CHAPTER 4
RESULT AND DISCUSSION
In this project, we are intent to enhance the performance of FBG temperature
sensor by applying the packaging technique. Therefore in this chapter we will
compare the performance of bare and packaged FBG temperature sensor. There are
two tests called uniform heat and nonuniform heat test to examine the performance
of FBG temperature sensor. In these two tests, the same FBG with Bragg wavelength
1528nm was used for fair comparison.

37
4.1 Uniform Heat Test
The intention of uniform heat test is to observe the performance and response
of bare and packaged FBG temperature sensor in the normal operating condition
where the heat can distribute evenly toward the whole grating structure. In this test,
the whole sensor was submerged underwater.
Figure 4.1 show the temperature sensitivity coefficient of the bare and
packaged FBG temperature sensor. The central Bragg wavelength of the bare FBG is
1528nm but it changed to 1528.46nm for the packaged FBG temperature sensor. This
is due to the stress residue created by the external packaging material. From the
Figure 4.1 the temperature sensitivity coefficient for the bare and packaged FBG
sensor are 10.05pm/°C and 10.09pm/°C, there is slightly increased but it is much
lower than the theoretical value. According to the equations 2.1 and 2.2, we assumed
the fiber is germonosilicate fiber, the thermal expansion coefficient, α of value is
0.55x 10⁻⁶
/°C,and the thermo-optic coefficient, ξ of value is 6.67x 10⁻⁶
/°C and
expansion coefficient of the copper is 17x10-6
/°C the theoretical value of temperature
sensitivity coefficient for bare and packaged FBG sensor are 11.03pm/°C and
30.64pm/°C. The big different between the theoretical and experiment result is
caused by the assumption of the value of α and ξ. The index change (α +ξ) is the
dominant effect in temperature sensitivity [12], but the type of fiber we used is not
germanosilicate fiber. The improvement of sensitivity for the packaged FBG sensor
is not significant, this is because the grating section is loosely placed inside the tube,
and effect of higher thermal expansion of the copper tube is not prominent. To
significantly enhance the sensitivity, strong contact between the FBG sensor and the
copper is required so that the effect of higher thermal expansion can be transfer to the
FBG.

38
Figure 4.1: Temperature characteristics curve of bare and packaged sensor
Series of measurement have been carried out to verify the temperature response
of bare and packaged sensor correspond to the actual temperature. The measurement
is then compared to the measurement obtained from thermometer. Figures 4.2(a) and
4.2(b) show the temperature measurement of bare fiber and packaged fiber,
respectively. The result clearly indicates the temperature measurements for bare and
packaged fiber are quite similar to the reading of thermometer. There are minor peak
fluctuations of the FBG spectrum that cause temperature fluctuation. One of the
reasons is that the low wavelength resolution of the OSA. Furthermore, the low
scanning speed of the OSA could also cause small irregularity to the measured
spectrum as the temperature could change during between each scanning step. By
using high speed tunable optical filter with high resolution, the aforementioned
problem can be minimized. Adjustment on the coefficient for the packaged fiber is
made to compensate the higher thermal expansion of the copper tube and the heat
sink compound. The higher thermal expansion of the copper tube also enhances of
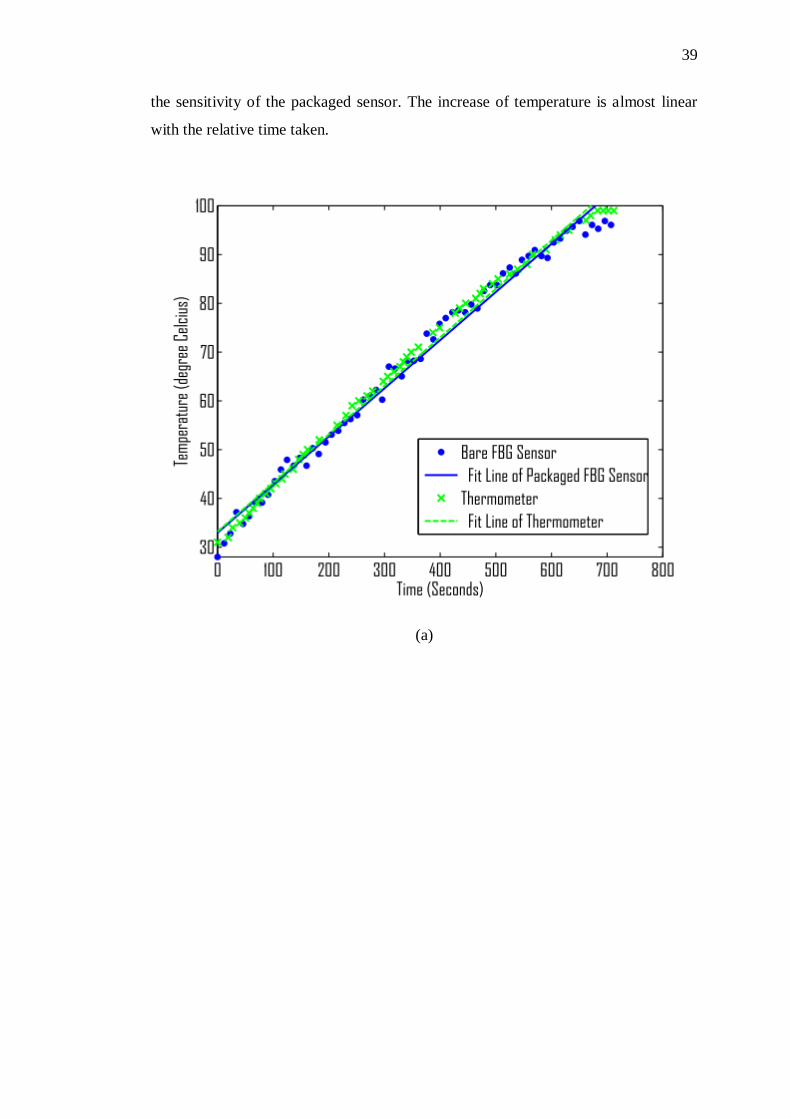
39
the sensitivity of the packaged sensor. The increase of temperature is almost linear
with the relative time taken.
(a)

40
(b)
Figure 4.2: Temperature measurement of (a) bare FBG sensor, and (b)packaged
sensor
4.2 Nonuniform Heat Test
The nonuniform heat test is used to observe the performance and response of
the bare and packaged FBG temperature sensor in the anomalies heat distribution
condition. In the nonuniform heat test , only half of the grating is submerged
underwater to create the partial heating condition toward the FBG temperature sensor.
Figure 4.3(a) and 4.3(b) show the transmission spectra of bare and packaged
sensors for the nonuniform heat test. There are multiple peaks and spectrum
broadening in the bare fiber due to the nonlinear chirping of grating. Apparently, this

41
multiple peaks lead to error in temperature measurement. Meanwhile, for the
packaged sensor, the shape of transmission spectrum is undistorted by the
nonuniform heat distribution test. The result shown in Figure 4.4 verifies that the
measurement of packaged FBG sensor under nonuniform test is comparable to the
reading from thermometer. The functionality of the copper tube packaging for heat
conductor is evident as the sensors pick up the highest temperature from the
nonuniform heat test.
(a)

42
(b)
Figure 4.3: FBG transmission spectra at different stages of experiment of (a) bare
FBG sensor, and (b) packaged FBG sensor, in nonuniform heat test

43
Figure 4.4: Temperature measurement of packaged FBG in nonuniform heat test.

CHAPTER 5
CONCLUSION AND RECOMMENDATION
5.1 Conclusion
In this project, a Labview based data acquisition system for temperature
measurement of FBG sensor has been successfully developed. The temperature
measurement of the FBG sensor system is corresponding to the thermometer
measurement. However we find out that the spectrum of bare FBG sensor is distorted
in nonuniform heat test and could not give correct temperature reading. This is due to
the anomalies of grating period and refractive index distribution. This problem
managed to solve by apply the proposed packaging technique. Result shows that the
simple and economical packaging for FBG sensor head gives the correct temperature
reading while the bare FBG sensor gives error reading in the nonuniform heat test.
Furthermore, the sensitivity of the FBG sensor could further enhanced due to the
higher thermal expansion of the packaged material. This sensing performance in
conjunction with the existing advantages of fiber optic sensor is highly desirable by
many practical applications.

45
5.2 Recommendation
The sensing performance of FBG temperature can be further enhancing by
using packaged material that have higher thermal expansion, such as aluminium to
replace the copper tube. In order to improve the performance of FBG temperature
sensor, we can change to germonosilicate fiber or other fiber that will give higher
index change (α +ξ). This can increase the sensitivity of the FBG temperature sensor
significantly. Furthermore, we have to make sure the strong contact between the
FBG sensor and the copper so that the effect of higher thermal expansion can be
transfer to the FBG. This can be achieved by adhere the edge of the FBG sensor
when it is placed in the copper tube, to make sure it will contact to the copper tube
although the heat sink compound is injected into the slot of the copper tube.

46
REFERENCES
[1] D. E. N. Davies and S. Kingsley, Electron. Lett. 10, 21 (1974).
[2] S. Y. Francis T. S. Yu, "Fiber Optic Sensors," in Overview of Fiber Optic
Sensors, E. Udd, Ed., ed. United States of America: Marcel Dekker, Inc.,
2002, p. 1.
[3] John. M. Senior, “Optical Fiber Communication”, 3rd
Ed. Prentice Hall, 2009
[4] D. Donlagic, "Fiber Optic Sensors: An Introduction and Overview," 1995.
[5] A. Mendez, "Fiber Bragg grating sensors: a market overview," vol. 6619.
[6] SUCHAT S., YUPAPIN P.P., A phase mask fiber grating and sensing
applications, Songklanakarin Journal of Science and Technology 25(5), 2003,
pp. 615–622.
[7] W. W. Morey, G. Meltz, and W. H. Glenn, “Fiber Bragg grating sensors,” in
Proc. SPIE Fiber Optic & Laser Sensors VII, 1989, vol.1169, p. 98.
[8] Y. G.-Q. SONG Li-Jun, "The Packaging Technique about FBG Temperature
Sensor," 2010 Second International Conference on Communication Systems,
Networks and Applications, 2010.
[9] Jung J, Nam H, Lee B. “Fiber Bragg grating temperature sensor with
controllable sensitivity”. Applied Optics, vol. 38, no. 13, pp. 2752-2574,
1999.
[10] W.-H. Wang, Y.-J. Feng, W.-Q. Shi, Z.-Y. Xiong, S.-D. Li, W.-N. Wu, et al.,
"Analysis of Packaging Material Impacting on FBG Temperature Sensors,"
2009 International Conference on Optical Instruments and Technology:
Advansed Sensor Technologies and Applications, vol. 7508,pp. 750810-1,
2009.
[11] A. I. Azmi, D. Sen, W. Sheng, J. Canning and G. D. Peng, “Performance
Enhancement of Vibration Sensing Employing Multiple Phase-Shifted Fiber

47
Bragg Grating,” Journal of Lightwave Technology, vol. 29, no. 22, pp. 3453-
3460, 2011.
[12] Q. C. a. P. Lu, "Fiber Bragg Grating and Their Applications as Temperature
and Humidity Sensors," in Atomic, Molecular and Optical Physics, L. T.
Chen, Ed., ed: Nova Science Publishers, Inc., 2008, pp. 235-260.

48
Appendices A
Top Related
Copyright © 2022 FDOKUMEN

