


Bahasa
Halaman
Hukum

CITY OF BURNABYBRITISH COLUMBIA, CANADA
ANNUAL MUNICIPAL REPORT
2021
FOR THE FISCAL YEAR ENDED DECEMBER 31, 2021
Burnaby’s Vision:
A world-class city committed to creating and sustaining the best quality of life for our entire community.
Burnaby is located on the ancestral and unceded homelands of the hən̓q̓əmin̓əm̓ and Sḵwxw̱ú7mesh speaking peoples.
Government Finance Officers Association of the United States and Canada (GFOA) awarded a Canadian Award for Financial Reporting to the City of Burnaby for its annual financial report for the fiscal year ended December 31, 2020. The Canadian Award for Financial Reporting program was established to encourage municipal governments throughout Canada to publish high-quality financial reports and provide peer recognition and technical guidance for officials preparing these reports.
To be awarded a Canadian Award for Financial Reporting, a government unit must publish an easily readable and efficiently organized annual financial report, whose contents conform to program standards. Such reports should go beyond the minimum requirements of generally accepted accounting principles and demonstrate an effort to clearly communicate the municipal government’s financial picture, enhance an understanding of financial reporting by municipal governments, and address user needs.
A Canadian Award for Financial Reporting is valid for one year only. We believe our current report conforms to the Canadian Award for Financial Reporting program requirements. We will be submitting it to GFOA to determine its eligibility for another award.
Government Finance Officers Association
Canadian Awardfor
Financial Reporting Presented to
City of Burnaby
British Columbia
For its Annual Financial Report
for the Year Ended
December 31, 2020
Executive Director/CEO
Table of Contents
Produced by the Finance Department at the City of Burnaby in cooperation with all civic departments.
4 INTRODUCTION
5 CITY COUNCIL
6 MESSAGE FROM THE MAYOR
7 MESSAGE FROM THE CHIEF ADMINISTRATIVE OFFICER
8 CITY OF BURNABY ORGANIZATIONAL CHART
9 MANAGEMENT COMMITTEE
10 BOARDS, COMMITTEES AND COMMISSIONS
11 FINANCIAL SECTION
12 AUDIT COMMITTEE
13 TREASURER’S REPORT
16 AUDITORS’ REPORT
20 CONSOLIDATED FINANCIAL STATEMENTS
20 Consolidated Statement of Financial Position
21 Consolidated Statement of Operations and Accumulated Surplus
22 Consolidated Statement of Changes in Net Financial Assets
23 Consolidated Statement of Cash Flow
24 Notes to the Consolidated Financial Statements
43 STATISTICAL SECTION
44 MISCELLANEOUS STATISTICS
47 TAXATION
51 FINANCIAL STATISTICS
53 PERMISSIVE EXEMPTIONS
59 APPENDIX A - INTEGRATED PLANNING FRAMEWORK & SERVICE HIGHLIGHTS
TABLE OF CONTENTS
32021 ANNUAL MUNICIPAL REPORT |

INTRODUCTIONCity Council
Message from the Mayor
Message from the Chief Administrative Officer
Organizational Chart
Management Committee
Boards, Committees & Commissions
4 | 2021 ANNUAL MUNICIPAL REPORT
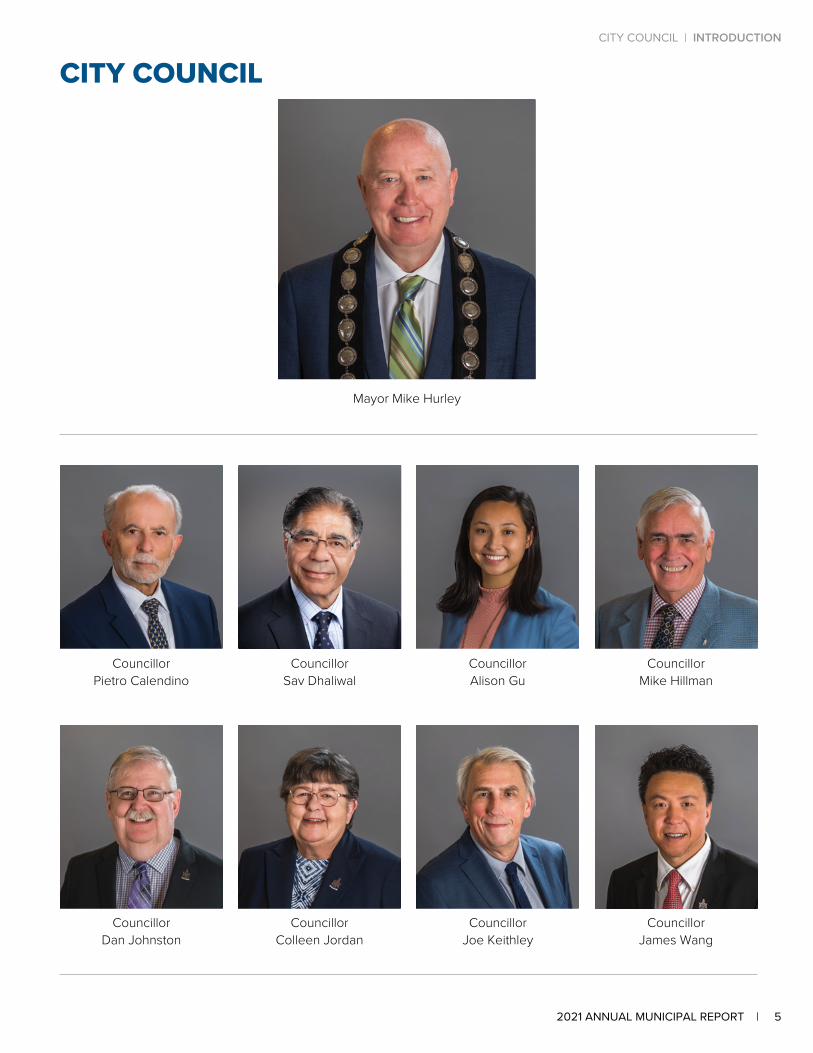
Mayor Mike Hurley
CouncillorPietro Calendino
Councillor Sav Dhaliwal
Councillor Alison Gu
Councillor Mike Hillman
Councillor Dan Johnston
Councillor Colleen Jordan
Councillor Joe Keithley
CouncillorJames Wang
CITY COUNCILCITY COUNCIL | INTRODUCTION
52021 ANNUAL MUNICIPAL REPORT |
MESSAGE FROM THE MAYORI am honoured to present the 2021 Annual Municipal Report on behalf of Burnaby Council.
The future is bright for Burnaby.
As our community emerges from the two-year disruption caused by the COVID-19 pandemic, I am filled with a sense of optimism and hope.
We are about to embark on a transformative period in our city. Over the last few years, we’ve spent a great deal of time and effort conducting in-depth consultations with residents and stakeholders to create long-range plans for housing, infrastructure, transportation and climate
action. And now, we are beginning to see those plans come to fruition.
For the first time in Burnaby’s history, there are more non-market rental housing units being built in our community than market rentals. This is a big win for affordability, and is a direct result of the actions and policies implemented at the recommendation of the Mayor’s Task Force on Community Housing in 2019 and the subsequent HOME strategy, which was endorsed by council in 2021.
We are also preparing big changes to the way we move. In 2021, we replaced a 25-year-old Transportation Plan with Connecting Burnaby, an ambitious vision for the future of travel in our City.
At the heart of all these plans is our urgent commitment to reduce carbon emissions in our community. In 2019, we set a goal to achieve carbon neutrality in Burnaby by 2050. But as we continue to experience the effects of a warming climate first-hand, it is imperative that we redouble our efforts to achieve that goal even earlier.
To address the needs of our growing City, this year we passed the most ambitious capital plan to date, with plans to build five new community facilities in five years.
It’s important to think big, but we can’t lose sight of the essential services that the City provides for its residents. Every day, Burnaby residents drive our roads, walk our trails and depend on our essential infrastructure, such as sewer and water.
We will continue to work towards our dream of building an even better Burnaby with our staff committed to delivering the highest standards of service to our residents.
There will always be challenges to face and obstacles to overcome, but I have never been more certain that the best days for our community are ahead of us.
Mayor Mike Hurley
6 | 2021 ANNUAL MUNICIPAL REPORT
INTRODUCTION | MESSAGE FROM THE MAYOR
MESSAGE FROM THE CHIEF ADMINISTRATIVE OFFICERBurnaby’s Annual Municipal Report provides us the opportunity to share some of the incredible accomplishments our City has made in the past year, as well as plans for the future.
This is an exciting time for Burnaby. In 2021, the City of Burnaby moved forward with ambitious, high-profile plans and policies which will shape our community for generations to come. Equally as important, our staff continued to deliver world-class services to residents, including snow clearing, garbage and recycling collection, road maintenance and more.
Recognizing the importance of maintaining and upgrading the City’s key infrastructure, in 2021 we approved the most ambitious capital plan in our City’s history. It includes plans to build five major new facilities. Thanks to years of prudent financial management, funding for these projects will come through the City’s reserves without incurring any debt.
The aging C.G. Brown Pool and Burnaby Lake Arena will be replaced with a new Burnaby Lake Sports Complex, which will include multiple pools, multi-purpose rooms and an NHL-sized arena. This new facility, along with the recent acquisition of the Christine Sinclair Community Centre, will establish Burnaby Lake as the premiere area for hosting tournaments in Metro Vancouver.
In northeast Burnaby, we are building a new Cameron Recreation Centre and Library, which will feature a new leisure pool, gym and weight room, as well as an outdoor public plaza.
On the northwest side of the City, a new Confederation Park Community Centre will offer extensive space for community activities and groups, and create a new connection between Eileen Dailly Pool and the McGill Library.
In 2022, we will complete the Rosemary Brown Arena in Edmonds, which will include two NHL-sized rinks, a skate shop, a concession and public meeting spaces. It will also incorporate sustainable design features and water conservation strategies.
And in the Brentwood Town Centre, we plan to deliver a new community centre to serve the residents of one of the fastest-growing neighbourhoods in the City.
Climate action continues to be a top priority. Building on our long history of successful partnerships with Simon Fraser University, we have again partnered with SFU and also Vancity to launch the Urban Resilient Futures Initiative, which will bring together Burnaby residents to find local, neighbourhood-level solutions to climate change.
Even as we engage residents to take action on climate change, the City is leading by example when it comes to sustainability, by continuing to expand Burnaby’s EV charging network and electrifying our City fleet. In 2021, the City broke ground on an EV charging lot at City Hall, which will be equipped with a solar canopy to recoup energy without generating new emissions.
Encouraging the transition to zero emission vehicles supports one of the key targets outlined in Connecting Burnaby, the new Transportation Plan which was adopted by council in 2021. This is an ambitious plan that will transform the way we move throughout the city.
Connecting Burnaby will contribute to a vibrant and prosperous community by connecting people, places and goods. The plan sets a clear goal to reduce our reliance on passenger vehicles by giving people convenient and safe options to walk, cycle and use transit.
Burnaby is one of the fastest-growing major municipalities in Canada and we are working hard to ensure that we grow in a way that improves affordability. Building on the success of the Mayor’s Task Force on Community Housing in 2019, the City approved the HOME Strategy in 2021, which outlines the specific initiatives and actions we will take over the next 10 years to improve housing opportunities for everyone.
It’s important that the City always seek better ways to provide services. One way we are doing this is through an in-depth review of our development approval processes currently underway. We will make things easier and faster for anyone applying for development approvals by modernizing and streamlining our processes to reduce approval times, and remove uncertainties for property owners, renters, home buyers and developers.
In 2022, we also begin a new partnership with SFU to create a Civic Innovation Lab, which will provide the City with the opportunity to take advantage of leading-edge academic research to develop sustainable, innovative solutions to civic issues and challenges as they arise.
As a City we are committed to delivering the programs and services that make Burnaby one of the best cities to live in the world. We look forward to continuing this important work.
Sincerely,
Leon Gous
MESSAGE FROM THE CHIEF ADMINISTRATIVE OFFICER | INTRODUCTION
72021 ANNUAL MUNICIPAL REPORT |
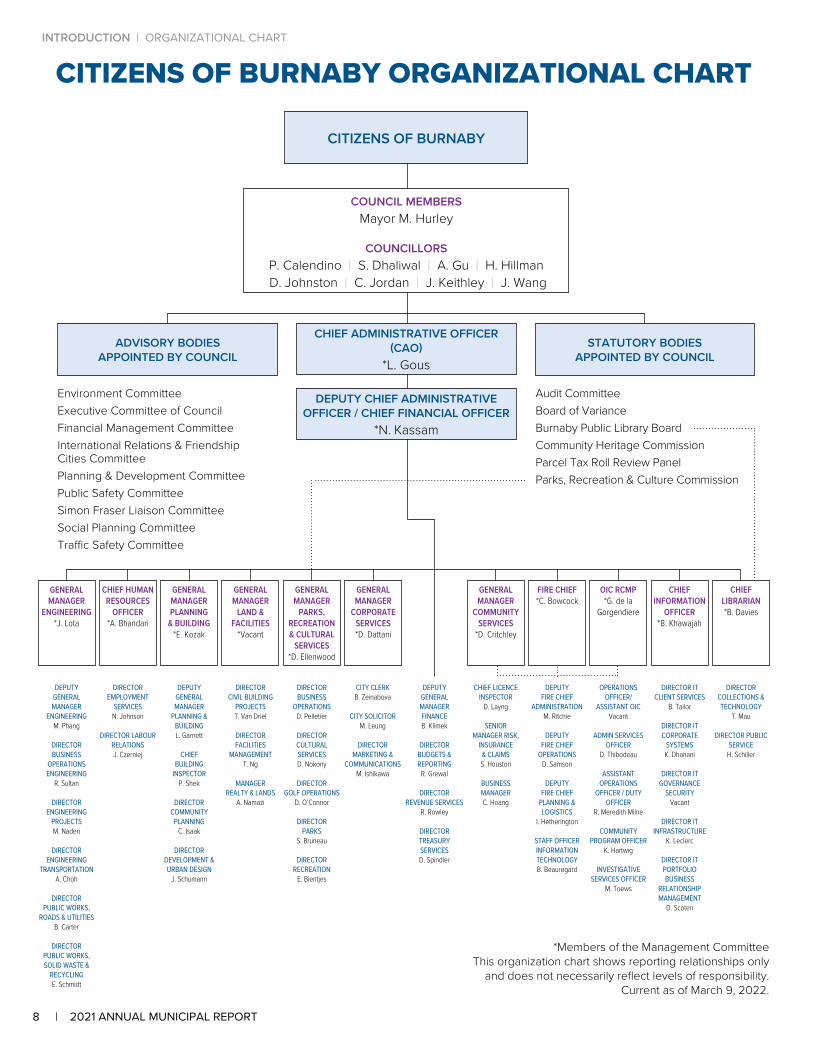
CITIZENS OF BURNABY ORGANIZATIONAL CHART
CITIZENS OF BURNABY
COUNCIL MEMBERSMayor M. Hurley
COUNCILLORSP. Calendino | S. Dhaliwal | A. Gu | H. Hillman D. Johnston | C. Jordan | J. Keithley | J. Wang
ADVISORY BODIES APPOINTED BY COUNCIL
CHIEF ADMINISTRATIVE OFFICER (CAO)
*L. Gous
STATUTORY BODIESAPPOINTED BY COUNCIL
Environment CommitteeExecutive Committee of Council Financial Management CommitteeInternational Relations & Friendship Cities CommitteePlanning & Development CommitteePublic Safety Committee Simon Fraser Liaison Committee Social Planning CommitteeTraffic Safety Committee
Audit Committee Board of VarianceBurnaby Public Library Board Community Heritage Commission Parcel Tax Roll Review PanelParks, Recreation & Culture Commission
*Members of the Management Committee This organization chart shows reporting relationships only
and does not necessarily reflect levels of responsibility. Current as of March 9, 2022.
DEPUTY CHIEF ADMINISTRATIVE OFFICER / CHIEF FINANCIAL OFFICER
*N. Kassam
GENERAL MANAGERPLANNING
& BUILDING*E. Kozak
DEPUTY GENERALMANAGER
PLANNING & BUILDINGL. Garnett
CHIEF BUILDING
INSPECTORP. Shek
DIRECTOR COMMUNITY
PLANNINGC. Isaak
DIRECTOR DEVELOPMENT & URBAN DESIGN
J. Schumann
DEPUTY GENERAL MANAGER
ENGINEERINGM. Phang
DIRECTORBUSINESS
OPERATIONS ENGINEERING
R. Sultan
DIRECTOR ENGINEERING
PROJECTSM. Naderi
DIRECTOR ENGINEERING
TRANSPORTATION A. Choh
DIRECTOR PUBLIC WORKS,
ROADS & UTILITIESB. Carter
DIRECTOR PUBLIC WORKS, SOLID WASTE &
RECYCLINGE. Schmidt
GENERALMANAGER
ENGINEERING*J. Lota
DIRECTOR CIVIL BUILDING
PROJECTST. Van Driel
DIRECTOR FACILITIES
MANAGEMENTT. Ng
MANAGERREALTY & LANDS
A. Namazi
GENERAL MANAGER
LAND & FACILITIES
*Vacant
DIRECTOR COLLECTIONS & TECHNOLOGY
T. Mau
DIRECTOR PUBLIC SERVICEH. Schiller
CHIEF LIBRARIAN*B. Davies
CHIEF INFORMATION
OFFICER*B. Khawajah
DIRECTOR IT CLIENT SERVICES
B. Tailor
DIRECTOR IT CORPORATE
SYSTEMSK. Dhanani
DIRECTOR IT GOVERNANCE
SECURITYVacant
DIRECTOR IT INFRASTRUCTURE
K. Leclerc
DIRECTOR IT PORTFOLIO BUSINESS
RELATIONSHIPMANAGEMENT
D. Scoten
DIRECTOR EMPLOYMENT
SERVICESN. Johnson
DIRECTOR LABOUR RELATIONSJ. Czerniej
CHIEF HUMAN RESOURCES
OFFICER*A. Bhandari
DIRECTOR BUSINESS
OPERATIONSD. Pelletier
DIRECTOR CULTURAL SERVICESD. Nokony
DIRECTOR GOLF OPERATIONS
D. O’Connor
DIRECTOR PARKS
S. Bruneau
DIRECTOR RECREATION
E. Bientjes
GENERALMANAGER
PARKS, RECREATION & CULTURAL
SERVICES*D. Ellenwood
CITY CLERKB. Zeinabova
CITY SOLICITORM. Leung
DIRECTORMARKETING &
COMMUNICATIONSM. Ishikawa
GENERALMANAGER
CORPORATE SERVICES*D. Dattani
DEPUTY GENERAL MANAGERFINANCEB. Klimek
DIRECTOR BUDGETS & REPORTING
R. Grewal
DIRECTOR REVENUE SERVICES
R. Rowley
DIRECTOR TREASURY SERVICESD. Spindler
CHIEF LICENCE INSPECTOR
D. Layng
SENIORMANAGER RISK,
INSURANCE & CLAIMSS. Houston
BUSINESSMANAGERC. Hoang
GENERAL MANAGER
COMMUNITY SERVICES
*D. Critchley
DEPUTY FIRE CHIEF
ADMINISTRATIONM. Ritchie
DEPUTY FIRE CHIEF
OPERATIONSD. Samson
DEPUTY FIRE CHIEF
PLANNING & LOGISTICS
I. Hetherington
STAFF OFFICERINFORMATIONTECHNOLOGYB. Beauregard
FIRE CHIEF*C. Bowcock
OIC RCMP*G. de la
Gorgendiere
OPERATIONS OFFICER/
ASSISTANT OICVacant
ADMIN SERVICES OFFICER
D. Thibodeau
ASSISTANT OPERATIONS
OFFICER / DUTY OFFICER
R. Meredith Milne
COMMUNITYPROGRAM OFFICER
K. Hartwig
INVESTIGATIVE SERVICES OFFICER
M. Toews
8 | 2021 ANNUAL MUNICIPAL REPORT
INTRODUCTION | ORGANIZATIONAL CHART

MANAGEMENT COMMITEEThe Chief Administrative Officer (CAO) makes recommendations to Council on a broad range of policy and administrative issues. The CAO’s Office directs the operations of the City and is responsible for implementing City policies.
Chief Administrative OfficerL. Gous
Deputy Chief Administrative Officer & Chief Financial OfficerN. Kassam
General Manager, Community SafetyD. Critchley
General Manager, Corporate ServicesD. Dattani
General Manager, EngineeringJ. Lota
General Manager, Lands & Facilities J. Radford (Acting)
General Manager, Parks, Recreation & Cultural ServicesD. Ellenwood
General Manager, Planning & DevelopmentE. Kozak
Chief Human Resources OfficerA. Bhandari
Chief LibrarianB. Davies
Chief Information OfficerB. Khawajah
Fire ChiefC. Bowcock
OIC RCMPG. de la Gorgendiere
Burnaby Mountain
MANAGEMENT COMMITTEE | INTRODUCTION
92021 ANNUAL MUNICIPAL REPORT |
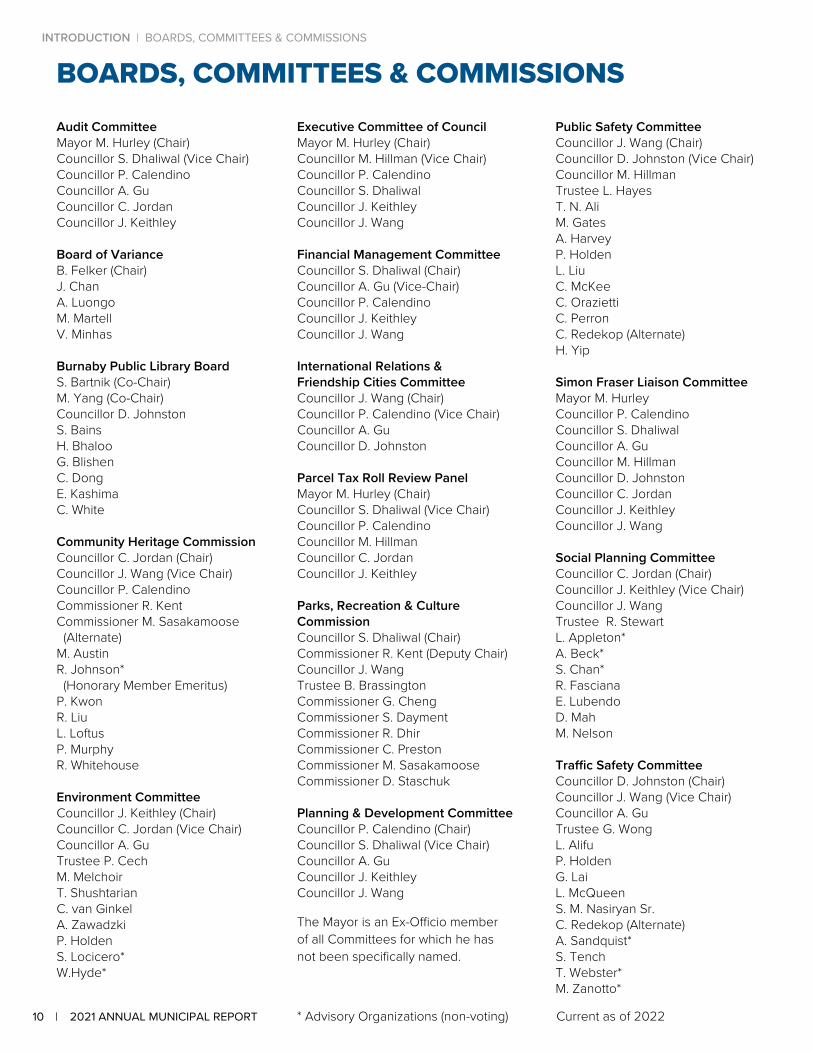
BOARDS, COMMITTEES & COMMISSIONS Audit CommitteeMayor M. Hurley (Chair)Councillor S. Dhaliwal (Vice Chair)Councillor P. CalendinoCouncillor A. GuCouncillor C. JordanCouncillor J. Keithley
Board of VarianceB. Felker (Chair)J. ChanA. LuongoM. MartellV. Minhas
Burnaby Public Library BoardS. Bartnik (Co-Chair)M. Yang (Co-Chair)Councillor D. JohnstonS. BainsH. BhalooG. BlishenC. DongE. KashimaC. White
Community Heritage CommissionCouncillor C. Jordan (Chair)Councillor J. Wang (Vice Chair)Councillor P. CalendinoCommissioner R. KentCommissioner M. Sasakamoose (Alternate) M. AustinR. Johnson* (Honorary Member Emeritus)P. KwonR. LiuL. LoftusP. MurphyR. Whitehouse
Environment CommitteeCouncillor J. Keithley (Chair)Councillor C. Jordan (Vice Chair)Councillor A. GuTrustee P. CechM. MelchoirT. ShushtarianC. van GinkelA. ZawadzkiP. HoldenS. Locicero*W.Hyde*
Executive Committee of CouncilMayor M. Hurley (Chair)Councillor M. Hillman (Vice Chair)Councillor P. CalendinoCouncillor S. DhaliwalCouncillor J. KeithleyCouncillor J. Wang
Financial Management CommitteeCouncillor S. Dhaliwal (Chair)Councillor A. Gu (Vice-Chair)Councillor P. CalendinoCouncillor J. KeithleyCouncillor J. Wang
International Relations & Friendship Cities CommitteeCouncillor J. Wang (Chair)Councillor P. Calendino (Vice Chair)Councillor A. GuCouncillor D. Johnston
Parcel Tax Roll Review PanelMayor M. Hurley (Chair)Councillor S. Dhaliwal (Vice Chair)Councillor P. CalendinoCouncillor M. HillmanCouncillor C. JordanCouncillor J. Keithley
Parks, Recreation & Culture CommissionCouncillor S. Dhaliwal (Chair)Commissioner R. Kent (Deputy Chair)Councillor J. WangTrustee B. BrassingtonCommissioner G. ChengCommissioner S. DaymentCommissioner R. DhirCommissioner C. PrestonCommissioner M. SasakamooseCommissioner D. Staschuk
Planning & Development CommitteeCouncillor P. Calendino (Chair)Councillor S. Dhaliwal (Vice Chair)Councillor A. GuCouncillor J. KeithleyCouncillor J. Wang
Public Safety CommitteeCouncillor J. Wang (Chair)Councillor D. Johnston (Vice Chair)Councillor M. HillmanTrustee L. HayesT. N. AliM. GatesA. HarveyP. HoldenL. LiuC. McKeeC. OraziettiC. PerronC. Redekop (Alternate)H. Yip
Simon Fraser Liaison CommitteeMayor M. HurleyCouncillor P. Calendino Councillor S. Dhaliwal Councillor A. GuCouncillor M. HillmanCouncillor D. JohnstonCouncillor C. JordanCouncillor J. Keithley Councillor J. Wang
Social Planning CommitteeCouncillor C. Jordan (Chair)Councillor J. Keithley (Vice Chair)Councillor J. WangTrustee R. StewartL. Appleton*A. Beck*S. Chan*R. FascianaE. LubendoD. MahM. Nelson
Traffic Safety CommitteeCouncillor D. Johnston (Chair)Councillor J. Wang (Vice Chair)Councillor A. GuTrustee G. WongL. AlifuP. HoldenG. LaiL. McQueenS. M. Nasiryan Sr.C. Redekop (Alternate)A. Sandquist*S. TenchT. Webster*M. Zanotto*
The Mayor is an Ex-Officio member of all Committees for which he has not been specifically named.
* Advisory Organizations (non-voting) Current as of 202210 | 2021 ANNUAL MUNICIPAL REPORT
INTRODUCTION | BOARDS, COMMITTEES & COMMISSIONS

FINANCIALSECTIONAudit Committee
Treasurer’s Report
Auditors’ Report
Consolidated Financial StatementsConsolidated Statement of Financial Position
Consolidated Statement of Operations & Accumulated Surplus
Consolidated Statement of Changes in Net Financial Assets
Consolidated Statement of Cash Flows
Notes to the Consolidated Financial Statements
112021 ANNUAL MUNICIPAL REPORT |
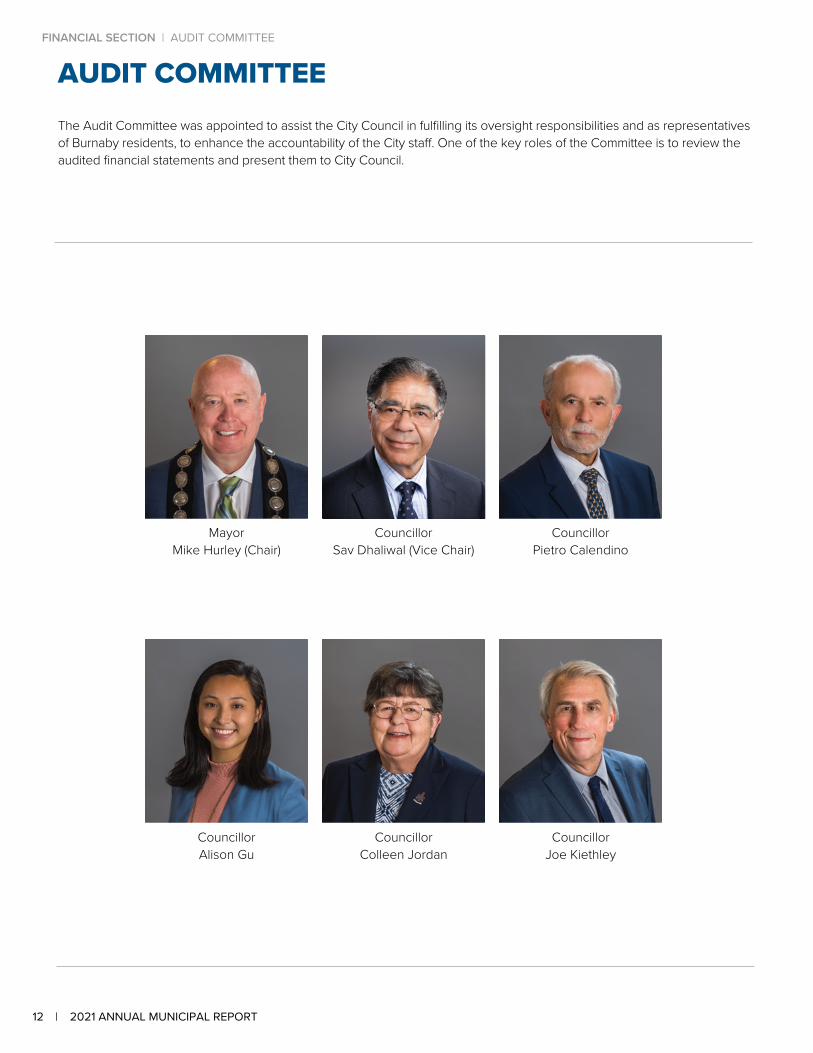
AUDIT COMMITTEEThe Audit Committee was appointed to assist the City Council in fulfilling its oversight responsibilities and as representatives of Burnaby residents, to enhance the accountability of the City staff. One of the key roles of the Committee is to review the audited financial statements and present them to City Council.
Mayor Mike Hurley (Chair)
Councillor Sav Dhaliwal (Vice Chair)
CouncillorPietro Calendino
CouncillorJoe Kiethley
Councillor Colleen Jordan
Councillor Alison Gu
12 | 2021 ANNUAL MUNICIPAL REPORT
FINANCIAL SECTION | AUDIT COMMITTEE
TREASURER’S REPORT2022 May 9
Mayor Mike Hurley and Members of Council,
I am pleased to present the 2021 Annual Municipal Report for the City of Burnaby. The purpose of this report is to publish the City of Burnaby’s audited Consolidated Financial Statements and provide an update on municipal services and operations for the fiscal year ended December 31, 2021 in accordance with Sections 98 and 167 of the Community Charter. Included in this Treasurer’s report is a financial overview, a summary on the City’s reserve funds and reserves, and highlights of the City’s investments.
Preparation of the consolidated financial statements is the responsibility of City Council and Management of the City of Burnaby. The consolidated financial statements have been
prepared in accordance with Canadian Public Sector Accounting Standards. Management is also responsible for ensuring the City remains fiscally prudent and financially sustainable through the ongoing monitoring of all financial affairs of the City. As a result, the City maintains a system of internal accounting controls designed to provide reasonable assurances for the safeguarding of assets and the reliability of financial records.
KPMG LLP has been appointed by City Council to independently audit the City’s consolidated financial statements. They have expressed an opinion that the City’s consolidated financial statements present fairly, in all material respects, the consolidated financial position of the City of Burnaby as at December 31, 2021, and its consolidated results of operations, its consolidated changes in net financial assets and its consolidated cash flows for the year then ended in accordance with Canadian Public Sector Accounting Standards. KPMG LLP reports their audit results to City Council through the City’s Audit Committee.
The COVID-19 global pandemic continued to impact operations in 2021. City services and programs were adjusted in accordance with Provincial Health Officer’s (PHO) COVID-19 guidelines. PHO restrictions resulted in significant revenue shortfalls in 2021, specifically in reduced programming for the Parks, Recreation & Cultural Services Department. In order to mitigate financial impacts, the City prioritized expenditures and utilized City reserves to cover any shortfalls due to the pandemic.
Despite the pandemic, development activity was strong in 2021 with community benefit contributions from developers exceeding $300 million. The developers contributions to the Community Benefit Bonus Program allows the City to address affordable housing needs and capital investment in key amenities as the City’s population continues to grow. Capital investment to fund timely renewal and enhancement of all key infrastructure, without incurring debt, remains a Council priority and is achieved through strategic financial planning over the years.
In addition, there was an increase in the number of building permit applications processed as compared to 2020, with a total construction value of over $1 billion. The most recent census data indicates that Burnaby is among the fastest-growing major municipalities in Canada. City Council’s housing policies and processes have put Burnaby above the regional average in housing growth. These results highlight Burnaby as a City where people want to make their home.
To address community needs, the City continues to concentrate its efforts on initiatives that impact the community as a whole. In 2021, the City has issued grants to fund childcare facilities which address the needs of childcare support within the community. Also, the City continues to pursue partnerships with government agencies, not-for-profit societies and private developers to help increase the supply of affordable housing within the community through numerous non-market housing initiatives.
Furthermore, in 2021, the City continued to build on its Climate Action Framework and City Energy Strategy that was approved in July 2020. The new Carbon Price Policy was adopted in March 2021; the inclusion of the carbon price in the decision making process for projects and initiatives that involve carbon emissions will help the City reach its’ carbon reduction targets. The City has entered into a three-year Urban Resilient Futures Initiative partnership with Vancity and SFU Morris J. Wosk Centre for Dialogue and aims to overcome barriers to climate action at the neighbourhood level, engaging the community on the City’s Building Retrofit Strategy and integrating into the City’s Official Community Plan renewal process. In order to reduce greenhouse gas emissions, building infrastructure for the electrification of fleet vehicles and equipment has begun at specific locations and remains a key requirement for future civic operational sites.
TREASURER’S REPORT | FINANCIAL SECTION
132021 ANNUAL MUNICIPAL REPORT |
Financial Overview
CONSOLIDATED STATEMENT OF FINANCIAL POSITION ($ millions)
2021 Actual 2020 Actual Year Over Year Change
Net Financial Assets 1,917.1 1,652.4 264.7
Non-Financial Assets 3,181.8 3,014.1 167.7
Accumulated Surplus 5,098.9 4,666.5 432.4
The City’s financial position continues to be strong as at December 31, 2021. The Annual Surplus is $432.4 million (2020 - $139.0 million), bringing Accumulated Surplus to $5,098.9 million. The accumulated surplus on the Consolidated Statement of Financial Position is a key measure of the City of Burnaby’s financial strength and long-term sustainability. Accumulated Surplus consists of Net Financial Assets and Non-Financial Assets.
Net Financial Assets is the amount by which all assets exceed all liabilities and represents the City’s reserve funds and reserves of $1,917.1 million (2020 - $1,652.4 million). Net Financial Assets denotes the City’s ability to meet its future obligations. The increase in Net Financial Assets of $264.7 million over the prior year is primarily due to community benefit contributions which in turn allows for further growth in the investment portfolio.
Non-Financial Assets of $3,181.8 million (2020 - $3,014.1 million), are comprised of the net book value of the City’s capital assets, which include civic buildings, recreation centres, parks, roads, water and sewer infrastructure and land. Non-Financial Assets also include inventory of supplies and prepaid expenses. Non-Financial Assets increased by $167.7 million over the prior year due to an increase in capital assets such as the new Christine Sinclair Community Centre and key engineering infrastructure.
CONSOLIDATED STATEMENT OF OPERATIONS ($ millions)
2021 Budget 2021 Actual 2020 Actual 2021 Budget Variance
Year Over Year Change
Revenues 655.8 954.5 619.3 298.7 335.2
Expenses 551.1 522.1 480.3 29.0 (41.8)
Annual Surplus 104.7 432.4 139.0 327.7 293.4
BUDGET VARIANCEThe Annual Surplus of $432.4 million, which is the excess of revenues less expenditures, was more than the budget of $104.7 million by $327.7 million.
Consolidated revenue of $954.5 million was higher than the budgeted revenue by $298.7 million, mainly due to higher than expected community benefit contributions received from developers in 2021. Furthermore, the City also generated higher than budgeted gain on land sales, contributed revenue from project completion with asset ownership transferred to the City, and higher permit revenue due to strong development activity throughout the City. This is partially offset by lower than expected sales of goods & services revenue primarily due to lower recreational program revenues as a result of the PHO restrictions of City facilities and subsequent reduced programming caused by the pandemic.
Consolidated expenses of $522.1 million across all City functions and services was lower than budgeted by $29.0 million, predominantly due to compensation and other operational programming expenditure savings due to reduced programming and deferral of projects and initiatives as a result of the pandemic. In addition, there are savings from less community housing grants issued. This savings is partially offset by the significantly higher than budgeted rate increase for RCMP Members resulting from the ratification of the RCMP collective agreement, increases in RCMP overtime and additional RCMP vehicle replacements.
14 | 2021 ANNUAL MUNICIPAL REPORT
FINANCIAL SECTION | TREASURER’S REPORT
YEAR OVER YEAR CHANGEAnnual Surplus of $432.4 million (2020 - $139.0 million) is higher in 2021 compared to 2020 by $293.4 million.
Consolidated revenue of $954.5 million (2020 - $619.3 million) increased from the prior year by $335.2 million mainly due to increases from community benefit contributions from the increase in development activities, increase in property taxes, new growth and contributed revenue from the project completion with asset ownership transferred to the City. This increase is partially offset by lower gain on land sales for the City’s various land sale transactions completed in the year and decreased investment income due to lower interest rates.
Consolidated expenses of $522.1 million (2020 - $480.3 million) increased in 2021 from the prior year by $41.8 million primarily due to increases in the collective agreement costs, costs associated with the reopening of facilities and increase is programs and services, increase in grants issued to the School Board for Childcare facilities and Executive Committee of Council grants, RCMP contract costs due to the significant increase from the ratification of the outstanding RCMP collective agreement, increase in amortization from new facilities and infrastructures, Greater Vancouver Sewer & Drainage District and Greater Vancouver Water District charges, and other general contract and inflationary escalations.
Reserve Funds and ReservesThe City’s reserve funds and reserves are comprised of capital and operating reserve funds and reserves. The total of all reserve funds and reserves at the end of 2021 is $1,917.1 million (2020 - $1,652.5 million).
Capital reserve funds and reserves account for the largest portion of the City’s financial portfolio at 91.4%. Interest earned on capital reserve funds and reserves are contributed back to the respective reserve funds or reserves. Capital reserve funds and reserves are used for new assets and to replace existing assets and infrastructure that are no longer able to provide service.
The City’s Community Benefit Bonus Reserves are funded by developer contributions through Burnaby’s Community Benefit Bonus Program. The program is essential to enable the City to attain new community amenities, including recreational and cultural facilities, space for non-profit service organizations and affordable and/or special needs housing. This program allows the City to continue serving our growing population within Burnaby, without otherwise having to raise property taxes or incur external debt. In 2021, as development activities increased, the City received a significant amount of contributions from developers through the Community Benefit Bonus Program. As development continues, a number of amenities will be funded from this program and will include Childcare facilities, Fire Stations, Burnaby Lake Aquatic & Arena Facility, Brentwood Community Space, Willingdon Community Centre, Confederation Park Recreation Centre, Cameron Community Centre and Library, and Rosemary Brown Arena.
Accounting for 8.6% of the City’s financial portfolio, operating reserves are comprised of the General Operating Reserves including stabilization, insurance and snow removal, the Waterworks Utility and the Sanitary Sewer Fund Operating Reserves. Operating reserves provide City Council with the ability to maintain property taxation stability and are dedicated to supporting operating needs for unforeseen events. Interest earned (2021 - $6.58 million) on these reserves is contributed to general operations to reduce the impact of increases in property taxation.
InvestmentsThe City’s reserve funds and reserves are invested in short and long-term investments based on the City’s projected cash flow needs. During 2021, the investment portfolio earned an average annual yield of 2.22% (2020 - 2.82%) and generated a notable return of $45.5 million (2020 - $55.8 million). A portion of this return, $3.2 million (2020 - $3.8 million) of investment earnings, was allocated to the Development Cost Charges Reserve Funds which is reflected as deferred revenue and included in the consolidated financial statements as a liability.
In closing, under the direction and guidance of City Council, the City of Burnaby remains fiscally prudent while navigating through the challenges and pressures of a global pandemic. Furthermore, the City continues to generate strong financial growth while executing on its fiscal strategy to maintain stabilized property tax rates and remain debt-free.
Respectfully submitted,
Noreen Kassam, CPA, CGADeputy Chief Administrative Officer & Chief Financial Officer
TREASURER’S REPORT | FINANCIAL SECTION
152021 ANNUAL MUNICIPAL REPORT |
KPMG LLP PO Box 10426 777 Dunsmuir Street Vancouver BC V7Y 1K3 Canada Telephone (604) 691-3000 Fax (604) 691-3031
KPMG LLP, an Ontario limited liability partnership and member firm of the KPMG global organization of independent member firms affiliated with KPMG International Limited, a private English company limited by guarantee. KPMG Canada provides services to KPMG LLP.
f
DRAFT - March 28, 2022
INDEPENDENT AUDITORS’ REPORT To the Mayor and Council of the City of Burnaby
Opinion
We have audited the consolidated financial statements of the City of Burnaby (the “City”), which comprise:
• the consolidated statement of financial position as at December 31, 2021;
• the consolidated statement of operations and accumulated surplus for the year then ended;
• the consolidated statement of changes in net financial assets for the year then ended;
• the consolidated statement of cash flows for the year then ended;
• and notes and schedule to the consolidated financial statements, including a summary of significant accounting policies
(hereinafter referred to as the “financial statements”).
In our opinion, the accompanying financial statements present fairly, in all material respects, the consolidated financial position of the City as at December 31, 2021, and its consolidated results of operations, its consolidated changes in net financial assets and its consolidated cash flows for the year then ended in accordance with Canadian public sector accounting standards.
Basis for Opinion
We conducted our audit in accordance with Canadian generally accepted auditing standards. Our responsibilities under those standards are further described in the “Auditors’ Responsibilities for the Audit of the Financial Statements” section of our auditors’ report.
We are independent of the City in accordance with the ethical requirements that are relevant to our audit of the financial statements in Canada and we have fulfilled our other ethical responsibilities in accordance with these requirements.
We believe that the audit evidence we have obtained is sufficient and appropriate to provide a basis for our opinion.
16 | 2021 ANNUAL MUNICIPAL REPORT
FINANCIAL SECTION | AUDITORS’ REPORT
DRAFT
City of Burnaby Page 2
DRAFT - March 28, 2022
Other Information
Management is responsible for the other information. Other information comprises the information, other than the financial statements and the auditors' report thereon, included in the 2021 Annual Municipal Report.
Our opinion on the financial statements does not cover the other information and we do not and will not express any form of assurance conclusion thereon.
In connection with our audit of the financial statements, our responsibility is to read the other information identified above and, in doing so, consider whether the other information is materially inconsistent with the financial statements or our knowledge obtained in the audit and remain alert for indications that the other information appears to be materially misstated.
We obtained the information, other than the financial statements and the auditors' report thereon, included in the 2021 Annual Municipal Report as at the date of this auditors’ report.
If, based on the work we have performed on this other information, we conclude that there is a material misstatement of this other information, we are required to report that fact in the auditors' report.
We have nothing to report in this regard.
Responsibilities of Management and Those Charged with Governance for the Financial Statements
Management is responsible for the preparation and fair presentation of the financial statements in accordance with Canadian public sector accounting standards, and for such internal control as management determines is necessary to enable the preparation of financial statements that are free from material misstatement, whether due to fraud or error.
In preparing the financial statements, management is responsible for assessing the City’s ability to continue as a going concern, disclosing as applicable, matters related to going concern and using the going concern basis of accounting unless management either intends to liquidate the City or to cease operations, or has no realistic alternative but to do so.
Those charged with governance are responsible for overseeing the City’s financial reporting process.
Auditors’ Responsibilities for the Audit of the Financial Statements
Our objectives are to obtain reasonable assurance about whether the financial statements as a whole are free from material misstatement, whether due to fraud or error, and to issue an auditors’ report that includes our opinion.
AUDITORS’ REPORT | FINANCIAL SECTION
172021 ANNUAL MUNICIPAL REPORT |
DRAFT
City of Burnaby Page 3
DRAFT - March 28, 2022
Reasonable assurance is a high level of assurance, but is not a guarantee that an audit conducted in accordance with Canadian generally accepted auditing standards will always detect a material misstatement when it exists.
Misstatements can arise from fraud or error and are considered material if, individually or in the aggregate, they could reasonably be expected to influence the economic decisions of users taken on the basis of the financial statements.
As part of an audit in accordance with Canadian generally accepted auditing standards, we exercise professional judgment and maintain professional skepticism throughout the audit. We also:
• Identify and assess the risks of material misstatement of the financial statements, whether due to fraud or error, design and perform audit procedures responsive to those risks, and obtain audit evidence that is sufficient and appropriate to provide a basis for our opinion.
The risk of not detecting a material misstatement resulting from fraud is higher than for one resulting from error, as fraud may involve collusion, forgery, intentional omissions, misrepresentations, or the override of internal control.
• Obtain an understanding of internal control relevant to the audit in order to design audit procedures that are appropriate in the circumstances, but not for the purpose of expressing an opinion on the effectiveness of the City’s internal control.
• Evaluate the appropriateness of accounting policies used and the reasonableness of accounting estimates and related disclosures made by management.
• Conclude on the appropriateness of management's use of the going concern basis of accounting and, based on the audit evidence obtained, whether a material uncertainty exists related to events or conditions that may cast significant doubt on City’s ability to continue as a going concern. If we conclude that a material uncertainty exists, we are required to draw attention in our auditors’ report to the related disclosures in the financial statements or, if such disclosures are inadequate, to modify our opinion. Our conclusions are based on the audit evidence obtained up to the date of our auditors’ report. However, future events or conditions may cause City to cease to continue as a going concern.
• Evaluate the overall presentation, structure and content of the financial statements, including the disclosures, and whether the financial statements represent the underlying transactions and events in a manner that achieves fair presentation.
• Communicate with those charged with governance regarding, among other matters, the planned scope and timing of the audit and significant audit findings, including any significant deficiencies in internal control that we identify during our audit.
18 | 2021 ANNUAL MUNICIPAL REPORT
FINANCIAL SECTION | AUDITORS’ REPORT
City of Burnaby Page 4
DRAFT - March 28, 2022
• Obtain sufficient appropriate audit evidence regarding the financial information of the entities or business activities within the group entity to express an opinion on the financial statements. We are responsible for the direction, supervision and performance of the group audit. We remain solely responsible for our audit opinion.
Chartered Professional Accountants
Vancouver, Canada
April __, 2022
DRAFT
AUDITORS’ REPORT | FINANCIAL SECTION
192021 ANNUAL MUNICIPAL REPORT |
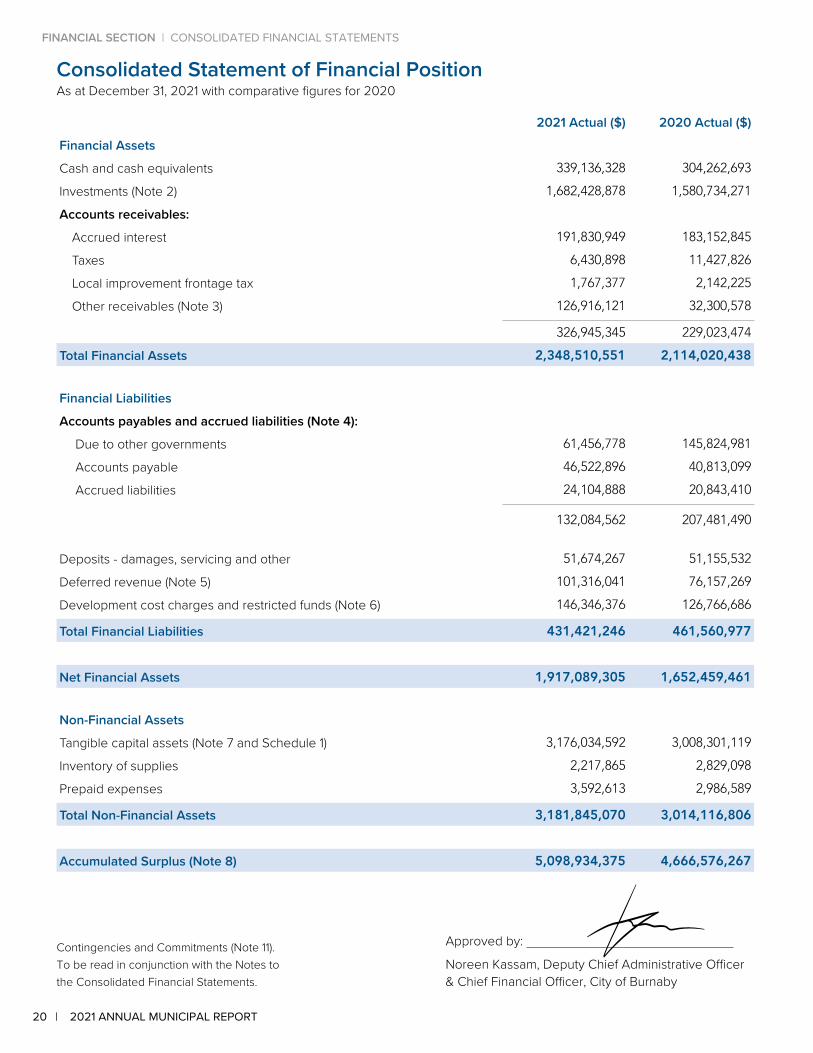
Consolidated Statement of Financial PositionAs at December 31, 2021 with comparative figures for 2020
2021 Actual ($) 2020 Actual ($)
Financial Assets
Cash and cash equivalents 339,136,328 304,262,693
Investments (Note 2) 1,682,428,878 1,580,734,271
Accounts receivables:
Accrued interest 191,830,949 183,152,845
Taxes 6,430,898 11,427,826
Local improvement frontage tax 1,767,377 2,142,225
Other receivables (Note 3) 126,916,121 32,300,578
326,945,345 229,023,474
Total Financial Assets 2,348,510,551 2,114,020,438
Financial Liabilities
Accounts payables and accrued liabilities (Note 4):
Due to other governments 61,456,778 145,824,981
Accounts payable 46,522,896 40,813,099
Accrued liabilities 24,104,888 20,843,410
132,084,562 207,481,490
Deposits - damages, servicing and other 51,674,267 51,155,532
Deferred revenue (Note 5) 101,316,041 76,157,269
Development cost charges and restricted funds (Note 6) 146,346,376 126,766,686
Total Financial Liabilities 431,421,246 461,560,977
Net Financial Assets 1,917,089,305 1,652,459,461
Non-Financial Assets
Tangible capital assets (Note 7 and Schedule 1) 3,176,034,592 3,008,301,119
Inventory of supplies 2,217,865 2,829,098
Prepaid expenses 3,592,613 2,986,589
Total Non-Financial Assets 3,181,845,070 3,014,116,806
Accumulated Surplus (Note 8) 5,098,934,375 4,666,576,267
Approved by:
Noreen Kassam, Deputy Chief Administrative Officer & Chief Financial Officer, City of Burnaby
Contingencies and Commitments (Note 11). To be read in conjunction with the Notes to the Consolidated Financial Statements.
20 | 2021 ANNUAL MUNICIPAL REPORT
FINANCIAL SECTION | CONSOLIDATED FINANCIAL STATEMENTS

Consolidated Statement of Operations and Accumulated SurplusFor the year ended December 31, 2021 with comparative figures for 2020
2021 Budget ($) 2021 Actual ($) 2020 Actual ($)
Revenues (Note 1 (B), 15)
Taxation revenue (Note 10) 318,713,900 319,636,883 304,640,143
Sales of goods and services 118,677,700 116,849,717 107,363,048
Investment income 41,447,800 42,263,976 51,984,393
Other revenue 53,314,300 86,346,264 90,552,865
Community benefit bonus 95,000,000 341,660,886 17,619,102
Contributed asset revenue 5,000,000 21,695,904 9,446,255
Transfers from other governments (Note 9) 17,599,400 21,644,029 28,051,301
Transfer from restricted funds and development cost charges (Note 6)
6,080,000 4,417,735 9,698,429
Total Revenues 655,833,100 954,515,394 619,355,536
Expenses
General government services 119,046,300 95,996,995 81,446,223
Protective services 131,030,000 133,774,985 122,665,009
Transportation services 56,899,900 59,563,093 56,840,414
Environmental services 111,500,800 108,638,347 105,430,981
Development services 9,622,200 9,238,279 7,561,160
Parks, recreation and cultural services 123,045,200 114,945,587 106,370,536
Total Expenses 551,144,400 522,157,286 480,314,323
Annual Surplus 104,688,700 432,358,108 139,041,213
Accumulated Surplus, Beginning of Year 4,666,576,267 4,666,576,267 4,527,535,054
Accumulated Surplus, End of Year 4,771,264,967 5,098,934,375 4,666,576,267
To be read in conjunction with the Notes to the Consolidated Financial Statements.
CONSOLIDATED FINANCIAL STATEMENTS | FINANCIAL SECTION
212021 ANNUAL MUNICIPAL REPORT |
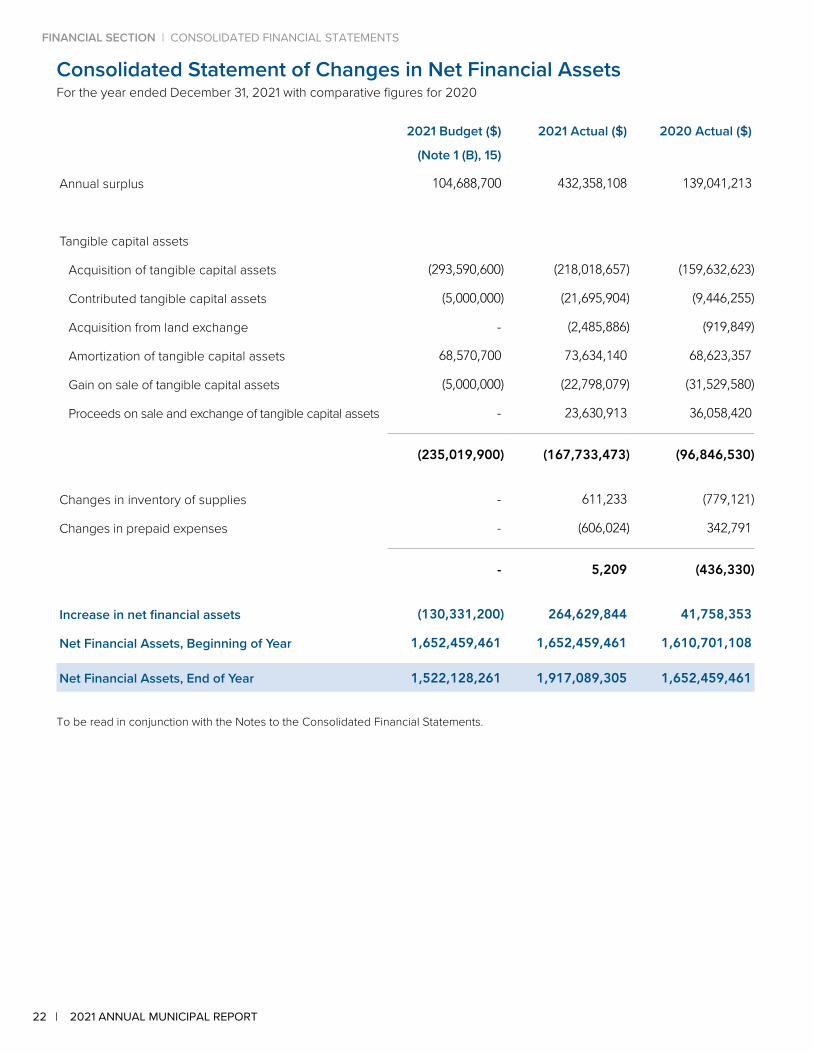
Consolidated Statement of Changes in Net Financial AssetsFor the year ended December 31, 2021 with comparative figures for 2020
2021 Budget ($) 2021 Actual ($) 2020 Actual ($)
(Note 1 (B), 15)
Annual surplus 104,688,700 432,358,108 139,041,213
Tangible capital assets
Acquisition of tangible capital assets (293,590,600) (218,018,657) (159,632,623)
Contributed tangible capital assets (5,000,000) (21,695,904) (9,446,255)
Acquisition from land exchange - (2,485,886) (919,849)
Amortization of tangible capital assets 68,570,700 73,634,140 68,623,357
Gain on sale of tangible capital assets (5,000,000) (22,798,079) (31,529,580)
Proceeds on sale and exchange of tangible capital assets - 23,630,913 36,058,420
(235,019,900) (167,733,473) (96,846,530)
Changes in inventory of supplies - 611,233 (779,121)
Changes in prepaid expenses - (606,024) 342,791
- 5,209 (436,330)
Increase in net financial assets (130,331,200) 264,629,844 41,758,353
Net Financial Assets, Beginning of Year 1,652,459,461 1,652,459,461 1,610,701,108
Net Financial Assets, End of Year 1,522,128,261 1,917,089,305 1,652,459,461
To be read in conjunction with the Notes to the Consolidated Financial Statements.
22 | 2021 ANNUAL MUNICIPAL REPORT
FINANCIAL SECTION | CONSOLIDATED FINANCIAL STATEMENTS
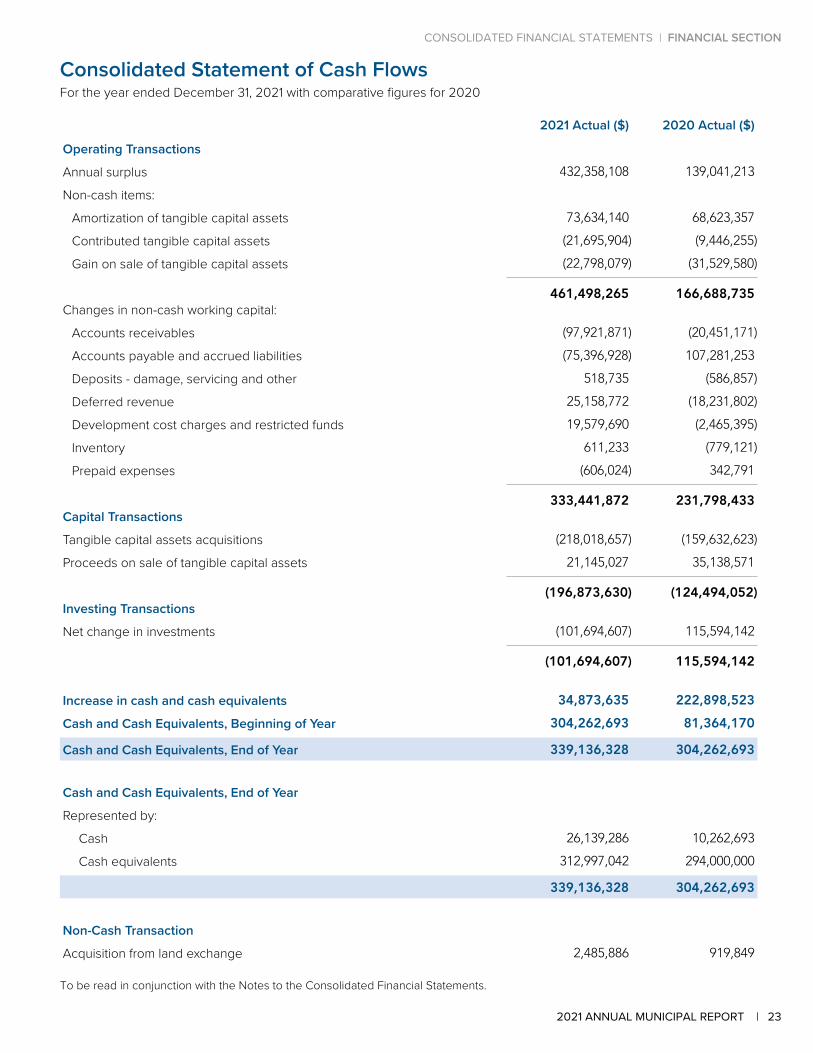
Consolidated Statement of Cash FlowsFor the year ended December 31, 2021 with comparative figures for 2020
2021 Actual ($) 2020 Actual ($)
Operating Transactions
Annual surplus 432,358,108 139,041,213
Non-cash items:
Amortization of tangible capital assets 73,634,140 68,623,357
Contributed tangible capital assets (21,695,904) (9,446,255)
Gain on sale of tangible capital assets (22,798,079) (31,529,580)
461,498,265 166,688,735 Changes in non-cash working capital:
Accounts receivables (97,921,871) (20,451,171)
Accounts payable and accrued liabilities (75,396,928) 107,281,253
Deposits - damage, servicing and other 518,735 (586,857)
Deferred revenue 25,158,772 (18,231,802)
Development cost charges and restricted funds 19,579,690 (2,465,395)
Inventory 611,233 (779,121)
Prepaid expenses (606,024) 342,791
333,441,872 231,798,433 Capital Transactions
Tangible capital assets acquisitions (218,018,657) (159,632,623)
Proceeds on sale of tangible capital assets 21,145,027 35,138,571
(196,873,630) (124,494,052)Investing Transactions
Net change in investments (101,694,607) 115,594,142
(101,694,607) 115,594,142
Increase in cash and cash equivalents 34,873,635 222,898,523
Cash and Cash Equivalents, Beginning of Year 304,262,693 81,364,170
Cash and Cash Equivalents, End of Year 339,136,328 304,262,693
Cash and Cash Equivalents, End of Year
Represented by:
Cash 26,139,286 10,262,693
Cash equivalents 312,997,042 294,000,000
339,136,328 304,262,693
Non-Cash Transaction
Acquisition from land exchange 2,485,886 919,849
To be read in conjunction with the Notes to the Consolidated Financial Statements.
CONSOLIDATED FINANCIAL STATEMENTS | FINANCIAL SECTION
232021 ANNUAL MUNICIPAL REPORT |
NOTES TO THE CONSOLIDATED FINANCIAL STATEMENTSBurnaby was incorporated in 1892 as a district municipality and one hundred years after incorporation, became the City of Burnaby (the “City”). The City is legislated under the Local Government Act of British Columbia and its principal activities include the provision of local government services to residents of the incorporated area. These include administrative, protective, infrastructure, environmental, planning, building, recreational, waterworks, and sanitary sewer services.
1. Significant Accounting PoliciesThe consolidated financial statements of the City have been prepared by management in accordance with Canadian generally accepted accounting principles as prescribed by the Public Sector Accounting Board (PSAB) of the Chartered Professional Accountants of Canada.
A. BASIS OF CONSOLIDATION
The consolidated financial statements are comprised of the City’s Operating, Capital and Reserve Funds as well as the Burnaby Public Library (the “Library”). The Library is consolidated as it is considered to be controlled by the City, by virtue of their Board being appointed by the City. Interfund balances and transactions have been eliminated on consolidation.
I. Operating Funds
These funds include the General, Waterworks Utility and Sanitary Sewer Operating Funds as well as the Burnaby Public Library. They are used to record the operating costs of services provided by the City.
II. Capital Funds
These funds include the General, Waterworks Utility and Sanitary Sewer Capital Funds and Burnaby Public Library Capital. They are used to record the acquisition costs of tangible capital assets. All the Capital Funds are combined on the financial statements.
III. Reserve Funds
Under the Community Charter of British Columbia, City Council may, by bylaw, establish reserve funds for specified purposes. Money in a reserve fund and interest earned thereon must be expended only for the purpose for which the fund was established. If the amount in a reserve fund is greater than required for the purposes for which it was established, City Council may transfer all or part of the amount to another reserve fund, provided that the nature of the reserve is used for the same purpose.
B. BUDGET
Budget information reported in the consolidated financial statements represents the 2021 Consolidated Revenues & Expenditures component of the City of Burnaby 2021-2025 Financial Plan received by City Council on April 26, 2021, and adopted through Bylaw No. 14333 on May 10, 2021.
24 | 2021 ANNUAL MUNICIPAL REPORT
FINANCIAL SECTION | CONSOLIDATED FINANCIAL STATEMENTS
C. REVENUE RECOGNITION
Revenues are recognized in the period in which the transactions or events occurred that gave rise to the revenues. All revenues are recorded on an accrual basis, except when the accruals cannot be determined with a reasonable degree of certainty or when their estimation is impractical.
Revenue recognition on the sale of properties occurs when the City has transferred the significant risks and rewards of ownership. Property lease revenue includes all amounts earned from tenants, including property tax and operating cost recoveries. Lease revenues are recognized on a straightline basis over the term of the lease.
Restricted transfers from governments are deferred and recognized as revenue in the year the related expenditures are incurred. Unrestricted transfers are recognized as revenue when received.
D. COLLECTION ON BEHALF OF OTHER AUTHORITIES
The City is required to collect and remit taxes on behalf of other tax authorities. Collections for other authorities are excluded from City revenues.
E. PROPERTY TAXES
British Columbia Assessment Authority (BCA) produces independent property assessments based on market value for all property owners in the Province as of July 01 each year. The City of Burnaby establishes property tax rates based on the assessed values provided by BCA to collect the revenue needed to fund City services and programs. Taxation revenue is recorded at the time property tax bills are issued. The City is entitled to collect interest and penalties on overdue taxes.
For 2021, the value for taxable land and buildings, (excluding valuations for exempt properties) across all property classes was $111.1 billion (2020 - $108.2 billion).
F. COMMUNITY BENEFIT BONUS REVENUE
Community Benefit Bonus revenue is a cash contribution received by the City through the land development process and recognized as revenue in the year received. These reserves are allocated by Council policy and held in capital reserves.
Council’s Community Benefit Bonus Policy provides a framework through which developments provide benefits for future amenities. The program is based on a voluntary density bonus approach provided for through provincial legislation, the Burnaby Zoning Bylaw, and Council’s direction.
Council policy directs 80% of undesignated cash contributions towards community amenities, and 20% to the City-wide Affordable Housing Reserve for affordable and/or special needs housing. Interest income earned on the Community Benefit Bonus Reserves is retained within the reserves.
As these funds are restricted for capital purposes, they are not available to be used to meet current operating expenditures or obligations. See Note 8 Reserves - Non-Statutory Capital Reserves for the balance of the Community Benefit Bonus Reserves held for future City amenities.
G. CONTRIBUTED ASSET REVENUE
Tangible capital assets from developers are a condition of the development approval process. Public Sector Accounting Board rules require municipalities to recognize as revenue the fair market value of the tangible capital assets when they are made available for use and received by the City.
The delivery of the contributed tangible capital assets is dependent upon the developer. The revenue is recognized on the Consolidated Statement of Operations and Accumulated Surplus with an increase in tangible capital assets on the Consolidated Statement of Financial Position of the same amount. Contributed asset revenue represents the fair market value of assets received. It is not a source of funding available to meet current operating expenditures or obligations.
CONSOLIDATED FINANCIAL STATEMENTS | FINANCIAL SECTION
252021 ANNUAL MUNICIPAL REPORT |
H. DEFERRED REVENUES
Deferred revenues represent the receipt of funds for which the provision of services occurs in the future, including development cost levies which have been collected in accordance to Council-approved bylaws to finance growth-related projects, other government transfers and amounts received from third parties pursuant to legislation, regulation or agreement. These revenues may only be used in the conduct of certain services, in the completion of specific work, or for the purchase of tangible capital assets. These amounts will be recognized as revenues in the year in which the expenditures are incurred.
I. EXPENSES
Expenses are recognized as they are incurred and measurable as a result of receipt of goods or services and/or the creation of a legal obligation to pay. Interest expense is accrued as the obligation is incurred.
J. CASH AND CASH EQUIVALENTS
Cash and cash equivalents include cash and short-term investments with maturities of three months or less at the date of acquisition, are readily convertible to known amounts of cash and are subject to an insignificant risk of change in value.
K. INVESTMENTS
Investments are recorded at cost, adjusted for amortization of premiums or discounts over the term of the investments on a straight-line basis. Provisions for losses are recorded when they are considered to be other than temporary. Short-term investments are those that mature between three months and one year. Long-term investments are those that mature in more than one year.
L. EMPLOYEE FUTURE BENEFITS
The City and its employees make contributions to the Municipal Pension Plan (the “Plan”). The Plan is a multi-employer contributory defined benefit pension plan. These contributions are expensed as incurred.
Sick leave and post-employment benefits accrue to the City’s employees. The liability relating to these benefits is actuarially determined based on length of service, best estimates of retirement ages and expected future salary and wage increases. The liabilities under these benefit plans are accrued based on projected benefits pro-rated as employees render services necessary to earn the future benefits.
Actuarial gains or losses are amortized over the expected average remaining service life of the related employee group.
The liability for event-driven benefits, such as disability benefits, is calculated after the event occurs. The expense is recognized in the year the event occurs.
M. GOVERNMENT TRANSFERS
Restricted transfers from governments are deferred and recognized as revenue as the related expenditures are incurred or the stipulations in the related agreements are met. Unrestricted transfers are recognized as revenue when received or if the amount to be received can be reasonably estimated and collection is reasonably assured.
26 | 2021 ANNUAL MUNICIPAL REPORT
FINANCIAL SECTION | CONSOLIDATED FINANCIAL STATEMENTS
N. NON-FINANCIAL ASSETS
Non-financial assets are not available to discharge existing liabilities and are held for use in the provision of services. They have useful lives extending beyond the current year and are not intended for sale in the ordinary course of operations.
I. Tangible Capital Assets
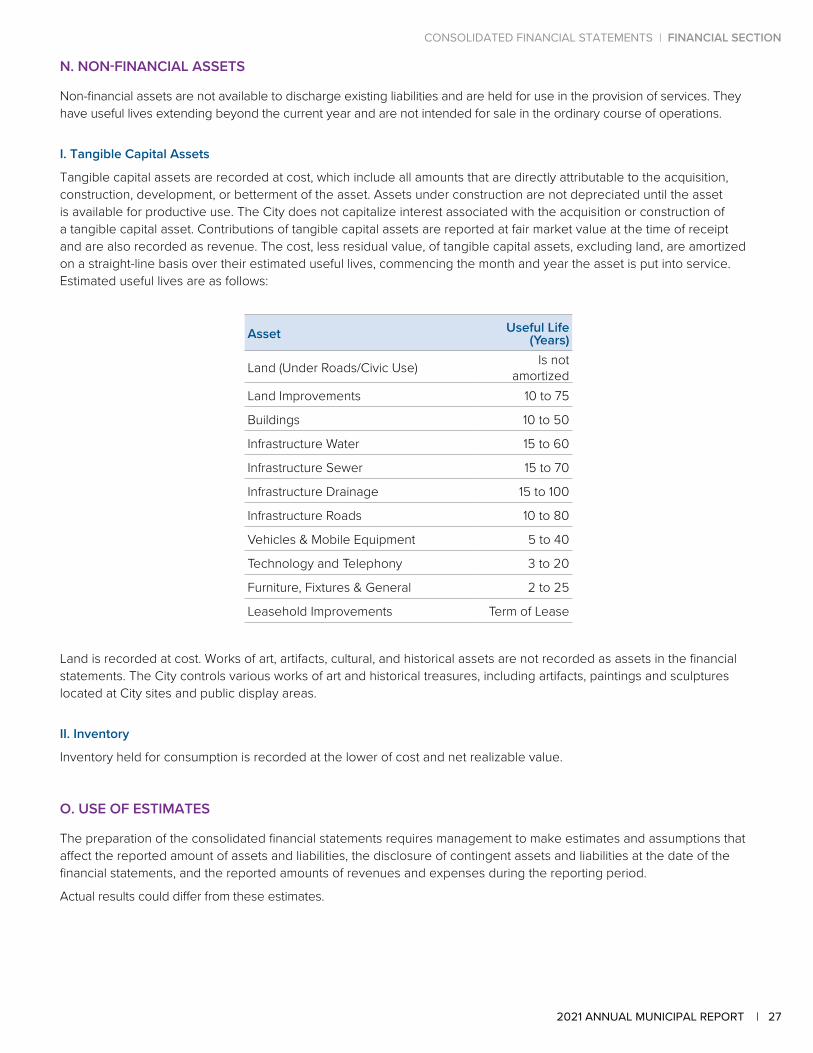
Tangible capital assets are recorded at cost, which include all amounts that are directly attributable to the acquisition, construction, development, or betterment of the asset. Assets under construction are not depreciated until the asset is available for productive use. The City does not capitalize interest associated with the acquisition or construction of a tangible capital asset. Contributions of tangible capital assets are reported at fair market value at the time of receipt and are also recorded as revenue. The cost, less residual value, of tangible capital assets, excluding land, are amortized on a straight-line basis over their estimated useful lives, commencing the month and year the asset is put into service. Estimated useful lives are as follows:
Asset Useful Life (Years)
Land (Under Roads/Civic Use) Is not amortized
Land Improvements 10 to 75
Buildings 10 to 50
Infrastructure Water 15 to 60
Infrastructure Sewer 15 to 70
Infrastructure Drainage 15 to 100
Infrastructure Roads 10 to 80
Vehicles & Mobile Equipment 5 to 40
Technology and Telephony 3 to 20
Furniture, Fixtures & General 2 to 25
Leasehold Improvements Term of Lease
Land is recorded at cost. Works of art, artifacts, cultural, and historical assets are not recorded as assets in the financial statements. The City controls various works of art and historical treasures, including artifacts, paintings and sculptures located at City sites and public display areas.
II. Inventory
Inventory held for consumption is recorded at the lower of cost and net realizable value.
O. USE OF ESTIMATES
The preparation of the consolidated financial statements requires management to make estimates and assumptions that affect the reported amount of assets and liabilities, the disclosure of contingent assets and liabilities at the date of the financial statements, and the reported amounts of revenues and expenses during the reporting period.
Actual results could differ from these estimates.
CONSOLIDATED FINANCIAL STATEMENTS | FINANCIAL SECTION
272021 ANNUAL MUNICIPAL REPORT |
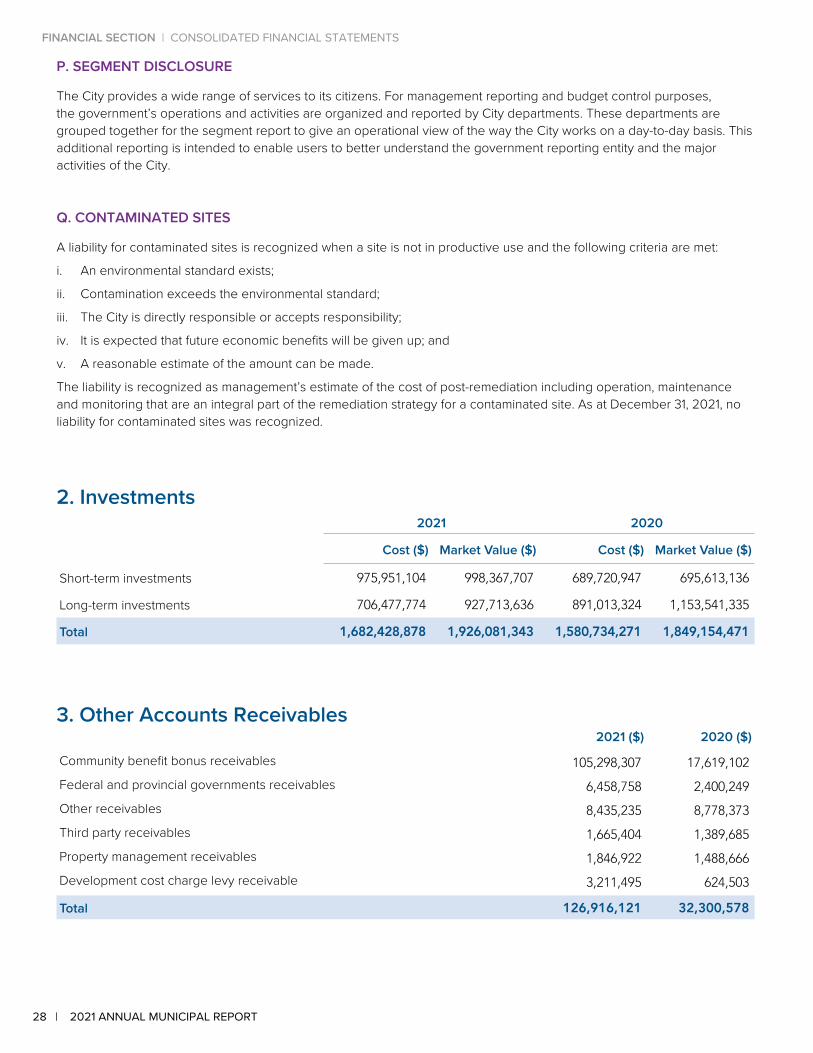
P. SEGMENT DISCLOSURE
The City provides a wide range of services to its citizens. For management reporting and budget control purposes, the government’s operations and activities are organized and reported by City departments. These departments are grouped together for the segment report to give an operational view of the way the City works on a day-to-day basis. This additional reporting is intended to enable users to better understand the government reporting entity and the major activities of the City.
Q. CONTAMINATED SITES
A liability for contaminated sites is recognized when a site is not in productive use and the following criteria are met:
i. An environmental standard exists;
ii. Contamination exceeds the environmental standard;
iii. The City is directly responsible or accepts responsibility;
iv. It is expected that future economic benefits will be given up; and
v. A reasonable estimate of the amount can be made.
The liability is recognized as management’s estimate of the cost of post-remediation including operation, maintenance and monitoring that are an integral part of the remediation strategy for a contaminated site. As at December 31, 2021, no liability for contaminated sites was recognized.
2. Investments2021 2020
Cost ($) Market Value ($) Cost ($) Market Value ($)
Short-term investments 975,951,104 998,367,707 689,720,947 695,613,136
Long-term investments 706,477,774 927,713,636 891,013,324 1,153,541,335
Total 1,682,428,878 1,926,081,343 1,580,734,271 1,849,154,471
3. Other Accounts Receivables2021 ($) 2020 ($)
Community benefit bonus receivables 105,298,307 17,619,102
Federal and provincial governments receivables 6,458,758 2,400,249
Other receivables 8,435,235 8,778,373
Third party receivables 1,665,404 1,389,685
Property management receivables 1,846,922 1,488,666
Development cost charge levy receivable 3,211,495 624,503
Total 126,916,121 32,300,578
28 | 2021 ANNUAL MUNICIPAL REPORT
FINANCIAL SECTION | CONSOLIDATED FINANCIAL STATEMENTS
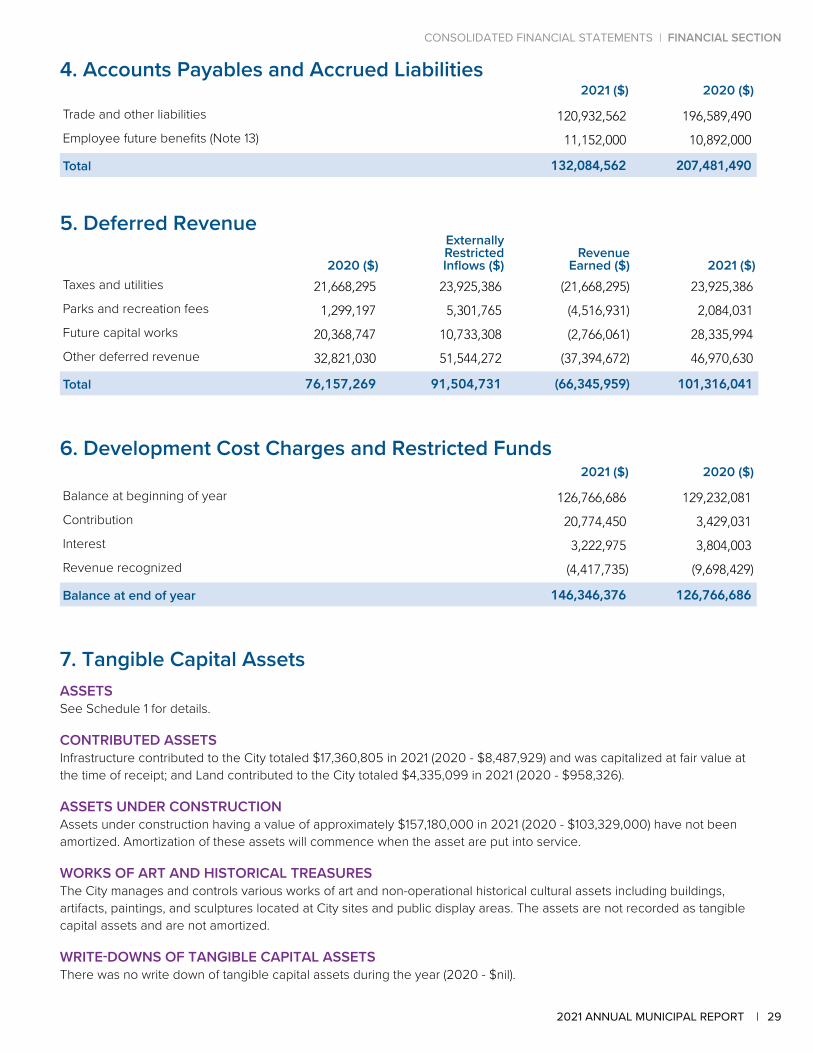
4. Accounts Payables and Accrued Liabilities2021 ($) 2020 ($)
Trade and other liabilities 120,932,562 196,589,490
Employee future benefits (Note 13) 11,152,000 10,892,000
Total 132,084,562 207,481,490
5. Deferred Revenue
2020 ($)
Externally RestrictedInflows ($)
RevenueEarned ($) 2021 ($)
Taxes and utilities 21,668,295 23,925,386 (21,668,295) 23,925,386
Parks and recreation fees 1,299,197 5,301,765 (4,516,931) 2,084,031
Future capital works 20,368,747 10,733,308 (2,766,061) 28,335,994
Other deferred revenue 32,821,030 51,544,272 (37,394,672) 46,970,630
Total 76,157,269 91,504,731 (66,345,959) 101,316,041
6. Development Cost Charges and Restricted Funds2021 ($) 2020 ($)
Balance at beginning of year 126,766,686 129,232,081
Contribution 20,774,450 3,429,031
Interest 3,222,975 3,804,003
Revenue recognized (4,417,735) (9,698,429)
Balance at end of year 146,346,376 126,766,686
7. Tangible Capital AssetsASSETSSee Schedule 1 for details.
CONTRIBUTED ASSETSInfrastructure contributed to the City totaled $17,360,805 in 2021 (2020 - $8,487,929) and was capitalized at fair value at the time of receipt; and Land contributed to the City totaled $4,335,099 in 2021 (2020 - $958,326).
ASSETS UNDER CONSTRUCTIONAssets under construction having a value of approximately $157,180,000 in 2021 (2020 - $103,329,000) have not been amortized. Amortization of these assets will commence when the asset are put into service.
WORKS OF ART AND HISTORICAL TREASURESThe City manages and controls various works of art and non-operational historical cultural assets including buildings, artifacts, paintings, and sculptures located at City sites and public display areas. The assets are not recorded as tangible capital assets and are not amortized.
WRITE-DOWNS OF TANGIBLE CAPITAL ASSETSThere was no write down of tangible capital assets during the year (2020 - $nil).
CONSOLIDATED FINANCIAL STATEMENTS | FINANCIAL SECTION
292021 ANNUAL MUNICIPAL REPORT |
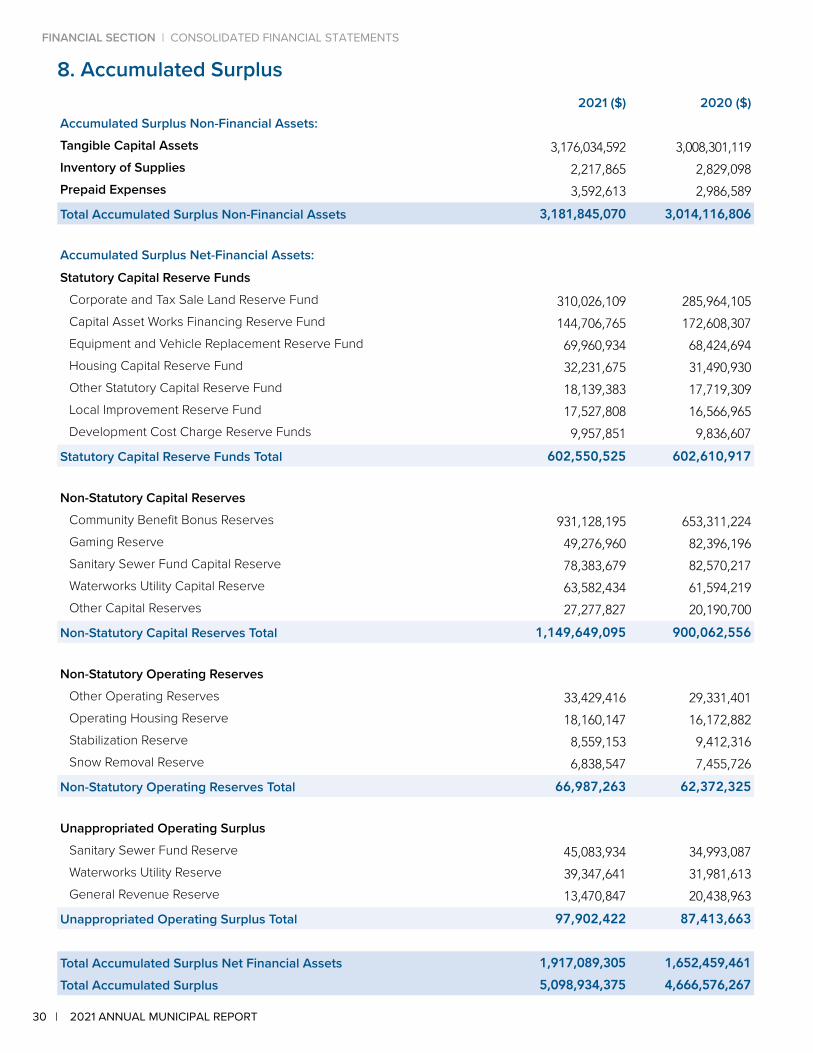
8. Accumulated Surplus2021 ($) 2020 ($)
Accumulated Surplus Non-Financial Assets:Tangible Capital Assets 3,176,034,592 3,008,301,119
Inventory of Supplies 2,217,865 2,829,098
Prepaid Expenses 3,592,613 2,986,589
Total Accumulated Surplus Non-Financial Assets 3,181,845,070 3,014,116,806
Accumulated Surplus Net-Financial Assets:
Statutory Capital Reserve FundsCorporate and Tax Sale Land Reserve Fund 310,026,109 285,964,105
Capital Asset Works Financing Reserve Fund 144,706,765 172,608,307
Equipment and Vehicle Replacement Reserve Fund 69,960,934 68,424,694
Housing Capital Reserve Fund 32,231,675 31,490,930
Other Statutory Capital Reserve Fund 18,139,383 17,719,309
Local Improvement Reserve Fund 17,527,808 16,566,965
Development Cost Charge Reserve Funds 9,957,851 9,836,607
Statutory Capital Reserve Funds Total 602,550,525 602,610,917
Non-Statutory Capital ReservesCommunity Benefit Bonus Reserves 931,128,195 653,311,224
Gaming Reserve 49,276,960 82,396,196
Sanitary Sewer Fund Capital Reserve 78,383,679 82,570,217
Waterworks Utility Capital Reserve 63,582,434 61,594,219
Other Capital Reserves 27,277,827 20,190,700
Non-Statutory Capital Reserves Total 1,149,649,095 900,062,556
Non-Statutory Operating ReservesOther Operating Reserves 33,429,416 29,331,401
Operating Housing Reserve 18,160,147 16,172,882
Stabilization Reserve 8,559,153 9,412,316
Snow Removal Reserve 6,838,547 7,455,726
Non-Statutory Operating Reserves Total 66,987,263 62,372,325
Unappropriated Operating SurplusSanitary Sewer Fund Reserve 45,083,934 34,993,087
Waterworks Utility Reserve 39,347,641 31,981,613
General Revenue Reserve 13,470,847 20,438,963
Unappropriated Operating Surplus Total 97,902,422 87,413,663
Total Accumulated Surplus Net Financial Assets 1,917,089,305 1,652,459,461
Total Accumulated Surplus 5,098,934,375 4,666,576,267
30 | 2021 ANNUAL MUNICIPAL REPORT
FINANCIAL SECTION | CONSOLIDATED FINANCIAL STATEMENTS
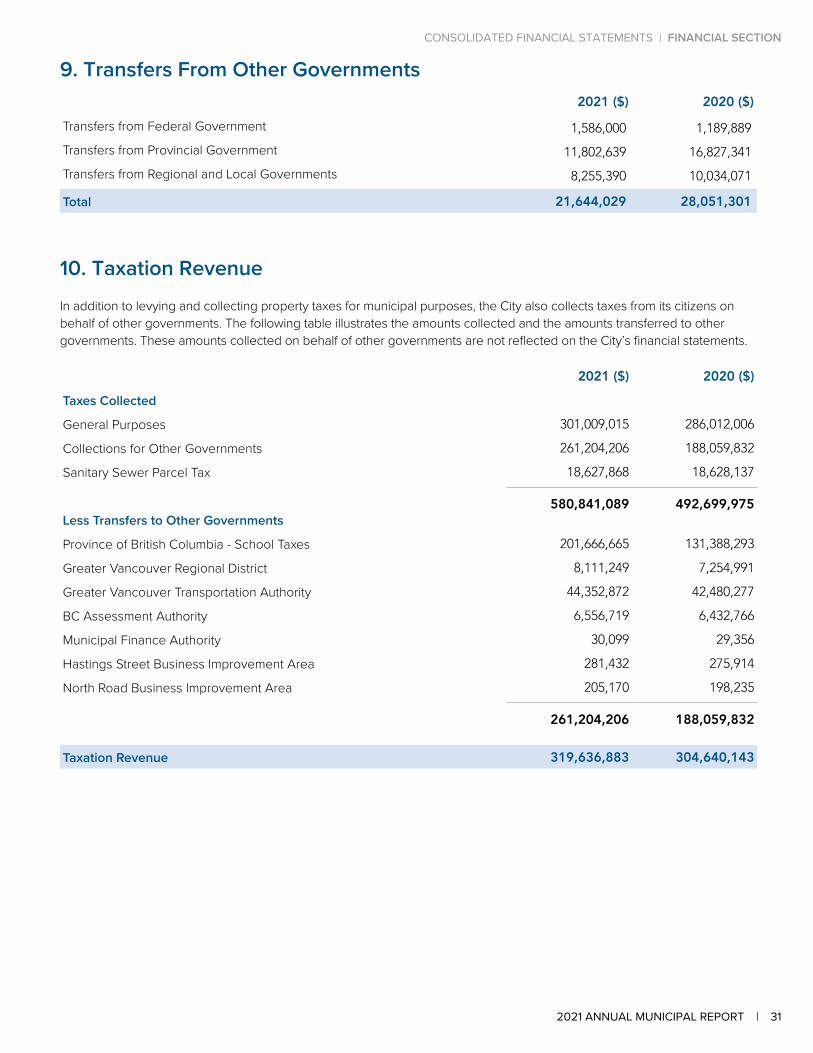
9. Transfers From Other Governments2021 ($) 2020 ($)
Transfers from Federal Government 1,586,000 1,189,889
Transfers from Provincial Government 11,802,639 16,827,341
Transfers from Regional and Local Governments 8,255,390 10,034,071
Total 21,644,029 28,051,301
10. Taxation RevenueIn addition to levying and collecting property taxes for municipal purposes, the City also collects taxes from its citizens on behalf of other governments. The following table illustrates the amounts collected and the amounts transferred to other governments. These amounts collected on behalf of other governments are not reflected on the City’s financial statements.
2021 ($) 2020 ($)
Taxes Collected
General Purposes 301,009,015 286,012,006
Collections for Other Governments 261,204,206 188,059,832
Sanitary Sewer Parcel Tax 18,627,868 18,628,137
580,841,089 492,699,975Less Transfers to Other Governments
Province of British Columbia - School Taxes 201,666,665 131,388,293
Greater Vancouver Regional District 8,111,249 7,254,991
Greater Vancouver Transportation Authority 44,352,872 42,480,277
BC Assessment Authority 6,556,719 6,432,766
Municipal Finance Authority 30,099 29,356
Hastings Street Business Improvement Area 281,432 275,914
North Road Business Improvement Area 205,170 198,235
261,204,206 188,059,832
Taxation Revenue 319,636,883 304,640,143
CONSOLIDATED FINANCIAL STATEMENTS | FINANCIAL SECTION
312021 ANNUAL MUNICIPAL REPORT |
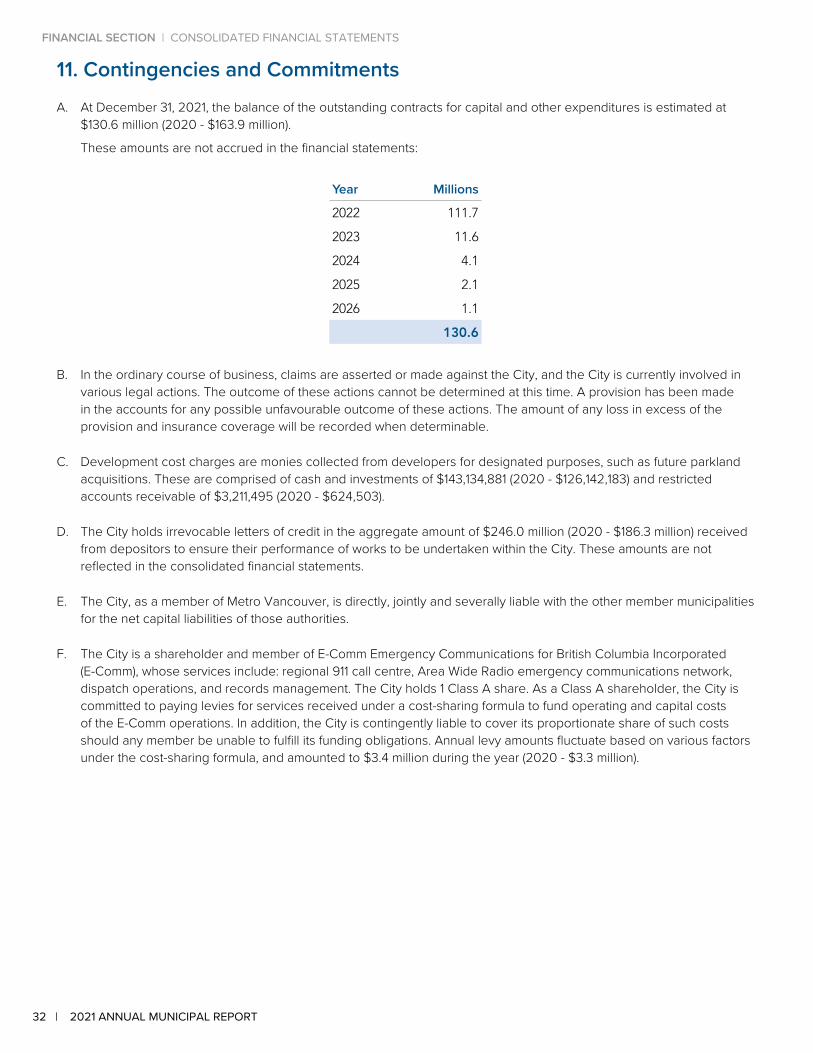
11. Contingencies and CommitmentsA. At December 31, 2021, the balance of the outstanding contracts for capital and other expenditures is estimated at
$130.6 million (2020 - $163.9 million).
These amounts are not accrued in the financial statements:
B.
Year Millions
2022 111.7
2023 11.6
2024 4.1
2025 2.1
2026 1.1
130.6
In the ordinary course of business, claims are asserted or made against the City, and the City is currently involved in various legal actions. The outcome of these actions cannot be determined at this time. A provision has been made in the accounts for any possible unfavourable outcome of these actions. The amount of any loss in excess of the provision and insurance coverage will be recorded when determinable.
C. Development cost charges are monies collected from developers for designated purposes, such as future parkland acquisitions. These are comprised of cash and investments of $143,134,881 (2020 - $126,142,183) and restricted accounts receivable of $3,211,495 (2020 - $624,503).
D. The City holds irrevocable letters of credit in the aggregate amount of $246.0 million (2020 - $186.3 million) received from depositors to ensure their performance of works to be undertaken within the City. These amounts are not reflected in the consolidated financial statements.
E. The City, as a member of Metro Vancouver, is directly, jointly and severally liable with the other member municipalities for the net capital liabilities of those authorities.
F. The City is a shareholder and member of E-Comm Emergency Communications for British Columbia Incorporated (E-Comm), whose services include: regional 911 call centre, Area Wide Radio emergency communications network, dispatch operations, and records management. The City holds 1 Class A share. As a Class A shareholder, the City is committed to paying levies for services received under a cost-sharing formula to fund operating and capital costs of the E-Comm operations. In addition, the City is contingently liable to cover its proportionate share of such costs should any member be unable to fulfill its funding obligations. Annual levy amounts fluctuate based on various factors under the cost-sharing formula, and amounted to $3.4 million during the year (2020 - $3.3 million).
32 | 2021 ANNUAL MUNICIPAL REPORT
FINANCIAL SECTION | CONSOLIDATED FINANCIAL STATEMENTS
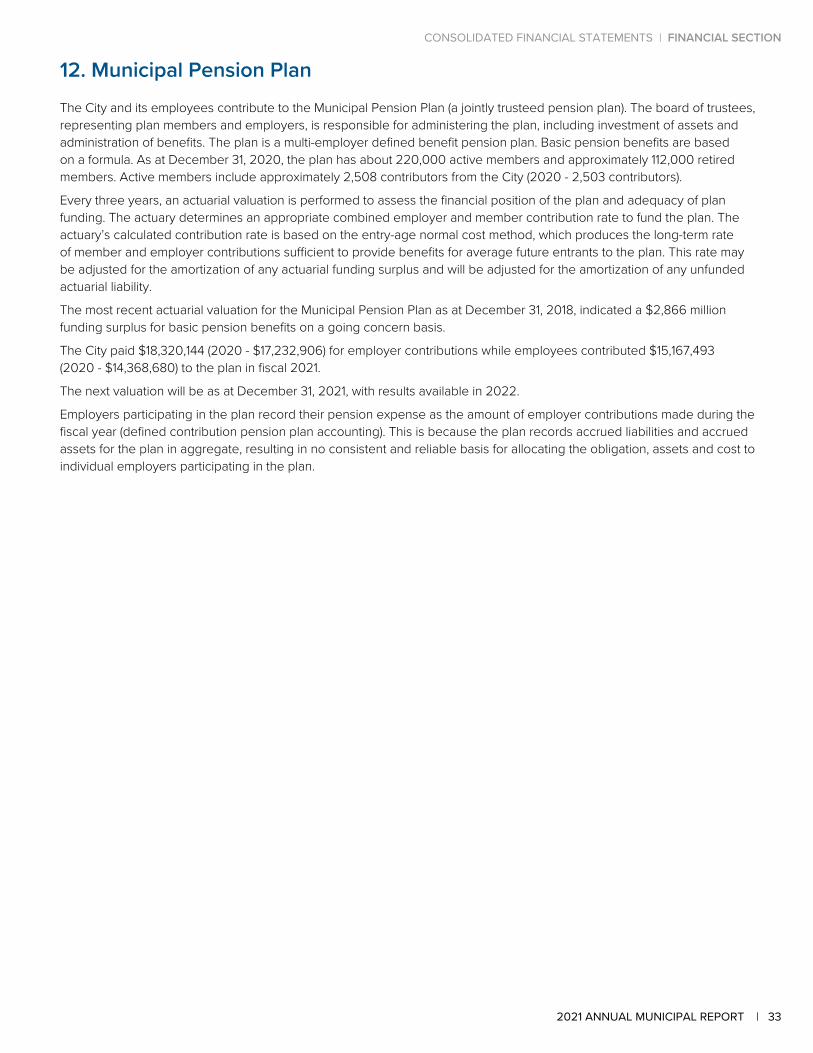
12. Municipal Pension PlanThe City and its employees contribute to the Municipal Pension Plan (a jointly trusteed pension plan). The board of trustees, representing plan members and employers, is responsible for administering the plan, including investment of assets and administration of benefits. The plan is a multi-employer defined benefit pension plan. Basic pension benefits are based on a formula. As at December 31, 2020, the plan has about 220,000 active members and approximately 112,000 retired members. Active members include approximately 2,508 contributors from the City (2020 - 2,503 contributors).
Every three years, an actuarial valuation is performed to assess the financial position of the plan and adequacy of plan funding. The actuary determines an appropriate combined employer and member contribution rate to fund the plan. The actuary’s calculated contribution rate is based on the entry-age normal cost method, which produces the long-term rate of member and employer contributions sufficient to provide benefits for average future entrants to the plan. This rate may be adjusted for the amortization of any actuarial funding surplus and will be adjusted for the amortization of any unfunded actuarial liability.
The most recent actuarial valuation for the Municipal Pension Plan as at December 31, 2018, indicated a $2,866 million funding surplus for basic pension benefits on a going concern basis.
The City paid $18,320,144 (2020 - $17,232,906) for employer contributions while employees contributed $15,167,493 (2020 - $14,368,680) to the plan in fiscal 2021.
The next valuation will be as at December 31, 2021, with results available in 2022.
Employers participating in the plan record their pension expense as the amount of employer contributions made during the fiscal year (defined contribution pension plan accounting). This is because the plan records accrued liabilities and accrued assets for the plan in aggregate, resulting in no consistent and reliable basis for allocating the obligation, assets and cost to individual employers participating in the plan.
CONSOLIDATED FINANCIAL STATEMENTS | FINANCIAL SECTION
332021 ANNUAL MUNICIPAL REPORT |
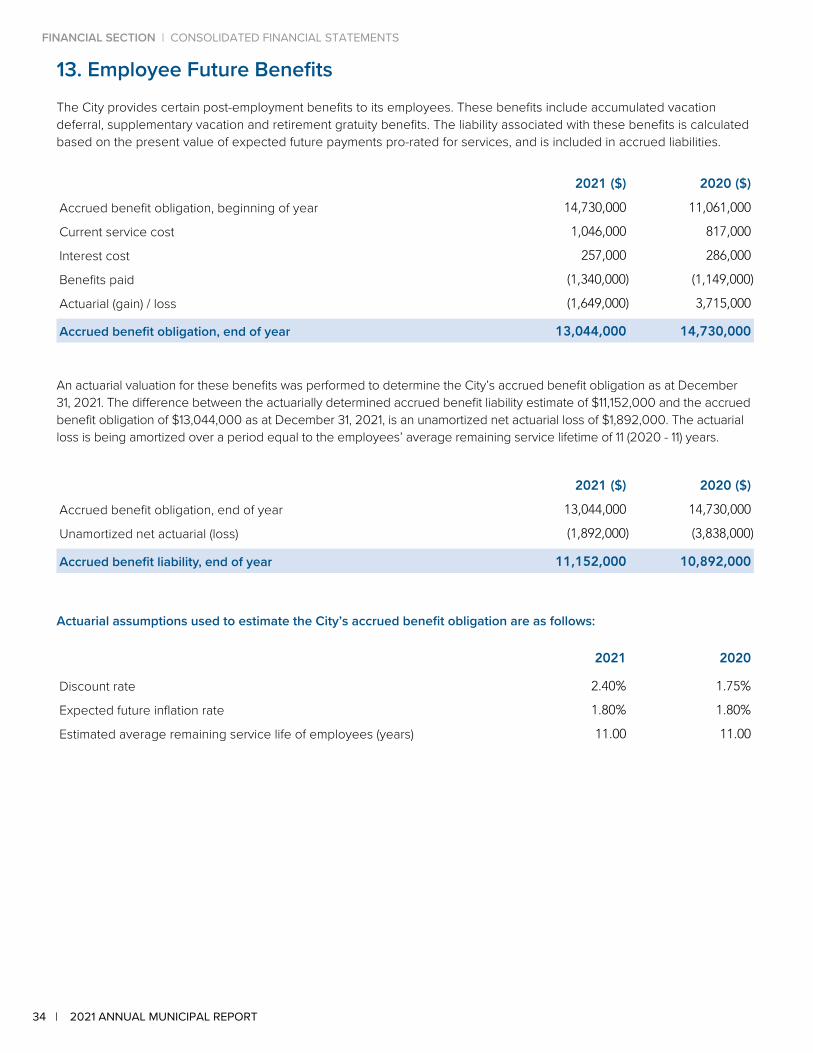
13. Employee Future BenefitsThe City provides certain post-employment benefits to its employees. These benefits include accumulated vacation deferral, supplementary vacation and retirement gratuity benefits. The liability associated with these benefits is calculated based on the present value of expected future payments pro-rated for services, and is included in accrued liabilities.
2021 ($) 2020 ($)
Accrued benefit obligation, beginning of year 14,730,000 11,061,000
Current service cost 1,046,000 817,000
Interest cost 257,000 286,000
Benefits paid (1,340,000) (1,149,000)
Actuarial (gain) / loss (1,649,000) 3,715,000
Accrued benefit obligation, end of year 13,044,000 14,730,000
An actuarial valuation for these benefits was performed to determine the City’s accrued benefit obligation as at December 31, 2021. The difference between the actuarially determined accrued benefit liability estimate of $11,152,000 and the accrued benefit obligation of $13,044,000 as at December 31, 2021, is an unamortized net actuarial loss of $1,892,000. The actuarial loss is being amortized over a period equal to the employees’ average remaining service lifetime of 11 (2020 - 11) years.
2021 ($) 2020 ($)
Accrued benefit obligation, end of year 13,044,000 14,730,000
Unamortized net actuarial (loss) (1,892,000) (3,838,000)
Accrued benefit liability, end of year 11,152,000 10,892,000
Actuarial assumptions used to estimate the City’s accrued benefit obligation are as follows:
2021 2020
Discount rate 2.40% 1.75%
Expected future inflation rate 1.80% 1.80%
Estimated average remaining service life of employees (years) 11.00 11.00
34 | 2021 ANNUAL MUNICIPAL REPORT
FINANCIAL SECTION | CONSOLIDATED FINANCIAL STATEMENTS

14. Segmented Information ($ Thousands)The following pages summarize the City’s segments by functional expenses and revenue categories.
2021General
Government &Administrative
ServicesProtective
Services
PublicWorks &
OthersSolid
WasteWaterWorks
SanitarySewer
Planning& Building
Services
Parks,Recreation& Cultural
ServicesLibrary
ServicesOtherFunds Total
Revenues
Taxation revenue 301,009 - - - - 18,628 - - - - 319,637
Sales of goods & services 676 540 2,861 6,058 58,026 28,239 119 20,330 - - 116,849
Investment income 6,583 - - - - - - - 47 35,634 42,264
Other revenue 20,021 1,173 4,492 3,424 1,352 1,158 23,428 760 1,088 29,450 86,346
Community benefit bonus - - - - - - - - - 341,661 341,661
Contributed asset revenue - - - - - - - - - 21,696 21,696
Transfers from other governments 517 2,755 8,221 - - - 753 701 - 8,697 21,644
Transfer from restricted funds & development cost charges - - - - - - - - - 4,418 4,418
328,806 4,468 15,574 9,482 59,378 48,025 24,300 21,791 1,135 441,556 954,515
Expenses
Compensation 46,403 58,936 22,783 9,729 4,401 3,941 15,304 64,852 11,059 - 237,408
Policing contract - 60,641 - - - - - - - - 60,641
General services 19,265 3,219 7,381 4,599 3,318 4,697 1,330 7,464 389 - 51,662
Materials & supplies 1,591 763 3,795 341 762 582 59 5,866 1,020 - 14,779
Equipment & related operating costs 6,777 1,606 (3,254) 5,030 849 934 213 2,040 202 - 14,397
Gas & electricity 79 276 1,616 32 203 80 - 2,460 178 - 4,924
Greater Vancouver refuse disposal 1 - - 3,425 - - - 32 - - 3,458
Greater Vancouver sewage & drainage district levy - - 953 - - 27,791 - - - - 28,744
Greater Vancouver water district- cost of water - - - - 31,858 - - - - - 31,858
Amortization / loss on disposals 11,024 2,652 34,314 185 6,233 3,140 486 14,601 1,651 - 74,286
85,140 128,093 67,588 23,341 47,624 41,165 17,392 97,315 14,499 - 522,157
243,666 (123,625) (52,014) (13,859) 11,754 6,860 6,908 (75,524) (13,364) 441,556 432,358
CONSOLIDATED FINANCIAL STATEMENTS | FINANCIAL SECTION
352021 ANNUAL MUNICIPAL REPORT |

14. Segmented Information ($ Thousands) Continued
2020General
Government &Administrative
ServicesProtective
Services
PublicWorks &
OthersSolid
WasteWaterWorks
SanitarySewer
Planning& Building
Services
Parks,Recreation& Cultural
ServicesLibrary
ServicesOtherFunds Total
Revenues
Taxation revenue 286,012 - - - - 18,628 - - - - 304,640
Sales of goods & services 478 474 2,341 5,287 55,909 27,297 106 15,471 - - 107,363
Investment income 8,068 - - - - - - - 53 43,863 51,984
Other revenue 63,340 1,071 1,845 2,884 - - 23,996 278 830 (3,691) 90,553
Community benefit bonus - - - - - - - - - 17,619 17,619
Contributed asset revenue - - - - - - - - - 9,446 9,446
Transfers from other governments 5,319 2,845 10,118 - - - 37 5,497 - 4,237 28,053
Transfer from restricted funds & development cost charges - - - - - - - - - 9,698 9,698
363,217 4,390 14,304 8,171 55,909 45,925 24,139 21,246 883 81,172 619,356
Expenses
Compensation 44,044 53,663 22,693 8,888 3,787 3,114 13,706 58,751 10,585 - 219,231
Policing contract - 54,335 - - - - - - - - 54,335
General services 11,261 3,775 6,989 5,080 2,976 4,055 5 6,537 446 - 41,124
Materials & supplies 1,624 1,341 3,516 352 522 381 60 4,986 1,290 - 14,072
Equipment & related operating costs 6,779 1,693 (3,160) 5,332 743 762 258 2,052 172 - 14,631
Gas & electricity 85 279 1,510 46 154 104 - 2,048 182 - 4,408
Greater Vancouver refuse disposal - - - 3,267 - - - 29 - - 3,296
Greater Vancouver sewage & drainage district levy - - 905 - - 26,630 - - - - 27,535
Greater Vancouver water district- cost of water - - - - 29,941 - - - - - 29,941
Amortization / loss on disposals 11,484 2,510 30,755 171 7,062 3,189 238 14,626 1,706 - 71,741
75,277 117,596 63,208 23,136 45,185 38,235 14,267 89,029 14,381 - 480,314
287,940 (113,206) (48,904) (14,965) 10,724 7,690 9,872 (67,783) (13,498) 81,172 139,042
36 | 2021 ANNUAL MUNICIPAL REPORT
FINANCIAL SECTION | CONSOLIDATED FINANCIAL STATEMENTS
The City’s segments are defined as follows:
A. GENERAL GOVERNMENT AND ADMINISTRATIVE SERVICESThis represents activities that provide for the overall administrative and strategic support of local government operations and capital acquisitions relating to general government functions. This includes general administration for the Office of the Chief Administrative Officer and Finance operations (Business Advisory Services, Budgets & Reporting, Financial Services, Purchasing, Revenue Services, and Treasury Services), Information Technology, Human Resource Management, Corporate Services and management of City rental properties, and the legislative operations of the Council, Clerk’s and Legal departments.
B. PROTECTIVE SERVICESProtective Services is comprised of the City’s Police and Fire Services. The mandate of the Police Department is to provide for the safety of the lives and property of Burnaby citizens, preserving the peace through law enforcement and working with citizens to prevent crime and maintain order. Support is provided through integrated regional units for homicide and forensic identification. Fire Services provide fire suppression services, fire prevention programs, training and education related to prevention, detection or extinguishment of fires, pre-hospital emergency paramedical care, and the handling of hazardous materials incidents. Both Police and Fire Services supply emergency coordination and response operations and support the mitigation of calamitous incidents including the evacuation of people when necessary.
ENGINEERING SERVICES
The City’s Engineering Department is a diverse and complex organization that provides many services to the citizens of Burnaby. These include: C. PUBLIC WORKS AND OTHERSMaintenance and management of the transportation infrastructure and related services which encompass administration, the maintenance of roads, sidewalks, street drainage, street lighting and signage, snow removal, and municipal parking facilities. Other services include the Environmental Services program that protects and educates Burnaby citizens about their environment. This program monitors community drinking water quality and surface water for bacteriological and chemical quality; provides response and expertise when chemical related spills occur; performs inspection and audits to support permit applications when fill or sediment control measures are required. Maintenance services for civic buildings and vehicles & equipment are provided to all City departments.
D. SOLID WASTEThe waste collection program is comprised of garbage collection, recycling, composting, street sweeping, and litter pickup.
E. WATERWORKSThe City receives treated water from three of Metro Vancouver’s reservoirs: Capilano, Seymour, and Coquitlam and distributes it through a network of pipes to its consumers. The provision of potable water and the maintenance and repair of infrastructure related to its delivery and disposal are provided by the City’s Engineering Department. Crews respond to emergency calls for broken water mains or leaky services and undertake regular maintenance of the valves, hydrants, pump stations, and reservoirs that make up our water system components. The department is also responsible for the capital replacement of aging water infrastructure.
F. SANITARY SEWERThe Engineering Department is responsible for operating and maintaining the City’s sanitary and combined sewer mains and 20 pump stations. Typical maintenance activities involve cleaning sewers by using sewer flush trucks, inspecting and repairing manholes, and excavating and repairing broken sewer mains and services. The department manages the capital improvement program for the design and construction of the sewer system. This program has made significant improvements toward the elimination of combined sewers that are located within some of the older neighbourhoods of Burnaby.
CONSOLIDATED FINANCIAL STATEMENTS | FINANCIAL SECTION
372021 ANNUAL MUNICIPAL REPORT |
G. PLANNING AND BUILDING SERVICESThe Planning Department develops the Official Community Plan for Burnaby which provides the future vision and lays the foundation for land use in the City including housing, the environment, transportation, economic development, and social policy. Current projects are considered in light of this long-term direction as the department manages development plan areas, rezonings, subdivisions, preliminary plan approvals, urban design, urban trails, and bicycle routes. The City’s Building Department supports the development process by ensuring compliance with the established BC Building Code and enforcement of the City’s construction-related bylaws. In addition, the Building Department provides Project Management services for civic development projects.
H. PARKS, RECREATION AND CULTURAL SERVICESThis segment includes programs that provide citizens an opportunity to participate in cultural, athletic, and other events. Programs also include the operations, maintenance and provision of parks and recreation, and museum facilities that enable the delivery of services. Working with schools, community and business to form partnerships for neighborhood development supportive of a healthy and active environment, programs contribute to the well-being of Burnaby’s citizens. The Parks, Recreation and Cultural Services Department manages 5,400 acres of protected beauty. Some parks have manicured lawns and formal gardens, others have lakes, and many are forested, with deep ravines with streams. Community recreation facilities, arenas and outdoor playgrounds, tennis courts, swimming pools, golf courses, and other venues provide the citizens of Burnaby with many choices to enjoy their leisure time. Cultural centres deliver arts programs, festivals and entertainment for all ages.
I. LIBRARY SERVICESThis segment includes programs that provide citizens an opportunity to participate in library and other events. Programs also include the operations, maintenance and provision of library facilities that enable the delivery of services. Working with schools, community and business to form partnerships for neighborhood development supportive of a literate environment, programs contribute to the well-being of Burnaby’s citizens. The Burnaby Public Library provides books, newspapers, CDs, DVDs, graphic novels, online databases, and downloadable books offering programs for children and adults alike that encourage learning and information sharing in a community setting.
J. OTHER FUNDSThis segment represents the City’s reserve funds and reserves.
38 | 2021 ANNUAL MUNICIPAL REPORT
FINANCIAL SECTION | CONSOLIDATED FINANCIAL STATEMENTS

15. Budget DataThe Community Charter requires Council to adopt an annual financial plan bylaw by May 15 of each fiscal year prior to the adoption of the annual property tax bylaw. The City of Burnaby prepares the annual financial plan on a revenue and expenditure basis to meet this requirement of a balanced budget and on a consolidated basis to report the City’s financial activities in accordance with Public Sector Accounting Board requirements.
The chart below reconciles the annual financial plan approved by Council and adopted on May 10, 2021 (Bylaw #14333) to the budget figures reported in these consolidated financial statements:
Operating budget: Budget Amount ($)*
Revenues 655,833,100
Expenses 551,144,400
Annual surplus per statement of operations 104,688,700
Less: capital expenditures (293,590,600)
Add: depreciation expense 68,570,700
Add: proposed internal transfers 120,331,200
Approved budget -
*Budget figures rounded to nearest hundreds.
16. Contractual RightsThe City of Burnaby has entered into contracts or agreements in the normal course of operations that it expects will result in the realization of assets and revenues in future fiscal years. The primary source of contracts and agreements are received from cost-sharing agreements, rental and leases, advertising and other agreements.
The following table summarizes the expected revenue from the City’s contractual rights:
Category ($ million) 2022 2023 2024 2025 2026 Thereafter Total
Rental / Land Lease Revenue 4.9 3.9 3.5 2.4 2.0 8.3 25.0
Advertising Revenue 0.7 0.7 0.8 0.7 0.7 1.2 4.8
Other Revenue 3.8 0.4 0.1 0.0 0.0 0.0 4.3
Total 9.4 5.0 4.4 3.1 2.7 9.5 34.1
The City is also entitled to receive revenue from other agreements. The revenue from those agreements has not been included in the amounts noted above as the amounts are difficult to quantify due to the complexity of the agreements. The amounts do not materially impact the City’s financial position.
17. Comparative FiguresCertain comparative information has been reclassified to conform to the financial statement presentation adopted for the current year.
CONSOLIDATED FINANCIAL STATEMENTS | FINANCIAL SECTION
392021 ANNUAL MUNICIPAL REPORT |

SCHEDULE 1
Consolidated Schedule of Tangible Capital AssetsAs at December 31, 2021 ($ thousands)
Class CostBeginning
of Year Additions DisposalsCost End
of Year
AccumulatedAmortization
Beginningof Year Disposals Amortization
AccumulatedAmortization
End of Year
Net BookValue End
of Year
Land Available for Resale 155,011 5,118 (28) 160,101 - - - - 160,101
Land Under Roads 1,133,280 3,953 (60) 1,137,173 - - - - 1,137,173
Land Civic Use 474,647 32,150 (5) 506,792 - - - - 506,792
Land Improvements 188,794 9,421 (604) 197,611 (83,876) 604 (6,139) (89,411) 108,200
Buildings 332,634 33,328 - 365,962 (153,989) - (9,638) (163,627) 202,335
Infrastructure - Drainage 260,598 21,781 (155) 282,224 (99,777) 95 (7,408) (107,090) 175,134
Infrastructure - Roads 858,274 48,922 (697) 906,499 (563,079) 584 (19,030) (581,525) 324,974
Infrastructure - Sewers 172,884 7,746 (202) 180,428 (73,921) 160 (2,857) (76,618) 103,810
Infrastructure - Water 293,202 7,582 (1,010) 299,774 (90,660) 574 (5,824) (95,910) 203,864
Vehicles & Mobile Equipment 79,172 7,232 (4,242) 82,162 (48,444) 4,154 (7,085) (51,375) 30,787
Technology & Telephony 112,242 5,264 (8,514) 108,992 (64,740) 8,514 (10,352) (66,578) 42,414
Furniture, Fixtures & Equipment 32,914 5,788 (3,351) 35,351 (13,452) 3,351 (4,851) (14,952) 20,399
Leasehold Improvements 5,345 64 - 5,409 (2,087) - (450) (2,537) 2,872
4,098,997 188,349 (18,868) 4,268,478 (1,194,025) 18,036 (73,634) (1,249,623) 3,018,855
Asset Under Construction 103,329 53,851 - 157,180 - - - - 157,180
Total 4,202,326 242,200 (18,868) 4,425,658 (1,194,025) 18,036 (73,634) (1,249,623) 3,176,035
40 | 2021 ANNUAL MUNICIPAL REPORT
FINANCIAL SECTION | CONSOLIDATED FINANCIAL STATEMENTS
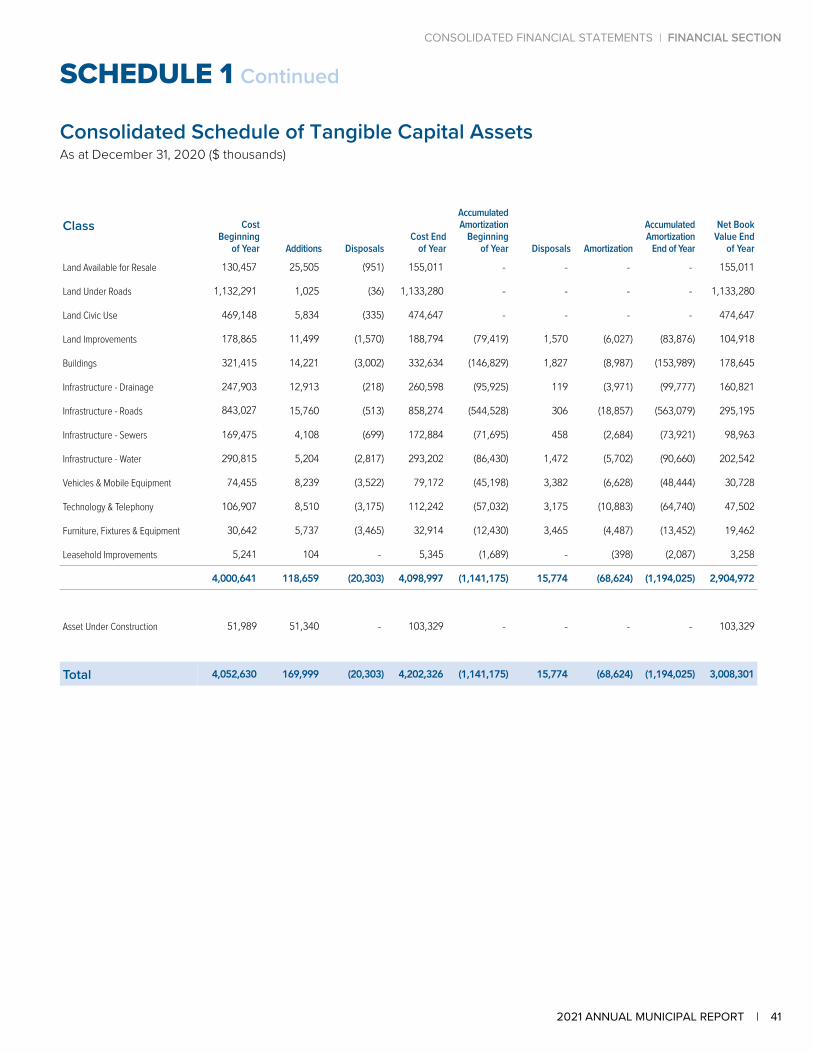
SCHEDULE 1 Continued
Consolidated Schedule of Tangible Capital AssetsAs at December 31, 2020 ($ thousands)
Class CostBeginning
of Year Additions DisposalsCost End
of Year
AccumulatedAmortization
Beginningof Year Disposals Amortization
AccumulatedAmortization
End of Year
Net BookValue End
of Year
Land Available for Resale 130,457 25,505 (951) 155,011 - - - - 155,011
Land Under Roads 1,132,291 1,025 (36) 1,133,280 - - - - 1,133,280
Land Civic Use 469,148 5,834 (335) 474,647 - - - - 474,647
Land Improvements 178,865 11,499 (1,570) 188,794 (79,419) 1,570 (6,027) (83,876) 104,918
Buildings 321,415 14,221 (3,002) 332,634 (146,829) 1,827 (8,987) (153,989) 178,645
Infrastructure - Drainage 247,903 12,913 (218) 260,598 (95,925) 119 (3,971) (99,777) 160,821
Infrastructure - Roads 843,027 15,760 (513) 858,274 (544,528) 306 (18,857) (563,079) 295,195
Infrastructure - Sewers 169,475 4,108 (699) 172,884 (71,695) 458 (2,684) (73,921) 98,963
Infrastructure - Water 290,815 5,204 (2,817) 293,202 (86,430) 1,472 (5,702) (90,660) 202,542
Vehicles & Mobile Equipment 74,455 8,239 (3,522) 79,172 (45,198) 3,382 (6,628) (48,444) 30,728
Technology & Telephony 106,907 8,510 (3,175) 112,242 (57,032) 3,175 (10,883) (64,740) 47,502
Furniture, Fixtures & Equipment 30,642 5,737 (3,465) 32,914 (12,430) 3,465 (4,487) (13,452) 19,462
Leasehold Improvements 5,241 104 - 5,345 (1,689) - (398) (2,087) 3,258
4,000,641 118,659 (20,303) 4,098,997 (1,141,175) 15,774 (68,624) (1,194,025) 2,904,972
Asset Under Construction 51,989 51,340 - 103,329 - - - - 103,329
Total 4,052,630 169,999 (20,303) 4,202,326 (1,141,175) 15,774 (68,624) (1,194,025) 3,008,301
CONSOLIDATED FINANCIAL STATEMENTS | FINANCIAL SECTION
412021 ANNUAL MUNICIPAL REPORT |
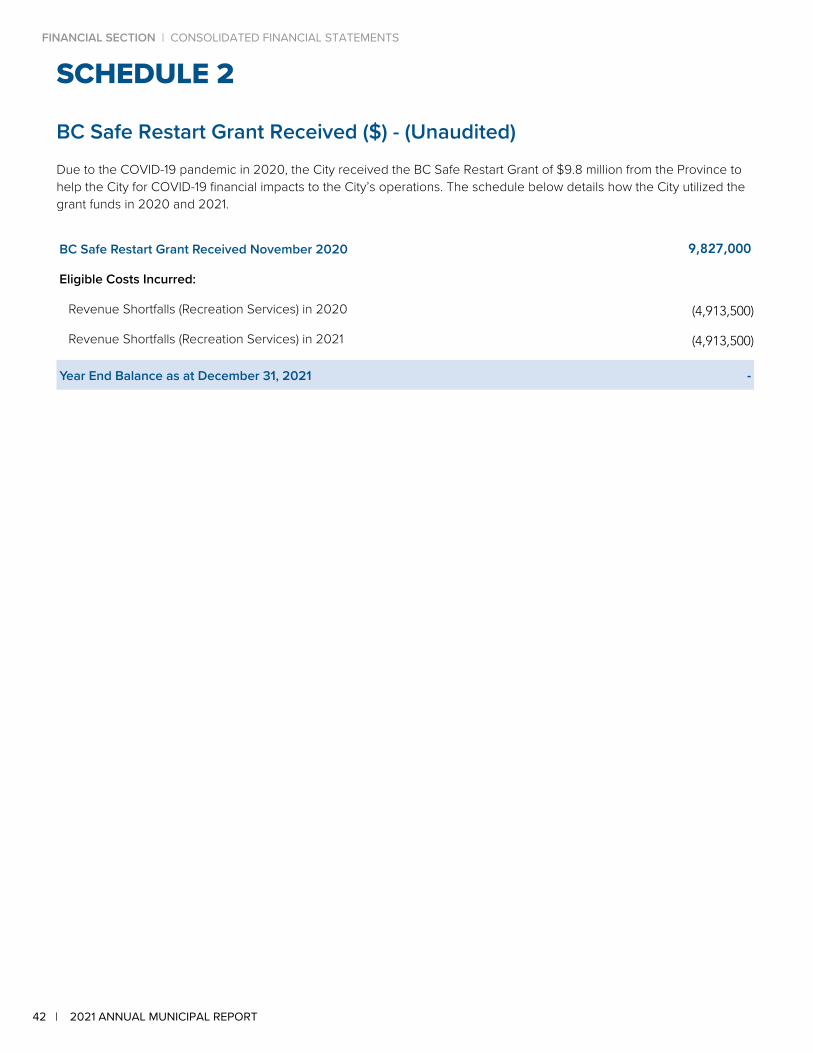
SCHEDULE 2
BC Safe Restart Grant Received ($) - (Unaudited)Due to the COVID-19 pandemic in 2020, the City received the BC Safe Restart Grant of $9.8 million from the Province to help the City for COVID-19 financial impacts to the City’s operations. The schedule below details how the City utilized the grant funds in 2020 and 2021.
BC Safe Restart Grant Received November 2020 9,827,000
Eligible Costs Incurred:
Revenue Shortfalls (Recreation Services) in 2020 (4,913,500)
Revenue Shortfalls (Recreation Services) in 2021 (4,913,500)
Year End Balance as at December 31, 2021 -
42 | 2021 ANNUAL MUNICIPAL REPORT
FINANCIAL SECTION | CONSOLIDATED FINANCIAL STATEMENTS

STATISTICALSECTIONMiscellaneous Statistics
Population
Business Distribution by Sector
Building Permits
Employment
TaxationAverage Residential Property Taxes/ Tax Bill
Top 10 Commercial Property Taxpayers
Tax Levy and Outstanding Balances
Assessed Values of Land & Total Improvements
Property Tax Collections & Grants in Lieu of Taxes
Taxes from New Growth
Taxes Paid to Other Authorities
Average Residential Assessment
Flat Rates - Water, Sewer Parcel, & Sewer Usage
Financial StatisticsExpenses by Function
Expenses by Object
Revenue by Source
Financial Highlights
City of Burnaby Annual Returns
432021 ANNUAL MUNICIPAL REPORT |
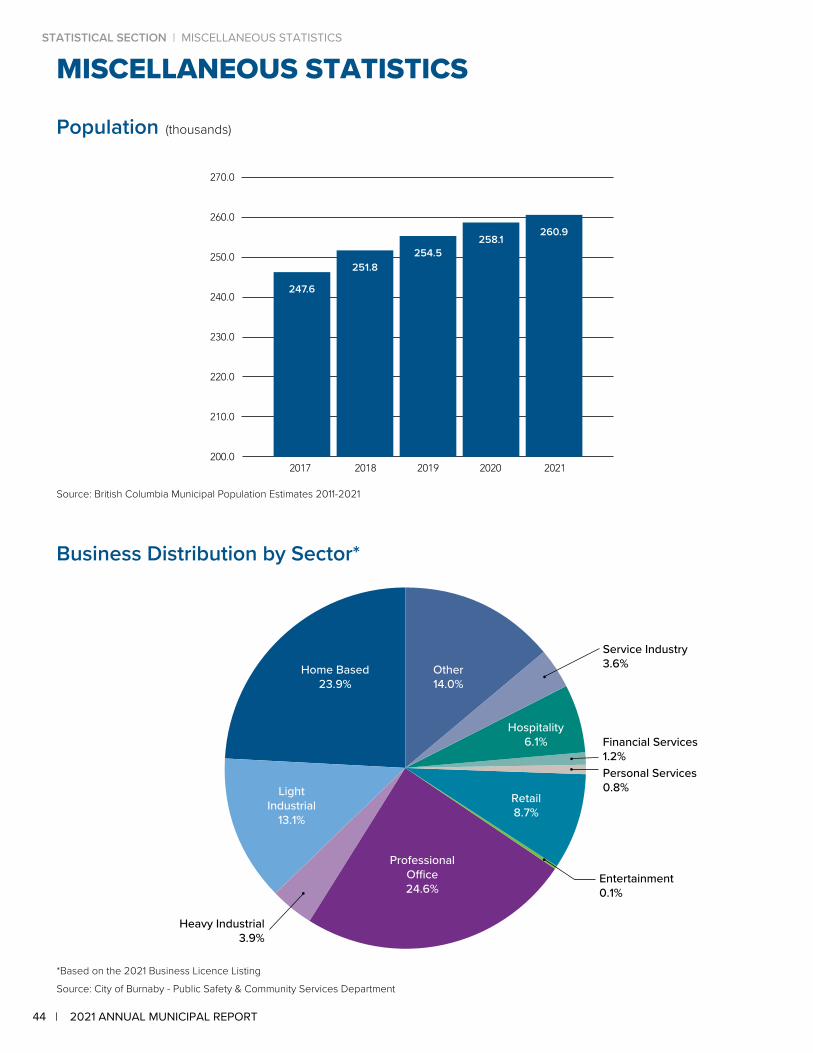
MISCELLANEOUS STATISTICS
Population (thousands)
270.0
260.0
250.0
240.0
230.0
220.0
210.0
200.0 2017 2018 2019 2020 2021
260.9258.1
254.5251.8
247.6
Source: British Columbia Municipal Population Estimates 2011-2021
Business Distribution by Sector*
Entertainment0.1%
Financial Services1.2%
Service Industry3.6%
*Based on the 2021 Business Licence Listing
Source: City of Burnaby - Public Safety & Community Services Department
Personal Services 0.8%
Professional Office24.6%
Other14.0%
Light Industrial
13.1%
Home Based23.9%
Retail8.7%
Hospitality6.1%
Heavy Industrial3.9%
44 | 2021 ANNUAL MUNICIPAL REPORT
STATISTICAL SECTION | MISCELLANEOUS STATISTICS
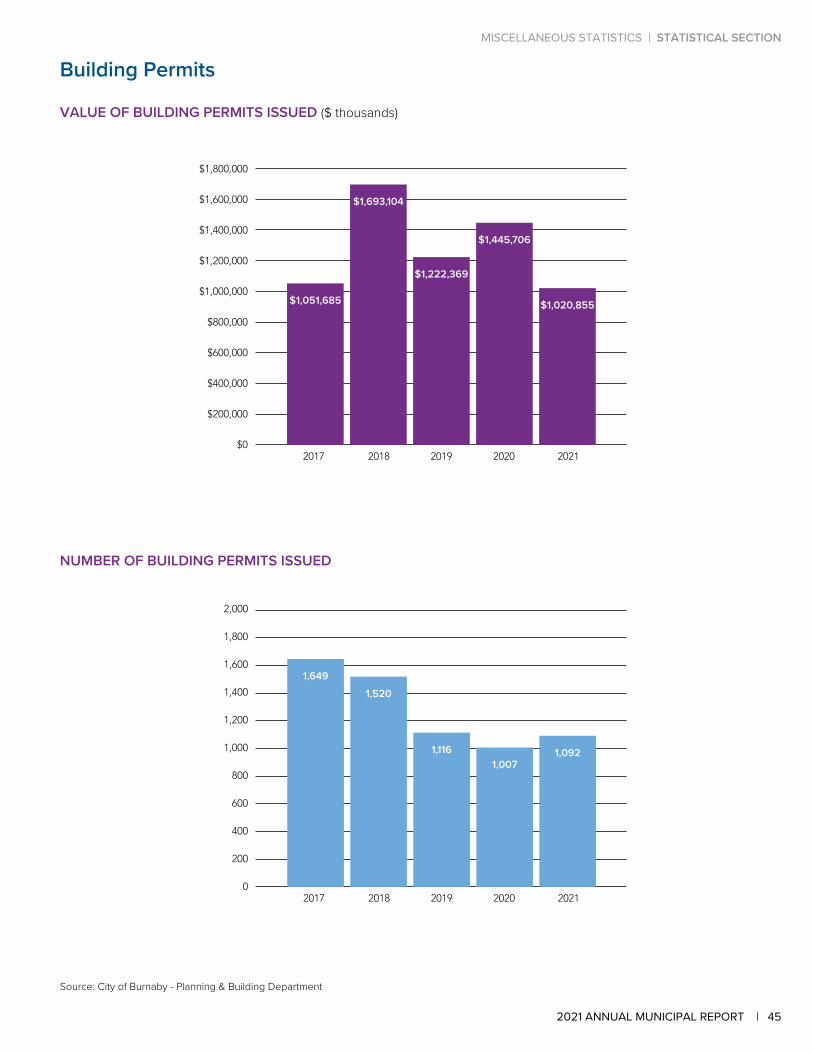
Building Permits
VALUE OF BUILDING PERMITS ISSUED ($ thousands)
$1,800,000
$1,600,000
$1,400,000
$1,200,000
$1,000,000
$800,000
$600,000
$400,000
$200,000
$0 2017 2018 2019 2020 2021
$1,020,855
$1,445,706
$1,222,369
$1,693,104
$1,051,685
NUMBER OF BUILDING PERMITS ISSUED
2,000
1,800
1,600
1,400
1,200
1,000
800
600
400
200
0 2017 2018 2019 2020 2021
1,0921,007
1,116
1,5201,649
Source: City of Burnaby - Planning & Building Department
MISCELLANEOUS STATISTICS | STATISTICAL SECTION
452021 ANNUAL MUNICIPAL REPORT |
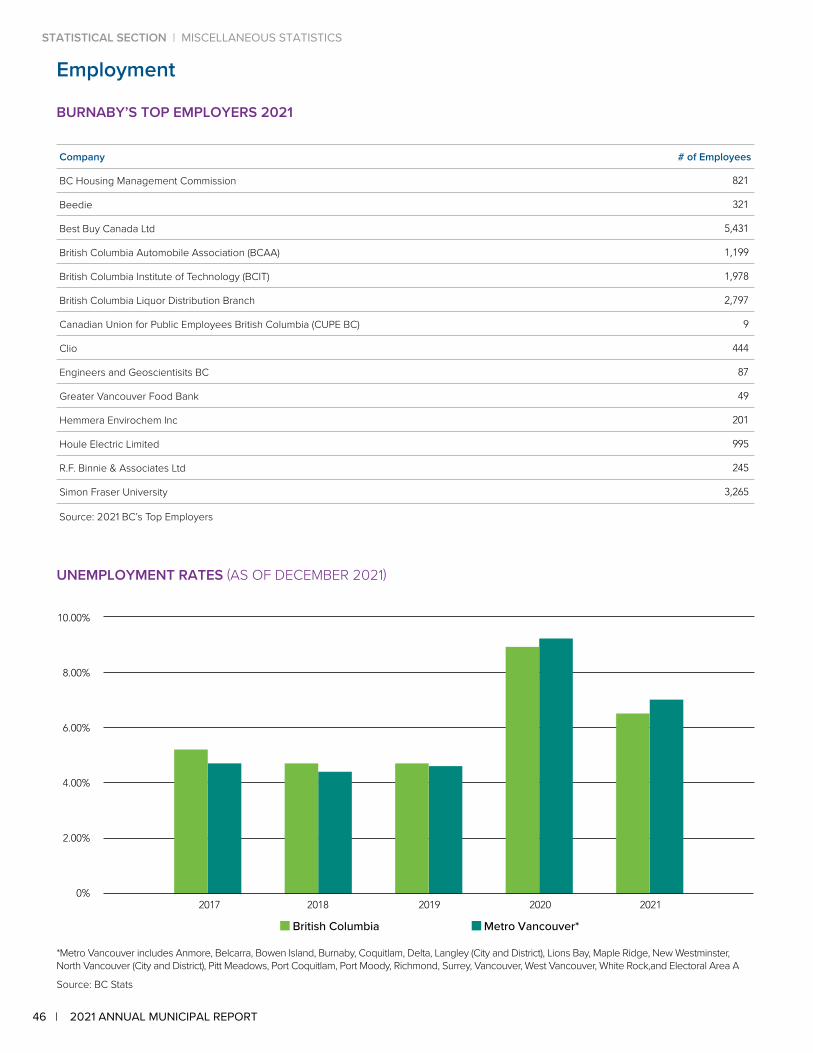
Employment
BURNABY’S TOP EMPLOYERS 2021
Company # of Employees
BC Housing Management Commission 821
Beedie 321
Best Buy Canada Ltd 5,431
British Columbia Automobile Association (BCAA) 1,199
British Columbia Institute of Technology (BCIT) 1,978
British Columbia Liquor Distribution Branch 2,797
Canadian Union for Public Employees British Columbia (CUPE BC) 9
Clio 444
Engineers and Geoscientisits BC 87
Greater Vancouver Food Bank 49
Hemmera Envirochem Inc 201
Houle Electric Limited 995
R.F. Binnie & Associates Ltd 245
Simon Fraser University 3,265
Source: 2021 BC’s Top Employers
UNEMPLOYMENT RATES (AS OF DECEMBER 2021)
10.00%
8.00%
6.00%
4.00%
2.00%
0% 2017 2018 2019 2020 2021
British Columbia Metro Vancouver*
*Metro Vancouver includes Anmore, Belcarra, Bowen Island, Burnaby, Coquitlam, Delta, Langley (City and District), Lions Bay, Maple Ridge, New Westminster, North Vancouver (City and District), Pitt Meadows, Port Coquitlam, Port Moody, Richmond, Surrey, Vancouver, West Vancouver, White Rock,and Electoral Area A
Source: BC Stats
46 | 2021 ANNUAL MUNICIPAL REPORT
STATISTICAL SECTION | MISCELLANEOUS STATISTICS
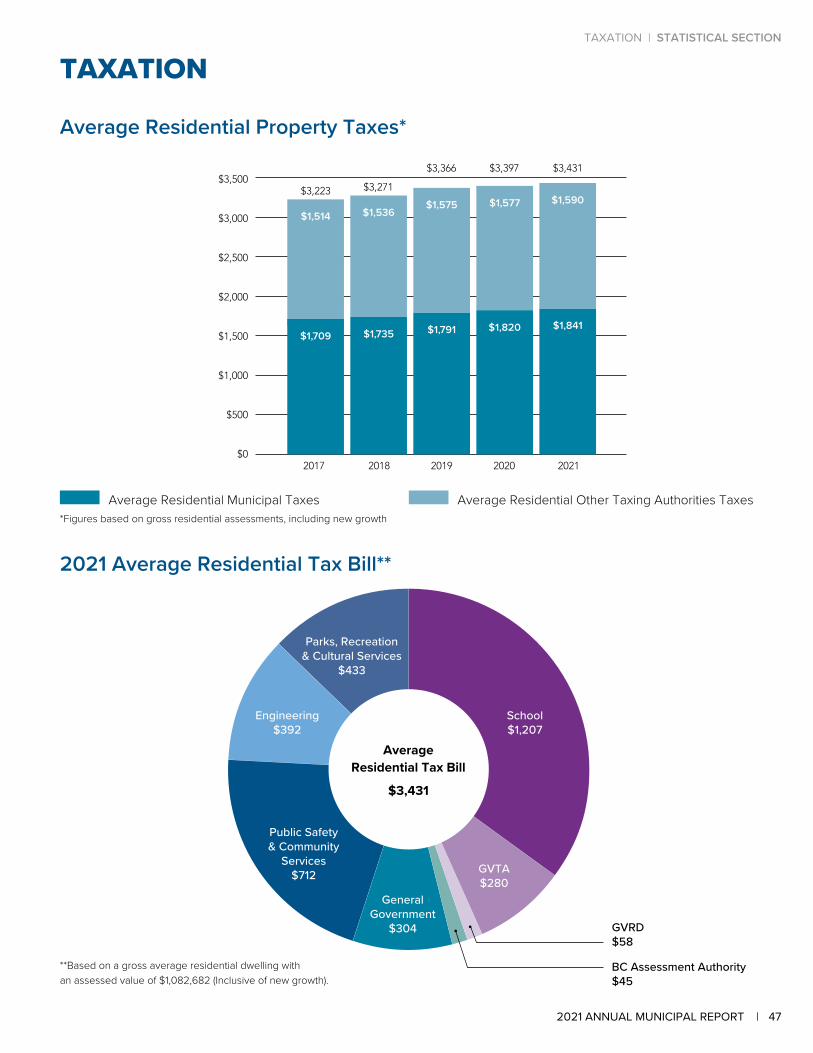
TAXATION
Average Residential Property Taxes*
$3,500
$3,000
$2,500
$2,000
$1,500
$1,000
$500
$0 2017 2018 2019 2020 2021
$1,841
$1,514 $1,536$1,575
$3,223 $3,271
$3,366
$1,577
$3,397
$1,590
$3,431
$1,709 $1,735 $1,791 $1,820
Average Residential Municipal Taxes Average Residential Other Taxing Authorities Taxes*Figures based on gross residential assessments, including new growth
2021 Average Residential Tax Bill**
Average Residential Tax Bill
$3,431
**Based on a gross average residential dwelling with an assessed value of $1,082,682 (Inclusive of new growth).
GVRD$58
BC Assessment Authority$45
School$1,207
Public Safety & Community
Services$712 GVTA
$280General
Government$304
Engineering$392
Parks, Recreation & Cultural Services
$433
TAXATION | STATISTICAL SECTION
472021 ANNUAL MUNICIPAL REPORT |
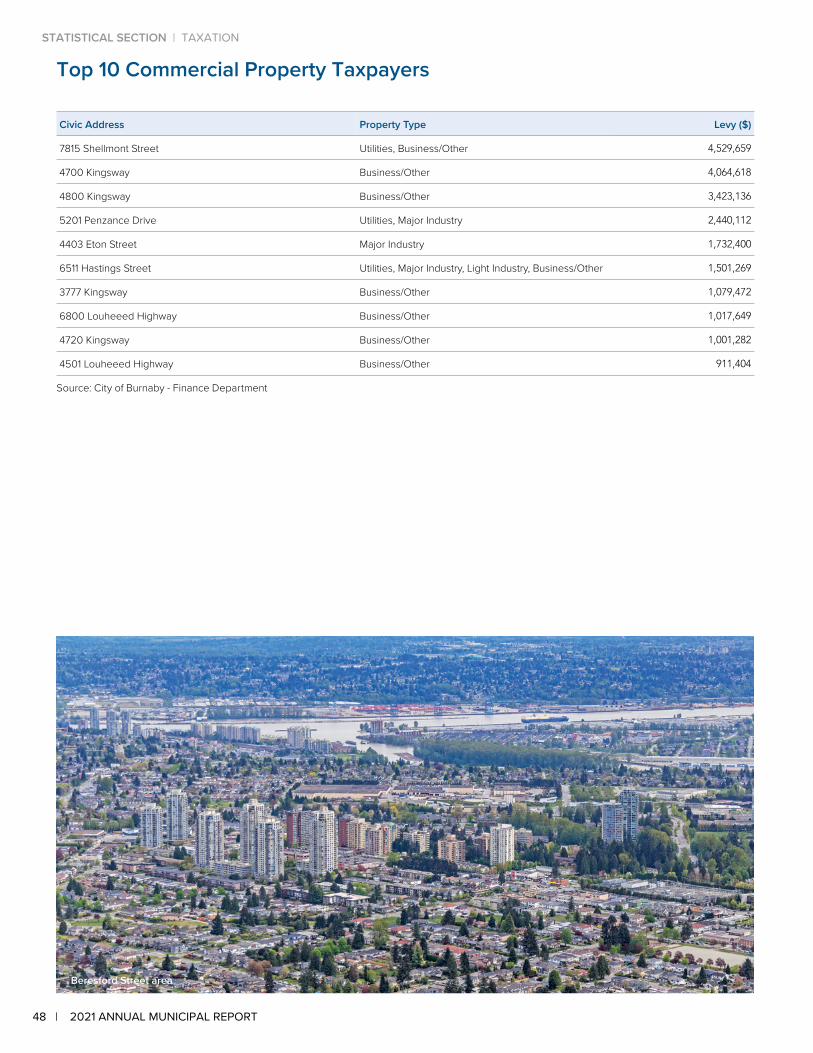
Beresford Street area
Top 10 Commercial Property Taxpayers
Civic Address Property Type Levy ($)
7815 Shellmont Street Utilities, Business/Other 4,529,659
4700 Kingsway Business/Other 4,064,618
4800 Kingsway Business/Other 3,423,136
5201 Penzance Drive Utilities, Major Industry 2,440,112
4403 Eton Street Major Industry 1,732,400
6511 Hastings Street Utilities, Major Industry, Light Industry, Business/Other 1,501,269
3777 Kingsway Business/Other 1,079,472
6800 Louheeed Highway Business/Other 1,017,649
4720 Kingsway Business/Other 1,001,282
4501 Louheeed Highway Business/Other 911,404
Source: City of Burnaby - Finance Department
48 | 2021 ANNUAL MUNICIPAL REPORT
STATISTICAL SECTION | TAXATION
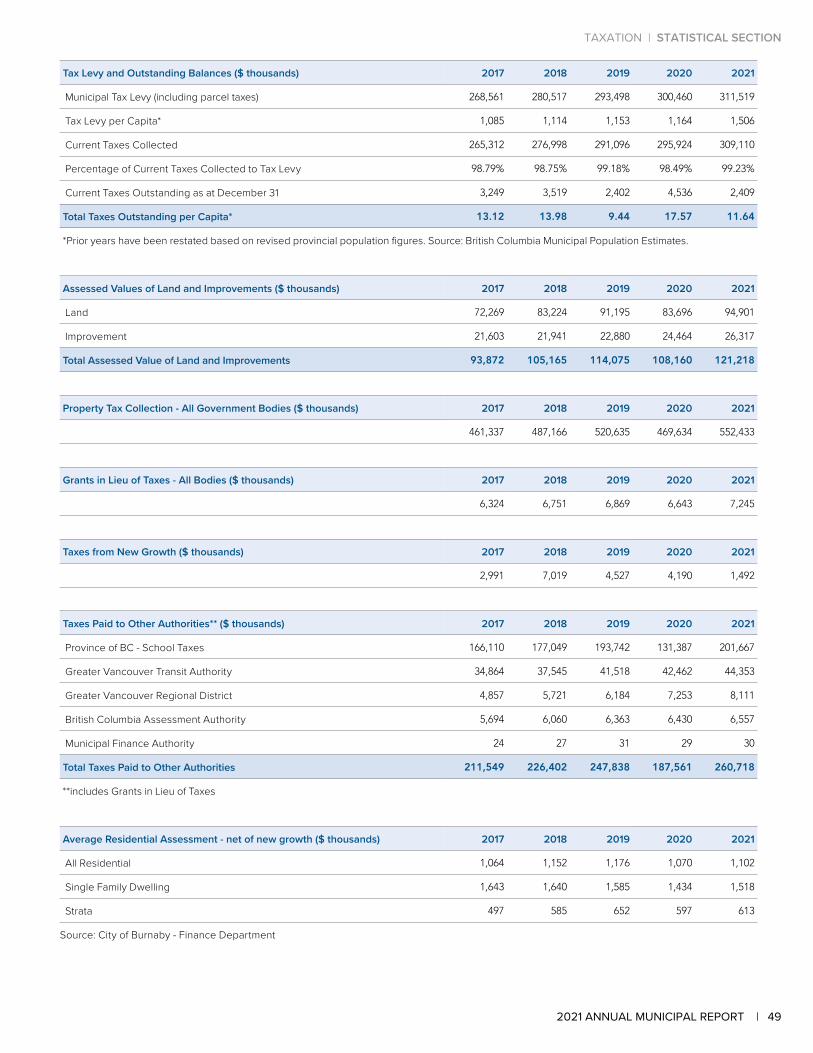
Tax Levy and Outstanding Balances ($ thousands) 2017 2018 2019 2020 2021
Municipal Tax Levy (including parcel taxes) 268,561 280,517 293,498 300,460 311,519
Tax Levy per Capita* 1,085 1,114 1,153 1,164 1,506
Current Taxes Collected 265,312 276,998 291,096 295,924 309,110
Percentage of Current Taxes Collected to Tax Levy 98.79% 98.75% 99.18% 98.49% 99.23%
Current Taxes Outstanding as at December 31 3,249 3,519 2,402 4,536 2,409
Total Taxes Outstanding per Capita* 13.12 13.98 9.44 17.57 11.64
*Prior years have been restated based on revised provincial population figures. Source: British Columbia Municipal Population Estimates.
Assessed Values of Land and Improvements ($ thousands) 2017 2018 2019 2020 2021
Land 72,269 83,224 91,195 83,696 94,901
Improvement 21,603 21,941 22,880 24,464 26,317
Total Assessed Value of Land and Improvements 93,872 105,165 114,075 108,160 121,218
Property Tax Collection - All Government Bodies ($ thousands) 2017 2018 2019 2020 2021
461,337 487,166 520,635 469,634 552,433
Grants in Lieu of Taxes - All Bodies ($ thousands) 2017 2018 2019 2020 2021
6,324 6,751 6,869 6,643 7,245
Taxes from New Growth ($ thousands) 2017 2018 2019 2020 2021
2,991 7,019 4,527 4,190 1,492
Taxes Paid to Other Authorities** ($ thousands) 2017 2018 2019 2020 2021
Province of BC - School Taxes 166,110 177,049 193,742 131,387 201,667
Greater Vancouver Transit Authority 34,864 37,545 41,518 42,462 44,353
Greater Vancouver Regional District 4,857 5,721 6,184 7,253 8,111
British Columbia Assessment Authority 5,694 6,060 6,363 6,430 6,557
Municipal Finance Authority 24 27 31 29 30
Total Taxes Paid to Other Authorities 211,549 226,402 247,838 187,561 260,718
**includes Grants in Lieu of Taxes
Average Residential Assessment - net of new growth ($ thousands) 2017 2018 2019 2020 2021
All Residential 1,064 1,152 1,176 1,070 1,102
Single Family Dwelling 1,643 1,640 1,585 1,434 1,518
Strata 497 585 652 597 613
Source: City of Burnaby - Finance Department
TAXATION | STATISTICAL SECTION
492021 ANNUAL MUNICIPAL REPORT |
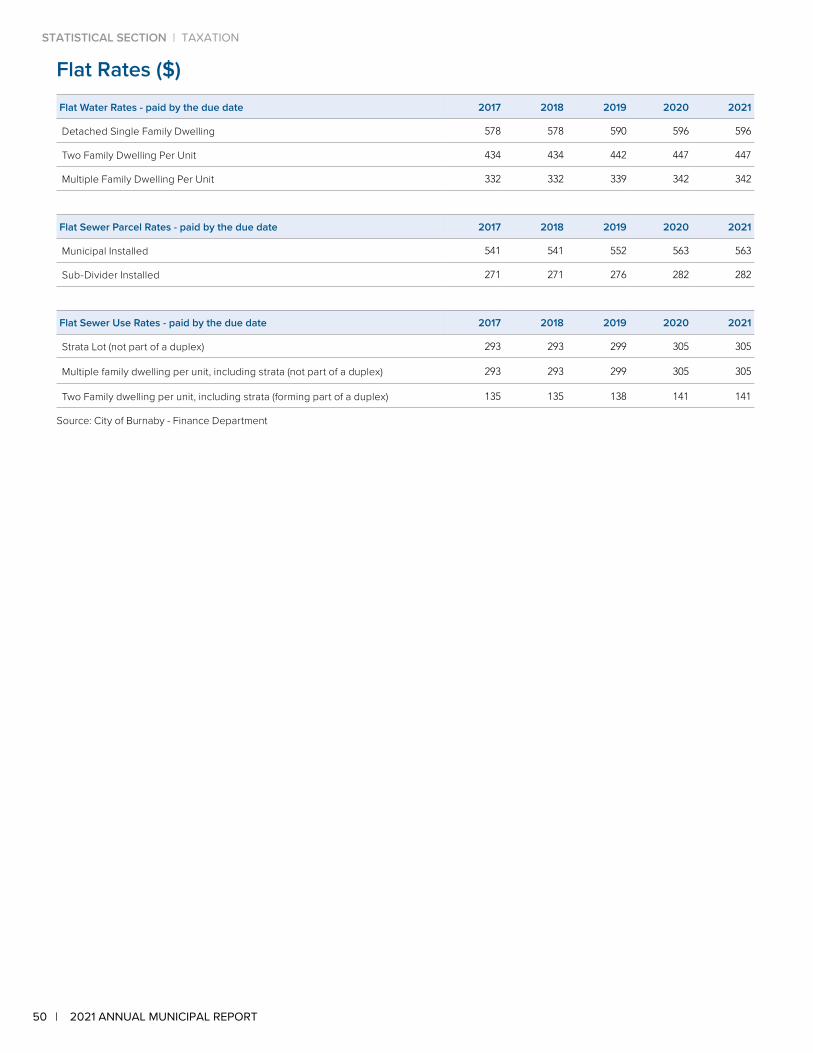
Flat Rates ($)Flat Water Rates - paid by the due date 2017 2018 2019 2020 2021
Detached Single Family Dwelling 578 578 590 596 596
Two Family Dwelling Per Unit 434 434 442 447 447
Multiple Family Dwelling Per Unit 332 332 339 342 342
Flat Sewer Parcel Rates - paid by the due date 2017 2018 2019 2020 2021
Municipal Installed 541 541 552 563 563
Sub-Divider Installed 271 271 276 282 282
Flat Sewer Use Rates - paid by the due date 2017 2018 2019 2020 2021
Strata Lot (not part of a duplex) 293 293 299 305 305
Multiple family dwelling per unit, including strata (not part of a duplex) 293 293 299 305 305
Two Family dwelling per unit, including strata (forming part of a duplex) 135 135 138 141 141
Source: City of Burnaby - Finance Department
50 | 2021 ANNUAL MUNICIPAL REPORT
STATISTICAL SECTION | TAXATION
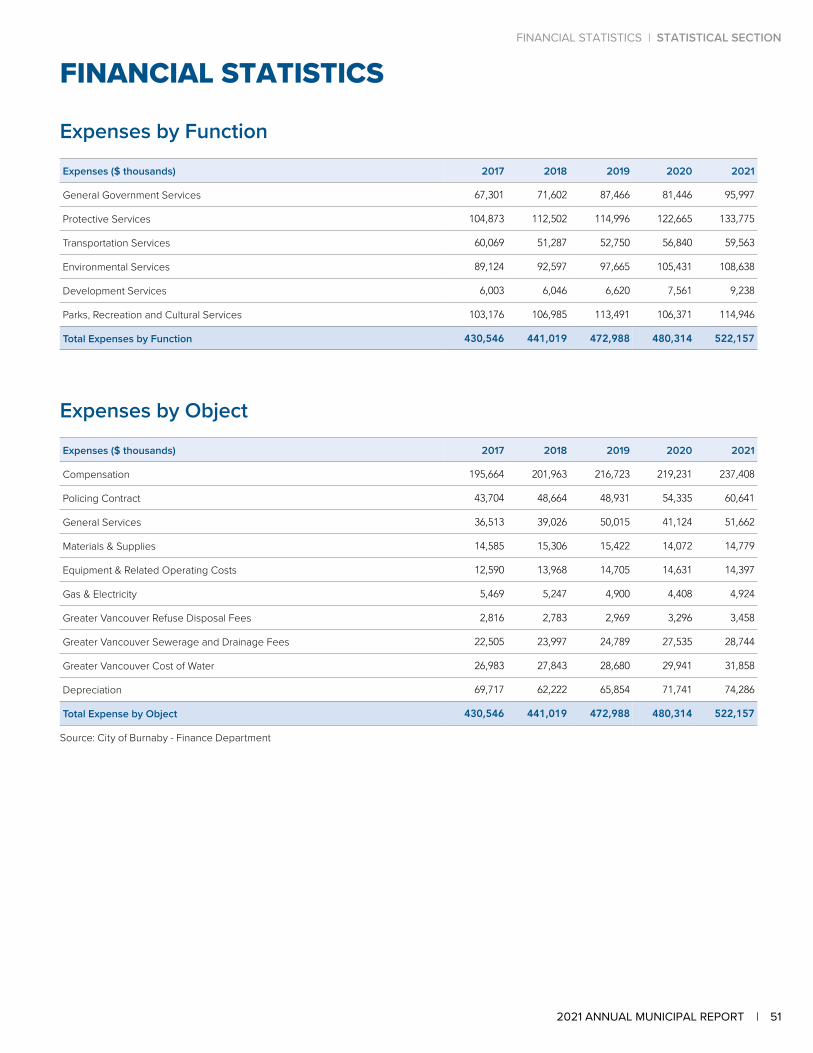
FINANCIAL STATISTICS
Expenses by Function
Expenses ($ thousands) 2017 2018 2019 2020 2021
General Government Services 67,301 71,602 87,466 81,446 95,997
Protective Services 104,873 112,502 114,996 122,665 133,775
Transportation Services 60,069 51,287 52,750 56,840 59,563
Environmental Services 89,124 92,597 97,665 105,431 108,638
Development Services 6,003 6,046 6,620 7,561 9,238
Parks, Recreation and Cultural Services 103,176 106,985 113,491 106,371 114,946
Total Expenses by Function 430,546 441,019 472,988 480,314 522,157
Expenses by Object
Expenses ($ thousands) 2017 2018 2019 2020 2021
Compensation 195,664 201,963 216,723 219,231 237,408
Policing Contract 43,704 48,664 48,931 54,335 60,641
General Services 36,513 39,026 50,015 41,124 51,662
Materials & Supplies 14,585 15,306 15,422 14,072 14,779
Equipment & Related Operating Costs 12,590 13,968 14,705 14,631 14,397
Gas & Electricity 5,469 5,247 4,900 4,408 4,924
Greater Vancouver Refuse Disposal Fees 2,816 2,783 2,969 3,296 3,458
Greater Vancouver Sewerage and Drainage Fees 22,505 23,997 24,789 27,535 28,744
Greater Vancouver Cost of Water 26,983 27,843 28,680 29,941 31,858
Depreciation 69,717 62,222 65,854 71,741 74,286
Total Expense by Object 430,546 441,019 472,988 480,314 522,157
Source: City of Burnaby - Finance Department
FINANCIAL STATISTICS | STATISTICAL SECTION
512021 ANNUAL MUNICIPAL REPORT |

Revenue by Source
Revenue ($ thousands) 2017 2018 2019 2020 2021
Taxation Revenue 277,180 289,222 301,884 304,640 319,637
Sales of Goods and Services 117,588 121,356 122,499 107,363 116,849
Investment Income 42,135 50,344 56,666 51,984 42,264
Other Revenue 77,297 77,467 57,475 90,553 86,346
Community Benefit Bonus 135,804 220,839 - 17,619 341,661
Contributed Asset Revenue 13,841 24,160 16,592 9,446 21,696
Transfer from Other Governments 21,567 24,824 30,766 28,053 21,644
Transfer from Restricted Funds and Development Cost Charges 2,536 - 40 9,698 4,418
Total Revenue by Source 687,948 808,212 585,922 619,356 954,515
Financial Highlights
($ thousands) 2017 2018 2019 2020 2021
Annual Surplus 257,402 367,193 112,934 139,042 432,358
Accumulated Surplus 4,047,407 4,414,601 4,527,535 4,666,577 5,098,935
Acquisition of Tangible Capital Assets 112,102 103,559 115,941 159,633 218,019
Net Book Value of Tangible Capital Assets 2,777,216 2,844,926 2,911,455 3,008,301 3,176,035
Net Financial Assets 1,265,732 1,564,608 1,610,701 1,652,459 1,917,089
City of Burnaby Annual Returns
City of Burnaby Annual Returns (%) 2017 2018 2019 2020 2021
30-Year Canada's Bond Average 2.28% 2.36% 1.80% 1.21% 1.85%
10-Year Canada's Bond Average 1.78% 2.28% 1.59% 0.75% 1.36%
Prime Rate Average 2.90% 3.60% 3.95% 2.77% 2.25%
City of Burnaby Annual Return 3.22% 3.16% 3.16% 2.82% 2.22%
Source: City of Burnaby - Finance Department
52 | 2021 ANNUAL MUNICIPAL REPORT
STATISTICAL SECTION | FINANCIAL STATISTICS
PermissiveExemptions
532021 ANNUAL MUNICIPAL REPORT |
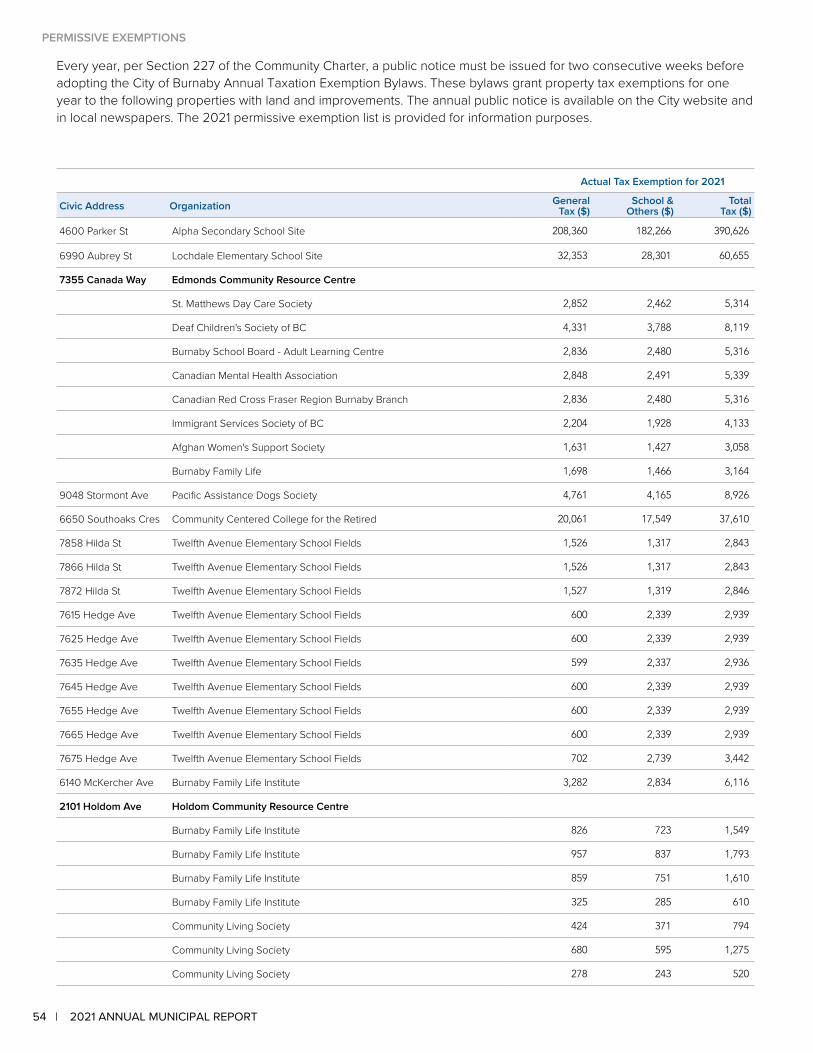
Every year, per Section 227 of the Community Charter, a public notice must be issued for two consecutive weeks before adopting the City of Burnaby Annual Taxation Exemption Bylaws. These bylaws grant property tax exemptions for one year to the following properties with land and improvements. The annual public notice is available on the City website and in local newspapers. The 2021 permissive exemption list is provided for information purposes.
Actual Tax Exemption for 2021
Civic Address Organization General Tax ($)
School & Others ($)
Total Tax ($)
4600 Parker St Alpha Secondary School Site 208,360 182,266 390,626
6990 Aubrey St Lochdale Elementary School Site 32,353 28,301 60,655
7355 Canada Way Edmonds Community Resource Centre
St. Matthews Day Care Society 2,852 2,462 5,314
Deaf Children's Society of BC 4,331 3,788 8,119
Burnaby School Board - Adult Learning Centre 2,836 2,480 5,316
Canadian Mental Health Association 2,848 2,491 5,339
Canadian Red Cross Fraser Region Burnaby Branch 2,836 2,480 5,316
Immigrant Services Society of BC 2,204 1,928 4,133
Afghan Women's Support Society 1,631 1,427 3,058
Burnaby Family Life 1,698 1,466 3,164
9048 Stormont Ave Pacific Assistance Dogs Society 4,761 4,165 8,926
6650 Southoaks Cres Community Centered College for the Retired 20,061 17,549 37,610
7858 Hilda St Twelfth Avenue Elementary School Fields 1,526 1,317 2,843
7866 Hilda St Twelfth Avenue Elementary School Fields 1,526 1,317 2,843
7872 Hilda St Twelfth Avenue Elementary School Fields 1,527 1,319 2,846
7615 Hedge Ave Twelfth Avenue Elementary School Fields 600 2,339 2,939
7625 Hedge Ave Twelfth Avenue Elementary School Fields 600 2,339 2,939
7635 Hedge Ave Twelfth Avenue Elementary School Fields 599 2,337 2,936
7645 Hedge Ave Twelfth Avenue Elementary School Fields 600 2,339 2,939
7655 Hedge Ave Twelfth Avenue Elementary School Fields 600 2,339 2,939
7665 Hedge Ave Twelfth Avenue Elementary School Fields 600 2,339 2,939
7675 Hedge Ave Twelfth Avenue Elementary School Fields 702 2,739 3,442
6140 McKercher Ave Burnaby Family Life Institute 3,282 2,834 6,116
2101 Holdom Ave Holdom Community Resource Centre
Burnaby Family Life Institute 826 723 1,549
Burnaby Family Life Institute 957 837 1,793
Burnaby Family Life Institute 859 751 1,610
Burnaby Family Life Institute 325 285 610
Community Living Society 424 371 794
Community Living Society 680 595 1,275
Community Living Society 278 243 520
54 | 2021 ANNUAL MUNICIPAL REPORT
PERMISSIVE EXEMPTIONS

Actual Tax Exemption for 2021
Civic Address Organization General Tax ($)
School & Others ($)
Total Tax ($)
Community Living Society 1,027 898 1,926
Community Living Society 576 504 1,080
Burnaby Volunteer Centre Society 1,028 899 1,928
Burnaby Volunteer Centre Society 1,165 1,019 2,185
Dixon Transition Society 1,165 1,019 2,185
Dixon Transition Society 1,037 907 1,945
Dixon Transition Society 1,021 893 1,914
2055 Rosser Ave Brentwood Community Resource Centre
Burnaby Community Services Society 3,816 3,338 7,154
Meals on Wheels 1,439 1,259 2,697
MOSAIC Immigrant Services 3,901 3,413 7,314
Burnaby Seniors Outreach Services Society 1,374 1,202 2,576
4460 Beresford St Metrotown Community Resource Centre
South Burnaby Neighbourhood House 28,839 25,227 54,066
BC Centre for Ability 4,032 3,527 7,559
YMCA Childcare Resource & Referral Program 2,434 2,129 4,563
National Congress of Black Women Foundation 1,591 1,392 2,983
4535 Kingsway Pioneer Community Resource Centre
Burnaby Hospice Society 6,216 5,437 11,653
Burnaby Family Life 11,545 10,099 21,643
8059 Texaco Dr The Lotus Sailing Club 4,977 4,353 9,330
7564 Barnet Rd BC Volleyball Association 102,772 89,901 192,673
4990 Canada Way Burnaby Winter Club 30,215 26,431 56,646
9080 Avalon Ave Burnaby Horsemen's Association 8,392 30,136 38,528
3890 Kensington Ave Burnaby Tennis Club 576 1,430 2,006
3883 Triumph St Burnaby Pacific Grace Church 2,640 10,298 12,939
3885 Albert St Grace New Covenant Pentecostal Church 512 1,997 2,509
4304 Parker St Willingdon Heights United Church 1,770 6,903 8,672
4550 Kitchener St Parish of Saint Timothy Anglican 4,049 15,793 19,842
3905 Norland Ave Vancouver Korean Full Gospel Church 11,670 45,519 57,189
7837 Canada Way Serbian Orthodox Church & Cultural Centre 1,208 4,713 5,921
9887 Cameron St St. Stephen the Martyr Anglican Church 803 3,130 3,933
5975 Sunset St Capitol Hill Congregation of Jehovah’s Witnesses 3,620 14,119 17,739
9387 Holmes St St. Michael’s Catholic Church & School 5,475 21,355 26,829
6907 Elwell St South Burnaby Gospel Hall Society 2,552 9,955 12,507
5060 Marine Dr Iglesia Ni Cristo Church of Christ 2,102 8,198 10,300
5420 Marine Dr Hindu Cultural Society & Community Centre of BC 4,180 16,304 20,484
PERMISSIVE EXEMPTIONS
552021 ANNUAL MUNICIPAL REPORT |
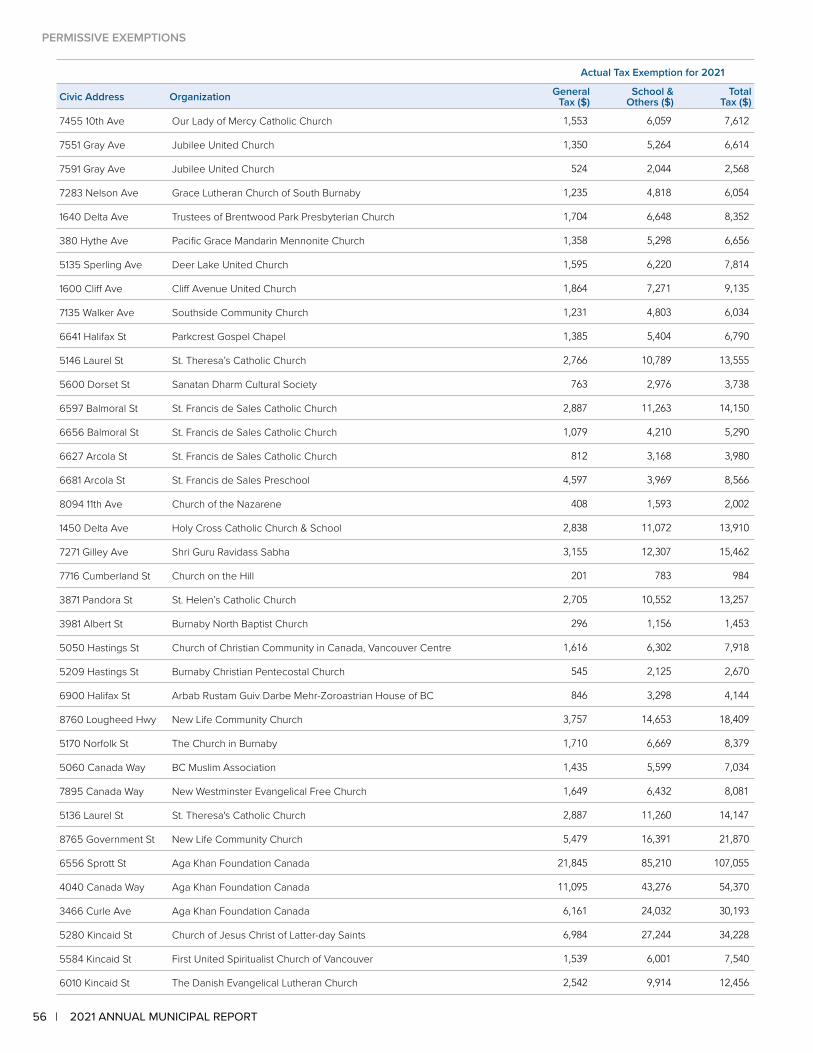
Actual Tax Exemption for 2021
Civic Address Organization General Tax ($)
School & Others ($)
Total Tax ($)
7455 10th Ave Our Lady of Mercy Catholic Church 1,553 6,059 7,612
7551 Gray Ave Jubilee United Church 1,350 5,264 6,614
7591 Gray Ave Jubilee United Church 524 2,044 2,568
7283 Nelson Ave Grace Lutheran Church of South Burnaby 1,235 4,818 6,054
1640 Delta Ave Trustees of Brentwood Park Presbyterian Church 1,704 6,648 8,352
380 Hythe Ave Pacific Grace Mandarin Mennonite Church 1,358 5,298 6,656
5135 Sperling Ave Deer Lake United Church 1,595 6,220 7,814
1600 Cliff Ave Cliff Avenue United Church 1,864 7,271 9,135
7135 Walker Ave Southside Community Church 1,231 4,803 6,034
6641 Halifax St Parkcrest Gospel Chapel 1,385 5,404 6,790
5146 Laurel St St. Theresa’s Catholic Church 2,766 10,789 13,555
5600 Dorset St Sanatan Dharm Cultural Society 763 2,976 3,738
6597 Balmoral St St. Francis de Sales Catholic Church 2,887 11,263 14,150
6656 Balmoral St St. Francis de Sales Catholic Church 1,079 4,210 5,290
6627 Arcola St St. Francis de Sales Catholic Church 812 3,168 3,980
6681 Arcola St St. Francis de Sales Preschool 4,597 3,969 8,566
8094 11th Ave Church of the Nazarene 408 1,593 2,002
1450 Delta Ave Holy Cross Catholic Church & School 2,838 11,072 13,910
7271 Gilley Ave Shri Guru Ravidass Sabha 3,155 12,307 15,462
7716 Cumberland St Church on the Hill 201 783 984
3871 Pandora St St. Helen’s Catholic Church 2,705 10,552 13,257
3981 Albert St Burnaby North Baptist Church 296 1,156 1,453
5050 Hastings St Church of Christian Community in Canada, Vancouver Centre 1,616 6,302 7,918
5209 Hastings St Burnaby Christian Pentecostal Church 545 2,125 2,670
6900 Halifax St Arbab Rustam Guiv Darbe Mehr-Zoroastrian House of BC 846 3,298 4,144
8760 Lougheed Hwy New Life Community Church 3,757 14,653 18,409
5170 Norfolk St The Church in Burnaby 1,710 6,669 8,379
5060 Canada Way BC Muslim Association 1,435 5,599 7,034
7895 Canada Way New Westminster Evangelical Free Church 1,649 6,432 8,081
5136 Laurel St St. Theresa's Catholic Church 2,887 11,260 14,147
8765 Government St New Life Community Church 5,479 16,391 21,870
6556 Sprott St Aga Khan Foundation Canada 21,845 85,210 107,055
4040 Canada Way Aga Khan Foundation Canada 11,095 43,276 54,370
3466 Curle Ave Aga Khan Foundation Canada 6,161 24,032 30,193
5280 Kincaid St Church of Jesus Christ of Latter-day Saints 6,984 27,244 34,228
5584 Kincaid St First United Spiritualist Church of Vancouver 1,539 6,001 7,540
6010 Kincaid St The Danish Evangelical Lutheran Church 2,542 9,914 12,456
56 | 2021 ANNUAL MUNICIPAL REPORT
PERMISSIVE EXEMPTIONS
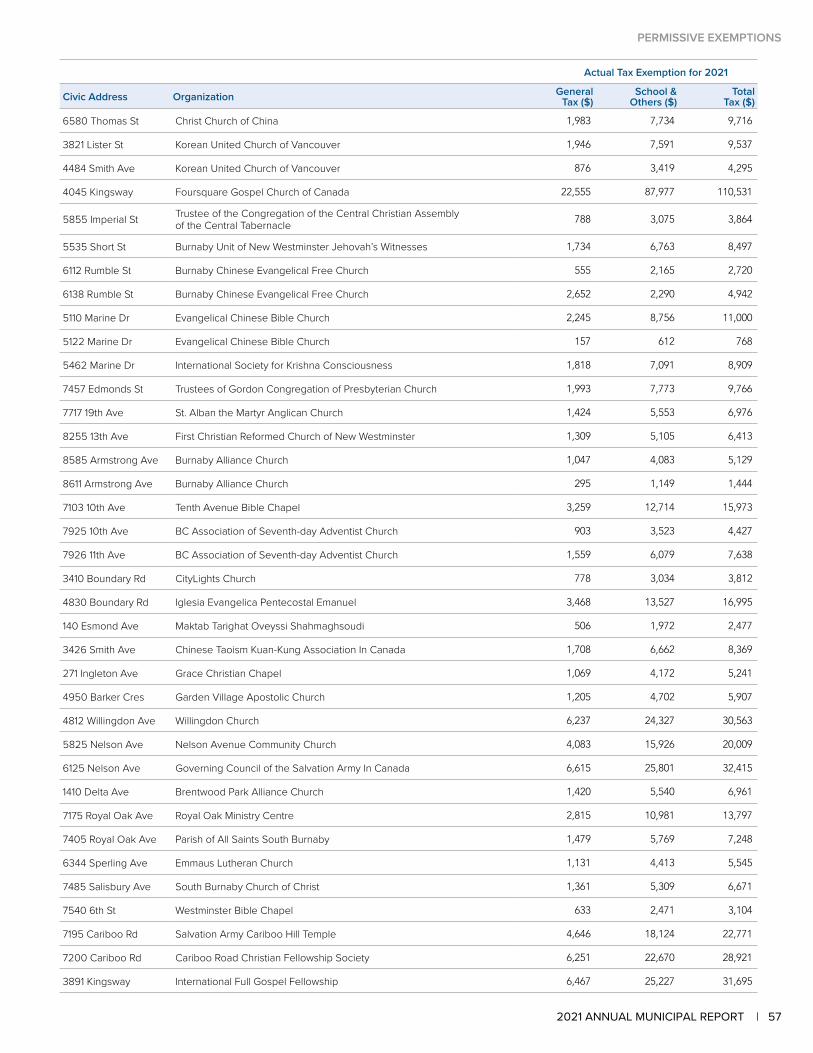
Actual Tax Exemption for 2021
Civic Address Organization General Tax ($)
School & Others ($)
Total Tax ($)
6580 Thomas St Christ Church of China 1,983 7,734 9,716
3821 Lister St Korean United Church of Vancouver 1,946 7,591 9,537
4484 Smith Ave Korean United Church of Vancouver 876 3,419 4,295
4045 Kingsway Foursquare Gospel Church of Canada 22,555 87,977 110,531
5855 Imperial St Trustee of the Congregation of the Central Christian Assembly of the Central Tabernacle 788 3,075 3,864
5535 Short St Burnaby Unit of New Westminster Jehovah’s Witnesses 1,734 6,763 8,497
6112 Rumble St Burnaby Chinese Evangelical Free Church 555 2,165 2,720
6138 Rumble St Burnaby Chinese Evangelical Free Church 2,652 2,290 4,942
5110 Marine Dr Evangelical Chinese Bible Church 2,245 8,756 11,000
5122 Marine Dr Evangelical Chinese Bible Church 157 612 768
5462 Marine Dr International Society for Krishna Consciousness 1,818 7,091 8,909
7457 Edmonds St Trustees of Gordon Congregation of Presbyterian Church 1,993 7,773 9,766
7717 19th Ave St. Alban the Martyr Anglican Church 1,424 5,553 6,976
8255 13th Ave First Christian Reformed Church of New Westminster 1,309 5,105 6,413
8585 Armstrong Ave Burnaby Alliance Church 1,047 4,083 5,129
8611 Armstrong Ave Burnaby Alliance Church 295 1,149 1,444
7103 10th Ave Tenth Avenue Bible Chapel 3,259 12,714 15,973
7925 10th Ave BC Association of Seventh-day Adventist Church 903 3,523 4,427
7926 11th Ave BC Association of Seventh-day Adventist Church 1,559 6,079 7,638
3410 Boundary Rd CityLights Church 778 3,034 3,812
4830 Boundary Rd Iglesia Evangelica Pentecostal Emanuel 3,468 13,527 16,995
140 Esmond Ave Maktab Tarighat Oveyssi Shahmaghsoudi 506 1,972 2,477
3426 Smith Ave Chinese Taoism Kuan-Kung Association In Canada 1,708 6,662 8,369
271 Ingleton Ave Grace Christian Chapel 1,069 4,172 5,241
4950 Barker Cres Garden Village Apostolic Church 1,205 4,702 5,907
4812 Willingdon Ave Willingdon Church 6,237 24,327 30,563
5825 Nelson Ave Nelson Avenue Community Church 4,083 15,926 20,009
6125 Nelson Ave Governing Council of the Salvation Army In Canada 6,615 25,801 32,415
1410 Delta Ave Brentwood Park Alliance Church 1,420 5,540 6,961
7175 Royal Oak Ave Royal Oak Ministry Centre 2,815 10,981 13,797
7405 Royal Oak Ave Parish of All Saints South Burnaby 1,479 5,769 7,248
6344 Sperling Ave Emmaus Lutheran Church 1,131 4,413 5,545
7485 Salisbury Ave South Burnaby Church of Christ 1,361 5,309 6,671
7540 6th St Westminster Bible Chapel 633 2,471 3,104
7195 Cariboo Rd Salvation Army Cariboo Hill Temple 4,646 18,124 22,771
7200 Cariboo Rd Cariboo Road Christian Fellowship Society 6,251 22,670 28,921
3891 Kingsway International Full Gospel Fellowship 6,467 25,227 31,695
PERMISSIVE EXEMPTIONS
572021 ANNUAL MUNICIPAL REPORT |
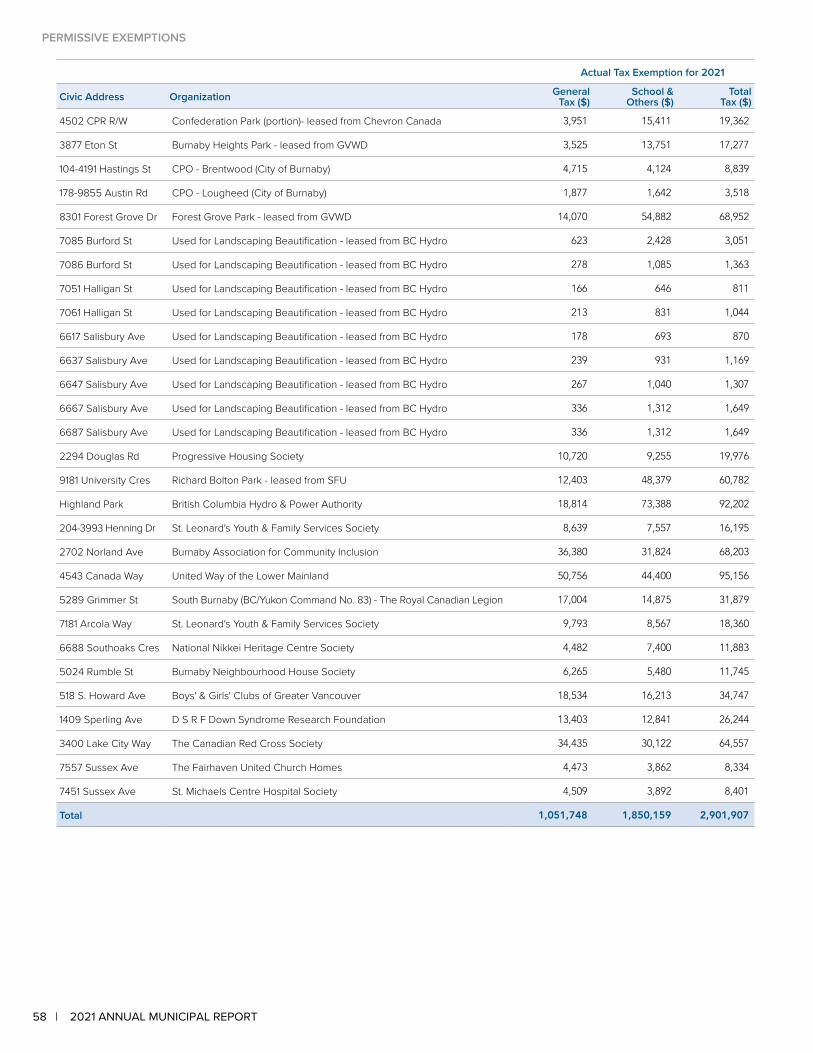
Actual Tax Exemption for 2021
Civic Address Organization General Tax ($)
School & Others ($)
Total Tax ($)
4502 CPR R/W Confederation Park (portion)- leased from Chevron Canada 3,951 15,411 19,362
3877 Eton St Burnaby Heights Park - leased from GVWD 3,525 13,751 17,277
104-4191 Hastings St CPO - Brentwood (City of Burnaby) 4,715 4,124 8,839
178-9855 Austin Rd CPO - Lougheed (City of Burnaby) 1,877 1,642 3,518
8301 Forest Grove Dr Forest Grove Park - leased from GVWD 14,070 54,882 68,952
7085 Burford St Used for Landscaping Beautification - leased from BC Hydro 623 2,428 3,051
7086 Burford St Used for Landscaping Beautification - leased from BC Hydro 278 1,085 1,363
7051 Halligan St Used for Landscaping Beautification - leased from BC Hydro 166 646 811
7061 Halligan St Used for Landscaping Beautification - leased from BC Hydro 213 831 1,044
6617 Salisbury Ave Used for Landscaping Beautification - leased from BC Hydro 178 693 870
6637 Salisbury Ave Used for Landscaping Beautification - leased from BC Hydro 239 931 1,169
6647 Salisbury Ave Used for Landscaping Beautification - leased from BC Hydro 267 1,040 1,307
6667 Salisbury Ave Used for Landscaping Beautification - leased from BC Hydro 336 1,312 1,649
6687 Salisbury Ave Used for Landscaping Beautification - leased from BC Hydro 336 1,312 1,649
2294 Douglas Rd Progressive Housing Society 10,720 9,255 19,976
9181 University Cres Richard Bolton Park - leased from SFU 12,403 48,379 60,782
Highland Park British Columbia Hydro & Power Authority 18,814 73,388 92,202
204-3993 Henning Dr St. Leonard's Youth & Family Services Society 8,639 7,557 16,195
2702 Norland Ave Burnaby Association for Community Inclusion 36,380 31,824 68,203
4543 Canada Way United Way of the Lower Mainland 50,756 44,400 95,156
5289 Grimmer St South Burnaby (BC/Yukon Command No. 83) - The Royal Canadian Legion 17,004 14,875 31,879
7181 Arcola Way St. Leonard's Youth & Family Services Society 9,793 8,567 18,360
6688 Southoaks Cres National Nikkei Heritage Centre Society 4,482 7,400 11,883
5024 Rumble St Burnaby Neighbourhood House Society 6,265 5,480 11,745
518 S. Howard Ave Boys' & Girls' Clubs of Greater Vancouver 18,534 16,213 34,747
1409 Sperling Ave D S R F Down Syndrome Research Foundation 13,403 12,841 26,244
3400 Lake City Way The Canadian Red Cross Society 34,435 30,122 64,557
7557 Sussex Ave The Fairhaven United Church Homes 4,473 3,862 8,334
7451 Sussex Ave St. Michaels Centre Hospital Society 4,509 3,892 8,401
Total 1,051,748 1,850,159 2,901,907
58 | 2021 ANNUAL MUNICIPAL REPORT
PERMISSIVE EXEMPTIONS
Appendix AIntegrated Planning Framework & Service Highlights
592021 ANNUAL MUNICIPAL REPORT |
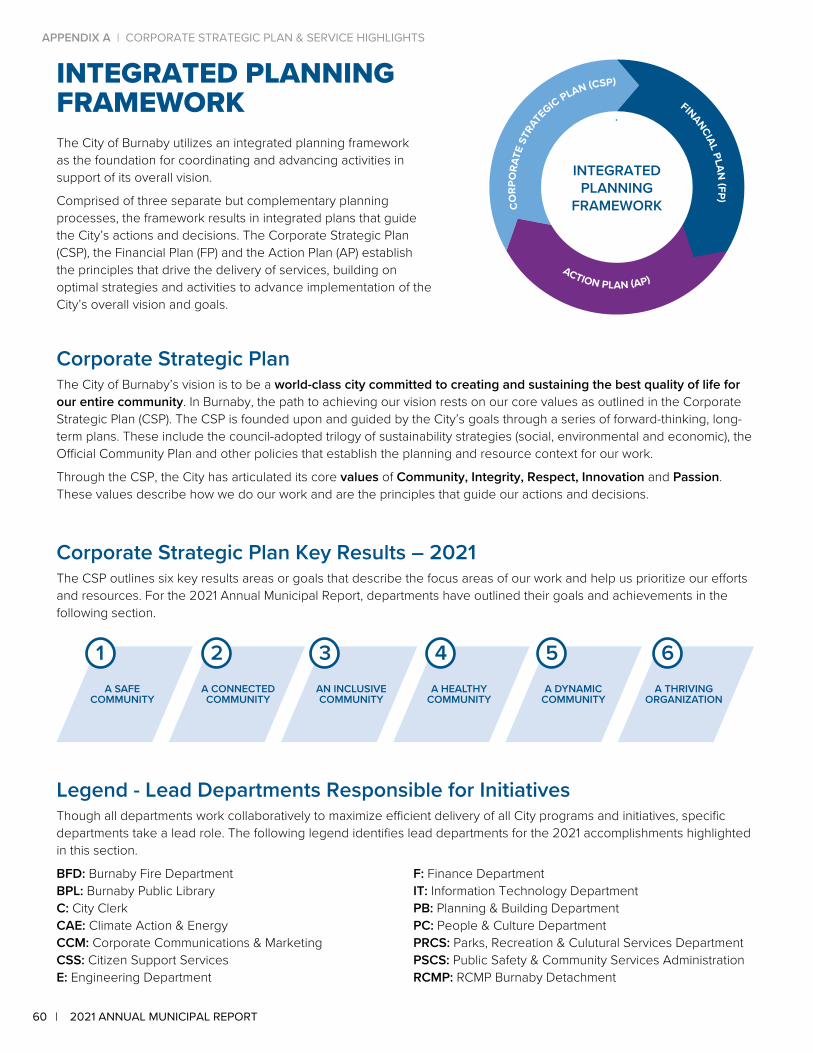
Corporate Strategic PlanThe City of Burnaby’s vision is to be a world-class city committed to creating and sustaining the best quality of life for our entire community. In Burnaby, the path to achieving our vision rests on our core values as outlined in the Corporate Strategic Plan (CSP). The CSP is founded upon and guided by the City’s goals through a series of forward-thinking, long-term plans. These include the council-adopted trilogy of sustainability strategies (social, environmental and economic), the Official Community Plan and other policies that establish the planning and resource context for our work.
Through the CSP, the City has articulated its core values of Community, Integrity, Respect, Innovation and Passion. These values describe how we do our work and are the principles that guide our actions and decisions.
Corporate Strategic Plan Key Results – 2021The CSP outlines six key results areas or goals that describe the focus areas of our work and help us prioritize our efforts and resources. For the 2021 Annual Municipal Report, departments have outlined their goals and achievements in the following section.
1 2 3 4 5 6A SAFE
COMMUNITYA CONNECTEDCOMMUNITY
AN INCLUSIVECOMMUNITY
A HEALTHYCOMMUNITY
A DYNAMICCOMMUNITY
A THRIVINGORGANIZATION
Legend - Lead Departments Responsible for InitiativesThough all departments work collaboratively to maximize efficient delivery of all City programs and initiatives, specific departments take a lead role. The following legend identifies lead departments for the 2021 accomplishments highlighted in this section.
INTEGRATEDPLANNING
FRAMEWORK
C
ORP
ORA
TE S
TRAT
EGIC PLAN (CSP)
ACTION PLAN (AP)
FINANCIAL PLAN
(FP)INTEGRATED PLANNING FRAMEWORKThe City of Burnaby utilizes an integrated planning framework as the foundation for coordinating and advancing activities in support of its overall vision.
Comprised of three separate but complementary planningprocesses, the framework results in integrated plans that guide the City’s actions and decisions. The Corporate Strategic Plan (CSP), the Financial Plan (FP) and the Action Plan (AP) establish the principles that drive the delivery of services, building on optimal strategies and activities to advance implementation of the City’s overall vision and goals.
BFD: Burnaby Fire DepartmentBPL: Burnaby Public LibraryC: City ClerkCAE: Climate Action & EnergyCCM: Corporate Communications & MarketingCSS: Citizen Support ServicesE: Engineering Department
F: Finance DepartmentIT: Information Technology DepartmentPB: Planning & Building DepartmentPC: People & Culture DepartmentPRCS: Parks, Recreation & Culutural Services DepartmentPSCS: Public Safety & Community Services Administration RCMP: RCMP Burnaby Detachment
60 | 2021 ANNUAL MUNICIPAL REPORT
APPENDIX A | CORPORATE STRATEGIC PLAN & SERVICE HIGHLIGHTS
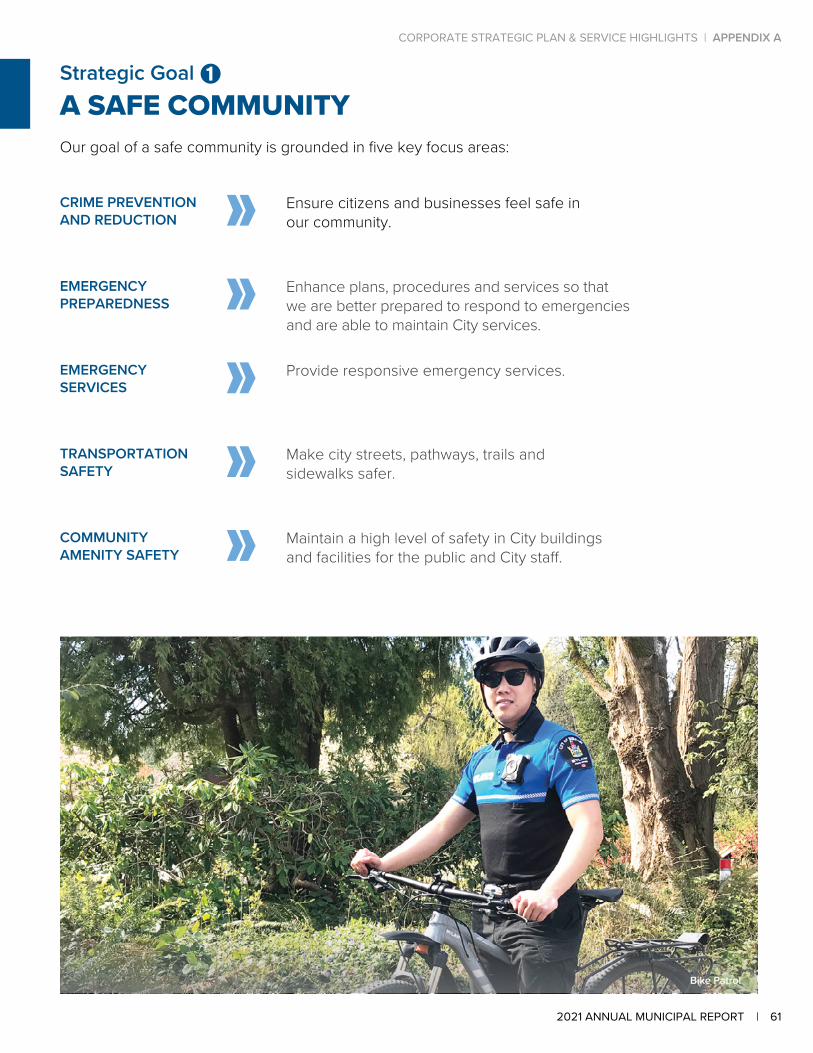
Strategic Goal A SAFE COMMUNITYOur goal of a safe community is grounded in five key focus areas:
CRIME PREVENTIONAND REDUCTION
Ensure citizens and businesses feel safe in our community.
EMERGENCYPREPAREDNESS
Enhance plans, procedures and services so that we are better prepared to respond to emergencies and are able to maintain City services.
EMERGENCYSERVICES
Provide responsive emergency services.
TRANSPORTATIONSAFETY
Make city streets, pathways, trails and sidewalks safer.
COMMUNITYAMENITY SAFETY
Maintain a high level of safety in City buildings and facilities for the public and City staff.
Bike Patrol
STRATEGIC GOAL 1 | CORPORATE STRATEGIC PLAN & SERVICE HIGHLIGHTS | APPENDIX A
612021 ANNUAL MUNICIPAL REPORT |
Crime Prevention & ReductionEnsure citizens and businesses feel safe in our community.
2021 ACHIEVEMENTS
Burnaby Gang Enforcement TeamLaunched Burnaby Gang Enforcement Team (BGET), a team dedicated to targeting gang members and their activity in Burnaby. (RCMP)
Block Watch WebsiteLaunched a new Block Watch site, which provides residents access to many forms, information and services online. This increased efficiency lets staff focus on communication with the almost 9,000 residents participating in the program. (RCMP)
Boost & BustFocused on reducing thefts at local Burnaby malls through a targeted “Boost & Bust ” program. The project resulted in over 40 arrests and nearly $5,000 in property recovered. (RCMP)
RCMP Youth SectionBurnaby RCMP Youth Section continued with its Youth-At-Risk initiative in 2021. The Youth Section officers, in collaboration with schools and other partner agencies, identify vulnerable youth and formulate the best course of action to provide support to these youth. Meetings were held with several youth who were vulnerable to being recruited into gangs, known for drug dealing, youth sexual exploitation and other criminal activities. (RCMP)
2021 ACHIEVEMENTS
COVID-19 Safety PlansCOVID-19 safety plans have been developed, reviewed and implemented across the entire City of Burnaby organization, including all facilities. These safety plans adhere to the standards established by the Provincial Health Orders and WorkSafeBC guidelines. (PC)
COVID-19 Staff Exposure TrackingDeveloped a COVID-19 tracking system, which supported all staff with the process of responding to staff exposures and follow ups to ensure staff and patron safety. (PC)
Wildland Firefighting CapabilitiesIncreased operational capability and executed field drills on Burnaby Mountain to address the heightened risk of wildfire on Burnaby Mountain due to industrial activity, the general drying of the forest due to regional weather change, and increased human use and interactions. (BFD)
Extreme Heat Initial Response GuidelineThe City activated the Extreme Heat Initial Response Guideline to assist with managing the extreme heat events in an effort to contribute to the overall safety of the community. (PSCS)
Firefighting Support in BC InteriorBurnaby Fire Department crews deployed on an ongoing basis to the B.C. Interior during the summer 2021 wildfire season. Crews drove up to the Interior to work for seven days before returning back home to Burnaby. Careful management of resources and personnel meant these deployments were made without any impact on the delivery of services to Burnaby residents. Providing support in wildfire situations offers Burnaby firefighters valuable wildland firefighting experience on the road, which will benefit Burnaby residents in the event that the city has to deal with its own wildfire scenario. There was no additional cost to Burnaby taxpayers, as the province covers the full cost for the firefighters’ time and equipment. (BFD)
Emergency PreparednessEnhance plans, procedures and services so that we are better prepared to respond to emergencies and are able to maintain City services.
62 | 2021 ANNUAL MUNICIPAL REPORT
APPENDIX A | CORPORATE STRATEGIC PLAN & SERVICE HIGHLIGHTS
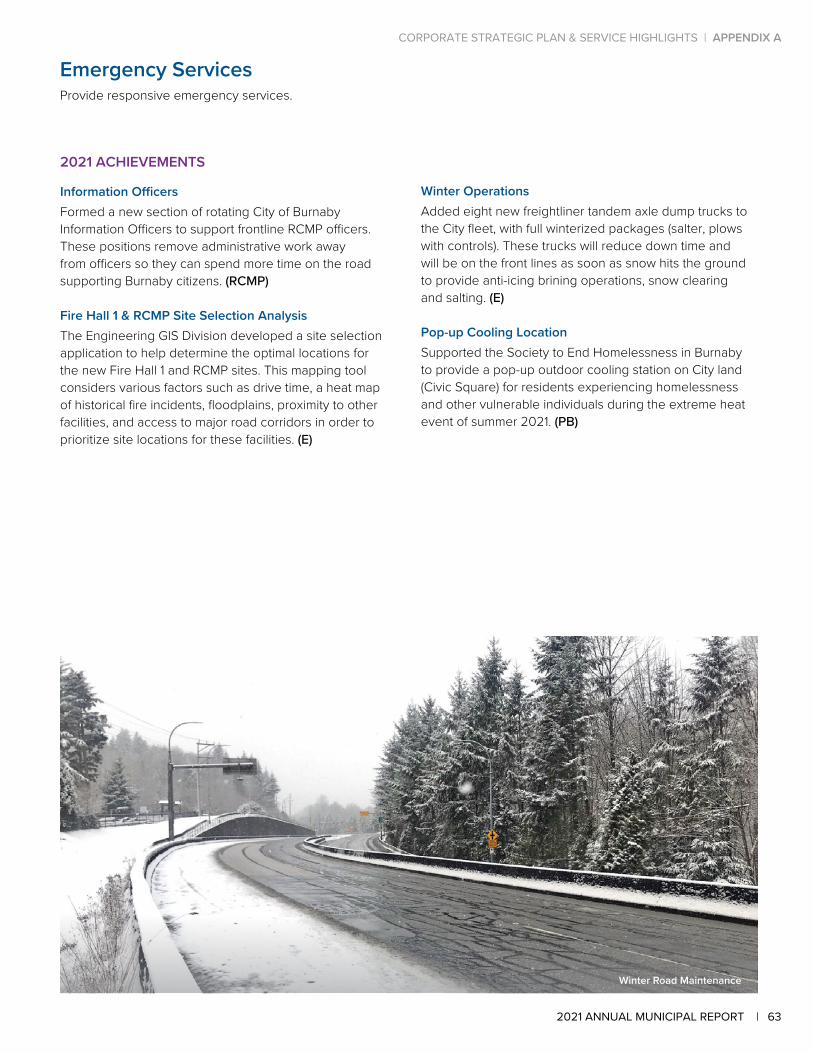
Emergency ServicesProvide responsive emergency services.
2021 ACHIEVEMENTS
Information OfficersFormed a new section of rotating City of Burnaby Information Officers to support frontline RCMP officers. These positions remove administrative work away from officers so they can spend more time on the road supporting Burnaby citizens. (RCMP)
Fire Hall 1 & RCMP Site Selection AnalysisThe Engineering GIS Division developed a site selection application to help determine the optimal locations for the new Fire Hall 1 and RCMP sites. This mapping tool considers various factors such as drive time, a heat map of historical fire incidents, floodplains, proximity to other facilities, and access to major road corridors in order to prioritize site locations for these facilities. (E)
Winter OperationsAdded eight new freightliner tandem axle dump trucks to the City fleet, with full winterized packages (salter, plows with controls). These trucks will reduce down time and will be on the front lines as soon as snow hits the ground to provide anti-icing brining operations, snow clearing and salting. (E)
Pop-up Cooling LocationSupported the Society to End Homelessness in Burnaby to provide a pop-up outdoor cooling station on City land (Civic Square) for residents experiencing homelessness and other vulnerable individuals during the extreme heat event of summer 2021. (PB)
Winter Road Maintenance
STRATEGIC GOAL 1 | CORPORATE STRATEGIC PLAN & SERVICE HIGHLIGHTS | APPENDIX A
632021 ANNUAL MUNICIPAL REPORT |
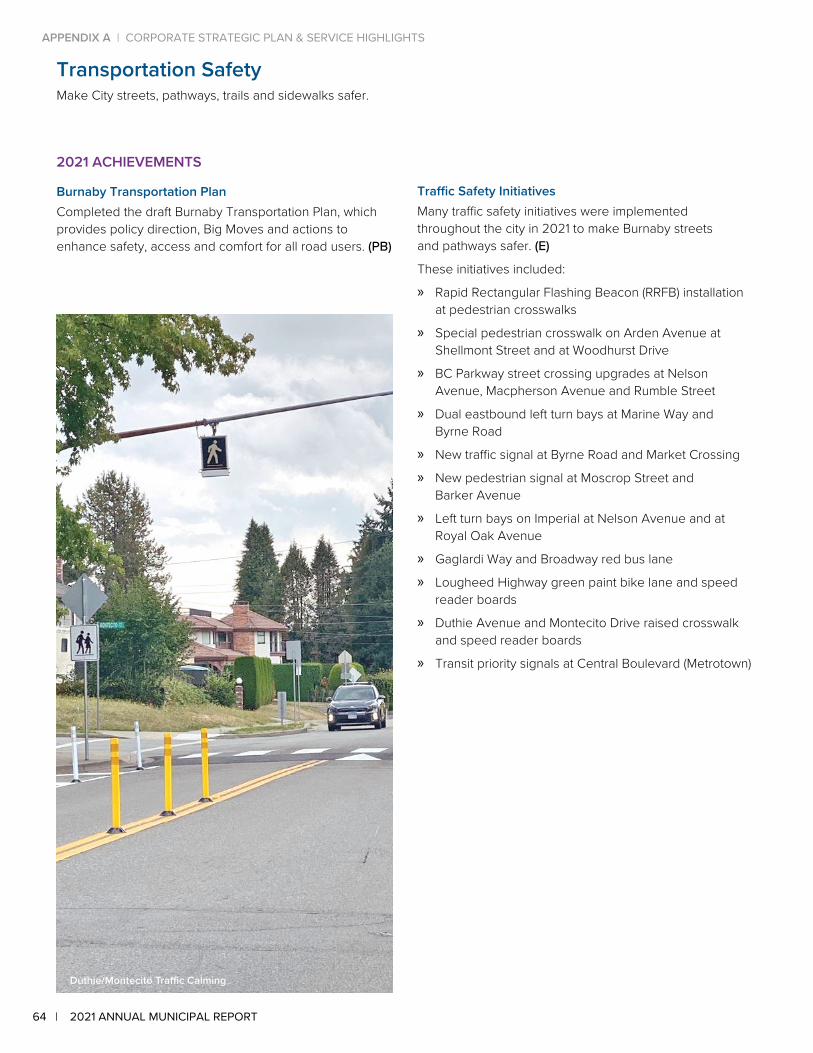
Transportation SafetyMake City streets, pathways, trails and sidewalks safer.
2021 ACHIEVEMENTS
Burnaby Transportation PlanCompleted the draft Burnaby Transportation Plan, which provides policy direction, Big Moves and actions to enhance safety, access and comfort for all road users. (PB)
Traffic Safety InitiativesMany traffic safety initiatives were implemented throughout the city in 2021 to make Burnaby streets and pathways safer. (E)
These initiatives included:
» Rapid Rectangular Flashing Beacon (RRFB) installation at pedestrian crosswalks
» Special pedestrian crosswalk on Arden Avenue at Shellmont Street and at Woodhurst Drive
» BC Parkway street crossing upgrades at Nelson Avenue, Macpherson Avenue and Rumble Street
» Dual eastbound left turn bays at Marine Way and Byrne Road
» New traffic signal at Byrne Road and Market Crossing
» New pedestrian signal at Moscrop Street and Barker Avenue
» Left turn bays on Imperial at Nelson Avenue and at Royal Oak Avenue
» Gaglardi Way and Broadway red bus lane
» Lougheed Highway green paint bike lane and speed reader boards
» Duthie Avenue and Montecito Drive raised crosswalk and speed reader boards
» Transit priority signals at Central Boulevard (Metrotown)
Duthie/Montecito Traffic Calming
64 | 2021 ANNUAL MUNICIPAL REPORT
APPENDIX A | CORPORATE STRATEGIC PLAN & SERVICE HIGHLIGHTS
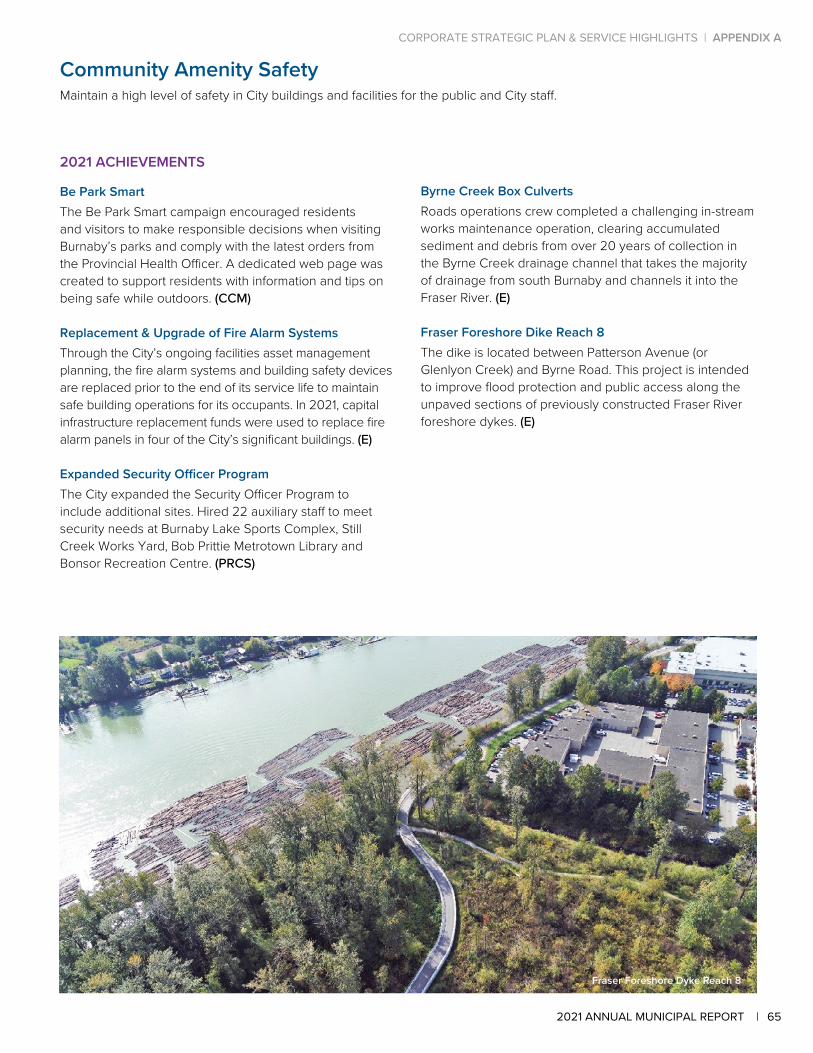
2021 ACHIEVEMENTS
Be Park Smart The Be Park Smart campaign encouraged residents and visitors to make responsible decisions when visiting Burnaby’s parks and comply with the latest orders from the Provincial Health Officer. A dedicated web page was created to support residents with information and tips on being safe while outdoors. (CCM)
Replacement & Upgrade of Fire Alarm SystemsThrough the City’s ongoing facilities asset management planning, the fire alarm systems and building safety devices are replaced prior to the end of its service life to maintain safe building operations for its occupants. In 2021, capital infrastructure replacement funds were used to replace fire alarm panels in four of the City’s significant buildings. (E)
Expanded Security Officer Program The City expanded the Security Officer Program to include additional sites. Hired 22 auxiliary staff to meet security needs at Burnaby Lake Sports Complex, Still Creek Works Yard, Bob Prittie Metrotown Library and Bonsor Recreation Centre. (PRCS)
Byrne Creek Box CulvertsRoads operations crew completed a challenging in-stream works maintenance operation, clearing accumulated sediment and debris from over 20 years of collection in the Byrne Creek drainage channel that takes the majority of drainage from south Burnaby and channels it into the Fraser River. (E)
Fraser Foreshore Dike Reach 8 The dike is located between Patterson Avenue (or Glenlyon Creek) and Byrne Road. This project is intended to improve flood protection and public access along the unpaved sections of previously constructed Fraser River foreshore dykes. (E)
Community Amenity SafetyMaintain a high level of safety in City buildings and facilities for the public and City staff.
Fraser Foreshore Dyke Reach 8
STRATEGIC GOAL 1 | CORPORATE STRATEGIC PLAN & SERVICE HIGHLIGHTS | APPENDIX A
652021 ANNUAL MUNICIPAL REPORT |

Active Transportation Connections
DIGITALCONNECTION
Provide online access to core City services and information.
SOCIALCONNECTION
Enhance social connections throughout Burnaby.
PARTNERSHIP Work collaboratively with businesses, educational institutions, associations, other communities and governments.
GEOGRAPHICCONNECTION
Ensure that people can move easily through allareas of Burnaby, using any form of transportation.
Strategic Goal A CONNECTED COMMUNITYOur goal of a connected community is grounded in four key focus areas:
Home Library Service
66 | 2021 ANNUAL MUNICIPAL REPORT
APPENDIX A | CORPORATE STRATEGIC PLAN & SERVICE HIGHLIGHTS

Digital ConnectionProvide online access to core City services and information.
2021 ACHIEVEMENTS
Launched New Burnaby.ca WebsiteLaunched the redesigned Burnaby.ca website on August 9 to better meet the needs of our community by providing a citizen-centric, service-oriented web experience with easier access and navigation to the City’s online services. (IT)
Business Licence: Migration from Annual to Anniversary BillingMoved to a new and improved solution for processing business licences, making it easier and more convenient for business owners to apply, renew, modify, make payments and print copies of their business licence online. Deploying the new solution provided an opportunity to transition from the current annual calendar billing to anniversary billing, enabling new businesses in Burnaby to receive a 12-month licence regardless of when they apply. (IT, F, PSCS)
Burnaby Art Gallery Online LearningBurnaby Art Gallery pivoted school workshops to accommodate online learning for the 2020/2021 school year. Four popular in-person workshops were presented via Zoom and kits were created and sent to participating schools. More than 1,400 students participated in over 60 classes throughout the school year. (PRCS)
Live at the Bolt Concert SeriesShadbolt Centre for the Arts presented Livestreaming at the 'Bolt every Thursday from January to December 2021. With 40+ performances from world class artists, the series employed 3,000 artists and engaged with over 7,000 online audience members from across the globe, as well as over 1,000 in-person patrons. (PRCS)
Burnaby Art Gallery Online Learning
STRATEGIC GOAL 1 | CORPORATE STRATEGIC PLAN & SERVICE HIGHLIGHTS | APPENDIX A
672021 ANNUAL MUNICIPAL REPORT |

Social ConnectionEnhance social connections throughout Burnaby.
2021 ACHIEVEMENTS
Home Library & Accessible Service DepartmentHome Delivery Service brings the library to Burnaby residents unable to visit the library on their own. Staff personalize the delivery with books, movies and other items according to what residents like. The department also provides access to thousands of accessible audiobooks for library members with a perceptual disability. (BPL)
Increased Outreach to Isolated SeniorsPerformed weekly wellness check-in calls with senior clients and volunteers. Clients were connected with additional services and/or resources as needed. The Phone Buddy match-up service, where volunteers call seniors, was increased. As part of the Sunshine Notes project, students connected with isolated seniors by writing letters which were included in the seniors grocery deliveries. The seniors would have the opportunity to write back to the students and City staff would deliver the messages to the schools. (CSS)
Horizons Events & Meeting VenueConstruction of the Horizons concession has been completed. Flooring for the restaurant has been leveled, with concrete poured and repairs to damaged pillars completed. Renovations and upgrades of front entrance, bar and kitchen areas have begun. (PRCS)
Burnaby Mountain Golf Course Clubhouse Patio UpgradesUpgrade and expansion of the restaurant patio at Burnaby Mountain Golf Course is complete. Work included replacing the uneven, concrete flooring with red brick and extending the patio to create more outdoor dining space for patrons. The finished space provides more distance between tables and improves the ability to serve patrons. (PRCS)
Expanded Summer Stages ProgramWith stages in Edmonds Park, Confederation Park and Civic Square, the Summer Stages program brought together families throughout Burnaby to attend art workshops, movie screenings, music performances, Indigenous storytelling and dance performances. Over 6,500 people enjoyed these free summer events. (PRCS)
Burnaby Mountain Golf Course Clubhouse Patio Upgrades
68 | 2021 ANNUAL MUNICIPAL REPORT
APPENDIX A | CORPORATE STRATEGIC PLAN & SERVICE HIGHLIGHTS

PartnershipWork collaboratively with businesses, educational institutions, associations, other communities and governments.
2021 ACHIEVEMENTS
Manager, Indigenous RelationsHired a Manager for Indigenous Relations, to help steer Burnaby’s relations with local First Nations and Indigenous people, as well as assist City staff in meeting their Truth and Reconciliation goals and obligations. (PB)
Urban Resilient Futures InitiativeIn 2021, the City committed to a three-year partnership with the Simon Fraser University’s Morris J. Wosk Centre for Dialogue and Vancity to engage with the community to tackle barriers to climate action. In late 2021, the initiative was launched with co-design workshops and participatory mapping. (CAE)
Vaccine Rollout Working Group Over 700 calls were made to isolated seniors in Burnaby to identify those unaware of how to get their vaccination and share the necessary information. Seniors without transportation were identified and City staff worked with Fraser Health to arrange rides. For seniors who could not be transported, City staff worked with Fraser Health to arrange a home visit from a healthcare professional. (CSS)
City-School District Partnership for Child CareThrough a partnership with the Burnaby School District, new child care centres opened on four sites this year, creating a total of 136 new child care spaces for children aged five and under. (PB)
SFU-City of Burnaby Research Study on ResiliencyUndertook a study with SFU Resource and Environmental Management faculty and students to define resiliency for Burnaby and provide a resiliency policy framework for consideration for future land use and community planning. (PB)
Published a History of Burnaby SchoolsLaunched the historical book Inkwells to Internet: A History of Burnaby Schools in collaboration with the Burnaby Board of Education and BC Retired Teachers’ Association. Five local authors volunteered their time to research and write the book, with graphic design and printing provided by the City of Burnaby. (PB)
2021 ACHIEVEMENTS
Funds for Public Parking & Active Transportation InfrastructureEnacted a Zoning Bylaw amendment that allows payment in-lieu of off-street parking spaces, where they are not feasible, with funds going towards public parking facilities and active transportation infrastructure. (PB)
Marine Drive – Boundary to Greenall ProjectThis project aims to bring Marine Drive to the urban street standard including curb and gutter, sidewalk on both sides of the road, bus route pavement, new bus stops, intersection upgrades, new streetlights, boulevard, and street trees as required. (E)
Geographic ConnectionEnsure that people can move easily through all areas of Burnaby, using any form of transportation.
Active Transportation Connections
STRATEGIC GOAL 1 | CORPORATE STRATEGIC PLAN & SERVICE HIGHLIGHTS | APPENDIX A
692021 ANNUAL MUNICIPAL REPORT |
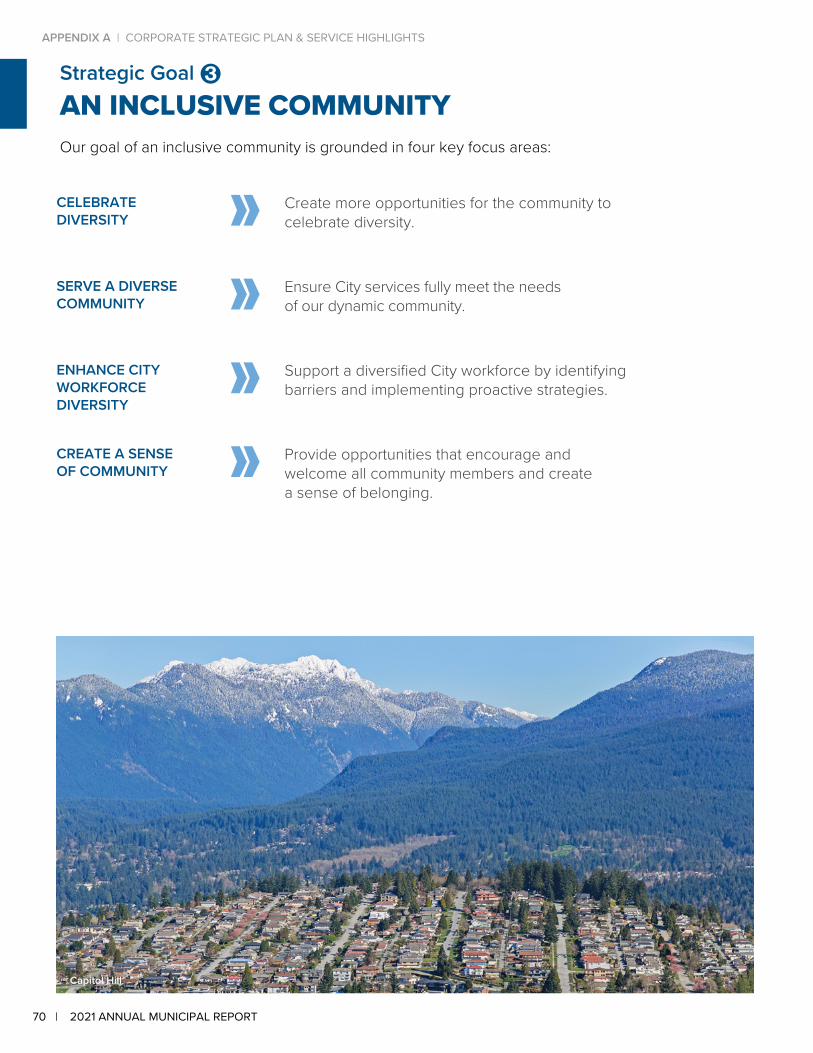
CELEBRATEDIVERSITY
Create more opportunities for the community to celebrate diversity.
SERVE A DIVERSECOMMUNITY
Ensure City services fully meet the needsof our dynamic community.
ENHANCE CITYWORKFORCE DIVERSITY
Support a diversified City workforce by identifyingbarriers and implementing proactive strategies.
CREATE A SENSEOF COMMUNITY
Provide opportunities that encourage and welcome all community members and create a sense of belonging.
Strategic Goal AN INCLUSIVE COMMUNITYOur goal of an inclusive community is grounded in four key focus areas:
Capitol Hill
70 | 2021 ANNUAL MUNICIPAL REPORT
APPENDIX A | CORPORATE STRATEGIC PLAN & SERVICE HIGHLIGHTS
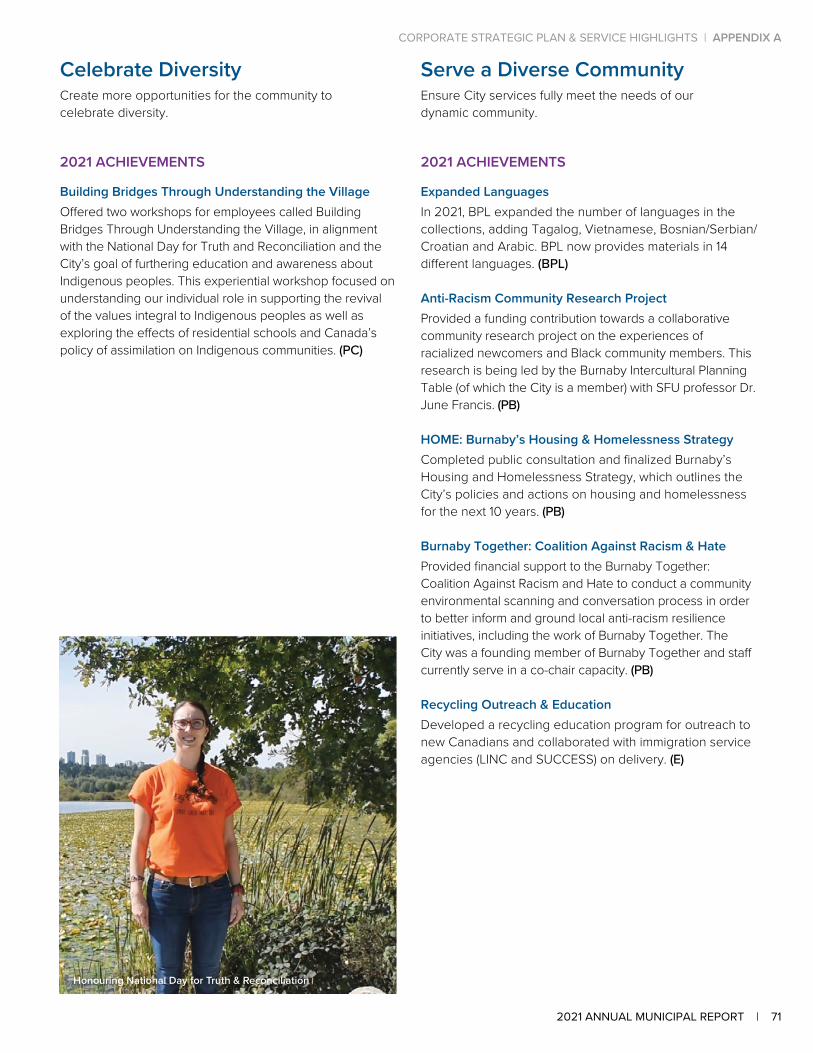
Celebrate DiversityCreate more opportunities for the community to celebrate diversity.
2021 ACHIEVEMENTS
Building Bridges Through Understanding the VillageOffered two workshops for employees called Building Bridges Through Understanding the Village, in alignment with the National Day for Truth and Reconciliation and the City’s goal of furthering education and awareness about Indigenous peoples. This experiential workshop focused on understanding our individual role in supporting the revival of the values integral to Indigenous peoples as well as exploring the effects of residential schools and Canada’s policy of assimilation on Indigenous communities. (PC)
\
2021 ACHIEVEMENTS
Expanded LanguagesIn 2021, BPL expanded the number of languages in the collections, adding Tagalog, Vietnamese, Bosnian/Serbian/Croatian and Arabic. BPL now provides materials in 14 different languages. (BPL)
Anti-Racism Community Research ProjectProvided a funding contribution towards a collaborative community research project on the experiences of racialized newcomers and Black community members. This research is being led by the Burnaby Intercultural Planning Table (of which the City is a member) with SFU professor Dr. June Francis. (PB)
HOME: Burnaby’s Housing & Homelessness StrategyCompleted public consultation and finalized Burnaby’s Housing and Homelessness Strategy, which outlines the City’s policies and actions on housing and homelessness for the next 10 years. (PB)
Burnaby Together: Coalition Against Racism & HateProvided financial support to the Burnaby Together: Coalition Against Racism and Hate to conduct a community environmental scanning and conversation process in order to better inform and ground local anti-racism resilience initiatives, including the work of Burnaby Together. The City was a founding member of Burnaby Together and staff currently serve in a co-chair capacity. (PB)
Recycling Outreach & EducationDeveloped a recycling education program for outreach to new Canadians and collaborated with immigration service agencies (LINC and SUCCESS) on delivery. (E)
Serve a Diverse CommunityEnsure City services fully meet the needs of our dynamic community.
Honouring National Day for Truth & Reconciliation
Strategic Goal AN INCLUSIVE COMMUNITYOur goal of an inclusive community is grounded in four key focus areas:
STRATEGIC GOAL 1 | CORPORATE STRATEGIC PLAN & SERVICE HIGHLIGHTS | APPENDIX A
712021 ANNUAL MUNICIPAL REPORT |
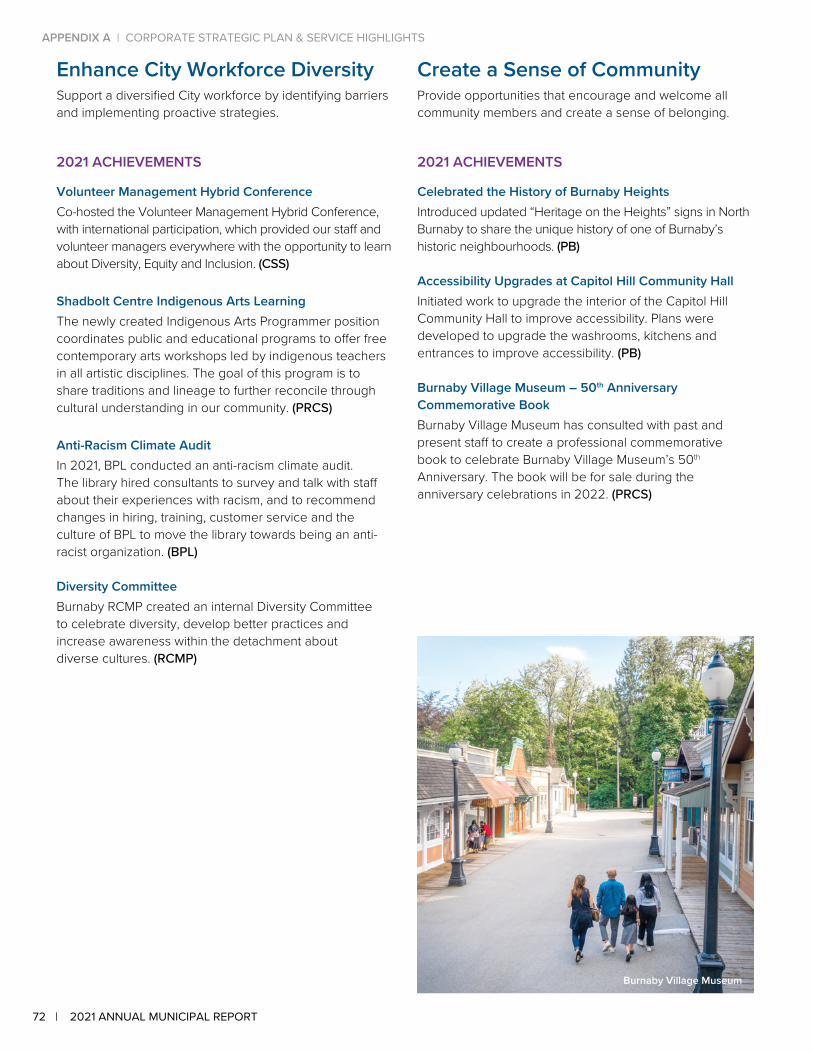
Enhance City Workforce DiversitySupport a diversified City workforce by identifying barriers and implementing proactive strategies.
2021 ACHIEVEMENTS
Volunteer Management Hybrid ConferenceCo-hosted the Volunteer Management Hybrid Conference, with international participation, which provided our staff and volunteer managers everywhere with the opportunity to learn about Diversity, Equity and Inclusion. (CSS)
Shadbolt Centre Indigenous Arts LearningThe newly created Indigenous Arts Programmer position coordinates public and educational programs to offer free contemporary arts workshops led by indigenous teachers in all artistic disciplines. The goal of this program is to share traditions and lineage to further reconcile through cultural understanding in our community. (PRCS)
Anti-Racism Climate AuditIn 2021, BPL conducted an anti-racism climate audit. The library hired consultants to survey and talk with staff about their experiences with racism, and to recommend changes in hiring, training, customer service and the culture of BPL to move the library towards being an anti-racist organization. (BPL)
Diversity CommitteeBurnaby RCMP created an internal Diversity Committee to celebrate diversity, develop better practices and increase awareness within the detachment about diverse cultures. (RCMP)
2021 ACHIEVEMENTS
Celebrated the History of Burnaby HeightsIntroduced updated “Heritage on the Heights” signs in North Burnaby to share the unique history of one of Burnaby’s historic neighbourhoods. (PB)
Accessibility Upgrades at Capitol Hill Community HallInitiated work to upgrade the interior of the Capitol Hill Community Hall to improve accessibility. Plans were developed to upgrade the washrooms, kitchens and entrances to improve accessibility. (PB)
Burnaby Village Museum – 50th Anniversary Commemorative BookBurnaby Village Museum has consulted with past and present staff to create a professional commemorative book to celebrate Burnaby Village Museum’s 50th Anniversary. The book will be for sale during the anniversary celebrations in 2022. (PRCS)
Create a Sense of CommunityProvide opportunities that encourage and welcome all community members and create a sense of belonging.
Burnaby Village Museum
72 | 2021 ANNUAL MUNICIPAL REPORT
APPENDIX A | CORPORATE STRATEGIC PLAN & SERVICE HIGHLIGHTS
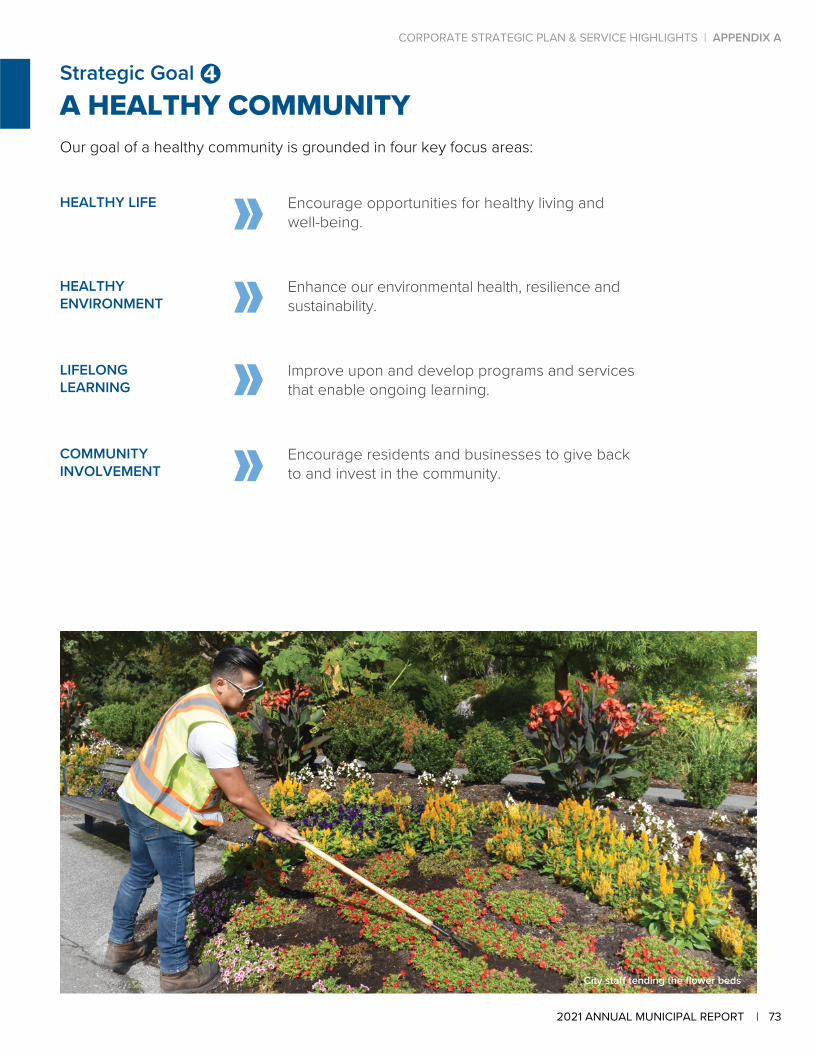
HEALTHY LIFE Encourage opportunities for healthy living and well-being.
HEALTHYENVIRONMENT
Enhance our environmental health, resilience and sustainability.
LIFELONGLEARNING
Improve upon and develop programs and servicesthat enable ongoing learning.
COMMUNITYINVOLVEMENT
Encourage residents and businesses to give back to and invest in the community.
Strategic Goal A HEALTHY COMMUNITYOur goal of a healthy community is grounded in four key focus areas:
City staff tending the flower beds
STRATEGIC GOAL 1 | CORPORATE STRATEGIC PLAN & SERVICE HIGHLIGHTS | APPENDIX A
732021 ANNUAL MUNICIPAL REPORT |
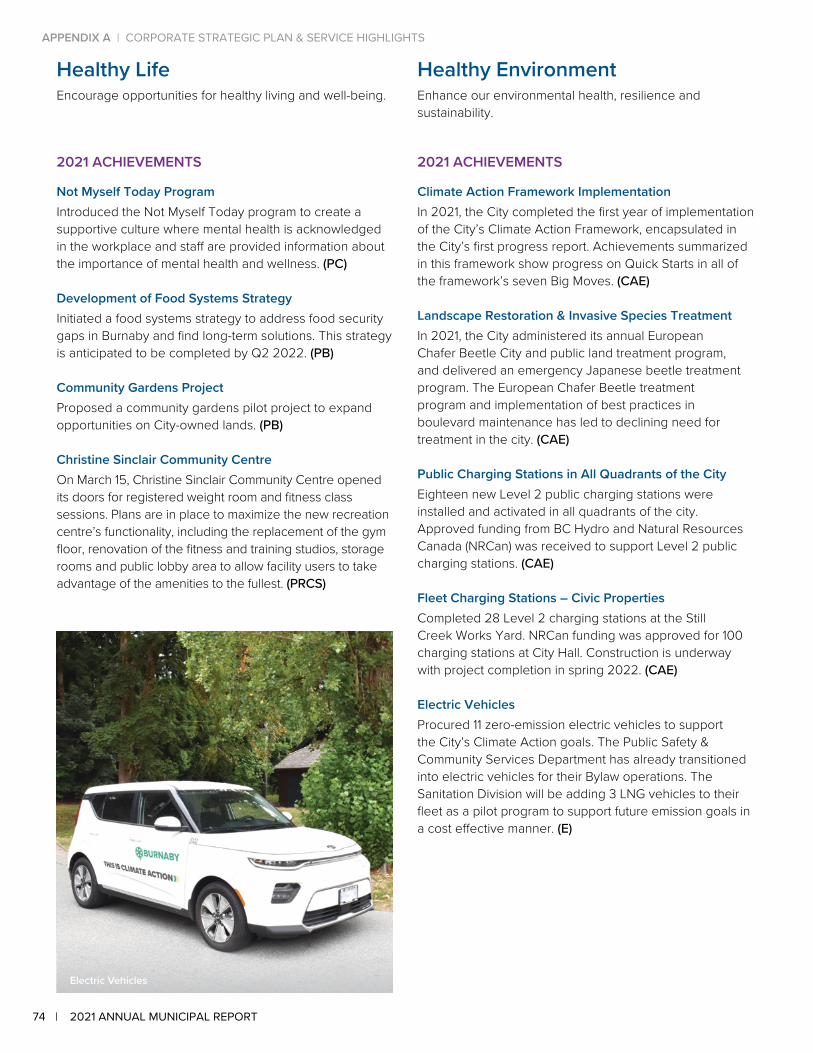
Healthy LifeEncourage opportunities for healthy living and well-being.
2021 ACHIEVEMENTS
Not Myself Today ProgramIntroduced the Not Myself Today program to create a supportive culture where mental health is acknowledged in the workplace and staff are provided information about the importance of mental health and wellness. (PC)
Development of Food Systems StrategyInitiated a food systems strategy to address food security gaps in Burnaby and find long-term solutions. This strategy is anticipated to be completed by Q2 2022. (PB)
Community Gardens ProjectProposed a community gardens pilot project to expand opportunities on City-owned lands. (PB)
Christine Sinclair Community CentreOn March 15, Christine Sinclair Community Centre opened its doors for registered weight room and fitness class sessions. Plans are in place to maximize the new recreation centre’s functionality, including the replacement of the gym floor, renovation of the fitness and training studios, storage rooms and public lobby area to allow facility users to take advantage of the amenities to the fullest. (PRCS)
2021 ACHIEVEMENTS
Climate Action Framework ImplementationIn 2021, the City completed the first year of implementation of the City’s Climate Action Framework, encapsulated in the City’s first progress report. Achievements summarized in this framework show progress on Quick Starts in all of the framework’s seven Big Moves. (CAE)
Landscape Restoration & Invasive Species TreatmentIn 2021, the City administered its annual European Chafer Beetle City and public land treatment program, and delivered an emergency Japanese beetle treatment program. The European Chafer Beetle treatment program and implementation of best practices in boulevard maintenance has led to declining need for treatment in the city. (CAE)
Public Charging Stations in All Quadrants of the CityEighteen new Level 2 public charging stations were installed and activated in all quadrants of the city. Approved funding from BC Hydro and Natural Resources Canada (NRCan) was received to support Level 2 public charging stations. (CAE)
Fleet Charging Stations – Civic PropertiesCompleted 28 Level 2 charging stations at the Still Creek Works Yard. NRCan funding was approved for 100 charging stations at City Hall. Construction is underway with project completion in spring 2022. (CAE)
Electric VehiclesProcured 11 zero-emission electric vehicles to support the City’s Climate Action goals. The Public Safety & Community Services Department has already transitioned into electric vehicles for their Bylaw operations. The Sanitation Division will be adding 3 LNG vehicles to their fleet as a pilot program to support future emission goals in a cost effective manner. (E)
Healthy EnvironmentEnhance our environmental health, resilience and sustainability.
Electric Vehicles
74 | 2021 ANNUAL MUNICIPAL REPORT
APPENDIX A | CORPORATE STRATEGIC PLAN & SERVICE HIGHLIGHTS
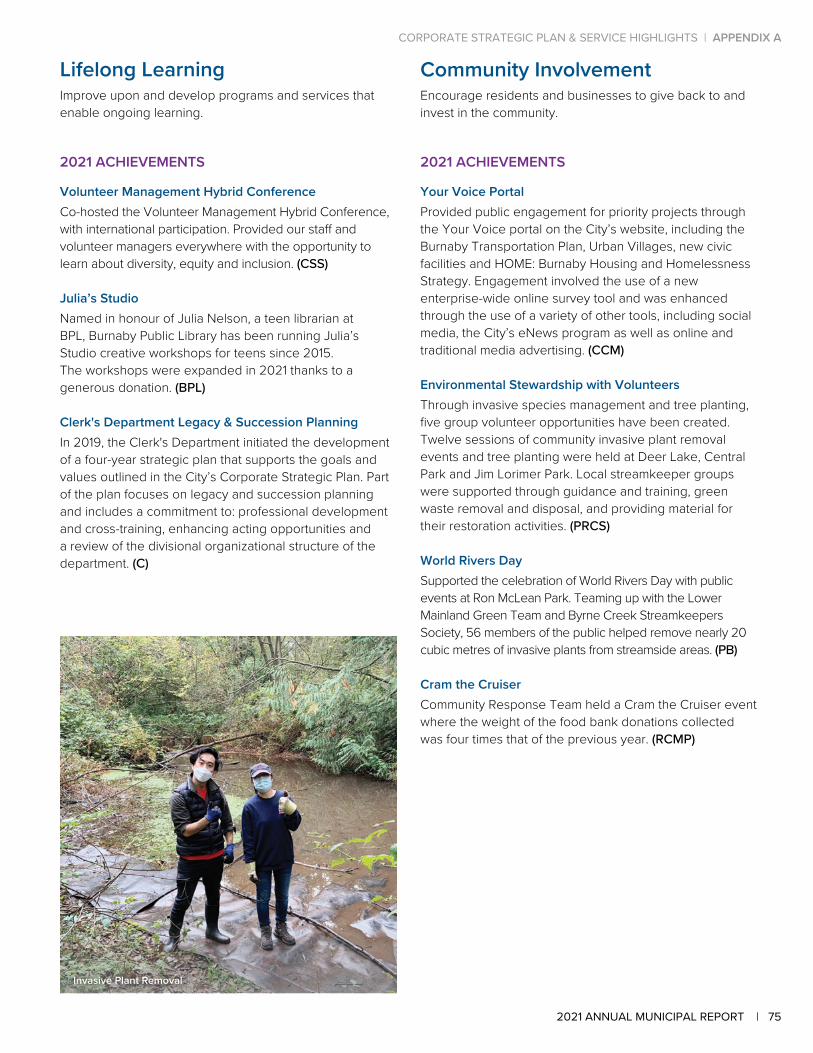
Lifelong LearningImprove upon and develop programs and services that enable ongoing learning.
2021 ACHIEVEMENTS
Volunteer Management Hybrid ConferenceCo-hosted the Volunteer Management Hybrid Conference, with international participation. Provided our staff and volunteer managers everywhere with the opportunity to learn about diversity, equity and inclusion. (CSS)
Julia’s StudioNamed in honour of Julia Nelson, a teen librarian at BPL, Burnaby Public Library has been running Julia’s Studio creative workshops for teens since 2015. The workshops were expanded in 2021 thanks to a generous donation. (BPL)
Clerk's Department Legacy & Succession PlanningIn 2019, the Clerk's Department initiated the development of a four-year strategic plan that supports the goals and values outlined in the City’s Corporate Strategic Plan. Part of the plan focuses on legacy and succession planning and includes a commitment to: professional development and cross-training, enhancing acting opportunities and a review of the divisional organizational structure of the department. (C)
2021 ACHIEVEMENTS
Your Voice PortalProvided public engagement for priority projects through the Your Voice portal on the City’s website, including the Burnaby Transportation Plan, Urban Villages, new civic facilities and HOME: Burnaby Housing and Homelessness Strategy. Engagement involved the use of a new enterprise-wide online survey tool and was enhanced through the use of a variety of other tools, including social media, the City’s eNews program as well as online and traditional media advertising. (CCM)
Environmental Stewardship with VolunteersThrough invasive species management and tree planting, five group volunteer opportunities have been created. Twelve sessions of community invasive plant removal events and tree planting were held at Deer Lake, Central Park and Jim Lorimer Park. Local streamkeeper groups were supported through guidance and training, green waste removal and disposal, and providing material for their restoration activities. (PRCS)
World Rivers DaySupported the celebration of World Rivers Day with public events at Ron McLean Park. Teaming up with the Lower Mainland Green Team and Byrne Creek Streamkeepers Society, 56 members of the public helped remove nearly 20 cubic metres of invasive plants from streamside areas. (PB)
Cram the Cruiser Community Response Team held a Cram the Cruiser event where the weight of the food bank donations collected was four times that of the previous year. (RCMP)
Community InvolvementEncourage residents and businesses to give back to and invest in the community.
Invasive Plant Removal
STRATEGIC GOAL 1 | CORPORATE STRATEGIC PLAN & SERVICE HIGHLIGHTS | APPENDIX A
752021 ANNUAL MUNICIPAL REPORT |

ECONOMICOPPORTUNITY
Foster an environment that attracts new and supports existing jobs, businesses and industries.
COMMUNITYDEVELOPMENT
Manage change by balancing economic development with environmental protection and maintaining a sense of belonging.
CITY FACILITIES& INFRASTRUCTURE
Build and maintain infrastructure that meets the needs of our growing community.
Strategic Goal A DYNAMIC COMMUNITYOur goal of a dynamic community is grounded in three key focus areas:
Fred Randall Pool & Waterslide
76 | 2021 ANNUAL MUNICIPAL REPORT
APPENDIX A | CORPORATE STRATEGIC PLAN & SERVICE HIGHLIGHTS
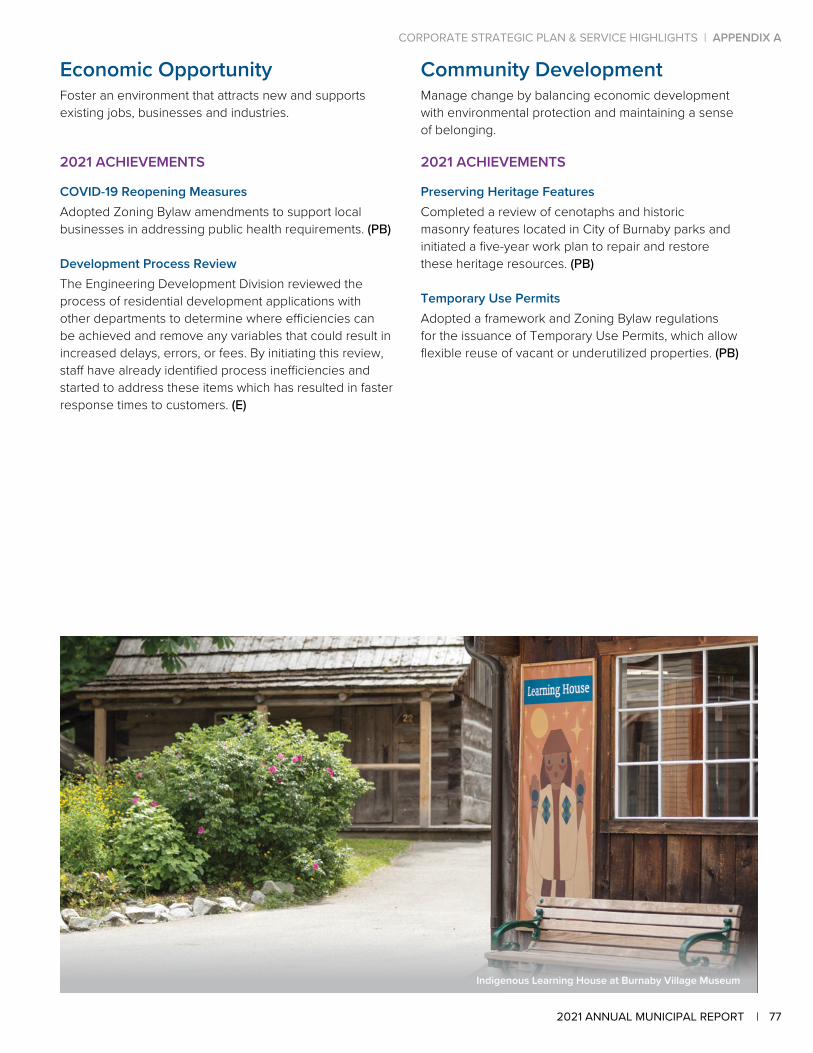
Economic OpportunityFoster an environment that attracts new and supports existing jobs, businesses and industries.
2021 ACHIEVEMENTS
COVID-19 Reopening MeasuresAdopted Zoning Bylaw amendments to support local businesses in addressing public health requirements. (PB)
Development Process ReviewThe Engineering Development Division reviewed the process of residential development applications with other departments to determine where efficiencies can be achieved and remove any variables that could result in increased delays, errors, or fees. By initiating this review, staff have already identified process inefficiencies and started to address these items which has resulted in faster response times to customers. (E)
2021 ACHIEVEMENTS
Preserving Heritage FeaturesCompleted a review of cenotaphs and historic masonry features located in City of Burnaby parks and initiated a five-year work plan to repair and restore these heritage resources. (PB)
Temporary Use PermitsAdopted a framework and Zoning Bylaw regulations for the issuance of Temporary Use Permits, which allow flexible reuse of vacant or underutilized properties. (PB)
Indigenous Learning House at Burnaby Village Museum
Community DevelopmentManage change by balancing economic development with environmental protection and maintaining a sense of belonging.
STRATEGIC GOAL 1 | CORPORATE STRATEGIC PLAN & SERVICE HIGHLIGHTS | APPENDIX A
772021 ANNUAL MUNICIPAL REPORT |
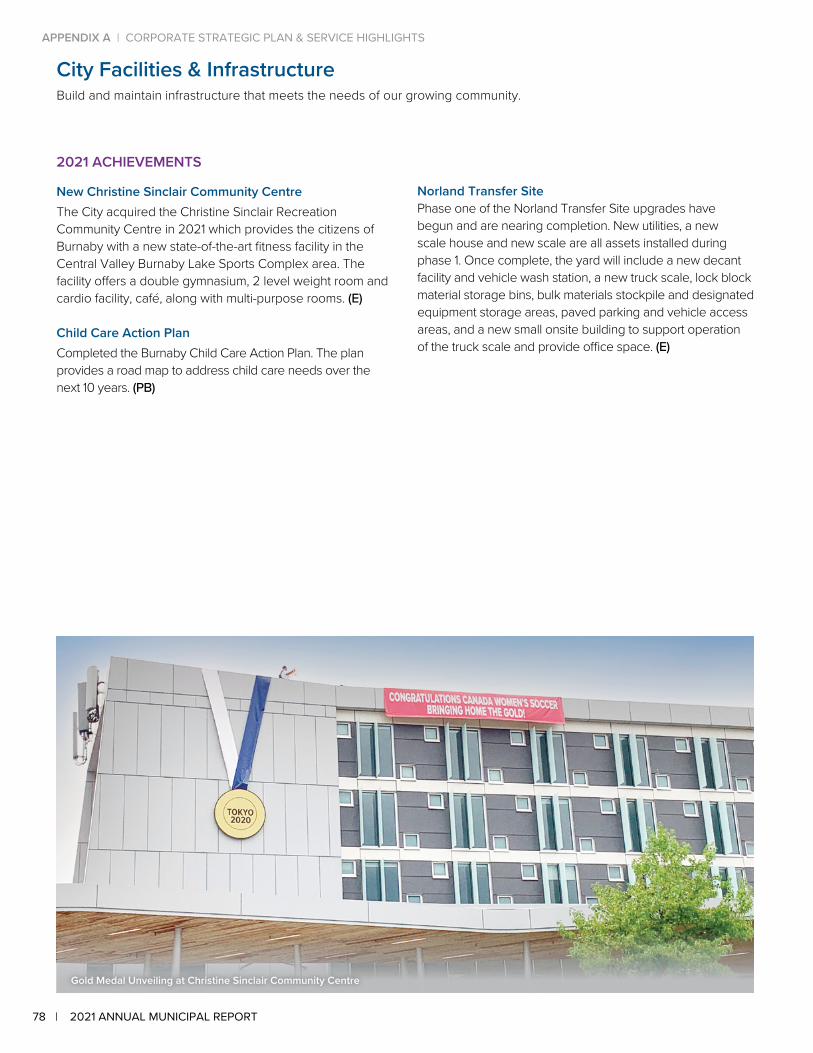
City Facilities & InfrastructureBuild and maintain infrastructure that meets the needs of our growing community.
2021 ACHIEVEMENTS
New Christine Sinclair Community CentreThe City acquired the Christine Sinclair Recreation Community Centre in 2021 which provides the citizens of Burnaby with a new state-of-the-art fitness facility in the Central Valley Burnaby Lake Sports Complex area. The facility offers a double gymnasium, 2 level weight room and cardio facility, café, along with multi-purpose rooms. (E)
Child Care Action PlanCompleted the Burnaby Child Care Action Plan. The plan provides a road map to address child care needs over the next 10 years. (PB)
Norland Transfer SitePhase one of the Norland Transfer Site upgrades have begun and are nearing completion. New utilities, a new scale house and new scale are all assets installed during phase 1. Once complete, the yard will include a new decant facility and vehicle wash station, a new truck scale, lock block material storage bins, bulk materials stockpile and designated equipment storage areas, paved parking and vehicle access areas, and a new small onsite building to support operation of the truck scale and provide office space. (E)
Gold Medal Unveiling at Christine Sinclair Community Centre
78 | 2021 ANNUAL MUNICIPAL REPORT
APPENDIX A | CORPORATE STRATEGIC PLAN & SERVICE HIGHLIGHTS
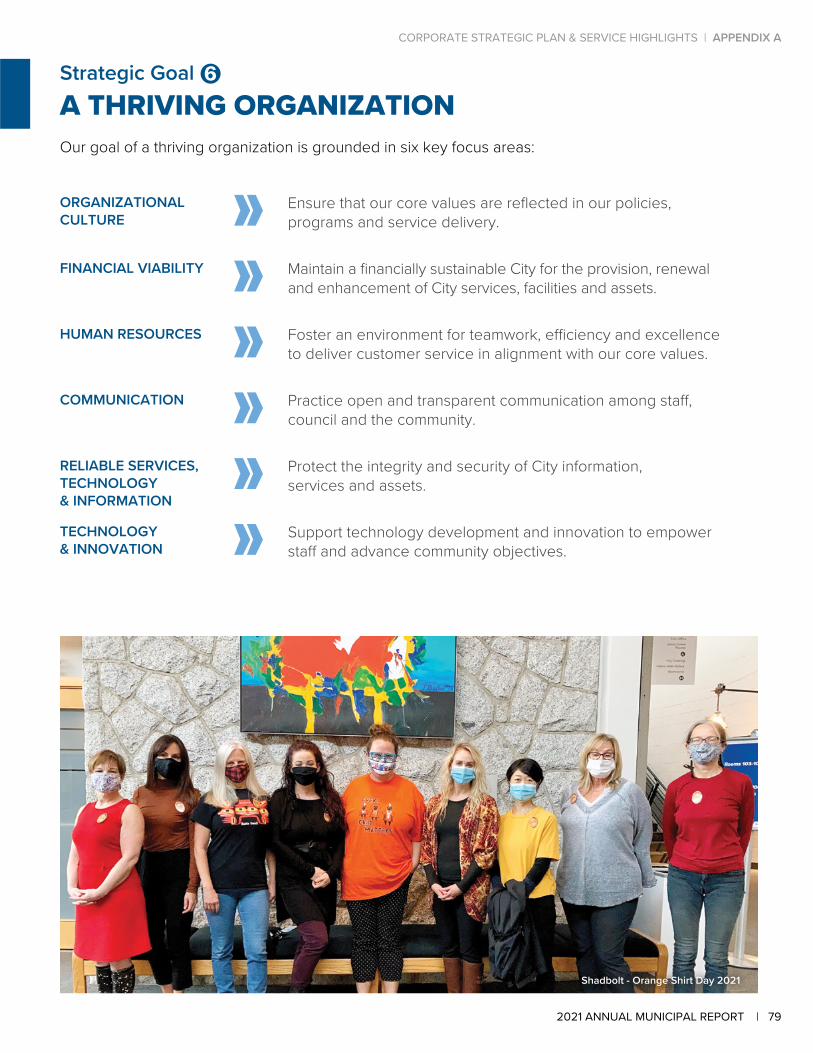
Strategic Goal A THRIVING ORGANIZATIONOur goal of a thriving organization is grounded in six key focus areas:
ORGANIZATIONAL CULTURE
Ensure that our core values are reflected in our policies, programs and service delivery.
FINANCIAL VIABILITY Maintain a financially sustainable City for the provision, renewal and enhancement of City services, facilities and assets.
HUMAN RESOURCES Foster an environment for teamwork, efficiency and excellence to deliver customer service in alignment with our core values.
COMMUNICATION Practice open and transparent communication among staff, council and the community.
RELIABLE SERVICES, TECHNOLOGY& INFORMATION
Protect the integrity and security of City information, services and assets.
TECHNOLOGY & INNOVATION
Support technology development and innovation to empower staff and advance community objectives.
Shadbolt - Orange Shirt Day 2021
STRATEGIC GOAL 1 | CORPORATE STRATEGIC PLAN & SERVICE HIGHLIGHTS | APPENDIX A
792021 ANNUAL MUNICIPAL REPORT |
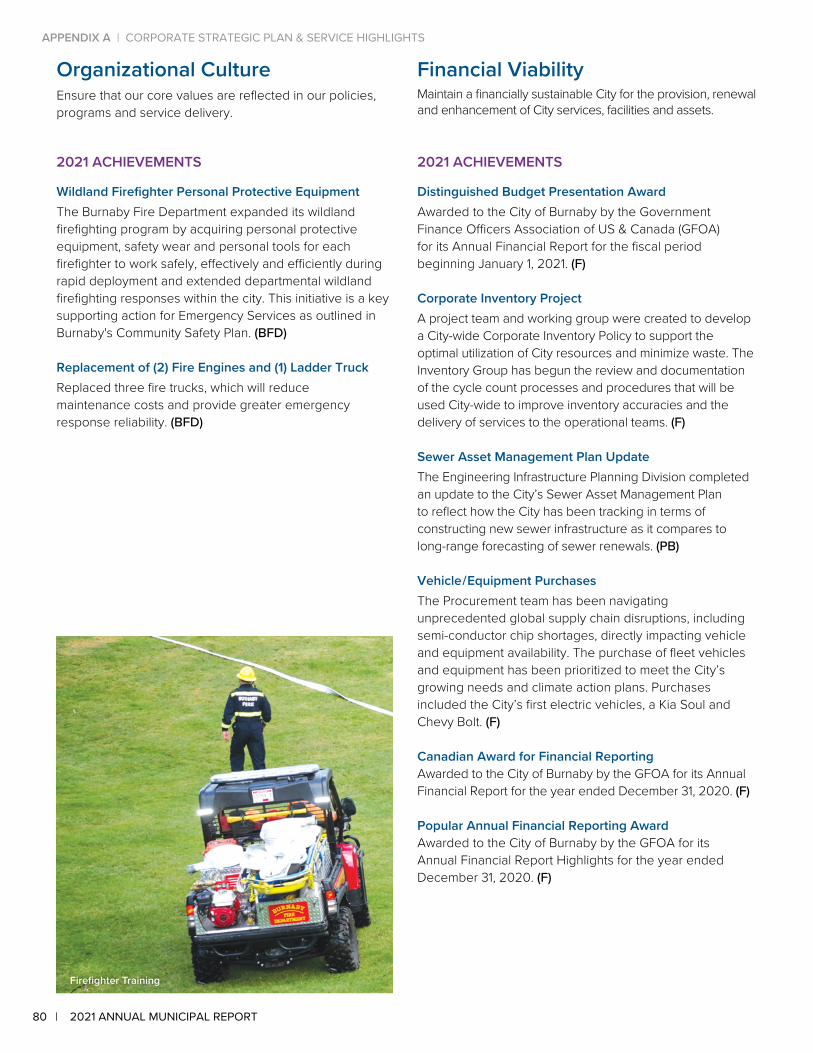
Organizational CultureEnsure that our core values are reflected in our policies, programs and service delivery.
2021 ACHIEVEMENTS
Wildland Firefighter Personal Protective EquipmentThe Burnaby Fire Department expanded its wildland firefighting program by acquiring personal protective equipment, safety wear and personal tools for each firefighter to work safely, effectively and efficiently during rapid deployment and extended departmental wildland firefighting responses within the city. This initiative is a key supporting action for Emergency Services as outlined in Burnaby's Community Safety Plan. (BFD)
Replacement of (2) Fire Engines and (1) Ladder TruckReplaced three fire trucks, which will reduce maintenance costs and provide greater emergency response reliability. (BFD)
2021 ACHIEVEMENTS
Distinguished Budget Presentation AwardAwarded to the City of Burnaby by the Government Finance Officers Association of US & Canada (GFOA) for its Annual Financial Report for the fiscal period beginning January 1, 2021. (F)
Corporate Inventory ProjectA project team and working group were created to develop a City-wide Corporate Inventory Policy to support the optimal utilization of City resources and minimize waste. The Inventory Group has begun the review and documentation of the cycle count processes and procedures that will be used City-wide to improve inventory accuracies and the delivery of services to the operational teams. (F)
Sewer Asset Management Plan UpdateThe Engineering Infrastructure Planning Division completed an update to the City’s Sewer Asset Management Plan to reflect how the City has been tracking in terms of constructing new sewer infrastructure as it compares to long-range forecasting of sewer renewals. (PB)
Vehicle / Equipment PurchasesThe Procurement team has been navigating unprecedented global supply chain disruptions, including semi-conductor chip shortages, directly impacting vehicle and equipment availability. The purchase of fleet vehicles and equipment has been prioritized to meet the City’s growing needs and climate action plans. Purchases included the City’s first electric vehicles, a Kia Soul and Chevy Bolt. (F)
Canadian Award for Financial ReportingAwarded to the City of Burnaby by the GFOA for its Annual Financial Report for the year ended December 31, 2020. (F)
Popular Annual Financial Reporting AwardAwarded to the City of Burnaby by the GFOA for its Annual Financial Report Highlights for the year ended December 31, 2020. (F)
Firefighter Training
Financial ViabilityMaintain a financially sustainable City for the provision, renewal and enhancement of City services, facilities and assets.
80 | 2021 ANNUAL MUNICIPAL REPORT
APPENDIX A | CORPORATE STRATEGIC PLAN & SERVICE HIGHLIGHTS
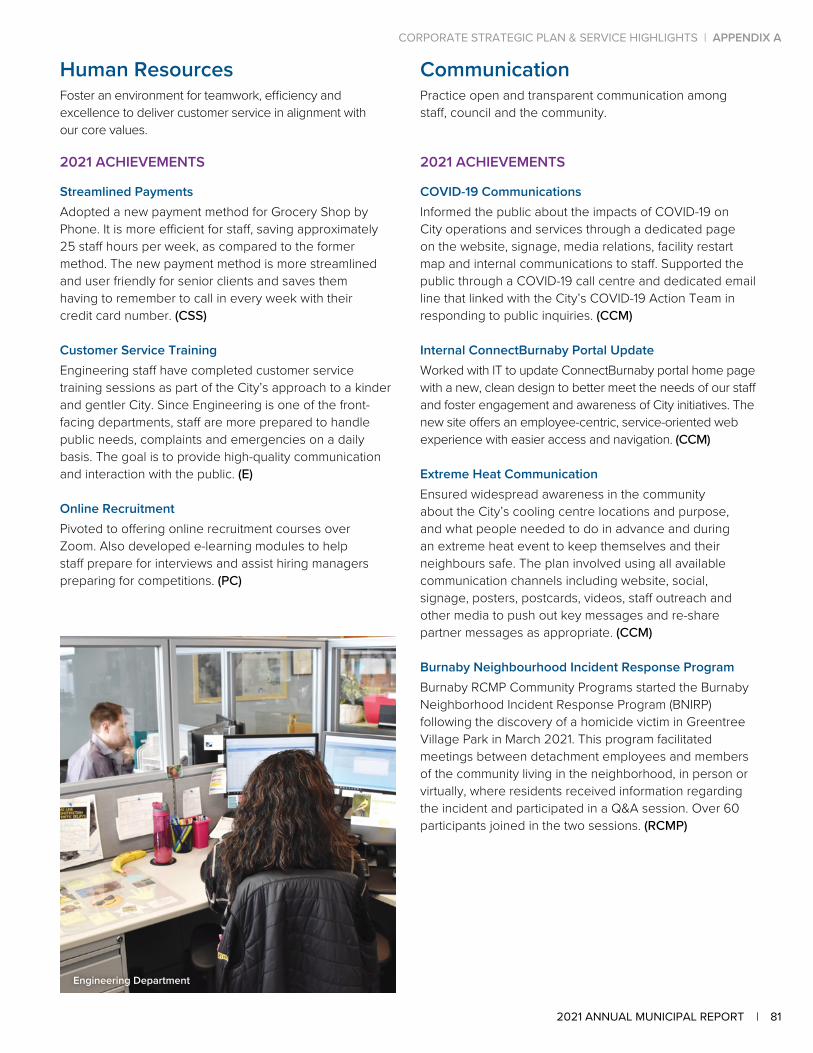
Human ResourcesFoster an environment for teamwork, efficiency and excellence to deliver customer service in alignment with our core values.
2021 ACHIEVEMENTS
Streamlined PaymentsAdopted a new payment method for Grocery Shop by Phone. It is more efficient for staff, saving approximately 25 staff hours per week, as compared to the former method. The new payment method is more streamlined and user friendly for senior clients and saves them having to remember to call in every week with their credit card number. (CSS)
Customer Service TrainingEngineering staff have completed customer service training sessions as part of the City’s approach to a kinder and gentler City. Since Engineering is one of the front-facing departments, staff are more prepared to handle public needs, complaints and emergencies on a daily basis. The goal is to provide high-quality communication and interaction with the public. (E)
Online RecruitmentPivoted to offering online recruitment courses over Zoom. Also developed e-learning modules to help staff prepare for interviews and assist hiring managers preparing for competitions. (PC)
2021 ACHIEVEMENTS
COVID-19 CommunicationsInformed the public about the impacts of COVID-19 on City operations and services through a dedicated page on the website, signage, media relations, facility restart map and internal communications to staff. Supported the public through a COVID-19 call centre and dedicated email line that linked with the City’s COVID-19 Action Team in responding to public inquiries. (CCM)
Internal ConnectBurnaby Portal UpdateWorked with IT to update ConnectBurnaby portal home page with a new, clean design to better meet the needs of our staff and foster engagement and awareness of City initiatives. The new site offers an employee-centric, service-oriented web experience with easier access and navigation. (CCM)
Extreme Heat CommunicationEnsured widespread awareness in the community about the City’s cooling centre locations and purpose, and what people needed to do in advance and during an extreme heat event to keep themselves and their neighbours safe. The plan involved using all available communication channels including website, social, signage, posters, postcards, videos, staff outreach and other media to push out key messages and re-share partner messages as appropriate. (CCM)
Burnaby Neighbourhood Incident Response ProgramBurnaby RCMP Community Programs started the Burnaby Neighborhood Incident Response Program (BNIRP) following the discovery of a homicide victim in Greentree Village Park in March 2021. This program facilitated meetings between detachment employees and members of the community living in the neighborhood, in person or virtually, where residents received information regarding the incident and participated in a Q&A session. Over 60 participants joined in the two sessions. (RCMP)
Engineering Department
CommunicationPractice open and transparent communication among staff, council and the community.
STRATEGIC GOAL 1 | CORPORATE STRATEGIC PLAN & SERVICE HIGHLIGHTS | APPENDIX A
812021 ANNUAL MUNICIPAL REPORT |
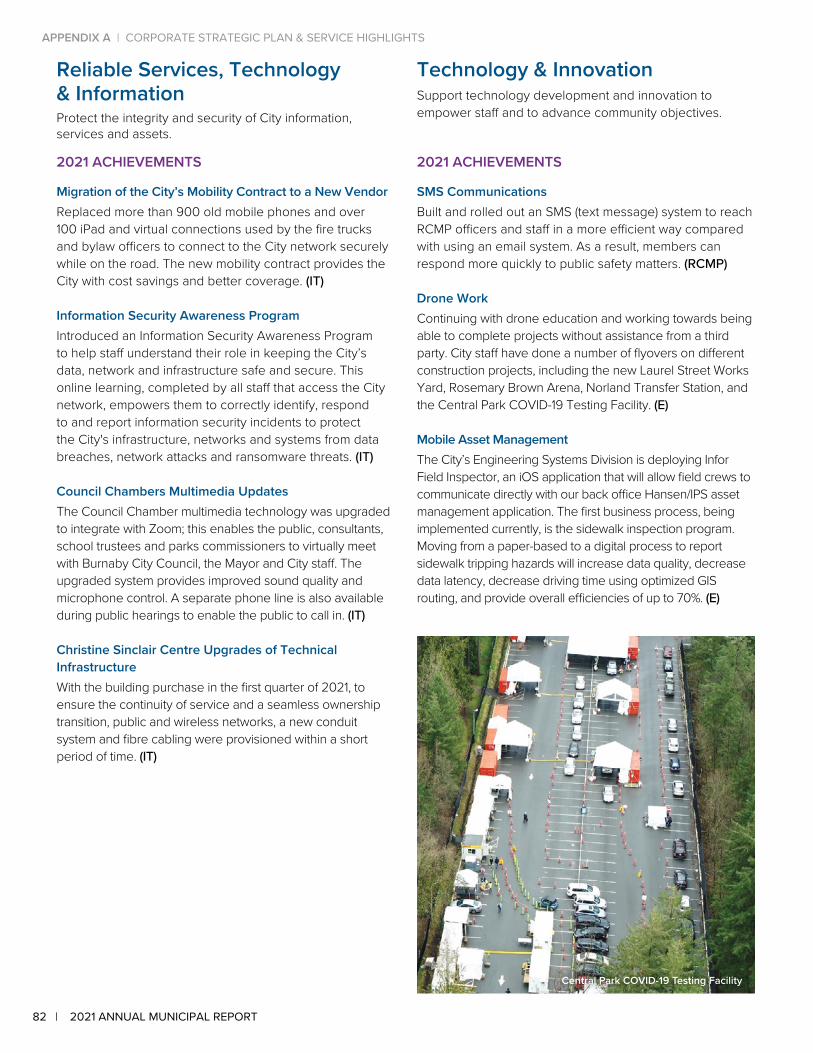
Reliable Services, Technology & InformationProtect the integrity and security of City information, services and assets.
2021 ACHIEVEMENTS
Migration of the City’s Mobility Contract to a New VendorReplaced more than 900 old mobile phones and over 100 iPad and virtual connections used by the fire trucks and bylaw officers to connect to the City network securely while on the road. The new mobility contract provides the City with cost savings and better coverage. (IT)
Information Security Awareness ProgramIntroduced an Information Security Awareness Program to help staff understand their role in keeping the City’s data, network and infrastructure safe and secure. This online learning, completed by all staff that access the City network, empowers them to correctly identify, respond to and report information security incidents to protect the City's infrastructure, networks and systems from data breaches, network attacks and ransomware threats. (IT)
Council Chambers Multimedia UpdatesThe Council Chamber multimedia technology was upgraded to integrate with Zoom; this enables the public, consultants, school trustees and parks commissioners to virtually meet with Burnaby City Council, the Mayor and City staff. The upgraded system provides improved sound quality and microphone control. A separate phone line is also available during public hearings to enable the public to call in. (IT)
Christine Sinclair Centre Upgrades of Technical InfrastructureWith the building purchase in the first quarter of 2021, to ensure the continuity of service and a seamless ownership transition, public and wireless networks, a new conduit system and fibre cabling were provisioned within a short period of time. (IT)
2021 ACHIEVEMENTS
SMS Communications Built and rolled out an SMS (text message) system to reach RCMP officers and staff in a more efficient way compared with using an email system. As a result, members can respond more quickly to public safety matters. (RCMP)
Drone WorkContinuing with drone education and working towards being able to complete projects without assistance from a third party. City staff have done a number of flyovers on different construction projects, including the new Laurel Street Works Yard, Rosemary Brown Arena, Norland Transfer Station, and the Central Park COVID-19 Testing Facility. (E)
Mobile Asset ManagementThe City’s Engineering Systems Division is deploying Infor Field Inspector, an iOS application that will allow field crews to communicate directly with our back office Hansen/IPS asset management application. The first business process, being implemented currently, is the sidewalk inspection program. Moving from a paper-based to a digital process to report sidewalk tripping hazards will increase data quality, decrease data latency, decrease driving time using optimized GIS routing, and provide overall efficiencies of up to 70%. (E)
Technology & InnovationSupport technology development and innovation to empower staff and to advance community objectives.
Central Park COVID-19 Testing Facility
82 | 2021 ANNUAL MUNICIPAL REPORT
APPENDIX A | CORPORATE STRATEGIC PLAN & SERVICE HIGHLIGHTS

2021 Annual Municipal ReportCity of Burnaby, British Columbia, Canada
Top Related
Copyright © 2022 FDOKUMEN

