


Bahasa
Halaman
Hukum


RN20023EN14GLN1
(E)GPRS BSS Dimensioning and Planning
1
1 © Nokia Siemens Networks RNM20023EN14GLN1
RN 2002(E)GPRS Explain: Chapter 3(E) GPRS BSS Dimensioning and Planning
RN20023EN14GLN1
(E)GPRS BSS Dimensioning and Planning
2
2 © Nokia Siemens Networks RN20023EN14GLN1
Legal Notice
Intellectual Property Rights
All copyrights and intellectual property rights for Nokia Siemens Networks training documentation, product documentation and slide presentation material, all of which are forthwith known as Nokia Siemens Networks training material, are the exclusive property of Nokia Siemens Networks . Nokia Siemens Networks owns the rights to copying, modification, translation, adaptation or derivatives including any improvements or developments. Nokia Siemens Networks has the sole right to copy, distribute, amend, modify, develop, license, sublicense, sell, transfer and assign the Nokia Siemens Networks training material.
Individuals can use the Nokia Siemens Networks training material for their own personal self-development only, those same individuals cannot subsequently pass on that same Intellectual Property to others without the prior written agreement of Nokia Siemens Networks .
The Nokia Siemens Networks training material cannot be used outside of an agreed Nokia Siemens Networks training session for development of groups without the prior written agreement of Nokia Siemens Networks.
RN20023EN14GLN1
(E)GPRS BSS Dimensioning and Planning
3
3 © Nokia Siemens Networks RN20023EN14GLN1
Module objectives
After completing this learning element, the participant will be able to:
Theory:
• Describe the Coverage Planning and Link Budget process • Know different ways to deploy (E)GPRS in the Network • Explain the main steps for the Dimensioning of the EGPRS system• Explain the impact of different features on the dimensioning process• Describe the connectivity limits of different PCU and BSC versions• Calculate the required number of PCUs• Calculate an example for a given scenario• Evaluate the impacts of Mobility planning

RN20023EN14GLN1
(E)GPRS BSS Dimensioning and Planning
4
4 © Nokia Siemens Networks RN20023EN14GLN1
Network Dimensioning and Planning - Content
Coverage and Interference Planning
Capacity Planning (Deployment, TSL Data Rate and BSS connectivity)
Dimensioning Example
Mobility Planning
RN20023EN14GLN1
(E)GPRS BSS Dimensioning and Planning
5
5 © Nokia Siemens Networks RN20023EN14GLN1
(E)GPRS Coverage Planning and Link Budget
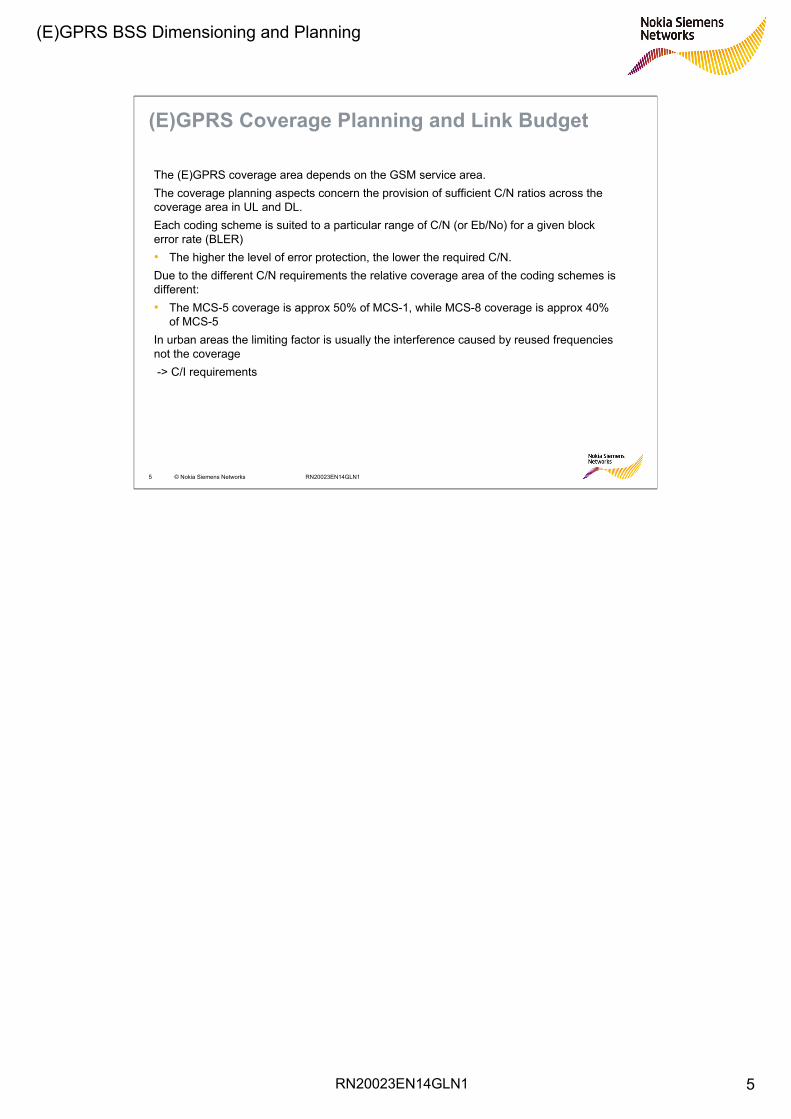
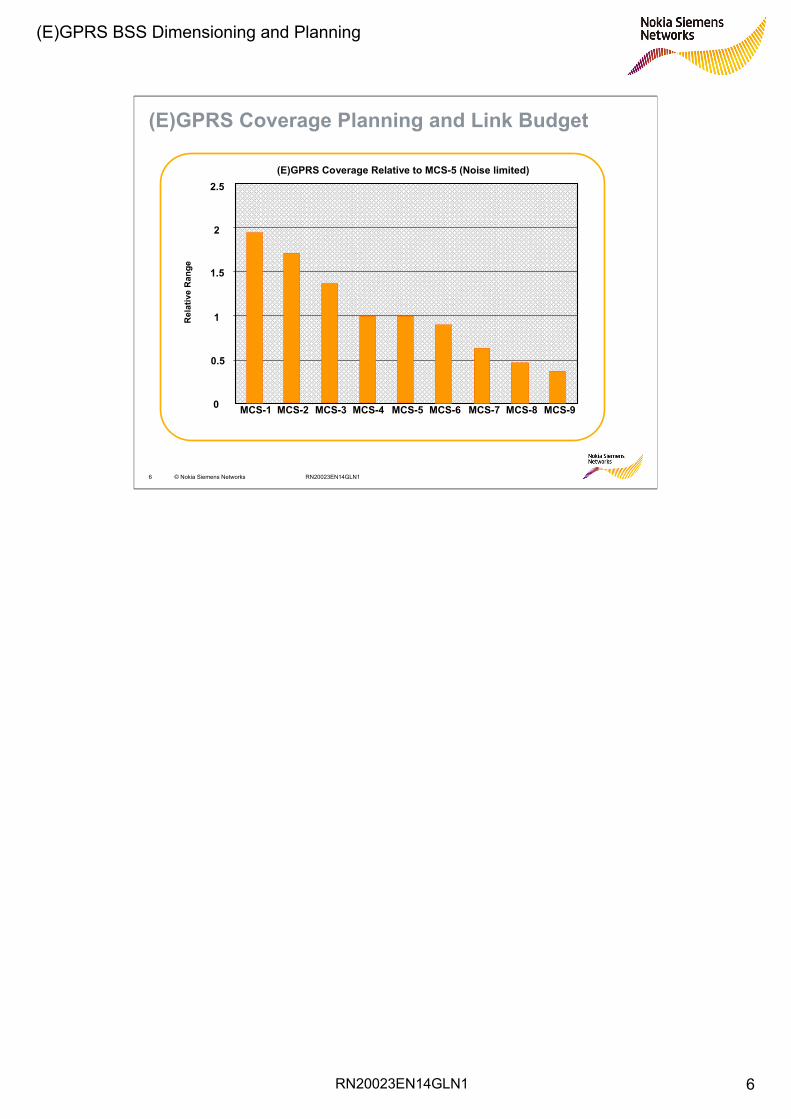
The (E)GPRS coverage area depends on the GSM service area.The coverage planning aspects concern the provision of sufficient C/N ratios across the coverage area in UL and DL.Each coding scheme is suited to a particular range of C/N (or Eb/No) for a given block error rate (BLER)• The higher the level of error protection, the lower the required C/N.Due to the different C/N requirements the relative coverage area of the coding schemes is different:• The MCS-5 coverage is approx 50% of MCS-1, while MCS-8 coverage is approx 40%
of MCS-5In urban areas the limiting factor is usually the interference caused by reused frequencies not the coverage-> C/I requirements
RN20023EN14GLN1
(E)GPRS BSS Dimensioning and Planning
6
6 © Nokia Siemens Networks RN20023EN14GLN1
(E)GPRS Coverage Planning and Link Budget
(E)GPRS Coverage Relative to MCS-5 (Noise limited)2.5
2
1.5
1
0.5
0
Rel
ativ
e R
ange
MCS-1 MCS-2 MCS-3 MCS-4 MCS-5 MCS-6 MCS-7 MCS-8 MCS-9
RN20023EN14GLN1
(E)GPRS BSS Dimensioning and Planning
7
7 © Nokia Siemens Networks RN20023EN14GLN1
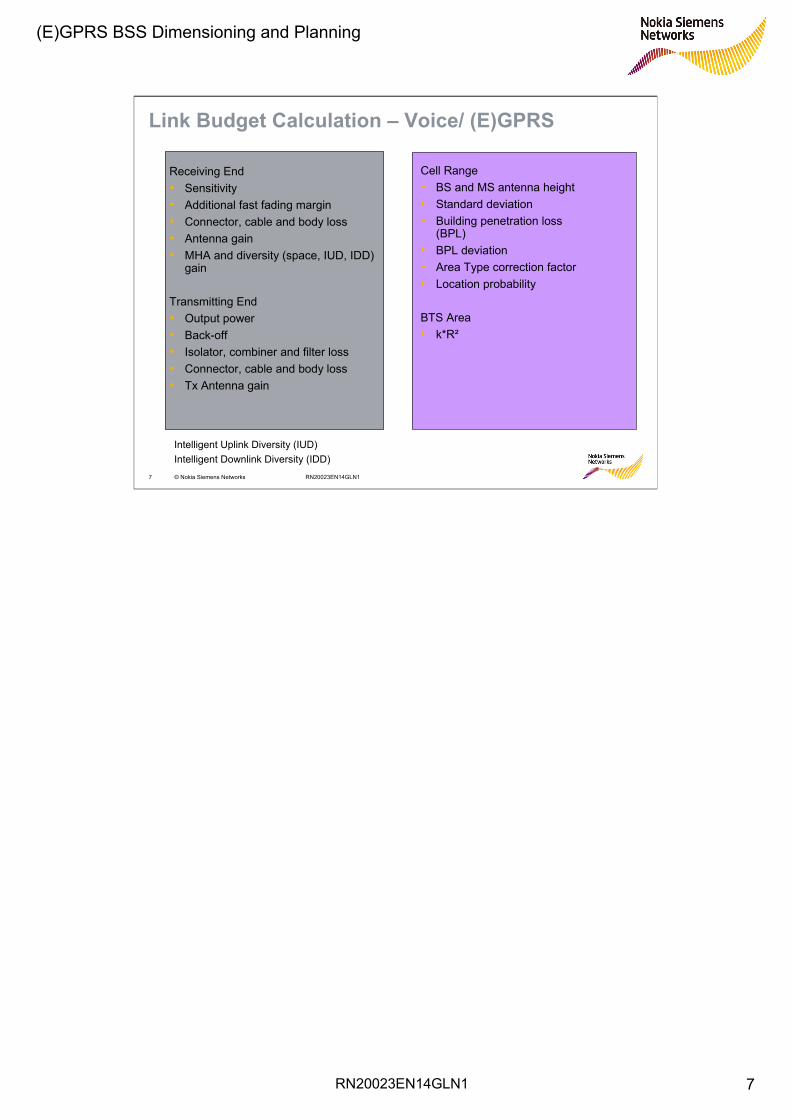
Link Budget Calculation – Voice/ (E)GPRS
Receiving End• Sensitivity• Additional fast fading margin• Connector, cable and body loss• Antenna gain• MHA and diversity (space, IUD, IDD)
gain
Transmitting End• Output power• Back-off• Isolator, combiner and filter loss• Connector, cable and body loss• Tx Antenna gain
Cell Range• BS and MS antenna height• Standard deviation• Building penetration loss
(BPL)• BPL deviation• Area Type correction factor• Location probability
BTS Area• k*R²
Intelligent Uplink Diversity (IUD)Intelligent Downlink Diversity (IDD)
RN20023EN14GLN1
(E)GPRS BSS Dimensioning and Planning
8
8 © Nokia Siemens Networks RN20023EN14GLN1
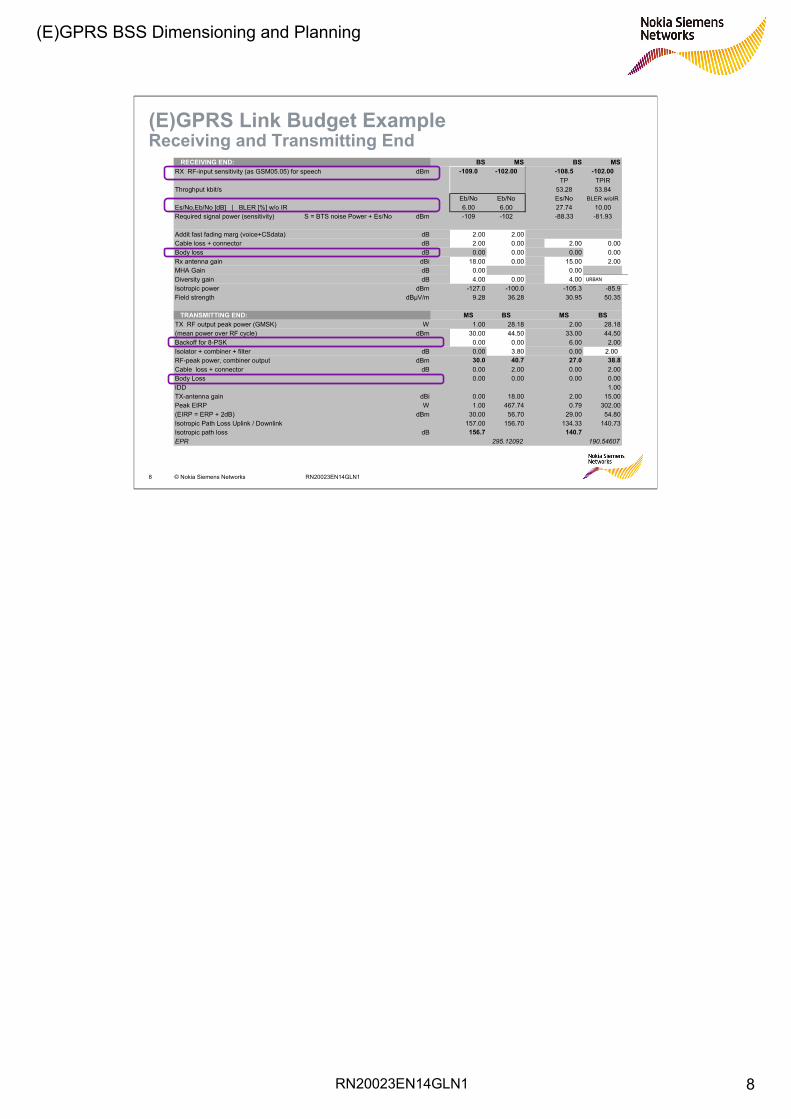
(E)GPRS Link Budget ExampleReceiving and Transmitting End
RECEIVING END: BS MS BS MSRX RF-input sensitivity (as GSM05.05) for speech dBm -109.0 -102.00 -108.5 -102.00
TP TPIRThroghput kbit/s 53.28 53.84
Eb/No Eb/No Es/No BLER w/oIREs/No,Eb/No [dB] | BLER [%] w/o IR 6.00 6.00 27.74 10.00Required signal power (sensitivity) S = BTS noise Power + Es/No dBm -109 -102 -88.33 -81.93
Addit fast fading marg (voice+CSdata) dB 2.00 2.00Cable loss + connector dB 2.00 0.00 2.00 0.00Body loss dB 0.00 0.00 0.00 0.00Rx antenna gain dBi 18.00 0.00 15.00 2.00MHA Gain dB 0.00 0.00Diversity gain dB 4.00 0.00 4.00 1.00Isotropic power dBm -127.0 -100.0 -105.3 -85.9Field strength dBµV/m 9.28 36.28 30.95 50.35
TRANSMITTING END: MS BS MS BSTX RF output peak power (GMSK) W 1.00 28.18 2.00 28.18(mean power over RF cycle) dBm 30.00 44.50 33.00 44.50Backoff for 8-PSK 0.00 0.00 6.00 2.00Isolator + combiner + filter dB 0.00 3.80 0.00 2.00RF-peak power, combiner output dBm 30.0 40.7 27.0 38.8Cable loss + connector dB 0.00 2.00 0.00 2.00Body Loss 0.00 0.00 0.00 0.00IDD 1.00TX-antenna gain dBi 0.00 18.00 2.00 15.00Peak EIRP W 1.00 467.74 0.79 302.00(EIRP = ERP + 2dB) dBm 30.00 56.70 29.00 54.80Isotropic Path Loss Uplink / Downlink 157.00 156.70 134.33 140.73Isotropic path loss dB 156.7 140.7EPR 295.12092 190.54607
URBAN
RN20023EN14GLN1
(E)GPRS BSS Dimensioning and Planning
9
9 © Nokia Siemens Networks RN20023EN14GLN1
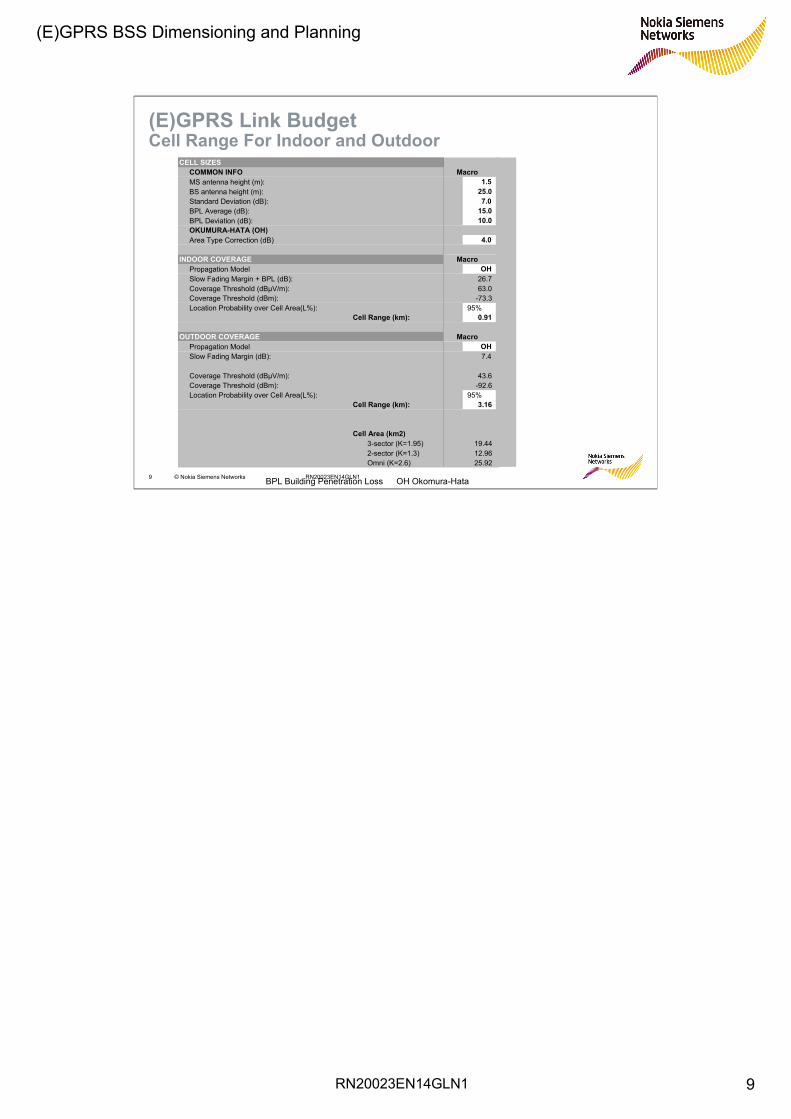
(E)GPRS Link Budget Cell Range For Indoor and Outdoor
CELL SIZESCOMMON INFO MacroMS antenna height (m): 1.5BS antenna height (m): 25.0Standard Deviation (dB): 7.0BPL Average (dB): 15.0BPL Deviation (dB): 10.0OKUMURA-HATA (OH)Area Type Correction (dB) 4.0
INDOOR COVERAGE MacroPropagation Model OHSlow Fading Margin + BPL (dB): 26.7Coverage Threshold (dBµV/m): 63.0Coverage Threshold (dBm): -73.3Location Probability over Cell Area(L%): 95%
Cell Range (km): 0.91
OUTDOOR COVERAGE MacroPropagation Model OHSlow Fading Margin (dB): 7.4
Coverage Threshold (dBµV/m): 43.6Coverage Threshold (dBm): -92.6Location Probability over Cell Area(L%): 95%
Cell Range (km): 3.16
Cell Area (km2)3-sector (K=1.95) 19.442-sector (K=1.3) 12.96Omni (K=2.6) 25.92
BPL Building Penetration Loss OH Okomura-Hata

RN20023EN14GLN1
(E)GPRS BSS Dimensioning and Planning
10
10 © Nokia Siemens Networks RN20023EN14GLN1
(E)GPRS Link Budget Reference sensitivities
-99-100-99-97.5-102dBmUSF/MCS-5 to 9
dBm
dBm
dBm
dBm
dBm
-86
-90.5
-93
-96
-98
staticPropagation conditions
-78.5**
-83**
-84
-91
-93
TU50 (no FH)
-78.5**
-83**
-84
-91.5
-94
TU50 (ideal FH)
*
*
*
-88
-93
RA250 (no FH)
*PDTCH/MCS-9
Type ofchannel HT100 (no
FH)
*PDTCH/MCS-8
-83** PDTCH/MCS-7
-89PDTCH/MCS-6
-92PDTCH/MCS-5
GSM 900 and GSM 850
The reference sensitivity performance with 10 % BLER are defined in 3GPP 45.005 (new version of GSM 05.05) for GPRS and EGPRS using GMSK or 8PSK for MS or BTS for different channel types and different propagation conditions and different bands:
* cannot be measured** in the table refers to a 30% block error rate
Example for MS (DL) for EGPRS using 8PSK
Table is onlyExample!There are
much morein
3GPP 45.005

RN20023EN14GLN1
(E)GPRS BSS Dimensioning and Planning
11
11 © Nokia Siemens Networks RN20023EN14GLN1
Frequency Planning: Timeslot capacity
Non-optimum protocols can reduce further the effective user throughput for some services (TCP based)
EGPRS
Peak throughput
1 TSL
TSL Capacity
C/I distribution59.2 Kbps
TSL sharingAverage user throughput
per allocated TSL
Especially for EGPRS the individual user throughput depends a lot of the environment. In the planning process, one can estimate the average Carrier over Interference level in a certain Cell and determine the Timeslot capacity. Other factors, which can lead to a reduction of the individual user throughput come from Timeslot sharing. In the dimensioning process the main focus is on cell level throughput and not user related so that these effects can be neglected.In case of GPRS with CS 1 and 2 there is almost no reduction due to C/I

RN20023EN14GLN1
(E)GPRS BSS Dimensioning and Planning
12
12 © Nokia Siemens Networks RN20023EN14GLN1
Frequency Planning: GPRS
02468
10121416
0 5 10 15 20 25C/I
kbps
CS-1
CS-2CS-3
CS-4
Minimum Average
TypicalNW C/I
Through-put for 1 TimeslotRelative cell radius of different GPRS
Coding Schemes (CS1=100%)
100
8171
45
8474
67
52
0
20
40
60
80
100
CS1 CS2 CS3 CS4
Hopping
Non Hopping
Simulations
RN20023EN14GLN1
(E)GPRS BSS Dimensioning and Planning
13
13 © Nokia Siemens Networks RN20023EN14GLN1
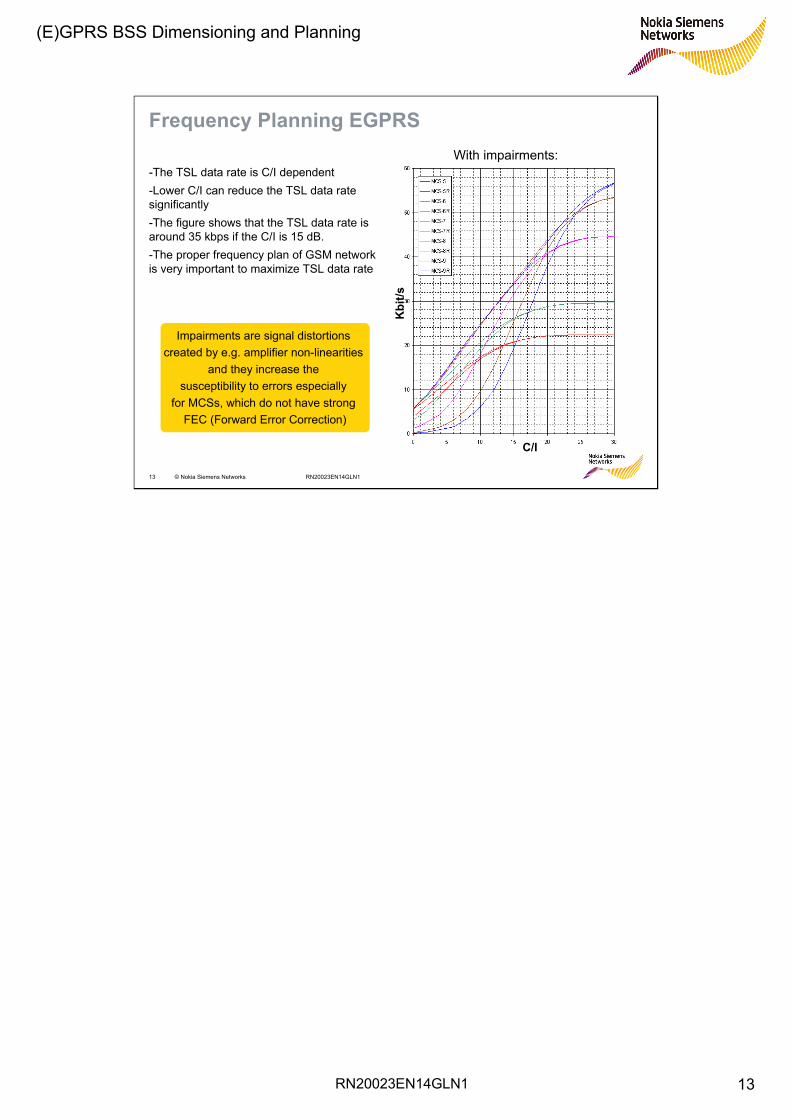
Frequency Planning EGPRS
-The TSL data rate is C/I dependent-Lower C/I can reduce the TSL data rate significantly-The figure shows that the TSL data rate is around 35 kbps if the C/I is 15 dB.-The proper frequency plan of GSM network is very important to maximize TSL data rate
C/I
Kbi
t/s
With impairments:
Impairments are signal distortions created by e.g. amplifier non-linearities
and they increase the susceptibility to errors especially
for MCSs, which do not have strong FEC (Forward Error Correction)
RN20023EN14GLN1
(E)GPRS BSS Dimensioning and Planning
14
14 © Nokia Siemens Networks RN20023EN14GLN1
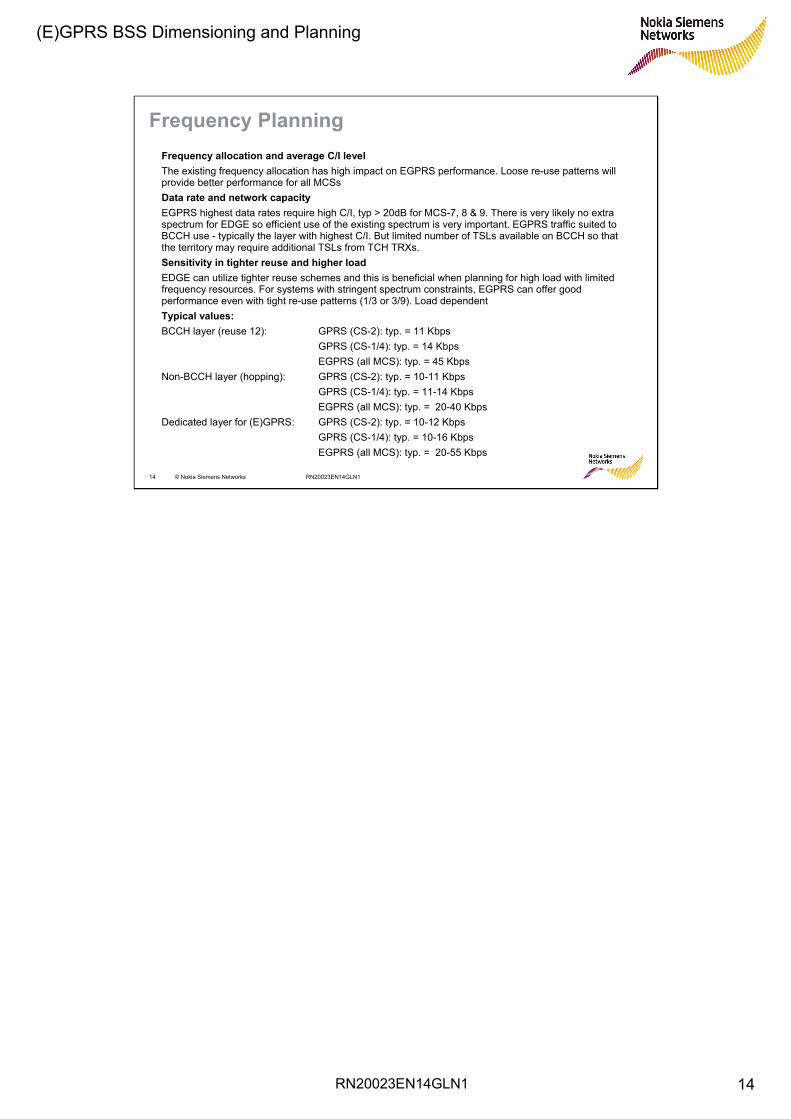
Frequency PlanningFrequency allocation and average C/I levelThe existing frequency allocation has high impact on EGPRS performance. Loose re-use patterns will provide better performance for all MCSsData rate and network capacityEGPRS highest data rates require high C/I, typ > 20dB for MCS-7, 8 & 9. There is very likely no extra spectrum for EDGE so efficient use of the existing spectrum is very important. EGPRS traffic suited to BCCH use - typically the layer with highest C/I. But limited number of TSLs available on BCCH so that the territory may require additional TSLs from TCH TRXs.Sensitivity in tighter reuse and higher loadEDGE can utilize tighter reuse schemes and this is beneficial when planning for high load with limited frequency resources. For systems with stringent spectrum constraints, EGPRS can offer good performance even with tight re-use patterns (1/3 or 3/9). Load dependentTypical values:BCCH layer (reuse 12): GPRS (CS-2): typ. = 11 Kbps
GPRS (CS-1/4): typ. = 14 KbpsEGPRS (all MCS): typ. = 45 Kbps
Non-BCCH layer (hopping): GPRS (CS-2): typ. = 10-11 KbpsGPRS (CS-1/4): typ. = 11-14 KbpsEGPRS (all MCS): typ. = 20-40 Kbps
Dedicated layer for (E)GPRS: GPRS (CS-2): typ. = 10-12 KbpsGPRS (CS-1/4): typ. = 10-16 KbpsEGPRS (all MCS): typ. = 20-55 Kbps

RN20023EN14GLN1
(E)GPRS BSS Dimensioning and Planning
15
15 © Nokia Siemens Networks RN20023EN14GLN1
0
10
20
30
40
50
60
1 2 3 4 5 6 7 8 9 10 11
Pathloss distance [km]
DL
Thro
ughp
utpe
r TSL
[Kbp
s] EGPRSGPRS CS1-2GPRS CS1-4
EGPRS and GPRS Coverage – Comparison
Es/No=8.3 dB
Es/No=42.3 dBPath loss [dB]
120.8 132.1 138.8 143.5 147.1 150.1 152.6 154.8 156.7 158.4 160.0
Average gain: 2.3
Average gain: 3.6
RN20023EN14GLN1
(E)GPRS BSS Dimensioning and Planning
16
16 © Nokia Siemens Networks RN20023EN14GLN1
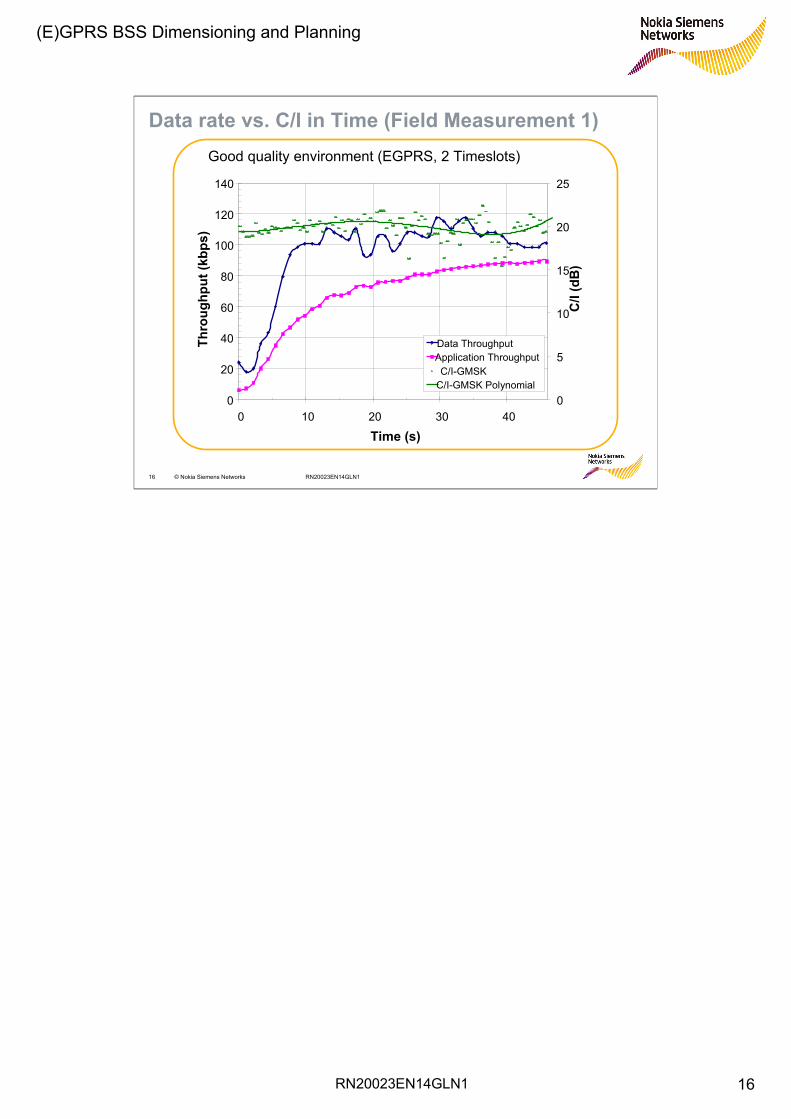
Data rate vs. C/I in Time (Field Measurement 1)Good quality environment (EGPRS, 2 Timeslots)
0
20
40
60
80
100
120
140
0 10 20 30 40
Time (s)
Thro
ughp
ut (k
bps)
0
5
10
15
20
25
C/I
(dB
)
Data ThroughputApplication ThroughputC/I-GMSK
C/I-GMSK Polynomial

RN20023EN14GLN1
(E)GPRS BSS Dimensioning and Planning
17
17 © Nokia Siemens Networks RN20023EN14GLN1
Data rate vs. C/I in Time (Field Measurement 2)Average quality environment (EGPRS, 2 Timeslots)
0
20
40
60
80
100
120
0 10 20 30 40 50 60 70
Time (s)
Thro
ughp
ut (k
bps)
0
5
10
15
20
25
C/I
(dB
)
Data ThroughputApplication ThroughputC/I-GMSKC/I-GMSK Polynomial
RN20023EN14GLN1
(E)GPRS BSS Dimensioning and Planning
18
18 © Nokia Siemens Networks RN20023EN14GLN1
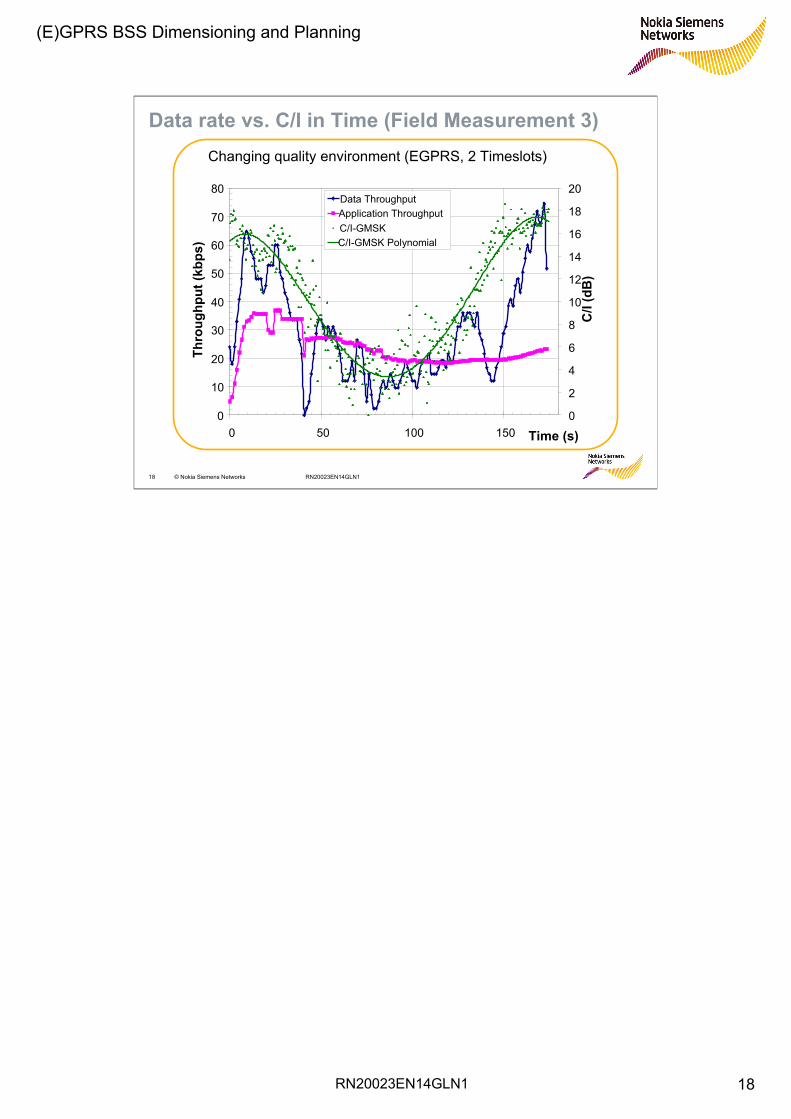
Data rate vs. C/I in Time (Field Measurement 3)Changing quality environment (EGPRS, 2 Timeslots)
0
10
20
30
40
50
60
70
80
0 50 100 150 Time (s)
Thro
ughp
ut (k
bps)
0
2
4
6
8
10
12
14
16
18
20
C/I
(dB
)
Data ThroughputApplication ThroughputC/I-GMSKC/I-GMSK Polynomial
RN20023EN14GLN1
(E)GPRS BSS Dimensioning and Planning
19
19 © Nokia Siemens Networks RN20023EN14GLN1
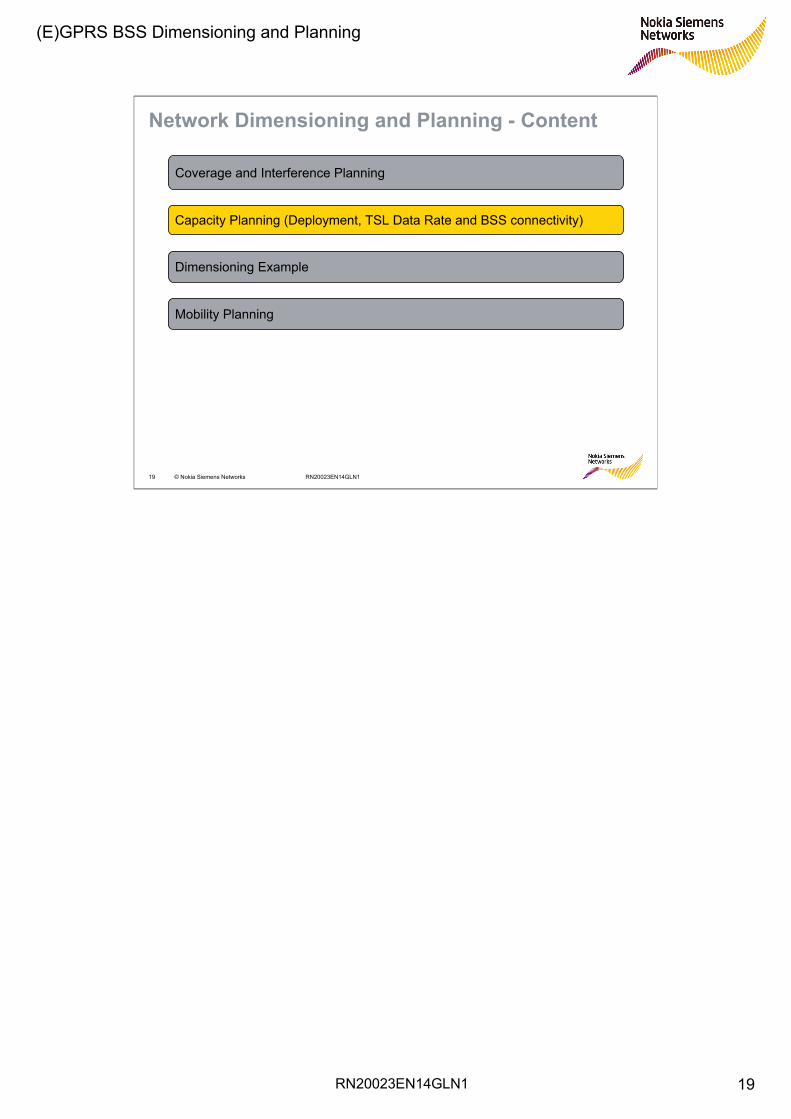
Network Dimensioning and Planning - Content
Coverage and Interference Planning
Capacity Planning (Deployment, TSL Data Rate and BSS connectivity)
Dimensioning Example
Mobility Planning

RN20023EN14GLN1
(E)GPRS BSS Dimensioning and Planning
20
20 © Nokia Siemens Networks RN20023EN14GLN1
The aim behind the preparation of deployment plan is to• adapt the existing network configuration for (E)GPRS• maximize the TSL data rate (RLC/MAC) and multislot usage • minimize the impact of PSW services on CSW services (and vice versa)• take all the hardware and software considerations into account• keep investment controlled
Most of the networks can be described by few cell/segment optionsThe analysis of the different options can give exact picture about the network based on:• Hardware types, software releases• Features, parameters • Current network structure and functionality• Coverage, quality and capacity characteristics of BSS
Deployment Planning
RN20023EN14GLN1
(E)GPRS BSS Dimensioning and Planning
21
21 © Nokia Siemens Networks RN20023EN14GLN1
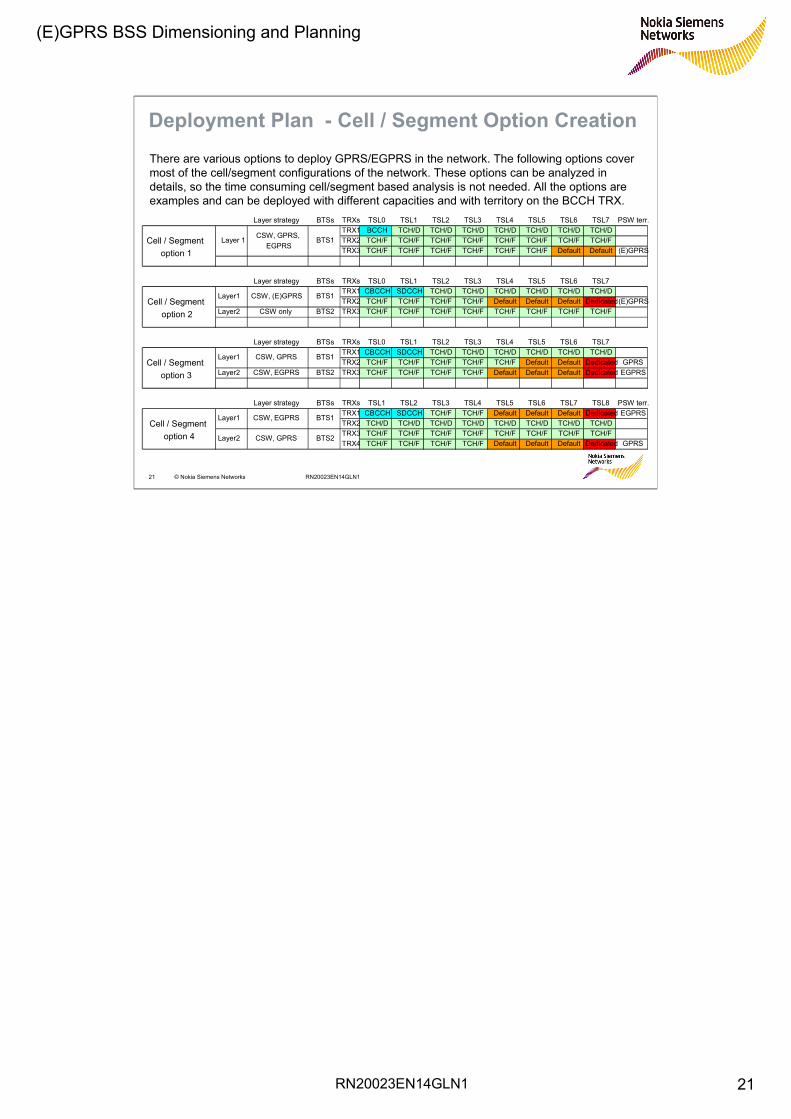
Deployment Plan - Cell / Segment Option Creation
There are various options to deploy GPRS/EGPRS in the network. The following options cover most of the cell/segment configurations of the network. These options can be analyzed in details, so the time consuming cell/segment based analysis is not needed. All the options are examples and can be deployed with different capacities and with territory on the BCCH TRX.
Layer strategy BTSs TRXs TSL0 TSL1 TSL2 TSL3 TSL4 TSL5 TSL6 TSL7 PSW terr.TRX1 BCCH TCH/D TCH/D TCH/D TCH/D TCH/D TCH/D TCH/DTRX2 TCH/F TCH/F TCH/F TCH/F TCH/F TCH/F TCH/F TCH/FTRX3 TCH/F TCH/F TCH/F TCH/F TCH/F TCH/F Default Default (E)GPRS
Layer strategy BTSs TRXs TSL0 TSL1 TSL2 TSL3 TSL4 TSL5 TSL6 TSL7TRX1 CBCCH SDCCH TCH/D TCH/D TCH/D TCH/D TCH/D TCH/DTRX2 TCH/F TCH/F TCH/F TCH/F Default Default Default Dedicated(E)GPRS
Layer2 CSW only BTS2 TRX3 TCH/F TCH/F TCH/F TCH/F TCH/F TCH/F TCH/F TCH/F
Layer strategy BTSs TRXs TSL0 TSL1 TSL2 TSL3 TSL4 TSL5 TSL6 TSL7TRX1 CBCCH SDCCH TCH/D TCH/D TCH/D TCH/D TCH/D TCH/DTRX2 TCH/F TCH/F TCH/F TCH/F TCH/F Default Default Dedicated GPRS
Layer2 CSW, EGPRS BTS2 TRX3 TCH/F TCH/F TCH/F TCH/F Default Default Default Dedicated EGPRS
Layer strategy BTSs TRXs TSL1 TSL2 TSL3 TSL4 TSL5 TSL6 TSL7 TSL8 PSW terr.TRX1 CBCCH SDCCH TCH/F TCH/F Default Default Default Dedicated EGPRSTRX2 TCH/D TCH/D TCH/D TCH/D TCH/D TCH/D TCH/D TCH/DTRX3 TCH/F TCH/F TCH/F TCH/F TCH/F TCH/F TCH/F TCH/FTRX4 TCH/F TCH/F TCH/F TCH/F Default Default Default Dedicated GPRS
Cell / Segmentoption 2
BTS1CSW, GPRS, EGPRS
Layer 1Cell / Segment option 1
BTS1
BTS1Cell / Segment
option 4
CSW, EGPRS
Cell / Segment option 3
Layer1
Layer1 CSW, GPRS
CSW, GPRSLayer2 BTS2
Layer1 CSW, (E)GPRS BTS1
RN20023EN14GLN1
(E)GPRS BSS Dimensioning and Planning
22
22 © Nokia Siemens Networks RN20023EN14GLN1
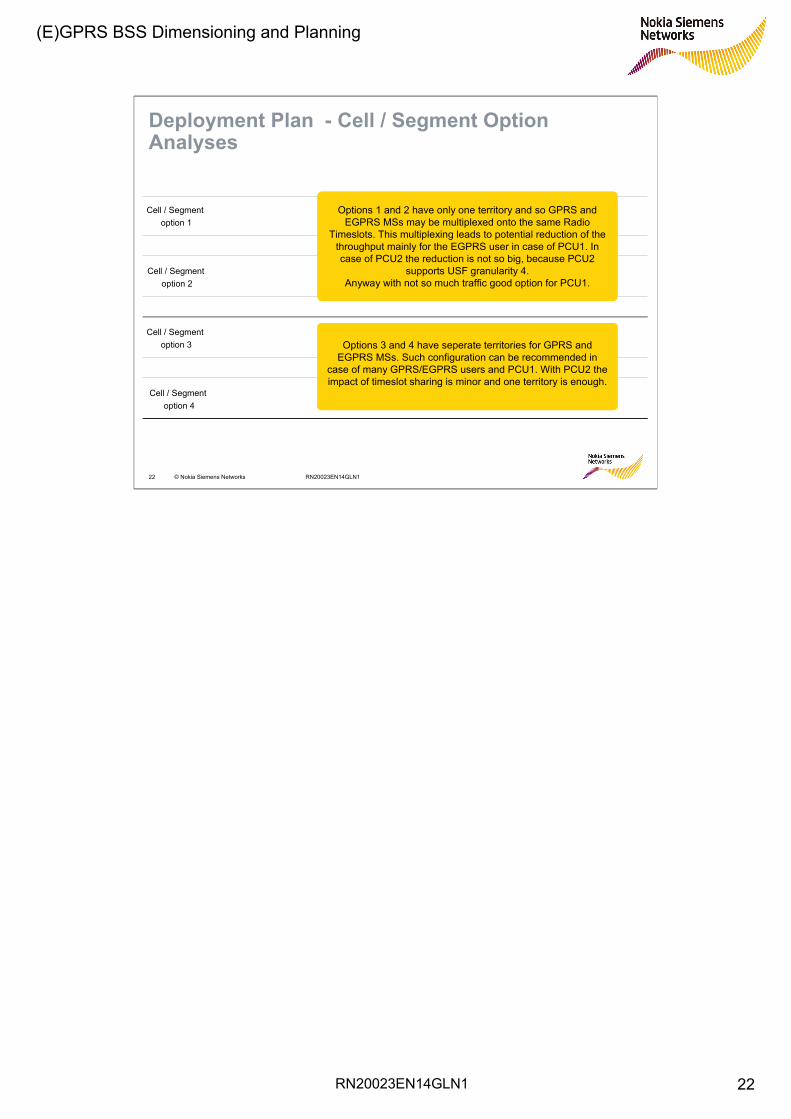
Deployment Plan - Cell / Segment Option Analyses
Cell / Segmentoption 2
Cell / Segment option 1
Cell / Segment option 4
Cell / Segment option 3
Options 1 and 2 have only one territory and so GPRS and EGPRS MSs may be multiplexed onto the same Radio
Timeslots. This multiplexing leads to potential reduction of thethroughput mainly for the EGPRS user in case of PCU1. In case of PCU2 the reduction is not so big, because PCU2
supports USF granularity 4. Anyway with not so much traffic good option for PCU1.
Options 3 and 4 have seperate territories for GPRS and EGPRS MSs. Such configuration can be recommended in
case of many GPRS/EGPRS users and PCU1. With PCU2 theimpact of timeslot sharing is minor and one territory is enough.

RN20023EN14GLN1
(E)GPRS BSS Dimensioning and Planning
23
23 © Nokia Siemens Networks RN20023EN14GLN1
Deployment Plan - Cell / Segment Option 1 Detailed Analysis
Layer strategy• No multiBCF/CBCCH• GPRS and EGPRS in one territory – data rate degradation due to multiplexing• There is not any dedicated territory (CDED) – The implementation of NMO1 is not
recommended, because the MS cannot be served if there is not any GPRS territorySignaling strategy• Combined signaling structure – load check is neededTCH usage (CSW)• TRX1 has TCH/D TSLs - which can lead to heavy signaling. • The CSW calls will be allocated to FR firstly.• AMR packing can provide more capacity for PSW trafficTCH usage (PSW)• CDEF is 2 TSLs only - the 4 TSL DL capable terminals require territory upgrade, which takes
time
RN20023EN14GLN1
(E)GPRS BSS Dimensioning and Planning
24
24 © Nokia Siemens Networks RN20023EN14GLN1
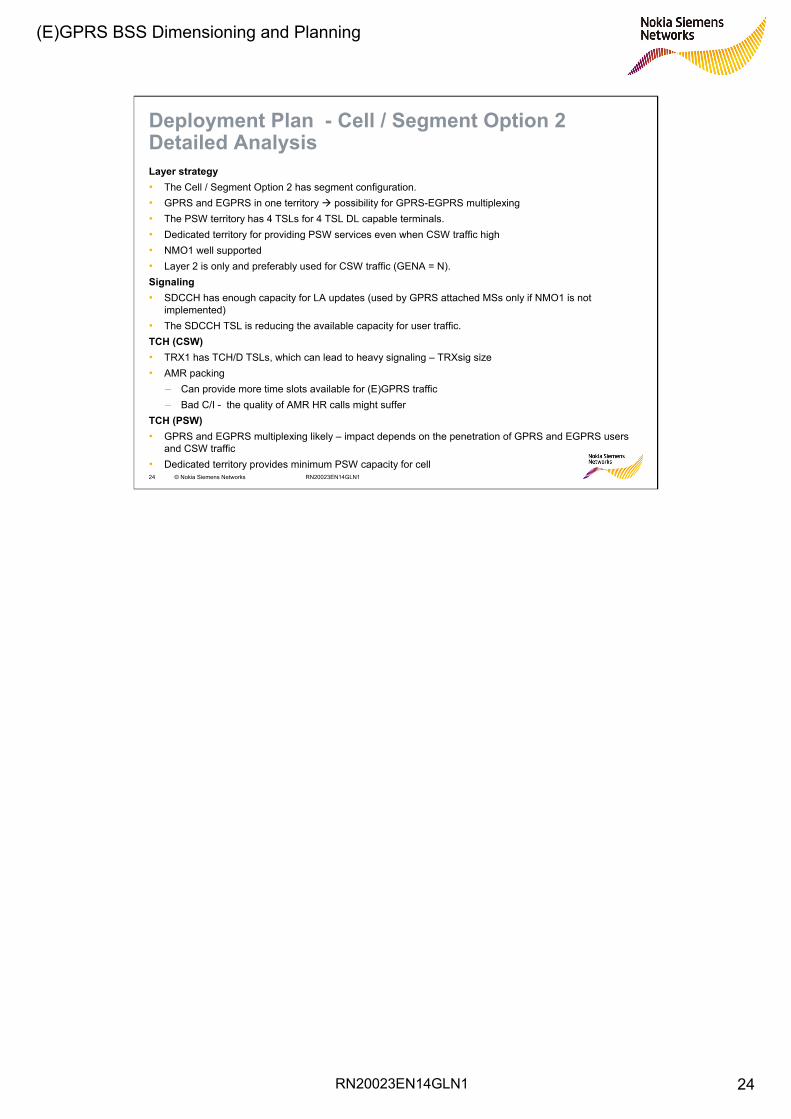
Deployment Plan - Cell / Segment Option 2 Detailed AnalysisLayer strategy• The Cell / Segment Option 2 has segment configuration. • GPRS and EGPRS in one territory possibility for GPRS-EGPRS multiplexing• The PSW territory has 4 TSLs for 4 TSL DL capable terminals.• Dedicated territory for providing PSW services even when CSW traffic high • NMO1 well supported• Layer 2 is only and preferably used for CSW traffic (GENA = N).Signaling• SDCCH has enough capacity for LA updates (used by GPRS attached MSs only if NMO1 is not
implemented)• The SDCCH TSL is reducing the available capacity for user traffic. TCH (CSW)• TRX1 has TCH/D TSLs, which can lead to heavy signaling – TRXsig size• AMR packing
– Can provide more time slots available for (E)GPRS traffic– Bad C/I - the quality of AMR HR calls might suffer
TCH (PSW)• GPRS and EGPRS multiplexing likely – impact depends on the penetration of GPRS and EGPRS users
and CSW traffic• Dedicated territory provides minimum PSW capacity for cell

RN20023EN14GLN1
(E)GPRS BSS Dimensioning and Planning
25
25 © Nokia Siemens Networks RN20023EN14GLN1
Deployment Plan - Cell / Segment Option 3 Detailed AnalysisLayer strategy• The Cell / Segment Option 3 has several BTSs configuration. • GPRS and EGPRS have separated territory GPRS-EGPRS multiplexing less likely• EGPRS has 4 TSLs territory for 4 TSL DL capable terminals.• There is dedicated territory for providing PSW services even in high CSW traffic, too.• NMO1 well supportedSignaling• SDCCH/8 SDCCH has probably enough capacity• The SDCCH TSL is reducing the available capacity for user traffic. TCH (CSW)• TRX1 has TCH/D TSLs, which can lead to heavy signaling – TRXsig size• AMR packing
– More time slots available for (E)GPRS traffic without more hardware – Bad C/I - the quality of AMR HR calls might suffer
TCH (PSW)• Layer1 has GPRS territory only (EGENA = N) with three TSLs. • Layer2 has the EGPRS territory with 4 TSLs, support for 4 RTSL MSs• Less GPRS - EGPRS multiplexing• Both layers have dedicated territory for minimum PSW capacity

RN20023EN14GLN1
(E)GPRS BSS Dimensioning and Planning
26
26 © Nokia Siemens Networks RN20023EN14GLN1
Deployment Plan - Cell / Segment Option 4 Detailed AnalysisLayer strategy• The Cell / Segment Option 3 has segment configuration. • GPRS and EGPRS have separated territory GPRS-EGPRS multiplexing less likely• Both layers have 4 TSLs territory for 4 TSL DL capable terminals.• There is dedicated territory for providing PSW services even in high CSW traffic, too.• NMO1 well supported• EGPRS territory is allocated to TRX1. It is useful if BCCH frequency has good C/ISignaling• The SDCCH has enough capacity • The CSW traffic should be moved from TRX1, because of the limited resources for CSW. • AMR packing
– More time slots available for (E)GPRS traffic without more hardware – Bad C/I - the quality of AMR HR calls might suffer
TCH (CSW)• TRX1 has only two TCH/F TSLs. TCH (PSW)• Layer1 has EGPRS territory (EGENA = Y) with 4 TSLs. • Layer2 has GPRS territory with 4 TSLs support for 4 RTSL MS• Multiplexing is still possible in case of high PSW and CSW traffic, but the possibility is reduced.• Both layers have dedicated territory for minimum PSW capacity
RN20023EN14GLN1
(E)GPRS BSS Dimensioning and Planning
27
27 © Nokia Siemens Networks RN20023EN14GLN1
After the network audit the following has to be calculated:Air Interface Capacity Calculations:• TSL data rate• Multislot usage• Available / required capacity calculationBSS Connectivity Calculations:• PCU calculation• Gb link calculation
- The accuracy of BSS dimensioning depends on the accuracy of the input values- The capacity of the radio interface has a significant role in defining the capacity of the rest of the network elements (BSC, SGSN and transmission interfaces between the different network elements)- Changes in the BTS configurations have direct impact on the BSC and SGSN configuration- The BSC has a limited number of PCUs and each PCU can handle a limited number of BTSs, TRXs and timeslot.
Capacity Calculations
RN20023EN14GLN1
(E)GPRS BSS Dimensioning and Planning
28
28 © Nokia Siemens Networks RN20023EN14GLN1
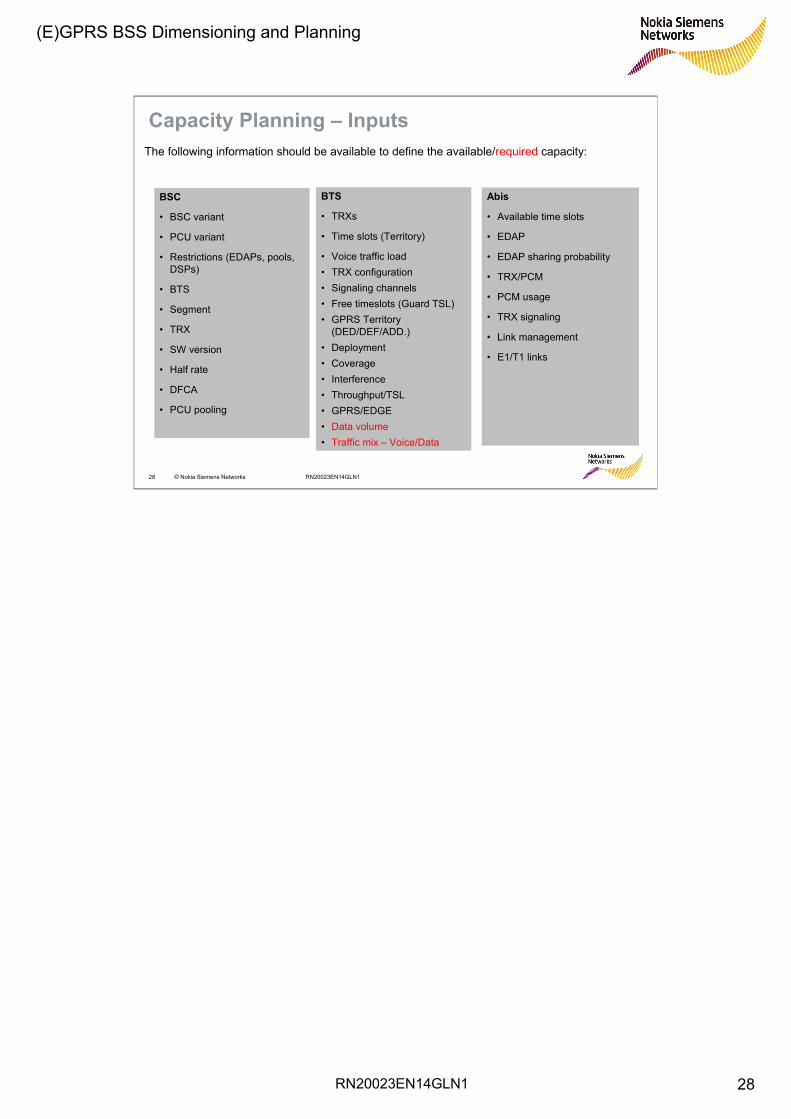
Capacity Planning – InputsThe following information should be available to define the available/required capacity:
BSC
• BSC variant
• PCU variant
• Restrictions (EDAPs, pools, DSPs)
• BTS
• Segment
• TRX
• SW version
• Half rate
• DFCA
• PCU pooling
BTS
• TRXs
• Time slots (Territory)
• Voice traffic load• TRX configuration• Signaling channels• Free timeslots (Guard TSL)• GPRS Territory
(DED/DEF/ADD.)• Deployment• Coverage• Interference• Throughput/TSL• GPRS/EDGE• Data volume• Traffic mix – Voice/Data
Abis
• Available time slots
• EDAP
• EDAP sharing probability
• TRX/PCM
• PCM usage
• TRX signaling
• Link management
• E1/T1 links
RN20023EN14GLN1
(E)GPRS BSS Dimensioning and Planning
29
29 © Nokia Siemens Networks RN20023EN14GLN1
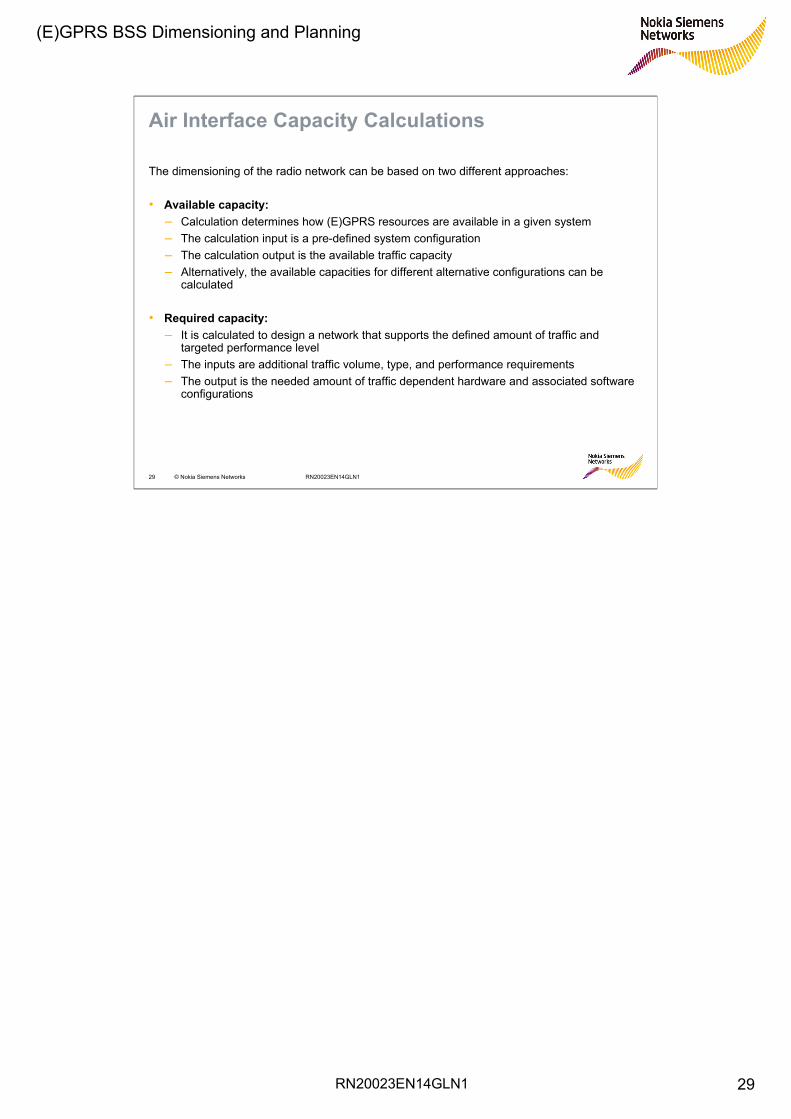
Air Interface Capacity Calculations
The dimensioning of the radio network can be based on two different approaches:
• Available capacity:– Calculation determines how (E)GPRS resources are available in a given system– The calculation input is a pre-defined system configuration– The calculation output is the available traffic capacity– Alternatively, the available capacities for different alternative configurations can be
calculated
• Required capacity:– It is calculated to design a network that supports the defined amount of traffic and
targeted performance level– The inputs are additional traffic volume, type, and performance requirements– The output is the needed amount of traffic dependent hardware and associated software
configurations

RN20023EN14GLN1
(E)GPRS BSS Dimensioning and Planning
30
30 © Nokia Siemens Networks RN20023EN14GLN1
Air interface Capacity Calculations – Available CapacityThe available capacity for data services can be estimated when the existing BTS hardware and the current voice traffic load is known. The next step is to calculate the capacity of the air interface related to the different cell / segment options analyzed before.The air interface capacity calculation contains the following items:• TSL data rate estimation• PSW Multislot usage (with CSW traffic volume and free TSLs)The TSL data rate calculations and the territory figures together for all the cells/segments can give the calculation results of available air interface capacity
Load CS - (Erlang-B) Margin Available for (E)GPRS
Total Capacity = CS + Margin (free TSL in CS) + (E)GPRS Traffic x Territory Occupancy
RN20023EN14GLN1
(E)GPRS BSS Dimensioning and Planning
31
31 © Nokia Siemens Networks RN20023EN14GLN1
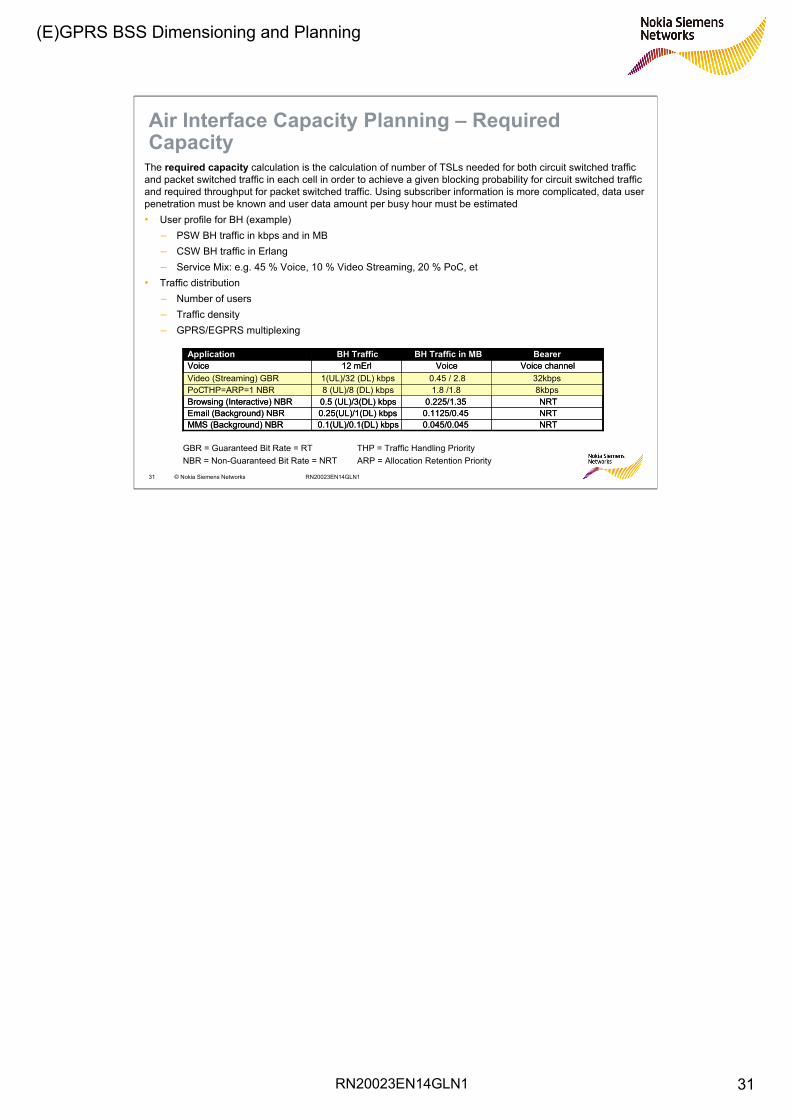
Air Interface Capacity Planning – Required Capacity
The required capacity calculation is the calculation of number of TSLs needed for both circuit switched traffic and packet switched traffic in each cell in order to achieve a given blocking probability for circuit switched traffic and required throughput for packet switched traffic. Using subscriber information is more complicated, data user penetration must be known and user data amount per busy hour must be estimated• User profile for BH (example)
– PSW BH traffic in kbps and in MB– CSW BH traffic in Erlang– Service Mix: e.g. 45 % Voice, 10 % Video Streaming, 20 % PoC, et
• Traffic distribution– Number of users– Traffic density – GPRS/EGPRS multiplexing
32kbps0.45 /2.81(UL)/32 (DL) kbpsVideo (Streaming) GBR8kbps1.8 /1.88 (UL)/8 (DL) kbpsPoCTHP=ARP=1 NBR
0.1(UL)/0.1(DL) kbps0.25(UL)/1(DL) kbps0.5 (UL)/3(DL) kbps
12 mErlBH Traffic
0.045/0.0450.1125/0.450.225/1.35
VoiceBH Traffic in MB
NRTMMS (Background) NBRNRTEmail (Background) NBRNRTBrowsing (Interactive) NBR
Voice channelVoiceBearerApplication
32kbps0.45 / 2.81(UL)/32 (DL) kbpsVideo (Streaming) GBR8kbps1.8 /1.88 (UL)/8 (DL) kbpsPoCTHP=ARP=1 NBR
0.1(UL)/0.1(DL) kbps0.25(UL)/1(DL) kbps0.5 (UL)/3(DL) kbps
12 mErlBH Traffic
0.045/0.0450.1125/0.450.225/1.35
VoiceBH Traffic in MB
NRTMMS (Background) NBRNRTEmail (Background) NBRNRTBrowsing (Interactive) NBR
Voice channelVoiceBearerApplication
GBR = Guaranteed Bit Rate = RT THP = Traffic Handling PriorityNBR = Non-Guaranteed Bit Rate = NRT ARP = Allocation Retention Priority
RN20023EN14GLN1
(E)GPRS BSS Dimensioning and Planning
32
32 © Nokia Siemens Networks RN20023EN14GLN1
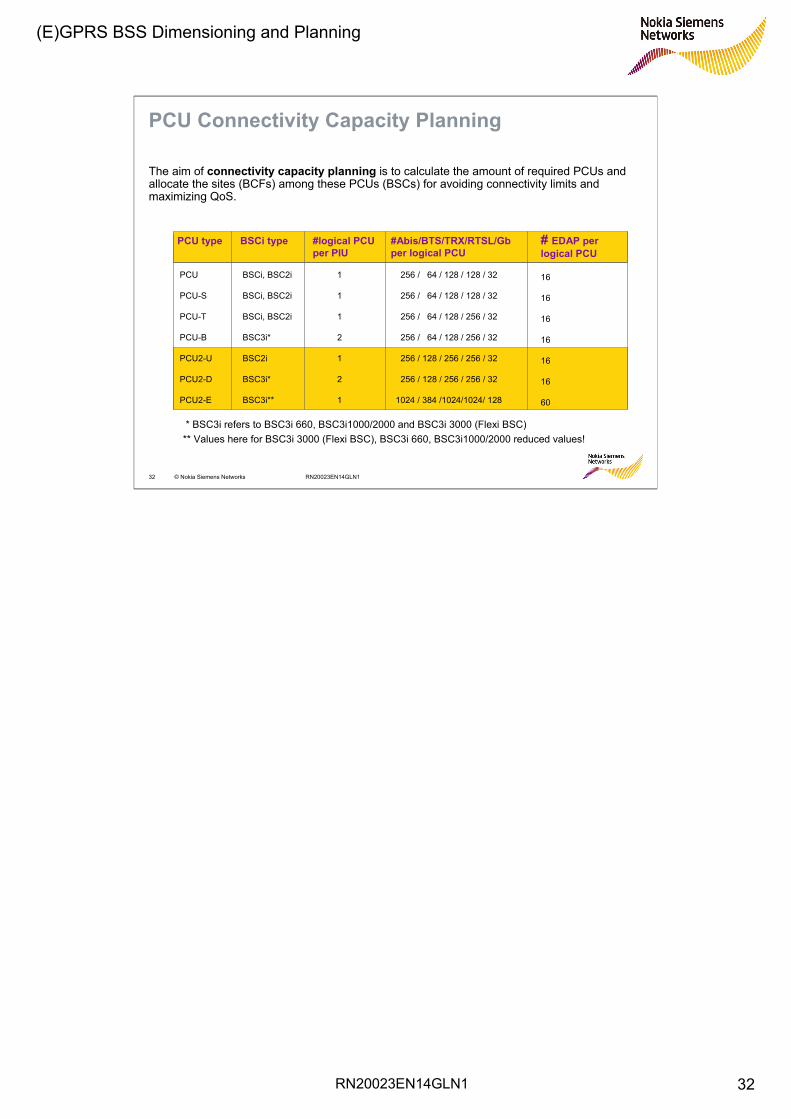
PCU Connectivity Capacity Planning
The aim of connectivity capacity planning is to calculate the amount of required PCUs and allocate the sites (BCFs) among these PCUs (BSCs) for avoiding connectivity limits and maximizing QoS.
PCU type
PCU
PCU-S
PCU-T
PCU-B
PCU2-U
PCU2-D
PCU2-E
BSCi type
BSCi, BSC2i
BSCi, BSC2i
BSCi, BSC2i
BSC3i*
BSC2i
BSC3i*
BSC3i**
#logical PCUper PIU
1
1
1
2
1
2
1
#Abis/BTS/TRX/RTSL/Gbper logical PCU
256 / 064 / 128 / 128 / 32
256 / 064 / 128 / 128 / 32
256 / 064 / 128 / 256 / 32
256 / 064 / 128 / 256 / 32
256 / 128 / 256 / 256 / 32
256 / 128 / 256 / 256 / 32
1024 / 384 /1024/1024/ 128
# EDAP per logical PCU
16
16
16
16
16
16
60
* BSC3i refers to BSC3i 660, BSC3i1000/2000 and BSC3i 3000 (Flexi BSC)** Values here for BSC3i 3000 (Flexi BSC), BSC3i 660, BSC3i1000/2000 reduced values!
RN20023EN14GLN1
(E)GPRS BSS Dimensioning and Planning
33
33 © Nokia Siemens Networks RN20023EN14GLN1
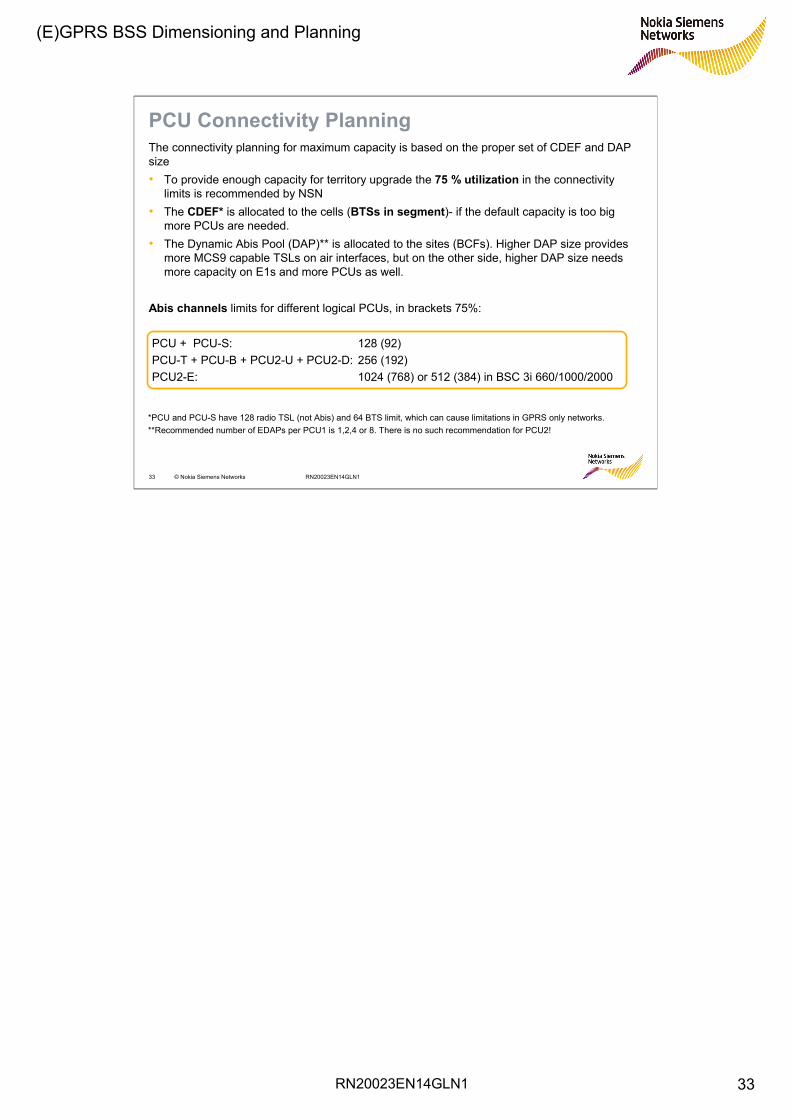
PCU Connectivity PlanningThe connectivity planning for maximum capacity is based on the proper set of CDEF and DAP size • To provide enough capacity for territory upgrade the 75 % utilization in the connectivity
limits is recommended by NSN• The CDEF* is allocated to the cells (BTSs in segment)- if the default capacity is too big
more PCUs are needed.• The Dynamic Abis Pool (DAP)** is allocated to the sites (BCFs). Higher DAP size provides
more MCS9 capable TSLs on air interfaces, but on the other side, higher DAP size needsmore capacity on E1s and more PCUs as well.
Abis channels limits for different logical PCUs, in brackets 75%:
PCU + PCU-S: 128 (92)PCU-T + PCU-B + PCU2-U + PCU2-D: 256 (192)PCU2-E: 1024 (768) or 512 (384) in BSC 3i 660/1000/2000
*PCU and PCU-S have 128 radio TSL (not Abis) and 64 BTS limit, which can cause limitations in GPRS only networks.**Recommended number of EDAPs per PCU1 is 1,2,4 or 8. There is no such recommendation for PCU2!
RN20023EN14GLN1
(E)GPRS BSS Dimensioning and Planning
34
34 © Nokia Siemens Networks RN20023EN14GLN1
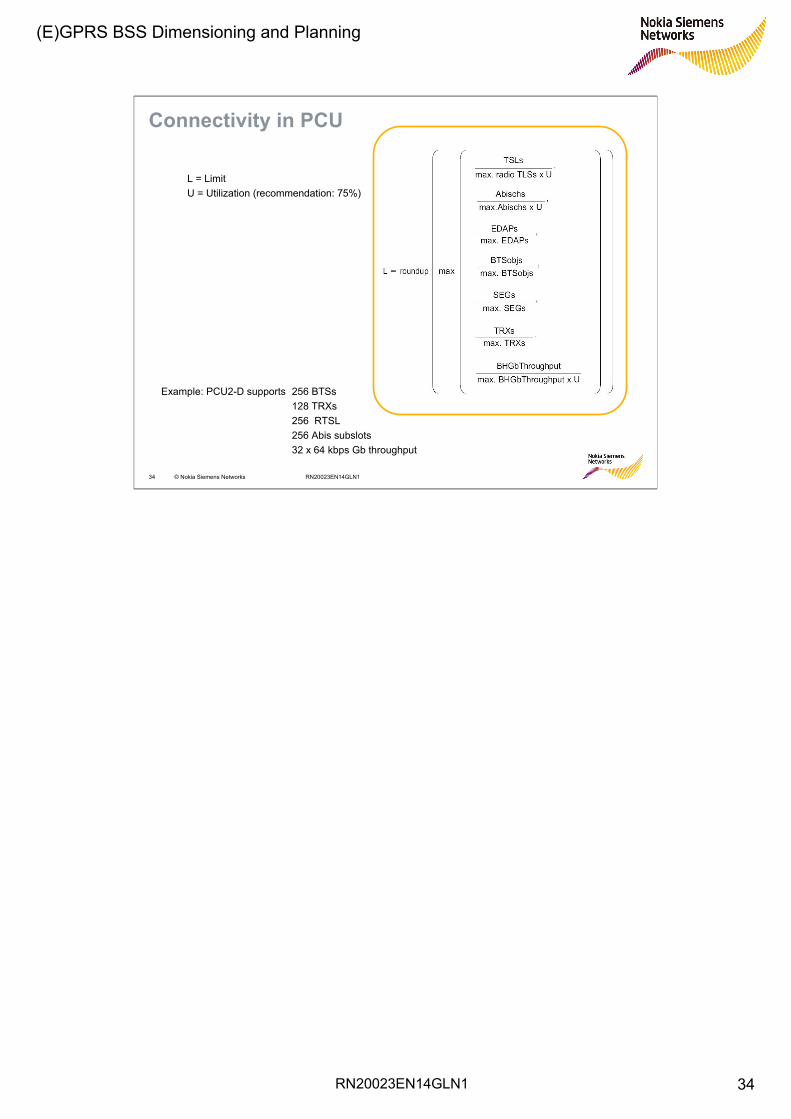
Connectivity in PCU
Example: PCU2-D supports 256 BTSs128 TRXs256 RTSL256 Abis subslots32 x 64 kbps Gb throughput
L = LimitU = Utilization (recommendation: 75%)

RN20023EN14GLN1
(E)GPRS BSS Dimensioning and Planning
35
35 © Nokia Siemens Networks RN20023EN14GLN1
Abis PCU
Abis Capacity of PCU or PSE
DAP 2
DAP 3 DAP 4
DAP 1
75%
In EGPRS networks the main limitation defining the number of PCUs is the Abis channels limits. The available capacity depends on the PCU version, in case of PCU pooling the amount of pooled PCUs. In this case one has to assume the summed capacity of all PCUs in the pool. The 75% connecty limit should still be considered. The distribution of the individual Pools along with the associated Radio resources between the PCUs will be done by the system.
BTS 1
BTS 1 From planning's point of view the Default Capacity is used for each BTS, 1 RTSL = 1 Abis channel
BTS 2
BTS 5 BTS 6 BTS 7
BTS 3 BTS 4BTS 8
BTS 9
DAP 5BTS 11BTS 9 BTS 10
BTS 19
BTS 12 BTS 13 BTS 14 BTS 15BTS 16 BTS 18
BTS 20BTS 17
BTS 21
Capacity for dynamic territory upgrades in a certain BTS
RN20023EN14GLN1
(E)GPRS BSS Dimensioning and Planning
36
36 © Nokia Siemens Networks RN20023EN14GLN1
Gb dimensioningThe dimensioning of the Gb interface can be based on two different approaches:Gb EDGE dimensioning based on EDAP:
– Each PCU has typically one Gb link towards the SGSN. In case of redundant Gb, two independent links are needed.
– The Gb should be capable of supporting the instantaneous data traffic being carried by all cells connected to a particular PCU.
– Gb size = k * Maximum EDAP size for that network area.– The k-factor is based on the estimate of the short term traffic distribution. If no specific
information about the distribution is available the minimum (k=1.25) may be used, which means one fully used Abis pool takes all the Gb capacity (can be seen as minimum)
– K-factor can range from 1.25, 1.4, 2, 3, ….(values above 2 are normally not used)Gb EDGE dimensioning based on traffic figures:
– The basic dimensioning of the Gb interface depends mainly on EGPRS traffic. Because of very different coding schemes and data rates, it is extremely relevant to know whether the traffic is GPRS or EDGE.
– Therefore, the main decision needed for Gb dimensioning is the amount of payload used, on average, for EGPRS traffic during a busy hour and the deviation of the traffic between the peak and minimum values.
– Data volume per PCU can be calculated (or estimated) as the total data volume per PCU or based on subscriber information.

RN20023EN14GLN1
(E)GPRS BSS Dimensioning and Planning
37
37 © Nokia Siemens Networks RN20023EN14GLN1
Area 2
SGSN 1 SGSN 2
Multipoint Gb dimensioning aspects
SGSN pool
PCU/PSE
With multipoint Gb several SGSNs (PAPUs) are connected to one PCU/PSE.-Each Gb will take part of the capacity-Is only implemented in Gb over IP option and capacity considerations are less critical, but need to be checked-If resiliency is target the physical capacity of one Gb link should be able to carry normal traffic plus in case of failure of one SGSN part of this traffic
Gb1 Gb2SGSN 3
Gb3
RN20023EN14GLN1
(E)GPRS BSS Dimensioning and Planning
38
38 © Nokia Siemens Networks RN20023EN14GLN1
Network Dimensioning and Planning - Content
Coverage and Interference Planning
Capacity Planning (Deployment, TSL Data Rate and BSS connectivity)
Dimensioning Example
Mobility Planning
RN20023EN14GLN1
(E)GPRS BSS Dimensioning and Planning
39
39 © Nokia Siemens Networks RN20023EN14GLN1
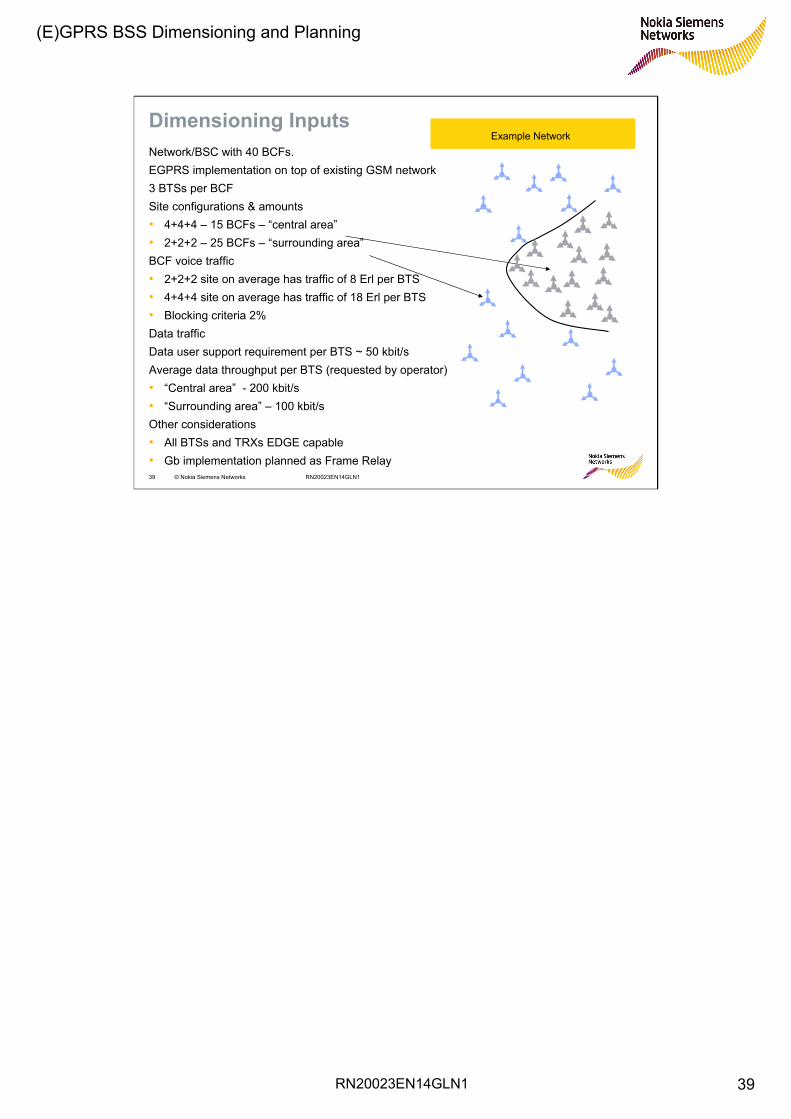
Dimensioning InputsNetwork/BSC with 40 BCFs. EGPRS implementation on top of existing GSM network3 BTSs per BCFSite configurations & amounts• 4+4+4 – 15 BCFs – “central area”• 2+2+2 – 25 BCFs – “surrounding area”BCF voice traffic• 2+2+2 site on average has traffic of 8 Erl per BTS• 4+4+4 site on average has traffic of 18 Erl per BTS• Blocking criteria 2%Data trafficData user support requirement per BTS ~ 50 kbit/sAverage data throughput per BTS (requested by operator)• “Central area” - 200 kbit/s• “Surrounding area” – 100 kbit/sOther considerations• All BTSs and TRXs EDGE capable• Gb implementation planned as Frame Relay
Example Network

RN20023EN14GLN1
(E)GPRS BSS Dimensioning and Planning
40
40 © Nokia Siemens Networks RN20023EN14GLN1
Dimensioning Inputs
TRX and Abis Configurations before EGPRS Implementation
TRX configurations• Only Full Rate voice implementationAbis configurations • Each BCF has own E1
2+2+2 configuration
4+4+4 configuration
TSL0 TSL1 TSL2 TSL3 TSL4 TSL5 TSL6 TSL7BCCH MBCCH SDCCH TCH/F TCH/F TCH/F TCH/F TCH/F TCH/FTCH TCH/F TCH/F TCH/F TCH/F TCH/F TCH/F TCH/F TCH/F
TSL0 TSL1 TSL2 TSL3 TSL4 TSL5 TSL6 TSL7BCCH MBCCH SDCCH TCH/F TCH/F TCH/F TCH/F TCH/F TCH/FTCH TCH/F TCH/F TCH/F TCH/F TCH/F TCH/F TCH/F TCH/FTCH SDCCH TCH/F TCH/F TCH/F TCH/F TCH/F TCH/F TCH/FTCH TCH/F TCH/F TCH/F TCH/F TCH/F TCH/F TCH/F TCH/F
0 01 TCH0 TCH1 TCH2 TCH3 1 TCH0 TCH1 TCH2 TCH32 TCH4 TCH5 TCH6 TCH7 2 TCH4 TCH5 TCH6 TCH73 TCH0 TCH1 TCH2 TCH3 3 TCH0 TCH1 TCH2 TCH34 TCH4 TCH5 TCH6 TCH7 4 TCH4 TCH5 TCH6 TCH75 TCH0 TCH1 TCH2 TCH3 5 TCH0 TCH1 TCH2 TCH36 TCH4 TCH5 TCH6 TCH7 6 TCH4 TCH5 TCH6 TCH77 TCH0 TCH1 TCH2 TCH3 7 TCH0 TCH1 TCH2 TCH38 TCH4 TCH5 TCH6 TCH7 8 TCH4 TCH5 TCH6 TCH79 TCH0 TCH1 TCH2 TCH3 9 TCH0 TCH1 TCH2 TCH3
10 TCH4 TCH5 TCH6 TCH7 10 TCH4 TCH5 TCH6 TCH711 TCH0 TCH1 TCH2 TCH3 11 TCH0 TCH1 TCH2 TCH312 TCH4 TCH5 TCH6 TCH7 12 TCH4 TCH5 TCH6 TCH713 TRXSIG1 TRXSIG2 13 TCH0 TCH1 TCH2 TCH314 TRXSIG3 TRXSIG4 14 TCH4 TCH5 TCH6 TCH715 TRXSIG5 TRXSIG6 15 TCH0 TCH1 TCH2 TCH316 BCFSIG 16 TCH4 TCH5 TCH6 TCH717 17 TCH0 TCH1 TCH2 TCH318 18 TCH4 TCH5 TCH6 TCH719 19 TCH0 TCH1 TCH2 TCH320 20 TCH4 TCH5 TCH6 TCH721 21 TCH0 TCH1 TCH2 TCH322 22 TCH4 TCH5 TCH6 TCH723 23 TCH0 TCH1 TCH2 TCH324 24 TCH4 TCH5 TCH6 TCH725 2526 2627 27 TRXSIG1 TRXSIG2 TRXSIG3 TRXSIG428 28 TRXSIG5 TRXSIG6 TRXSIG7 TRXSIG829 29 TRXSIG9 TRXSIG10 TRXSIG11TRXSIG1230 30 BCFSIG31 31Q1-management Q1-management
4+4+4 2+2+2
Abis Configurations
TRX Configurations
RN20023EN14GLN1
(E)GPRS BSS Dimensioning and Planning
41
41 © Nokia Siemens Networks RN20023EN14GLN1
Dimensioning Inputs – Deployment Scenarios
TRX configurations• No DR/HR implementation• GTRX = YBTS configuration• GENA = Y, EGENA = Y, CMAX = 100 %
RF-environment• Average C/I = 16 dB (BCCH-layer)• Average RxLevel = -85 dBm
⇒ Average RLC/MAC throughput for EDGE: 35 kbit/s (BCCH layer)
Typically best C/I TRX preferred for maximum throughput Depending on frequency plan this can be either BCCH or TCH TRXFeatures impacting location selection:• DR RTSL location needs to be considered with 2+2+2 configuration• DR RTSLs should not be allocated close to GPRS territory boundary

RN20023EN14GLN1
(E)GPRS BSS Dimensioning and Planning
42
42 © Nokia Siemens Networks RN20023EN14GLN1
Dimensioning Inputs – Free timeslots on Air IF
Free RTSLs between CS and PS territory are required in order to serve incoming CS calls without blocking• CS downgrade – if less RTSLs free in CS territory, PS territory downgrade triggered• CS upgrade – PS territory upgrade can be triggered if at least that amount of RTSLs free
Free TSLs for up and downgrade can be controlled by BSC parameters– free TSL for CS downgrade– free TSL for CS upgrade
• Mean free RTSLs for 2 TRXs: 1.5 (default)• Mean free RTSLs for 4 TRXs: 2.5 (default)
RN20023EN14GLN1
(E)GPRS BSS Dimensioning and Planning
43
43 © Nokia Siemens Networks RN20023EN14GLN1
Air Interface – Available Capacity
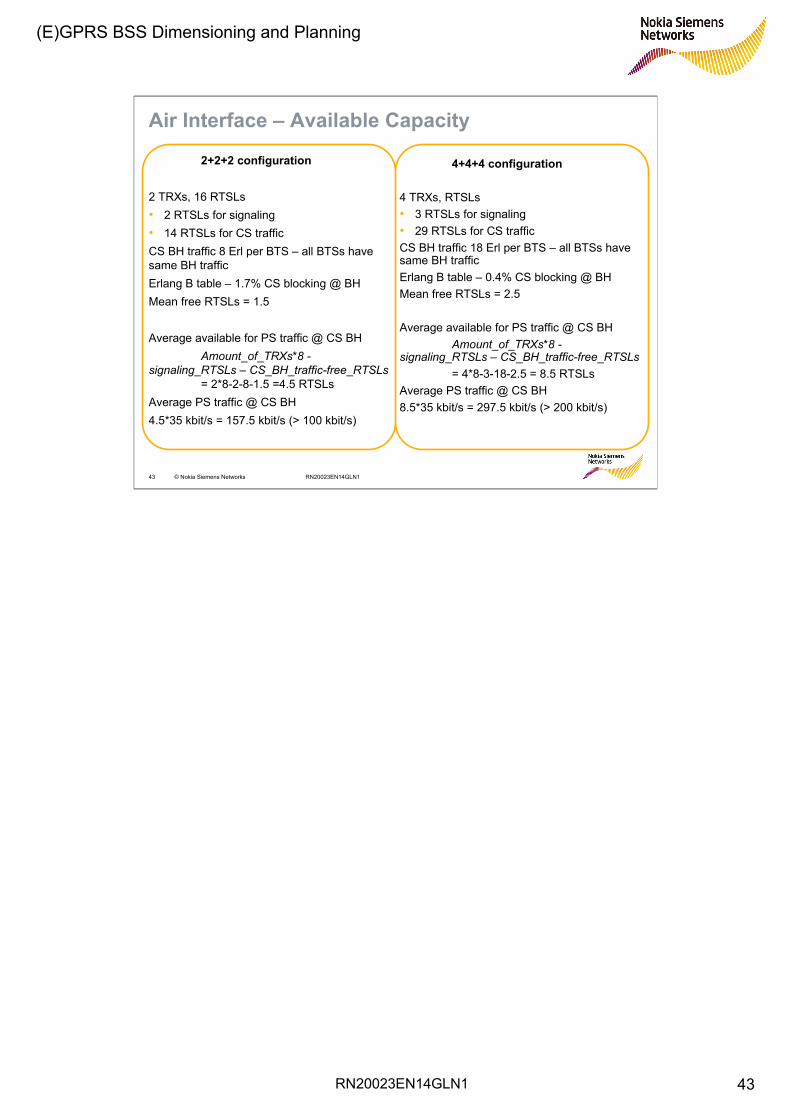
2+2+2 configuration
2 TRXs, 16 RTSLs• 2 RTSLs for signaling• 14 RTSLs for CS trafficCS BH traffic 8 Erl per BTS – all BTSs have same BH trafficErlang B table – 1.7% CS blocking @ BHMean free RTSLs = 1.5
Average available for PS traffic @ CS BHAmount_of_TRXs*8 -
signaling_RTSLs – CS_BH_traffic-free_RTSLs= 2*8-2-8-1.5 =4.5 RTSLs
Average PS traffic @ CS BH4.5*35 kbit/s = 157.5 kbit/s (> 100 kbit/s)
4+4+4 configuration
4 TRXs, RTSLs• 3 RTSLs for signaling• 29 RTSLs for CS trafficCS BH traffic 18 Erl per BTS – all BTSs have same BH trafficErlang B table – 0.4% CS blocking @ BHMean free RTSLs = 2.5
Average available for PS traffic @ CS BHAmount_of_TRXs*8 -
signaling_RTSLs – CS_BH_traffic-free_RTSLs= 4*8-3-18-2.5 = 8.5 RTSLs
Average PS traffic @ CS BH8.5*35 kbit/s = 297.5 kbit/s (> 200 kbit/s)
RN20023EN14GLN1
(E)GPRS BSS Dimensioning and Planning
44
44 © Nokia Siemens Networks RN20023EN14GLN1
Air Interface – Available Capacity (Default Territory Size)
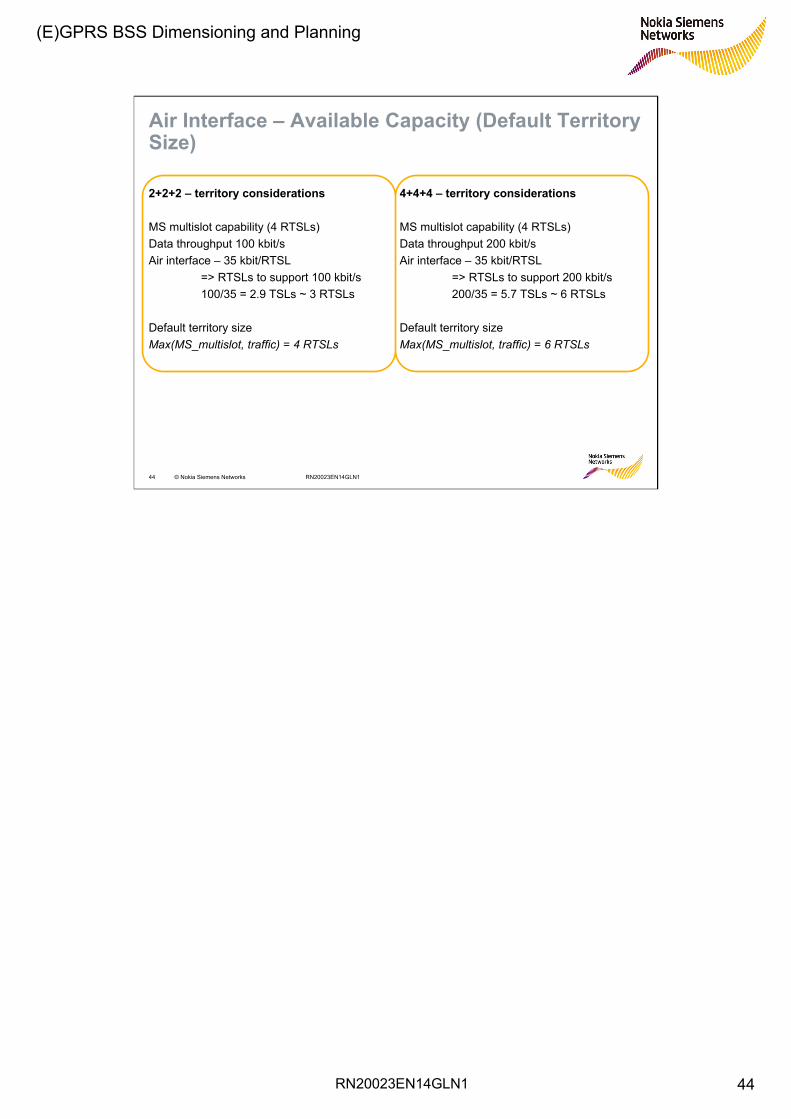
2+2+2 – territory considerations
MS multislot capability (4 RTSLs)Data throughput 100 kbit/sAir interface – 35 kbit/RTSL
=> RTSLs to support 100 kbit/s100/35 = 2.9 TSLs ~ 3 RTSLs
Default territory sizeMax(MS_multislot, traffic) = 4 RTSLs
4+4+4 – territory considerations
MS multislot capability (4 RTSLs)Data throughput 200 kbit/sAir interface – 35 kbit/RTSL
=> RTSLs to support 200 kbit/s200/35 = 5.7 TSLs ~ 6 RTSLs
Default territory sizeMax(MS_multislot, traffic) = 6 RTSLs
RN20023EN14GLN1
(E)GPRS BSS Dimensioning and Planning
45
45 © Nokia Siemens Networks RN20023EN14GLN1
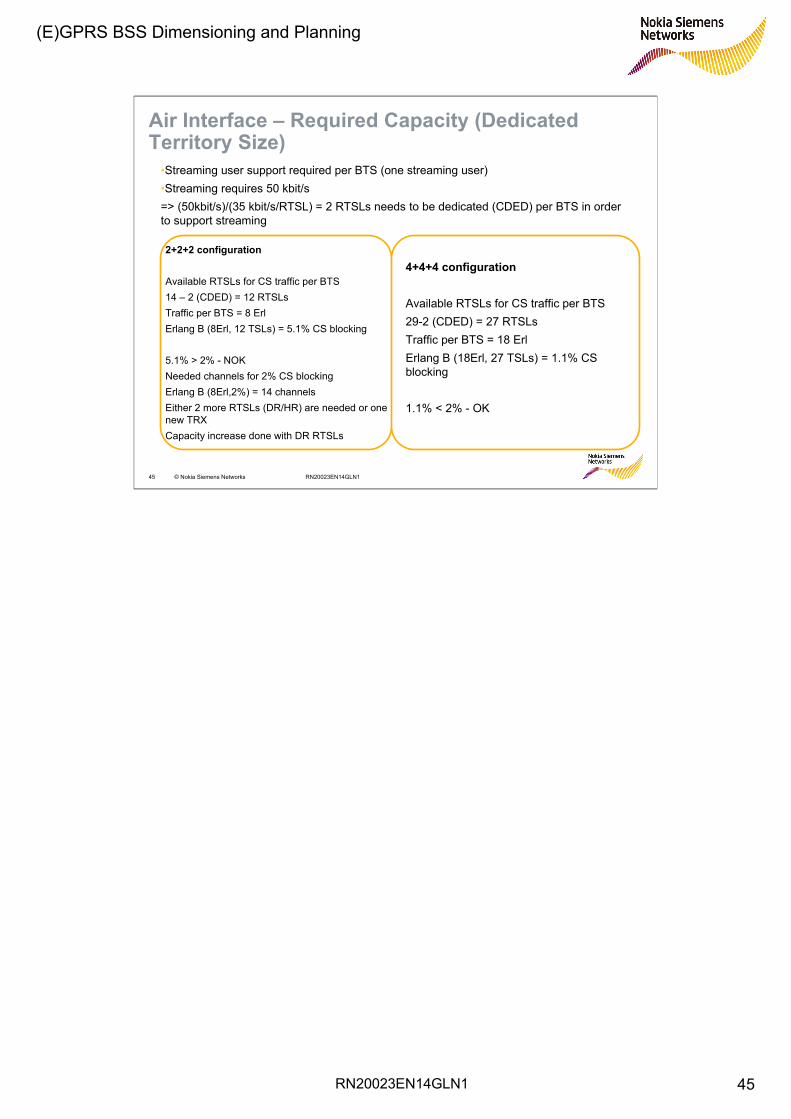
Air Interface – Required Capacity (Dedicated Territory Size)
2+2+2 configuration
Available RTSLs for CS traffic per BTS14 – 2 (CDED) = 12 RTSLsTraffic per BTS = 8 ErlErlang B (8Erl, 12 TSLs) = 5.1% CS blocking
5.1% > 2% - NOKNeeded channels for 2% CS blockingErlang B (8Erl,2%) = 14 channelsEither 2 more RTSLs (DR/HR) are needed or one new TRXCapacity increase done with DR RTSLs
•Streaming user support required per BTS (one streaming user)•Streaming requires 50 kbit/s=> (50kbit/s)/(35 kbit/s/RTSL) = 2 RTSLs needs to be dedicated (CDED) per BTS in order to support streaming
4+4+4 configuration
Available RTSLs for CS traffic per BTS29-2 (CDED) = 27 RTSLsTraffic per BTS = 18 ErlErlang B (18Erl, 27 TSLs) = 1.1% CS blocking
1.1% < 2% - OK
RN20023EN14GLN1
(E)GPRS BSS Dimensioning and Planning
46
46 © Nokia Siemens Networks RN20023EN14GLN1
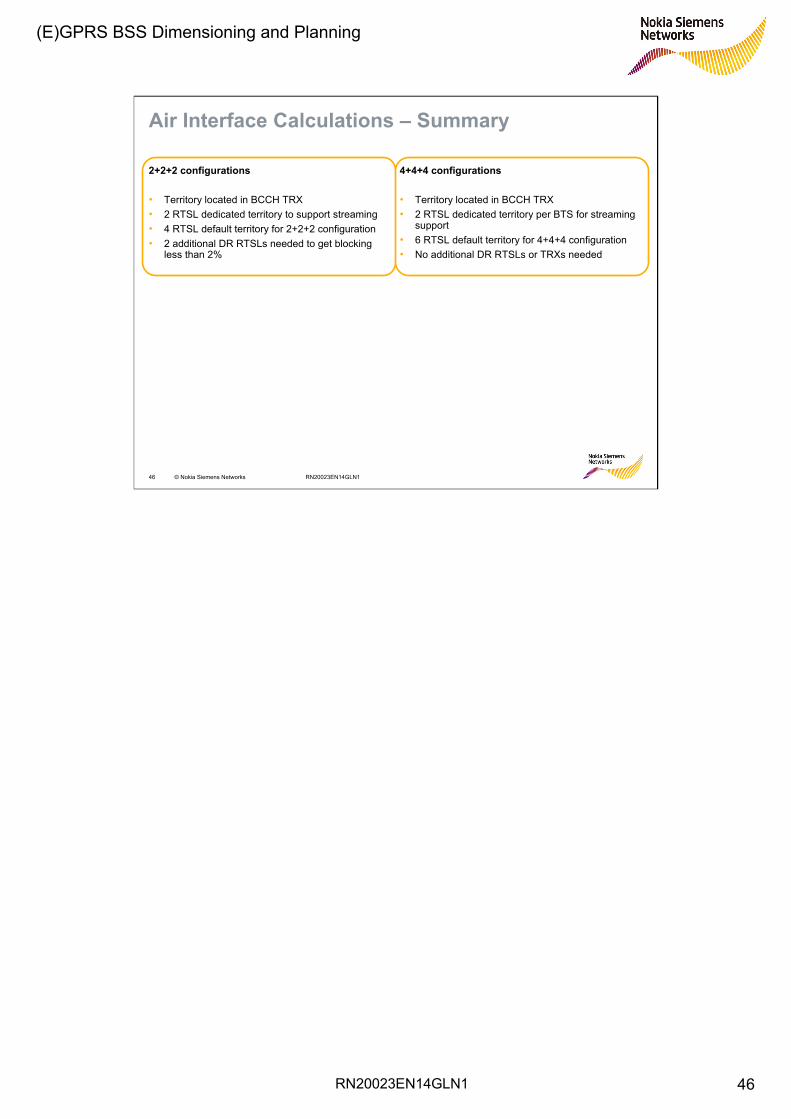
Air Interface Calculations – Summary
2+2+2 configurations
• Territory located in BCCH TRX• 2 RTSL dedicated territory to support streaming• 4 RTSL default territory for 2+2+2 configuration• 2 additional DR RTSLs needed to get blocking
less than 2%
4+4+4 configurations
• Territory located in BCCH TRX• 2 RTSL dedicated territory per BTS for streaming
support• 6 RTSL default territory for 4+4+4 configuration• No additional DR RTSLs or TRXs needed

RN20023EN14GLN1
(E)GPRS BSS Dimensioning and Planning
47
47 © Nokia Siemens Networks RN20023EN14GLN1
Connectivity Capacity - EDAP Size
General EDAP size considerations:At least full support for one MS with Multislot class 4 RTSL should be given (multislot capability may be already considerred with default territory calculations). The minimum EDAP size can be set to
Min_EDAP_1 = MS_Multislot capability (= 4 TSLs)
If support for MCS-9 in all EGPRS territory timeslots of BTSs is requiredMin_EDAP_2 = Max_Default_Territory_size_of one_BTS
Minimum EDAP size can be calculated from above inputMin_EDAP_size = Max(Min_EDAP_1, Min_EDAP_2)
If EDAP has more than one BTS attached, BTS multiplexing factor k can be taken into account if • EDAP peak load is estimated to exceed one BTSs territory size• BTS multiplexing factor can be estimated e.g. by
k = 2/(1+1/x), wherex= amount of BTSs in one EDAP
EDAP size can be estimated by EDAP_size = k * Min_EDAP_size
# of BTSs k1 1.02 1.33 1.5
RN20023EN14GLN1
(E)GPRS BSS Dimensioning and Planning
48
48 © Nokia Siemens Networks RN20023EN14GLN1
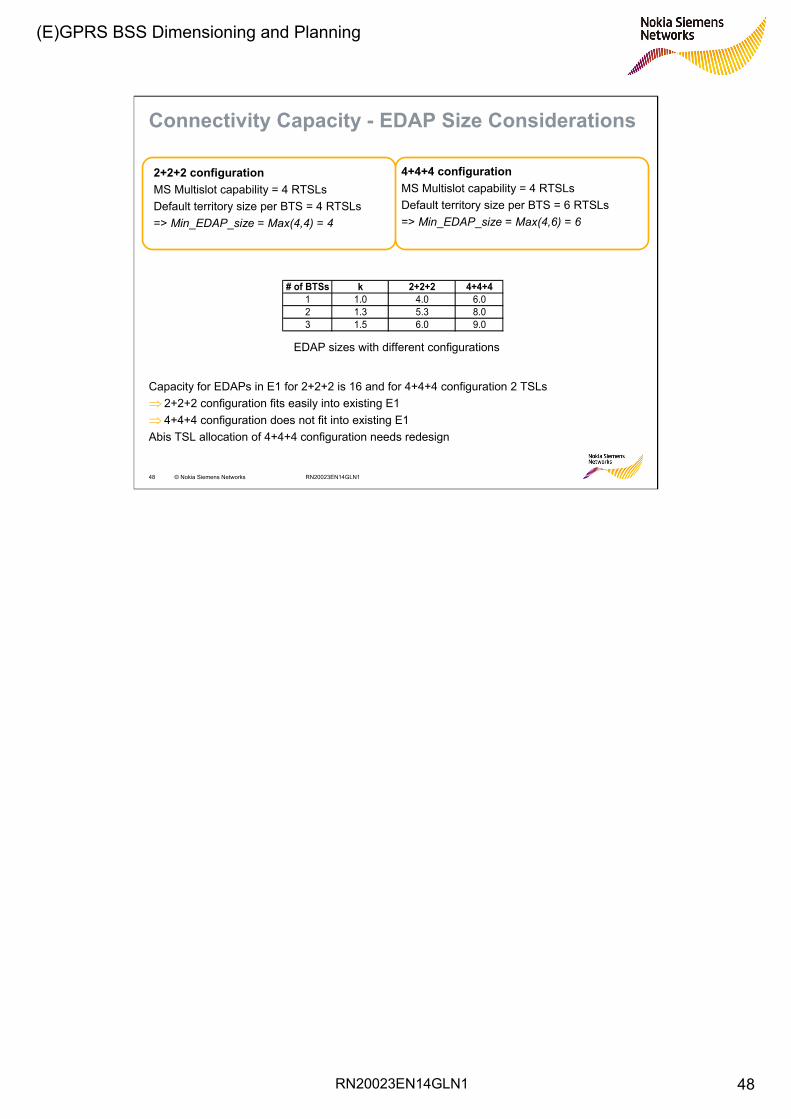
Connectivity Capacity - EDAP Size Considerations
EDAP sizes with different configurations
2+2+2 configurationMS Multislot capability = 4 RTSLsDefault territory size per BTS = 4 RTSLs=> Min_EDAP_size = Max(4,4) = 4
4+4+4 configurationMS Multislot capability = 4 RTSLsDefault territory size per BTS = 6 RTSLs=> Min_EDAP_size = Max(4,6) = 6
# of BTSs k 2+2+2 4+4+41 1.0 4.0 6.02 1.3 5.3 8.03 1.5 6.0 9.0
Capacity for EDAPs in E1 for 2+2+2 is 16 and for 4+4+4 configuration 2 TSLs⇒ 2+2+2 configuration fits easily into existing E1⇒ 4+4+4 configuration does not fit into existing E1Abis TSL allocation of 4+4+4 configuration needs redesign
RN20023EN14GLN1
(E)GPRS BSS Dimensioning and Planning
49
49 © Nokia Siemens Networks RN20023EN14GLN1
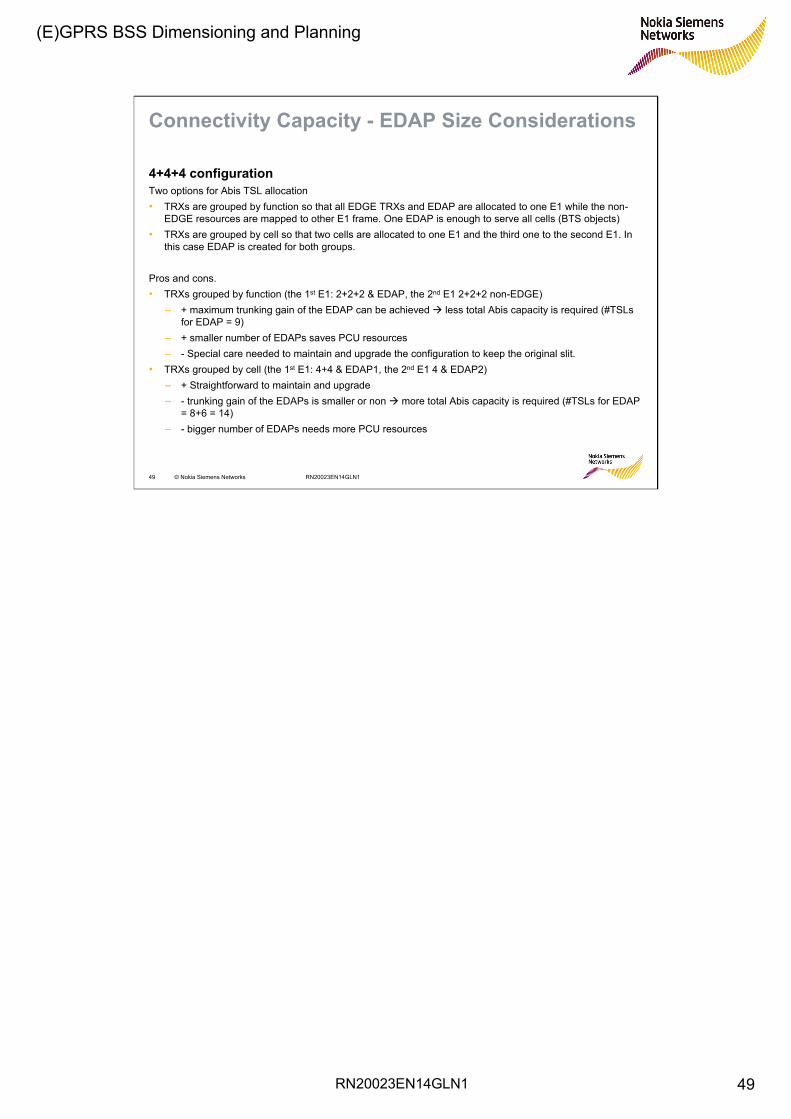
Connectivity Capacity - EDAP Size Considerations
4+4+4 configurationTwo options for Abis TSL allocation • TRXs are grouped by function so that all EDGE TRXs and EDAP are allocated to one E1 while the non-
EDGE resources are mapped to other E1 frame. One EDAP is enough to serve all cells (BTS objects) • TRXs are grouped by cell so that two cells are allocated to one E1 and the third one to the second E1. In
this case EDAP is created for both groups.
Pros and cons.• TRXs grouped by function (the 1st E1: 2+2+2 & EDAP, the 2nd E1 2+2+2 non-EDGE)
– + maximum trunking gain of the EDAP can be achieved less total Abis capacity is required (#TSLsfor EDAP = 9)
– + smaller number of EDAPs saves PCU resources– - Special care needed to maintain and upgrade the configuration to keep the original slit.
• TRXs grouped by cell (the 1st E1: 4+4 & EDAP1, the 2nd E1 4 & EDAP2)– + Straightforward to maintain and upgrade – - trunking gain of the EDAPs is smaller or non more total Abis capacity is required (#TSLs for EDAP
= 8+6 = 14)– - bigger number of EDAPs needs more PCU resources

RN20023EN14GLN1
(E)GPRS BSS Dimensioning and Planning
50
50 © Nokia Siemens Networks RN20023EN14GLN1
Connectivity Capacity - EDAP Size Considerations
TRXs grouped by function requires one EDAP with 9 TSL.
EGDE resources Non-EGDE resources
0 01 TCH0 TCH1 TCH2 TCH3 1 TCH0 TCH1 TCH2 TCH32 TCH4 TCH5 TCH6 TCH7 2 TCH4 TCH5 TCH6 TCH73 TCH0 TCH1 TCH2 TCH3 3 TCH0 TCH1 TCH2 TCH34 TCH4 TCH5 TCH6 TCH7 4 TCH4 TCH5 TCH6 TCH75 TCH0 TCH1 TCH2 TCH3 5 TCH0 TCH1 TCH2 TCH36 TCH4 TCH5 TCH6 TCH7 6 TCH4 TCH5 TCH6 TCH77 TCH0 TCH1 TCH2 TCH3 7 TCH0 TCH1 TCH2 TCH38 TCH4 TCH5 TCH6 TCH7 8 TCH4 TCH5 TCH6 TCH79 TCH0 TCH1 TCH2 TCH3 9 TCH0 TCH1 TCH2 TCH3
10 TCH4 TCH5 TCH6 TCH7 10 TCH4 TCH5 TCH6 TCH711 TCH0 TCH1 TCH2 TCH3 11 TCH0 TCH1 TCH2 TCH312 TCH4 TCH5 TCH6 TCH7 12 TCH4 TCH5 TCH6 TCH713 1314 1415 1516 1617 1718 1819 1920 2021 2122 2223 2324 2425 2526 2627 2728 TRXSIG1TRXSIG2 TRXSIG3TRXSIG4 2829 TRXSIG5TRXSIG6 29 TRXSIG7TRXSIG830 BCFSIG 30 TRXSIG9TRXSIG10TRXSIG11TRXSIG1231 31Q1-management Q1-management
4+4+4 configuration
TRXs grouped by cells requires two EDAPs with 8 TSL and 6 TSL
Cell A & B resources Cell C resources
0 01 TCH0 TCH1 TCH2 TCH3 1 TCH0 TCH1 TCH2 TCH32 TCH4 TCH5 TCH6 TCH7 2 TCH4 TCH5 TCH6 TCH73 TCH0 TCH1 TCH2 TCH3 3 TCH0 TCH1 TCH2 TCH34 TCH4 TCH5 TCH6 TCH7 4 TCH4 TCH5 TCH6 TCH75 TCH0 TCH1 TCH2 TCH3 5 TCH0 TCH1 TCH2 TCH36 TCH4 TCH5 TCH6 TCH7 6 TCH4 TCH5 TCH6 TCH77 TCH0 TCH1 TCH2 TCH3 7 TCH0 TCH1 TCH2 TCH38 TCH4 TCH5 TCH6 TCH7 8 TCH4 TCH5 TCH6 TCH79 TCH0 TCH1 TCH2 TCH3 9
10 TCH4 TCH5 TCH6 TCH7 1011 TCH0 TCH1 TCH2 TCH3 1112 TCH4 TCH5 TCH6 TCH7 1213 TCH0 TCH1 TCH2 TCH3 1314 TCH4 TCH5 TCH6 TCH7 1415 TCH0 TCH1 TCH2 TCH3 1516 TCH4 TCH5 TCH6 TCH7 1617 1718 1819 1920 2021 2122 2223 2324 2425 2526 2627 2728 TRXSIG1 TRXSIG2TRXSIG3 TRXSIG4 2829 TRXSIG5 TRXSIG6TRXSIG7 TRXSIG8 2930 BCFSIG 30 TRXSIG9TRXSIG10TRXSIG11TRXSIG1231 31Q1-management Q1-management
RN20023EN14GLN1
(E)GPRS BSS Dimensioning and Planning
51
51 © Nokia Siemens Networks RN20023EN14GLN1
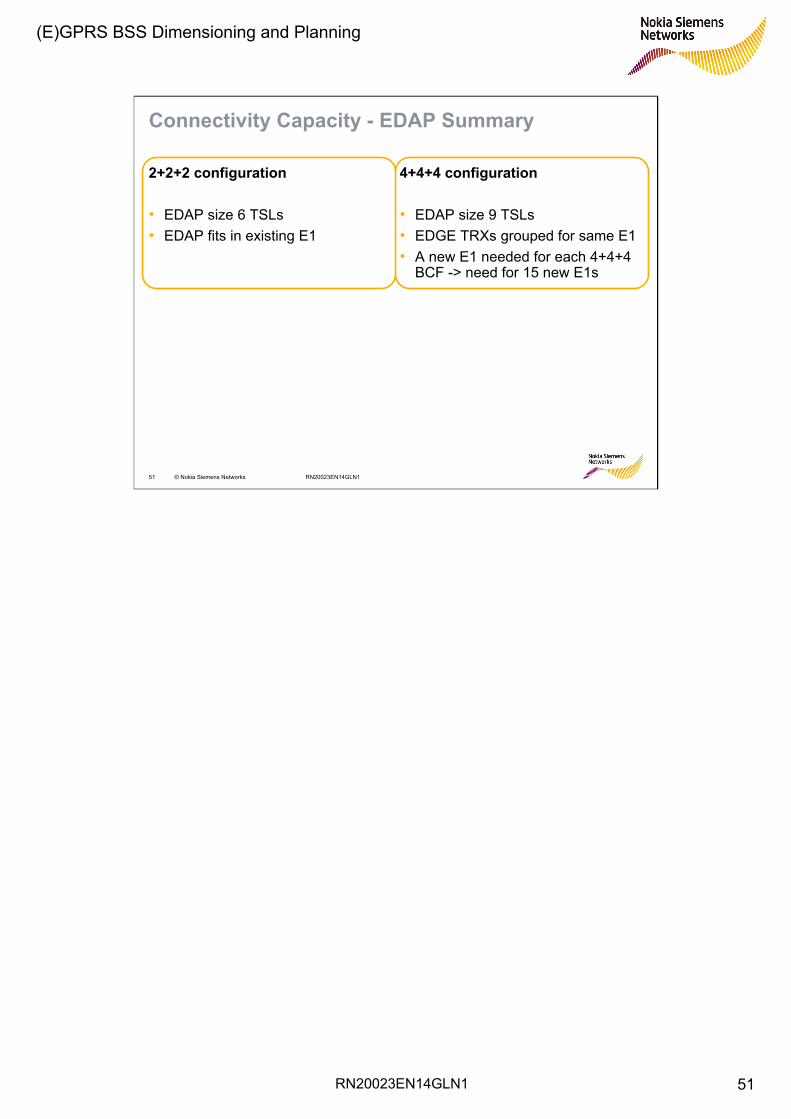
Connectivity Capacity - EDAP Summary
2+2+2 configuration
• EDAP size 6 TSLs• EDAP fits in existing E1
4+4+4 configuration
• EDAP size 9 TSLs• EDGE TRXs grouped for same E1• A new E1 needed for each 4+4+4
BCF -> need for 15 new E1s
RN20023EN14GLN1
(E)GPRS BSS Dimensioning and Planning
52
52 © Nokia Siemens Networks RN20023EN14GLN1
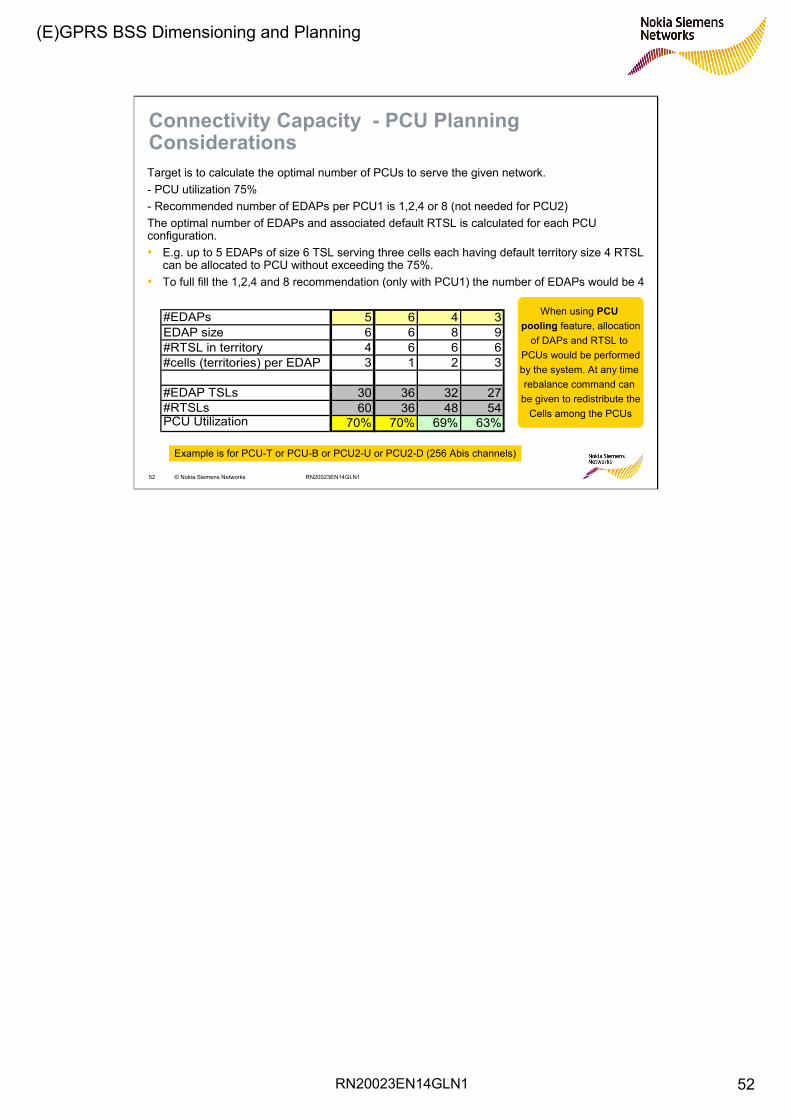
Connectivity Capacity - PCU Planning ConsiderationsTarget is to calculate the optimal number of PCUs to serve the given network. - PCU utilization 75%- Recommended number of EDAPs per PCU1 is 1,2,4 or 8 (not needed for PCU2)The optimal number of EDAPs and associated default RTSL is calculated for each PCU configuration.• E.g. up to 5 EDAPs of size 6 TSL serving three cells each having default territory size 4 RTSL
can be allocated to PCU without exceeding the 75%. • To full fill the 1,2,4 and 8 recommendation (only with PCU1) the number of EDAPs would be 4
#EDAPs 5 6 4 3EDAP size 6 6 8 9#RTSL in territory 4 6 6 6#cells (territories) per EDAP 3 1 2 3
#EDAP TSLs 30 36 32 27#RTSLs 60 36 48 54PCU Utilization 70% 70% 69% 63%
When using PCU pooling feature, allocation
of DAPs and RTSL to PCUs would be performedby the system. At any time rebalance command canbe given to redistribute the
Cells among the PCUs
Example is for PCU-T or PCU-B or PCU2-U or PCU2-D (256 Abis channels)

RN20023EN14GLN1
(E)GPRS BSS Dimensioning and Planning
53
53 © Nokia Siemens Networks RN20023EN14GLN1
Connectivity Capacity - PCU Configurations and Requirements
Table below lists possible PCU combinations:
• 4+4+4 configurations -> 3 sites per PCU- load too low, 4 sites per PCU load too high • 2+2+2 configuration -> 5 sites per PCU provides reasonable load
When considering total network, 15 (4+4+4) and 25 (2+2+2) configurations one possibility is to have• 5 PCUs with 1 (2+2+2) and 3 (4+4+4) configurations• 4 PCUs with 5 (2+2+2) configurations
BTS configuration EDAP size2+2+2 (12) 6 0 0 1 3 2 4 3 5 44+4+4 (18) 9 4 3 3 2 2 1 1 0 0
4 3 4 5 4 5 4 5 4total PCU Abis load 216 162 198 216 180 198 162 180 144PCU load% 84% 63% 77% 84% 70% 77% 63% 70% 56%
Example is for PCU-T or PCU-B or PCU2-U or PCU2-D (256 Abis channels)
RN20023EN14GLN1
(E)GPRS BSS Dimensioning and Planning
54
54 © Nokia Siemens Networks RN20023EN14GLN1
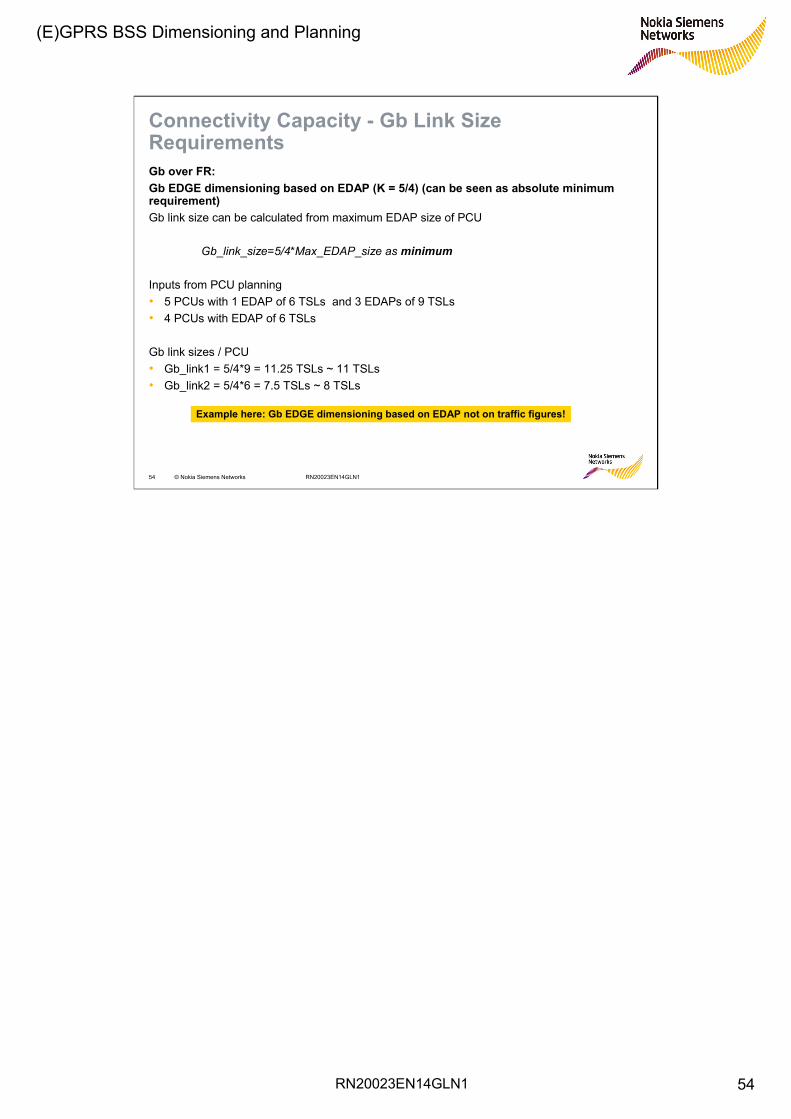
Connectivity Capacity - Gb Link Size RequirementsGb over FR:Gb EDGE dimensioning based on EDAP (K = 5/4) (can be seen as absolute minimum requirement)Gb link size can be calculated from maximum EDAP size of PCU
Gb_link_size=5/4*Max_EDAP_size as minimum
Inputs from PCU planning• 5 PCUs with 1 EDAP of 6 TSLs and 3 EDAPs of 9 TSLs• 4 PCUs with EDAP of 6 TSLs
Gb link sizes / PCU• Gb_link1 = 5/4*9 = 11.25 TSLs ~ 11 TSLs• Gb_link2 = 5/4*6 = 7.5 TSLs ~ 8 TSLs
Example here: Gb EDGE dimensioning based on EDAP not on traffic figures!

RN20023EN14GLN1
(E)GPRS BSS Dimensioning and Planning
55
55 © Nokia Siemens Networks RN20023EN14GLN1
Connectivity Capacity - Gb Links
When Gb links are combined into E1s maximum 31 TSLs can be used
#PCUGb
links5 11 3 2 2 1 24 8 0 0 1 2 2
33 22 30 27 38
Table above shows that 1 E1 can fit well either2 Gb links of 11 TSLs and one link of 8 TSL1 Gb link of 11 TSL and two links of 8 TSLs
9 PCUs can therefore be fitted into 3 E1 links

RN20023EN14GLN1
(E)GPRS BSS Dimensioning and Planning
56
56 © Nokia Siemens Networks RN20023EN14GLN1
Connectivity Capacity - Summary
DR RTSLs 150PCUs 9E1s for Abis 15E1s for Gb 3
# of PCUs BTS Configurations Abis util. Gb Link5 3*(4+4+4) 1*(2+2+2) 77% 114 5*(2+2+2) 70% 8
Configuration CDED CDEF EDAP2+2+2 2 4 64+4+4 2 6 9
RN20023EN14GLN1
(E)GPRS BSS Dimensioning and Planning
57
57 © Nokia Siemens Networks RN20023EN14GLN1
Network Dimensioning and Planning - Content
Coverage and Interference Planning
Capacity Planning (Deployment, TSL Data Rate and BSS connectivity)
Dimensioning Example
Mobility Planning
RN20023EN14GLN1
(E)GPRS BSS Dimensioning and Planning
58
58 © Nokia Siemens Networks RN20023EN14GLN1
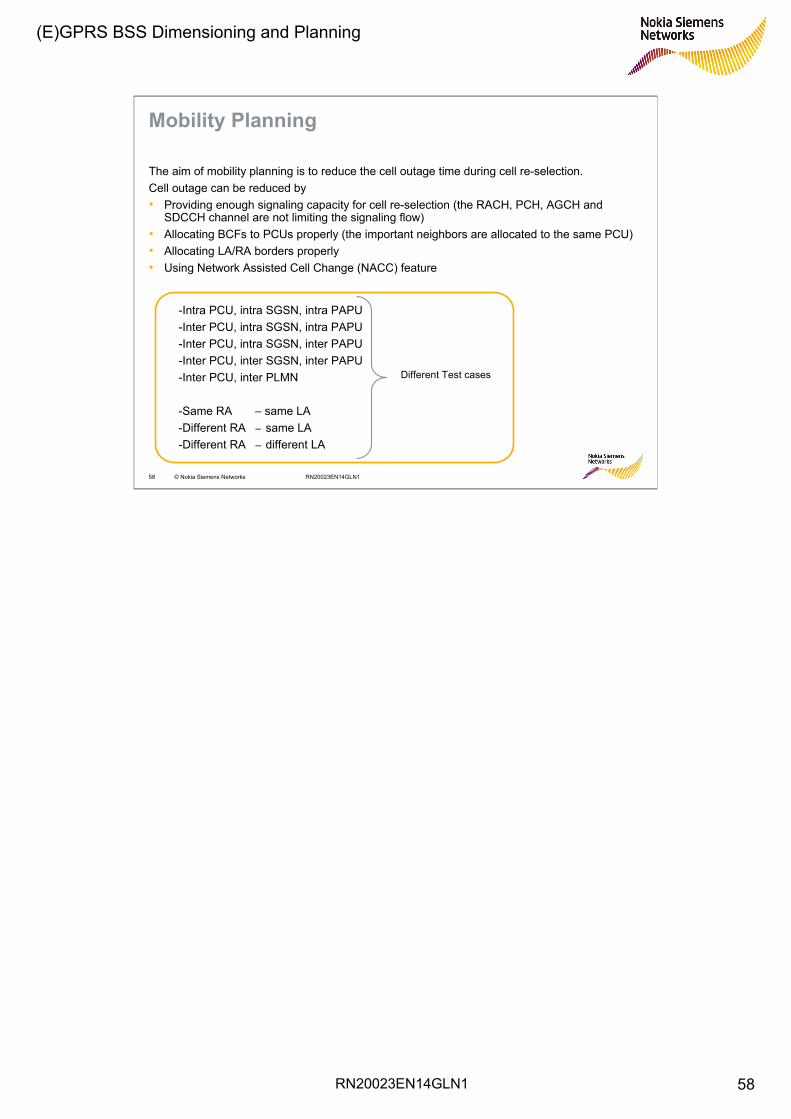
Mobility Planning
The aim of mobility planning is to reduce the cell outage time during cell re-selection.Cell outage can be reduced by• Providing enough signaling capacity for cell re-selection (the RACH, PCH, AGCH and
SDCCH channel are not limiting the signaling flow)• Allocating BCFs to PCUs properly (the important neighbors are allocated to the same PCU)• Allocating LA/RA borders properly • Using Network Assisted Cell Change (NACC) feature
-Intra PCU, intra SGSN, intra PAPU-Inter PCU, intra SGSN, intra PAPU-Inter PCU, intra SGSN, inter PAPU-Inter PCU, inter SGSN, inter PAPU-Inter PCU, inter PLMN
-Same RA – same LA-Different RA – same LA-Different RA – different LA
Different Test cases
RN20023EN14GLN1
(E)GPRS BSS Dimensioning and Planning
59
59 © Nokia Siemens Networks RN20023EN14GLN1
Mobility Planning
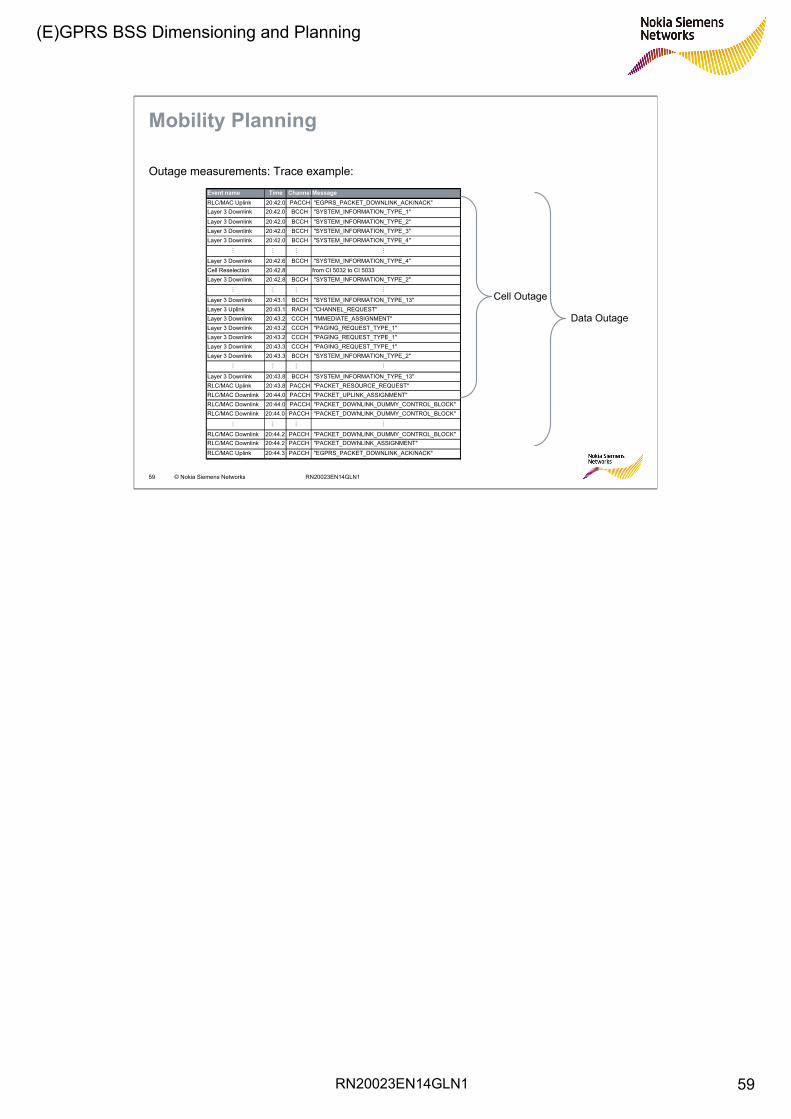
Outage measurements: Trace example:
Event name Time Channel MessageRLC/MAC Uplink 20:42.0 PACCH "EGPRS_PACKET_DOWNLINK_ACK/NACK"Layer 3 Downlink 20:42.0 BCCH "SYSTEM_INFORMATION_TYPE_1"
Layer 3 Downlink 20:42.0 BCCH "SYSTEM_INFORMATION_TYPE_2"Layer 3 Downlink 20:42.0 BCCH "SYSTEM_INFORMATION_TYPE_3"Layer 3 Downlink 20:42.0 BCCH "SYSTEM_INFORMATION_TYPE_4"
… … … …
Layer 3 Downlink 20:42.6 BCCH "SYSTEM_INFORMATION_TYPE_4"Cell Reselection 20:42.8 from CI 5032 to CI 5033Layer 3 Downlink 20:42.8 BCCH "SYSTEM_INFORMATION_TYPE_2"
… … … …
Layer 3 Downlink 20:43.1 BCCH "SYSTEM_INFORMATION_TYPE_13"Layer 3 Uplink 20:43.1 RACH "CHANNEL_REQUEST"Layer 3 Downlink 20:43.2 CCCH "IMMEDIATE_ASSIGNMENT"Layer 3 Downlink 20:43.2 CCCH "PAGING_REQUEST_TYPE_1"Layer 3 Downlink 20:43.2 CCCH "PAGING_REQUEST_TYPE_1"Layer 3 Downlink 20:43.3 CCCH "PAGING_REQUEST_TYPE_1"Layer 3 Downlink 20:43.3 BCCH "SYSTEM_INFORMATION_TYPE_2"
… … … …
Layer 3 Downlink 20:43.8 BCCH "SYSTEM_INFORMATION_TYPE_13"RLC/MAC Uplink 20:43.8 PACCH "PACKET_RESOURCE_REQUEST"RLC/MAC Downlink 20:44.0 PACCH "PACKET_UPLINK_ASSIGNMENT"RLC/MAC Downlink 20:44.0 PACCH "PACKET_DOWNLINK_DUMMY_CONTROL_BLOCK"RLC/MAC Downlink 20:44.0 PACCH "PACKET_DOWNLINK_DUMMY_CONTROL_BLOCK"
… … … …
RLC/MAC Downlink 20:44.2 PACCH "PACKET_DOWNLINK_DUMMY_CONTROL_BLOCK"RLC/MAC Downlink 20:44.2 PACCH "PACKET_DOWNLINK_ASSIGNMENT"
RLC/MAC Uplink 20:44.3 PACCH "EGPRS_PACKET_DOWNLINK_ACK/NACK"
Cell Outage
Data Outage
RN20023EN14GLN1
(E)GPRS BSS Dimensioning and Planning
60
60 © Nokia Siemens Networks RN20023EN14GLN1
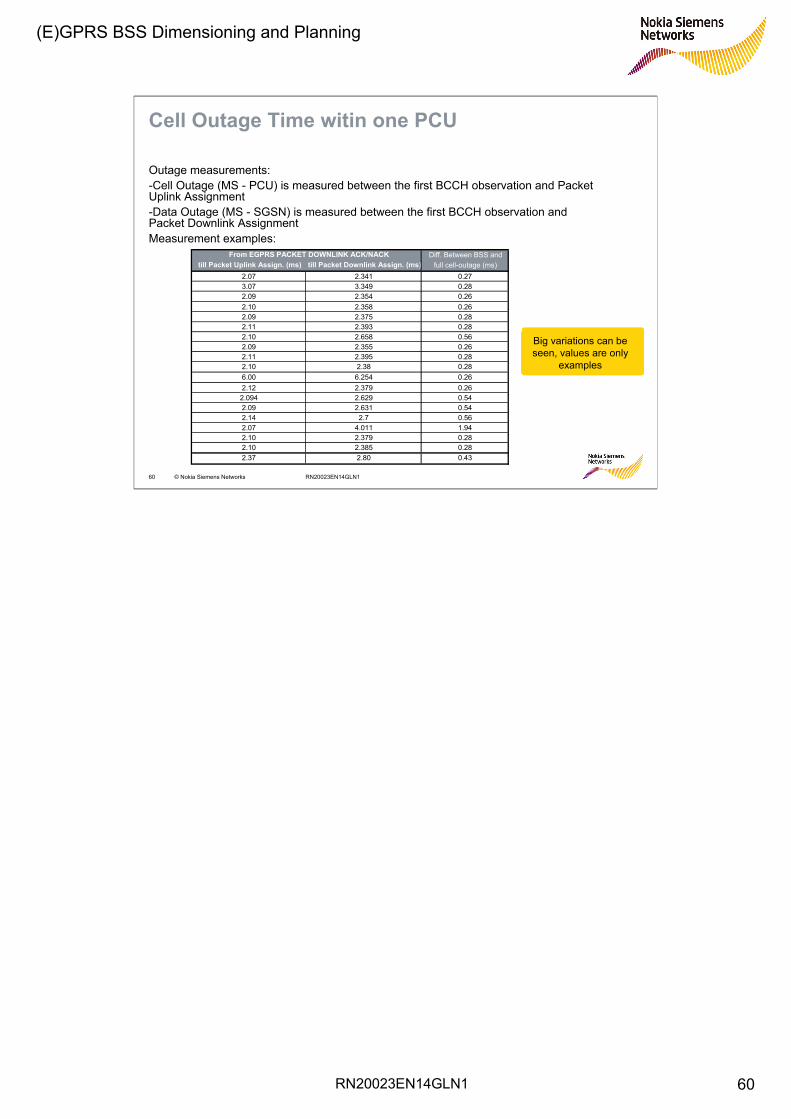
Diff. Between BSS andtill Packet Uplink Assign. (ms) till Packet Downlink Assign. (ms) full cell-outage (ms)
2.07 2.341 0.273.07 3.349 0.282.09 2.354 0.262.10 2.358 0.262.09 2.375 0.282.11 2.393 0.282.10 2.658 0.562.09 2.355 0.262.11 2.395 0.282.10 2.38 0.286.00 6.254 0.262.12 2.379 0.262.094 2.629 0.542.09 2.631 0.542.14 2.7 0.562.07 4.011 1.942.10 2.379 0.282.10 2.385 0.282.37 2.80 0.43
From EGPRS PACKET DOWNLINK ACK/NACK
Cell Outage Time witin one PCU
Outage measurements:-Cell Outage (MS - PCU) is measured between the first BCCH observation and Packet Uplink Assignment -Data Outage (MS - SGSN) is measured between the first BCCH observation and Packet Downlink Assignment Measurement examples:
Big variations can beseen, values are only
examples

RN20023EN14GLN1
(E)GPRS BSS Dimensioning and Planning
61
61 © Nokia Siemens Networks RN20023EN14GLN1
Cell Outage Time with LAU/RAU change
Outage measurements as seen by MS:Cell Outage (MS - PCU) is measured between the first BCCH observation and Packet Uplink Assignment with LA and RA Update procedure Data Outage (MS - SGSN) is measured between the first BCCH observation and Packet Downlink ACK/NACK after Routing Area Update Complete
… … … …
Layer 3 Downlink 8:44:05.801 BCCH "SYSTEM_INFORMATION_TYPE_1"… … … …
Layer 3 Downlink 8:44:10.797 BCCH "SYSTEM_INFORMATION_TYPE_13"Cell Reselection 8:44:10.906 from 5691 to 5753Layer 3 Downlink 8:44:11.018 BCCH "SYSTEM_INFORMATION_TYPE_2"… … … …
Layer 3 Uplink 8:44:11.997 RACH "CHANNEL_REQUEST"Layer 3 Downlink 8:44:12.101 CCCH "IMMEDIATE_ASSIGNMENT"Layer 3 Uplink 8:44:12.313 SDCCH "LOCATION_UPDATING_REQUEST"Layer 3 Downlink 8:44:12.353 SACCH "SYSTEM_INFORMATION_TYPE_6"Layer 3 Uplink 8:44:12.388 SACCH "MEASUREMENT_REPORT"Layer 3 Uplink 8:44:12.548 SDCCH "CLASSMARK_CHANGE"Layer 3 Downlink 8:44:12.764 SDCCH "CIPHERING_MODE_COMMAND"Layer 3 Uplink 8:44:12.784 SDCCH "GPRS_SUSPENSION_REQUEST"Layer 3 Uplink 8:44:13.020 SDCCH "CIPHERING_MODE_COMPLETE"Layer 3 Downlink 8:44:13.224 SDCCH "IDENTITY_REQUEST"Layer 3 Uplink 8:44:13.350 SACCH "MEASUREMENT_REPORT"Layer 3 Uplink 8:44:13.490 SDCCH "IDENTITY_RESPONSE"Layer 3 Downlink 8:44:13.697 SDCCH "LOCATION_UPDATING_ACCEPT"Layer 3 Uplink 8:44:13.799 SACCH "MEASUREMENT_REPORT"Layer 3 Downlink 8:44:14.168 SDCCH "MM_INFORMATION"Layer 3 Uplink 8:44:14.284 SACCH "MEASUREMENT_REPORT"Layer 3 Downlink 8:44:14.399 SDCCH "CHANNEL_RELEASE"… … … …
… … … …
… … … …
Layer 3 Uplink 8:44:16.258 PDTCH "ROUTING_AREA_UPDATE_REQUEST"RLC/MAC Uplink 8:44:17.401 PACCH "PACKET_RESOURCE_REQUEST"RLC/MAC Downlink 8:44:17.607 PACCH "PACKET_UPLINK_ASSIGNMENT"… … … …RLC/MAC Downlink 8:44:17.886 PACCH "PACKET_DOWNLINK_ASSIGNMENT"… … … …
Layer 3 Downlink 8:44:18.950 PDTCH "ROUTING_AREA_UPDATE_ACCEPT"Layer 3 Uplink 8:44:18.964 PDTCH "ROUTING_AREA_UPDATE_COMPLETE"RLC/MAC Uplink 8:44:19.119 PACCH "EGPRS_PACKET_DOWNLINK_ACK/NACK"… … … …
Event name Time Channel Message

RN20023EN14GLN1
(E)GPRS BSS Dimensioning and Planning
62
62 © Nokia Siemens Networks RN20023EN14GLN1
PCU Allocation Plan
The proper allocation of the cells among PCUs can help to maximize the number of intra PCU cell re-selections, which is the most stable cell re-selection event.• RLC/MAC layer: The intra PCU cell re-selection takes less time compared with inter PCU cell
reselection• LLC layer: In case of intra PCU cell re-selection the un-transferred data is moved to new cell
(BVCI) and the transfer can be continued on new cell without packet loss on higher layer, while in case of inter PCU cell re-selection the un-transferred data is not moved to new cell (BVCI).
The following rules can be followed:• The cells of one BCF should be connected to the same PCU• The neighbor relations with high re-selection traffic should be connected to the same PCU• The neighbor relations in very bad signal and quality environment should be connected to the
same PCU
NACC* and NCCR can be used to enhance the performance of cell reselections, because offsets can be defined avoiding too many inter PCU cell reselections for example (* NACC is working inside BSCs only)
RN20023EN14GLN1
(E)GPRS BSS Dimensioning and Planning
63
63 © Nokia Siemens Networks RN20023EN14GLN1
LA/RA Design – Radio Aspects
Radio Aspect of LA/RA Design• too big LA/RA will increase the paging, while too small LA/RA will increase the amount of
LA/RA Updates. So the balance should be found between too big and too small LA/RAs.• a bad LA/RA border design can significantly increase the amount of signaling what can lead
to an increase of the cell-reselection outage on the LA/RA border. • The LA/RA border should be moved from those areas where the normal CSW and PSW
traffic is very high.• The combined RAU (NMO I with Gs) is shorter compared to NMO II
• A class B MS (and class A MS without DTM support) has to suspend GPRS services while in dedicated mode. Once the dedicated connection is finished, GPRS services have to be resumed. This can be done by an RA update. Since S11.5 the Resumption is provided by the BSC without need for RA update.
Copyright © 2022 FDOKUMEN

