


Bahasa
Halaman
Hukum


Laporan Statistik Statistic Report2010
PT INDONESIA POWER
1
Laporan StatistikStatistics Report
20
10
Penyusunan statistik 2010 merupakan bentuk transparansi informasi Indonesia Power tidak hanya kepada pemegang saham tetapi juga publik secara luas, komitmen tersebut akan terus ditingkatkan seiring dengan implementasi GCC dimasa mendatang.

Laporan Statistik Statistic Report2010
PT INDONESIA POWER
2
I. Sistem Jawa-Bali
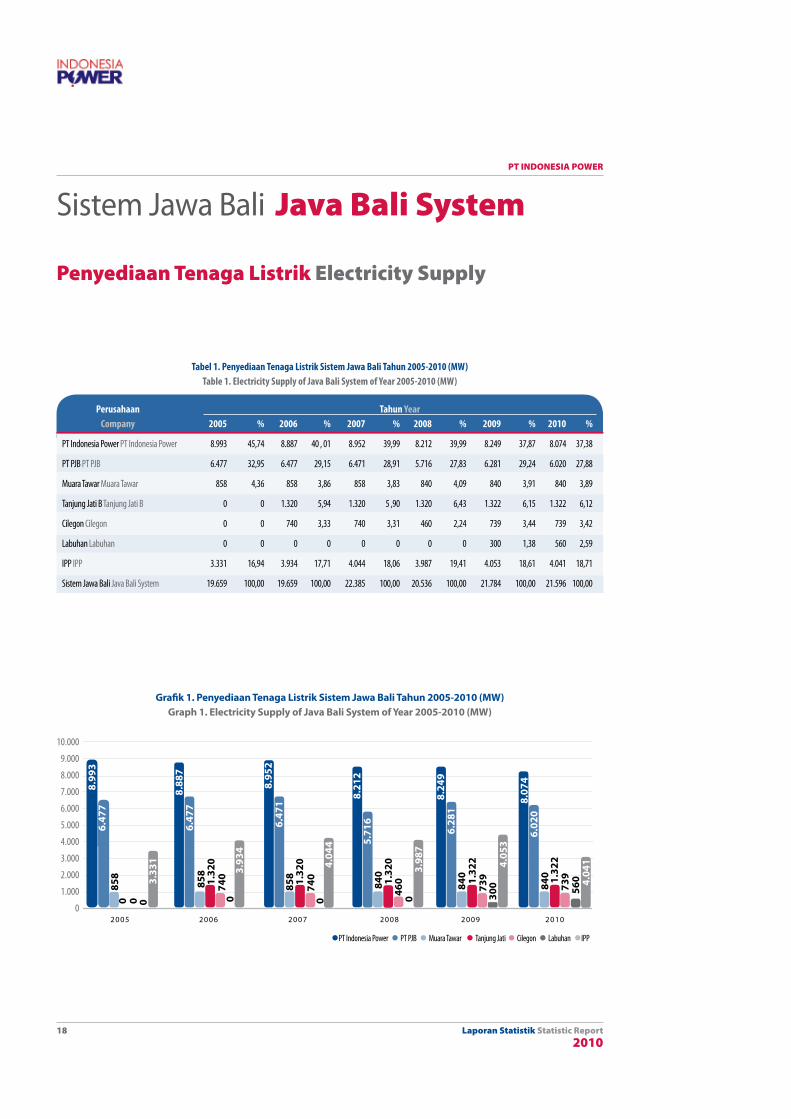
Penyediaan Tenaga ListrikPada tahun 2010, total penyediaan tenaga listrik (daya mampu netto) untuk Sistem Jawa-Bali mencapai mencapai 21.036 MW, dengan perincian: Indonesia Power sebesar 38,38% (8.074 MW), PT PJB sebesar 28,62% (6.020 MW), Muara Tawar sebesar 3,99% (840 MW), Tanjung Jati B sebesar 6,28% (1.322 MW), Cilegon sebesar 3,51% (739 MW), dan IPP sebesar 19,21% (4.041 MW).
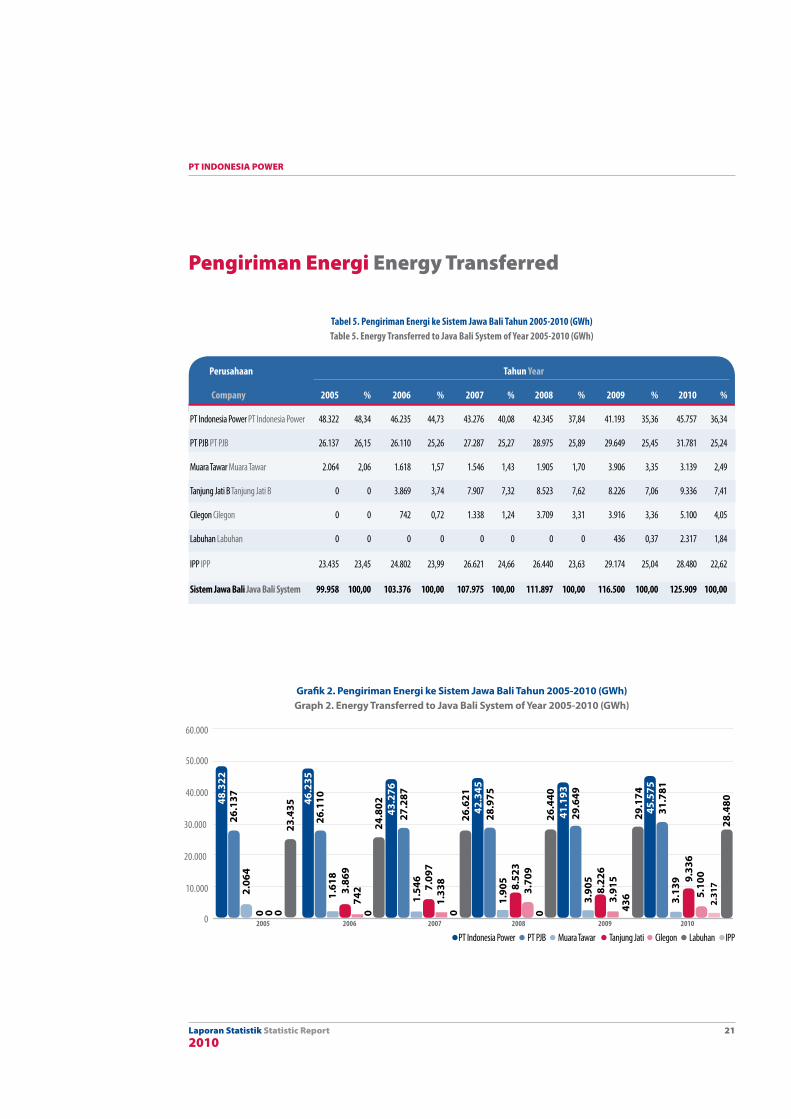
Pengiriman EnergiSelama tahun 2010, jumlah energi listrik yang dikirim ke Sistem Jawa Bali sebesar 125.909 GWh meningkat 7,52% dibandingkan tahun sebelumnya. Dari jumlah tersebut, 36,34% dikirim oleh Indonesia Power. 25,24% dikirim oleh PT PJB. 22,62% dikirim oleh IPP. 7,41% dikirim oleh Tanjung Jati B. 4,05% dikirim oleh Cilegon, 2,49% dikirim oleh Muara Tawar dan 1,69% dikirim oleh Lontar dan 0,15% dikirim oleh Indramayu.
II. Indonesia Power
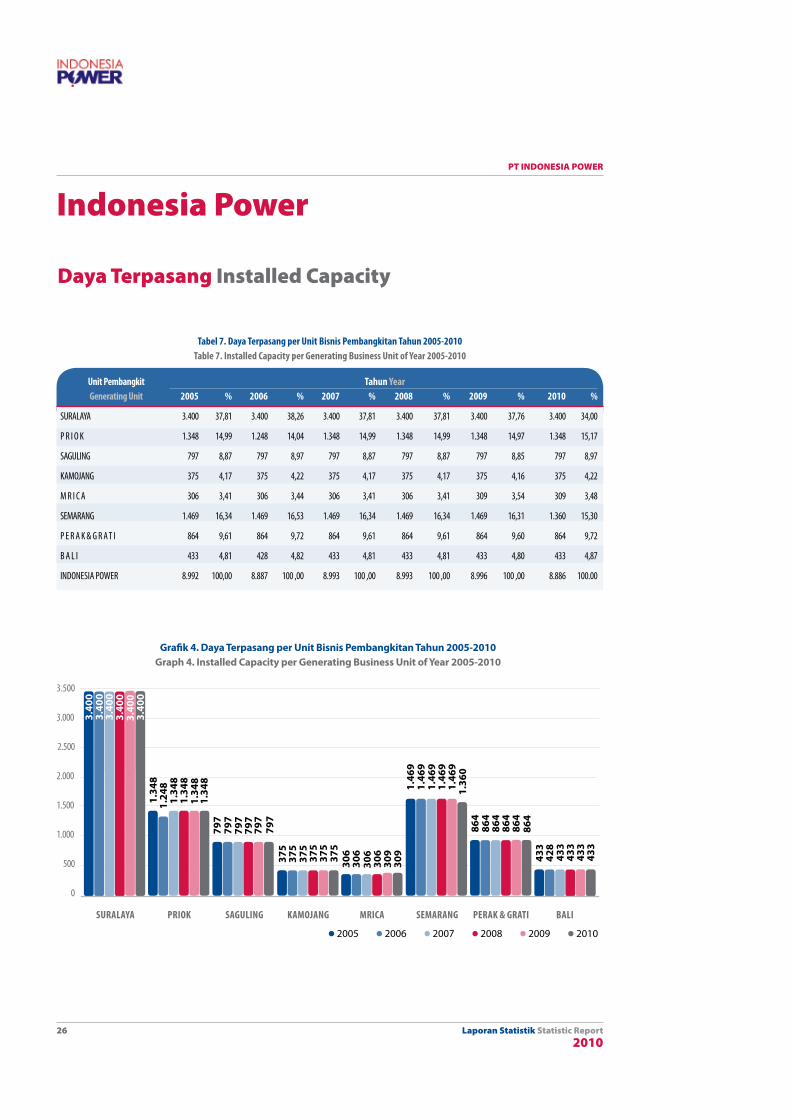
Daya TerpasangJumlah daya terpasang Indonesia Power di tahun 2010 untuk Sistem Jawa Bali sebesar 8.885,95 MW. Kapasitas terpasang terbesar milik Indonesia Power adalah UBP Suralaya dengan kapasitas terpasang 3.400 MW (38,26%), kemudian UBP Semarang sebesar 1.359,51 MW (15,30%), UBP Priok sebesar 1.348,08 MW (15,17%), UBP Perak & Grati sebesar 864,08 MW (9,72%), UBP Saguling sebesar 797,36 MW (8,97%), UBP Bali 432,68 MW (4,87%), UBP Kamojang sebesar 375 MW (4,22%), dan UBP Mrica sebesar 309,24 MW (3,48%).
Untuk per jenis pembangkit kapasitas terpasang terbesar adalah PLTU sebesar 3.900 MW (43,89%) kemudian PLTGU sebesar 2.566,08 MW (28,88%), PLTA sebesar 1.106 MW (12,45%), PLTG sebesar 846,36 MW (9,52%), PLTP sebesar 375 MW (4,22%) dan PLTD sebesar 91,91 MW (1,04%).
I. Java-Bali System
Electricity SupplyIn 2010, the total supply of electricity to the Java-Bali system reaches reaching 21.036 MW, with the details as follows Indonesia Power by 38.38% (8.074 MW), PT PJB by 28.62% (6020 MW), Muara Tawar by 3.99% (840 MW), Tanjung Jati B by 6.28% (1322 MW), Cilegon by 3.51% (739 MW) and IPP by 19.21% (4041 MW).
Energy TransferredHaving an increase of 7.52% compared to the previous year, the total energy transferred to the Java Bali System in 2010 reached 125,909 GWh, which was transferred by Indonesia Power (36.34%), PT PJB (25.24%), IPP (22.62%), Tanjung Jati B (7.41%), Cilegon (4.05%), Muara Tawar (2.49%), Lontar (1.69%) and Indramayu (0.15%).
II. Indonesia Power
Installed CapacityThe total of electricity supply of Indonesia Power in 2010 for the Java Bali System reached 8,885.95 MW. The biggest installed capacity of Indonesia Power was UBP Suralaya by 3,400 MW (38,26%, followed by UBP Semarang by 1,359.51 MW (15,30%), UBP Priok by 1,348 .08 MW (15.17%), UBP Perak & Grati by 864.08 MW (9.72%), UBP Saguling by 797.36 MW (8.97%), UBP Bali 432.68 MW (4.87%), UBP Kamojang by 375 MW (4.22%), and UBP Mrica by 309.24 MW (3.48%).
Based on power plant type, the biggest installed capacity was SPP by 3,900 MW (43.89%) followed by CCPP by 2,566.08 MW (28.88%), HEPP by 1,106 MW (12.45%), GTPP by 846.36 MW (9.52%), GPP by 375 MW (4,22%) and DPP by 91.91 MW (1.04%).
Ringkasan Summary
Ringkasan Summary
Laporan Statistik Statistic Report2010
PT INDONESIA POWER
3
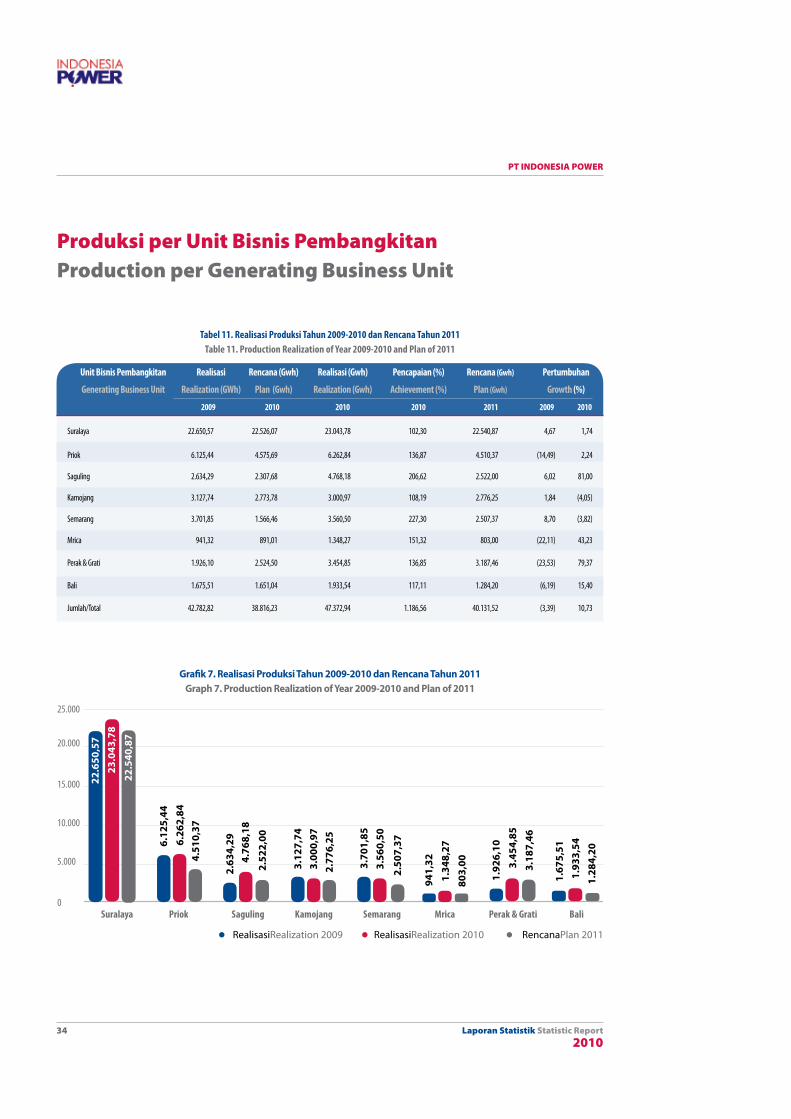
ProduksiSelama tahun 2010 Indonesia Power telah memproduksi energi listrik sebanyak 47.372,94 GWh meningkat 10,73% dari tahun sebelumnya. Produksi listrik terbesar dihasilkan oleh UBP Suralaya sebesar 23.043,78 GWh, kemudian UBP Priok sebesar 6.262,84 GWh, UBP Kamojang sebesar 3.000,97 GWh, UBP Perak & Grati sebesar 3.454,85 GWh, UBP Saguling sebesar 4.768,18 GWh, UBP Bali sebesar 1.933,54 GWh, UBP Semarang sebesar 3.560,50 GWh, dan UBP Mrica sebesar 1.348,27 GWh.
Berdasarkan jenis pembangkit, PLTU mencapai produksi tertinggi sebesar 23.043,78 GWh, kemudian PLTGU sebesar 10.960,80 GWh, PLTA sebesar 6.116,45 GWh, PLTP sebesar 3.000,97 GWh, PLTG sebesar 1.994,04 GWh, dan PLTD Sebesar 135,80 GWh.
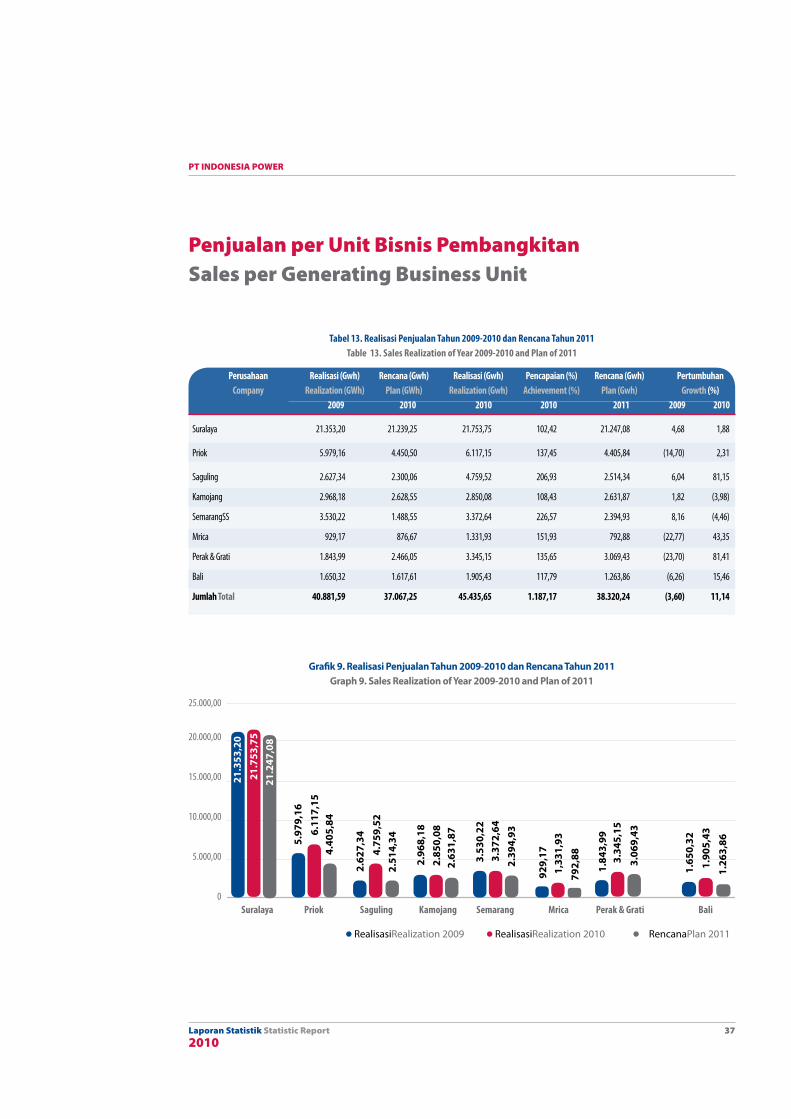
PenjualanRealisasi penjualan energi listrik untuk sistem Jawa Bali mencapai 45.435,65 GWh, meningkat 11,14% dari tahun sebelumnya.
Berdasarkan jenis pembangkit, PLTU mencapai penjualan tertinggi sebesar 23.685,52 GWh, kemudian PLTGU sebesar 10.709,95 GWh, PLTA sebesar 6.091,44 GWh, PLTP sebesar 2.850,08 GWh, PLTG sebesar 1.972,35 GWh, dan PLTD Sebesar 125,83 GWh.
III. Pemakaian Sendiri
Untuk pemakaian sendiri Indonesia Power di Tahun 2010 sebesar 1.937,29 GWh, menurun 0,35% dari tahun sebelumnya. UBP Suralaya adalah Unit yang banyak mengkonsumsi energi listrik untuk pemakaian sendiri yaitu sebesar 1.290,03 GWh, kemudian UBP Semarang sebesar 187,86 GWh, UBP Kamojang Sebesar 150,90 GWh, UBP Priok 145,68 GWh UBP Perak & Grati sebesar 109,70 GWh, UBP Bali sebesar 28,11 GWh, UBP Mrica sebesar 16,34 GWh dan UBP Saguling sebesar 8,67 GWh.
ProductionIn 2010 Indonesia Power has produced electrical energy 47,372.94 GWh an increase of 10.73% compared to the previous year. The biggest electricity production was produced by GBU Suralaya by 23,043.78 GWh, followed by GBU Priok by 6,262.84 GWh, GBU Kamojang by 3,000.97 GWh, GBU Perak & Grati by 3,454.85 GWh, GBU Saguling by 4,768.18 GWh, GBU Bali by 1,933.54 GWh, GBU Semarang by 3,560.50 GWh and GBU Mrica by 1,348.27 GWh.
Based on power plant type, SPP has attained the biggest production by 23,043.78 GWh, followed by CCPP by 10,960.80 GWh, HEPP by 6,116.45 GWh, geothermal power plants by 3,000.97 GWh, GTPP of 1,994.04 GWh, and DPP by 135,80 GWH.
SalesRealization of electric energy sales for the Java Bali System reached 45,435.65 GWh, increase of 11.14% compared to the previous year.
Based on the type of plant, SPP has attained the highest sales of 23,685.52 GWh, followed by CCPP by 10,709.95 GWh, HEPP by 6,091.44 GWh, GPP by 2,850.08 GWh, GTPP by 1,972.35 GWh, and DPP by 125,83 GWh.
III. Self Consumption
Indonesia Power for its own use in the year 2010 amounted to 1,937.29 GWh, a decrease of 0.35% compare to the previous year. GBU Suralaya was the largest self consumer by 1290.03 GWh, followed by GBU Semarang by 187.86 GWh, GBU Kamojang by 150.90 GWh, GBU Priok by 145.68 GWh, GBU Perak & Grati by 109.70 GWh, GBU Bali by 28.11 GWh, GBU Mrica by 16.34 GWh and GBU Saguling by 8.67 GWh.
Ringkasan Summary
Laporan Statistik Statistic Report2010
PT INDONESIA POWER
4
Pemakaian Bahan BakarSelama tahun 2010 terjadi penurunan pemakaian jenis bahan bakar HSD dan batubara, sedangkan pemakaian jenis bahan bakar MFO dan gas terjadi kenaikan. Untuk jenis MFO pemakaian sebesar 638.800,58 kiloliter, naik 19,46%, pemakaian gas mencapai 24,019 MMFCS naik 2,71% dan pemakaian HSD sebesar 2.174.475,63 kiloliter turun 3,55%. Sedangkan, pemakaian batubara menurun 0,18% atau mencapai 11.834.813,44 ton
KinerjaFaktor keandalan pembangkit Indonesia Power yang tercermin pada Equivalent Availability Factor (EAF) di tahun 2010 sebesar 88,43% meningkat 1,83% dari tahun sebelumnya. Faktor keandalan lainnya yaitu Operating Avabilitas Factor (OAF) sebesar 90,71% lebih tinggi 1,24% dari tahun sebelumnya. Faktor efiensi pembangkit Capacty Factor (CF) selama tahun 2010 sebesar 63,07% atau meningkat 6,21% dari tahun sebelumnnya.
PendapatanPada tahun 2010, jumlah aktiva Indonesia Power mengalami penurunan sebesar 2,58% menjadi Rp 52.338 Miliar dibandingkan tahun sebelumnnya. Pendapatan penjualan energi listrik mengalami peningkatan 2,37% dari tahun 2009 menjadi 34.143 Miliar.
KepegawaianJumlah pegawai Indonesia Power di tahun 2010 mencapai 3.375 pegawai, meningkat 2,49% dibandingkan tahun sebelumnnya. Dengan komposisi terbesar 25,39% pegawai berusia antara 46-50 tahun. Dari jumlah seluruh pegawai sebanyak 62,34% pegawai berjenjang pelaksana dan 53,01% pegawai berpendidikan SMK
Fuel ConsumptionIn 2010, the consumption of HSD and coal decrease, meanwhile the consumption of MFO and gas increased. The consumption of MFO 638,800.58 kiloliters, an increased of 19.46%, the consumption of gas reached 24.019 MMFCS increase 2.71% and consumption of HSD reached 2,174,475.63 kiloliters a decreased of 3.55%. For the time being, the coal consumption reduced by 0,18% or reached 11,834,813.44 tons.
PerformanceIndonesia Power plant reliability factors are reflected in the Equivalent Availability Factor (EAF) in the year 2010 amounted to 88.43% up 1.83% from the previous year. The other reliability factor was the Operating Availability Factor(OAF) increased of 1.24% or reached 90.71%. In 2010 the efficiency of power plant, the Capacity Factor (CF) increased 6,21% to 63,07% from the previous year.
RevenueIn 2010, the total assets of Indonesia Power have decreased by 2.58% to IDR 52,338 billion compared to the previous year. And, the revenue of electricity sales increased by 2.37% compared to 2009 to IDR 34,143 billion.
Human ResourcesThe total number of Indonesia Power’s employees in 2010 reached 3,375 employees, increase of 2,49% compared to the previous year. The composition of the number was dominated by 46-50 years old employees, which occupied 25,39%. Out of total employees, who were categorized as staff reached 62,34% and those who had high school level of education were 53,01%.
Ringkasan Summary
Laporan Statistik Statistic Report2010
PT INDONESIA POWER
5
Kata Pengantar Foreword
PT Indonesia Power tahun ini menerbitkan Buku Statistik Indonesia Power Tahun 2010 yang merupakan penerbitan lanjutan dari buku statistik tahun sebelumnya. Data pada buku ini disusun berdasarkan hasil data laporan Unit Bisnis, konsolidasi laporan Kantor Pusat Indonesia Power dan PT PLN Penyaluran dan Pusat Pengaturan Beban Jawa Bali. Buku ini dimaksudkan untuk memberikan informasi mengenai hasil kerja perusahaan di bidang Pengusahaan Pembangkit, Niaga, Keuangan, dan SDM tahun 2010 dan perkembangannya selama 5 tahun terakhir. Data statistik disajikan dalam bentuk grafik dan tabel yang dirinci berdasarkan satuan unit bisnis dan jenis pembangkit. Isi Buku Statistik Indonesia Power tahun 2010 terdiri atas dua bagian:1. Sistem Kelistrikan Jawa Bali, yaitu data penyediaan
tenaga listrik dan produksi energi listrik PT Indonesia Power, PT Pembangkitan Jawa Bali, dan Penyedia Listrik Swasta.
2. Kinerja PT Indonesia Power yang terdiri dari Data Pengusahaan Pembangkit, Niaga, Keuangan dan Kepegawaian.
Kami sangat mengharapkan saran dan kritik yang membangun dari para pembaca untuk meningkatkan kualitas buku statistik PT Indonesia Power berikutnya.
Direktur Utama President Director
Djoko Hastowo
Indonesia Power publishes the 2010 Statistic Book, which is continuous edition from the previous year. Data is classified based on Business Unit Report,Consolidated Report of Indonesia Power and PT PLN Penyaluran dan Pusat Pengaturan Beban Jawa Bali. Statistic Book pro-vides information about Indonesia Power’s performance in several areas, i.e. Electricity Supply, Sales, Finance and Human Resource in 2010 and its development during the last 5 years. Statistical data presented in the form of graphs and tables are broken down by business unit and plant types. Statistics Book contents Indonesia Power in 2010 consisted of two parts: 1. The Electrical System of Java Bali; Electricity Supply
and energy production of PT Indonesia Power, PT Pembangkitan Jawa Bali and Independent Power
Producers.2. Performance of Indonesia Power; Power Plant,
Sales,Finance and Human Resources Performance.
Hopefully this book will provide any information you need. We look forward for your feedback and critics in order to make this book better in the future.
Kata Pengantar Foreword

Laporan Statistik Statistic Report2010
PT INDONESIA POWER
6
Identitas Perusahaan Corporate identity
NamaPT Indonesia Power
Bidang UsahaPembangkitan tenaga listrik
Komposisi Pemegang Sahama. PT PLN (Persero) sebanyak 1 lembar saham seri 1
dan 5.215.647.598 lembar saham seri 2b. Yayasan Pendidikan dan Kesejahteraan PT PLN
(Persero) sebanyak 1 lembar saham seri 2
Dasar Hukum PendirianAkte Pendirian PT Indonesia Power tanggal 8 Agustus 2000
Modal DasarRp10.000.000.000.000,- (sepuluh triliun rupiah)
Modal Ditempatkan Dan Telah Disetor Penuh Rp2.607.823.800.000,- (dua triliun enam ratus tujuh miliar delapan ratus dua puluh tiga juta delapan ratus ribu rupiah)
Kronologis Pencatatan SahamIndonesia Power belum pernah mencatatkan saham di Bursa Efek Indonesia
Kronologis Pencatatan Efek LainnyaIndonesia Power belum mencatatkan kepemilikan efek dan surat berharga lainnya di Bursa Efek Indonesia
Kantor PusatJl. Jenderal Gatot Subroto Kav.18 Jakarta Selatan 12950 Phone: (62-21) 5267666 (Hunting),Faximile: (62-21) 5251923, 5252623E-mail: [email protected]: www.indonesiapower.co.id
Identitas Perusahaan Corporate Identity
Corporation NamePT Indonesia Power
Core BusinessPower Generation
Composition of Share Holdersa. PT PLN (Persero) owns 1 Shares series 1 and
5,215,647,598 Shares series 2b. Yayasan Pendidikan dan Kesejahteraan PT PLN
(Persero) owns 1 Shares series 2
Establishment Legal BasisPT Indonesia Power Deed of Establishment dated 8 Agust 2000
Authorized Capital Rp10.000.000.000.000,- (ten trillion rupiah)
Has Issued And Fully PaidRp2.607.823.800.000,- (two trillion, six hundred and seven billion eight hundred twenty three million eight hundred thousand rupiah)
Chronological Listing Shares Indonesia Power has never been listed shares on the Indonesia Stock Exchange
Chronological Listing of Other StockIndonesia Power has never listed the ownership of stocks and other securities in Indonesia Stock Exchange
Head OfficeJl. Jenderal Gatot Subroto Kav.18 Jakarta Selatan 12950 Phone :(62-21) 5267666 (Hunting), Faximile : (62-21) 5251923, 5252623E-mail : [email protected] www.indonesiapower.co.id
Laporan Statistik Statistic Report2010
PT INDONESIA POWER
7
Sejarah Singkat Indonesia Power In Brief
PT Indonesia Power selanjutnya disebut “Indonesia Power” merupakan salah satu anak perusahaan PT PLN (Persero) yang didirikan pada tanggal 3 Oktober 1995 dengan nama PT PLN Pembangkitan Jawa Bali I (PT PJB I) melalui Surat Keputusan Menteri Kehakiman Republik Indonesia Nomor C2-12496 HT.01.01.TH 1995.
Pada tanggal 3 Oktober 2000 PT PJB I berganti nama menjadi Indonesia Power sebagai penegasan atas tujuan perusahaan yang menjadi perusahaan pembangkitan tenaga listrik independen yang berorientasi bisnis murni. Indonesia Power merupakan perusahaan pembangkitan tenaga listrik terbesar di Indonesia dengan kepemilikan saham sebanyak 1 lembar saham seri 1 dan 5.215.647.598 lembar saham seri 2 oleh PT PLN (Persero) dan sebanyak 1 lembar saham seri 2 oleh Yayasan Pendidikan dan Kesejahteraan PT PLN (Persero).
Dengan identitas baru, Indonesia Power mendeklarasikan Visi dan Misi yang terintegrasi dengan rencana baru untuk menjadi perusahaan publik dan meningkatkan diri menjadi pembangkit kelas dunia. Untuk mendukung terealisasinya keinginan tersebut, Indonesia Power dan seluruh Unit Bisnisnya telah berbenah diri. Hal ini dibuktikan dengan diperolehnya berbagai penghargaan nasional dan internasional antara lain ISO 14001 (Sistem Manajemen Lingkungan), ISO 9001 (Sistem Manajemen Mutu), SMK 3 dari Departemen tenaga Kerja dan Transmigrasi Indonesia, Penghargaan Padma untuk bidang pengembangan masyarakat dan Asean Renewable Energy Award.
Indonesia Power memegang peran penting dalam mendukung tersedianya energi listrik di sistem Jawa Bali dengan mengoperasikan berbagai jenis pembangkit dengan total kapasitas terpasang sebesar 8.885,95 MW dan kemampuan produksi bersih 6.489,90 MW.
PT Indonesia Power, hereinafter referred to as “Indone-sia Power”, is one of the subsidiaries of PT PLN (Persero) which was established in 3 October 1995 and formerly known as PT PLN Pembangkitan Jawa Bali I (PT PJB I) as stipulated on the Minister of Justice of the Republic of Indonesia’s Decree No. C2-12496 HT.01.01. Year 1995.
PT PJB I changed its name in 3 October 2000 to assert the Company’s new goal, being an independent power company with purely business-oriented. Indonesia Pow-er is the largest power plant in Indonesia with share pro-prietary of 1 share sheet series and 5,215,647,598 share sheets series 2 by PT PLN (Persero) and 1 share sheet se-ries 2 by Yayasan Pendidikan dan Kesejahteraan PT PLN (Persero).
Having new identity, Indonesia Power declares its vi-sions and missions which are integrated with its new agenda - being a public company and conducting self- improvement in order to be a worldclass power gener-ating company. Indonesia Power and all of its business units have been improving themselves in order to reach the goals. This effort is evidenced by some national and international awards, such as ISO 14001 (Environmental Management System), ISO 9001 (Quality Management System), SMK 3 from Department of Labour and Trans-migration of Republic of Indonesia, Padma Award in community development area, and ASEAN Renewable Energy Award.
Indonesia Power plays very important role in providing electrical energy in Jawa-Bali system by operating vari-ous types of power plant with the total installed capac-ity of 8,885.95 MW and the net production capability of 6,489.90 MW
Sejarah Singkat PT Indonesia Power PT Indonesia Power In Brief
Laporan Statistik Statistic Report2010
PT INDONESIA POWER
8
Tujuan Perusahaan Corporate Objective
Indonesia Power memiliki tujuan untuk menyelenggarakan usaha ketenagalistrikan berdasarkan prinsip industri dan niaga yang sehat dengan menerapkan prinsip-prinsip Perseroan Terbatas, yang dilakukan melalui langkah-langkah sebagai berikut: 1. Memberikan nilai tambah bagi pelanggan, pegawai
dan pemilik 2. Menghasilkan keuntungan yang menjamin
pertumbuhan yang berkesinambungan 3. Mencapai tingkat kinerja setara dengan perusahaan
pembangkitan tenaga listrik kelas dunia 4. Membangun budaya perusahaan yang memiliki
nilai-nilai: Integritas, Profesional, Harmoni, Pelayanan
Prima, Peduli, Pembelajar dan Inovatif (IP HaPPPI).
Bidang Usaha PerusahaanIndonesia Power memiliki 4 anak perusahaan, 8 Unit Bisnis Pembangkitan (UBP) dan 1 Unit Bisnis Pemeliharaan (UBH) serta mengelola 4 Unit Bisnis Operasi dan Pemeliharaan (UBOH) yang tersebar di Jawa, Bali, sebagian Sumatera dan Kalimantan. Selain itu, Indonesia Power juga melakukan operasi dan pemeliharaan di sebagian pembangkit listrik dalam Program Percepatan Diversifikasi Energi (PPDE) 10.000 MW. Indonesia Power mengoperasikan berbagai jenis pembangkit dengan total kapasitas terpasang sebesar 8.885,95 MW.
Disamping itu, Perusahaan juga mengoperasikan unit pembangkit di luar Jawa Bali yaitu PLTD Pontianak 5x2,6 MW dan PLTG Indralaya sebesar 48,80 MW. Sehingga jumlah keseluruhan kapasitas terpasang pembangkit Indonesia Power sebesar 8.947,75 MW. Energi yang dihasilkan unit pembangkitan tersebut dijual/disalurkan melalui saluran udara tegangan tinggi (SUTT) sistem Jawa – Bali yang dikelola oleh PT PLN (Persero) dan didistribusikan kepada pelanggan retail. Disamping usaha utama, Indonesia Power juga mengembangkan usaha penunjang tenaga listrik yaitu unit bisnis pengoperasian dan pemeliharaan pembangkitan tenaga listrik (Operation & Maintenance/ O&M). Sedangkan Jasa cogeneration dan perdagangan batubara dikelola oleh anak perusahaan.
Indonesia Power aims to run an electrical power supply business based on clean Industrial and commercial principles by implementing Limited Liability Company’s principles as follows:1. Giving additional value to its customers, employees,
and owners2. Gaining profit in order to give a continuing
development assurance3. Having equal performance with world-class
electrical generating company4. Developing corporate culture by implementing
these values: Integrity, Professionalism, Harmony, Excellent
Service, Care, Curious, and Innovative (IP HaPPPI).
Company’s BusinessIndonesia Power has 4 subsidiaries, 8 Generating Business Units, and 1 Maintenance Business Unit. It also manages 4 Operational and Maintenance Business Units spread in Jawa, Bali, some regions in Sumatera, and Kalimantan. Indonesia Power also performs operations and maintenance to some electrical power plants by implementing 10,000 MW Energy Diversification Acceleration Program (PPDE). Indonesia Power operates various types of power plants with the total installed capacity of 8,885.95 MW.
The Company also operates generating units outside Jawa Bali area, namely PLTD Pontianak which produces 5x2.6 MW and PLTG Indralaya which produces 48.80 MW. Thus, total installed capacity of all Indonesia Power’s power plants reaches 8,947.75 MW. The energy produced by the generating units is sold/distributed through Jawa-Bali system’s High Voltage Overhead Line (SUTT) maintained by PT PLN (Persero). It is also distributed to retail customers. Besides running its main business, Indonesia Power also develops electrical power supporting industries or power plants’ operating and maintenance business unit Operation & Maintenance/O&M). Whereas the subsidiaries maintain cogeneration and coal trading services.
Tujuan Perusahaan Corporate Objective
Laporan Statistik Statistic Report2010
PT INDONESIA POWER
9
Tujuan Perusahaan Corporate identity
Laporan Statistik Statistic Report2010
PT INDONESIA POWER
9
Laporan Statistik Statistic Report2010
PT INDONESIA POWER
10
Daftar Isi Contents
Daftar Isi Contents
Ringkasan Summary Kata Pengantar Foreword Identitas Perusahaan Corporate Identity Sejarah Singkat PT Indonesia Power PT Indonesia Power In Brief Tujuan Perusahaan Corporate Objective Daftar Isi Contents Daftar Tabel Table List Daftar Grafik Graph List Sistem Jawa Bali Java Bali System Penyediaan Tenaga Listrik Electricity Supply Pengiriman Energi Energy Transferred Indonesia Power Daya Terpasang Installed Capacity Produksi, Penjualan dan Pemakaian Sendiri Production, Sales and Self Consumption Produksi per Unit Bisnis Pembangkitan Production per Generating Business Unit Penjualan per Unit Bisnis Pembangkitan Sales per Generating Business Unit Pemakaian Sendiri per Unit Bisnis Pembangkitan Self Consumption per Generating
Business Unit Produksi per Jenis Pembangkit Production per Power Plant Type Penjualan per Jenis Pembangkit Sales per Power Plant Type Pemakaian Sendiri per Jenis Pembangkit Self Consumption per Power Plant Type Pemakaian Bahan Bakar Fuel Consumption Pemakaian Bahan Bakar per Unit Bisnis Pembangkitan Fuel Consumption per Generating
Business Unit Pemakaian Bahan Bakar per Jenis Pembangkit Fuel Consumption per Power Plant Type Kinerja Performance Kinerja per Unit Bisnis Pembangkitan Performance per Generating Business Unit Kinerja per Jenis Pembangkit Performance per Power Plant Type Pendapatan Penjualan Energi Listrik Electricity Sales Revenue Kepegawaian Human Resources Penjelasan Glosarry of Term Daftar Singkatan Abbreviation
25678
1011141718212526313437
4044475055
606365677583899596
Laporan Statistik Statistic Report2010
PT INDONESIA POWER
11
Daftar Tabel Table List
1. Penyediaan Tenaga Listrik Sistem Jawa Bali Tahun 2005-2010 (MW) Electricity Supply of Java Bali System of Year 2005-2010 (MW)
2. Penyediaan Tenaga Listrik PT PJB (MW) Tahun 2010 Electricity Supply of PT PJB (MW) in 20103. Penyediaan Tenaga Listrik PMT, TJB, Cilegon dan Labuhan (MW) Tahun 2010 Electricity Supply of
PMT, TJB, Cilegon and Labuhan (MW) in 20104. Penyediaan Tenaga Listrik IPP (MW) Tahun 2010 Electricity Supply of IPP (MW) 2010 5 Pengiriman Energi ke Sistem Jawa Bali Tahun 2005-2010 (GWh) Energy Transferred to Java Bali
System of Year 2005-2010 (GWh)6. Realisasi Pengiriman Energi ke Sistem Jawa Bali Tahun 2009-2010 dan Rencana Tahun 2011
(GWh) Realization of Energy Transferred to Java Bali System of Year 2009-2010 and Plan of 2011 (GWh)
7. Daya Terpasang per Unit Bisnis Pembangkitan Tahun 2005-2010 Installed Capacity per Generating Business Unit of Year 2005-2010
8. Daya Terpasang per Jenis Pembangkit Tahun 2005-2010 Installed Capacity per Power Plant Type of Year 2005-2010
9. Daya Terpasang Tahun 2010 Installed Capacity in 201010. Pertumbuhan Produksi, Penjualan dan Pemakaian Sendiri Tahun 2005-2010 Production Growth,
Sales and Self Consumption of Year 2005-201011. Realisasi Produksi Tahun 2009-2010 dan Rencana Tahun 2011 Production Realization of Year
2009-2010 and Plan of 2011 12. Produksi per Unit Bisnis Pembangkitan Tahun 2010 Production per Generating Business Unit in
201013. Realisasi Penjualan Tahun 2009-2010 dan Rencana Tahun 2011 Sales Realization of Year 2009-
2010 and Plan of 201114. Penjualan per Unit Bisnis Pembangkitan Tahun 2010 (GWh) Sales per Generating Business Unit in
2010 (GWh)15. Realisasi Pemakaian Sendiri Tahun 2009-2010 dan Rencana Tahun 2011 Self Consumption
Realization of Year 2009-2010 and Plan of 201116. Pemakaian Sendiri per Unit Bisnis Pembangkitan Tahun 2010 (GWh) Self Consumption per
Generating Business Unit in 2010 (GWh)17. Prosentase Pemakaian Sendiri Terhadap Produksi Tahun 2009-2010 dan Rencana Tahun 2011 Self
Consumption Percentage Towards Production of Year 2009-2010 and Plan of 201118. Realisasi Produksi per Jenis Pembangkit Tahun 2009-2010 dan Rencana Tahun 2011 Production
Realization of Power Plant Type of Year 2009-2010 and Plan of 201119. Produksi per Jenis Pembangkit Tahun 2010 (GWh) Production of Power Plant Type in 2010 (GWh)20. Realisasi Penjualan per Jenis Pembangkit Tahun 2009-2010 dan Rencana Tahun 2011 Sales
Realization of Power Plant Type of Year 2009-2010 and Plan of 201121. Penjualan per Jenis Pembangkit Tahun 2010 (GWh) Sales of Power Plant Type in 2010 (GWh)22. Realisasi Pemakaian Sendiri per Jenis Pembangkit Tahun 2009-2010 dan Rencana Tahun 2011
Self Consumption Realization of Power Plant Type of Year 2009-2010 and Plan of 2011
1819
2020
21
22
26
2728
32
34
35
37
38
40
41
42
4445
4748
50
Daftar Tabel Table List
Laporan Statistik Statistic Report2010
PT INDONESIA POWER
12
Daftar Table Table List
23. Pemakaian Sendiri per Jenis Pembangkit Tahun 2010 (GWh) Self Consumption of Power Plant Type in 2010 (GWh)
24. Prosentase Pemakaian Sendiri Terhadap Produksi Tahun 2009-2010 dan Rencana Tahun 2011 Self Consumption Percentage Towards Production of Year 2009-2010 and Plan of 2011
25. Pemakaian Bahan Bakar Tahun 2005-2010 Fuel Consumption of Year 2005-201026. Realisasi Pemakaian Bahan Bakar per Unit Bisnis Pembangkitan Tahun 2009-2010 dan Rencana
Tahun 2011 Fuel Consumption Realization per Generating Business Unit of Year 2005-2010 and Plan of 2011
27. Pemakaian Bahan Bakar per Unit Bisnis Pembangkitan Tahun 2010Fuel Consumption per Generating Business Unit in 2010
28. Realisasi Pemakaian Bahan Bakar per Jenis Pembangkit Tahun 2009-2010 dan Rencana Tahun 2011Fuel Consumption Realization per Power Plant Type of Year 2005-2010 and Plan of 2011
29. Pemakaian Bahan Bakar per Jenis Pembangkit Tahun 2010 Fuel Consumption per Power Plant Type in 2010
30. Kinerja Unit Bisnis Pembangkitan Indonesia Power Tahun 2005-2010 Indonesia Power Generating Business Unit Performance of Year 2005-2010
31. Realisasi EAF (%) Tahun 2009-2010 dan Rencana Tahun 2011 EAF Realization (%) of Year 2009-2010 and Plan of 2011
32. Kinerja Unit Bisnis Pembangkitan Suralaya Tahun 2010 Suralaya Generating Business Unit Performance in 2010
33. Kinerja Unit Bisnis Pembangkitan Priok Tahun 2010 Priok Generating Business Unit Performance in 2010
34. Kinerja Unit Bisnis Pembangkitan Saguling Tahun 2010 Saguling Generating Business Unit Performance in 2010
35. Kinerja Unit Bisnis Pembangkitan Kamojang Tahun 2010 Kamojang Generating Business Unit Performance in 2010
36. Kinerja Unit Bisnis Pembangkitan Mrica Tahun 2010 Mrica Generating Business Unit Performance in 2010
37. Kinerja Unit Bisnis Pembangkitan Semarang Tahun 2010 Semarang Generating Business Unit Performance in 2010
38. Kinerja Unit Bisnis Pembangkitan Perak dan Grati Tahun 2010 Perak dan Grati Generating Business Unit Performance in 2010
39. Kinerja Unit Bisnis Pembangkitan Bali Tahun 2010 Bali Generating Business Unit Performance in 2010
40. Kinerja Unit Bisnis Pembangkitan PLTA Tahun 2010 Hydro Power Plant Performance in 201041. Kinerja Unit Bisnis Pembangkitan PLTU Tahun 2010 Steam Power Plant Performance in 201042. Kinerja Unit Bisnis Pembangkitan PLTGU Tahun 2010 Combined Cycle Power Plant Performance
in 201043. Kinerja Unit Bisnis Pembangkitan PLTG Tahun 2010 Gas Power Plant Performance in 201044. Kinerja Unit Bisnis Pembangkitan PLTP Tahun 2010 Geothermal Power Plant Performance in 201045. Kinerja Unit Bisnis Pembangkitan PLTD Tahun 2010 Diesel Power Plant Performance in 2010
51
5256
60
61
63
63
66
67
67
68
69
70
71
72
73
747576
77787980

Laporan Statistik Statistic Report2010
PT INDONESIA POWER
13
46. Pertumbuhan Jumlah Aktiva dan Pendapatan Penjualan Energi Listrik Tahun 2005-2010 Total Asset Growth and Electricity Sales Revenue of Year 2005-201047. Pendapatan Penjualan Energi Listrik per Unit Bisnis Pembangkitan Tahun 2010 Electricity Sales Revenue per Generating Business Unit of Year 201048. Pendapatan Penjualan Energi Listrik per Jenis Pembangkit Tahun 2010 Electricity Sales Revenue per Power Plant Type in 2010 49. Jumlah Pegawai Tahun 2005-2010 Total Employees of Year 2005-201050. Jumlah Pegawai berdasarkan Usia Tahun 2010 Total Employees based on Age of Year 201051. Jumlah Pegawai berdasarkan Jabatan Tahun 2010 Total Employees based on Position in 201052. Jumlah Pegawai berdasarkan Jenis Kelamin Tahun 2010 Total Employees based on Gender in
201053. Jumlah Pegawai berdasarkan Pendidikan Tahun 2010 Total Employees based on Education of
Year 2010
84
85
86909192
93
94
Daftar Tabel Table List

Laporan Statistik Statistic Report2010
PT INDONESIA POWER
14
1. Penyediaan Tenaga Listrik Sistem Jawa Bali Tahun 2005-2010 (MW) Electricity Supply of Java Bali System of Year 2005-2010 (MW)
2. Pengiriman Energi ke Sistem Jawa Bali Tahun 2005-2010 (GWh) Energy Transferred to Java Bali System of Year 2005-2010 (GWh)
3. Realisasi Pengiriman Energi ke Sistem Jawa Bali Tahun 2009-2010 dan Rencana Tahun 2011 (GWh) Realization of Energy Transferred to Java Bali System in 2009-2010 and Plan of 2011 (GWh)
4. Daya Terpasang per Unit Bisnis Pembangkitan di Tahun 2005-2010 Installed Capacity per Generating Business Unit of Year 2005-2010
5. Daya Terpasang per Jenis Pembangkit Tahun 2005-2010 Installed Capacity per Power Plant Type of Year 2005-2010
6. Produksi dan Penjualan Tahun 2005-2010 Production and Sales of Year 2005-20107. Realisasi Produksi Tahun 2009-2010 dan Rencana Tahun 2011 Production Realization of Year
2009-2010 and Plan of 20118. Produksi per Unit Bisnis Pembangkitan Tahun 2010 Production per Generating Business Unit in
20109. Realisasi Penjualan Tahun 2009-2010 dan Rencana Tahun 2011 Sales Realization of Year 2009-
2010 and Plan of 201110. Penjualan per Unit Bisnis Pembangkitan Tahun 2010 (GWh) Sales per Generating Business Unit in
2010 (GWh)11. Realisasi Pemakaian Sendiri Tahun 2009-2010 dan Rencana Tahun 2011 Self Consumption
Realization of Year 2009-2010 and Plan of 201112. Pemakaian Sendiri per Unit Bisnis Pembangkitan Tahun 2010 (GWh) Self Consumption per
Generating Business Unit in 2010 (GWh)13. Prosentase Pemakaian Sendiri Terhadap Produksi Tahun 2009-2010 dan Rencana Tahun 2011 Self
Consumption Percentage Towards Production of Year 2009-2010 and Plan of 201114. Realisasi Produksi per Jenis Pembangkit Tahun 2009-2010 dan Rencana Tahun 2011 Production
Realization of Power Plant Type of Year 2009-2010 and Planning of 201115. Produksi per Jenis Pembangkit Tahun 2010 (GWh) Production of Power Plant Type of Year 2010
(GWh)16. Realisasi Penjualan per Jenis Pembangkit Tahun 2009-2010 dan Rencana Tahun 2011 Sales
Realization of Power Plant Type of Year 2009-2010 and Plan of 201117. Penjualan per Jenis Pembangkit Tahun 2010 (GWh) Sales of Power Plant Type in 2010 (GWh)18. Realisasi Pemakaian Sendiri per Jenis Pembangkit Tahun 2009-2010 dan Rencana Tahun 2011
Self Consumption Realization of Power Plant Type of Year 2009-2010 and Plan of 201119. Pemakaian Sendiri per Jenis Pembangkit Tahun 2010 (GWh) Self Consumption of Power Plant
Type in 2010 (GWh)20. Prosentase Pemakaian Sendiri Terhadap Produksi Tahun 2009-2010 dan Rencana Tahun 2011 Self
Consumption Percentage Towards Production of Year 2009-2010 and Plan of 201121. Pemakaian Bahan Bakar HSD dan MFO Tahun 2005-2010 HSD and MFO Consumption of Year
2005-201022. Pemakaian Bahan Bakar IDO Tahun 2005-2010 IDO Consumption of Year 2005-2010
18
21
22
26
2732
34
36
37
39
40
41
43
44
46
4749
50
51
52
5657
Daftar Grafik Graph listDaftar Grafik Graph List
Laporan Statistik Statistic Report2010
PT INDONESIA POWER
15
23. Pemakaian Bahan Bakar Gas dan Batubara Tahun 2005-2010 Gas and Coal Consumption of Year 2005-2010
24. Realisasi Pemakaian Bahan Bakar Minyak Tahun 2005-2010 dan Rencana Tahun 2011 Oil Consumption Realization of Year 2005-2010 and Plan 2011
25. Realisasi Pemakaian Bahan Bakar Gas dan Batubara Tahun 2005-2010 dan Rencana Tahun 2011 Gas and Coal Consumption Realization of Year 2005-2010 and Plan 2011
26. Pemakaian Bahan Bakar HSD, MFO dan IDO Tahun 2010 HSD, MFO and IDO Fuel Consumption in 2010
27. Pemakaian Bahan Bakar Gas dan Batubara Tahun 2010 Gas and Coal Consumption Realization in 2010
28. Kinerja Unit Bisnis Pembangkitan Indonesia Power Tahun 2005-2010 Indonesia Power Generating Business Unit Performance of Year 2005-2010
29. Kinerja Unit Bisnis Pembangkitan Suralaya Tahun 2010 Suralaya Generating Business Unit Performance in 2010
30. Kinerja Unit Bisnis Pembangkitan Priok Tahun 2010 Priok Generating Business Unit Performance in 2010
31. Kinerja Unit Bisnis Pembangkitan Saguling Tahun 2010 Saguling Generating Business Unit Performance in 2010
32. Kinerja Unit Bisnis Pembangkitan Kamojang Tahun 2010 Kamojang Generating Business Unit Performance in 2010
33. Kinerja Unit Bisnis Pembangkitan Mrica Tahun 2010 Mrica Generating Business Unit Performance in 2010
34. Kinerja Unit Bisnis Pembangkitan Semarang Tahun 2010 Semarang Generating Business Unit Performance in 2010
35. Kinerja Unit Bisnis Pembangkitan Perak dan Grati Tahun 2010 Perak dan Grati Generating Business Unit Performance in 2010
36. Kinerja Unit Bisnis Pembangkitan Bali Tahun 2010 Bali Generating Business Unit Performance in 2010
37. Kinerja Unit Bisnis Pembangkitan PLTA Tahun 2010 Hydro Power Plant Performance in 201038. Kinerja Unit Bisnis Pembangkitan PLTU Tahun 2010 Steam Power Plant Performance in 201039. Kinerja Unit Bisnis Pembangkitan PLTGU Tahun 2010 Combined Cycle Power Plant Performance
in 201040. Kinerja Unit Bisnis Pembangkitan PLTG Tahun 2010 Gas Power Plant Performance in 201041. Kinerja Unit Bisnis Pembangkitan PLTP Tahun 2010 Geothermal Power Plant Performance in 201042. Kinerja Unit Bisnis Pembangkitan PLTD Tahun 2010 Diesel Power Plant Performance in 201043. Jumlah Aktiva dan Pendapatan Penjualan Energi Listrik Tahun 2005-2010 Total Asset and
Electricity Sales Revenue of Year 2005-201044. Jumlah Pegawai Tahun 2005-2010 Total Employees of Year 2005-201045. Jumlah Pegawai berdasarkan Usia Tahun 2010 Total Employees based on Age in 201046. Jumlah Pegawai berdasarkan Jabatan Tahun 2010 Total Employees based on Position in 201047. Jumlah Pegawai berdasarkan Jenis Kelamin Tahun 2010 Total Employees based on Gender in
201048. Jumlah Pegawai berdasarkan Pendidikan Tahun 2010 Total Employees based on Education in
2010
58
60
61
62
62
66
68
69
70
71
72
73
74
757677
78798081
84909192
93
94
Daftar Grafik Graph List

Laporan Statistik Statistic Report2010
PT INDONESIA POWER
16

Laporan Statistik Statistic Report2010
PT INDONESIA POWER
17
Sistem Jawa BaliJava Bali System
• Penyediaan Tenaga Listrik | Electricity Supply• Pengiriman Energi | Energy Transferred
Laporan Statistik Statistic Report2010
PT INDONESIA POWER
18
Sistem Jawa Bali Java Bali System
Grafik 1. Penyediaan Tenaga Listrik Sistem Jawa Bali Tahun 2005-2010 (MW)Graph 1. Electricity Supply of Java Bali System of Year 2005-2010 (MW)
10.000
9.000
8.000
7.000
6.000
5.000
4.000
3.000
2.000
1.000
02005 2006 2007 2008 2009 2010
8.99
36.
477
858
858
858
840
840
840
0 0 03.
331
8.88
76.
477
1.32
0
1.32
0
1.32
0
1.32
2
1.32
2
740
7403.
934
8.95
26.
471
4.04
4
8.21
25.
716
460
3.98
7
300
8.24
96.
281
4.05
3
8.07
46.
020
4.04
1
lPT Indonesia Power l PT PJB l Muara Tawar l Tanjung Jati l Cilegon l Labuhan lIPP
0 0 0
739
739
Tabel 1. Penyediaan Tenaga Listrik Sistem Jawa Bali Tahun 2005-2010 (MW)Table 1. Electricity Supply of Java Bali System of Year 2005-2010 (MW)
Perusahaan Tahun Year Company 2005 % 2006 % 2007 % 2008 % 2009 % 2010 %
PT Indonesia Power PT Indonesia Power 8.993 45,74 8.887 40 , 01 8.952 39,99 8.212 39,99 8.249 37,87 8.074 37,38
PT PJB PT PJB 6.477 32,95 6.477 29,15 6.471 28,91 5.716 27,83 6.281 29,24 6.020 27,88
Muara Tawar Muara Tawar 858 4,36 858 3,86 858 3,83 840 4,09 840 3,91 840 3,89
Tanjung Jati B Tanjung Jati B 0 0 1.320 5,94 1.320 5 ,90 1.320 6,43 1.322 6,15 1.322 6,12
Cilegon Cilegon 0 0 740 3,33 740 3,31 460 2,24 739 3,44 739 3,42
Labuhan Labuhan 0 0 0 0 0 0 0 0 300 1,38 560 2,59
IPP IPP 3.331 16,94 3.934 17,71 4.044 18,06 3.987 19,41 4.053 18,61 4.041 18,71
Sistem Jawa Bali Java Bali System 19.659 100,00 19.659 100,00 22.385 100,00 20.536 100,00 21.784 100,00 21.596 100,00
Penyediaan Tenaga Listrik Electricity Supply
560
Laporan Statistik Statistic Report2010
PT INDONESIA POWER
19
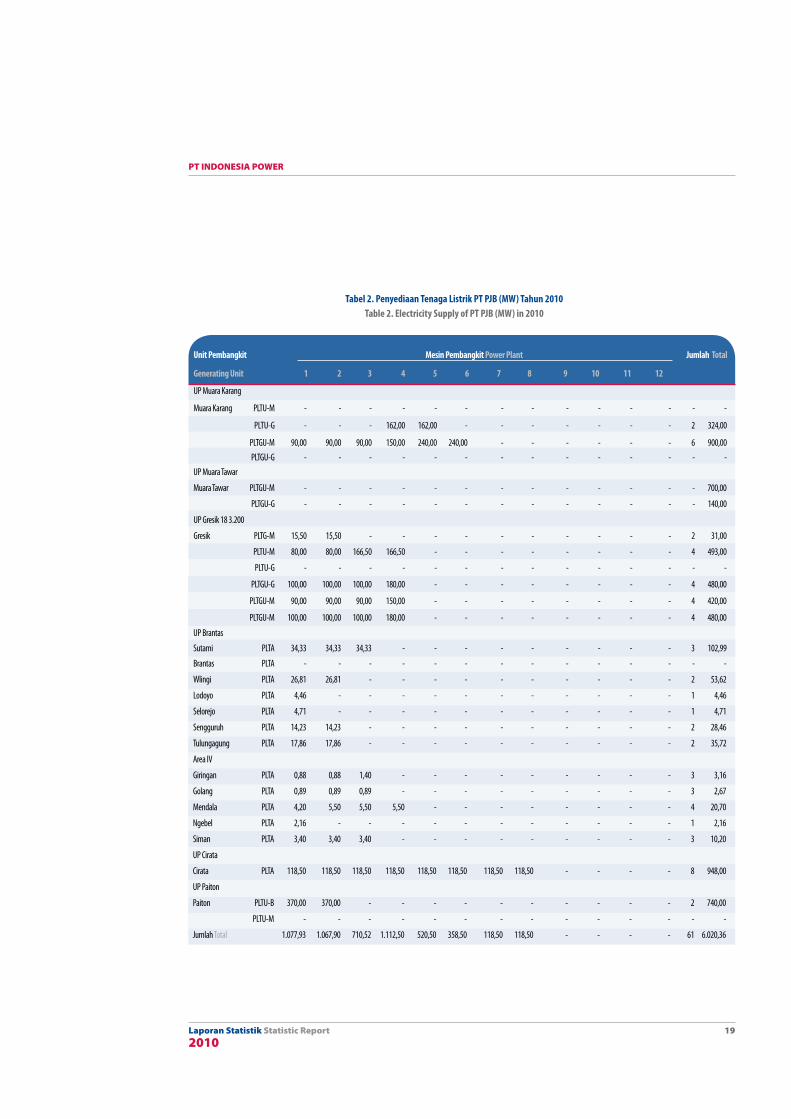
Tabel 2. Penyediaan Tenaga Listrik PT PJB (MW) Tahun 2010Table 2. Electricity Supply of PT PJB (MW) in 2010
Unit Pembangkit Mesin Pembangkit Power Plant Jumlah Total
Generating Unit 1 2 3 4 5 6 7 8 9 10 11 12
UP Muara Karang
Muara Karang PLTU-M - - - - - - - - - - - - - -
PLTU-G - - - 162,00 162,00 - - - - - - - 2 324,00
PLTGU-M 90,00 90,00 90,00 150,00 240,00 240,00 - - - - - - 6 900,00 PLTGU-G - - - - - - - - - - - - - - UP Muara Tawar
Muara Tawar PLTGU-M - - - - - - - - - - - - - 700,00
PLTGU-G - - - - - - - - - - - - - 140,00
UP Gresik 18 3.200
Gresik PLTG-M 15,50 15,50 - - - - - - - - - - 2 31,00
PLTU-M 80,00 80,00 166,50 166,50 - - - - - - - - 4 493,00
PLTU-G - - - - - - - - - - - - - -
PLTGU-G 100,00 100,00 100,00 180,00 - - - - - - - - 4 480,00
PLTGU-M 90,00 90,00 90,00 150,00 - - - - - - - - 4 420,00
PLTGU-M 100,00 100,00 100,00 180,00 - - - - - - - - 4 480,00
UP Brantas
Sutami PLTA 34,33 34,33 34,33 - - - - - - - - - 3 102,99
Brantas PLTA - - - - - - - - - - - - - -
Wlingi PLTA 26,81 26,81 - - - - - - - - - - 2 53,62
Lodoyo PLTA 4,46 - - - - - - - - - - - 1 4,46
Selorejo PLTA 4,71 - - - - - - - - - - - 1 4,71
Sengguruh PLTA 14,23 14,23 - - - - - - - - - - 2 28,46
Tulungagung PLTA 17,86 17,86 - - - - - - - - - - 2 35,72
Area IV
Giringan PLTA 0,88 0,88 1,40 - - - - - - - - - 3 3,16
Golang PLTA 0,89 0,89 0,89 - - - - - - - - - 3 2,67
Mendala PLTA 4,20 5,50 5,50 5,50 - - - - - - - - 4 20,70
Ngebel PLTA 2,16 - - - - - - - - - - - 1 2,16
Siman PLTA 3,40 3,40 3,40 - - - - - - - - - 3 10,20
UP Cirata
Cirata PLTA 118,50 118,50 118,50 118,50 118,50 118,50 118,50 118,50 - - - - 8 948,00
UP Paiton
Paiton PLTU-B 370,00 370,00 - - - - - - - - - - 2 740,00
PLTU-M - - - - - - - - - - - - - -
Jumlah Total 1.077,93 1.067,90 710,52 1.112,50 520,50 358,50 118,50 118,50 - - - - 61 6.020,36

Laporan Statistik Statistic Report2010
PT INDONESIA POWER
20
Tabel 3. Penyediaan Tenaga Listrik PMT, TJB, Cilegon dan Labuhan (MW) Tahun 2010Table 3. Electricity Supply of PMT, TJB, Cilegon and Labuhan (MW) in 2010
Unit Pembangkit Mesin Pembangkit Power Plant Jumlah Total
Generating Unit 1 2 3 4 5 6 7 8 9 10 11 12
Muara Tawar - - - - - - - - - - - - 6 840,00
Blok 3 PLTG-M 140,00 140,00 140,00 - - - - - - - - - 3 420,00
Blok 4 PLTGU-M 140,00 140,00 140,00 - - - - - - - - - 3 420,00
Tanjung Jati B PLTU-B 660,80 660,80 - - - - - - - - - - 2 1.321,6
Cilegon PLTGU-G 238,50 238,50 262,40 - - - - - - - - - 3 739,40
Labuhan PLTU-B 280,00 280,00 - - - - - - - - - - 2 560,00
Jumlah Total 1.459,30 1.459,30 542,40 - - - - - - - - - 13 3.461,00
Tabel 4. Penyediaan Tenaga Listrik IPP (MW) Tahun 2010Table 4. Electricity Supply of IPP (MW) in 2010
Unit Pembangkit Mesin Pembangkit Power Plant Jumlah Total
Generating Unit 1 2 3 4 5 6 7 8 9 10 11 12
Perum Jasa Tirta II Jatiluhur PLTA 30,00 30,00 30,00 30,00 30,00 30,00 - - - - - - 6 180,00 PT Geo Dipa Energy Dieng PLTP 45,00 - - - - - - - - - - - 1 45,00 PT Dayabumi Salak Pratama Ltd Salak PLTP - - - 61,00 61,00 61,00 - - - - - - 3 183,00 PT Magma Nusantara Listrindo Wayangwindu PLTP 112,06 113,10 - - - - - - - - - - 2 225,16 Chevron Texaco Energy Indonesia Ltd Drajat PLTP - 90,24 105,80 - - - - - - - - - 2 196,04 PT Paiton Energy (PEC) Paiton 7,8 PLTU-B - - - - - - 610,00 610,00 - - - - 2 1.220,00 PT Jawa Power Paiton 5,6 PLTU-B - - - - 610,00 610,00 - - - - - - 2 1.220,00 PT Cikarang Listrindo Power Company Cikarang PLTG-G 150,00 - - - - - - - - - - - 1 150,00 PT Krakatau Daya Listrik Krakatau PLTU-B - - - - - - - - - - - - - - PT Sumberenergi Sakti Prima Cilacap PLTU-B 281,00 281,00 - - - - - - - - - - 2 562,00 PT Pertamina Kamojang IV PLTP - - - 60,23 - - - - - - - - 1 60,23
Jumlah / Total 618,06 514,34 135,80 151,23 701,00 701,00 610,00 610,00 - - - - 22 4.041,43
Laporan Statistik Statistic Report2010
PT INDONESIA POWER
21
Pengiriman Energi Energy Transferred
48.3
2226
.137
2.06
40 0 0 0 0 0
1.33
8
3.70
9
23.4
35
26.1
1046.2
35
1.61
83.
869
24.8
02 43.2
7627
.287
1.54
67.
097
26.6
2142
.345
28.9
751.
905 8.52
3
26.4
4041
.193
29.6
493.90
5
3.91
58.
226
436 3.
139
742
29.1
7445
.575
31.7
81
2.31
728
.480
60.000
50.000
40.000
30.000
20.000
10.000
0 2005 2006 2007 2008 2009 2010
Grafik 2. Pengiriman Energi ke Sistem Jawa Bali Tahun 2005-2010 (GWh)Graph 2. Energy Transferred to Java Bali System of Year 2005-2010 (GWh)
lPT Indonesia Power l PT PJB l Muara Tawar l Tanjung Jati l Cilegon l Labuhan lIPP
9.33
65.
100
Tabel 5. Pengiriman Energi ke Sistem Jawa Bali Tahun 2005-2010 (GWh)Table 5. Energy Transferred to Java Bali System of Year 2005-2010 (GWh)
Perusahaan Tahun Year
Company 2005 % 2006 % 2007 % 2008 % 2009 % 2010 %
PT Indonesia Power PT Indonesia Power 48.322 48,34 46.235 44,73 43.276 40,08 42.345 37,84 41.193 35,36 45.757 36,34
PT PJB PT PJB 26.137 26,15 26.110 25,26 27.287 25,27 28.975 25,89 29.649 25,45 31.781 25,24
Muara Tawar Muara Tawar 2.064 2,06 1.618 1,57 1.546 1,43 1.905 1,70 3.906 3,35 3.139 2,49
Tanjung Jati B Tanjung Jati B 0 0 3.869 3,74 7.907 7,32 8.523 7,62 8.226 7,06 9.336 7,41
Cilegon Cilegon 0 0 742 0,72 1.338 1,24 3.709 3,31 3.916 3,36 5.100 4,05
Labuhan Labuhan 0 0 0 0 0 0 0 0 436 0,37 2.317 1,84
IPP IPP 23.435 23,45 24.802 23,99 26.621 24,66 26.440 23,63 29.174 25,04 28.480 22,62
Sistem Jawa Bali Java Bali System 99.958 100,00 103.376 100,00 107.975 100,00 111.897 100,00 116.500 100,00 125.909 100,00
Laporan Statistik Statistic Report2010
PT INDONESIA POWER
22
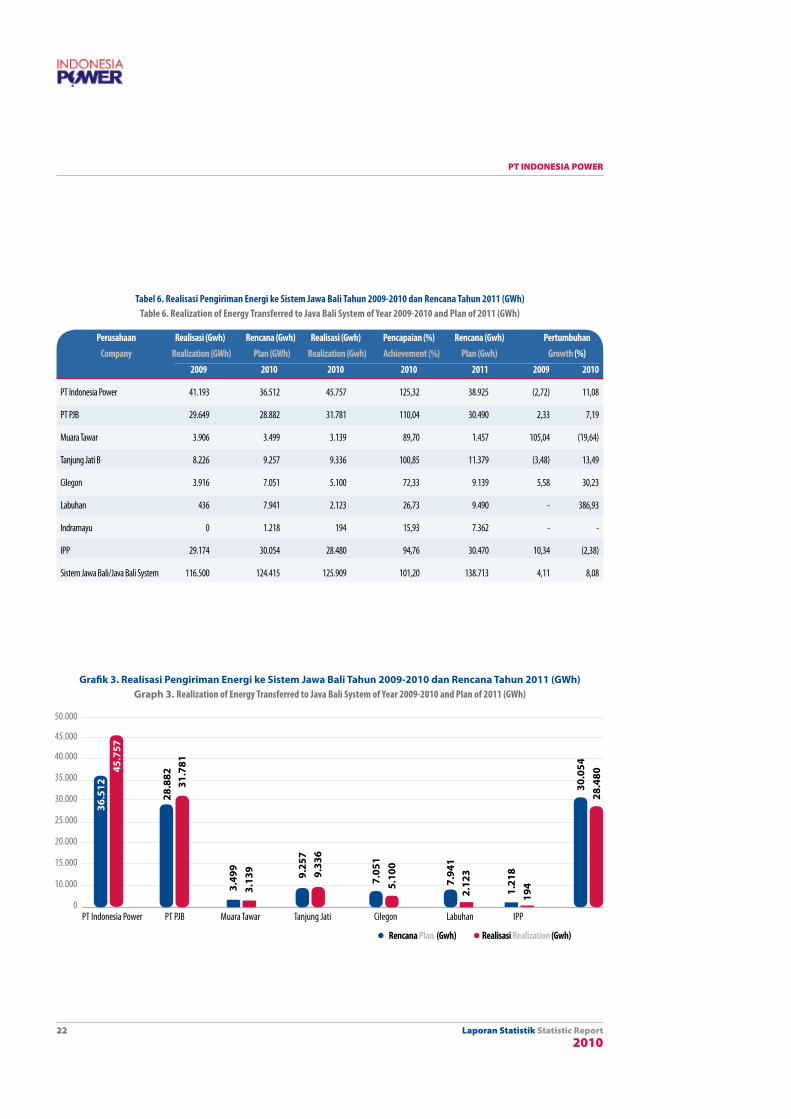
Grafik 3. Realisasi Pengiriman Energi ke Sistem Jawa Bali Tahun 2009-2010 dan Rencana Tahun 2011 (GWh)Graph 3. Realization of Energy Transferred to Java Bali System of Year 2009-2010 and Plan of 2011 (GWh)
50.000
45.000
40.000
35.000
30.000
25.000
20.000
15.000
10.000
0
l Rencana Plan (Gwh) l Realisasi Realization (Gwh)
36.5
12
28.8
82
3.4
99 9.25
7
7.05
1
7.94
1
1.21
8
30.0
5445.7
57
31.7
81
3.13
9 9.33
6
5.10
0
2.12
3
194
28.4
80
PT Indonesia Power PT PJB Muara Tawar Tanjung Jati Cilegon Labuhan IPP
Tabel 6. Realisasi Pengiriman Energi ke Sistem Jawa Bali Tahun 2009-2010 dan Rencana Tahun 2011 (GWh)Table 6. Realization of Energy Transferred to Java Bali System of Year 2009-2010 and Plan of 2011 (GWh)
Perusahaan Realisasi (Gwh) Rencana (Gwh) Realisasi (Gwh) Pencapaian (%) Rencana (Gwh) Pertumbuhan Company Realization (GWh) Plan (GWh) Realization (Gwh) Achievement (%) Plan (Gwh) Growth (%) 2009 2010 2010 2010 2011 2009 2010
PT Indonesia Power 41.193 36.512 45.757 125,32 38.925 (2,72) 11,08
PT PJB 29.649 28.882 31.781 110,04 30.490 2,33 7,19
Muara Tawar 3.906 3.499 3.139 89,70 1.457 105,04 (19,64)
Tanjung Jati B 8.226 9.257 9.336 100,85 11.379 (3,48) 13,49
Cilegon 3.916 7.051 5.100 72,33 9.139 5,58 30,23
Labuhan 436 7.941 2.123 26,73 9.490 - 386,93
Indramayu 0 1.218 194 15,93 7.362 - -
IPP 29.174 30.054 28.480 94,76 30.470 10,34 (2,38)
Sistem Jawa Bali/Java Bali System 116.500 124.415 125.909 101,20 138.713 4,11 8,08
Laporan Statistik Statistic Report2010
PT INDONESIA POWER
23
halaman ini sengaja dikosongkanThis Page Is Intentionally Left Blank

Laporan Statistik Statistic Report2010
PT INDONESIA POWER
24
Laporan Statistik Statistic Report2010
PT INDONESIA POWER
25
Indonesia Power
• Daya Terpasang | Installed Capacity
Laporan Statistik Statistic Report2010
PT INDONESIA POWER
26
Indonesia Power
Grafik 4. Daya Terpasang per Unit Bisnis Pembangkitan Tahun 2005-2010Graph 4. Installed Capacity per Generating Business Unit of Year 2005-2010
375
375
375
375
375
375
433
428
433
433
433
433
306
306
306
306
309
309
3.500
3.000
2.500
2.000
1.500
1.000
500
0
SURALAYA PRIok SAGULInG kAMoJAnG MRICA SEMARAnG PERAk & GRATI BALI
864
864
864
864
864
864
797
797
797
797
797
797
1.34
81.
248
1.34
81.
348
1.34
81.
348
3.40
03.
400
3.40
03.
400
3.40
03.
400
1.46
91.
469
1.46
91.
469
1.46
91.
360
l 2005 l 2006 l 2007 l 2008 l 2009 l 2010
Tabel 7. Daya Terpasang per Unit Bisnis Pembangkitan Tahun 2005-2010Table 7. Installed Capacity per Generating Business Unit of Year 2005-2010
Unit Pembangkit Tahun Year Generating Unit 2005 % 2006 % 2007 % 2008 % 2009 % 2010 %
SURALAYA 3.400 37,81 3.400 38,26 3.400 37,81 3.400 37,81 3.400 37,76 3.400 34,00
P R I O K 1.348 14,99 1.248 14,04 1.348 14,99 1.348 14,99 1.348 14,97 1.348 15,17
SAGULING 797 8,87 797 8,97 797 8,87 797 8,87 797 8,85 797 8,97
KAMOJANG 375 4,17 375 4,22 375 4,17 375 4,17 375 4,16 375 4,22
M R I C A 306 3,41 306 3,44 306 3,41 306 3,41 309 3,54 309 3,48
SEMARANG 1.469 16,34 1.469 16,53 1.469 16,34 1.469 16,34 1.469 16,31 1.360 15,30
P E R A K & G R A T I 864 9,61 864 9,72 864 9,61 864 9,61 864 9,60 864 9,72
B A L I 433 4,81 428 4,82 433 4,81 433 4,81 433 4,80 433 4,87
INDONESIA POWER 8.992 100,00 8.887 100 ,00 8.993 100 ,00 8.993 100 ,00 8.996 100 ,00 8.886 100.00
Daya Terpasang Installed Capacity

Laporan Statistik Statistic Report2010
PT INDONESIA POWER
27
Grafik 5. Daya Terpasang per Jenis Pembangkit Tahun 2005-2010Graph 5. Installed Capacity per Power Plant Type of Year 2005-2010
1.10
492
846
375
3.90
02.
676
871.
116
749
360
3.80
02.
773
1.10
492
846
375
3.90
0
2.67
61.
104
9284
637
53.
900
2.67
61.
107
9284
637
53.
900
2.67
6
1.10
792
846
375
3.90
02.
566
4.000
3.500
3.000
2.500
2.000
1.500
1.000
500
0
2005 2006 2007 2008 2009 2010
l PLTA l PLTD l PLTG l PLTP l PLTU l PLTGU
Tabel 8. Daya Terpasang per Jenis Pembangkit Tahun 2005-2010Table 8. Installed Capacity per Power Plant Type of Year 2005-2010
Jenis Pembangkit 2005 % 2006 % 2007 % 2008 % 2009 % 2010 %
Power Plant Type MW (%) MW (%) MW (%) MW (%) MW (%) MW (%)
PLTA 1.104 12,27 1.116 12,57 1.104 12,27 1.104 12,27 1.107 12,4 1.107 12,45
PLTD 92 1,02 87 0,98 92 1,02 92 1,02 92 1,02 92 1,03
PLTG 846 9,41 749 8,43 846 9,41 846 9,41 846 9,4 846 9,52
PLTP 375 4,17 360 4,05 375 4,17 375 4,17 375 4,16 375 4,22
PLTU 3.900 43,37 3.800 42,79 3.900 43,37 3.900 43,37 3.900 43,31 3.900 43,89
PLTGU 2.676 29,27 2.773 31,23 2.676 29,27 2.676 29,75 2.676 29,71 2.566 28,88
Indonesia Power 8.993 100,00 8.887 100,00 8.993 100,00 8.993 100,00 8.996 100,00 8.886 100,00
Laporan Statistik Statistic Report2010
PT INDONESIA POWER
28
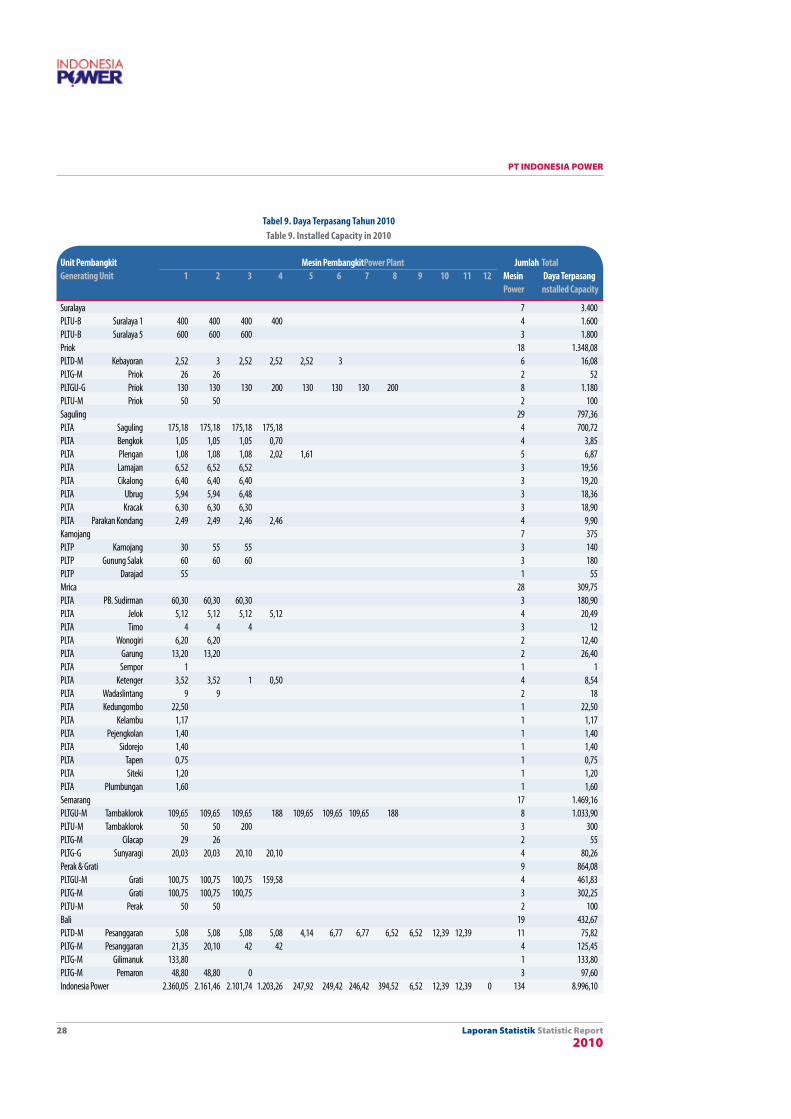
Tabel 9. Daya Terpasang Tahun 2010Table 9. Installed Capacity in 2010
Unit Pembangkit Mesin PembangkitPower Plant Jumlah TotalGenerating Unit 1 2 3 4 5 6 7 8 9 10 11 12 Mesin Daya Terpasang Power nstalled Capacity
Suralaya 7 3.400PLTU-B Suralaya 1 400 400 400 400 4 1.600PLTU-B Suralaya 5 600 600 600 3 1.800Priok 18 1.348,08PLTD-M Kebayoran 2,52 3 2,52 2,52 2,52 3 6 16,08PLTG-M Priok 26 26 2 52PLTGU-G Priok 130 130 130 200 130 130 130 200 8 1.180PLTU-M Priok 50 50 2 100Saguling 29 797,36PLTA Saguling 175,18 175,18 175,18 175,18 4 700,72PLTA Bengkok 1,05 1,05 1,05 0,70 4 3,85PLTA Plengan 1,08 1,08 1,08 2,02 1,61 5 6,87PLTA Lamajan 6,52 6,52 6,52 3 19,56PLTA Cikalong 6,40 6,40 6,40 3 19,20PLTA Ubrug 5,94 5,94 6,48 3 18,36PLTA Kracak 6,30 6,30 6,30 3 18,90PLTA Parakan Kondang 2,49 2,49 2,46 2,46 4 9,90Kamojang 7 375PLTP Kamojang 30 55 55 3 140PLTP Gunung Salak 60 60 60 3 180PLTP Darajad 55 1 55Mrica 28 309,75PLTA PB. Sudirman 60,30 60,30 60,30 3 180,90PLTA Jelok 5,12 5,12 5,12 5,12 4 20,49PLTA Timo 4 4 4 3 12PLTA Wonogiri 6,20 6,20 2 12,40PLTA Garung 13,20 13,20 2 26,40PLTA Sempor 1 1 1PLTA Ketenger 3,52 3,52 1 0,50 4 8,54PLTA Wadaslintang 9 9 2 18PLTA Kedungombo 22,50 1 22,50PLTA Kelambu 1,17 1 1,17PLTA Pejengkolan 1,40 1 1,40PLTA Sidorejo 1,40 1 1,40PLTA Tapen 0,75 1 0,75PLTA Siteki 1,20 1 1,20PLTA Plumbungan 1,60 1 1,60Semarang 17 1.469,16PLTGU-M Tambaklorok 109,65 109,65 109,65 188 109,65 109,65 109,65 188 8 1.033,90PLTU-M Tambaklorok 50 50 200 3 300PLTG-M Cilacap 29 26 2 55PLTG-G Sunyaragi 20,03 20,03 20,10 20,10 4 80,26Perak & Grati 9 864,08PLTGU-M Grati 100,75 100,75 100,75 159,58 4 461,83PLTG-M Grati 100,75 100,75 100,75 3 302,25PLTU-M Perak 50 50 2 100Bali 19 432,67PLTD-M Pesanggaran 5,08 5,08 5,08 5,08 4,14 6,77 6,77 6,52 6,52 12,39 12,39 11 75,82PLTG-M Pesanggaran 21,35 20,10 42 42 4 125,45PLTG-M Gilimanuk 133,80 1 133,80PLTG-M Pemaron 48,80 48,80 0 3 97,60Indonesia Power 2.360,05 2.161,46 2.101,74 1.203,26 247,92 249,42 246,42 394,52 6,52 12,39 12,39 0 134 8.996,10

Laporan Statistik Statistic Report2010
PT INDONESIA POWER
29
halaman ini sengaja dikosongkanThis Page Is Intentionally Left Blank
Laporan Statistik Statistic Report2010
PT INDONESIA POWER
30
Laporan Statistik Statistic Report2010
PT INDONESIA POWER
31
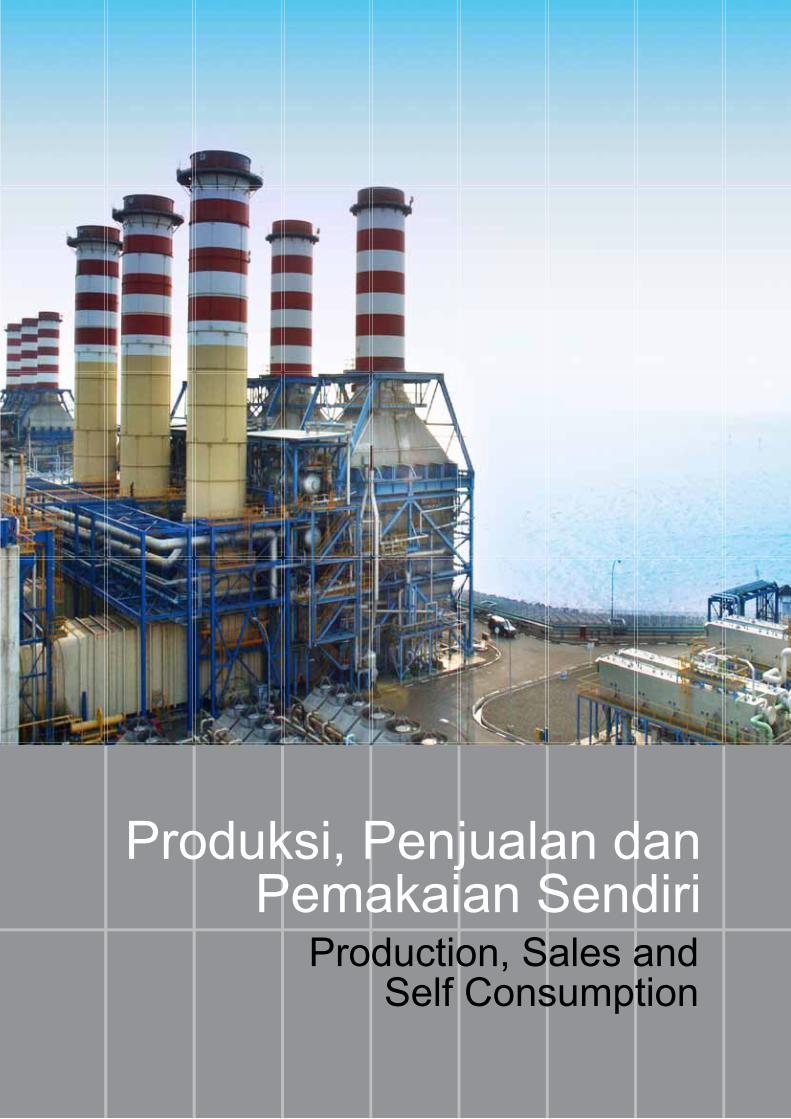
Produksi, Penjualan dan Pemakaian Sendiri
Production, Sales and Self Consumption

Laporan Statistik Statistic Report2010
PT INDONESIA POWER
32
Produksi, Penjualan dan Pemakaian Sendiri Production, Sales and Self Consumption
Grafik 6. Produksi dan Penjualan Tahun 2005-2010Graph 6. Production and Sales of Year 2005-2010
50.000
40.000
30.000
20.000
10.000
0 .2005 2006 2007 2008 2009 2010
l ProduksiProductionl PenjualanSales
48.3
22
46.2
35
45.0
71
44.2
83
42.7
83 47.3
72
46.3
85
44.2
53
43.1
35
42.4
08
40.8
82 45.4
36
Tabel 10. Pertumbuhan Produksi, Penjualan dan Pemakaian Sendiri Tahun 2005-2010Table 10. Production Growth, Sales and Self Consumption of Year 2005-2010
Uraian Realisasi Realization
Description 2005 2006 2007 2008 2009 2010
P roduksi Production (GWh) 48.322 46.235 45.071 44.283 42.783 47.373
Pertumbuhan Produksi Production Growth (%) 8,79 (4,32) (2,52) (1,75) (3,39) 10,73
Penjualan Sales (GWh) 46.385 44.253 43.135 42.408 40.882 45.436
Pertumbuhan penjualan Sales Growth (%) 9,03 (4,60) (2,53) (1,69) (3,60) 11,14
Pemakaian sendiri Self Consumption (GWh) 1.730 1.726 1.936 1.876 1.901 1.937

Laporan Statistik Statistic Report2010
PT INDONESIA POWER
33
12
10
8
6
4
2
0
-2
-4
-6
2005 2006 2007 2008 2009 2010
Pertumbuhan Penjualan/Sales Growth (%) Pertumbuhan Produksi/Production Growth (%)
Grafik. Pertumbuhan Produksi dan Penjualan Tahun 2005-2010Graph. Growth of Production and Sales of Year 2005-2010
Laporan Statistik Statistic Report2010
PT INDONESIA POWER
34
Produksi per Unit Bisnis PembangkitanProduction per Generating Business Unit
Grafik 7. Realisasi Produksi Tahun 2009-2010 dan Rencana Tahun 2011Graph 7. Production Realization of Year 2009-2010 and Plan of 2011
25.000
20.000
15.000
10.000
5.000
0Suralaya Priok Saguling kamojang Semarang Mrica Perak & Grati Bali
l RealisasiRealization 2009 l RealisasiRealization 2010 lRencanaPlan 2011
22.6
50,5
7
6.12
5,44
2.63
4,29
3.12
7,74
3.70
1,85
941,
32
1.92
6,10
1.67
5,51
23.0
43,7
8
22.5
40,8
7
6.26
2,84
4.51
0,37
4.76
8,18
2.52
2,00
3.00
0,97
2.77
6,25
3.56
0,50
2.50
7,37
1.34
8,27
3.45
4,85
1.93
3,54
803,
00 3.18
7,46
1.28
4,20
Tabel 11. Realisasi Produksi Tahun 2009-2010 dan Rencana Tahun 2011Table 11. Production Realization of Year 2009-2010 and Plan of 2011
Unit Bisnis Pembangkitan Realisasi Rencana (Gwh) Realisasi (Gwh) Pencapaian (%) Rencana (Gwh) Pertumbuhan
Generating Business Unit Realization (GWh) Plan (Gwh) Realization (Gwh) Achievement (%) Plan (Gwh) Growth (%)
2009 2010 2010 2010 2011 2009 2010
Suralaya 22.650,57 22.526,07 23.043,78 102,30 22.540,87 4,67 1,74
Priok 6.125,44 4.575,69 6.262,84 136,87 4.510,37 (14,49) 2,24
Saguling 2.634,29 2.307,68 4.768,18 206,62 2.522,00 6,02 81,00
Kamojang 3.127,74 2.773,78 3.000,97 108,19 2.776,25 1,84 (4,05)
Semarang 3.701,85 1.566,46 3.560,50 227,30 2.507,37 8,70 (3,82)
Mrica 941,32 891,01 1.348,27 151,32 803,00 (22,11) 43,23
Perak & Grati 1.926,10 2.524,50 3.454,85 136,85 3.187,46 (23,53) 79,37
Bali 1.675,51 1.651,04 1.933,54 117,11 1.284,20 (6,19) 15,40
Jumlah/Total 42.782,82 38.816,23 47.372,94 1.186,56 40.131,52 (3,39) 10,73
Laporan Statistik Statistic Report2010
PT INDONESIA POWER
35
100,00
80,00
60,00
40,00
20,00
-
(20,00)
(40,00)
Suralaya Priok
Saguling
Sagulingkamojang
Semarang
Mrica
Mrica
Perak & Grati
Perak & Grati
Bali
Bali
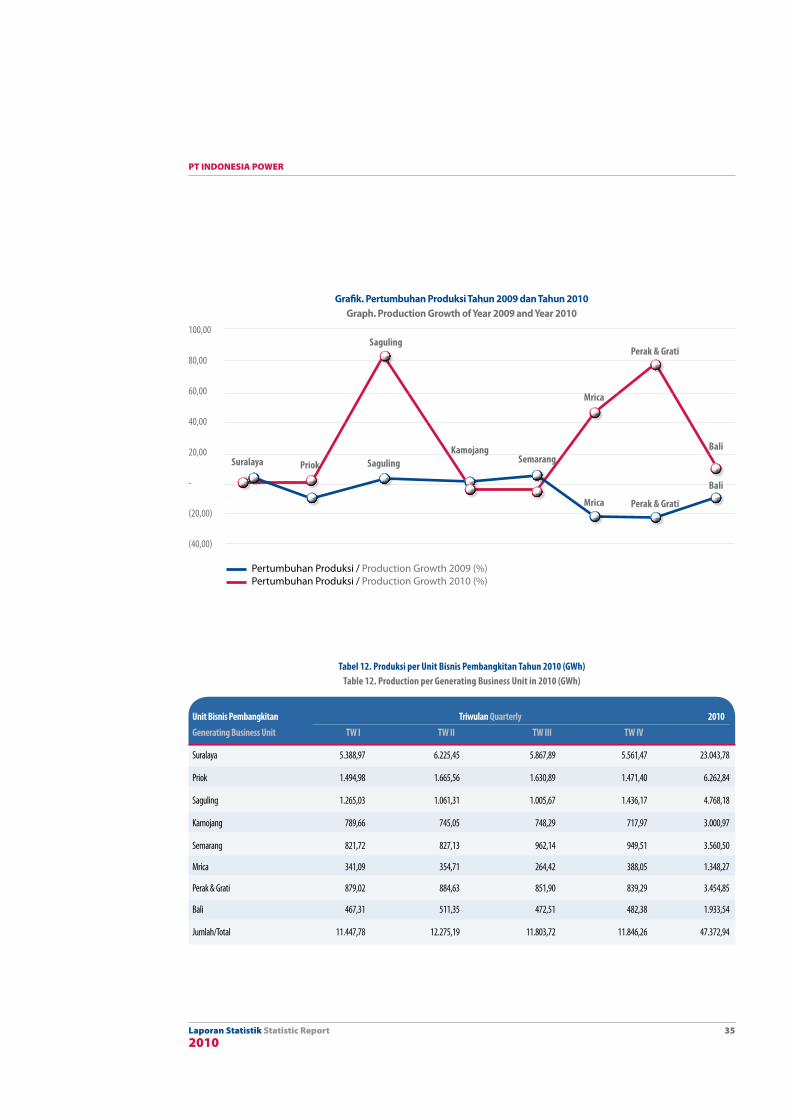
Tabel 12. Produksi per Unit Bisnis Pembangkitan Tahun 2010 (GWh)Table 12. Production per Generating Business Unit in 2010 (GWh)
Unit Bisnis Pembangkitan Triwulan Quarterly 2010Generating Business Unit TW I TW II TW III TW IV
Suralaya 5.388,97 6.225,45 5.867,89 5.561,47 23.043,78
Priok 1.494,98 1.665,56 1.630,89 1.471,40 6.262,84
Saguling 1.265,03 1.061,31 1.005,67 1.436,17 4.768,18
Kamojang 789,66 745,05 748,29 717,97 3.000,97
Semarang 821,72 827,13 962,14 949,51 3.560,50
Mrica 341,09 354,71 264,42 388,05 1.348,27
Perak & Grati 879,02 884,63 851,90 839,29 3.454,85
Bali 467,31 511,35 472,51 482,38 1.933,54
Jumlah/Total 11.447,78 12.275,19 11.803,72 11.846,26 47.372,94
Grafik. Pertumbuhan Produksi Tahun 2009 dan Tahun 2010 Graph. Production Growth of Year 2009 and Year 2010
Pertumbuhan Produksi / Production Growth 2009 (%) Pertumbuhan Produksi / Production Growth 2010 (%)

Laporan Statistik Statistic Report2010
PT INDONESIA POWER
36
lSURALAYA
lPRIok
lSAGULInG
lkAMoJAnG
lMRICA
lSEMARAnG
lPERAk & GRATI
lBALI
49%
4%
7% 3%
8%
6%
10%
13%
Grafik 8. Produksi per Unit Bisnis Pembangkitan Tahun 2010 (GWh)Graph 8. Production per Generating Business Unit in 2010 (GWh)
SURALAYA PRIok SAGULInG kAMoJAnG MRICA SEMARAnG PERAk & GRATI BALI
5.56
1,47
5.86
7,89
6.22
5,45
5.38
8,97
717,
9774
8,97
745,
0578
9,66
839,
2985
1,90
884,
6387
9,02
482,
3847
2,51
511,
3546
7,31
1.47
1,40
1.63
0,89
1.66
5,56
1.49
4,98
949,
5196
2,14
827,
1382
1,721.
436,
171.
005,
671.
061,
311.
265,
03
388,
0526
4,42
354,
7134
1,09
7.000,00
6.000,00
5.000,00
4.000,00
3.000,00
2.000,00
1.000,00
0
l TW IV l TW III l TW II l TW I
Laporan Statistik Statistic Report2010
PT INDONESIA POWER
37
Penjualan per Unit Bisnis PembangkitanSales per Generating Business Unit
Grafik 9. Realisasi Penjualan Tahun 2009-2010 dan Rencana Tahun 2011Graph 9. Sales Realization of Year 2009-2010 and Plan of 2011
25.000,00
20.000,00
15.000,00
10.000,00
5.000,00
0Suralaya Priok Saguling kamojang Semarang Mrica Perak & Grati Bali
l RealisasiRealization 2009 l RealisasiRealization 2010 lRencanaPlan 2011
21.3
53,2
0
5.97
9,16
2.62
7,34
2.96
8,18
3.53
0,22
929,
17
1.84
3,99
1.65
0,32
21.7
53,7
521
.247
,08
6.11
7,15
4.40
5,84
4.75
9,52
2.51
4,34
2.85
0,08
2.63
1,87
3.37
2,64
2.39
4,93
1,33
1,93
3.34
5,15
1.90
5,43
792,
88 3.06
9,43
1.26
3,86
Tabel 13. Realisasi Penjualan Tahun 2009-2010 dan Rencana Tahun 2011Table 13. Sales Realization of Year 2009-2010 and Plan of 2011
Perusahaan Realisasi (Gwh) Rencana (Gwh) Realisasi (Gwh) Pencapaian (%) Rencana (Gwh) Pertumbuhan Company Realization (GWh) Plan (GWh) Realization (Gwh) Achievement (%) Plan (Gwh) Growth (%) 2009 2010 2010 2010 2011 2009 2010
Suralaya 21.353,20 21.239,25 21.753,75 102,42 21.247,08 4,68 1,88
Priok 5.979,16 4.450,50 6.117,15 137,45 4.405,84 (14,70) 2,31
Saguling 2.627,34 2.300,06 4.759,52 206,93 2.514,34 6,04 81,15
Kamojang 2.968,18 2.628,55 2.850,08 108,43 2.631,87 1,82 (3,98)
SemarangSS 3.530,22 1.488,55 3.372,64 226,57 2.394,93 8,16 (4,46)
Mrica 929,17 876,67 1.331,93 151,93 792,88 (22,77) 43,35
Perak & Grati 1.843,99 2.466,05 3.345,15 135,65 3.069,43 (23,70) 81,41
Bali 1.650,32 1.617,61 1.905,43 117,79 1.263,86 (6,26) 15,46
Jumlah Total 40.881,59 37.067,25 45.435,65 1.187,17 38.320,24 (3,60) 11,14
Laporan Statistik Statistic Report2010
PT INDONESIA POWER
38
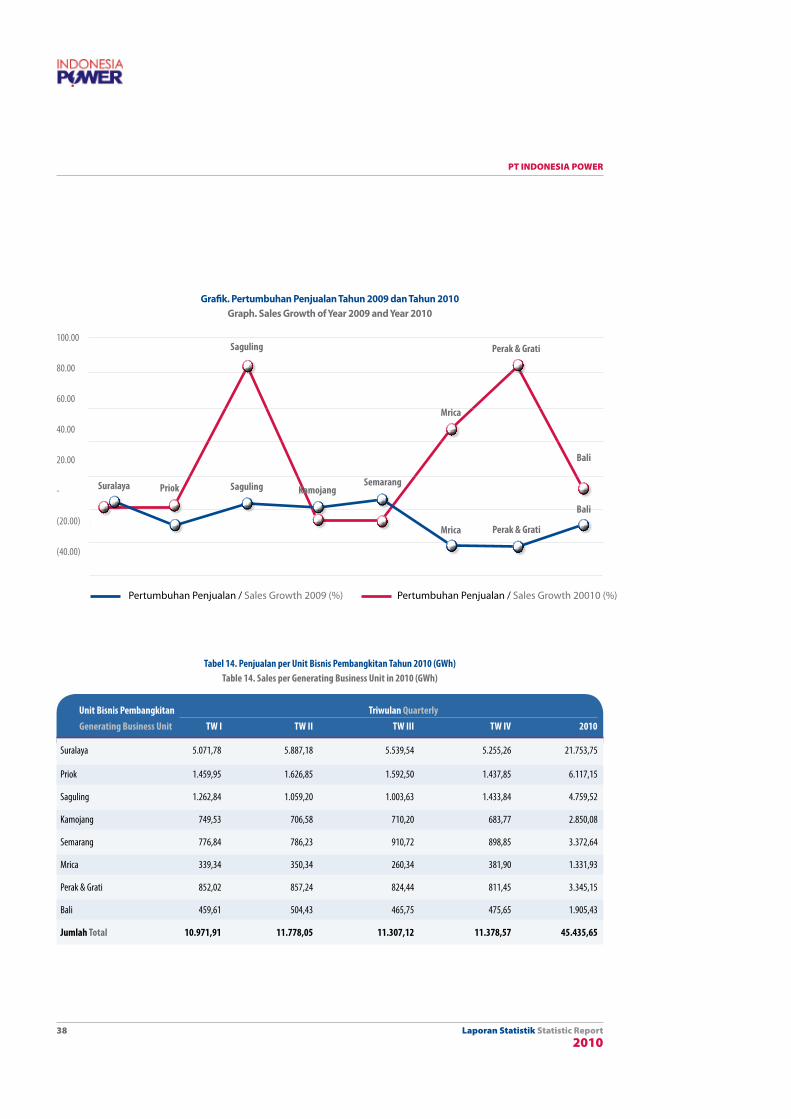
Pertumbuhan Penjualan / Sales Growth 2009 (%) Pertumbuhan Penjualan / Sales Growth 20010 (%)
100.00
80.00
60.00
40.00
20.00
-
(20.00)
(40.00)
Suralaya Priok Saguling kamojangSemarang
Mrica
Mrica Perak & Grati
Perak & Grati
Bali
Bali
Saguling
Tabel 14. Penjualan per Unit Bisnis Pembangkitan Tahun 2010 (GWh)Table 14. Sales per Generating Business Unit in 2010 (GWh)
Unit Bisnis Pembangkitan Triwulan Quarterly Generating Business Unit TW I TW II TW III TW IV 2010
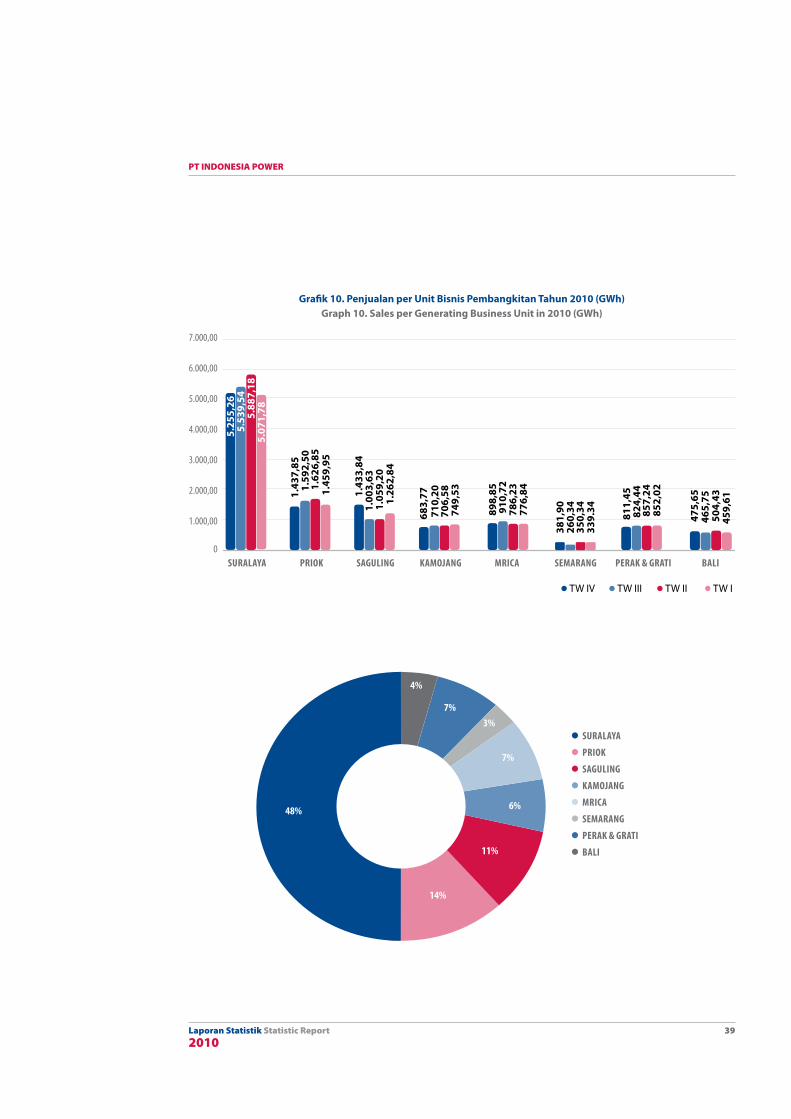
Suralaya 5.071,78 5.887,18 5.539,54 5.255,26 21.753,75
Priok 1.459,95 1.626,85 1.592,50 1.437,85 6.117,15
Saguling 1.262,84 1.059,20 1.003,63 1.433,84 4.759,52
Kamojang 749,53 706,58 710,20 683,77 2.850,08
Semarang 776,84 786,23 910,72 898,85 3.372,64
Mrica 339,34 350,34 260,34 381,90 1.331,93
Perak & Grati 852,02 857,24 824,44 811,45 3.345,15
Bali 459,61 504,43 465,75 475,65 1.905,43
Jumlah Total 10.971,91 11.778,05 11.307,12 11.378,57 45.435,65
Grafik. Pertumbuhan Penjualan Tahun 2009 dan Tahun 2010Graph. Sales Growth of Year 2009 and Year 2010
Laporan Statistik Statistic Report2010
PT INDONESIA POWER
39
lSURALAYA
lPRIok
lSAGULInG
lkAMoJAnG
lMRICA
lSEMARAnG
lPERAk & GRATI
lBALI
48%
4%
7%3%
7%
6%
11%
14%
Grafik 10. Penjualan per Unit Bisnis Pembangkitan Tahun 2010 (GWh)Graph 10. Sales per Generating Business Unit in 2010 (GWh)
SURALAYA PRIok SAGULInG kAMoJAnG MRICA SEMARAnG PERAk & GRATI BALI
5.25
5,26
5.53
9,54
5.88
7,18
5.07
1,78
683,
7771
0,20
706,
5874
9,53
811,
4582
4,44
857,
2485
2,02
475,
6546
5,75
504,
4345
9,611.
437,
851.
592,
501.
626,
851.
459,
95
898,
8591
0,72
786,
2377
6,841.
433,
841.
003,
631.
059,
201.
262,
84
381,
9026
0,34
350,
3433
9.34
7.000,00
6.000,00
5.000,00
4.000,00
3.000,00
2.000,00
1.000,00
0
l TW IV l TW III l TW II l TW I
Laporan Statistik Statistic Report2010
PT INDONESIA POWER
40
Pemakaian Sendiri per Unit Bisnis PembangkitanSelf Consumption per Generating Business Unit
Grafik 11. Realisasi Pemakaian Sendiri Tahun 2009-2010 dan Rencana Tahun 2011Graph 11. Self Consumption Realization of Year 2009-2010 and Plan of 2011
1.29
7,37
1.29
0,03
1.29
3,79
159,
5615
0,90
144,
38
82,1
110
9,70
118,
03
25,2
028
,11
20,3
4146,
4114
5,68
104,
53
171,
6218
7,86
112,
44
6,94
8,67
7,66
12,1
616
,34
10,1
2
1.400
1.200
1.000
800
600
400
200
0 SURALAYA PRIok SAGULInG kAMoJAnG MRICA SEMARAnG PERAk & GRATI BALI
l RealisasiRealization 2009 l RealisasiRealization 2010 lRencanaPlan 2011
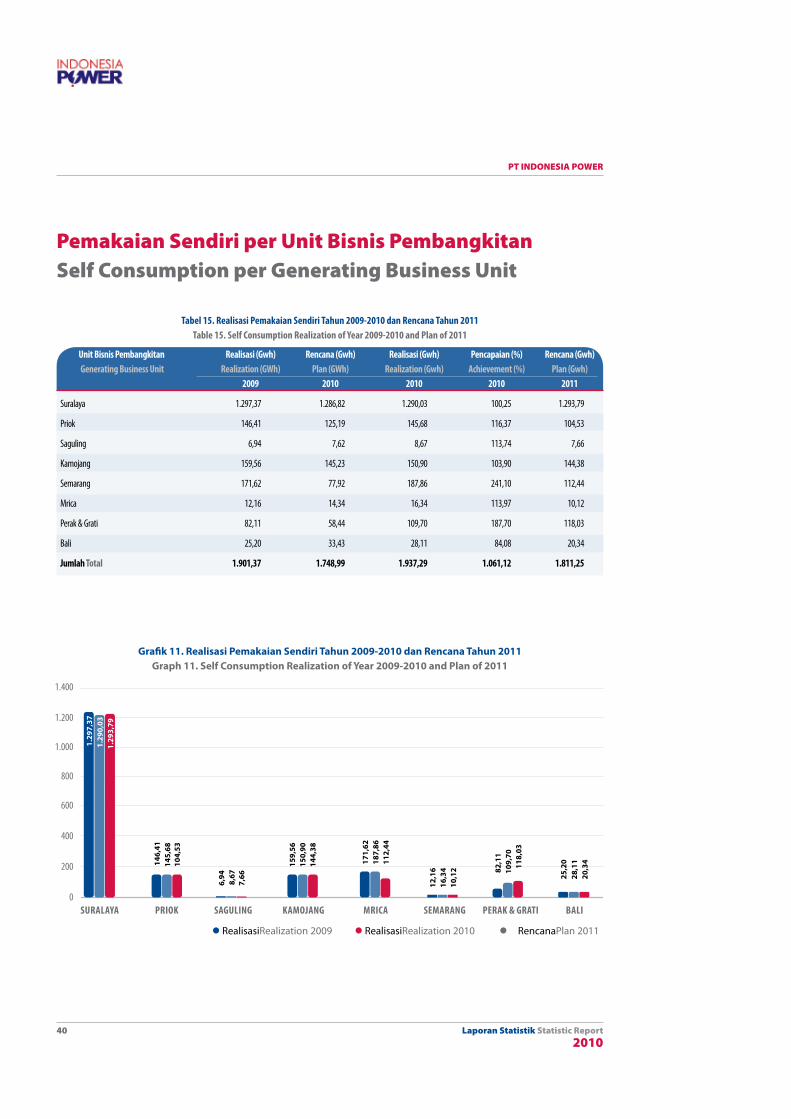
Tabel 15. Realisasi Pemakaian Sendiri Tahun 2009-2010 dan Rencana Tahun 2011Table 15. Self Consumption Realization of Year 2009-2010 and Plan of 2011
Unit Bisnis Pembangkitan Realisasi (Gwh) Rencana (Gwh) Realisasi (Gwh) Pencapaian (%) Rencana (Gwh) Generating Business Unit Realization (GWh) Plan (GWh) Realization (Gwh) Achievement (%) Plan (Gwh) 2009 2010 2010 2010 2011
Suralaya 1.297,37 1.286,82 1.290,03 100,25 1.293,79
Priok 146,41 125,19 145,68 116,37 104,53
Saguling 6,94 7,62 8,67 113,74 7,66
Kamojang 159,56 145,23 150,90 103,90 144,38
Semarang 171,62 77,92 187,86 241,10 112,44
Mrica 12,16 14,34 16,34 113,97 10,12
Perak & Grati 82,11 58,44 109,70 187,70 118,03
Bali 25,20 33,43 28,11 84,08 20,34
Jumlah Total 1.901,37 1.748,99 1.937,29 1.061,12 1.811,25
Laporan Statistik Statistic Report2010
PT INDONESIA POWER
41
Grafik 12. Pemakaian Sendiri per Unit Bisnis Pembangkitan Tahun 2010 (GWh)Graph 12. Self Consumption per Generating Business Unit in 2010 (GWh)
SURALAYA PRIok SAGULInG kAMoJAnG MRICA SEMARAnG PERAk & GRATI BALI
306,
2132
8,36
338,
2731
7,19
34,2
038
,09
38,4
740
,13
27,8
427
,46
27,3
927
,01
6,73
6,76
6,92
7,7033
,56
38,3
938
,71
35,0
3 50,6
751
,42
40,8
944
,88
2,33
2,04 2,11
2,18
6,15
4,08
4,37
1,75
400,00
350,00
300,00
250,00
200,00
150,00
100,00
50,00
0
l TW IV l TW III l TW II l TW I
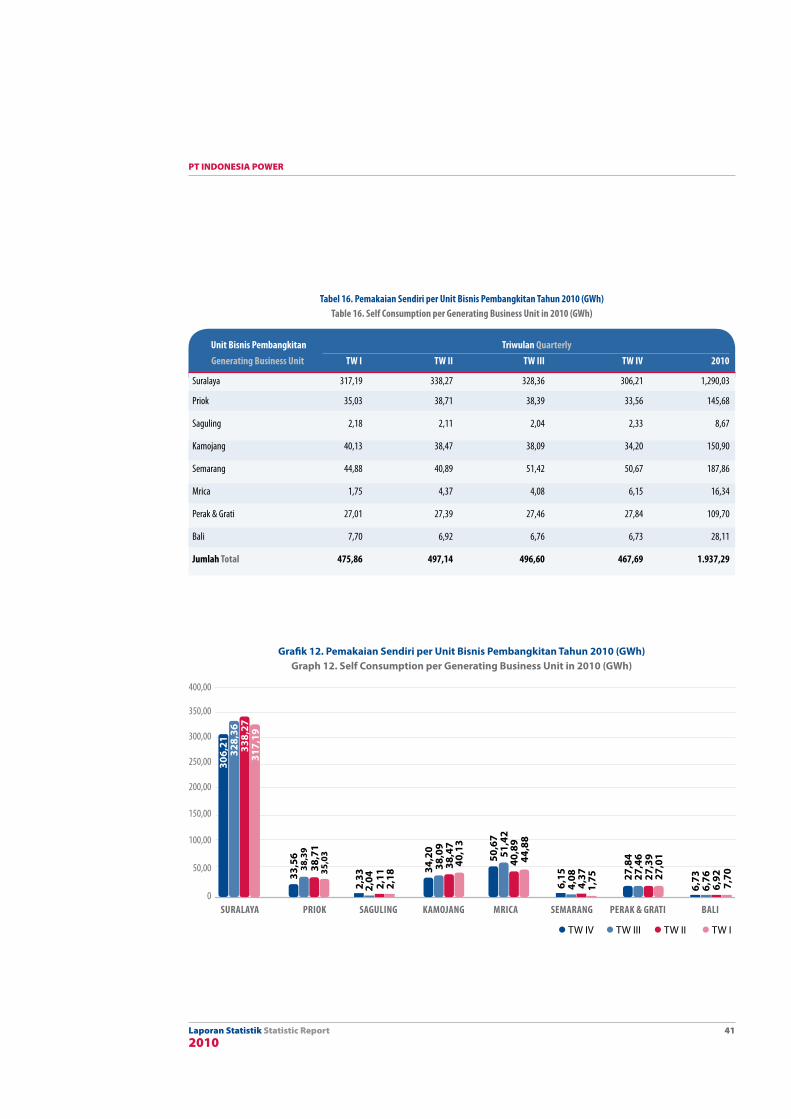
Tabel 16. Pemakaian Sendiri per Unit Bisnis Pembangkitan Tahun 2010 (GWh)Table 16. Self Consumption per Generating Business Unit in 2010 (GWh)
Unit Bisnis Pembangkitan Triwulan Quarterly Generating Business Unit TW I TW II TW III TW IV 2010
Suralaya 317,19 338,27 328,36 306,21 1,290,03
Priok 35,03 38,71 38,39 33,56 145,68
Saguling 2,18 2,11 2,04 2,33 8,67
Kamojang 40,13 38,47 38,09 34,20 150,90
Semarang 44,88 40,89 51,42 50,67 187,86
Mrica 1,75 4,37 4,08 6,15 16,34
Perak & Grati 27,01 27,39 27,46 27,84 109,70
Bali 7,70 6,92 6,76 6,73 28,11
Jumlah Total 475,86 497,14 496,60 467,69 1.937,29

Laporan Statistik Statistic Report2010
PT INDONESIA POWER
42
lSURALAYA
lPRIok
lSAGULInG
lkAMoJAnG
lMRICA
lSEMARAnG
lPERAk & GRATI
lBALI
67%7%
0%
8%
10%
1% 6%1%
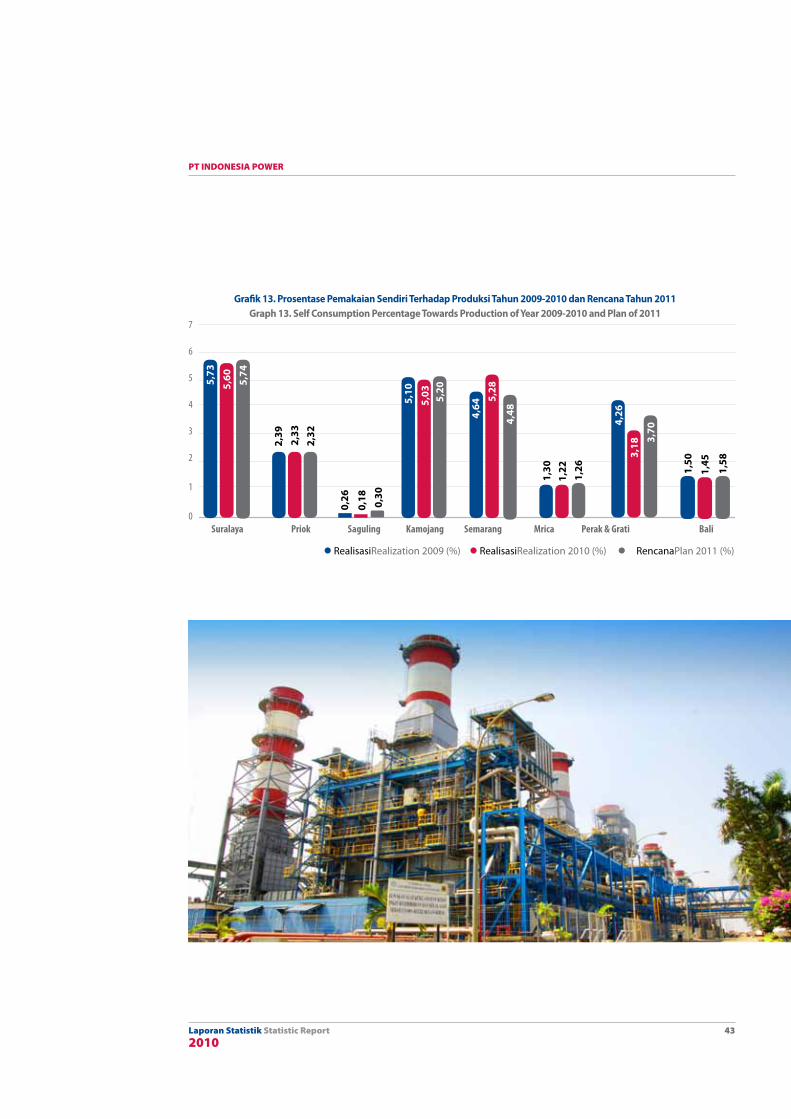
Tabel 17. Prosentase Pemakaian Sendiri Terhadap Produksi Tahun 2009-2010 dan Rencana Tahun 2011Table 17. Self Consumption Percentage Towards Production of Year 2009-2010 and Plan of 2011
Unit Bisnis Pembangkitan Produksi Pemakaian Sendiri Prosentase Terhadap Produksi
Generating Business Unit Production (GWh) Self Consumption (GWh) Percentage Towards Production
2009 2010 Rencana Plan 2011 2009 2010 Rencana Plan 2011 2009 2010 Rencana Plan 2011
Suralaya 22.650,57 23.043,78 22.540,87 1.297,37 1.290,03 1.293,79 5,73 5,60 5,74
Priok 6.125,44 6.262,84 4.510,37 146,41 145,68 104,53 2,39 2,33 2,32
Saguling 2.634,29 4.768,18 2.522,00 6,94 8,67 7,66 0,26 0,18 0,30
Kamojang 3.127,74 3.000,97 2.776,25 159,56 150,90 144,38 5,10 5,03 5,20
Semarang 3.701,85 3.560,50 2.507,37 171,62 187,86 112,44 4,64 5,28 4,48
Mrica 941,32 1.348,27 803,00 12,16 16,34 10,12 1,29 1,21 1,26
Perak & Grati 1.926,10 3.454,85 3.187,46 82,11 109,70 118,03 4,26 3,18 3,70
Bali 1.675,51 1.933,54 1.284,20 25,20 28,11 20,34 1,50 1,45 1,58
Jumlah T otal 42.782,82 47.372,94 40.131,52 1.901,37 1.937,29 1.811,28 4,44 4,09 4,51
Laporan Statistik Statistic Report2010
PT INDONESIA POWER
43
Grafik 13. Prosentase Pemakaian Sendiri Terhadap Produksi Tahun 2009-2010 dan Rencana Tahun 2011Graph 13. Self Consumption Percentage Towards Production of Year 2009-2010 and Plan of 2011
7
6
5
4
3
2
1
0Suralaya Priok Saguling kamojang Semarang Mrica Perak & Grati Bali
l RealisasiRealization 2009 (%) l RealisasiRealization 2010 (%) lRencanaPlan 2011 (%)
5,73
2,39
0,26
5,10
4,64
1,30
4,26
1,50
5,60 5,74
2,33
2,32
0,18 0,30
5,03 5,20
5,28
4,48
1,22
3,18
1,45
1,26
3,70
1,58

Laporan Statistik Statistic Report2010
PT INDONESIA POWER
44
Produksi per Jenis PembangkitProduction per Power Plant Type
3.57
5,61
128,
66
9.72
1,70
1.83
1,99
3.12
7,74
24.3
97,1
2
6.11
6,45
3325
,00
135,
80
10.9
60,8
0
142,
74
9.06
5,71
1.99
4,05
3.00
0,97
25.1
64,8
7
2.13
8,08
2.27
6,25
22.6
83,7
3
30.000
25.000
20.000
15.000
10.000
5.000
0
PLTA PLTD PLTG PLTP PLTU PLTGU
l RealisasiRealization 2009 l RealisasiRealization 2010 lRencanaPlan 2011
Grafik 14. Realisasi Produksi per Jenis Pembangkit Tahun 2009-2010 dan Rencana Tahun 2011Graph 14. Production Realization of Power Plant Type of Year 2009-2010 and Plan of 2011
Tabel 18. Realisasi Produksi per Jenis Pembangkit Tahun 2009-2010 dan Rencana Tahun 2011Table 18. Production Realization of Power Plant Type of Year 2009-2010 and Plan of 2011
Unit Bisnis Pembangkitan Realisasi (Gwh) Rencana (Gwh) Realisasi (Gwh) Pencapaian (%) Rencana (Gwh) Pertumbuhan Generating Business Unit Realization (GWh) Plan (GWh) Realization (Gwh) Achievement (%) Plan (Gwh) Growth (%) 2009 2010 2011 2009 2010
PLTA PLTA 3.575,61 3.198,70 6.116,45 191.22 3.325,00 6,69 71,06
PLTD PLTD 128,66 444,66 135,80 30,54 142,74 (29,91) 5,54
PLTG PLTG 1.831,99 1.285,02 1.994,05 155,18 2.138,08 (7,35) 8,85
PLTG (HSD) PLTG (HSD) 1.782,82 1.219,39 1.981,31 162,48 2.064,13 61,51 11,13
PLTG (gas) PLTG (gas) 49,18 65,63 12,74 19,41 73,96 (9,38) (74,10)
PLTP PLTP 3.127,74 2.773,78 3.000,97 108,19 2.776,25 1,84 (4,05)
PLTU PLTU 24.397,12 22.883,16 25.164,87 109,97 22.683,73 1,43 3,15
PLTU (batu bara) PLTU (batu bara) 22.650,57 22.526,07 23.043,78 102,30 22.540,87 4,67 1,74
PLTU (MFO) PLTU (MFO) 1.746,55 357,09 2.121,09 593,99 142,86 (27,64) 21,44
PLTGU PLTGU 9.721,70 8.230,92 10.960,80 133,17 9.065,71 (16,52) 12,75
PLTGU (gas) PLTGU (gas) 2.697,78 4.518,47 5.406,18 119,65 4.120,53 (9,42) 100,39
PLTGU (HSD) PLTGU (HSD) 7.023,91 3.712,45 5.554,62 149,62 4.945,18 (19,65) (20,92)
Jumlah Total 42.782,82 38.816,23 47.372,94 122,04 40.131,52 (3,39) 10,73
Laporan Statistik Statistic Report2010
PT INDONESIA POWER
45
Pertumbuhan Produksi / Production Growth 2009 (%) Pertumbuhan Produksi / Production Growth 2010 (%)
80,00
60,00
40,00
20,00
-
(20,00)
(40,00)
PLTA
PLTAPLTD
PLTD
PLTG PLTP PLTUPLTGU
PLTGU
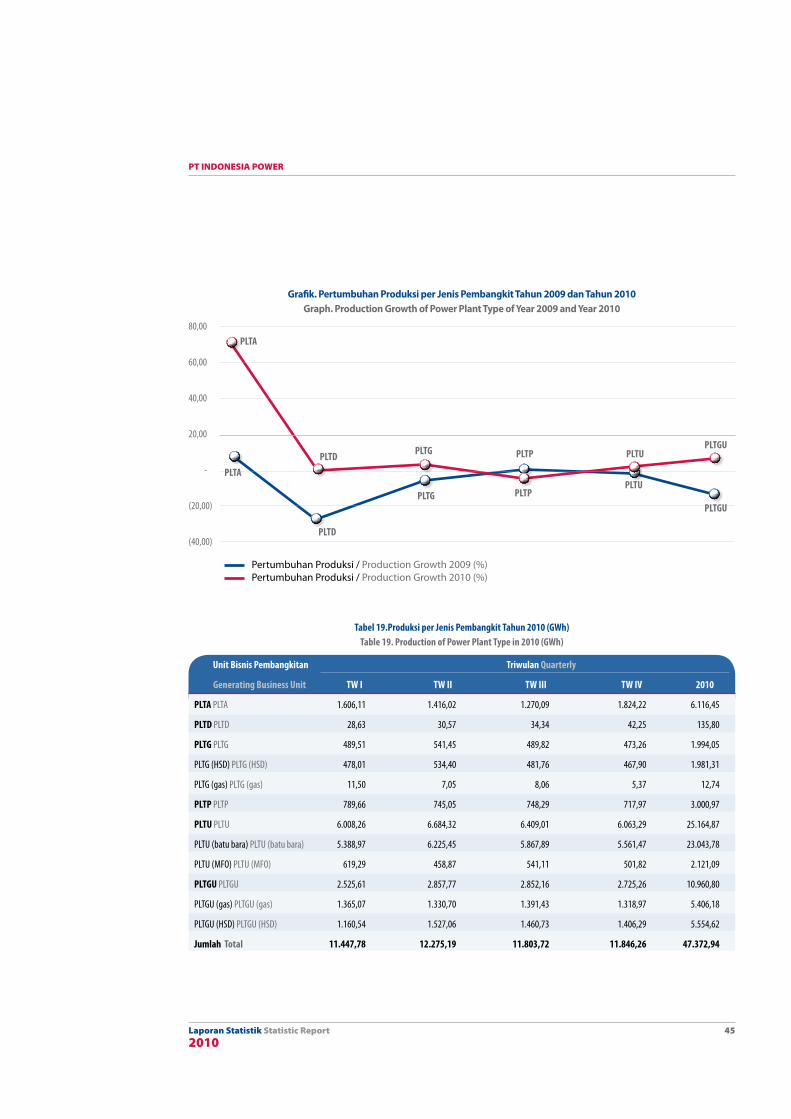
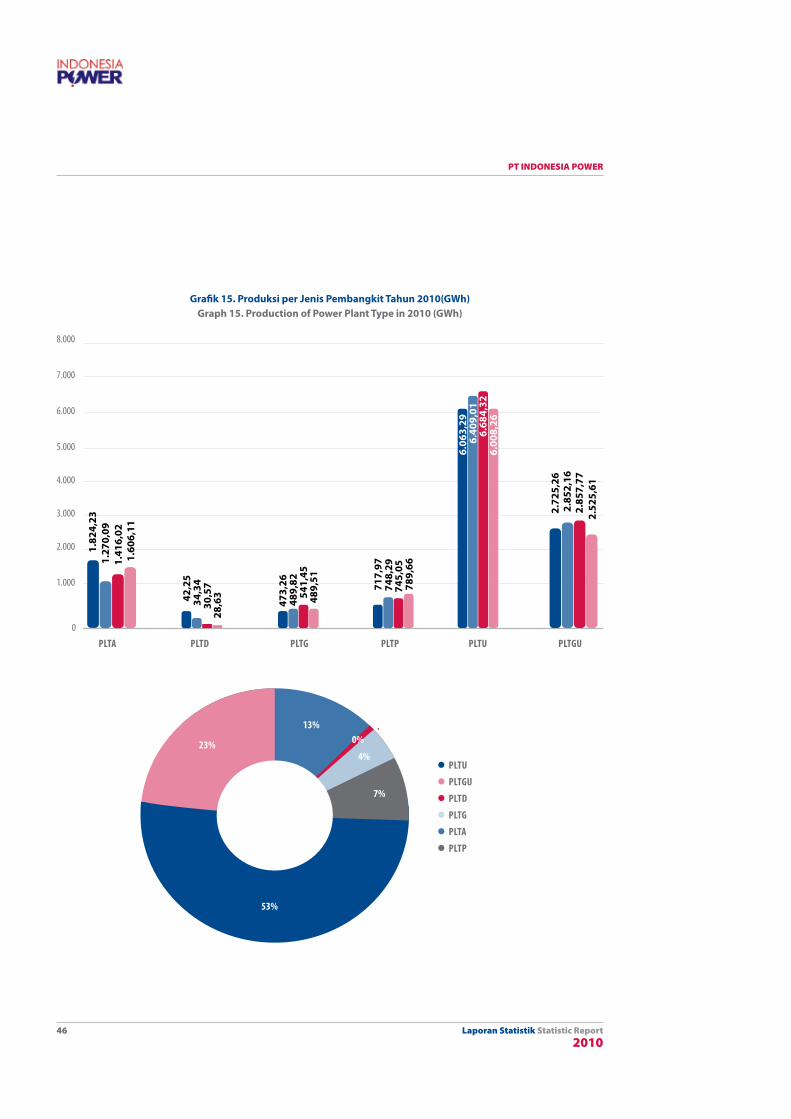
Tabel 19.Produksi per Jenis Pembangkit Tahun 2010 (GWh)Table 19. Production of Power Plant Type in 2010 (GWh)
Unit Bisnis Pembangkitan Triwulan Quarterly
Generating Business Unit TW I TW II TW III TW IV 2010
PLTA PLTA 1.606,11 1.416,02 1.270,09 1.824,22 6.116,45
PLTD PLTD 28,63 30,57 34,34 42,25 135,80
PLTG PLTG 489,51 541,45 489,82 473,26 1.994,05
PLTG (HSD) PLTG (HSD) 478,01 534,40 481,76 467,90 1.981,31
PLTG (gas) PLTG (gas) 11,50 7,05 8,06 5,37 12,74
PLTP PLTP 789,66 745,05 748,29 717,97 3.000,97
PLTU PLTU 6.008,26 6.684,32 6.409,01 6.063,29 25.164,87
PLTU (batu bara) PLTU (batu bara) 5.388,97 6.225,45 5.867,89 5.561,47 23.043,78
PLTU (MFO) PLTU (MFO) 619,29 458,87 541,11 501,82 2.121,09
PLTGU PLTGU 2.525,61 2.857,77 2.852,16 2.725,26 10.960,80
PLTGU (gas) PLTGU (gas) 1.365,07 1.330,70 1.391,43 1.318,97 5.406,18
PLTGU (HSD) PLTGU (HSD) 1.160,54 1.527,06 1.460,73 1.406,29 5.554,62
Jumlah Total 11.447,78 12.275,19 11.803,72 11.846,26 47.372,94
Grafik. Pertumbuhan Produksi per Jenis Pembangkit Tahun 2009 dan Tahun 2010Graph. Production Growth of Power Plant Type of Year 2009 and Year 2010
PLTG PLTPPLTU
Laporan Statistik Statistic Report2010
PT INDONESIA POWER
46
lPLTU
lPLTGU
lPLTD
lPLTG
lPLTA
lPLTP
23%
13%
4%
0%
7%
53%
8.000
7.000
6.000
5.000
4.000
3.000
2.000
1.000
0
PLTA PLTD PLTG PLTP PLTU PLTGU
1.82
4,23
42,2
5
473,
26 717,
97
2.72
5,26
1.27
0,09
34,3
4
489,
82 748,
29
2.85
2,16
1.41
6,02
30,5
7
541,
45
745,
05
2.85
7,77
1.60
6,11
28,6
3 489,
51
789,
66
2.52
5,61
6.06
3,29
6.40
9,01
6.68
4,32
6.00
8,26
Grafik 15. Produksi per Jenis Pembangkit Tahun 2010(GWh)Graph 15. Production of Power Plant Type in 2010 (GWh)
Laporan Statistik Statistic Report2010
PT INDONESIA POWER
47
Penjualan per Jenis PembangkitSales per Power Plant Type
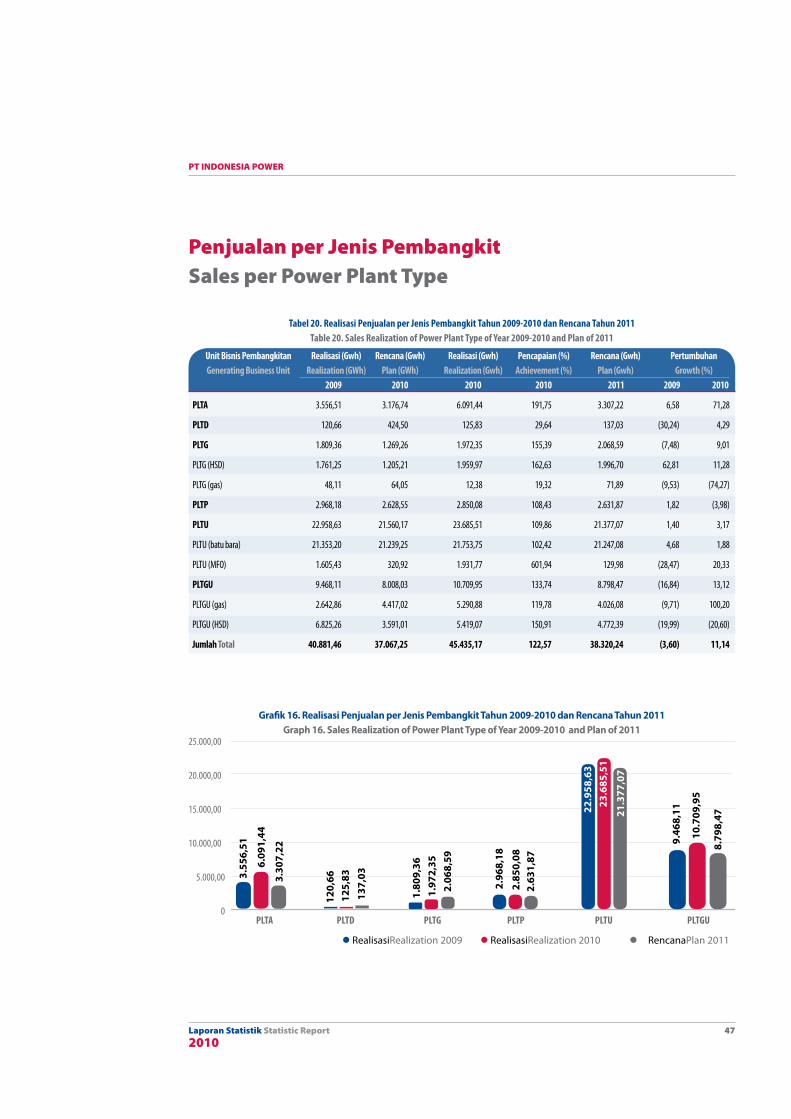
Grafik 16. Realisasi Penjualan per Jenis Pembangkit Tahun 2009-2010 dan Rencana Tahun 2011Graph 16. Sales Realization of Power Plant Type of Year 2009-2010 and Plan of 2011
25.000,00
20.000,00
15.000,00
10.000,00
5.000,00
0PLTA PLTD PLTG PLTP PLTU PLTGU
l RealisasiRealization 2009 l RealisasiRealization 2010 lRencanaPlan 2011
3.55
6,51
120,
66
1.80
9,36
2.96
8,18
22.9
58,6
3
9.46
8,11
6.09
1,44
3.30
7,22
125,
8313
7,03
1.97
2,35
2.06
8,59
2.85
0,08
2.63
1,87
23.6
85,5
1
21.3
77,0
7
10.7
09,9
5
8.79
8,47
Unit Bisnis Pembangkitan Realisasi (Gwh) Rencana (Gwh) Realisasi (Gwh) Pencapaian (%) Rencana (Gwh) Pertumbuhan Generating Business Unit Realization (GWh) Plan (GWh) Realization (Gwh) Achievement (%) Plan (Gwh) Growth (%) 2009 2010 2010 2010 2011 2009 2010
PLTA 3.556,51 3.176,74 6.091,44 191,75 3.307,22 6,58 71,28
PLTD 120,66 424,50 125,83 29,64 137,03 (30,24) 4,29
PLTG 1.809,36 1.269,26 1.972,35 155,39 2.068,59 (7,48) 9,01
PLTG (HSD) 1.761,25 1.205,21 1.959,97 162,63 1.996,70 62,81 11,28
PLTG (gas) 48,11 64,05 12,38 19,32 71,89 (9,53) (74,27)
PLTP 2.968,18 2.628,55 2.850,08 108,43 2.631,87 1,82 (3,98)
PLTU 22.958,63 21.560,17 23.685,51 109,86 21.377,07 1,40 3,17
PLTU (batu bara) 21.353,20 21.239,25 21.753,75 102,42 21.247,08 4,68 1,88
PLTU (MFO) 1.605,43 320,92 1.931,77 601,94 129,98 (28,47) 20,33
PLTGU 9.468,11 8.008,03 10.709,95 133,74 8.798,47 (16,84) 13,12
PLTGU (gas) 2.642,86 4.417,02 5.290,88 119,78 4.026,08 (9,71) 100,20
PLTGU (HSD) 6.825,26 3.591,01 5.419,07 150,91 4.772,39 (19,99) (20,60)
Jumlah Total 40.881,46 37.067,25 45.435,17 122,57 38.320,24 (3,60) 11,14
Tabel 20. Realisasi Penjualan per Jenis Pembangkit Tahun 2009-2010 dan Rencana Tahun 2011Table 20. Sales Realization of Power Plant Type of Year 2009-2010 and Plan of 2011
Laporan Statistik Statistic Report2010
PT INDONESIA POWER
48
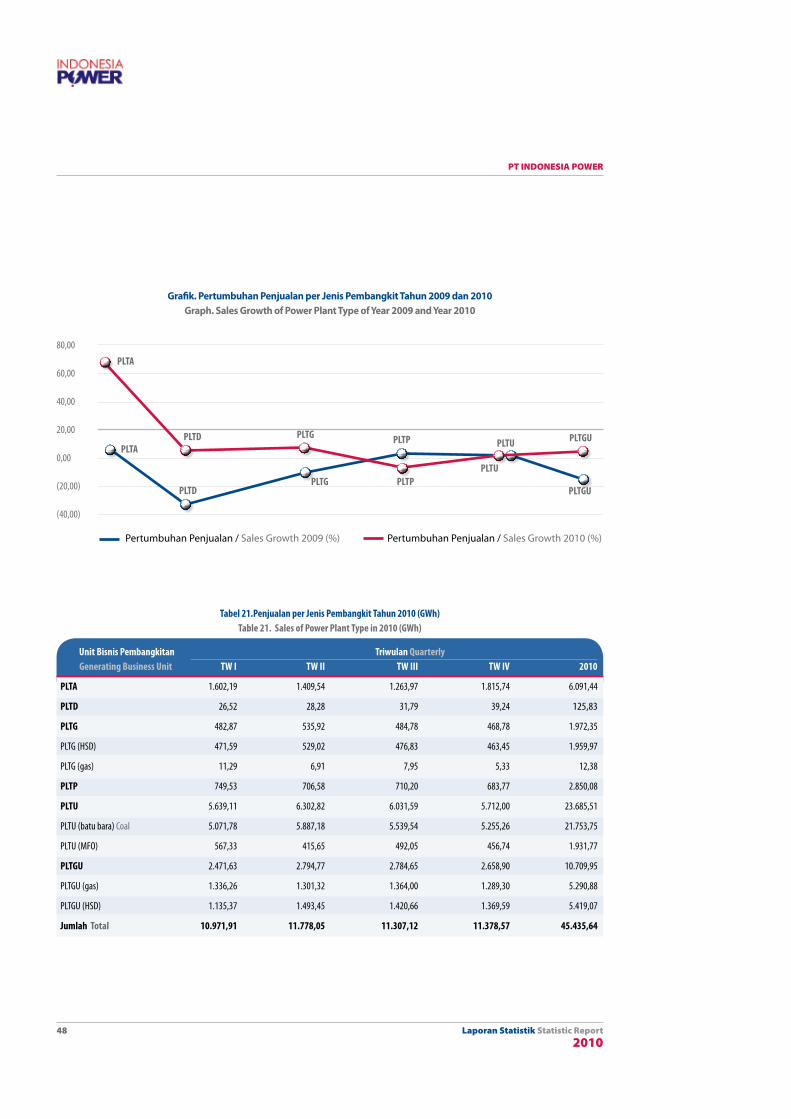
Pertumbuhan Penjualan / Sales Growth 2009 (%) Pertumbuhan Penjualan / Sales Growth 2010 (%)
PLTA
PLTA
PLTD
PLTG PLTP PLTU PLTGUPLTD
80,00
60,00
40,00
20,00
0,00
(20,00)
(40,00)
Tabel 21.Penjualan per Jenis Pembangkit Tahun 2010 (GWh)Table 21. Sales of Power Plant Type in 2010 (GWh)
Unit Bisnis Pembangkitan Triwulan Quarterly Generating Business Unit TW I TW II TW III TW IV 2010
PLTA 1.602,19 1.409,54 1.263,97 1.815,74 6.091,44
PLTD 26,52 28,28 31,79 39,24 125,83
PLTG 482,87 535,92 484,78 468,78 1.972,35
PLTG (HSD) 471,59 529,02 476,83 463,45 1.959,97
PLTG (gas) 11,29 6,91 7,95 5,33 12,38
PLTP 749,53 706,58 710,20 683,77 2.850,08
PLTU 5.639,11 6.302,82 6.031,59 5.712,00 23.685,51
PLTU (batu bara) Coal 5.071,78 5.887,18 5.539,54 5.255,26 21.753,75
PLTU (MFO) 567,33 415,65 492,05 456,74 1.931,77
PLTGU 2.471,63 2.794,77 2.784,65 2.658,90 10.709,95
PLTGU (gas) 1.336,26 1.301,32 1.364,00 1.289,30 5.290,88
PLTGU (HSD) 1.135,37 1.493,45 1.420,66 1.369,59 5.419,07
Jumlah Total 10.971,91 11.778,05 11.307,12 11.378,57 45.435,64
Grafik. Pertumbuhan Penjualan per Jenis Pembangkit Tahun 2009 dan 2010Graph. Sales Growth of Power Plant Type of Year 2009 and Year 2010
PLTG PLTPPLTU
PLTGU
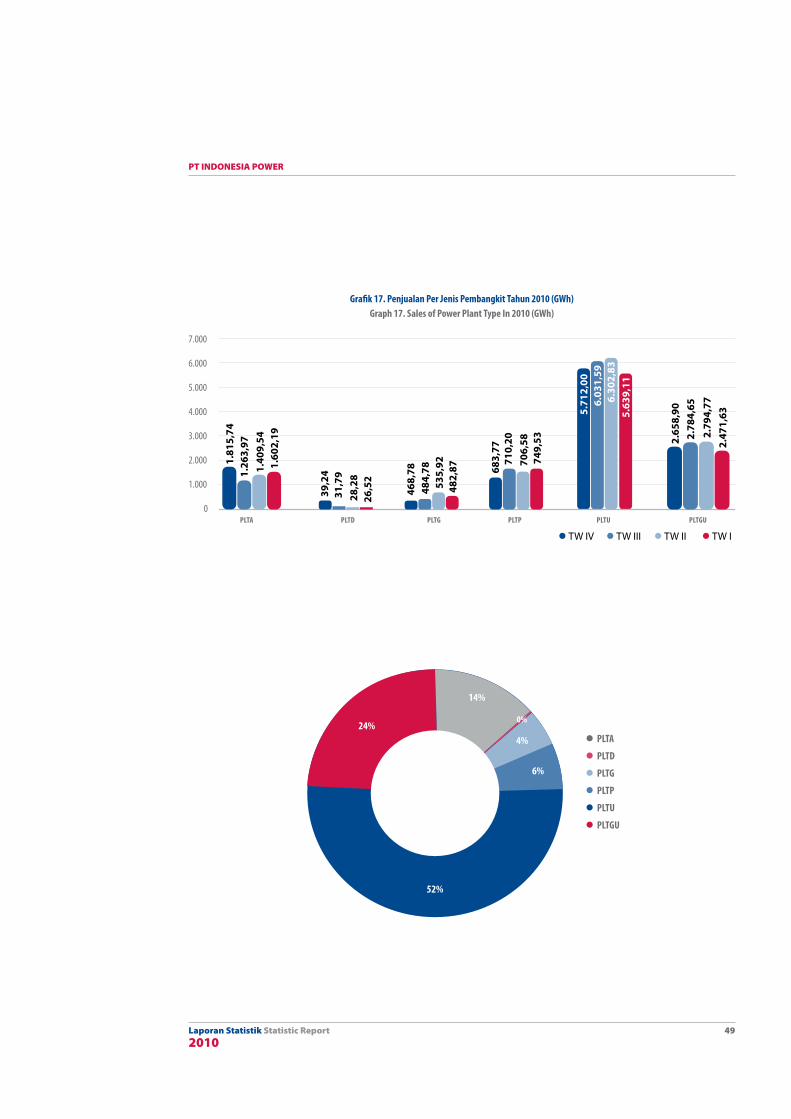
Laporan Statistik Statistic Report2010
PT INDONESIA POWER
49
lPLTA
lPLTD
lPLTG
lPLTP
lPLTU
lPLTGU
52%
14%
0%
4%
6%
24%
Grafik 17. Penjualan Per Jenis Pembangkit Tahun 2010 (GWh)Graph 17. Sales of Power Plant Type In 2010 (GWh)
7.000
6.000
5.000
4.000
3.000
2.000
1.000
0PLTA PLTD PLTG PLTP PLTU PLTGU
5.71
2,00
6.03
1,59
6.30
2,83
5.63
9,11
l TW IV l TW III l TW II l TW I
1.81
5,74
1.26
3,97
1.40
9,54
1.60
2,19 2.
658,
902.
784,
652.
794,
772.
471,
63
683,
7771
0,20
706,
5874
9,53
39,2
431
,79
28,2
826
,52
468,
7848
4,78
535,
9248
2,87
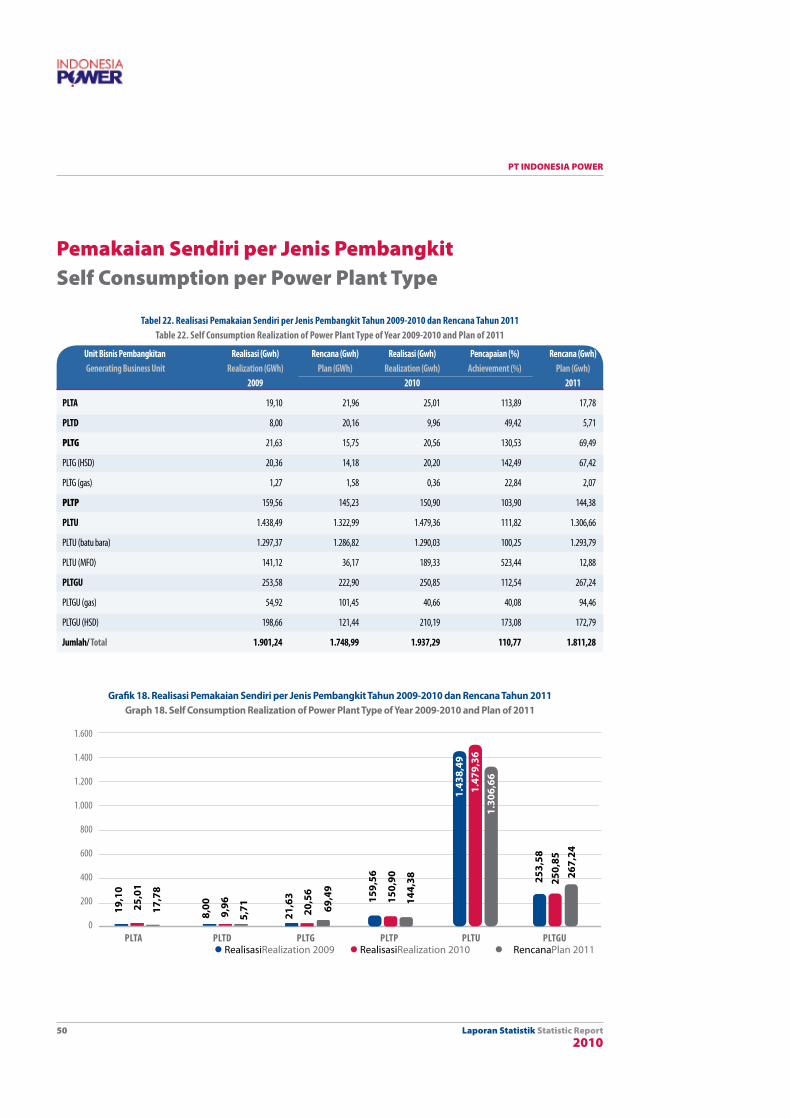
Laporan Statistik Statistic Report2010
PT INDONESIA POWER
50
Pemakaian Sendiri per Jenis Pembangkit Self Consumption per Power Plant Type
Grafik 18. Realisasi Pemakaian Sendiri per Jenis Pembangkit Tahun 2009-2010 dan Rencana Tahun 2011Graph 18. Self Consumption Realization of Power Plant Type of Year 2009-2010 and Plan of 2011
PLTA PLTD PLTG PLTP PLTU PLTGU
1.600
1.400
1.200
1.000
800
600
400
200
0
19,1
0
25,0
1
17,7
8
8,00
9,96
5,71
21,6
3
20,5
6
69,4
9
159,
56
150,
90
144,
38
1.43
8,49
1.47
9,36
1.30
6,66
253,
5825
0,85
267,
24
l RealisasiRealization 2009 l RealisasiRealization 2010 lRencanaPlan 2011
Tabel 22. Realisasi Pemakaian Sendiri per Jenis Pembangkit Tahun 2009-2010 dan Rencana Tahun 2011Table 22. Self Consumption Realization of Power Plant Type of Year 2009-2010 and Plan of 2011
Unit Bisnis Pembangkitan Realisasi (Gwh) Rencana (Gwh) Realisasi (Gwh) Pencapaian (%) Rencana (Gwh) Generating Business Unit Realization (GWh) Plan (GWh) Realization (Gwh) Achievement (%) Plan (Gwh) 2009 2010 2011
PLTA 19,10 21,96 25,01 113,89 17,78
PLTD 8,00 20,16 9,96 49,42 5,71
PLTG 21,63 15,75 20,56 130,53 69,49
PLTG (HSD) 20,36 14,18 20,20 142,49 67,42
PLTG (gas) 1,27 1,58 0,36 22,84 2,07
PLTP 159,56 145,23 150,90 103,90 144,38
PLTU 1.438,49 1.322,99 1.479,36 111,82 1.306,66
PLTU (batu bara) 1.297,37 1.286,82 1.290,03 100,25 1.293,79
PLTU (MFO) 141,12 36,17 189,33 523,44 12,88
PLTGU 253,58 222,90 250,85 112,54 267,24
PLTGU (gas) 54,92 101,45 40,66 40,08 94,46
PLTGU (HSD) 198,66 121,44 210,19 173,08 172,79
Jumlah/ Total 1.901,24 1.748,99 1.937,29 110,77 1.811,28
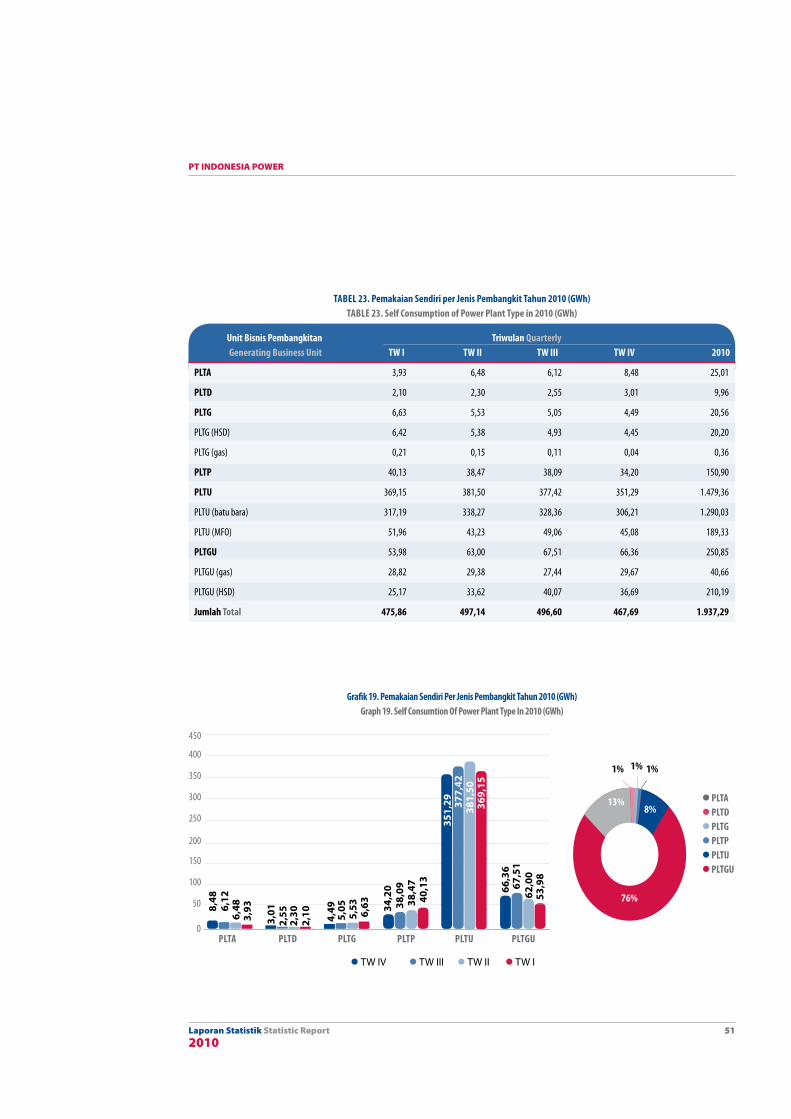
Laporan Statistik Statistic Report2010
PT INDONESIA POWER
51
Grafik 19. Pemakaian Sendiri Per Jenis Pembangkit Tahun 2010 (GWh)Graph 19. Self Consumtion of Power Plant Type In 2010 (GWh)
62,0
053
,98
450
400
350
300
250
200
150
100
50
0PLTA PLTD PLTG PLTP PLTU PLTGU
351,
29 377,
4238
1,50
369,
15
l TW IV l TW III l TW II l TW I
8,48
6,12
6,48
3,93
66,3
667
,51
34,2
038
,09
38,4
740
,13
3,01
2,55
2,30
2,10 4,49
5,05
5,53 6,63
lPLTA lPLTD lPLTGlPLTP lPLTU lPLTGU
1%
13%8%
76%
1% 1%
TABEL 23. Pemakaian Sendiri per Jenis Pembangkit Tahun 2010 (GWh)TABLE 23. Self Consumption of Power Plant Type in 2010 (GWh)
Unit Bisnis Pembangkitan Triwulan Quarterly Generating Business Unit TW I TW II TW III TW IV 2010
PLTA 3,93 6,48 6,12 8,48 25,01
PLTD 2,10 2,30 2,55 3,01 9,96
PLTG 6,63 5,53 5,05 4,49 20,56
PLTG (HSD) 6,42 5,38 4,93 4,45 20,20
PLTG (gas) 0,21 0,15 0,11 0,04 0,36
PLTP 40,13 38,47 38,09 34,20 150,90
PLTU 369,15 381,50 377,42 351,29 1.479,36
PLTU (batu bara) 317,19 338,27 328,36 306,21 1.290,03
PLTU (MFO) 51,96 43,23 49,06 45,08 189,33
PLTGU 53,98 63,00 67,51 66,36 250,85
PLTGU (gas) 28,82 29,38 27,44 29,67 40,66
PLTGU (HSD) 25,17 33,62 40,07 36,69 210,19
Jumlah Total 475,86 497,14 496,60 467,69 1.937,29
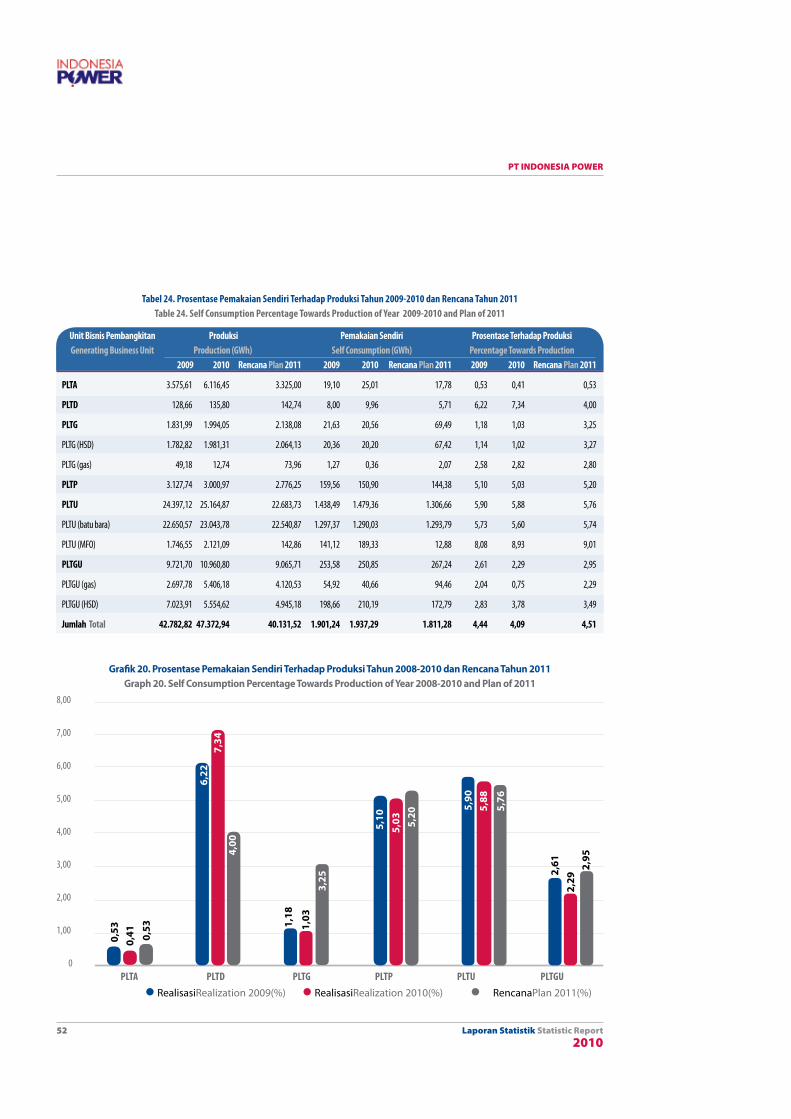
Laporan Statistik Statistic Report2010
PT INDONESIA POWER
52
Grafik 20. Prosentase Pemakaian Sendiri Terhadap Produksi Tahun 2008-2010 dan Rencana Tahun 2011Graph 20. Self Consumption Percentage Towards Production of Year 2008-2010 and Plan of 2011
8,00
7,00
6,00
5,00
4,00
3,00
2,00
1,00
0PLTA PLTD PLTG PLTP PLTU PLTGU
l RealisasiRealization 2009(%) l RealisasiRealization 2010(%) lRencanaPlan 2011(%)
0,53 1,
18
5,10
5,90
2,61
0,41 0,
53
6,22
7,34
4,00
1,03
3,25
5,03 5,
20
5,88
5,76
2,29
2,95
Tabel 24. Prosentase Pemakaian Sendiri Terhadap Produksi Tahun 2009-2010 dan Rencana Tahun 2011Table 24. Self Consumption Percentage Towards Production of Year 2009-2010 and Plan of 2011
Unit Bisnis Pembangkitan Produksi Pemakaian Sendiri Prosentase Terhadap Produksi Generating Business Unit Production (GWh) Self Consumption (GWh) Percentage Towards Production 2009 2010 Rencana Plan 2011 2009 2010 Rencana Plan 2011 2009 2010 Rencana Plan 2011
PLTA 3.575,61 6.116,45 3.325,00 19,10 25,01 17,78 0,53 0,41 0,53
PLTD 128,66 135,80 142,74 8,00 9,96 5,71 6,22 7,34 4,00
PLTG 1.831,99 1.994,05 2.138,08 21,63 20,56 69,49 1,18 1,03 3,25
PLTG (HSD) 1.782,82 1.981,31 2.064,13 20,36 20,20 67,42 1,14 1,02 3,27
PLTG (gas) 49,18 12,74 73,96 1,27 0,36 2,07 2,58 2,82 2,80
PLTP 3.127,74 3.000,97 2.776,25 159,56 150,90 144,38 5,10 5,03 5,20
PLTU 24.397,12 25.164,87 22.683,73 1.438,49 1.479,36 1.306,66 5,90 5,88 5,76
PLTU (batu bara) 22.650,57 23.043,78 22.540,87 1.297,37 1.290,03 1.293,79 5,73 5,60 5,74
PLTU (MFO) 1.746,55 2.121,09 142,86 141,12 189,33 12,88 8,08 8,93 9,01
PLTGU 9.721,70 10.960,80 9.065,71 253,58 250,85 267,24 2,61 2,29 2,95
PLTGU (gas) 2.697,78 5.406,18 4.120,53 54,92 40,66 94,46 2,04 0,75 2,29
PLTGU (HSD) 7.023,91 5.554,62 4.945,18 198,66 210,19 172,79 2,83 3,78 3,49
Jumlah Total 42.782,82 47.372,94 40.131,52 1.901,24 1.937,29 1.811,28 4,44 4,09 4,51

Laporan Statistik Statistic Report2010
PT INDONESIA POWER
53
halaman ini sengaja dikosongkanThis Page Is Intentionally Left Blank

Laporan Statistik Statistic Report2010
PT INDONESIA POWER
54
Laporan Statistik Statistic Report2010
PT INDONESIA POWER
55
Pemakaian Bahan BakarFuel Consumption
• Pemakaian Bahan Bakar per Unit Bisnis Pembangkitan | Fuel Consumption per Generating Business Unit
• Pemakaian Bahan Bakar per Jenis Pembangkit | Fuel Consumption per Power Plant Type
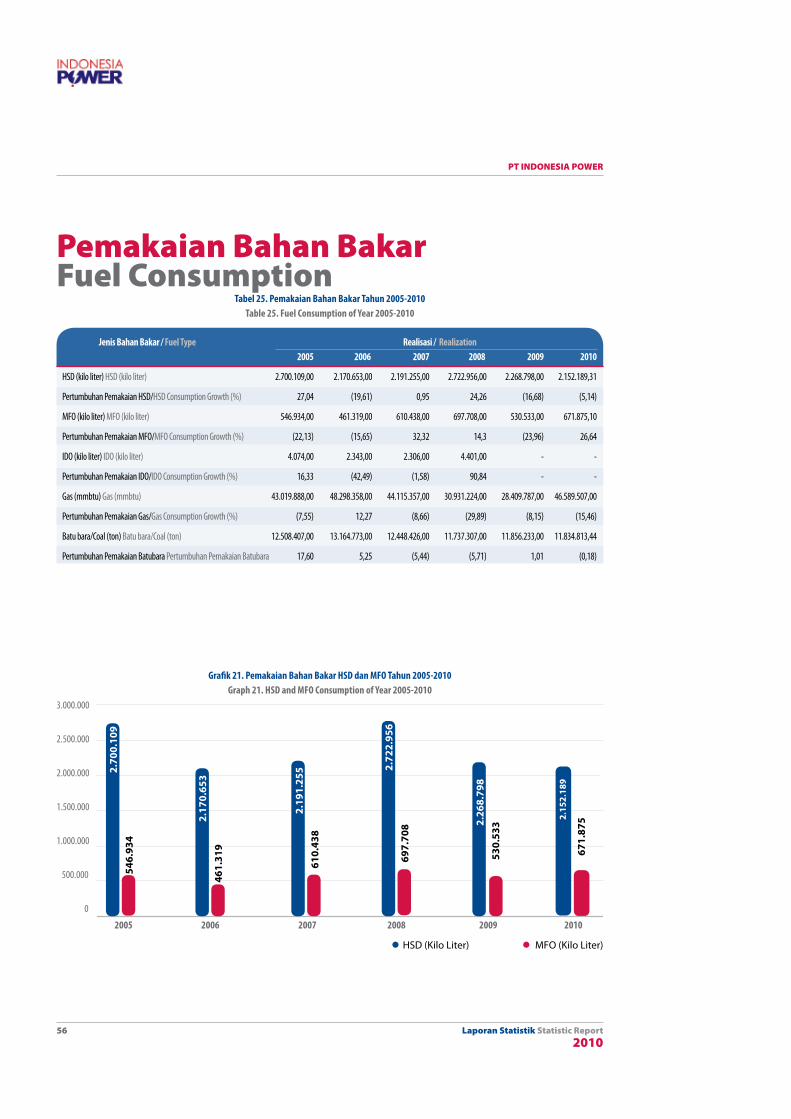
Laporan Statistik Statistic Report2010
PT INDONESIA POWER
56
Pemakaian Bahan Bakar Fuel Consumption
Grafik 21. Pemakaian Bahan Bakar HSD dan MFo Tahun 2005-2010Graph 21. HSD and MFo Consumption of Year 2005-2010
3.000.000
2.500.000
2.000.000
1.500.000
1.000.000
500.000
0
2005 2006 2007 2008 2009 2010
l HSD (Kilo Liter)l MFO (Kilo Liter)
2.70
0.10
9
2.17
0.65
3
2.19
1.25
5 2.72
2.95
6
2.26
8.79
8
2.15
2.18
9
546.
934
461.
319
610.
438
697.
708
530.
533
671.
875
Tabel 25. Pemakaian Bahan Bakar Tahun 2005-2010Table 25. Fuel Consumption of Year 2005-2010
Jenis Bahan Bakar / Fuel Type Realisasi / Realization 2005 2006 2007 2008 2009 2010
HSD (kilo liter) HSD (kilo liter) 2.700.109,00 2.170.653,00 2.191.255,00 2.722.956,00 2.268.798,00 2.152.189,31
Pertumbuhan Pemakaian HSD/HSD Consumption Growth (%) 27,04 (19,61) 0,95 24,26 (16,68) (5,14)
MFO (kilo liter) MFO (kilo liter) 546.934,00 461.319,00 610.438,00 697.708,00 530.533,00 671.875,10
Pertumbuhan Pemakaian MFO/MFO Consumption Growth (%) (22,13) (15,65) 32,32 14,3 (23,96) 26,64
IDO (kilo liter) IDO (kilo liter) 4.074,00 2.343,00 2.306,00 4.401,00 - -
Pertumbuhan Pemakaian IDO/IDO Consumption Growth (%) 16,33 (42,49) (1,58) 90,84 - -
Gas (mmbtu) Gas (mmbtu) 43.019.888,00 48.298.358,00 44.115.357,00 30.931.224,00 28.409.787,00 46.589.507,00
Pertumbuhan Pemakaian Gas/Gas Consumption Growth (%) (7,55) 12,27 (8,66) (29,89) (8,15) (15,46)
Batu bara/Coal (ton) Batu bara/Coal (ton) 12.508.407,00 13.164.773,00 12.448.426,00 11.737.307,00 11.856.233,00 11.834.813,44
Pertumbuhan Pemakaian Batubara Pertumbuhan Pemakaian Batubara 17,60 5,25 (5,44) (5,71) 1,01 (0,18)

Laporan Statistik Statistic Report2010
PT INDONESIA POWER
57
2010
2010
Grafik 22. Pemakaian Bahan Bakar IDO Tahun 2005-2010Graph 22. IDO Consumption of Year 2005-2010
4.500
4.000
3.500
3.000
2.500
2.000
1.500
1.000
500
02005 2006 2007 2008 2009 2010
l IDO Kilo Liter
4.07
4
2.34
3
2.30
6
4.40
1
0 0
Grafik. Pertumbuhan Pemakaian Bahan Bakar HSD dan MFo Tahun 2005-2010Graph. HSD and MFo Consumption Growth of Year 2005-2010
Pertumbuhan Pemakaian HSD / HSD Consumption Growth 2005-2010 (%) Pertumbuhan Pemakaian MFO / MFO Consumption Growth 2005-2010 (%)
40,00
30,00
20,00
10,00
-
(10,00)
(20,00)
(30,00)
2005
2005
2006
2007
2007
2008
2009
2006
2008
2009
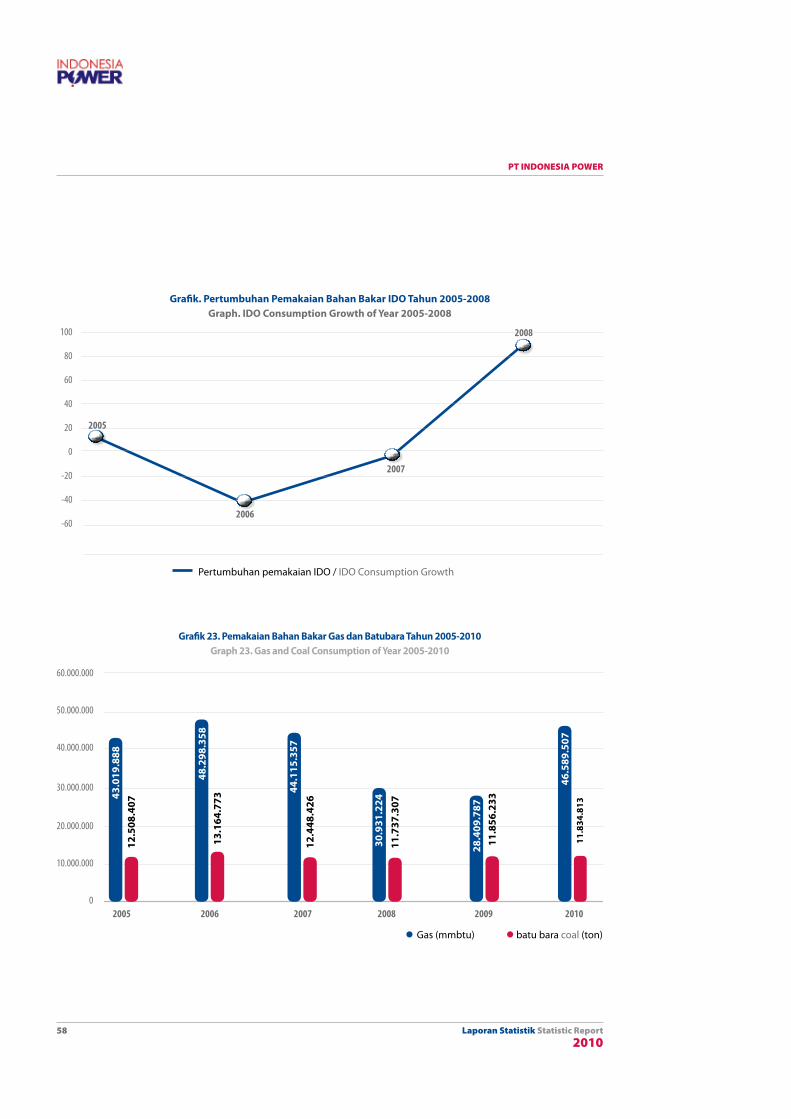
Laporan Statistik Statistic Report2010
PT INDONESIA POWER
58
Grafik 23. Pemakaian Bahan Bakar Gas dan Batubara Tahun 2005-2010Graph 23. Gas and Coal Consumption of Year 2005-2010
60.000.000
50.000.000
40.000.000
30.000.000
20.000.000
10.000.000
02005 2006 2007 2008 2009 2010
l Gas (mmbtu) l batu bara coal (ton)
43.0
19.8
88
48.2
98.3
58
44.1
15.3
57
30.9
31.2
24
12.5
08.4
07
13.1
64.7
73
12.4
48.4
26
11.7
37.3
07
28.4
09.7
8711
.856
.233
11.8
34.8
13
2005
2006
2007
2008
Pertumbuhan pemakaian IDO / IDO Consumption Growth
100
80
60
40
20
0
-20
-40
-60
Grafik. Pertumbuhan Pemakaian Bahan Bakar IDO Tahun 2005-2008Graph. IDO Consumption Growth of Year 2005-2008
46.5
89.5
07

Laporan Statistik Statistic Report2010
PT INDONESIA POWER
59
Pertumbuhan Pemakaian Gas / Gas Compsumption Growth %
Pertumbuhan Pemakaian Batu Bara / Pertumbuhan Pemakaian Batu Bara
40
20
0
-20
-40
-60
-80
-100
-120
2005
2006
2008
2009 2010
2005 2006
2007
2007
2008
2009 2010
Grafik. Pertumbuhan Pemakaian Bahan Bakar Gas dan Batubara Tahun 2005-2010Graph. Gas and Coal Consumption Growth of Year 2005-2010
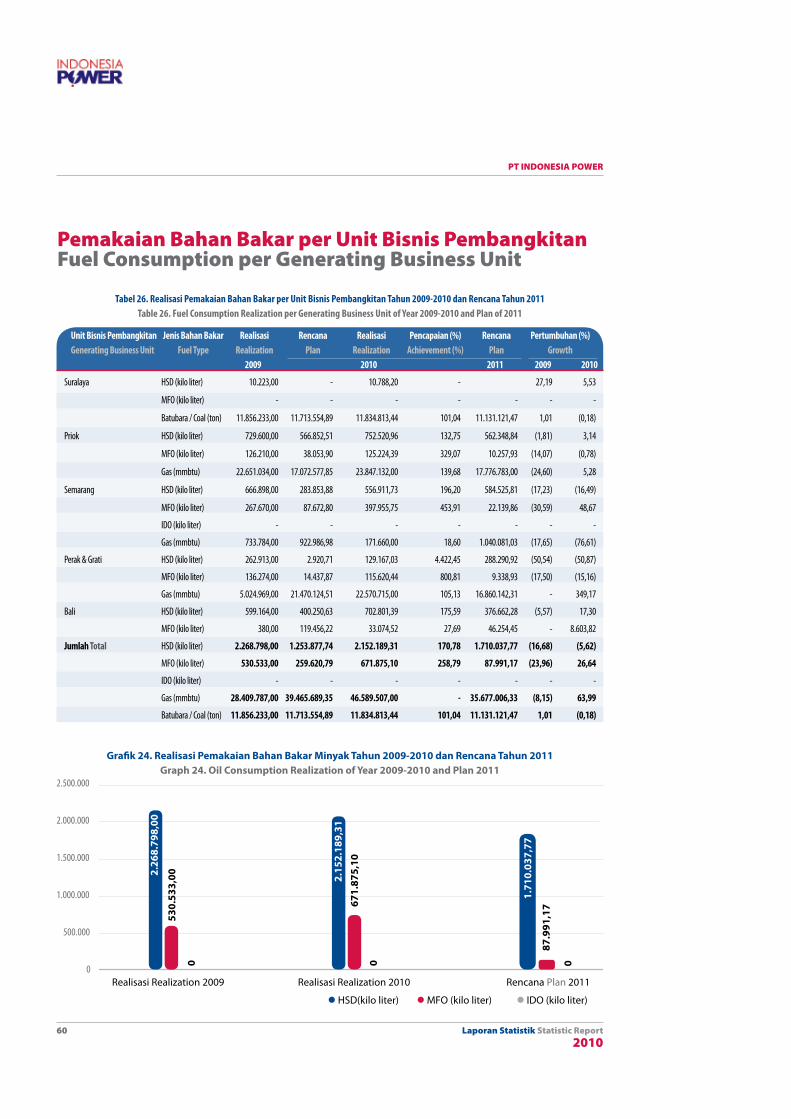
Laporan Statistik Statistic Report2010
PT INDONESIA POWER
60
Pemakaian Bahan Bakar per Unit Bisnis Pembangkitan Fuel Consumption per Generating Business Unit
Grafik 24. Realisasi Pemakaian Bahan Bakar Minyak Tahun 2009-2010 dan Rencana Tahun 2011Graph 24. Oil Consumption Realization of Year 2009-2010 and Plan 2011
2.500.000
2.000.000
1.500.000
1.000.000
500.000
0
l HSD(kilo liter) l MFO (kilo liter) l IDO (kilo liter)
2.26
8.79
8,00
2.15
2.18
9,31
530.
533,
00
671
.875
,10
1.7
10.0
37,7
7
87.
991,
17
Realisasi Realization 2009 Realisasi Realization 2010 Rencana Plan 2011
0 0 0
Tabel 26. Realisasi Pemakaian Bahan Bakar per Unit Bisnis Pembangkitan Tahun 2009-2010 dan Rencana Tahun 2011Table 26. Fuel Consumption Realization per Generating Business Unit of Year 2009-2010 and Plan of 2011
Unit Bisnis Pembangkitan Jenis Bahan Bakar Realisasi Rencana Realisasi Pencapaian (%) Rencana Pertumbuhan (%)Generating Business Unit Fuel Type Realization Plan Realization Achievement (%) Plan Growth
2009 2010 2011 2009 2010
Suralaya HSD (kilo liter) 10.223,00 - 10.788,20 - 27,19 5,53
MFO (kilo liter) - - - - - - -
Batubara / Coal (ton) 11.856.233,00 11.713.554,89 11.834.813,44 101,04 11.131.121,47 1,01 (0,18)
Priok HSD (kilo liter) 729.600,00 566.852,51 752.520,96 132,75 562.348,84 (1,81) 3,14
MFO (kilo liter) 126.210,00 38.053,90 125.224,39 329,07 10.257,93 (14,07) (0,78)
Gas (mmbtu) 22.651.034,00 17.072.577,85 23.847.132,00 139,68 17.776.783,00 (24,60) 5,28
Semarang HSD (kilo liter) 666.898,00 283.853,88 556.911,73 196,20 584.525,81 (17,23) (16,49)
MFO (kilo liter) 267.670,00 87.672,80 397.955,75 453,91 22.139,86 (30,59) 48,67
IDO (kilo liter) - - - - - - -
Gas (mmbtu) 733.784,00 922.986,98 171.660,00 18,60 1.040.081,03 (17,65) (76,61)
Perak & Grati HSD (kilo liter) 262.913,00 2.920,71 129.167,03 4.422,45 288.290,92 (50,54) (50,87)
MFO (kilo liter) 136.274,00 14.437,87 115.620,44 800,81 9.338,93 (17,50) (15,16)
Gas (mmbtu) 5.024.969,00 21.470.124,51 22.570.715,00 105,13 16.860.142,31 - 349,17
Bali HSD (kilo liter) 599.164,00 400.250,63 702.801,39 175,59 376.662,28 (5,57) 17,30
MFO (kilo liter) 380,00 119.456,22 33.074,52 27,69 46.254,45 - 8.603,82
Jumlah Total HSD (kilo liter) 2.268.798,00 1.253.877,74 2.152.189,31 170,78 1.710.037,77 (16,68) (5,62)
MFO (kilo liter) 530.533,00 259.620,79 671.875,10 258,79 87.991,17 (23,96) 26,64
IDO (kilo liter) - - - - - - -
Gas (mmbtu) 28.409.787,00 39.465.689,35 46.589.507,00 - 35.677.006,33 (8,15) 63,99
Batubara / Coal (ton) 11.856.233,00 11.713.554,89 11.834.813,44 101,04 11.131.121,47 1,01 (0,18)
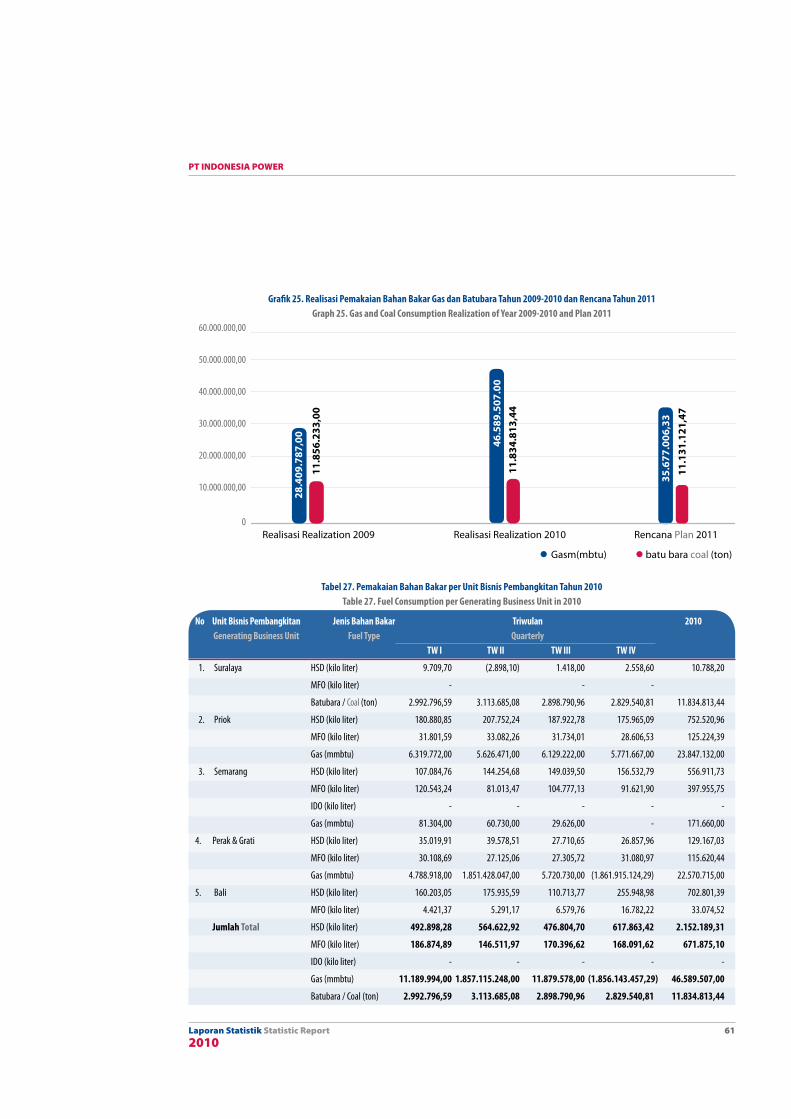
Laporan Statistik Statistic Report2010
PT INDONESIA POWER
61
Grafik 25. Realisasi Pemakaian Bahan Bakar Gas dan Batubara Tahun 2009-2010 dan Rencana Tahun 2011Graph 25. Gas and Coal Consumption Realization of Year 2009-2010 and Plan 2011
60.000.000,00
50.000.000,00
40.000.000,00
30.000.000,00
20.000.000,00
10.000.000,00
0
l Gasm(mbtu) l batu bara coal (ton)
28.4
09.7
87,0
0
11.8
56.2
33,0
0
11.8
34.8
13,4
4
35.6
77.0
06,3
3 11
.131
.121
,47
Realisasi Realization 2009 Realisasi Realization 2010 Rencana Plan 2011
46.5
89.5
07.0
0
Tabel 27. Pemakaian Bahan Bakar per Unit Bisnis Pembangkitan Tahun 2010Table 27. Fuel Consumption per Generating Business Unit in 2010
no Unit Bisnis Pembangkitan Jenis Bahan Bakar Triwulan 2010 Generating Business Unit Fuel Type Quarterly TW I TW II TW III TW IV
1. Suralaya HSD (kilo liter) 9.709,70 (2.898,10) 1.418,00 2.558,60 10.788,20
MFO (kilo liter) - - -
Batubara / Coal (ton) 2.992.796,59 3.113.685,08 2.898.790,96 2.829.540,81 11.834.813,44
2. Priok HSD (kilo liter) 180.880,85 207.752,24 187.922,78 175.965,09 752.520,96
MFO (kilo liter) 31.801,59 33.082,26 31.734,01 28.606,53 125.224,39
Gas (mmbtu) 6.319.772,00 5.626.471,00 6.129.222,00 5.771.667,00 23.847.132,00
3. Semarang HSD (kilo liter) 107.084,76 144.254,68 149.039,50 156.532,79 556.911,73
MFO (kilo liter) 120.543,24 81.013,47 104.777,13 91.621,90 397.955,75
IDO (kilo liter) - - - - -
Gas (mmbtu) 81.304,00 60.730,00 29.626,00 - 171.660,00
4. Perak & Grati HSD (kilo liter) 35.019,91 39.578,51 27.710,65 26.857,96 129.167,03
MFO (kilo liter) 30.108,69 27.125,06 27.305,72 31.080,97 115.620,44
Gas (mmbtu) 4.788.918,00 1.851.428.047,00 5.720.730,00 (1.861.915.124,29) 22.570.715,00
5. Bali HSD (kilo liter) 160.203,05 175.935,59 110.713,77 255.948,98 702.801,39
MFO (kilo liter) 4.421,37 5.291,17 6.579,76 16.782,22 33.074,52
Jumlah Total HSD (kilo liter) 492.898,28 564.622,92 476.804,70 617.863,42 2.152.189,31
MFO (kilo liter) 186.874,89 146.511,97 170.396,62 168.091,62 671.875,10
IDO (kilo liter) - - - - -
Gas (mmbtu) 11.189.994,00 1.857.115.248,00 11.879.578,00 (1.856.143.457,29) 46.589.507,00
Batubara / Coal (ton) 2.992.796,59 3.113.685,08 2.898.790,96 2.829.540,81 11.834.813,44
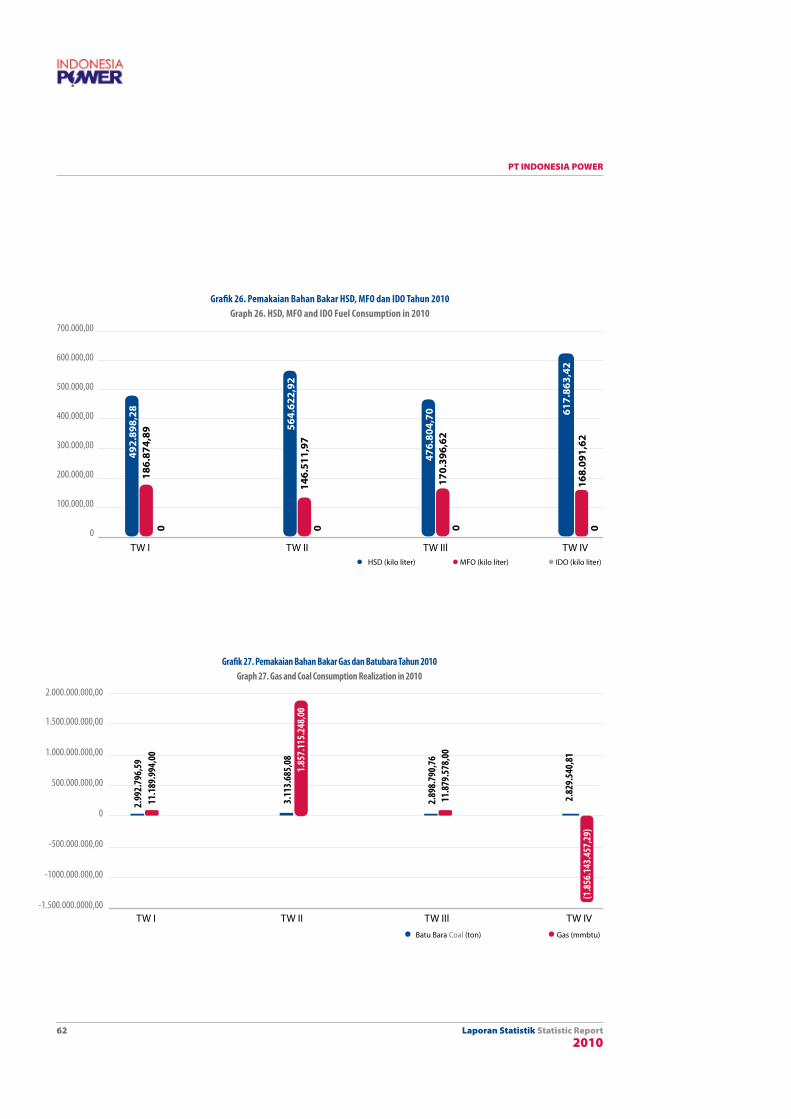
Laporan Statistik Statistic Report2010
PT INDONESIA POWER
62
Grafik 26. Pemakaian Bahan Bakar HSD, MFo dan IDo Tahun 2010Graph 26. HSD, MFo and IDo Fuel Consumption in 2010
700.000,00
600.000,00
500.000,00
400.000,00
300.000,00
200.000,00
100.000,00
0 TW I TW II TW IIl TW IV
492.
898,
28
186
.874
,89 5
64.6
22,9
214
6.51
1,97
476.
804,
70
170.
396,
62
617.
863,
42
168.
091,
62
l HSD (kilo liter) l MFO (kilo liter) l IDO (kilo liter)
Grafik 27. Pemakaian Bahan Bakar Gas dan Batubara Tahun 2010Graph 27. Gas and Coal Consumption Realization in 2010
2.000.000.000,00
1.500.000.000,00
1.000.000.000,00
500.000.000,00
0
-500.000.000,00
-1000.000.000,00
-1.500.000.0000,00
2.99
2.79
6,59
11.1
89.9
94,0
0
3.11
3.68
5,08
2.89
8.79
0,76
11.8
79.5
78,0
0
2.82
9.54
0,81
(1
.856
.143
.457
,29)
l Batu Bara Coal (ton) l Gas (mmbtu)
TW I TW II TW IIl TW IV
1.85
7.11
5.24
8,00
0
0
0
0
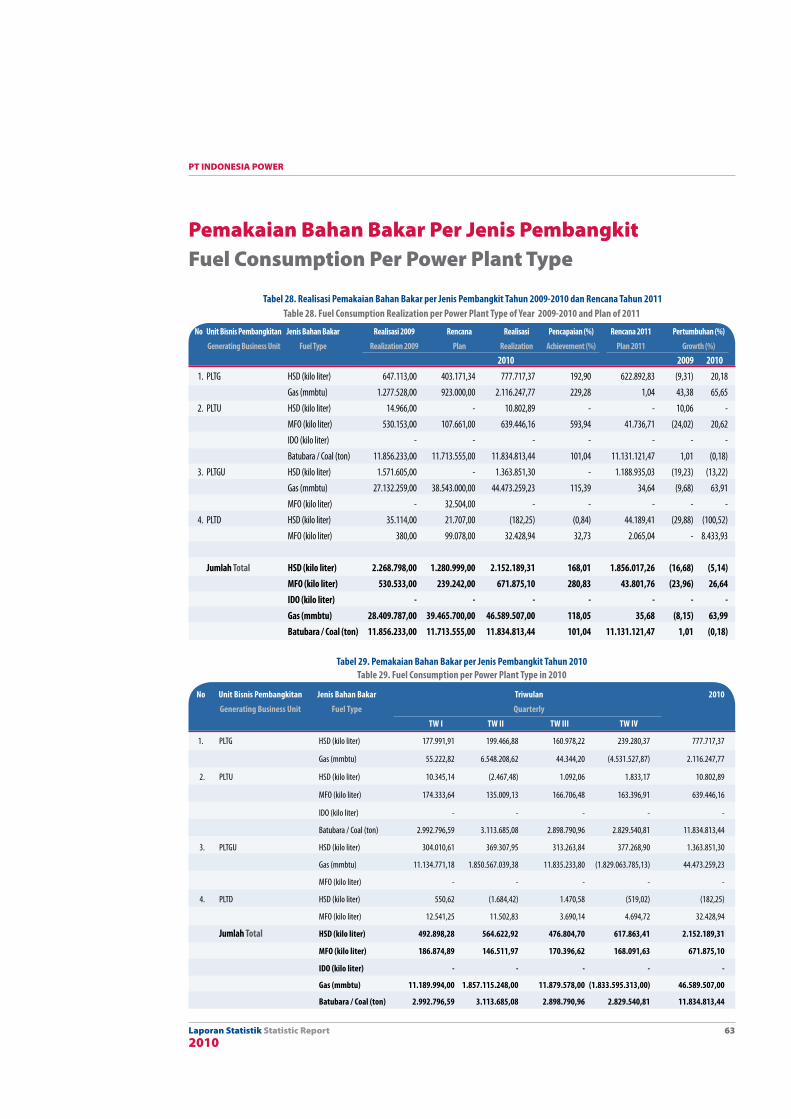
Laporan Statistik Statistic Report2010
PT INDONESIA POWER
63
Pemakaian Bahan Bakar Per Jenis Pembangkit Fuel Consumption Per Power Plant Type
no Unit Bisnis Pembangkitan Jenis Bahan Bakar Realisasi 2009 Rencana Realisasi Pencapaian (%) Rencana 2011 Pertumbuhan (%)
Generating Business Unit Fuel Type Realization 2009 Plan Realization Achievement (%) Plan 2011 Growth (%)
2010 2009 2010 1. PLTG HSD (kilo liter) 647.113,00 403.171,34 777.717,37 192,90 622.892,83 (9,31) 20,18
Gas (mmbtu) 1.277.528,00 923.000,00 2.116.247,77 229,28 1,04 43,38 65,65
2. PLTU HSD (kilo liter) 14.966,00 - 10.802,89 - - 10,06 -
MFO (kilo liter) 530.153,00 107.661,00 639.446,16 593,94 41.736,71 (24,02) 20,62
IDO (kilo liter) - - - - - - -
Batubara / Coal (ton) 11.856.233,00 11.713.555,00 11.834.813,44 101,04 11.131.121,47 1,01 (0,18)
3. PLTGU HSD (kilo liter) 1.571.605,00 - 1.363.851,30 - 1.188.935,03 (19,23) (13,22)
Gas (mmbtu) 27.132.259,00 38.543.000,00 44.473.259,23 115,39 34,64 (9,68) 63,91
MFO (kilo liter) - 32.504,00 - - - - -
4. PLTD HSD (kilo liter) 35.114,00 21.707,00 (182,25) (0,84) 44.189,41 (29,88) (100,52)
MFO (kilo liter) 380,00 99.078,00 32.428,94 32,73 2.065,04 - 8.433,93
Jumlah Total HSD (kilo liter) 2.268.798,00 1.280.999,00 2.152.189,31 168,01 1.856.017,26 (16,68) (5,14) MFo (kilo liter) 530.533,00 239.242,00 671.875,10 280,83 43.801,76 (23,96) 26,64 IDo (kilo liter) - - - - - - - Gas (mmbtu) 28.409.787,00 39.465.700,00 46.589.507,00 118,05 35,68 (8,15) 63,99 Batubara / Coal (ton) 11.856.233,00 11.713.555,00 11.834.813,44 101,04 11.131.121,47 1,01 (0,18)
Tabel 28. Realisasi Pemakaian Bahan Bakar per Jenis Pembangkit Tahun 2009-2010 dan Rencana Tahun 2011Table 28. Fuel Consumption Realization per Power Plant Type of Year 2009-2010 and Plan of 2011
Tabel 29. Pemakaian Bahan Bakar per Jenis Pembangkit Tahun 2010 Table 29. Fuel Consumption per Power Plant Type in 2010
no Unit Bisnis Pembangkitan Jenis Bahan Bakar Triwulan 2010
Generating Business Unit Fuel Type Quarterly
TW I TW II TW III TW IV
1. PLTG HSD (kilo liter) 177.991,91 199.466,88 160.978,22 239.280,37 777.717,37
Gas (mmbtu) 55.222,82 6.548.208,62 44.344,20 (4.531.527,87) 2.116.247,77
2. PLTU HSD (kilo liter) 10.345,14 (2.467,48) 1.092,06 1.833,17 10.802,89
MFO (kilo liter) 174.333,64 135.009,13 166.706,48 163.396,91 639.446,16
IDO (kilo liter) - - - - -
Batubara / Coal (ton) 2.992.796,59 3.113.685,08 2.898.790,96 2.829.540,81 11.834.813,44
3. PLTGU HSD (kilo liter) 304.010,61 369.307,95 313.263,84 377.268,90 1.363.851,30
Gas (mmbtu) 11.134.771,18 1.850.567.039,38 11.835.233,80 (1.829.063.785,13) 44.473.259,23
MFO (kilo liter) - - - - -
4. PLTD HSD (kilo liter) 550,62 (1.684,42) 1.470,58 (519,02) (182,25)
MFO (kilo liter) 12.541,25 11.502,83 3.690,14 4.694,72 32.428,94
Jumlah Total HSD (kilo liter) 492.898,28 564.622,92 476.804,70 617.863,41 2.152.189,31
MFo (kilo liter) 186.874,89 146.511,97 170.396,62 168.091,63 671.875,10
IDo (kilo liter) - - - - -
Gas (mmbtu) 11.189.994,00 1.857.115.248,00 11.879.578,00 (1.833.595.313,00) 46.589.507,00
Batubara / Coal (ton) 2.992.796,59 3.113.685,08 2.898.790,96 2.829.540,81 11.834.813,44

Laporan Statistik Statistic Report2010
PT INDONESIA POWER
64
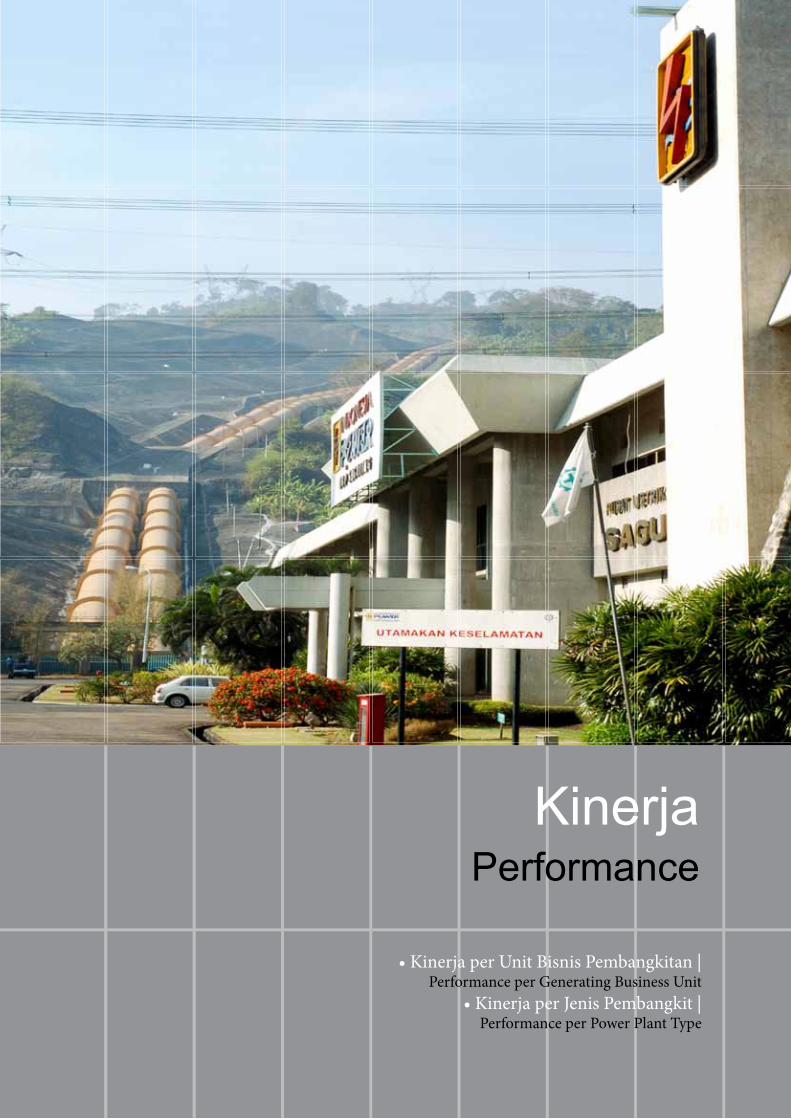
Laporan Statistik Statistic Report2010
PT INDONESIA POWER
65
KinerjaPerformance
• Kinerja per Unit Bisnis Pembangkitan | Performance per Generating Business Unit
• Kinerja per Jenis Pembangkit | Performance per Power Plant Type
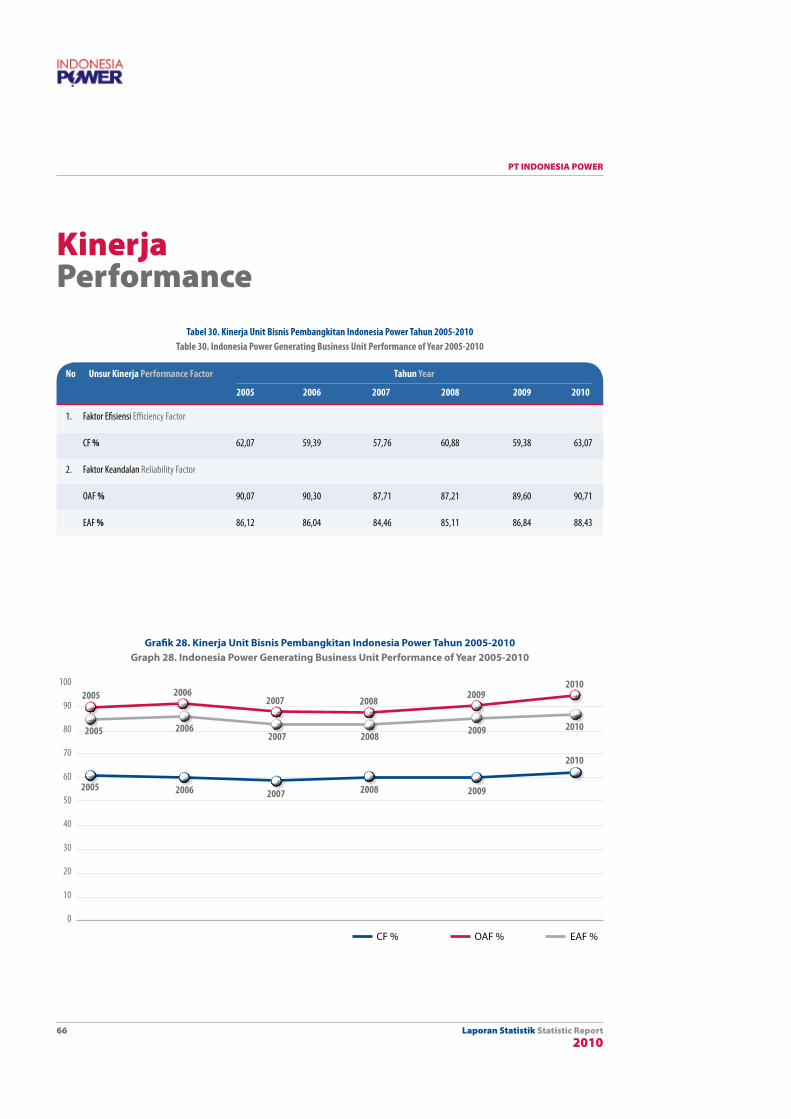
Laporan Statistik Statistic Report2010
PT INDONESIA POWER
66
KinerjaPerformance
no Unsur kinerja Performance Factor Tahun Year
2005 2006 2007 2008 2009 2010
1. Faktor Efisiensi Efficiency Factor
CF % 62,07 59,39 57,76 60,88 59,38 63,07
2. Faktor Keandalan Reliability Factor
OAF % 90,07 90,30 87,71 87,21 89,60 90,71
EAF % 86,12 86,04 84,46 85,11 86,84 88,43
Tabel 30. kinerja Unit Bisnis Pembangkitan Indonesia Power Tahun 2005-2010Table 30. Indonesia Power Generating Business Unit Performance of Year 2005-2010
Grafik 28. Kinerja Unit Bisnis Pembangkitan Indonesia Power Tahun 2005-2010Graph 28. Indonesia Power Generating Business Unit Performance of Year 2005-2010
100
90
80
70
60
50
40
30
20
10
0
2005
2005
2005
2006
2006
20062007 2008
2008
2008
2009
2009
2010
2010
2009
2007
2007
CF % OAF % EAF %
2010
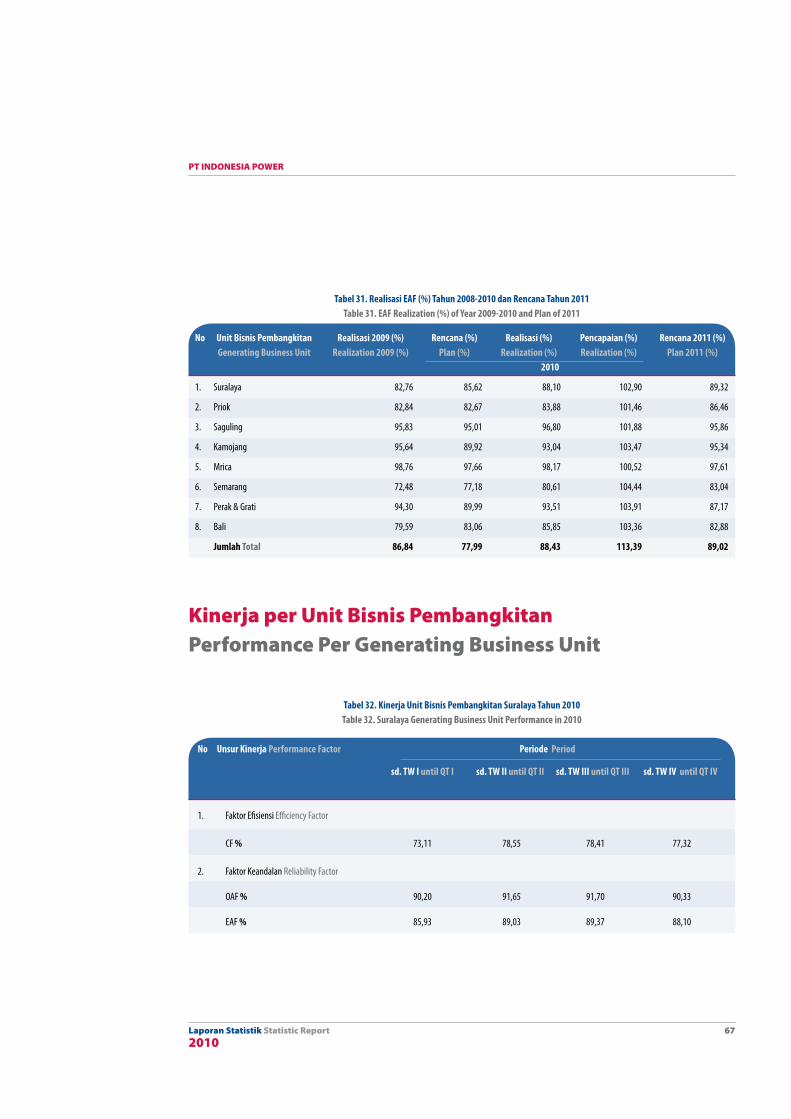
Laporan Statistik Statistic Report2010
PT INDONESIA POWER
67
no Unit Bisnis Pembangkitan Realisasi 2009 (%) Rencana (%) Realisasi (%) Pencapaian (%) Rencana 2011 (%) Generating Business Unit Realization 2009 (%) Plan (%) Realization (%) Realization (%) Plan 2011 (%) 2010
1. Suralaya 82,76 85,62 88,10 102,90 89,32
2. Priok 82,84 82,67 83,88 101,46 86,46
3. Saguling 95,83 95,01 96,80 101,88 95,86
4. Kamojang 95,64 89,92 93,04 103,47 95,34
5. Mrica 98,76 97,66 98,17 100,52 97,61
6. Semarang 72,48 77,18 80,61 104,44 83,04
7. Perak & Grati 94,30 89,99 93,51 103,91 87,17
8. Bali 79,59 83,06 85,85 103,36 82,88
Jumlah Total 86,84 77,99 88,43 113,39 89,02
Tabel 31. Realisasi EAF (%) Tahun 2008-2010 dan Rencana Tahun 2011Table 31. EAF Realization (%) of Year 2009-2010 and Plan of 2011
no Unsur kinerja Performance Factor Periode Period
sd. TW I until QT I sd. TW II until QT II sd. TW III until QT III sd. TW IV until QT IV
1. Faktor Efisiensi Efficiency Factor
CF % 73,11 78,55 78,41 77,32
2. Faktor Keandalan Reliability Factor
OAF % 90,20 91,65 91,70 90,33
EAF % 85,93 89,03 89,37 88,10
Tabel 32. kinerja Unit Bisnis Pembangkitan Suralaya Tahun 2010Table 32. Suralaya Generating Business Unit Performance in 2010
Kinerja per Unit Bisnis PembangkitanPerformance Per Generating Business Unit
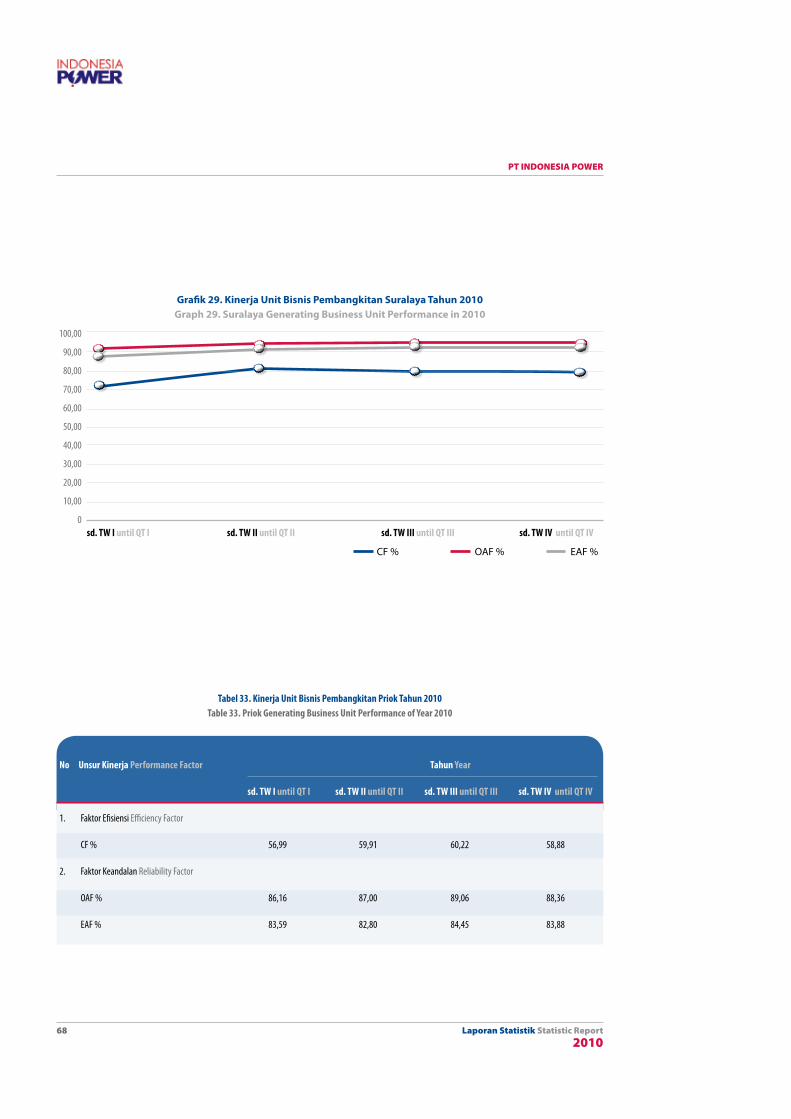
Laporan Statistik Statistic Report2010
PT INDONESIA POWER
68
Grafik 29. Kinerja Unit Bisnis Pembangkitan Suralaya Tahun 2010Graph 29. Suralaya Generating Business Unit Performance in 2010
100,00
90,00
80,00
70,00
60,00
50,00
40,00
30,00
20,00
10,00
0sd. TW I until QT I sd. TW II until QT II sd. TW III until QT III sd. TW IV until QT IV
CF % OAF % EAF %
no Unsur kinerja Performance Factor Tahun Year
sd. TW I until QT I sd. TW II until QT II sd. TW III until QT III sd. TW IV until QT IV
1. Faktor Efisiensi Efficiency Factor
CF % 56,99 59,91 60,22 58,88
2. Faktor Keandalan Reliability Factor
OAF % 86,16 87,00 89,06 88,36
EAF % 83,59 82,80 84,45 83,88
Tabel 33. kinerja Unit Bisnis Pembangkitan Priok Tahun 2010Table 33. Priok Generating Business Unit Performance of Year 2010

Laporan Statistik Statistic Report2010
PT INDONESIA POWER
69
Grafik 30. Kinerja Unit Bisnis Pembangkitan Priok Tahun 2010Graph 30. Priok Generating Business Unit Performance in 2010
100
90
80
70
60
50
40
30
20
10
0sd. TW I until QT I sd. TW II until QT II sd. TW III until QT III sd. TW IV until QT IV
CF % OAF % EAF %
Tabel 34. kinerja Unit Bisnis Pembangkitan Saguling Tahun 2010Table 34. Saguling Generating Business Unit Performance of Year 2010
no Unsur kinerja Performance Factor Tahun Year
sd. TW I until QT I sd. TW II until QT II sd. TW III until QT III sd. TW IV until QT IV
1. Faktor Efisiensi Efficiency Factor
CF % 73,65 67,34 63,94 68,45
2. Faktor Keandalan Reliability Factor
OAF % 99,79 97,81 96,89 96,80
EAF % 99,79 97,81 96,89 96,80
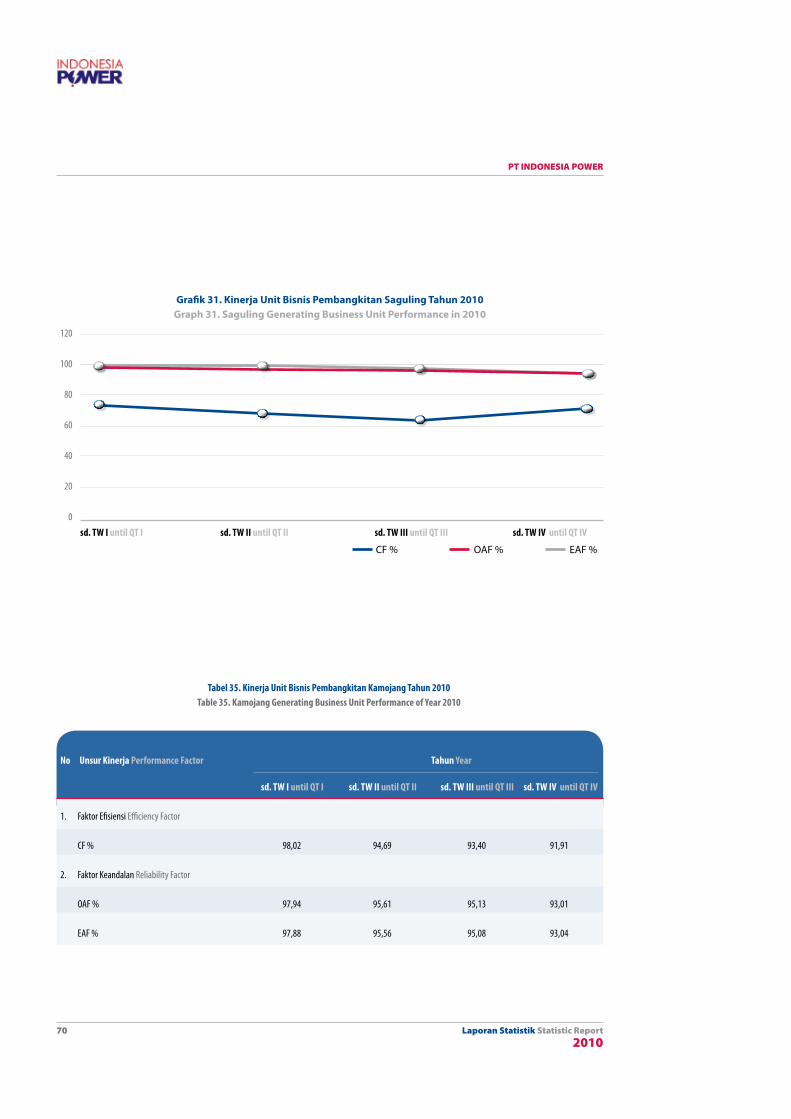
Laporan Statistik Statistic Report2010
PT INDONESIA POWER
70
Grafik 31. Kinerja Unit Bisnis Pembangkitan Saguling Tahun 2010Graph 31. Saguling Generating Business Unit Performance in 2010
120
100
80
60
40
20
0sd. TW I until QT I sd. TW II until QT II sd. TW III until QT III sd. TW IV until QT IV
CF % OAF % EAF %
no Unsur kinerja Performance Factor Tahun Year
sd. TW I until QT I sd. TW II until QT II sd. TW III until QT III sd. TW IV until QT IV
1. Faktor Efisiensi Efficiency Factor
CF % 98,02 94,69 93,40 91,91
2. Faktor Keandalan Reliability Factor
OAF % 97,94 95,61 95,13 93,01
EAF % 97,88 95,56 95,08 93,04
Tabel 35. kinerja Unit Bisnis Pembangkitan kamojang Tahun 2010Table 35. kamojang Generating Business Unit Performance of Year 2010

Laporan Statistik Statistic Report2010
PT INDONESIA POWER
71
Grafik 32. Kinerja Unit Bisnis Pembangkitan Kamojang Tahun 2010Graph 32. Kamojang Generating Business Unit Performance in 2010
999897969594939291908988
0
sd. TW I until QT I sd. TW II until QT II sd. TW III until QT III sd. TW IV until QT IV
CF % OAF % EAF %
Tabel 36. kinerja Unit Bisnis Pembangkitan Mrica Tahun 2010Table 36. Mrica Generating Business Unit Performance of Year 2010
no Unsur kinerja Performance Factor Tahun Year
sd. TW I until QT I sd. TW II until QT II sd. TW III until QT III sd. TW IV until QT IV
1. Faktor Efisiensi Efficiency Factor
CF % 51,16 51,70 47,21 49,51
2. Faktor Keandalan Reliability Factor
OAF % 97,34 98,67 97,73 98,17
EAF % 97,34 98,67 97,73 98,17
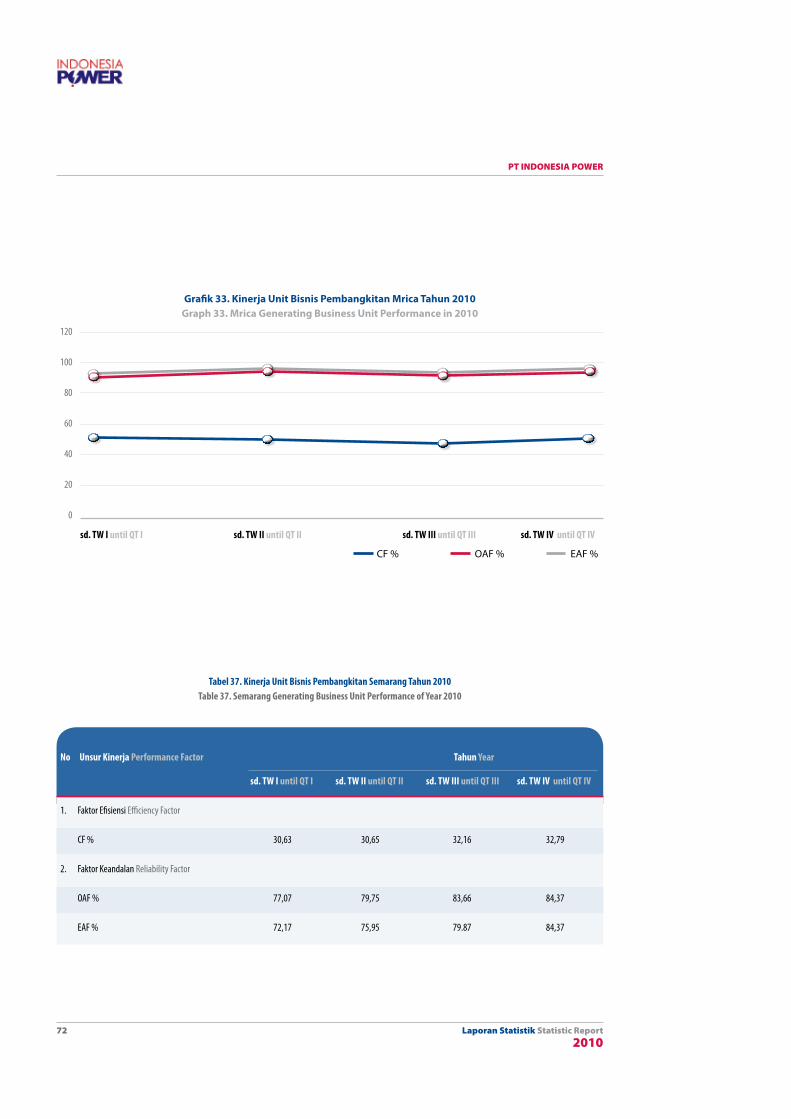
Laporan Statistik Statistic Report2010
PT INDONESIA POWER
72
Grafik 33. Kinerja Unit Bisnis Pembangkitan Mrica Tahun 2010Graph 33. Mrica Generating Business Unit Performance in 2010
120
100
80
60
40
20
0
sd. TW I until QT I sd. TW II until QT II sd. TW III until QT III sd. TW IV until QT IV
CF % OAF % EAF %
Tabel 37. kinerja Unit Bisnis Pembangkitan Semarang Tahun 2010Table 37. Semarang Generating Business Unit Performance of Year 2010
no Unsur kinerja Performance Factor Tahun Year
sd. TW I until QT I sd. TW II until QT II sd. TW III until QT III sd. TW IV until QT IV
1. Faktor Efisiensi Efficiency Factor
CF % 30,63 30,65 32,16 32,79
2. Faktor Keandalan Reliability Factor
OAF % 77,07 79,75 83,66 84,37
EAF % 72,17 75,95 79.87 84,37
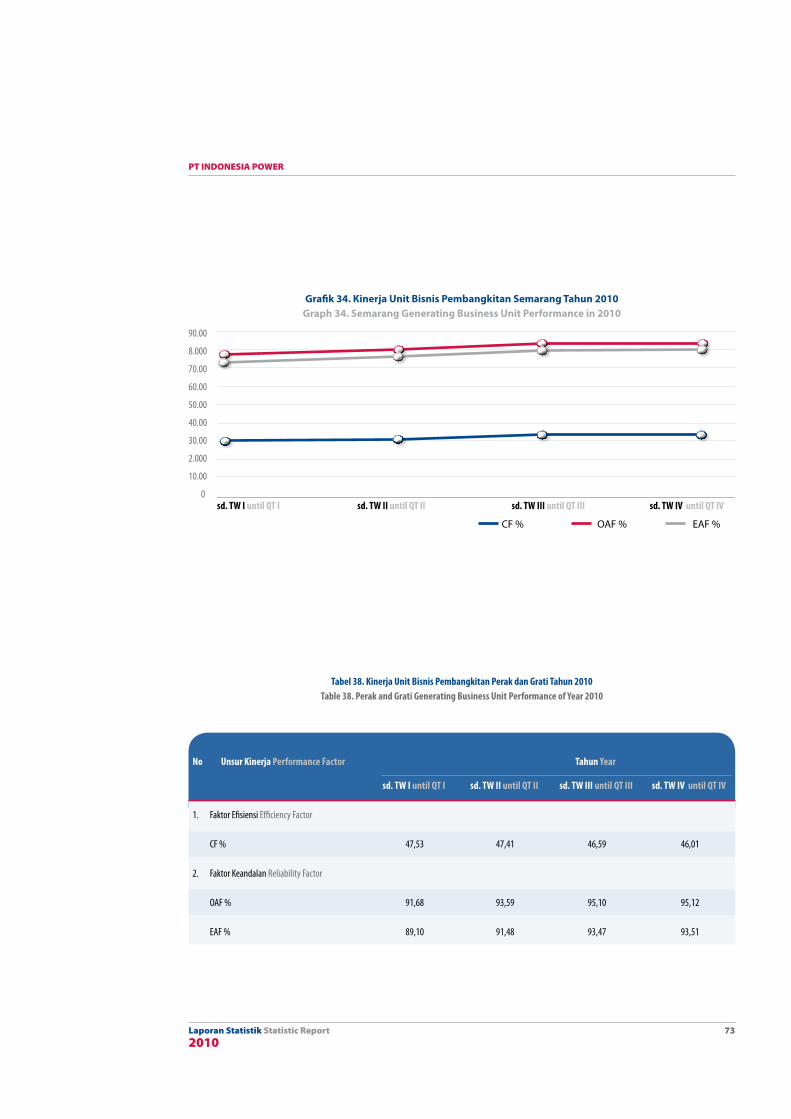
Laporan Statistik Statistic Report2010
PT INDONESIA POWER
73
Grafik 34. Kinerja Unit Bisnis Pembangkitan Semarang Tahun 2010Graph 34. Semarang Generating Business Unit Performance in 2010
90.00
8.000
70.00
60.00
50.00
40.00
30.00
2.000
10.00
0sd. TW I until QT I sd. TW II until QT II sd. TW III until QT III sd. TW IV until QT IV
CF % OAF % EAF %
Tabel 38. kinerja Unit Bisnis Pembangkitan Perak dan Grati Tahun 2010Table 38. Perak and Grati Generating Business Unit Performance of Year 2010
no Unsur kinerja Performance Factor Tahun Year
sd. TW I until QT I sd. TW II until QT II sd. TW III until QT III sd. TW IV until QT IV
1. Faktor Efisiensi Efficiency Factor
CF % 47,53 47,41 46,59 46,01
2. Faktor Keandalan Reliability Factor
OAF % 91,68 93,59 95,10 95,12
EAF % 89,10 91,48 93,47 93,51
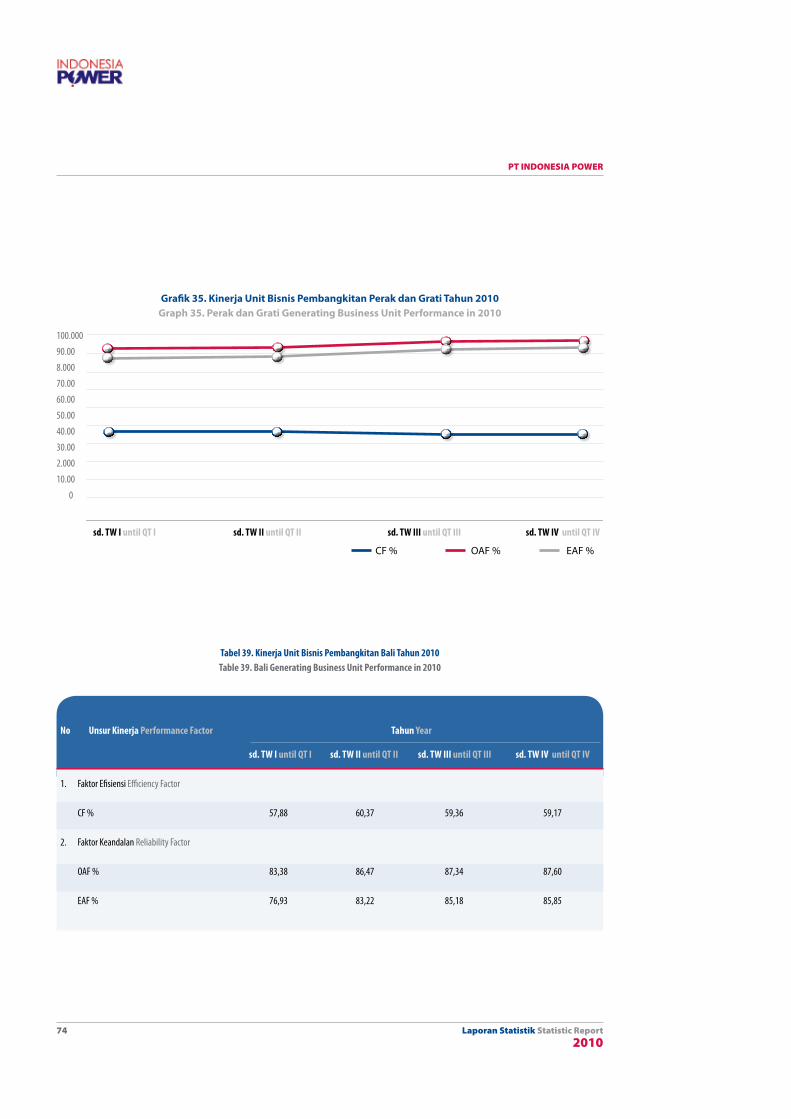
Laporan Statistik Statistic Report2010
PT INDONESIA POWER
74
Grafik 35. Kinerja Unit Bisnis Pembangkitan Perak dan Grati Tahun 2010Graph 35. Perak dan Grati Generating Business Unit Performance in 2010
100.000
90.00
8.000
70.00
60.00
50.00
40.00
30.00
2.000
10.00
0
sd. TW I until QT I sd. TW II until QT II sd. TW III until QT III sd. TW IV until QT IV
CF % OAF % EAF %
Tabel 39. kinerja Unit Bisnis Pembangkitan Bali Tahun 2010Table 39. Bali Generating Business Unit Performance in 2010
no Unsur kinerja Performance Factor Tahun Year
sd. TW I until QT I sd. TW II until QT II sd. TW III until QT III sd. TW IV until QT IV
1. Faktor Efisiensi Efficiency Factor
CF % 57,88 60,37 59,36 59,17
2. Faktor Keandalan Reliability Factor
OAF % 83,38 86,47 87,34 87,60
EAF % 76,93 83,22 85,18 85,85
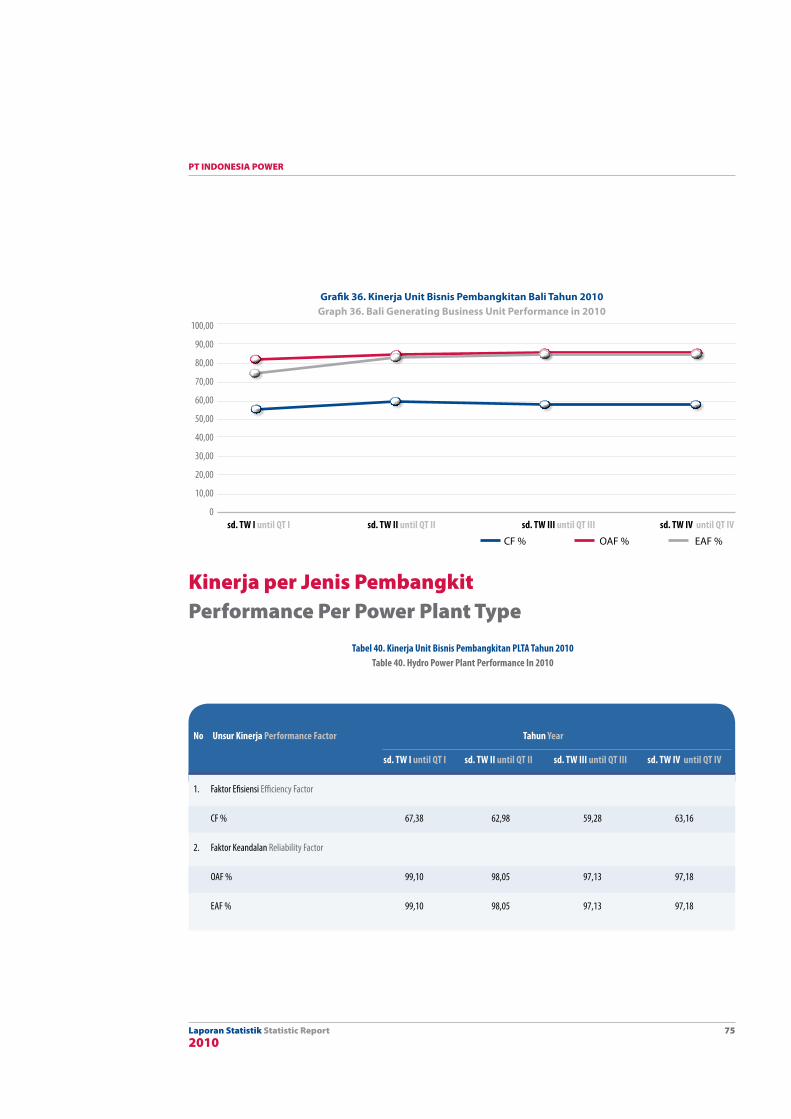
Laporan Statistik Statistic Report2010
PT INDONESIA POWER
75
Grafik 36. Kinerja Unit Bisnis Pembangkitan Bali Tahun 2010Graph 36. Bali Generating Business Unit Performance in 2010
100,00
90,00
80,00
70,00
60,00
50,00
40,00
30,00
20,00
10,00
0sd. TW I until QT I sd. TW II until QT II sd. TW III until QT III sd. TW IV until QT IV
CF % OAF % EAF %
Tabel 40. kinerja Unit Bisnis Pembangkitan PLTA Tahun 2010Table 40. Hydro Power Plant Performance In 2010
no Unsur kinerja Performance Factor Tahun Year
sd. TW I until QT I sd. TW II until QT II sd. TW III until QT III sd. TW IV until QT IV
1. Faktor Efisiensi Efficiency Factor
CF % 67,38 62,98 59,28 63,16
2. Faktor Keandalan Reliability Factor
OAF % 99,10 98,05 97,13 97,18
EAF % 99,10 98,05 97,13 97,18
Kinerja per Jenis Pembangkit Performance Per Power Plant Type
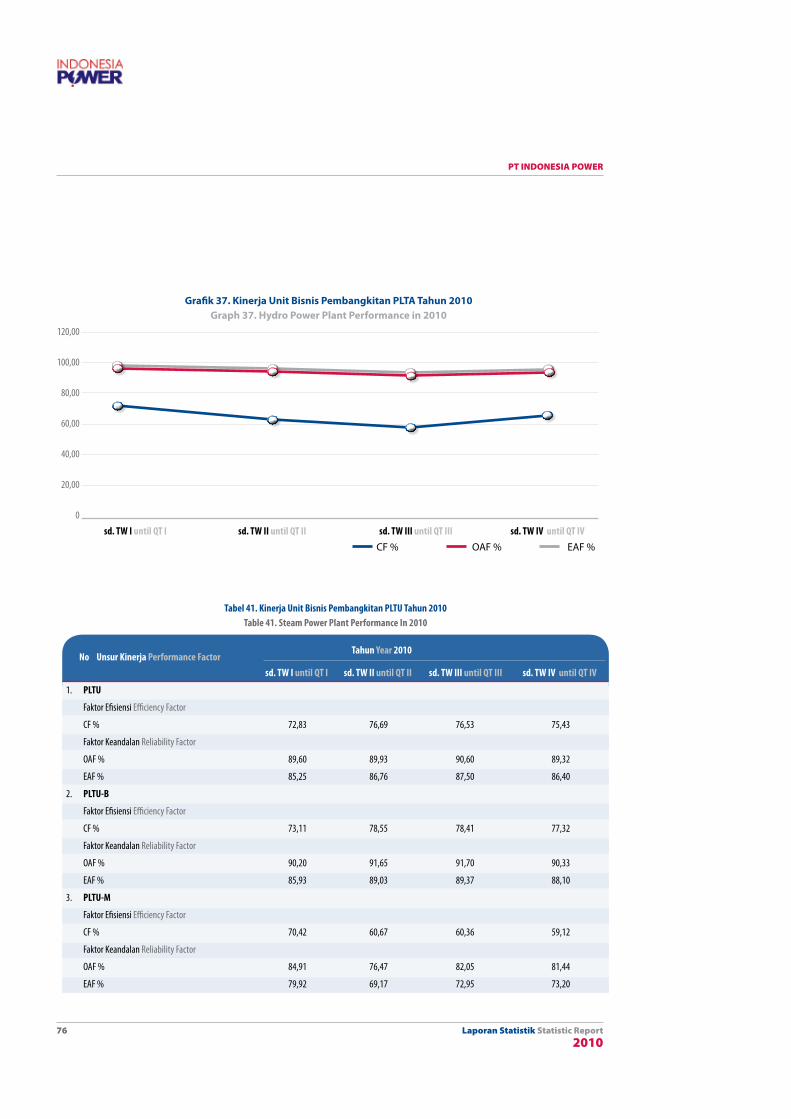
Laporan Statistik Statistic Report2010
PT INDONESIA POWER
76
Grafik 37. Kinerja Unit Bisnis Pembangkitan PLTA Tahun 2010Graph 37. Hydro Power Plant Performance in 2010
120,00
100,00
80,00
60,00
40,00
20,00
0
sd. TW I until QT I sd. TW II until QT II sd. TW III until QT III sd. TW IV until QT IVCF % OAF % EAF %
Tabel 41. kinerja Unit Bisnis Pembangkitan PLTU Tahun 2010Table 41. Steam Power Plant Performance In 2010
Tahun Year 2010
sd. TW I until QT I sd. TW II until QT II sd. TW III until QT III sd. TW IV until QT IV
1. PLTU
Faktor Efisiensi Efficiency Factor
CF % 72,83 76,69 76,53 75,43
Faktor Keandalan Reliability Factor
OAF % 89,60 89,93 90,60 89,32
EAF % 85,25 86,76 87,50 86,40
2. PLTU-B
Faktor Efisiensi Efficiency Factor
CF % 73,11 78,55 78,41 77,32
Faktor Keandalan Reliability Factor
OAF % 90,20 91,65 91,70 90,33
EAF % 85,93 89,03 89,37 88,10
3. PLTU-M
Faktor Efisiensi Efficiency Factor
CF % 70,42 60,67 60,36 59,12
Faktor Keandalan Reliability Factor
OAF % 84,91 76,47 82,05 81,44
EAF % 79,92 69,17 72,95 73,20
no Unsur kinerja Performance Factor
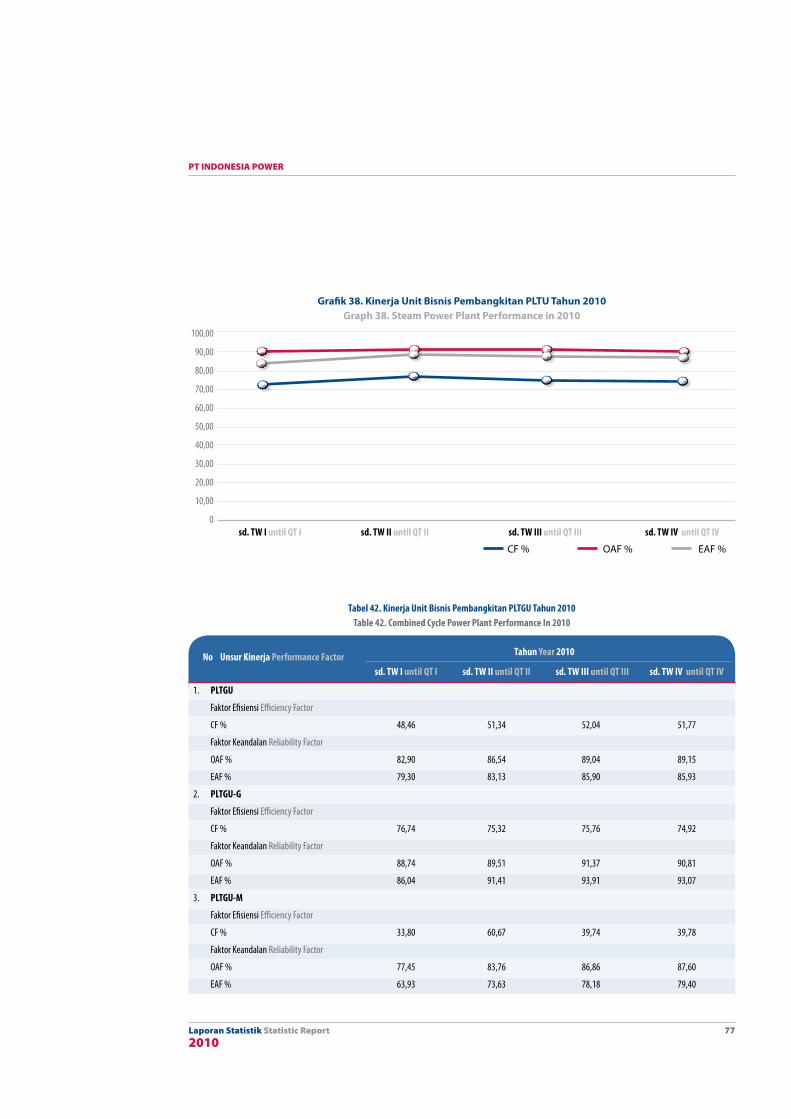
Laporan Statistik Statistic Report2010
PT INDONESIA POWER
77
Grafik 38. Kinerja Unit Bisnis Pembangkitan PLTU Tahun 2010Graph 38. Steam Power Plant Performance in 2010
100,00
90,00
80,00
70,00
60,00
50,00
40,00
30,00
20,00
10,00
0
CF % OAF % EAF %
sd. TW I until QT I sd. TW II until QT II sd. TW III until QT III sd. TW IV until QT IV
Tabel 42. kinerja Unit Bisnis Pembangkitan PLTGU Tahun 2010Table 42. Combined Cycle Power Plant Performance In 2010
Tahun Year 2010
sd. TW I until QT I sd. TW II until QT II sd. TW III until QT III sd. TW IV until QT IV
1. PLTGU
Faktor Efisiensi Efficiency Factor
CF % 48,46 51,34 52,04 51,77
Faktor Keandalan Reliability Factor
OAF % 82,90 86,54 89,04 89,15
EAF % 79,30 83,13 85,90 85,93
2. PLTGU-G
Faktor Efisiensi Efficiency Factor
CF % 76,74 75,32 75,76 74,92
Faktor Keandalan Reliability Factor
OAF % 88,74 89,51 91,37 90,81
EAF % 86,04 91,41 93,91 93,07
3. PLTGU-M
Faktor Efisiensi Efficiency Factor
CF % 33,80 60,67 39,74 39,78
Faktor Keandalan Reliability Factor
OAF % 77,45 83,76 86,86 87,60
EAF % 63,93 73,63 78,18 79,40
no Unsur kinerja Performance Factor
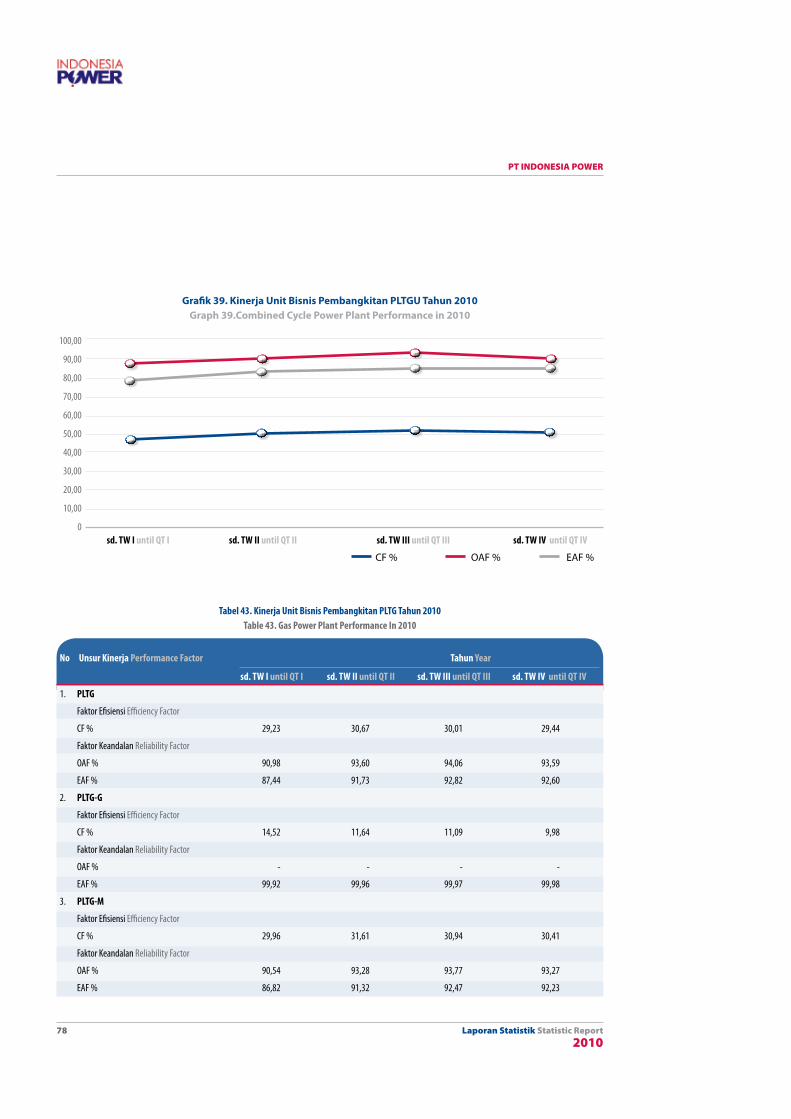
Laporan Statistik Statistic Report2010
PT INDONESIA POWER
78
Grafik 39. Kinerja Unit Bisnis Pembangkitan PLTGU Tahun 2010Graph 39.Combined Cycle Power Plant Performance in 2010
100,00
90,00
80,00
70,00
60,00
50,00
40,00
30,00
20,00
10,00
0 sd. TW I until QT I sd. TW II until QT II sd. TW III until QT III sd. TW IV until QT IV
CF % OAF % EAF %
Tabel 43. kinerja Unit Bisnis Pembangkitan PLTG Tahun 2010Table 43. Gas Power Plant Performance In 2010
no Unsur kinerja Performance Factor Tahun Year
sd. TW I until QT I sd. TW II until QT II sd. TW III until QT III sd. TW IV until QT IV
1. PLTG
Faktor Efisiensi Efficiency Factor
CF % 29,23 30,67 30,01 29,44
Faktor Keandalan Reliability Factor
OAF % 90,98 93,60 94,06 93,59
EAF % 87,44 91,73 92,82 92,60
2. PLTG-G
Faktor Efisiensi Efficiency Factor
CF % 14,52 11,64 11,09 9,98
Faktor Keandalan Reliability Factor
OAF % - - - -
EAF % 99,92 99,96 99,97 99,98
3. PLTG-M
Faktor Efisiensi Efficiency Factor
CF % 29,96 31,61 30,94 30,41
Faktor Keandalan Reliability Factor
OAF % 90,54 93,28 93,77 93,27
EAF % 86,82 91,32 92,47 92,23

Laporan Statistik Statistic Report2010
PT INDONESIA POWER
79
Grafik 40. Kinerja Unit Bisnis Pembangkitan PLTG Tahun 2010Graph 40. Gas Power Plant Performance in 2010
100,00
90,00
80,00
70,00
60,00
50,00
40,00
30,00
20,00
10,00
0 sd. TW I until QT I sd. TW II until QT II sd. TW III until QT III sd. TW IV until QT IV
CF % OAF % EAF %
Tabel 44. kinerja Unit Bisnis Pembangkitan PLTP Tahun 2010Table 44. Geothermal Power Plant Performance of Year 2010
no Unsur kinerja Performance Factor Tahun Year
sd. TW I until QT I sd. TW II until QT II sd. TW III until QT III sd. TW IV until QT IV
1. Faktor Efisiensi Efficiency Factor
CF % 98,02 94,69 93,40 91,91
2. Faktor Keandalan Reliability Factor
OAF % 97,94 95,61 95,13 93,10
EAF % 97,88 95,56 95,08 93,04

Laporan Statistik Statistic Report2010
PT INDONESIA POWER
80
Grafik 41. Kinerja Unit Bisnis Pembangkitan PLTP Tahun 2010Graph 41. Geothermal Power Plant Performance in 2010
99,00
98,00
97,00
96,00
95,00
94,00
93,00
92,00
91,00
90,00
89,00
88,00
sd. TW I until QT I sd. TW II until QT II sd. TW III until QT III sd. TW IV until QT IV
CF % OAF % EAF %
Tabel 45. kinerja Unit Bisnis Pembangkitan PLTD Tahun 2010Table 45. Diesel Power Plant Performance of Year 2010
no Unsur kinerja Performance Factor Tahun Year
sd. TW I until QT I sd. TW II until QT II sd. TW III until QT III sd. TW IV until QT IV
1. Faktor Efisiensi Efficiency Factor
CF % 20,99 21,56 22,59 24,55
2. Faktor Keandalan Reliability Factor
OAF % 51,78 52,51 57,16 60,94
EAF % 51,78 52,51 57,16 60,94
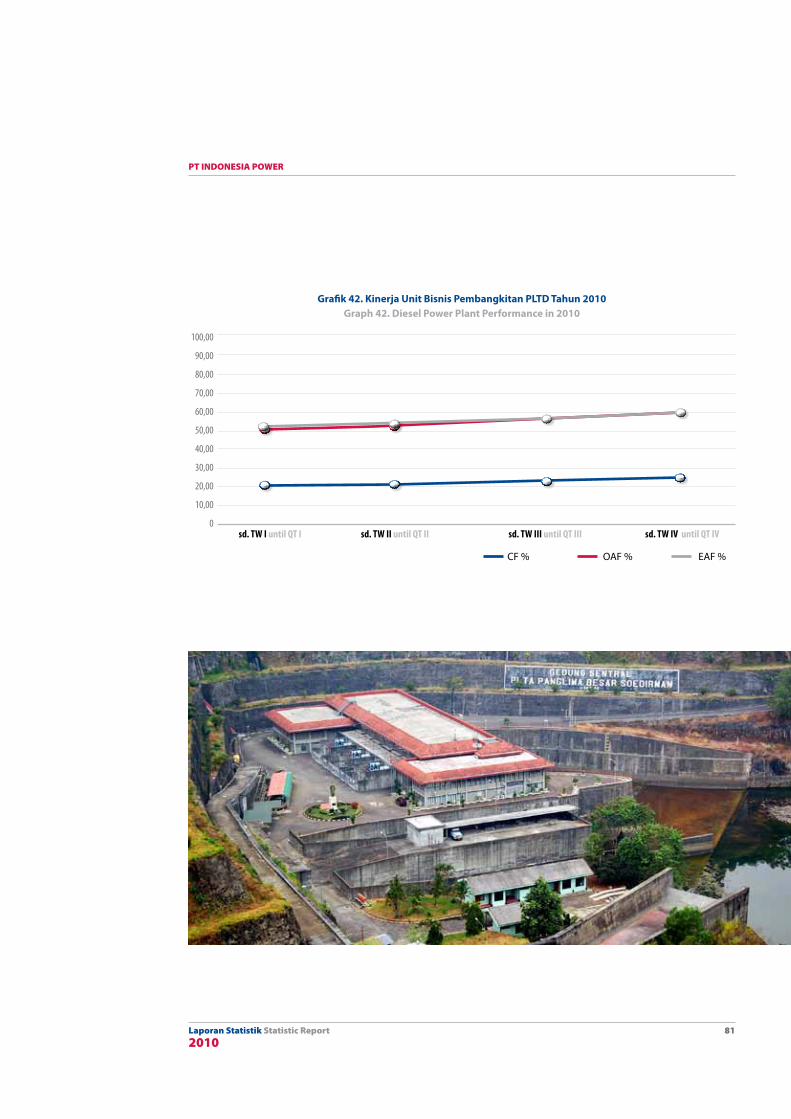
Laporan Statistik Statistic Report2010
PT INDONESIA POWER
81
Grafik 42. Kinerja Unit Bisnis Pembangkitan PLTD Tahun 2010Graph 42. Diesel Power Plant Performance in 2010
100,00
90,00
80,00
70,00
60,00
50,00
40,00
30,00
20,00
10,00
0
CF % OAF % EAF %
sd. TW I until QT I sd. TW II until QT II sd. TW III until QT III sd. TW IV until QT IV

Laporan Statistik Statistic Report2010
PT INDONESIA POWER
82
Laporan Statistik Statistic Report2010
PT INDONESIA POWER
83
Pendapatan Penjualan Energi Listrik
Electricity Sales Revenue

Laporan Statistik Statistic Report2010
PT INDONESIA POWER
84
Grafik 43. Jumlah Aktiva dan Pendapatan Penjualan Energi Listrik Tahun 2005-2010Graph 43. Total Asset and Electricity Sales Revenue of Year 2005-2010
70.000
60.000
50.000
40.000
30.000
20.000
10.000
0
2005 2006 2007 2008 2009 2010
l Jumlah Aktiva (Rp Miliar) l Pendapatan Penjualan Energi Listrik (Rp Miliar) Total Asset (Rp Billion) Electricity Sales Revenue (IDR Billion)
58.8
05
56.2
36
60.8
76
55.5
44
53.5
45
52.3
38
21.8
62
28.1
43
28.1
50
42.2
03
33.2
77
34.0
78
Pendapatan Penjualan Energi Listrik Electricity Sales Revenue
Tabel 46. Pertumbuhan Jumlah Aktiva dan Pendapatan Penjualan Energi Listrik Tahun 2005-2010Table 46. Total Asset Growth and Electricity Sales Revenue of Year 2005-2010
no Uraian Description Tahun Year
2005 2006 2007 2008 2009 2010
1. Jumlah Aktiva Total Asset (Rp Miliar) 58.805 56.236 60.876 55.544 53.723 52.338
2. Pertumbuhan Growth (%) 11,10 (4,37) 8,25 (8,76) (3,28) (2,58)
3. Pendapatan Penjualan Energi Listrik Electricity Sales Revenue (Rp Miliar) 21.862 28.143 28.150 42.203 33.353 34.143
4. Pertumbuhan Growth (%) 33,61 28,73 0,02 49,92 (21,15) 2,37
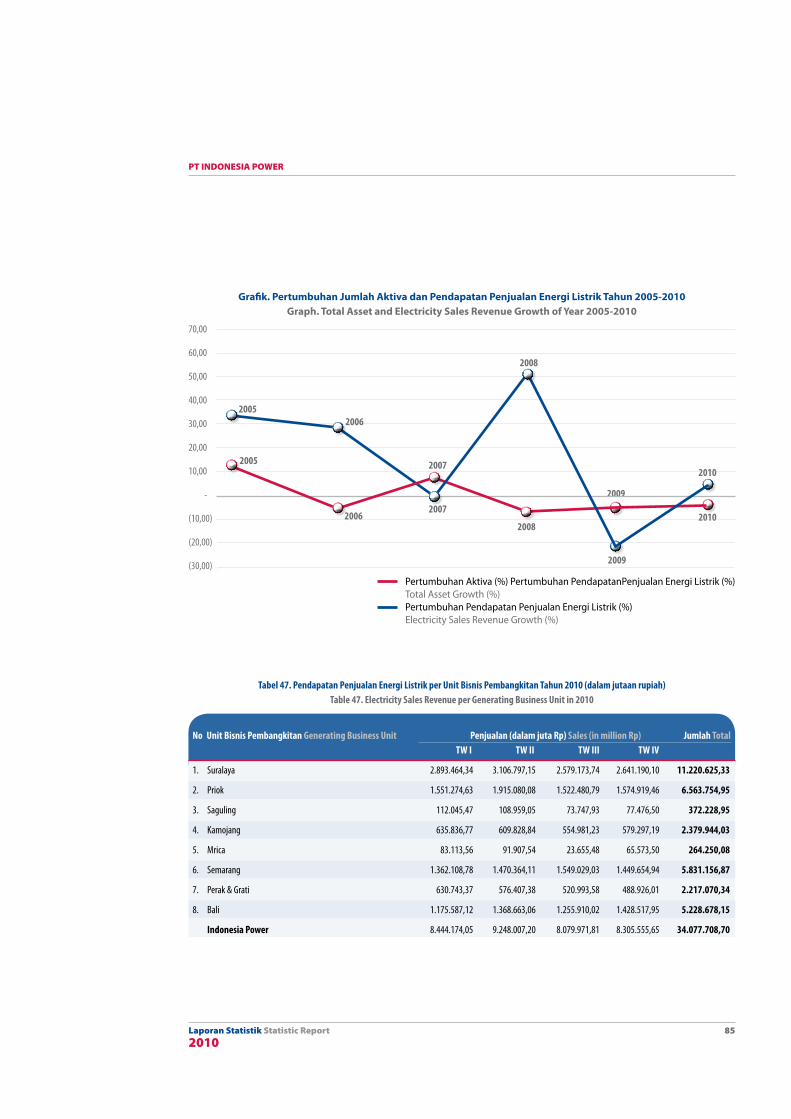
Laporan Statistik Statistic Report2010
PT INDONESIA POWER
85
2009
2009
2010
2010
Pertumbuhan Aktiva (%) Pertumbuhan PendapatanPenjualan Energi Listrik (%)Total Asset Growth (%)Pertumbuhan Pendapatan Penjualan Energi Listrik (%)Electricity Sales Revenue Growth (%)
Tabel 47. Pendapatan Penjualan Energi Listrik per Unit Bisnis Pembangkitan Tahun 2010 (dalam jutaan rupiah)Table 47. Electricity Sales Revenue per Generating Business Unit in 2010
no Unit Bisnis Pembangkitan Generating Business Unit Penjualan (dalam juta Rp) Sales (in million Rp) Jumlah Total TW I TW II TW III TW IV
1. Suralaya 2.893.464,34 3.106.797,15 2.579.173,74 2.641.190,10 11.220.625,33
2. Priok 1.551.274,63 1.915.080,08 1.522.480,79 1.574.919,46 6.563.754,95
3. Saguling 112.045,47 108.959,05 73.747,93 77.476,50 372.228,95
4. Kamojang 635.836,77 609.828,84 554.981,23 579.297,19 2.379.944,03
5. Mrica 83.113,56 91.907,54 23.655,48 65.573,50 264.250,08
6. Semarang 1.362.108,78 1.470.364,11 1.549.029,03 1.449.654,94 5.831.156,87
7. Perak & Grati 630.743,37 576.407,38 520.993,58 488.926,01 2.217.070,34
8. Bali 1.175.587,12 1.368.663,06 1.255.910,02 1.428.517,95 5.228.678,15
Indonesia Power 8.444.174,05 9.248.007,20 8.079.971,81 8.305.555,65 34.077.708,70
70,00
60,00
50,00
40,00
30,00
20,00
10,00
-
(10,00)
(20,00)
(30,00)
2005
2005
2006
2006
2007
2007
2008
2008
Grafik. Pertumbuhan Jumlah Aktiva dan Pendapatan Penjualan Energi Listrik Tahun 2005-2010Graph. Total Asset and Electricity Sales Revenue Growth of Year 2005-2010
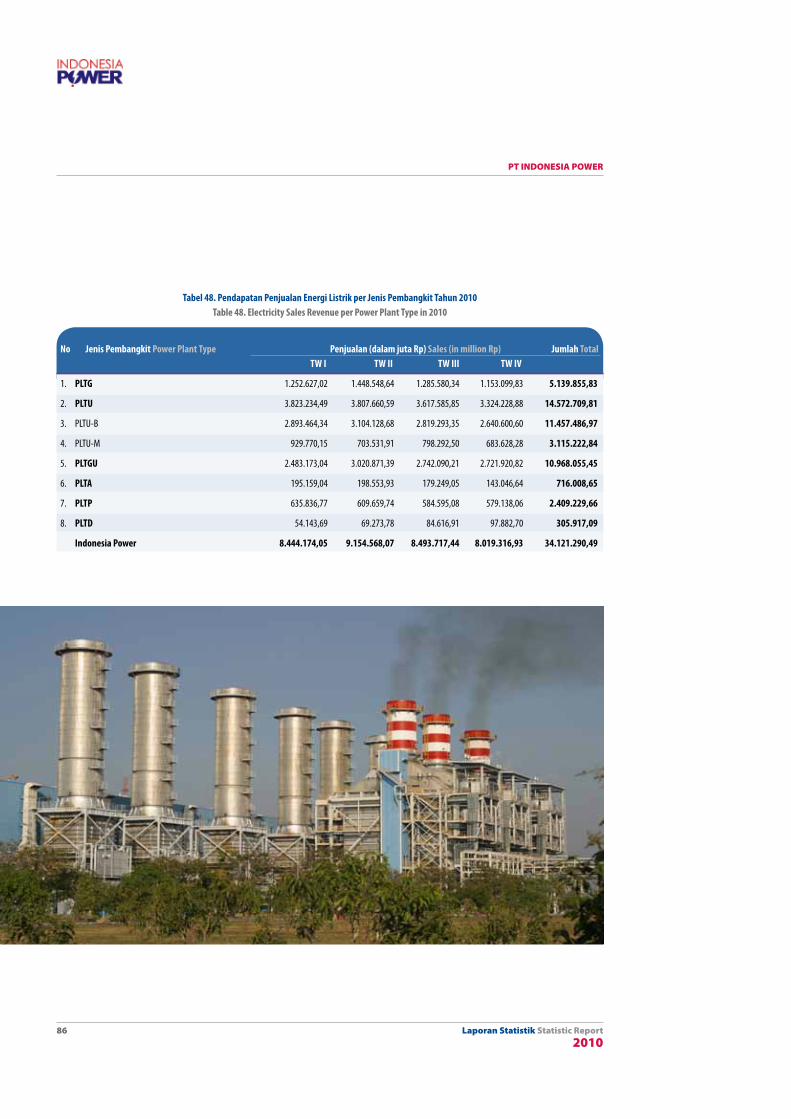
Laporan Statistik Statistic Report2010
PT INDONESIA POWER
86
no Jenis Pembangkit Power Plant Type Penjualan (dalam juta Rp) Sales (in million Rp) Jumlah Total TW I TW II TW III TW IV
1. PLTG 1.252.627,02 1.448.548,64 1.285.580,34 1.153.099,83 5.139.855,83
2. PLTU 3.823.234,49 3.807.660,59 3.617.585,85 3.324.228,88 14.572.709,81
3. PLTU-B 2.893.464,34 3.104.128,68 2.819.293,35 2.640.600,60 11.457.486,97
4. PLTU-M 929.770,15 703.531,91 798.292,50 683.628,28 3.115.222,84
5. PLTGU 2.483.173,04 3.020.871,39 2.742.090,21 2.721.920,82 10.968.055,45
6. PLTA 195.159,04 198.553,93 179.249,05 143.046,64 716.008,65
7. PLTP 635.836,77 609.659,74 584.595,08 579.138,06 2.409.229,66
8. PLTD 54.143,69 69.273,78 84.616,91 97.882,70 305.917,09
Indonesia Power 8.444.174,05 9.154.568,07 8.493.717,44 8.019.316,93 34.121.290,49
Tabel 48. Pendapatan Penjualan Energi Listrik per Jenis Pembangkit Tahun 2010Table 48. Electricity Sales Revenue per Power Plant Type in 2010

Laporan Statistik Statistic Report2010
PT INDONESIA POWER
87
halaman ini sengaja dikosongkanThis Page Is Intentionally Left Blank

Laporan Statistik Statistic Report2010
PT INDONESIA POWER
88

Laporan Statistik Statistic Report2010
PT INDONESIA POWER
89
KepegawaianHuman Resources
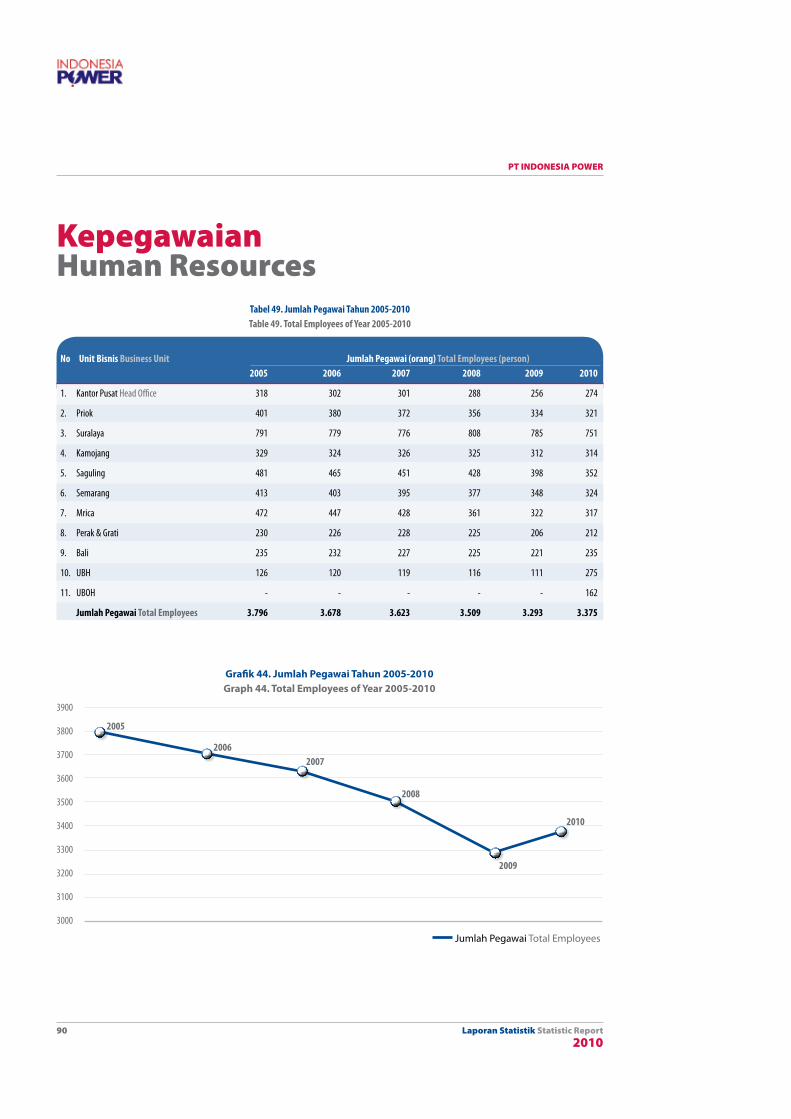
Laporan Statistik Statistic Report2010
PT INDONESIA POWER
90
Grafik 44. Jumlah Pegawai Tahun 2005-2010Graph 44. Total Employees of Year 2005-2010
3900
3800
3700
3600
3500
3400
3300
3200
3100
3000
2005
20062007
2008
2009
2010
Jumlah Pegawai Total Employees
Tabel 49. Jumlah Pegawai Tahun 2005-2010Table 49. Total Employees of Year 2005-2010
no Unit Bisnis Business Unit Jumlah Pegawai (orang) Total Employees (person) 2005 2006 2007 2008 2009 2010
1. Kantor Pusat Head Office 318 302 301 288 256 274
2. Priok 401 380 372 356 334 321
3. Suralaya 791 779 776 808 785 751
4. Kamojang 329 324 326 325 312 314
5. Saguling 481 465 451 428 398 352
6. Semarang 413 403 395 377 348 324
7. Mrica 472 447 428 361 322 317
8. Perak & Grati 230 226 228 225 206 212
9. Bali 235 232 227 225 221 235
10. UBH 126 120 119 116 111 275
11. UBOH - - - - - 162
Jumlah Pegawai Total Employees 3.796 3.678 3.623 3.509 3.293 3.375
KepegawaianHuman Resources
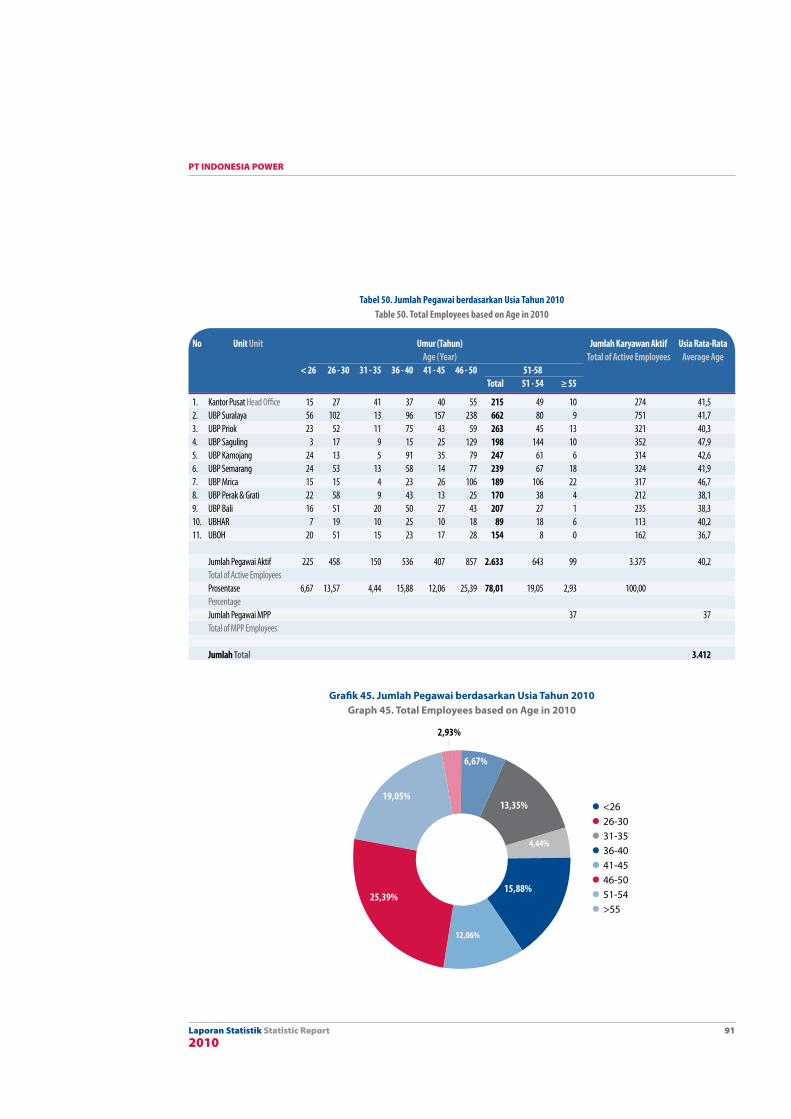
Laporan Statistik Statistic Report2010
PT INDONESIA POWER
91
Grafik 45. Jumlah Pegawai berdasarkan Usia Tahun 2010Graph 45. Total Employees based on Age in 2010
l <26l 26-30l31-35l36-40l41-45l46-50l51-54l>55
19,05%
6,67%
13,35%
4,44%
15,88%
12,06%
25,39%
2,93%
no Unit Unit Umur (Tahun) Jumlah karyawan Aktif Usia Rata-Rata Age (Year) Total of Active Employees Average Age < 26 26 - 30 31 - 35 36 - 40 41 - 45 46 - 50 51-58 Total 51 - 54 ≥ 55
1. Kantor Pusat Head Office 15 27 41 37 40 55 215 49 10 274 41,52. UBP Suralaya 56 102 13 96 157 238 662 80 9 751 41,73. UBP Priok 23 52 11 75 43 59 263 45 13 321 40,34. UBP Saguling 3 17 9 15 25 129 198 144 10 352 47,95. UBP Kamojang 24 13 5 91 35 79 247 61 6 314 42,66. UBP Semarang 24 53 13 58 14 77 239 67 18 324 41,97. UBP Mrica 15 15 4 23 26 106 189 106 22 317 46,78. UBP Perak & Grati 22 58 9 43 13 25 170 38 4 212 38,19. UBP Bali 16 51 20 50 27 43 207 27 1 235 38,310. UBHAR 7 19 10 25 10 18 89 18 6 113 40,211. UBOH 20 51 15 23 17 28 154 8 0 162 36,7 Jumlah Pegawai Aktif 225 458 150 536 407 857 2.633 643 99 3.375 40,2 Total of Active Employees Prosentase 6,67 13,57 4,44 15,88 12,06 25,39 78,01 19,05 2,93 100,00 Percentage Jumlah Pegawai MPP 37 37 Total of MPP Employees
Jumlah Total 3.412
Tabel 50. Jumlah Pegawai berdasarkan Usia Tahun 2010 Table 50. Total Employees based on Age in 2010
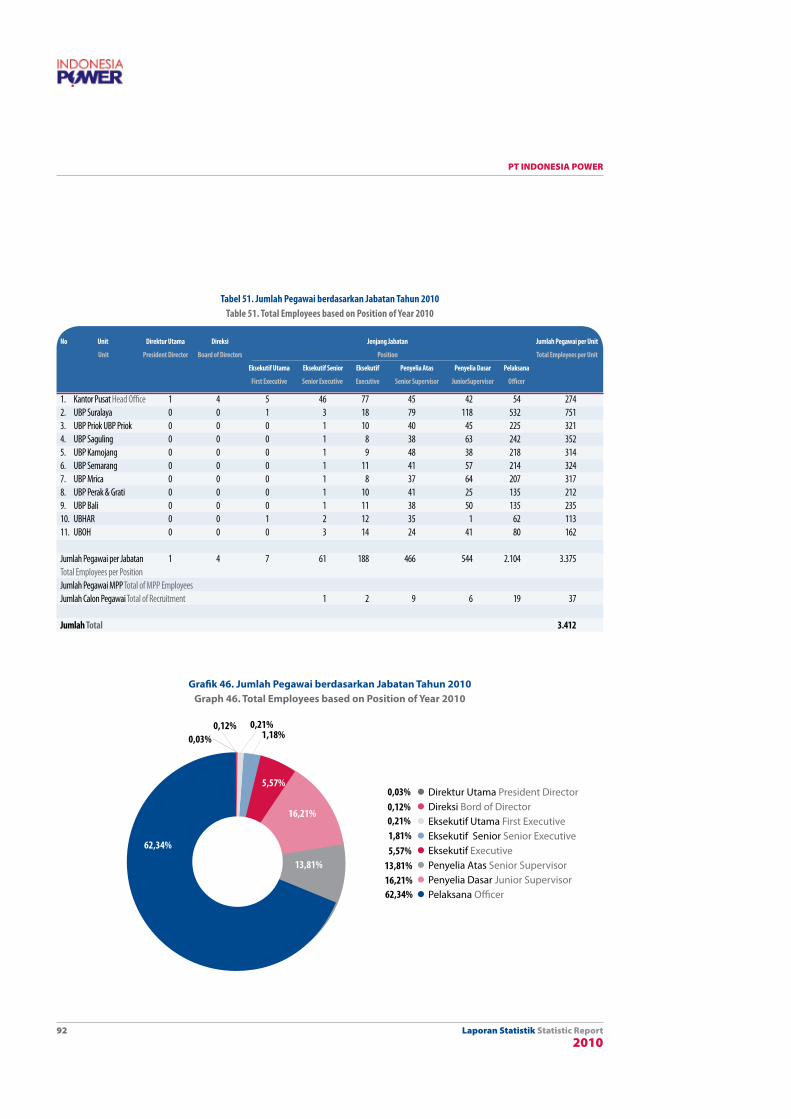
Laporan Statistik Statistic Report2010
PT INDONESIA POWER
92
Grafik 46. Jumlah Pegawai berdasarkan Jabatan Tahun 2010Graph 46. Total Employees based on Position of Year 2010
l Direktur Utama President Directorl Direksi Bord of DirectorlEksekutif Utama First ExecutivelEksekutif Senior Senior ExecutivelEksekutif ExecutivelPenyelia Atas Senior SupervisorlPenyelia Dasar Junior SupervisorlPelaksana Officer
0,21%0,03% 1,18%
0,12%
no Unit Direktur Utama Direksi Jenjang Jabatan Jumlah Pegawai per Unit
Unit President Director Board of Directors Position Total Employees per Unit
Eksekutif Utama Eksekutif Senior Eksekutif Penyelia Atas Penyelia Dasar Pelaksana
First Executive Senior Executive Executive Senior Supervisor JuniorSupervisor officer
1. Kantor Pusat Head Office 1 4 5 46 77 45 42 54 2742. UBP Suralaya 0 0 1 3 18 79 118 532 7513. UBP Priok UBP Priok 0 0 0 1 10 40 45 225 3214. UBP Saguling 0 0 0 1 8 38 63 242 3525. UBP Kamojang 0 0 0 1 9 48 38 218 3146. UBP Semarang 0 0 0 1 11 41 57 214 3247. UBP Mrica 0 0 0 1 8 37 64 207 3178. UBP Perak & Grati 0 0 0 1 10 41 25 135 2129. UBP Bali 0 0 0 1 11 38 50 135 23510. UBHAR 0 0 1 2 12 35 1 62 11311. UBOH 0 0 0 3 14 24 41 80 162
Jumlah Pegawai per Jabatan 1 4 7 61 188 466 544 2.104 3.375Total Employees per Position Jumlah Pegawai MPP Total of MPP Employees Jumlah Calon Pegawai Total of Recruitment 1 2 9 6 19 37
Jumlah Total 3.412
Tabel 51. Jumlah Pegawai berdasarkan Jabatan Tahun 2010Table 51. Total Employees based on Position of Year 2010
0,03%0,12%0,21%1,81%5,57%
13,81%16,21%62,34%
62,34%
5,57%
16,21%
13,81%

Laporan Statistik Statistic Report2010
PT INDONESIA POWER
93
Grafik 47. Jumlah Pegawai berdasarkan Jenis Kelamin Tahun 2010Graph 47. Total Employees based on Gender of Year 2010
l Pria Malel Wanita Female
90,00%
10,00%
Tabel 52. Jumlah Pegawai berdasarkan Jenis kelamin Tahun 2010Table 52. Jumlah Pegawai berdasarkan Jenis kelamin Tahun 2010
no Unit Unit Desember 2010 December 2010 Jumlah Total Pria Male Wanita Female
1. Kantor Pusat Kantor Pusat 187 87 2742. UBP Suralaya 703 48 7513. UBP Priok 294 27 3214. UBP Saguling 334 18 3525. UBP Kamojang 295 19 3146. UBP Semarang 294 30 3247. UBP Mrica 293 24 3178. UBP Perak & Grati 188 24 2129. UBP Bali 216 19 23510. UBHAR 94 19 11311. UBOH 153 9 162
Jumlah Pegawai Aktif 3.051 324 3.375 Total of Active Employees Jumlah Pegawai MPP 35 2 37 Total of MPP Employees Jumlah Total 3.086 326 3.412 Jumlah Calon Pegawai 115 3 5.762 Total of Recruitment
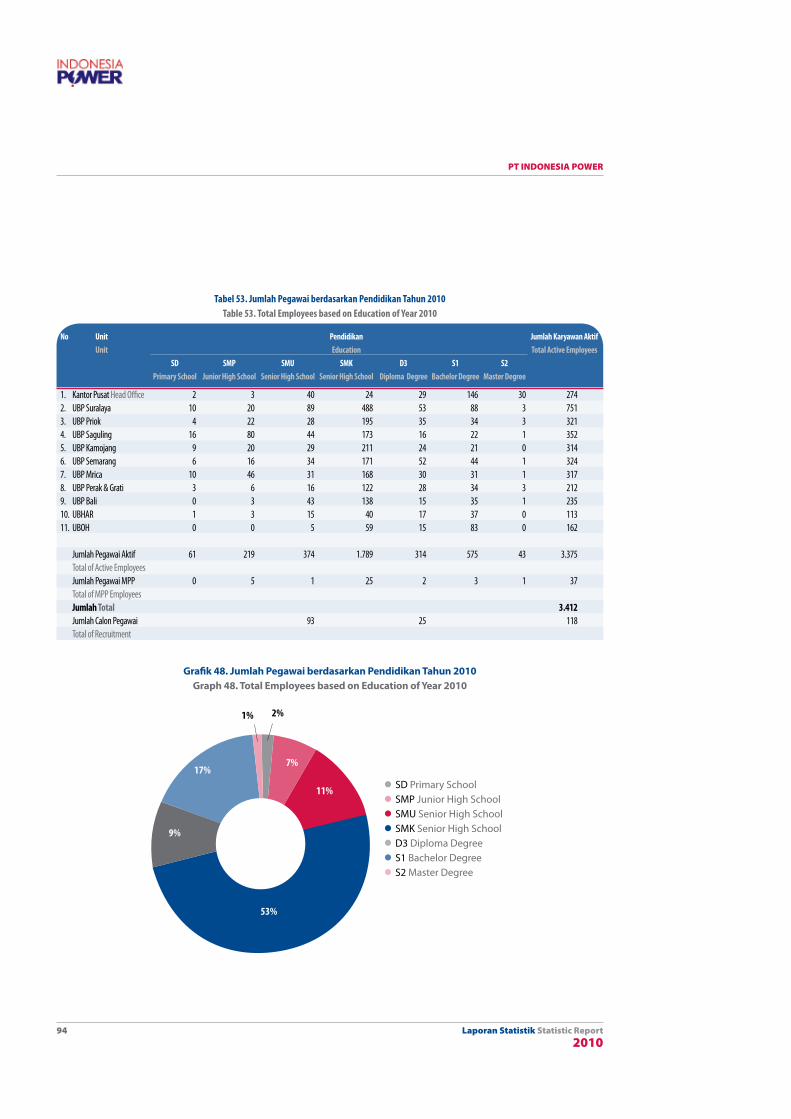
Laporan Statistik Statistic Report2010
PT INDONESIA POWER
94
Grafik 48. Jumlah Pegawai berdasarkan Pendidikan Tahun 2010Graph 48. Total Employees based on Education of Year 2010
l SD Primary Schooll SMP Junior High SchoollSMU Senior High SchoollSMK Senior High SchoollD3 Diploma DegreelS1 Bachelor DegreelS2 Master Degree
53%
11%
7%17%
9%
1% 2%
no Unit Pendidikan Jumlah karyawan Aktif Unit Education Total Active Employees SD SMP SMU SMk D3 S1 S2 Primary School Junior High School Senior High School Senior High School Diploma Degree Bachelor Degree Master Degree
1. Kantor Pusat Head Office 2 3 40 24 29 146 30 2742. UBP Suralaya 10 20 89 488 53 88 3 7513. UBP Priok 4 22 28 195 35 34 3 3214. UBP Saguling 16 80 44 173 16 22 1 3525. UBP Kamojang 9 20 29 211 24 21 0 3146. UBP Semarang 6 16 34 171 52 44 1 3247. UBP Mrica 10 46 31 168 30 31 1 3178. UBP Perak & Grati 3 6 16 122 28 34 3 2129. UBP Bali 0 3 43 138 15 35 1 23510. UBHAR 1 3 15 40 17 37 0 11311. UBOH 0 0 5 59 15 83 0 162
Jumlah Pegawai Aktif 61 219 374 1.789 314 575 43 3.375 Total of Active Employees Jumlah Pegawai MPP 0 5 1 25 2 3 1 37 Total of MPP Employees Jumlah Total 3.412 Jumlah Calon Pegawai 93 25 118 Total of Recruitment
Tabel 53. Jumlah Pegawai berdasarkan Pendidikan Tahun 2010Table 53. Total Employees based on Education of Year 2010
Laporan Statistik Statistic Report2010
PT INDONESIA POWER
95
PT INDONESIA POWERPT INDONESIA POWER
Istilah, definisi dan rumus-rumus yang digunakan adalahsebagai berikut:1. Faktor Kapasitas yaitu kWh produksi bruto, adalah energi yang
dibangkitkan oleh generator sebelum dikurangi energi pemakaian sendiri (untuk peralatan bantu, penerangan sentral, dan lain-lain), atau produksi energi listrik yang diukur pada terminal generator. Kapasitas terpasang, adalah kapasitas suatu unit pembangkit sebagaimana tertera pada papan nama (name plate) dari generator atau mesin penggerak utama, dipilih mana yang lebih kecil. Khusus untuk PLTG, kapasitas terpasangnya adalah sebagaimana tertera pada papan nama berdasarkan base-load, bukan berdasarkan peakload.
2. Equivalent Availability Factor (EAF) Dependable capacity: kapasitas/daya maksimum
yang tergantung batasan terhadap keadaan sekeliling selama suatu periode tertentu (satu bulan atau satu musim); dengan perhitungan=daya terpasang-(derating permanen+derating tidak permanen). Untuk PLTA yang dihitungkan adalah unit mesinnya, bukan ketersediaan debit air. Jam tersedia: jumlah jam dimana unit dalam keadaan operasi dan atau siap operasi.
3. Pemakaian Sendiri (PS) Perhitungan pemakaian sendiri (PS), merupakan
selisih antara produksi bruto dengan netto (MWh yang disalurkan ke Sistem Transaksi) pembangkit.
4. Operating Available Factor OAF (%) = jumlah jam pelayanan + jam standby x
100 Jam periode
5. Output Factor (OF) kWh produksi bruto x 100 kWh kapasitas terpasang x jam pelayanan
Term, definitions and formulas used in this report asfollow:1. Capacity Factor kWh gross production is the amount of power
(kWh) generated before being subtracted by self consumption energy (for assisting machinery, central lighting,etc.), or production of energy as measured by terminal generator. Installed capacity is the capacity of one of the generation business unit has, as it shown on generator’s name plate of prime mover, whichever is smaller. Especially for Gas Turbine Power Plant, the installed capacity is whatever shown on the name plate or based on base load, not based on peak load.
2. Equivalent Availability Factor (EAF) Dependaple capacity: Maximum capacity which
dependable on the surrounding natural condition over one period of time (one month or one season); with formulation = installed capacity-(derating permanent+derating non permanent). For Hydro power plant the derivative is the number of machine (unit), not the water volume. Availability hours: total hours of operation and/ or running hours.
3. Self Consumption Measurement for self consumption is the difference
between gross production value and the net value (MWh delivered to the Transmission System) both Power Plants.
4. Operating Available Factor OAF (%) = jumlah jam pelayanan + jam standby x
100 Jam periode
5. Output Factor (OF) kWh produksi bruto x 100 kWh kapasitas terpasang x jam pelayanan
Penjelasan Glossary of Term

Laporan Statistik Statistic Report2010
PT INDONESIA POWER
96
Daftar Singkatan Abbreviation
PLTA : Pusat Listrik Tenaga AirPLTU : Pusat Listrik Tenaga UapPLTG : Pusat Listrik Tenaga GasPLTGU : Pusat Listrik Tenaga Gas dan UapPLTD : Pusat Listrik Tenaga DieselPLTP : Pusat Listrik Tenaga Panas Bumi
MMBTU: 106 British Thermal Unit (MM=106)
Kw : Kilo WattMW: Mega WattkWh : kilo Watt-hourMWh : Mega Watt-hourGWh : Giga Watt-hourHSD : High Speed DieselIDO : Intermediate Diesel OilMFO : Marine Fuel OilCF : Capacity FactorOF : Output FactorOAF : Operating Available FactorEAF : Equivalent Available FactorUBP : Unit Bisnis PembangkitanUBH : Unit Bisnis Jasa PemeliharaanUBOH : Unit Bisnis Operasi dan PemeliharaanPJB : Pembangkitan Jawa-BaliP3B : Penyaluran dan Pusat Pengatur Beban Jawa-BaliIPP : Independent Power Producer
British Thermal Unit (BTU) adalah jumlah kalori yang diperlukan untuk menaikan 1 pound air 1 derajat Fahrenheit pada temperature 60 derajat Fahrenheit, pada tekanan absolute 14,7 pound per square inch.
Standard Cubic Foot (SCF) adalah sejumlah gas yang diperlukan untuk mengisi ruangan 1 Cubic Foot, dengan tekanan sebesar 14,7 pounds per square inch absolute dan pada temperature 60 derajat Fahrenheit, dalam kondisi kering.
1.000 BTU Gas adalah gas yang mempunyai Gross Heating Value sebesar 1.000 BTU tiap SCF.
PLTA : Pusat Listrik Tenaga AirPLTU : Pusat Listrik Tenaga UapPLTG : Pusat Listrik Tenaga GasPLTGU : Pusat Listrik Tenaga Gas dan UapPLTD : Pusat Listrik Tenaga DieselPLTP : Pusat Listrik Tenaga Panas Bumi
MMBTU: 106 British Thermal Unit (MM=106)
Kw : Kilo WattMW: Mega WattkWh : kilo Watt-hourMWh : Mega Watt-hourGWh : Giga Watt-hourHSD : High Speed DieselIDO : Intermediate Diesel OilMFO : Marine Fuel OilCF : Capacity FactorOF : Output FactorOAF : Operating Available FactorEAF : Equivalent Available FactorUBP : Unit Bisnis PembangkitanUBH : Unit Bisnis Jasa PemeliharaanUBOH : Unit Bisnis Operasi dan PemeliharaanPJB : Pembangkitan Jawa-BaliP3B : Penyaluran dan Pusat Pengatur Beban Jawa-BaliIPP : Independent Power Producer
British Thermal Unit (BTU) is the total calories needed to raise 7 pound of water 7 Fahrenheit degree from temperature 60 Fahrenheit degrees with pressure 74.7 pound per square inc absolute.
Standard Cubic Foot (SCF) is the total gas which needed to fit 7 Cubic Foot room, with pressure 74.7 pounds per square inch absolute and in temperature of 60 Fahrenheit degrees in dry condition.
1,000 BTU Gas is gas which has Gross Heating Value 1,000 BTU per SCF.
Daftar Singkatan Abbreviation
Top Related
Copyright © 2022 FDOKUMEN

